Exhibit (c)(2)
Deutsche Bank Corporate & Investment Banking CONFIDENTIAL Special Committee of the Board of Directors Discussion materials August 22, 2016 Deutsche Bank Securities Inc., a subsidiary of Deutsche Bank AG, conducts investment banking and securities activities in the United States.

IMPORTANT: This presentation (the “Presentation”) has been prepared by Deutsche Bank’s investment banking department exclusively for the benefit and internal use of the Special Committee of the Board of Directors of the company code-named Arrow (the “Recipient”) to whom it is addressed. The Recipient is not permitted to reproduce in whole or in part the information provided in this Presentation (the “Information”) or to communicate the Information to any third party without our prior written consent. No party may rely on this Presentation without our prior written consent. Deutsche Bank and its affiliates, officers, directors, employees and agents do not accept responsibility or liability for this Presentation or its contents (except to the extent that such liability cannot be excluded by law). Statements and opinions regarding the Recipient's investment case, positioning and valuation are not, and should not be construed as, an indication that Deutsche Bank will provide favorable research coverage of the Recipient or publish research containing any particular rating or price target for the Recipient’s securities. This Presentation is (i) for discussion purposes only; and (ii) speaks only as of the date it is given, reflecting prevailing market conditions and the views expressed are subject to change based upon a number of factors, including market conditions and the Recipient's business and prospects. The Information, whether taken from public sources, received from the Recipient or elsewhere, has not been verified and Deutsche Bank has relied upon and assumed without independent verification, the accuracy and completeness of all information which may have been provided directly or indirectly by the Recipient. No representation or warranty is made as to the Information’s accuracy or completeness and Deutsche Bank assumes no obligation to update the Information. The Presentation is incomplete without reference to, and should be viewed solely in conjunction with, the oral briefing provided by Deutsche Bank. The analyses contained in the Presentation are not, and do not purport to be, appraisals of the assets, stock, or business of the Recipient. The Information does not take into account the effects of a possible transaction or transactions involving an actual or potential change of control, which may have significant valuation and other effects. The Presentation is not exhaustive and does not serve as legal, accounting or tax advice. Nothing herein shall be taken as constituting the giving of investment advice and this Presentation is not intended to provide, and must not be taken as, the basis of any decision and should not be considered as a recommendation by Deutsche Bank. Recipient must make its own independent assessment and such investigations as it deems necessary. In preparing this presentation Deutsche Bank has acted as an independent contractor and nothing in this presentation is intended to create or shall be construed as creating a fiduciary relationship between the Recipient and Deutsche Bank. Deutsche Bank Corporate & Investment Banking

Contents Section 1 2 3 Situation update Arrow overview Valuation 1 5 18 Appendix I II III Arrow WACC analysis Gaming transaction comparables Trading comparables 25 26 27 Deutsche Bank Corporate & Investment Banking
Deutsche Bank Corporate & Investment Banking Section 1 Situation update
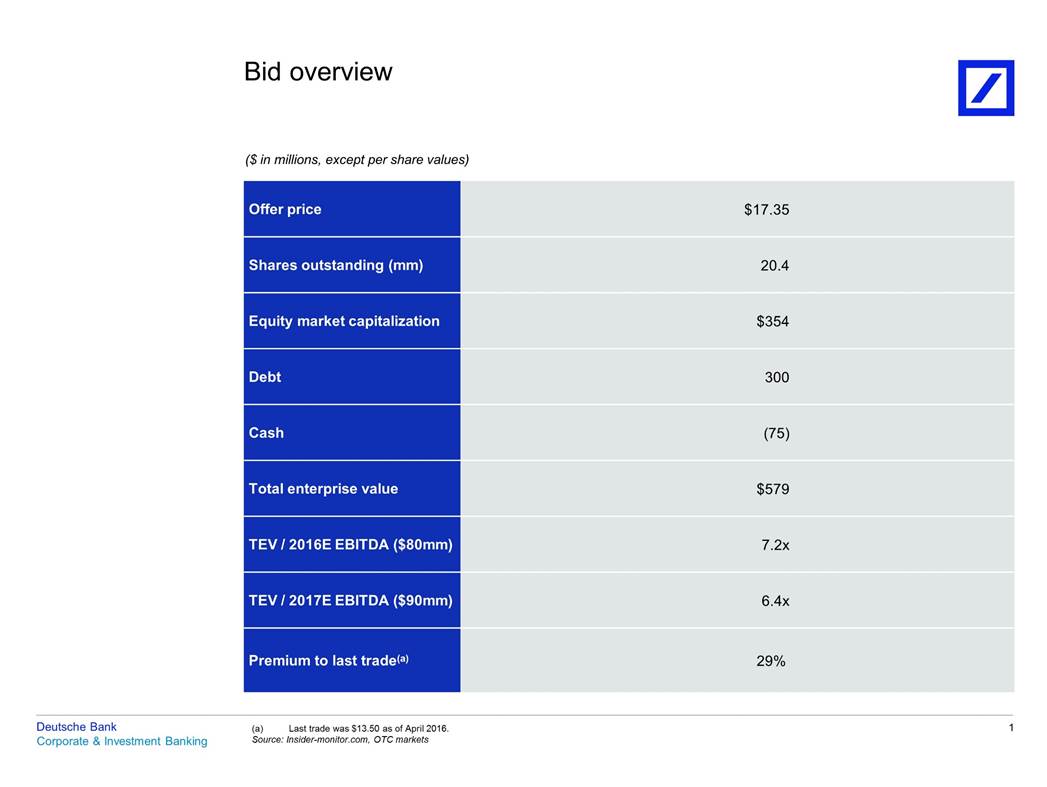
Bid overview ($ in millions, except per share values) Deutsche Bank Corporate & Investment Banking 1 (a) Last trade was $13.50 as of April 2016. Source: Insider-monitor.com, OTC markets Offer price $17.35 Shares outstanding (mm) 20.4 Equity market capitalization $354 Debt 300 Cash (75) Total enterprise value $579 TEV / 2016E EBITDA ($80mm) 7.2x TEV / 2017E EBITDA ($90mm) 6.4x Premium to last trade(a) 29%
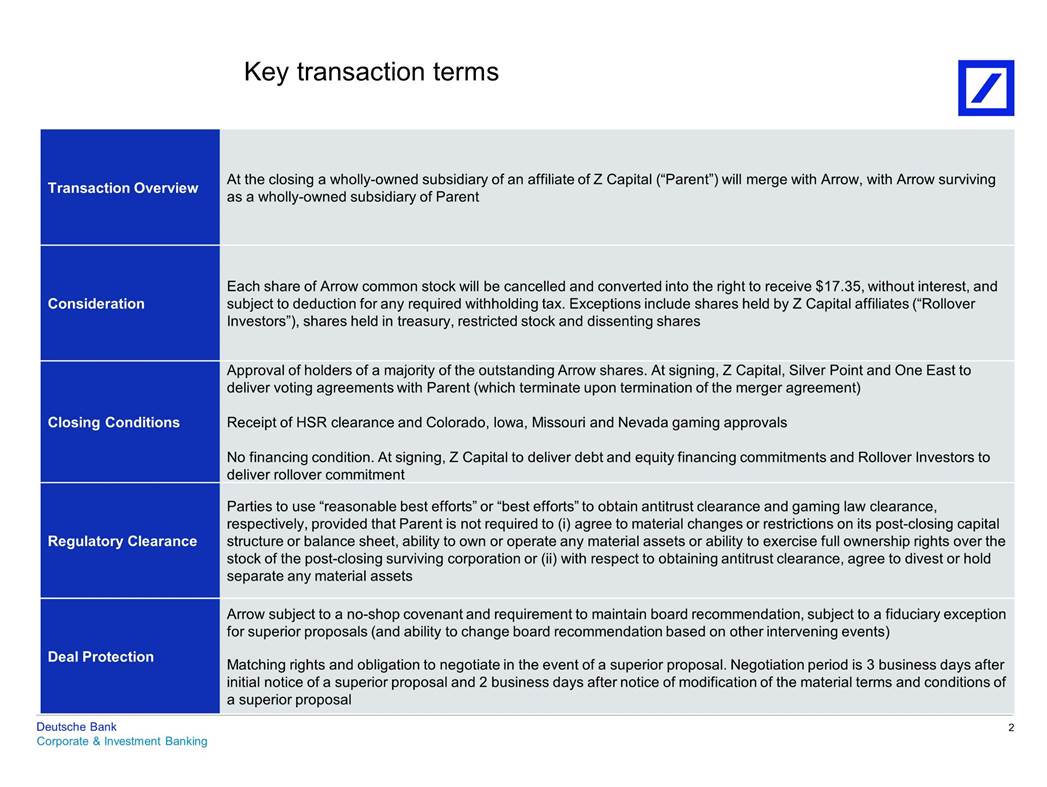
Key transaction terms as a wholly-owned subsidiary of Parent Deutsche Bank Corporate & Investment Banking 2 Transaction Overview At the closing a wholly-owned subsidiary of an affiliate of Z Capital (“Parent”) will merge with Arrow, with Arrow surviving Consideration Each share of Arrow common stock will be cancelled and converted into the right to receive $17.35, without interest, and subject to deduction for any required withholding tax. Exceptions include shares held by Z Capital affiliates (“Rollover Investors”), shares held in treasury, restricted stock and dissenting shares Closing Conditions Approval of holders of a majority of the outstanding Arrow shares. At signing, Z Capital, Silver Point and One East to deliver voting agreements with Parent (which terminate upon termination of the merger agreement) Receipt of HSR clearance and Colorado, Iowa, Missouri and Nevada gaming approvals No financing condition. At signing, Z Capital to deliver debt and equity financing commitments and Rollover Investors to deliver rollover commitment Regulatory Clearance Parties to use “reasonable best efforts” or “best efforts” to obtain antitrust clearance and gaming law clearance, respectively, provided that Parent is not required to (i) agree to material changes or restrictions on its post-closing capital structure or balance sheet, ability to own or operate any material assets or ability to exercise full ownership rights over the stock of the post-closing surviving corporation or (ii) with respect to obtaining antitrust clearance, agree to divest or hold separate any material assets Deal Protection Arrow subject to a no-shop covenant and requirement to maintain board recommendation, subject to a fiduciary exception for superior proposals (and ability to change board recommendation based on other intervening events) Matching rights and obligation to negotiate in the event of a superior proposal. Negotiation period is 3 business days after initial notice of a superior proposal and 2 business days after notice of modification of the material terms and conditions of a superior proposal
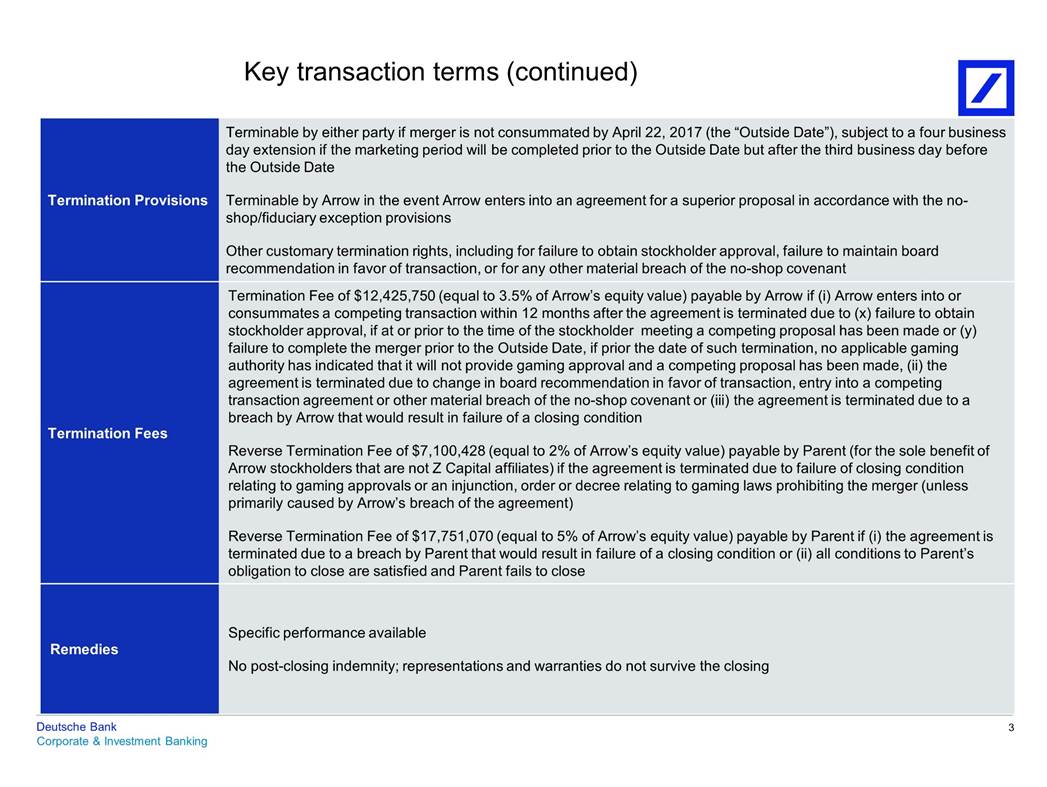
Key transaction terms (continued) Deutsche Bank Corporate & Investment Banking 3 Termination Provisions Terminable by either party if merger is not consummated by April 22, 2017 (the “Outside Date”), subject to a four business day extension if the marketing period will be completed prior to the Outside Date but after the third business day before the Outside Date Terminable by Arrow in the event Arrow enters into an agreement for a superior proposal in accordance with the no-shop/fiduciary exception provisions Other customary termination rights, including for failure to obtain stockholder approval, failure to maintain board recommendation in favor of transaction, or for any other material breach of the no-shop covenant Termination Fees Termination Fee of $12,425,750 (equal to 3.5% of Arrow’s equity value) payable by Arrow if (i) Arrow enters into or consummates a competing transaction within 12 months after the agreement is terminated due to (x) failure to obtain stockholder approval, if at or prior to the time of the stockholder meeting a competing proposal has been made or (y) failure to complete the merger prior to the Outside Date, if prior the date of such termination, no applicable gaming authority has indicated that it will not provide gaming approval and a competing proposal has been made, (ii) the agreement is terminated due to change in board recommendation in favor of transaction, entry into a competing transaction agreement or other material breach of the no-shop covenant or (iii) the agreement is terminated due to a breach by Arrow that would result in failure of a closing condition Reverse Termination Fee of $7,100,428 (equal to 2% of Arrow’s equity value) payable by Parent (for the sole benefit of Arrow stockholders that are not Z Capital affiliates) if the agreement is terminated due to failure of closing condition relating to gaming approvals or an injunction, order or decree relating to gaming laws prohibiting the merger (unless primarily caused by Arrow’s breach of the agreement) Reverse Termination Fee of $17,751,070 (equal to 5% of Arrow’s equity value) payable by Parent if (i) the agreement is terminated due to a breach by Parent that would result in failure of a closing condition or (ii) all conditions to Parent’s obligation to close are satisfied and Parent fails to close Remedies Specific performance available No post-closing indemnity; representations and warranties do not survive the closing
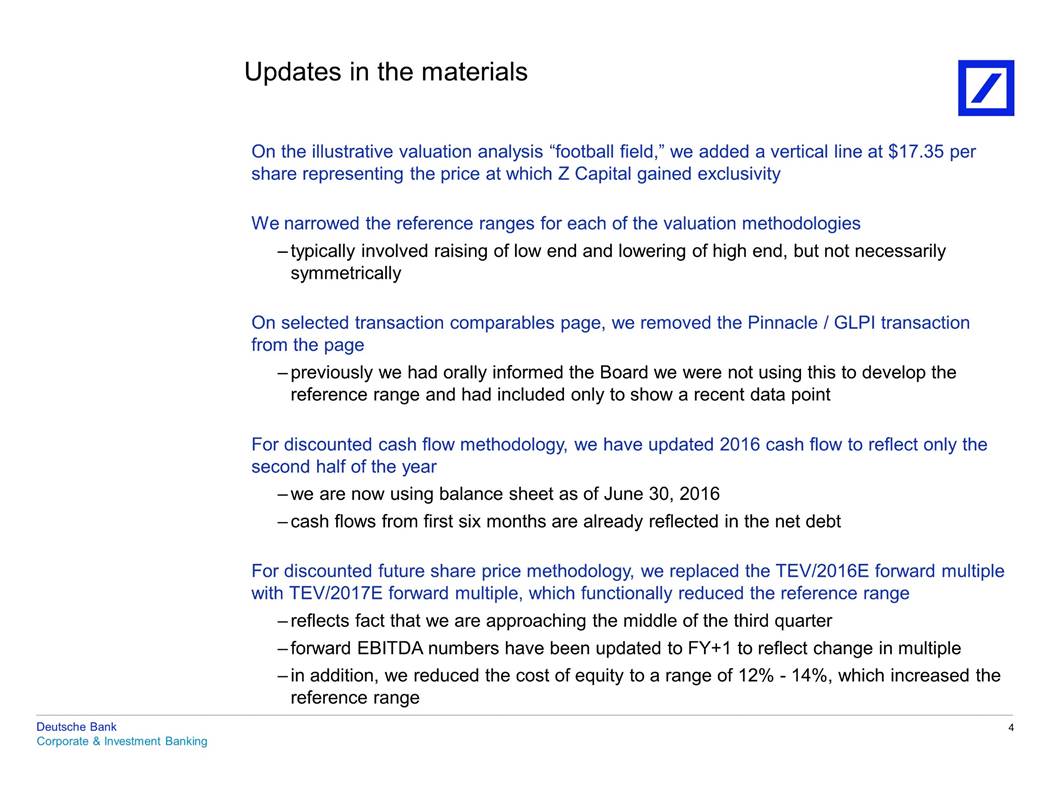
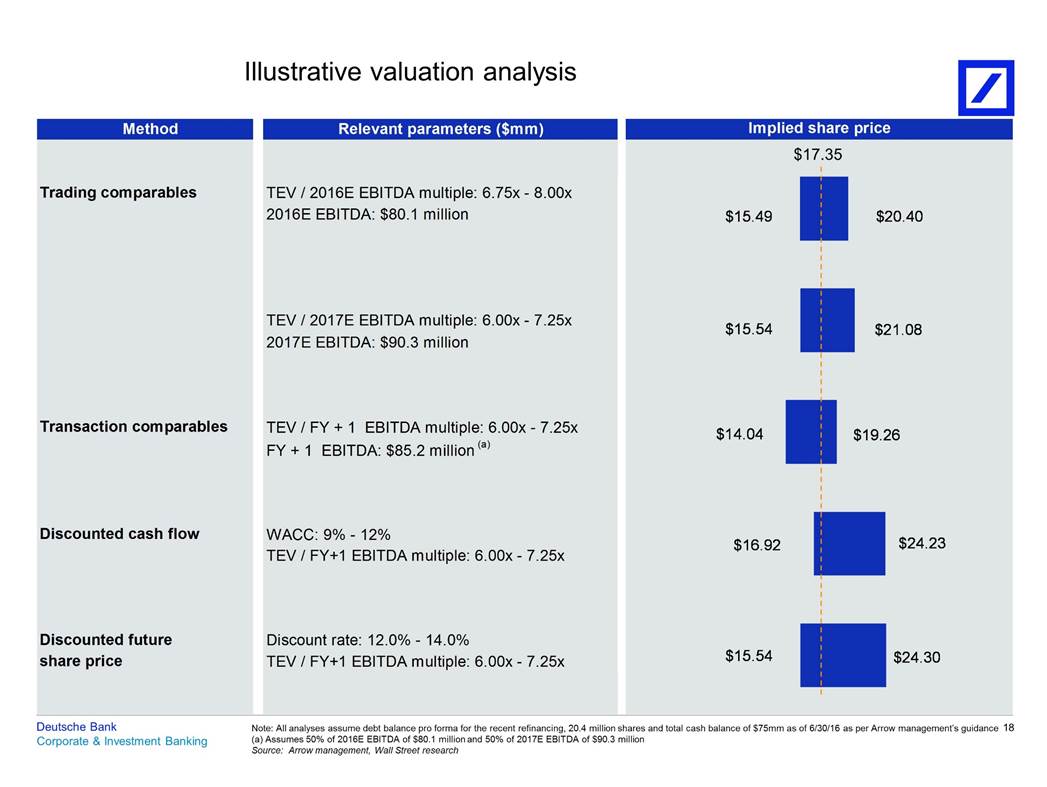
Updates in the materials On the illustrative valuation analysis “football field,” we added a vertical line at $17.35 per share representing the price at which Z Capital gained exclusivity We narrowed the reference ranges for each of the valuation methodologies – typically involved raising of low end and lowering of high end, but not necessarily symmetrically On selected transaction comparables page, we removed the Pinnacle / GLPI transaction from the page – previously we had orally informed the Board we were not using this to develop the reference range and had included only to show a recent data point For discounted cash flow methodology, we have updated 2016 cash flow to reflect only the second half of the year – we are now using balance sheet as of June 30, 2016 – cash flows from first six months are already reflected in the net debt For discounted future share price methodology, we replaced the TEV/2016E forward multiple with TEV/2017E forward multiple, which functionally reduced the reference range – reflects fact that we are approaching the middle of the third quarter – forward EBITDA numbers have been updated to FY+1 to reflect change in multiple – in addition, we reduced the cost of equity to a range of 12% - 14%, which increased the reference range Deutsche Bank Corporate & Investment Banking 4
Deutsche Bank Corporate & Investment Banking Section 2 Arrow overview
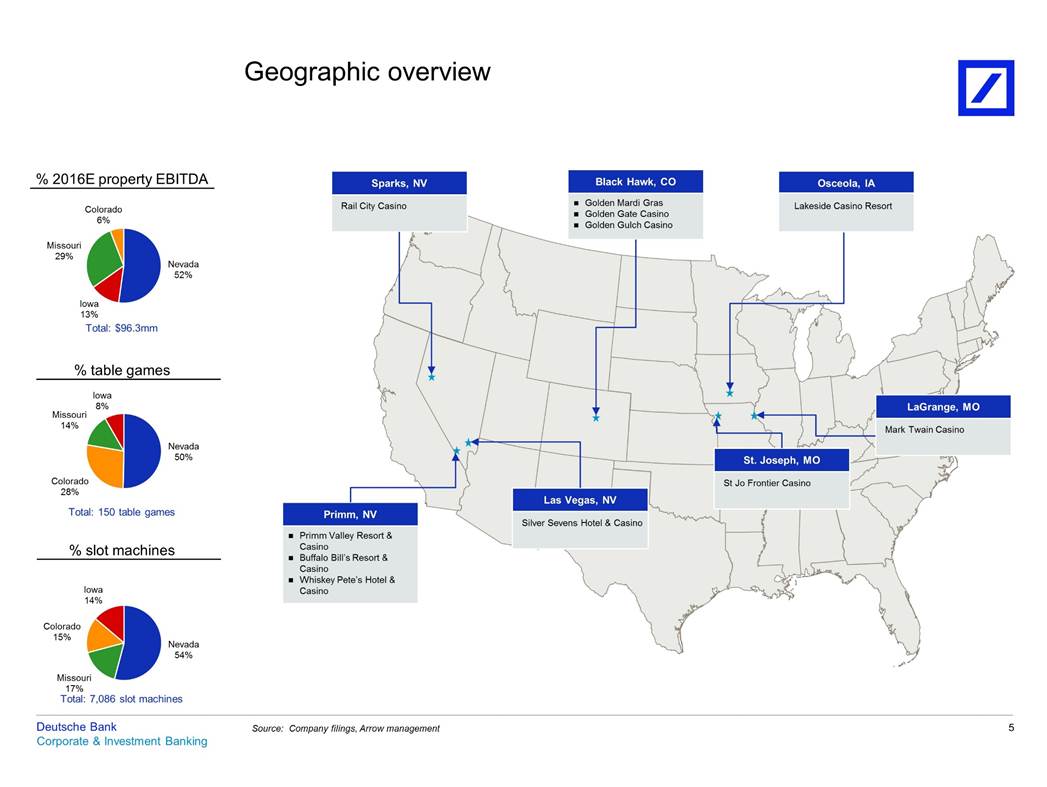
Geographic overview % 2016E property EBITDA Colorado 6% Missouri 29% Nevada 52% Iowa 13% Total: $96.3mm % table games Iowa 8% Missouri 14% Nevada 50% Colorado 28% Total: 150 table games % slot machines Iowa 14% Colorado 15% Nevada 54% Missouri 17% Total: 7,086 slot machines Deutsche Bank Corporate & Investment Banking 5 Source: Company filings, Arrow management Primm Valley Resort & Casino Buffalo Bill’s Resort & Casino Whiskey Pete’s Hotel & Casino Silver Sevens Hotel & Casino St Jo Frontier Casino Mark Twain Casino Golden Mardi Gras Golden Gate Casino Golden Gulch Casino Lakeside Casino Resort Rail City Casino
Portfolio overview Year built/ remodeled Table games Hotel rooms RV spaces Location Gaming SF Slots Midwest St Jo Frontier Casino Mark Twain Casino Lakeside Casino Resort Total Midwest St. Joseph, MO LaGrange, MO Osceola, IA 2005 2001 2005 13,000 18,000 36,000 515 636 960 10 13 13 – – 150 – 8 47 67,000 2,111 36 150 55 Southern Nevada Silver Sevens Total Southern Nevada Las Vegas, NV 2006 25,000 834 8 327 – 25,000 834 8 327 – Primm Primm Valley Resort & Casino Buffalo Bill’s Resort & Casino Whiskey Pete’s Hotel & Casino Total Primm Primm, NV Primm, NV Primm, NV 1990 1994 1977 38,000 62,000 36,000 789 888 562 26 28 10 626 1,243 779 – – – 136,000 2,239 64 2,648 – Northern Nevada Rail City Casino Total Northern Nevada Sparks, NV 2007 24,000 852 6 – – 24,000 852 6 – – Black Hawk Golden Mardi Gras Golden Gate Casino Golden Gulch Casino Total Black Hawk Black Hawk, CO Black Hawk, CO Black Hawk, CO 2000 1992 2003 NA NA NA 694 264 92 11 25 NA – – – – – – 36,391 1,050 36 – – Total casinos 288,391 7,086 150 3,125 55 Deutsche Bank Corporate & Investment Banking 6 Note: Portfolio information as of August 2016. Source: Company filings, Arrow management

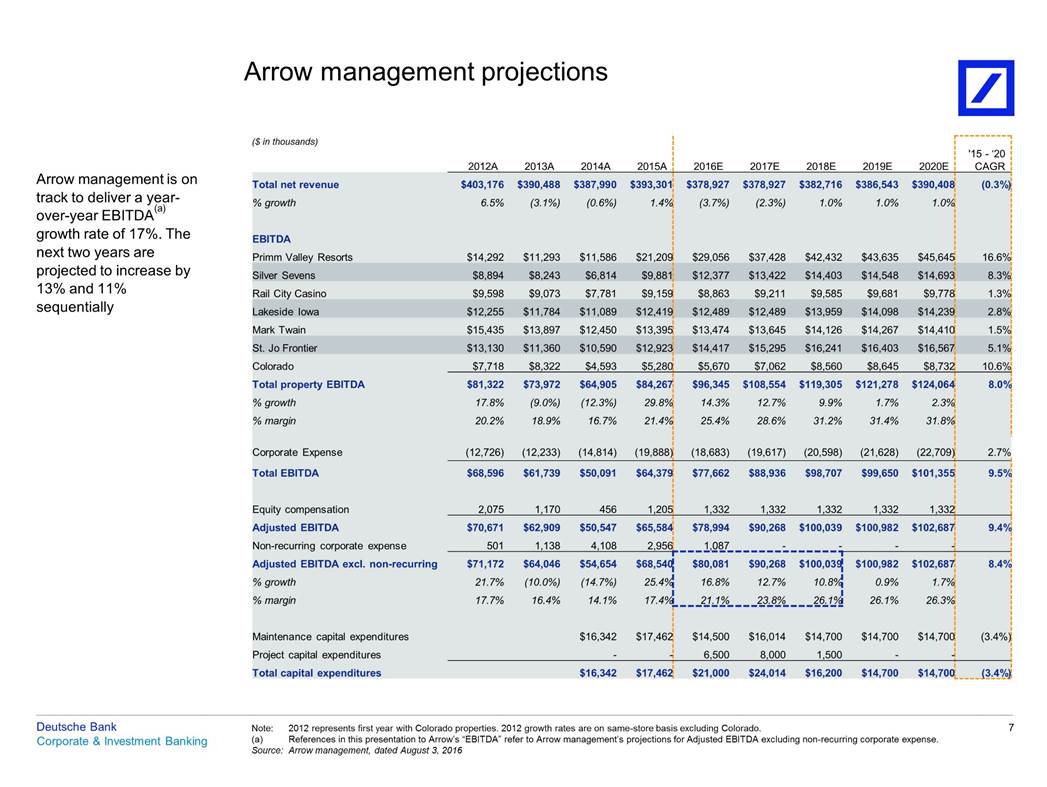
Arrow management projections ($ in thousands) Arrow management is on track to deliver a year-Total net revenue % growth (a) over-year EBITDA growth rate of 17%. The next two years are projected to increase by 13% and 11% sequentially EBITDA Primm Valley Resorts Deutsche Bank Corporate & Investment Banking 7 Note:2012 represents first year with Colorado properties. 2012 growth rates are on same-store basis excluding Colorado. (a) References in this presentation to Arrow’s “EBITDA” refer to Arrow management’s projections for Adjusted EBITDA excluding non-recurring corporate expense. Source: Arrow management, dated August 3, 2016 2012A2013A2014A2015A2016E2017E2018E2019E2020E '15 - ‘20 CAGR $403,176 $390,488 $387,990 $393,301 6.5%(3.1%)(0.6%)1.4% $14,292$11,293$11,586$21,209 $378,927 $378,927 $382,716 $386,543 $390,408 (3.7%)(2.3%)1.0%1.0%1.0% $29,056$37,428$42,432$43,635$45,645 (0.3%) 16.6% Silver Sevens$8,894$8,243$6,814$9,881 $12,377$13,422$14,403$14,548$14,693 8.3% Rail City Casino$9,598$9,073$7,781$9,159 $8,863$9,211$9,585$9,681$9,778 1.3% Lakeside Iowa$12,255$11,784$11,089$12,419 $12,489$12,489$13,959$14,098$14,239 2.8% Mark Twain$15,435$13,897$12,450$13,395 $13,474$13,645$14,126$14,267$14,410 1.5% St. Jo Frontier$13,130$11,360$10,590$12,923 $14,417$15,295$16,241$16,403$16,567 5.1% Colorado Total property EBITDA % growth % margin Corporate Expense Total EBITDA Equity compensation Adjusted EBITDA Non-recurring corporate expense Adjusted EBITDA excl. non-recurring % growth % margin Maintenance capital expenditures $7,718$8,322$4,593$5,280 $5,670$7,062$8,560$8,645$8,732 10.6% $81,322$73,972$64,905$84,267 17.8%(9.0%)(12.3%)29.8% 20.2%18.9%16.7%21.4% (12,726)(12,233)(14,814)(19,888) $96,345 $108,554 $119,305 $121,278 $124,064 14.3%12.7%9.9%1.7%2.3% 25.4%28.6%31.2%31.4%31.8% (18,683)(19,617)(20,598)(21,628)(22,709) 8.0% 2.7% $68,596$61,739$50,091$64,379 2,0751,1704561,205 $77,662$88,936$98,707$99,650 $101,355 1,3321,3321,3321,3321,332 9.5% $70,671$62,909$50,547$65,584 5011,1384,1082,956 $78,994$90,268 $100,039 $100,982 $102,687 1,087----9.4% $71,172$64,046$54,654$68,540 21.7%(10.0%)(14.7%)25.4% 17.7%16.4%14.1%17.4% $16,342$17,462 $80,081$90,268 $100,039 16.8%12.7%10.8% 21.1%23.8%26.1% $100,982 $102,687 0.9%1.7% 26.1%26.3% 8.4% (3.4%) $14,500$16,014$14,700$14,700$14,700 Project capital expenditures Total capital expenditures --6,5008,0001,500--$16,342$17,462 $21,000$24,014$16,200$14,700$14,700 (3.4%)
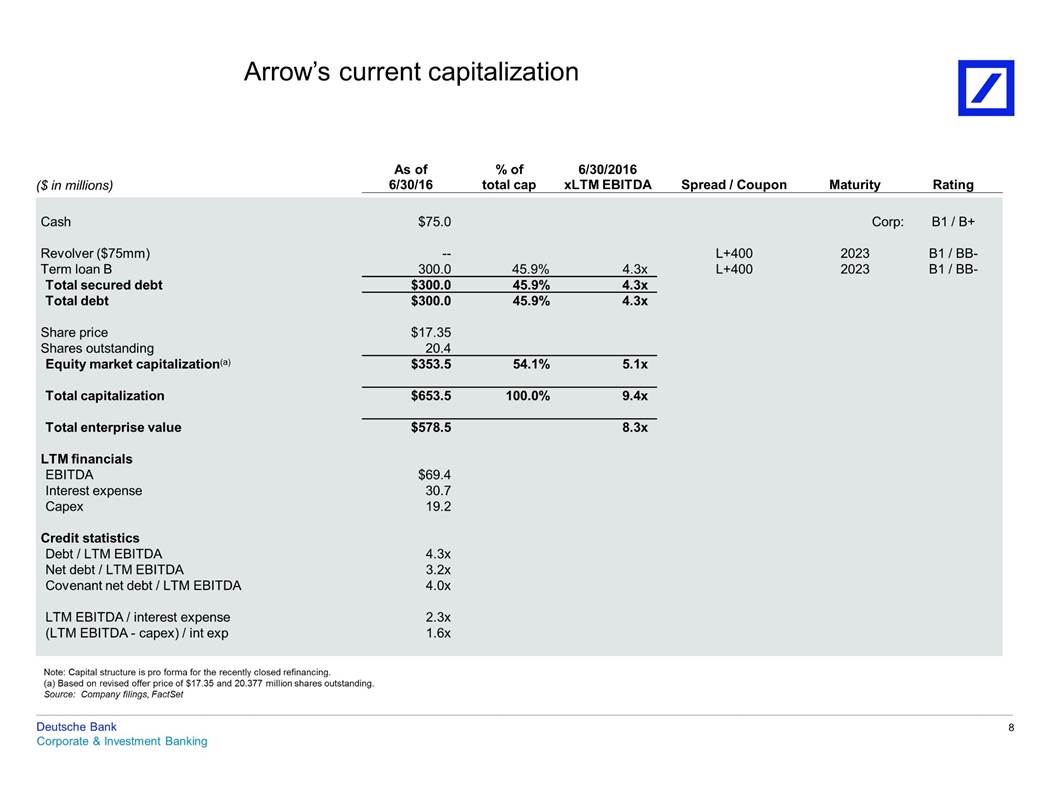
Arrow’s current capitalization As of % of 6/30/2016 ($ in millions) 6/30/16 total cap xLTM EBITDA Spread / Coupon Maturity Rating Cash $75.0 Corp: B1 / B+ Revolver ($75mm) Term loan B Total secured debt Total debt --300.0 L+400 L+400 2023 2023 B1 / BB-B1 / BB-45.9% 4.3x $300.0 45.9% 4.3x $300.0 45.9% 4.3x Share price Shares outstanding Equity market capitalization(a) $17.35 20.4 $353.5 54.1% 5.1x Total capitalization $653.5 100.0% 9.4x Total enterprise value $578.5 8.3x LTM financials EBITDA Interest expense Capex $69.4 30.7 19.2 Credit statistics Debt / LTM EBITDA Net debt / LTM EBITDA Covenant net debt / LTM EBITDA 4.3x 3.2x 4.0x LTM EBITDA / interest expense (LTM EBITDA - capex) / int exp 2.3x 1.6x Note: Capital structure is pro forma for the recently closed refinancing. (a) Based on revised offer price of $17.35 and 20.377 million shares outstanding. Source: Company filings, FactSet Deutsche Bank Corporate & Investment Banking 8
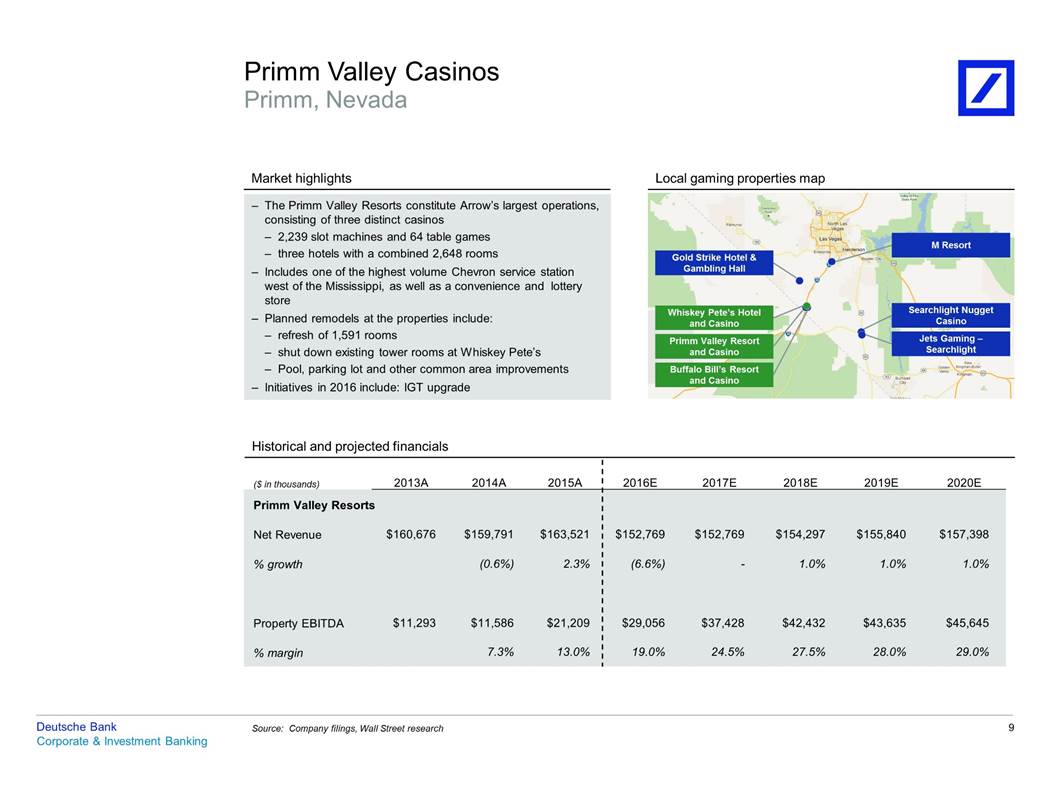
Primm Valley Casinos Primm, Nevada Market highlights Local gaming properties map Casino and Casino Historical and projected financials ($ in thousands) Primm Valley Resorts Net Revenue % growth Property EBITDA % margin Deutsche Bank Corporate & Investment Banking 9 Source: Company filings, Wall Street research 2013A2014A2015A 2016E2017E2018E2019E2020E $160,676$159,791$163,521 (0.6%)2.3% $11,293$11,586$21,209 7.3%13.0% $152,769$152,769$154,297$155,840$157,398 (6.6%)-1.0%1.0%1.0% $29,056$37,428$42,432$43,635$45,645 19.0%24.5%27.5%28.0%29.0% Primm Valley Resort Buffalo Bill’s Resort and Casino Searchlight Nugget Jets Gaming – Searchlight Whiskey Pete’s Hotel and Casino Gold Strike Hotel & Gambling Hall M Resort – The Primm Valley Resorts constitute Arrow’s largest operations, consisting of three distinct casinos – 2,239 slot machines and 64 table games – three hotels with a combined 2,648 rooms – Includes one of the highest volume Chevron service station west of the Mississippi, as well as a convenience and lottery store – Planned remodels at the properties include: – refresh of 1,591 rooms – shut down existing tower rooms at Whiskey Pete’s – Pool, parking lot and other common area improvements – Initiatives in 2016 include: IGT upgrade
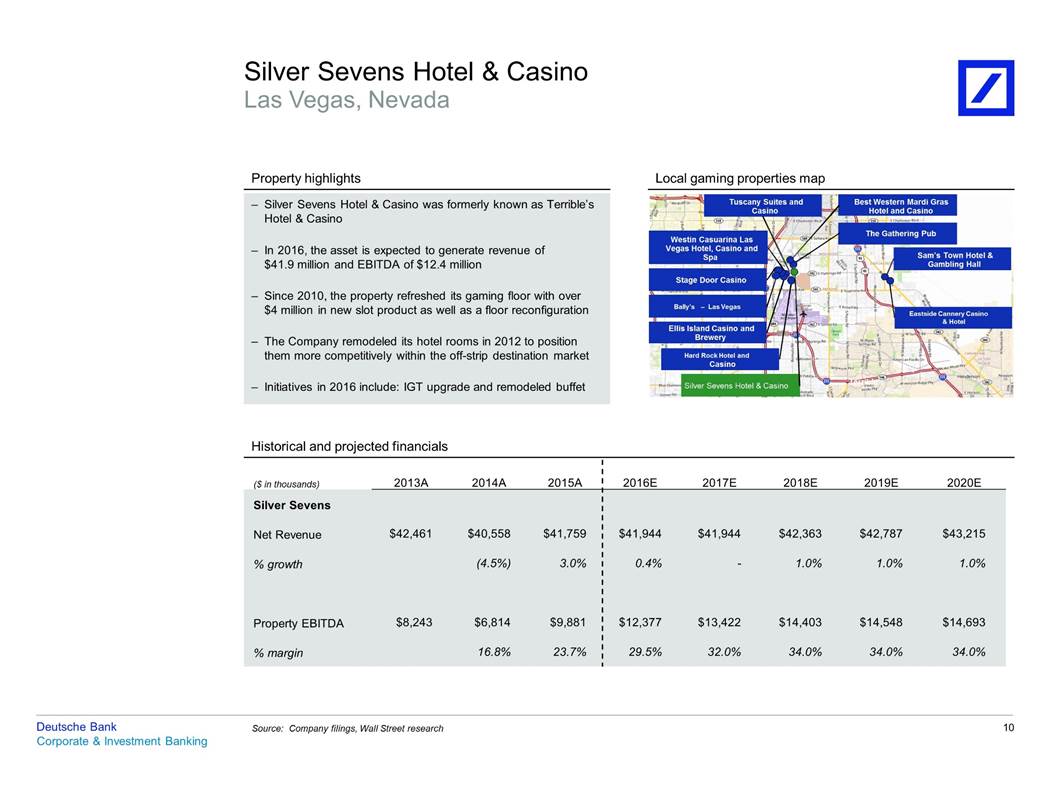
Silver Sevens Hotel Las Vegas, Nevada & Casino Property highlights Local gaming properties map Sam’s Town Hotel & Gambling Hall Casino Terrible’s Bowl Historical and projected financials ($ in thousands) Silver Sevens Net Revenue % growth Property EBITDA % margin Deutsche Bank Corporate & Investment Banking 10 Source: Company filings, Wall Street research 2013A2014A2015A 2016E2017E2018E2019E2020E $42,461$40,558$41,759 (4.5%)3.0% $8,243$6,814$9,881 16.8%23.7% $41,944$41,944$42,363$42,787$43,215 0.4%-1.0%1.0%1.0% $12,377$13,422$14,403$14,548$14,693 29.5%32.0%34.0%34.0%34.0% Silver Sevens Hotel & Casino Hard Rock Hotel and Ellis Island Casino and Brewery Eastside Cannery Casino & Hotel Bally’s – Las Vegas Stage Door Casino Westin Casuarina Las Vegas Hotel, Casino and Spa The Gathering Pub – Silver Sevens Hotel & Casino was formerly known as Terrible’s Hotel & Casino – In 2016, the asset is expected to generate revenue of $41.9 million and EBITDA of $12.4 million – Since 2010, the property refreshed its gaming floor with over $4 million in new slot product as well as a floor reconfiguration – The Company remodeled its hotel rooms in 2012 to position them more competitively within the off-strip destination market – Initiatives in 2016 include: IGT upgrade and remodeled buffet Best Western Mardi Gras Hotel and Casino Tuscany Suites and Casino
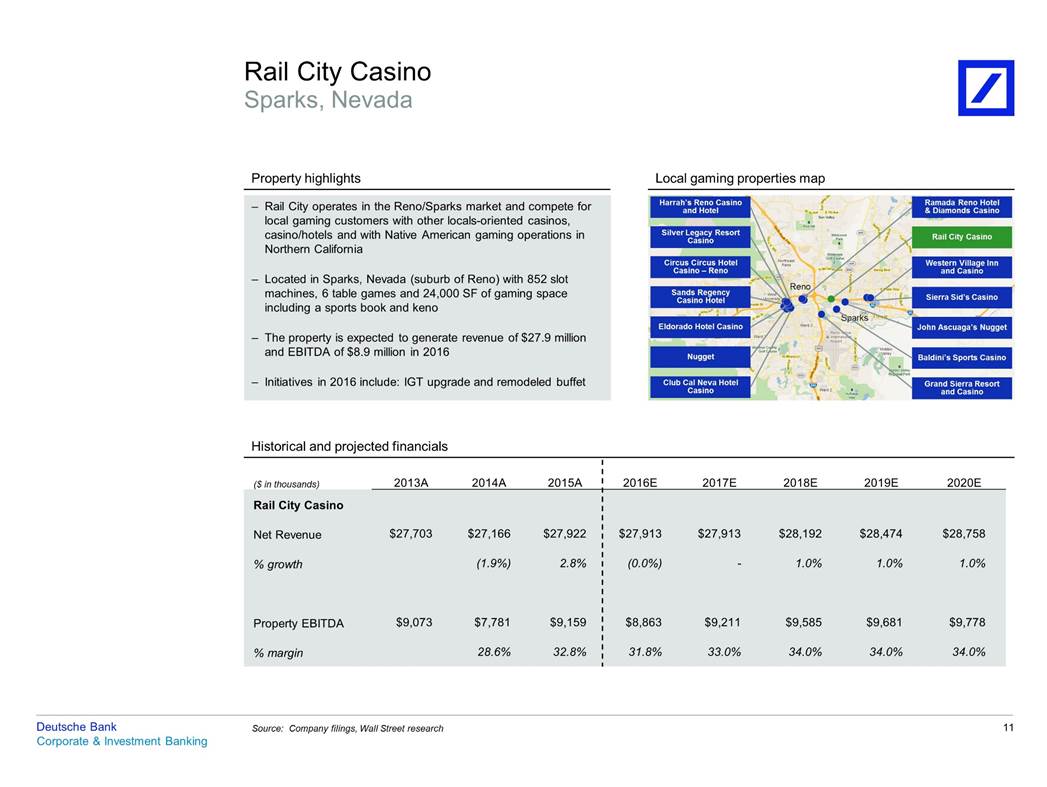
Rail City Casino Sparks, Nevada Property highlights Local gaming properties map and Casino and Casino Historical and projected financials ($ in thousands) Rail City Casino Net Revenue % growth Property EBITDA % margin Deutsche Bank Corporate & Investment Banking 11 Source: Company filings, Wall Street research 2013A2014A2015A 2016E2017E2018E2019E2020E $27,703$27,166$27,922 (1.9%)2.8% $9,073$7,781$9,159 28.6%32.8% $27,913$27,913$28,192$28,474$28,758 (0.0%)-1.0%1.0%1.0% $8,863$9,211$9,585$9,681$9,778 31.8%33.0%34.0%34.0%34.0% Grand Sierra Resort Club Cal Neva Hotel Casino Baldini’s Sports Casino Nugget John Ascuaga’s Nugget Eldorado Hotel Casino Sierra Sid’s Casino Sands Regency Casino Hotel Western Village Inn Circus Circus Hotel Casino – Reno Rail City Casino Silver Legacy Resort Casino – Rail City operates in the Reno/Sparks market and compete for local gaming customers with other locals-oriented casinos, casino/hotels and with Native American gaming operations in Northern California – Located in Sparks, Nevada (suburb of Reno) with 852 slot machines, 6 table games and 24,000 SF of gaming space including a sports book and keno – The property is expected to generate revenue of $27.9 million and EBITDA of $8.9 million in 2016 – Initiatives in 2016 include: IGT upgrade and remodeled buffet Ramada Reno Hotel & Diamonds Casino Harrah’s Reno Casino and Hotel
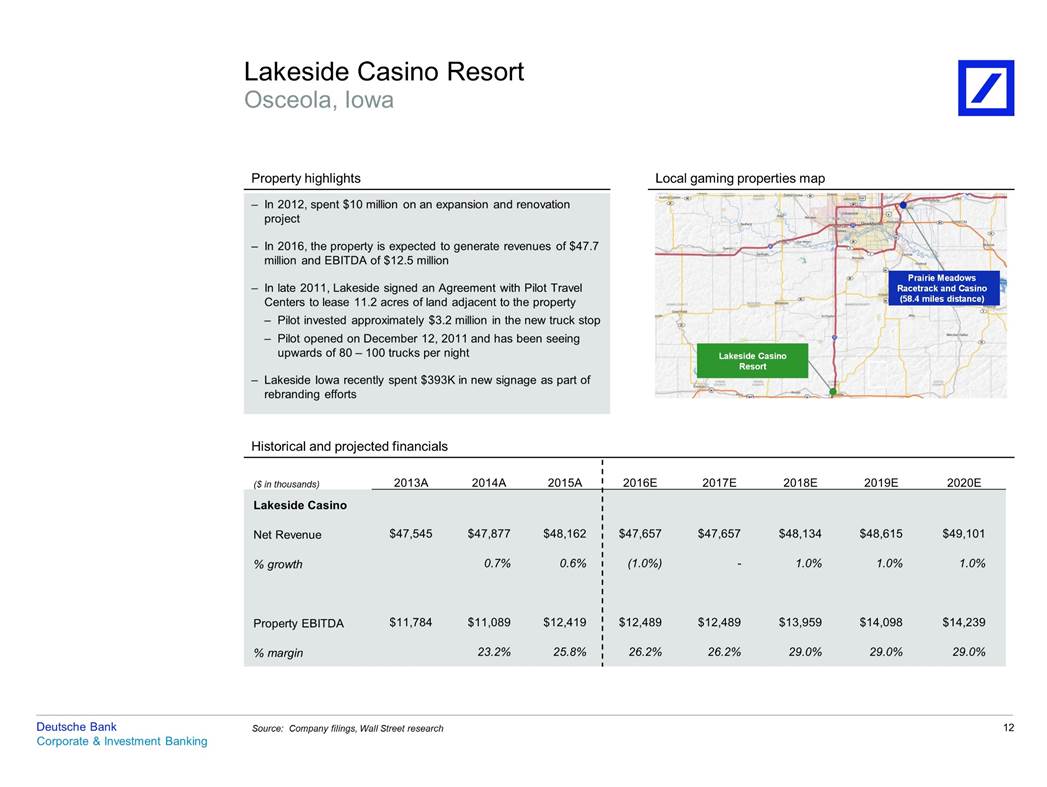
Lakeside Casino Osceola, Iowa Resort Property highlights Local gaming properties map Historical and projected financials ($ in thousands) Lakeside Casino Net Revenue % growth Property EBITDA % margin Deutsche Bank Corporate & Investment Banking 12 Source: Company filings, Wall Street research 2013A2014A2015A 2016E2017E2018E2019E2020E $47,545$47,877$48,162 0.7%0.6% $11,784$11,089$12,419 23.2%25.8% $47,657$47,657$48,134$48,615$49,101 (1.0%)-1.0%1.0%1.0% $12,489$12,489$13,959$14,098$14,239 26.2%26.2%29.0%29.0%29.0% – In 2012, spent $10 million on an expansion and renovation project – In 2016, the property is expected to generate revenues of $47.7 million and EBITDA of $12.5 million – In late 2011, Lakeside signed an Agreement with Pilot Travel Centers to lease 11.2 acres of land adjacent to the property – Pilot invested approximately $3.2 million in the new truck stop – Pilot opened on December 12, 2011 and has been seeing upwards of 80 – 100 trucks per night – Lakeside Iowa recently spent $393K in new signage as part of rebranding efforts
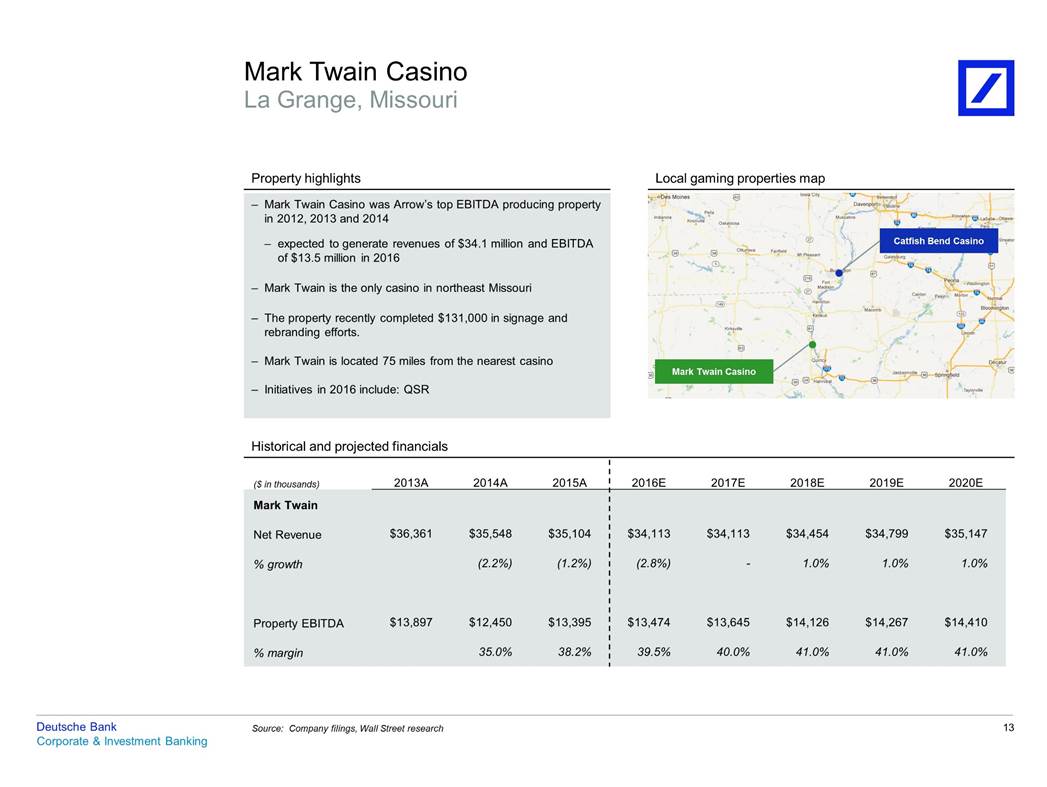
Mark Twain Casino La Grange, Missouri Property highlights Local gaming properties map Historical and projected financials ($ in thousands) Mark Twain Net Revenue % growth Property EBITDA % margin Deutsche Bank Corporate & Investment Banking 13 Source: Company filings, Wall Street research 2013A2014A2015A 2016E2017E2018E2019E2020E $36,361$35,548$35,104 (2.2%)(1.2%) $13,897$12,450$13,395 35.0%38.2% $34,113$34,113$34,454$34,799$35,147 (2.8%)-1.0%1.0%1.0% $13,474$13,645$14,126$14,267$14,410 39.5%40.0%41.0%41.0%41.0% Mark Twain Casino Catfish Bend Casino – Mark Twain Casino was Arrow’s top EBITDA producing property in 2012, 2013 and 2014 – expected to generate revenues of $34.1 million and EBITDA of $13.5 million in 2016 – Mark Twain is the only casino in northeast Missouri – The property recently completed $131,000 in signage and rebranding efforts. – Mark Twain is located 75 miles from the nearest casino – Initiatives in 2016 include: QSR
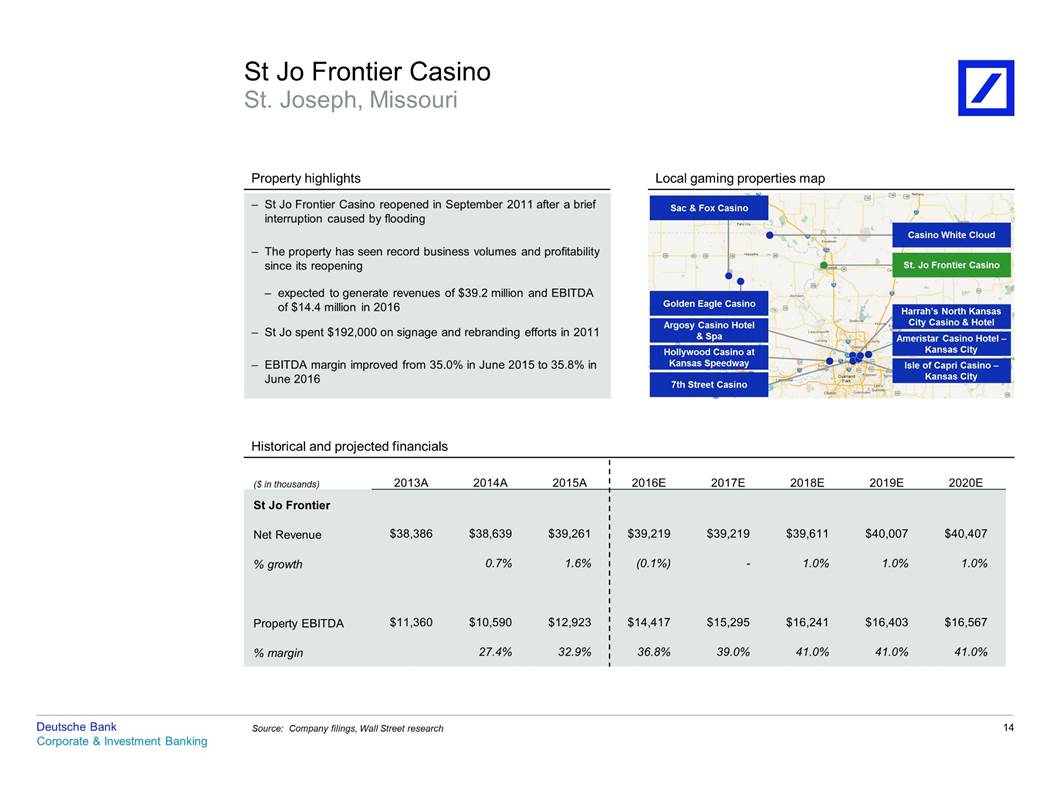
St Jo Frontier Casino St. Joseph, Missouri Property highlights Local gaming properties map Historical and projected financials ($ in thousands) St Jo Frontier Net Revenue % growth Property EBITDA % margin Deutsche Bank Corporate & Investment Banking 14 Source: Company filings, Wall Street research 2013A2014A2015A 2016E2017E2018E2019E2020E $38,386$38,639$39,261 0.7%1.6% $11,360$10,590$12,923 27.4%32.9% $39,219$39,219$39,611$40,007$40,407 (0.1%)-1.0%1.0%1.0% $14,417$15,295$16,241$16,403$16,567 36.8%39.0%41.0%41.0%41.0% Harrah’s North Kansas City Casino & Hotel Ameristar Casino Hotel – Kansas City Isle of Capri Casino – Kansas City Golden Eagle Casino Argosy Casino Hotel & Spa Hollywood Casino at Kansas Speedway 7th Street Casino St. Jo Frontier Casino Casino White Cloud – St Jo Frontier Casino reopened in September 2011 after a brief interruption caused by flooding – The property has seen record business volumes and profitability since its reopening – expected to generate revenues of $39.2 million and EBITDA of $14.4 million in 2016 – St Jo spent $192,000 on signage and rebranding efforts in 2011 – EBITDA margin improved from 35.0% in June 2015 to 35.8% in June 2016 Sac & Fox Casino
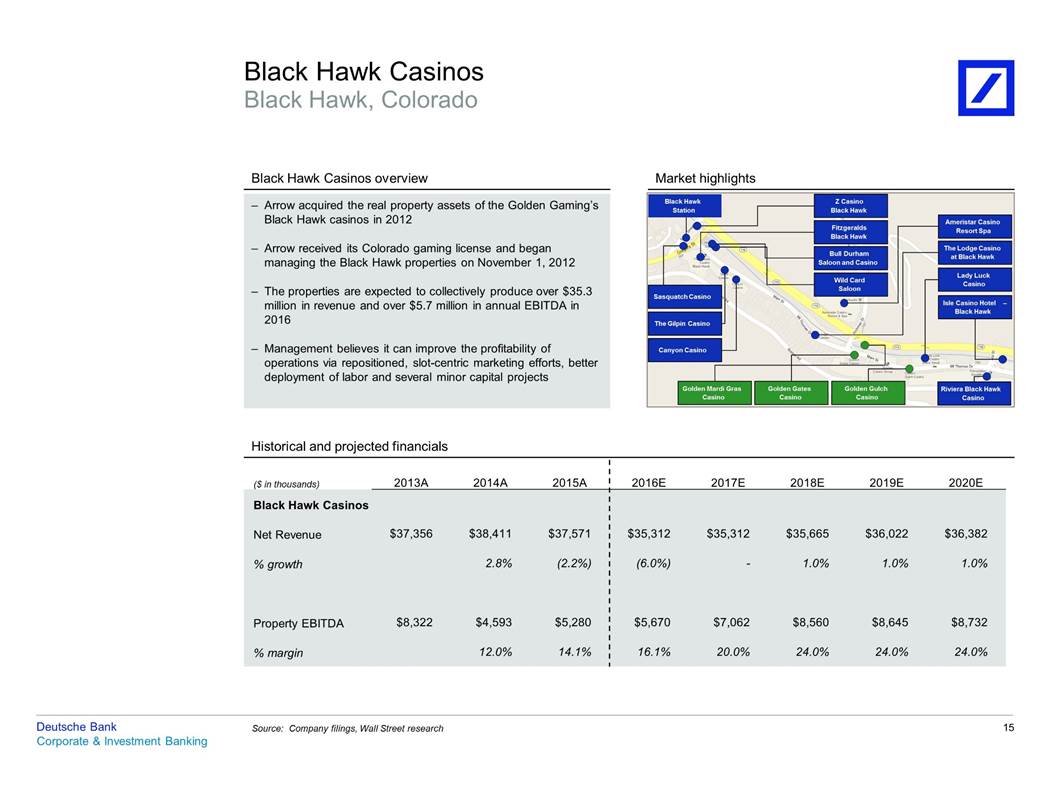
Black Hawk Casinos Black Hawk, Colorado Black Hawk Casinos overview Market highlights Black Hawk Historical and projected financials ($ in thousands) Black Hawk Casinos Net Revenue % growth Property EBITDA % margin Deutsche Bank Corporate & Investment Banking 15 Source: Company filings, Wall Street research 2013A2014A2015A 2016E2017E2018E2019E2020E $37,356$38,411$37,571 2.8%(2.2%) $8,322$4,593$5,280 12.0%14.1% $35,312$35,312$35,665$36,022$36,382 (6.0%)-1.0%1.0%1.0% $5,670$7,062$8,560$8,645$8,732 16.1%20.0%24.0%24.0%24.0% – Arrow acquired the real property assets of the Golden Gaming’s Black Hawk casinos in 2012 – Arrow received its Colorado gaming license and began managing the Black Hawk properties on November 1, 2012 – The properties are expected to collectively produce over $35.3 million in revenue and over $5.7 million in annual EBITDA in 2016 – Management believes it can improve the profitability of operations via repositioned, slot-centric marketing efforts, better deployment of labor and several minor capital projects Black Hawk Station Z Casino Black Hawk Ameristar Casino Resort Spa Fitzgeralds The Lodge Casino at Black Hawk Bull Durham Saloon and Casino Lady Luck Casino Wild Card Saloon Sasquatch Casino Isle Casino Hotel – Black Hawk The Gilpin Casino Canyon Casino Golden Mardi Gras Casino Golden Gates Casino Golden Gulch Casino Riviera Black Hawk Casino
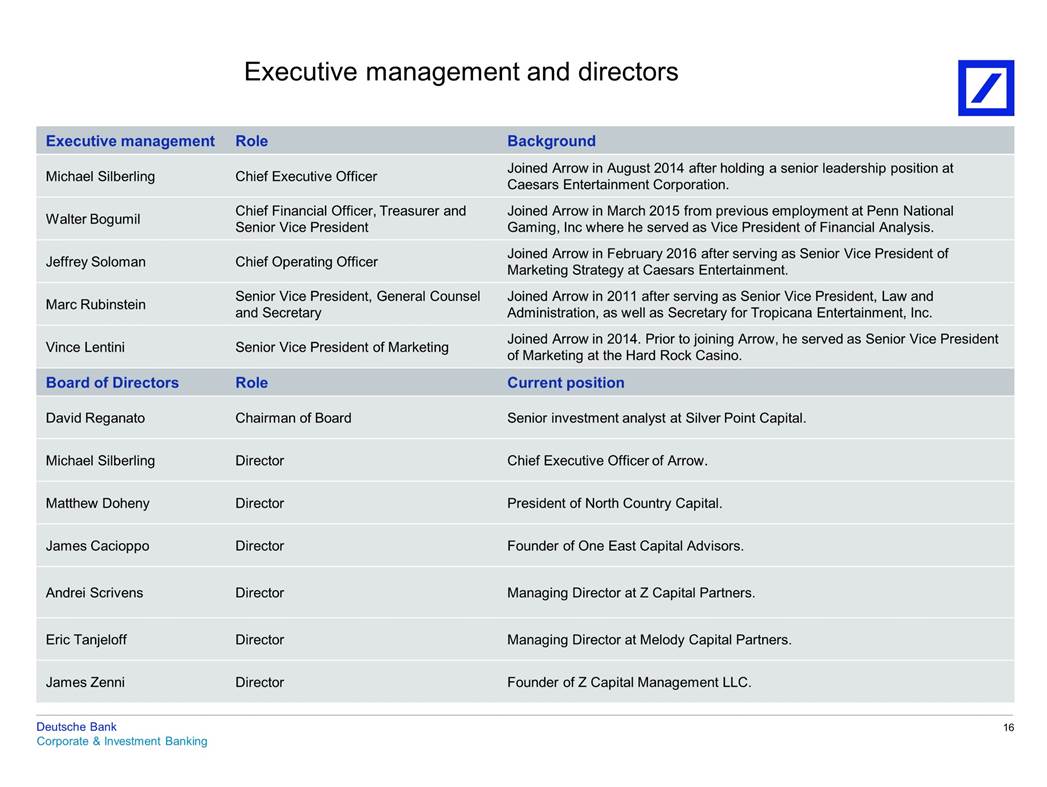
Executive management and directors Joined Arrow in August 2014 after holding a senior leadership position at Caesars Entertainment Corporation. Joined Arrow in March 2015 from previous employment at Penn National Gaming, Inc where he served as Vice President of Financial Analysis. Joined Arrow in February 2016 after serving as Senior Vice President of Marketing Strategy at Caesars Entertainment. Joined Arrow in 2011 after serving as Senior Vice President, Law and Administration, as well as Secretary for Tropicana Entertainment, Inc. Joined Arrow in 2014. Prior to joining Arrow, he served as Senior Vice President of Marketing at the Hard Rock Casino. Michael Silberling Chief Executive Officer Chief Financial Officer, Treasurer and Senior Vice President Walter Bogumil Jeffrey Soloman Chief Operating Officer Senior Vice President, General Counsel and Secretary Marc Rubinstein Vince Lentini Senior Vice President of Marketing David Reganato Chairman of Board Senior investment analyst at Silver Point Capital. Michael Silberling Director Chief Executive Officer of Arrow. Matthew Doheny Director President of North Country Capital. James Cacioppo Director Founder of One East Capital Advisors. Andrei Scrivens Director Managing Director at Z Capital Partners. Eric Tanjeloff Director Managing Director at Melody Capital Partners. James Zenni Director Founder of Z Capital Management LLC. Deutsche Bank Corporate & Investment Banking 16 Board of DirectorsRoleCurrent position Executive managementRoleBackground
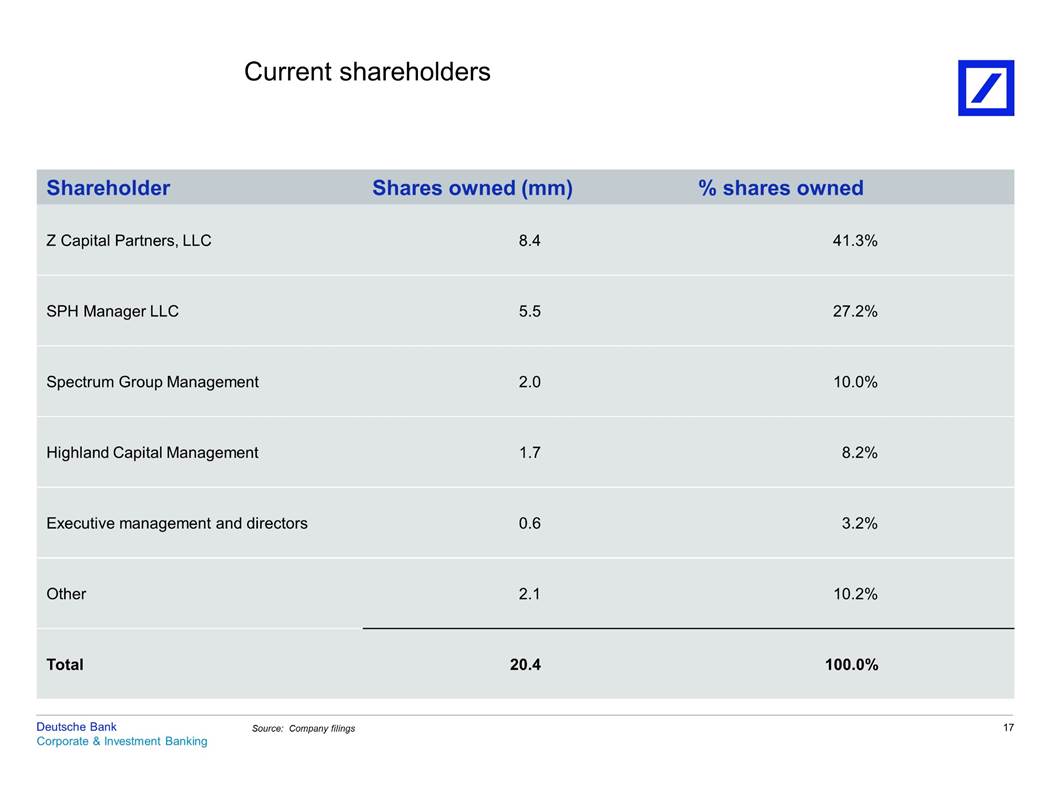
Current shareholders Z Capital Partners, LLC 8.4 41.3% SPH Manager LLC 5.5 27.2% Spectrum Group Management 2.0 10.0% Highland Capital Management 1.7 8.2% Executive management and directors 0.6 3.2% Other 2.1 10.2% Total 20.4 100.0% Deutsche Bank Corporate & Investment Banking 17 Source: Company filings ShareholderShares owned (mm)% shares owned
Deutsche Bank Corporate & Investment Banking Section Valuation 3
Illustrative valuation analysis Deutsche Bank Corporate & Investment Banking Note: All analyses assume debt balance pro forma for the recent refinancing, 20.4 million shares and total cash balance of $75mm as of 6/30/16 as per Arrow management’s guidance 18 (a) Assumes 50% of 2016E EBITDA of $80.1 million and 50% of 2017E EBITDA of $90.3 million Source: Arrow management, Wall Street research Method Relevant parameters ($mm) Implied share price TEV / 2016E EBITDA multiple: 6.75x - 8.00x 2016E EBITDA: $80.1 million TEV / 2017E EBITDA multiple: 6.00x - 7.25x 2017E EBITDA: $90.3 million TEV / FY + 1 EBITDA multiple: 6.00x - 7.25x FY + 1 EBITDA: $85.2 million (a) WACC: 9% - 12% TEV / FY+1 EBITDA multiple: 6.00x - 7.25x Discount rate: 12.0% - 14.0% TEV / FY+1 EBITDA multiple: 6.00x - 7.25x $17.35 $15.49 $20.40 $15.54 $21.08 $14.04 $19.26 $16.92 $24.23 $15.54 $24.30 Trading comparables Transaction comparables Discounted cash flow Discounted future share price
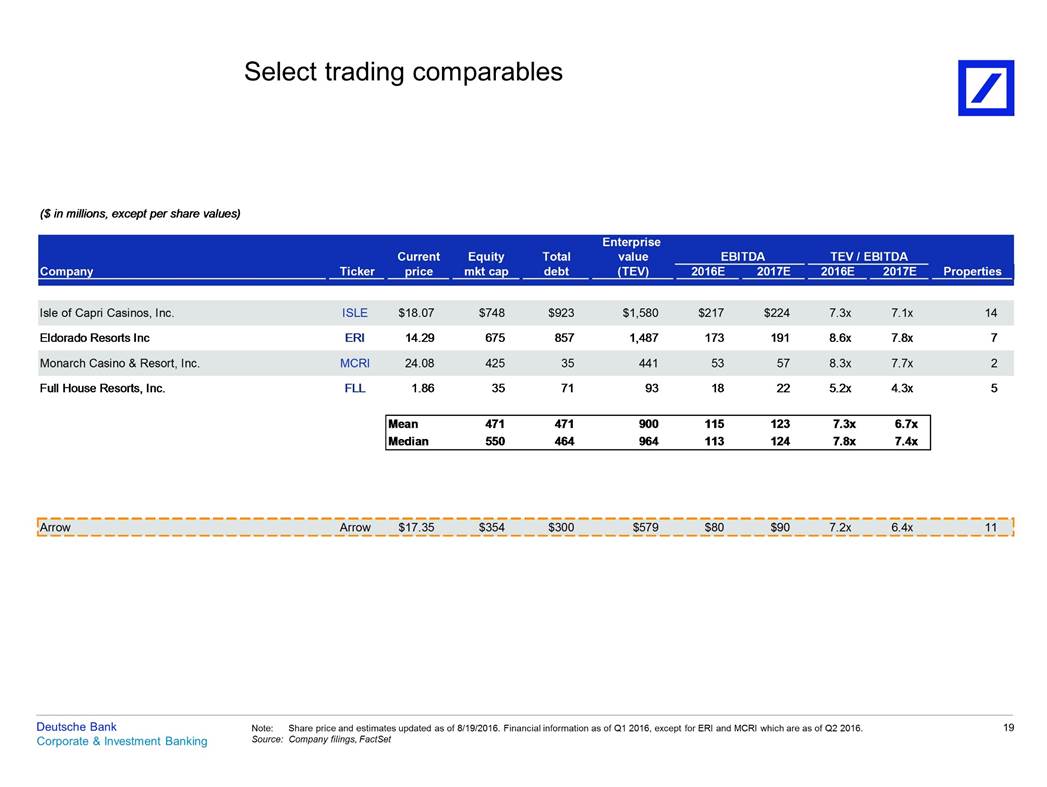
Select trading comparables ($ in millions, except per share values) Eldorado Resorts Inc ERI 14.29 675 857 1,487 173 191 8.6x 7.8x 7 Full House Resorts, Inc. FLL 1.86 35 71 93 18 22 5.2x 4.3x 5 Deutsche Bank Corporate & Investment Banking 19 Note:Share price and estimates updated as of 8/19/2016. Financial information as of Q1 2016, except for ERI and MCRI which are as of Q2 2016. Source: Company filings, FactSet ArrowArrow$17.35$354$300$579$80$907.2x6.4x11 Mean4714719001151237.3x6.7x Median5504649641131247.8x7.4x Monarch Casino & Resort, Inc.MCRI24.084253544153578.3x7.7x2 Isle of Capri Casinos, Inc.ISLE$18.07$748$923$1,580$217$2247.3x7.1x14 Company Enterprise CurrentEquityTotalvalue Ticker price mkt cap debt (TEV) EBITDATEV / EBITDA 2016E 2017E 2016E2017E Properties
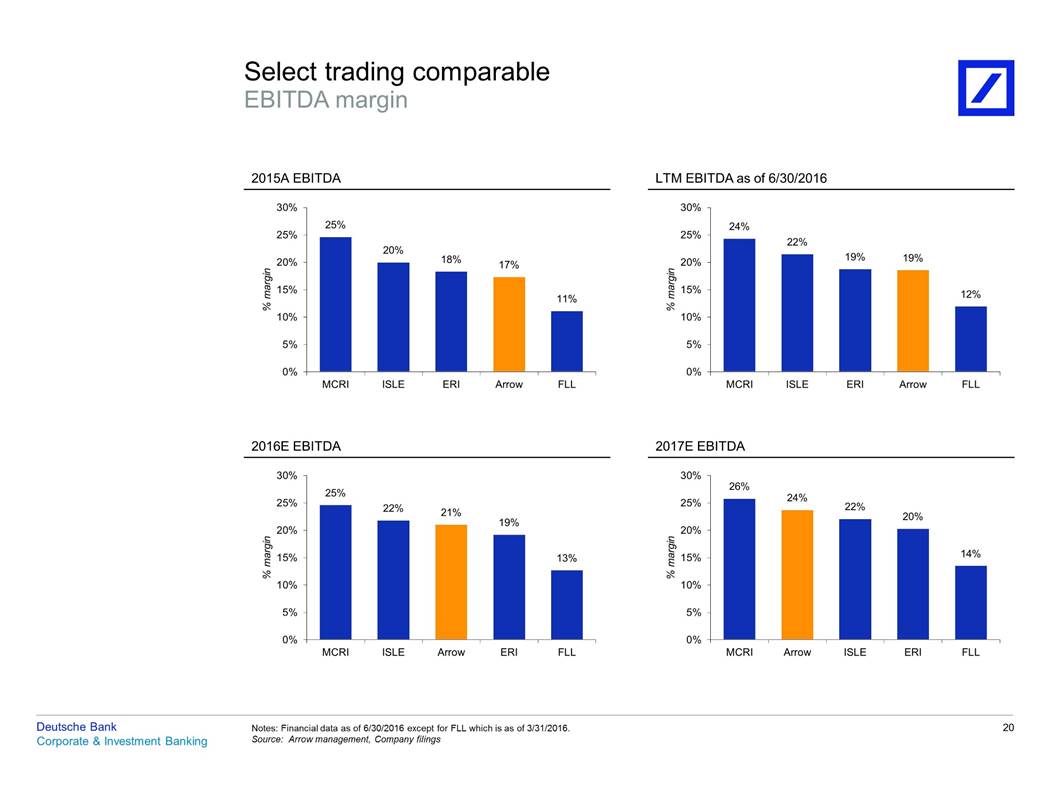
Select trading comparable EBITDA margin 2015A EBITDA LTM EBITDA as of 6/30/2016 30% 30% 25% 25% 18% 20% 20% 17% 15% 15% 10% 10% 5% 5% 0% 0% MCRI ISLE ERI Arrow FLL MCRI ISLE ERI Arrow FLL 2016E EBITDA 2017E EBITDA 30% 30% 24% 25% 25% 20% 19% 20% 20% 15% 15% 10% 10% 5% 5% 0% 0% MCRI ISLE Arrow ERI FLL MCRI Arrow ISLE ERI FLL Deutsche Bank Corporate & Investment Banking 20 Notes: Financial data as of 6/30/2016 except for FLL which is as of 3/31/2016. Source: Arrow management, Company filings % margin % margin % margin % margin 26% 22% 14% 25% 22%21% 13% 24% 22% 19%19% 12% 25% 20% 11%
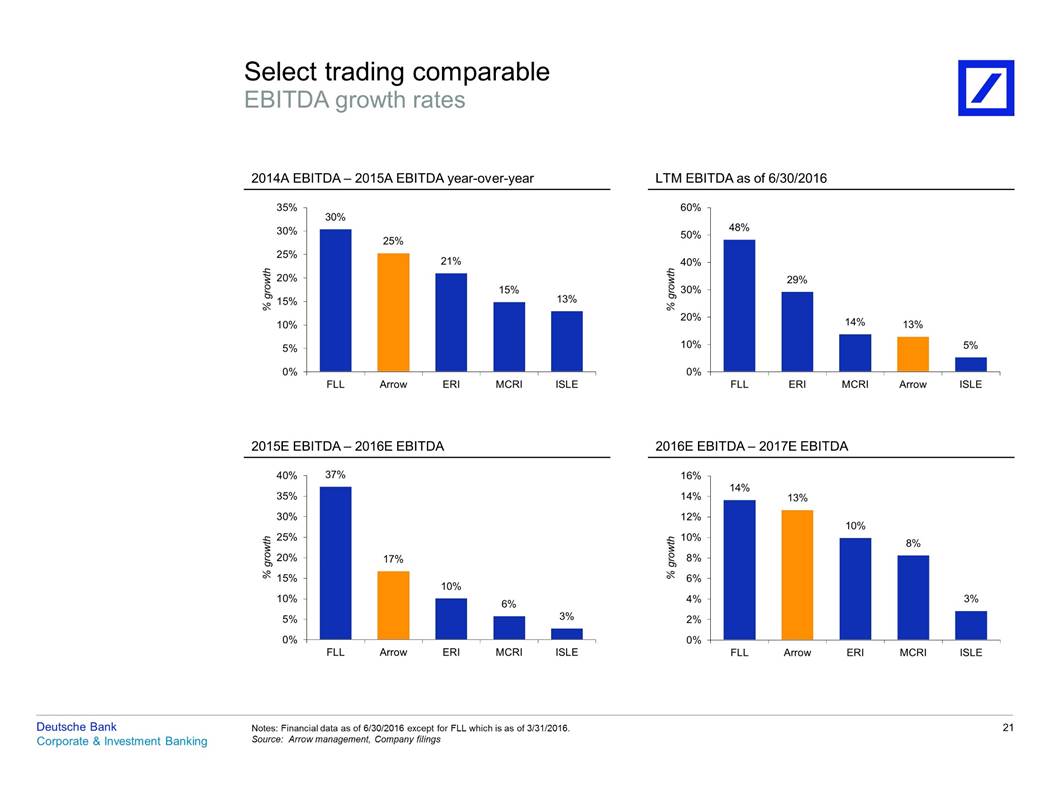
Select trading comparable EBITDA growth rates 2014A EBITDA – 2015A EBITDA year-over-year LTM EBITDA as of 6/30/2016 35% 60% 30% 50% 25% 40% 20% 30% 15% 20% 10% 10% 5% 0% 0% FLL Arrow ERI MCRI ISLE FLL ERI MCRI Arrow ISLE 2015E EBITDA – 2016E EBITDA 2016E EBITDA – 2017E EBITDA 40% 35% 30% 25% 20% 15% 10% 5% 0% 37% 16% 14% 12% 10% 8% 6% 4% 2% 0% FLL Arrow ERI MCRI ISLE FLL Arrow ERI MCRI ISLE Deutsche Bank Corporate & Investment Banking 21 Notes: Financial data as of 6/30/2016 except for FLL which is as of 3/31/2016. Source: Arrow management, Company filings % growth % growth % growth % growth 14% 13% 10% 8% 3% 17% 10% 6% 3% 48% 29% 14%13% 5% 30% 25% 21% 15% 13%
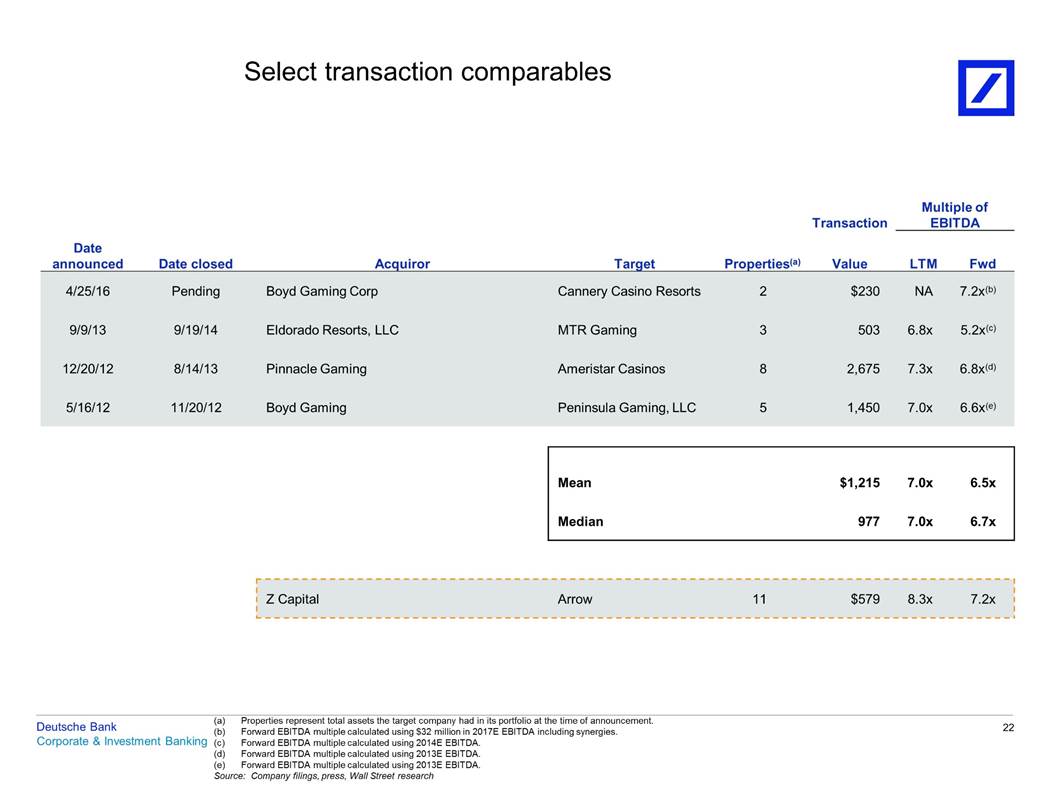
Select transaction comparables Multiple of EBITDA Transaction Date announced Date closed Acquiror Target Properties(a) Value LTM Fwd (a) Properties represent total assets the target company had in its portfolio at the time of announcement. Forward EBITDA multiple calculated using $32 million in 2017E EBITDA including synergies. Forward EBITDA multiple calculated using 2014E EBITDA. Forward EBITDA multiple calculated using 2013E EBITDA. Forward EBITDA multiple calculated using 2013E EBITDA. Deutsche Bank 22 (b) Corporate & Investment Banking (c) (d) (e) Source: Company filings, press, Wall Street research Z CapitalArrow11$5798.3x7.2x Mean$1,2157.0x6.5x Median9777.0x6.7x 4/25/16PendingBoyd Gaming CorpCannery Casino Resorts2$230NA7.2x(b) 9/9/139/19/14Eldorado Resorts, LLCMTR Gaming35036.8x5.2x(c) 12/20/128/14/13Pinnacle GamingAmeristar Casinos82,6757.3x6.8x(d) 5/16/1211/20/12Boyd GamingPeninsula Gaming, LLC51,4507.0x6.6x(e)
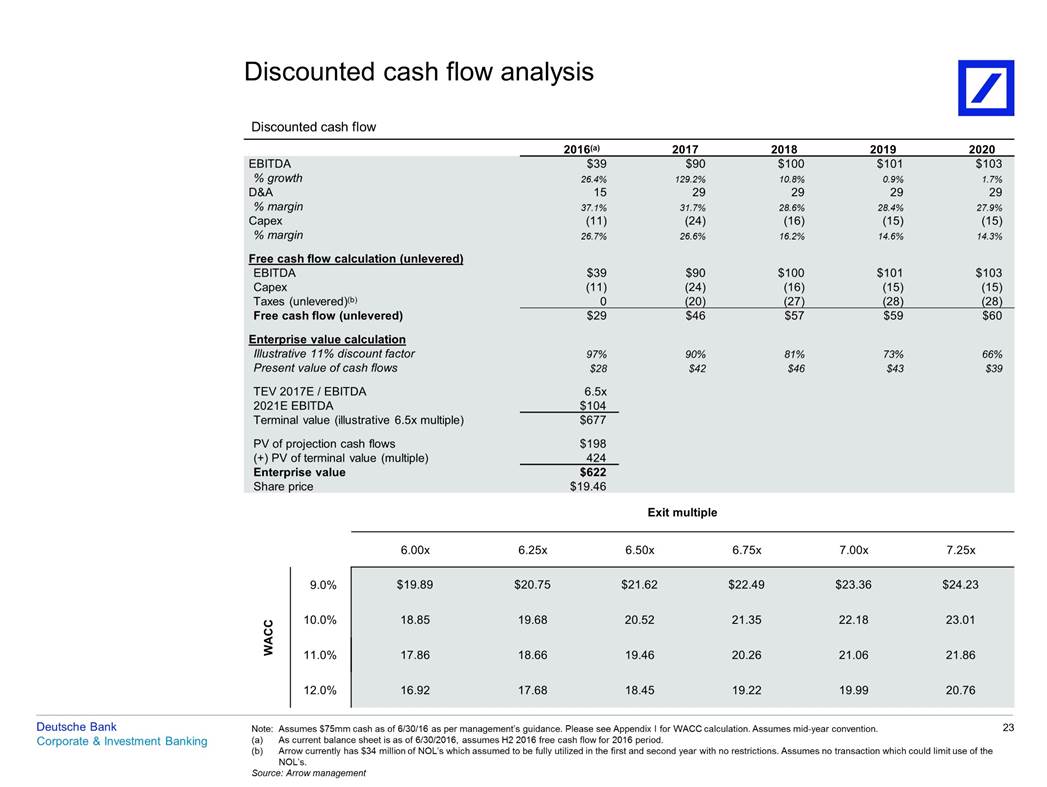
Discounted cash flow analysis Discounted cash flow 2016(a) 2017 2018 2019 2020 EBITDA % growth D&A % margin Capex % margin Free cash flow calculation (unlevered) $39 26.4% 15 37.1% (11) 26.7% $90 129.2% 29 31.7% (24) 26.6% $100 10.8% 29 28.6% (16) 16.2% $101 0.9% 29 28.4% (15) 14.6% $103 1.7% 29 27.9% (15) 14.3% EBITDA Capex Taxes (unlevered)(b) Free cash flow (unlevered) Enterprise value calculation $39 (11) 0 $90 (24) (20) $100 (16) (27) $101 (15) (28) $103 (15) (28) $29 $46 $57 $59 $60 Illustrative 11% discount factor Present value of cash flows TEV 2017E / EBITDA 2021E EBITDA Terminal value (illustrative 6.5x multiple) PV of projection cash flows (+) PV of terminal value (multiple) Enterprise value Share price 97% $28 90% $42 81% $46 73% $43 66% $39 6.5x $104 $677 $198 424 $622 $19.46 Exit multiple 6.00x 6.25x 6.50x 6.75x 7.00x 7.25x 9.0% 10.0% 11.0% 12.0% Deutsche Bank Corporate & Investment Banking 23 Note: Assumes $75mm cash as of 6/30/16 as per management’s guidance. Please see Appendix I for WACC calculation. Assumes mid-year convention. (a) (b) As current balance sheet is as of 6/30/2016, assumes H2 2016 free cash flow for 2016 period. Arrow currently has $34 million of NOL’s which assumed to be fully utilized in the first and second year with no restrictions. Assumes no transaction which could limit use of the NOL’s. Source: Arrow management WACC $19.89$20.75$21.62$22.49$23.36$24.23 18.8519.6820.5221.3522.1823.01 17.8618.6619.4620.2621.0621.86 16.9217.6818.4519.2219.9920.76
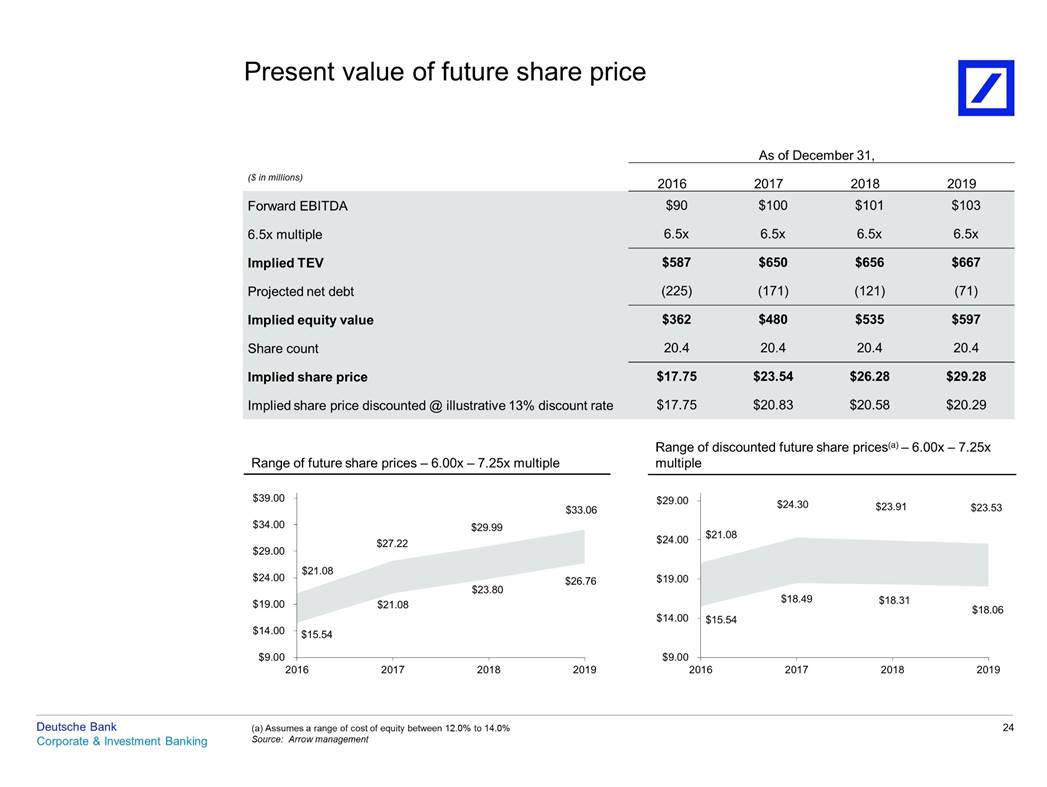
Present value of future share price As of December 31, ($ in millions) 2016 2017 2018 2019 Forward EBITDA $90 $100 $101 $103 6.5x 6.5x 6.5x 6.5x 6.5x multiple Implied TEV $587 $650 $656 $667 (225) (171) (121) (71) Projected net debt Implied equity value $362 $480 $535 $597 Share count 20.4 20.4 20.4 20.4 $17.75 $23.54 $26.28 $29.28 Implied share price Implied share price discounted @ illustrative 13% discount rate $17.75 $20.83 $20.58 $20.29 Range of discounted future share prices(a) – 6.00x – 7.25x multiple Range of future share prices – 6.00x – 7.25x multiple $39.00 $29.00 $23.53 06 $34.00 $24.00 $29.00 $24.00 $19.00 76 $23.80 $19.00 .06 $14.00 $14.00 $9.00 $9.00 2016 2017 2018 2019 2016 2017 2018 2019 Deutsche Bank Corporate & Investment Banking 24 (a) Assumes a range of cost of equity between 12.0% to 14.0% Source: Arrow management $24.30$23.91 $21.08 $18.49$18.31 $18 $15.54 $33. $29.99 $27.22 $21.08 $26. $21.08 $15.54
Deutsche Bank Corporate & Investment Banking Appendix I Arrow WACC analysis
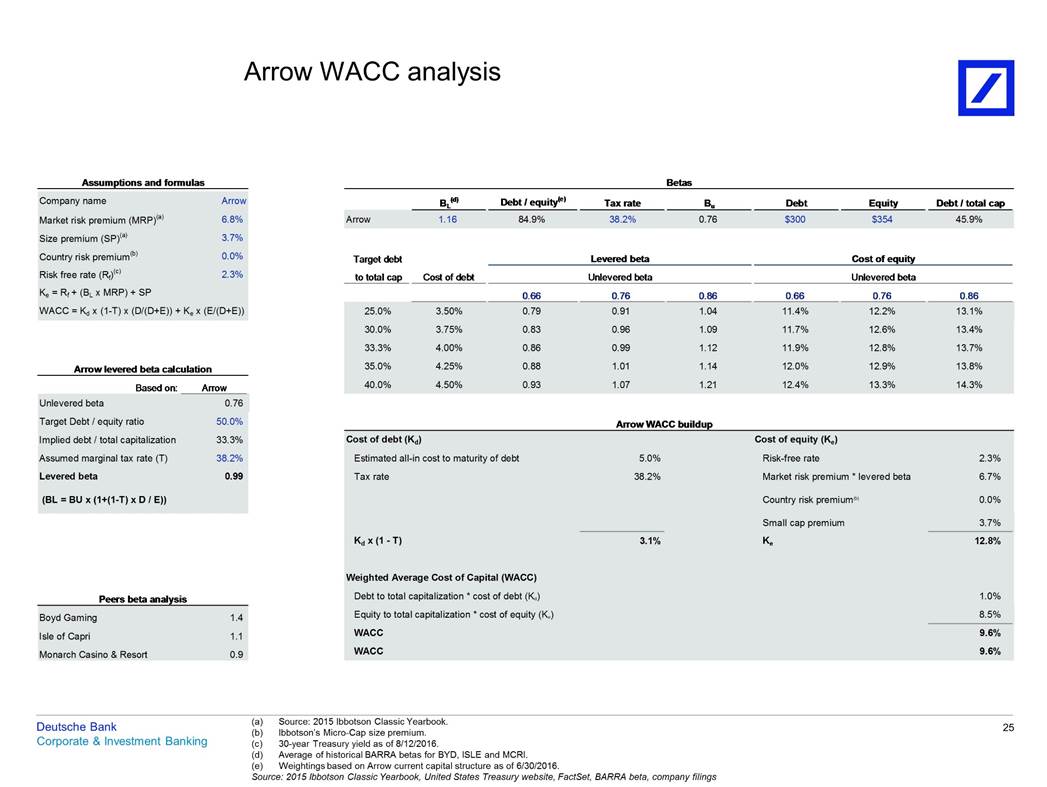
Arrow WACC analysis Assumptions and formulas Betas u Target debt Levered beta Cost of equity 0.66 0.76 0.86 0.66 0.76 0.86 Arrow levered beta calculation Based on: Arrow Arrow WACC buildup Peers beta analysis (a) (b) (c) (d) (e) Source: 2015 Ibbotson Classic Yearbook. Ibbotson’s Micro-Cap size premium. 30-year Treasury yield as of 8/12/2016. Average of historical BARRA betas for BYD, ISLE and MCRI. Weightings based on Arrow current capital structure as of 6/30/2016. Deutsche Bank Corporate & Investment Banking 25 Source: 2015 Ibbotson Classic Yearbook, United States Treasury website, FactSet, BARRA beta, company filings Boyd Gaming 1.4 Isle of Capri 1.1 Monarch Casino & Resort 0.9 Cost of debt (Kd) Cost of equity (Ke) Estimated all-in cost to maturity of debt 5.0% Risk-free rate Tax rate 38.2% Market risk premium * levered beta Country risk premium(b) Small cap premium Kd x (1 - T) 3.1% Ke Weighted Average Cost of Capital (WACC) Debt to total capitalization * cost of debt (Kd) Equity to total capitalization * cost of equity (Ke) WACC WACC 2.3% 6.7% 0.0% 3.7% 12.8% 1.0% 8.5% 9.6% 9.6% Unlevered beta 0.76 Target Debt / equity ratio 50.0% Implied debt / total capitalization 33.3% Assumed marginal tax rate (T) 38.2% Levered beta 0.99 (BL = BU x (1+(1-T) x D / E)) 25.0% 3.50% 0.79 0.91 1.04 11.4% 12.2% 13.1% 30.0% 3.75% 0.83 0.96 1.09 11.7% 12.6% 13.4% 33.3% 4.00% 0.86 0.99 1.12 11.9% 12.8% 13.7% 35.0% 4.25% 0.88 1.01 1.14 12.0% 12.9% 13.8% 40.0% 4.50% 0.93 1.07 1.21 12.4% 13.3% 14.3% to total cap Cost of debt Unlevered beta Unlevered beta (d) BL Debt / equity(e) Tax rate B Debt Equity Debt / total cap Arrow 1.16 84.9% 38.2% 0.76 $300 $354 45.9% Company name Arrow Market risk premium (MRP)(a) 6.8% Size premium (SP)(a) 3.7% Country risk premium(b) 0.0% (c) Risk free rate (Rf) 2.3% Ke = Rf + (BL x MRP) + SP WACC = Kd x (1-T) x (D/(D+E)) + Ke x (E/(D+E))
Deutsche Bank Corporate & Investment Banking Appendix II Gaming transaction comparables
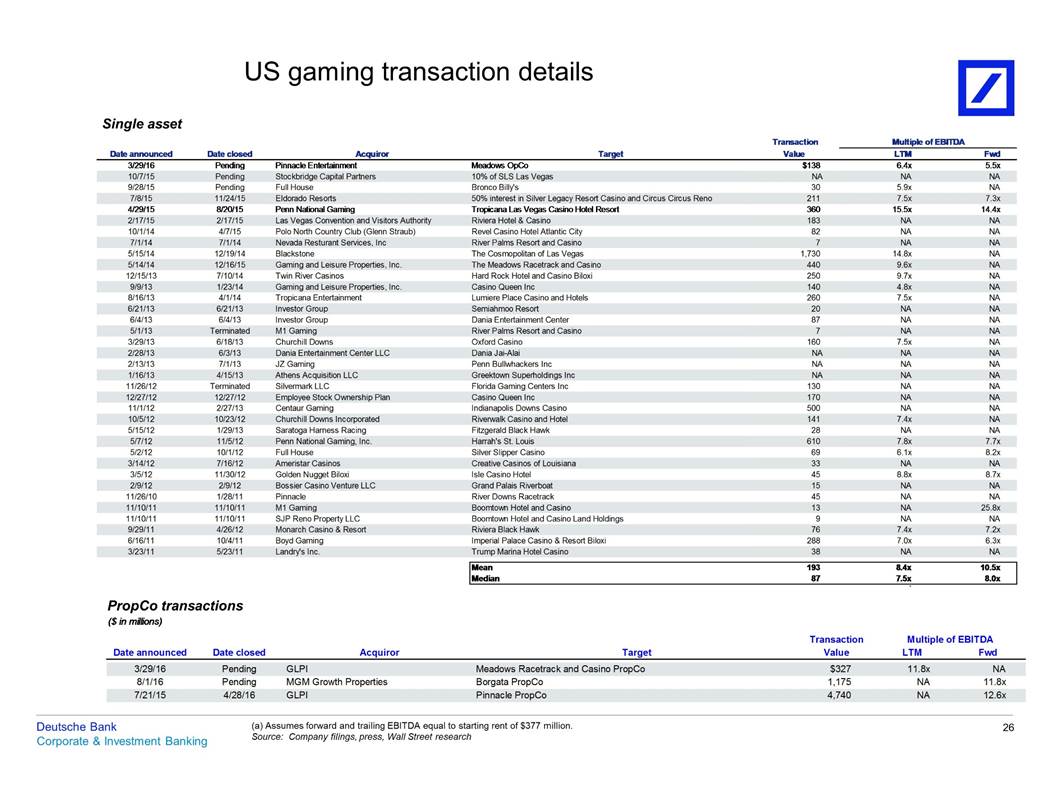
US gaming transaction details Single asset Transaction Value Multiple of EBITDA Date announced Date closed Acquiror Target LTM Fwd 3/29/16 Pending Pinnacle Entertainment Meadows OpCo $138 6.4x 5.5x 9/28/15 Pending Full House Bronco Billy's 30 5.9x NA 4/29/15 8/20/15 Penn National Gaming Tropicana Las Vegas Casino Hotel Resort 360 15.5x 14.4x 10/1/14 4/7/15 Polo North Country Club (Glenn Straub) Revel Casino Hotel Atlantic City 82 NA NA 5/15/14 12/19/14 Blackstone The Cosmopolitan of Las Vegas 1,730 14.8x NA 12/15/13 7/10/14 Twin River Casinos Hard Rock Hotel and Casino Biloxi 250 9.7x NA 8/16/13 4/1/14 Tropicana Entertainment Lumiere Place Casino and Hotels 260 7.5x NA 6/4/13 6/4/13 Investor Group Dania Entertainment Center 87 NA NA 3/29/13 6/18/13 Churchill Downs Oxford Casino 160 7.5x NA 2/13/13 7/1/13 JZ Gaming Penn Bullwhackers Inc NA NA NA 11/26/12 Terminated Silvermark LLC Florida Gaming Centers Inc 130 NA NA 11/1/12 2/27/13 Centaur Gaming Indianapolis Downs Casino 500 NA NA 5/15/12 1/29/13 Saratoga Harness Racing Fitzgerald Black Hawk 28 NA NA 5/2/12 10/1/12 Full House Silver Slipper Casino 69 6.1x 8.2x 3/5/12 11/30/12 Golden Nugget Biloxi Isle Casino Hotel 45 8.8x 8.7x 11/26/10 1/28/11 Pinnacle River Downs Racetrack 45 NA NA 11/10/11 11/10/11 SJP Reno Property LLC Boomtown Hotel and Casino Land Holdings 9 NA NA 6/16/11 10/4/11 Boyd Gaming Imperial Palace Casino & Resort Biloxi 288 7.0x 6.3x . PropCo transactions ($ in millions) Transaction Value Multiple of EBITDA Date announced Date closed Acquiror Target LTM Fwd 8/1/16 Pending MGM Growth Properties Borgata PropCo 1,175 NA 11.8x Deutsche Bank Corporate & Investment Banking (a) Assumes forward and trailing EBITDA equal to starting rent of $377 million. Source: Company filings, press, Wall Street research 26 7/21/15 4/28/16 GLPI Pinnacle PropCo 4,740 NA 12.6x 3/29/16 Pending GLPI Meadows Racetrack and Casino PropCo $327 11.8x NA Mean 193 8.4x 10.5x Median 87 7.5x 8.0x 3/23/11 5/23/11 Landry's Inc. Trump Marina Hotel Casino 38 NA NA 9/29/11 4/26/12 Monarch Casino & Resort Riviera Black Hawk 76 7.4x 7.2x 11/10/11 11/10/11 M1 Gaming Boomtown Hotel and Casino 13 NA 25.8x 2/9/12 2/9/12 Bossier Casino Venture LLC Grand Palais Riverboat 15 NA NA 3/14/12 7/16/12 Ameristar Casinos Creative Casinos of Louisiana 33 NA NA 5/7/12 11/5/12 Penn National Gaming, Inc. Harrah's St. Louis 610 7.8x 7.7x 10/5/12 10/23/12 Churchill Downs Incorporated Riverwalk Casino and Hotel 141 7.4x NA 12/27/12 12/27/12 Employee Stock Ownership Plan Casino Queen Inc 170 NA NA 1/16/13 4/15/13 Athens Acquisition LLC Greektown Superholdings Inc NA NA NA 2/28/13 6/3/13 Dania Entertainment Center LLC Dania Jai-Alai NA NA NA 5/1/13 Terminated M1 Gaming River Palms Resort and Casino 7 NA NA 6/21/13 6/21/13 Investor Group Semiahmoo Resort 20 NA NA 9/9/13 1/23/14 Gaming and Leisure Properties, Inc. Casino Queen Inc 140 4.8x NA 5/14/14 12/16/15 Gaming and Leisure Properties, Inc. The Meadows Racetrack and Casino 440 9.6x NA 7/1/14 7/1/14 Nevada Resturant Services, Inc River Palms Resort and Casino 7 NA NA 2/17/15 2/17/15 Las Vegas Convention and Visitors Authority Riviera Hotel & Casino 183 NA NA 7/8/15 11/24/15 Eldorado Resorts 50% interest in Silver Legacy Resort Casino and Circus Circus Reno 211 7.5x 7.3x 10/7/15 Pending Stockbridge Capital Partners 10% of SLS Las Vegas NA NA NA
Deutsche Bank Corporate & Investment Banking Appendix III Trading comparables
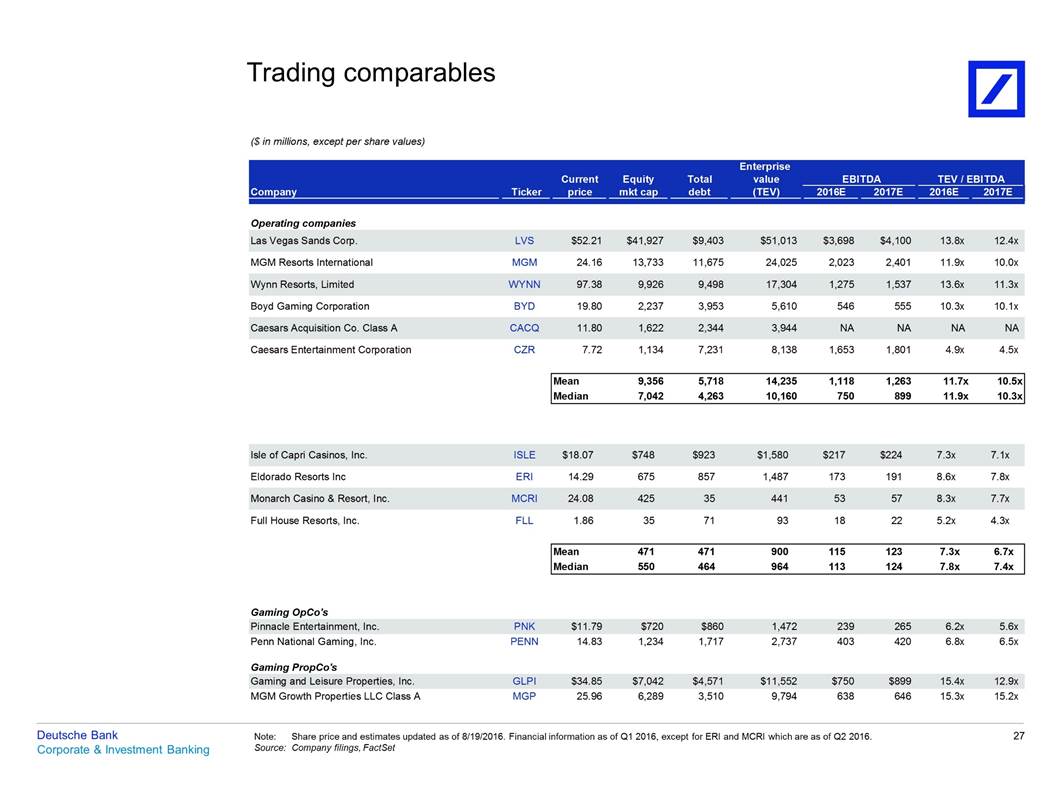
Trading comparables ($ in millions, except per share values) Operating companies MGM Resorts International MGM 24.16 13,733 11,675 24,025 2,023 2,401 11.9x 10.0x Boyd Gaming Corporation BYD 19.80 2,237 3,953 5,610 546 555 10.3x 10.1x Caesars Entertainment Corporation CZR 7.72 1,134 7,231 8,138 1,653 1,801 4.9x 4.5x Eldorado Resorts Inc ERI 14.29 675 857 1,487 173 191 8.6x 7.8x Full House Resorts, Inc. FLL 1.86 35 71 93 18 22 5.2x 4.3x Gaming OpCo's Penn National Gaming, Inc. PENN 14.83 1,234 1,717 2,737 403 420 6.8x 6.5x Gaming PropCo's MGM Growth Properties LLC Class A MGP 25.96 6,289 3,510 9,794 638 646 15.3x 15.2x Deutsche Bank Corporate & Investment Banking 27 Note:Share price and estimates updated as of 8/19/2016. Financial information as of Q1 2016, except for ERI and MCRI which are as of Q2 2016. Source: Company filings, FactSet Gaming and Leisure Properties, Inc. GLPI $34.85 $7,042 $4,571 $11,552 $750 $899 15.4x 12.9x Pinnacle Entertainment, Inc. PNK $11.79 $720 $860 1,472 239 265 6.2x 5.6x Mean 471 471 900 115 123 7.3x 6.7x Median 550 464 964 113 124 7.8x 7.4x Monarch Casino & Resort, Inc. MCRI 24.08 425 35 441 53 57 8.3x 7.7x Isle of Capri Casinos, Inc. ISLE $18.07 $748 $923 $1,580 $217 $224 7.3x 7.1x Mean 9,356 5,718 14,235 1,118 1,263 11.7x 10.5x Median 7,042 4,263 10,160 750 899 11.9x 10.3x Caesars Acquisition Co. Class A CACQ 11.80 1,622 2,344 3,944 NA NA NA NA Wynn Resorts, Limited WYNN 97.38 9,926 9,498 17,304 1,275 1,537 13.6x 11.3x Las Vegas Sands Corp. LVS $52.21 $41,927 $9,403 $51,013 $3,698 $4,100 13.8x 12.4x Enterprise Current Equity Total value Company Ticker price mkt cap debt (TEV) EBITDA TEV / EBITDA 2016E 2017E 2016E 2017E
Trading comparables ($ in millions, except per share values) Operating companies MGM Resorts International MGM 24.16 13,733 11,675 24,025 2,023 2,401 11.9x 10.0x Boyd Gaming Corporation BYD 19.80 2,237 3,953 5,610 546 555 10.3x 10.1x Caesars Entertainment Corporation CZR 7.72 1,134 7,231 8,138 1,653 1,801 4.9x 4.5x Eldorado Resorts Inc ERI 14.29 675 857 1,487 173 191 8.6x 7.8x Full House Resorts, Inc. FLL 1.86 35 71 93 18 22 5.2x 4.3x Gaming OpCo's Penn National Gaming, Inc. PENN 14.83 1,234 1,717 2,737 403 420 6.8x 6.5x Gaming PropCo's MGM Growth Properties LLC Class A MGP 25.96 6,289 3,510 9,794 638 646 15.3x 15.2x Deutsche Bank Corporate & Investment Banking 27 Note:Share price and estimates updated as of 8/19/2016. Financial information as of Q1 2016, except for ERI and MCRI which are as of Q2 2016. Source: Company filings, FactSet Gaming and Leisure Properties, Inc. GLPI $34.85 $7,042 $4,571 $11,552 $750 $899 15.4x 12.9x Pinnacle Entertainment, Inc. PNK $11.79 $720 $860 1,472 239 265 6.2x 5.6x Mean 471 471 900 115 123 7.3x 6.7x Median 550 464 964 113 124 7.8x 7.4x Monarch Casino & Resort, Inc. MCRI 24.08 425 35 441 53 57 8.3x 7.7x Isle of Capri Casinos, Inc. ISLE $18.07 $748 $923 $1,580 $217 $224 7.3x 7.1x Mean 9,356 5,718 14,235 1,118 1,263 11.7x 10.5x Median 7,042 4,263 10,160 750 899 11.9x 10.3x Caesars Acquisition Co. Class A CACQ 11.80 1,622 2,344 3,944 NA NA NA NA Wynn Resorts, Limited WYNN 97.38 9,926 9,498 17,304 1,275 1,537 13.6x 11.3x Las Vegas Sands Corp. LVS $52.21 $41,927 $9,403 $51,013 $3,698 $4,100 13.8x 12.4x Enterprise Current Equity Total value Company Ticker price mkt cap debt (TEV) EBITDA TEV / EBITDA 2016E 2017E 2016E 2017E
