Exhibit (c)(2)
Exhibit (c)(2)
PROJECT SIGMA
Presentation to the Independent Committee of ShangPharma Corporation
December 21, 2012
STRICTLY PRIVATE AND CONFIDENTIAL
This presentation was prepared exclusively for the benefit and internal use of the J.P. Morgan client to whom it is directly addressed and delivered (including such client’s subsidiaries, the “Company”) in order to assist the Company in evaluating, on a preliminary basis, the feasibility of a possible transaction or transactions and does not carry any right of publication or disclosure, in whole or in part, to any other party. This presentation is for discussion purposes only and is incomplete without reference to, and should be viewed solely in conjunction with, the oral briefing provided by J.P. Morgan. Neither this presentation nor any of its contents may be disclosed or used for any other purpose without the prior written consent of J.P. Morgan.
The information in this presentation is based upon any management forecasts supplied to us and reflects prevailing conditions and our views as of this date, all of which are accordingly subject to change. J.P. Morgan’s opinions and estimates constitute J.P. Morgan’s judgment and should be regarded as indicative, preliminary and for illustrative purposes only. In preparing this presentation, we have relied upon and assumed, without independent verification, the accuracy and completeness of all information available from public sources or which was provided to us by or on behalf of the Company or which was otherwise reviewed by us. In addition, our analyses are not and do not purport to be appraisals of the assets, stock, or business of the Company or any other entity. In relying on financial analyses and forecasts provided to J.P. Morgan or derived therefrom, J.P. Morgan has assumed that they have been reasonably prepared based on assumptions reflecting the best currently available estimates and judgments by management as to the expected future results of operations and financial condition of the Company to which such analyses or forecasts related. J.P. Morgan expresses no view as to such analyses or forecasts, the assumptions on which they were based or the likelihood that any forecasts, projections or estimates will be achieved. J.P. Morgan makes no representations as to the actual value which may be received in connection with a transaction nor the legal, tax or accounting effects of consummating a transaction. Unless expressly contemplated hereby, the information in this presentation does not take into account the effects of a possible transaction or transactions involving an actual or potential change of control, which may have significant valuation and other effects.
Notwithstanding anything herein to the contrary, the Company and each of its employees, representatives or other agents may disclose to any and all persons, without limitation of any kind, the U.S. federal and state income tax treatment and the U.S. federal and state income tax structure of the transactions contemplated hereby and all materials of any kind (including opinions or other tax analyses) that are provided to the Company relating to such tax treatment and tax structure insofar as such treatment and/or structure relates to a U.S. federal or state income tax strategy provided to the Company by J.P. Morgan.
J.P. Morgan’s policies prohibit employees from offering, directly or indirectly, a favorable research rating or specific price target, or offering to change a rating or price target, to a subject company as consideration or inducement for the receipt of business or for compensation. J.P. Morgan also prohibits its research analysts from being compensated for involvement in investment banking transactions except to the extent that such participation is intended to benefit investors. IRS Circular 230 Disclosure: JPMorgan Chase & Co. and its affiliates do not provide tax advice. Accordingly, any discussion of U.S. tax matters included herein (including any attachments) is not intended or written to be used, and cannot be used, in connection with the promotion, marketing or recommendation by anyone not affiliated with JPMorgan Chase & Co. of any of the matters addressed herein or for the purpose of avoiding U.S. tax-related penalties.
J.P. Morgan is a marketing name for investment banking businesses of JPMorgan Chase & Co. and its subsidiaries worldwide. Securities, syndicated loan arranging, financial advisory and other investment banking activities are performed by a combination J.P. Morgan Securities LLC, J.P. Morgan Limited, J.P. Morgan Securities plc and the appropriately licensed subsidiaries of JPMorgan Chase & Co. in Asia-Pacific, and lending, derivatives and other commercial banking activities are performed by JPMorgan Chase Bank, N.A. J.P. Morgan deal team members may be employees of any of the foregoing entities. This presentation does not constitute a commitment by any J.P. Morgan entity to underwrite, subscribe for or place any securities or to extend or arrange credit or to provide any other services.
SHANGPHARMA
PROJECT SIGMA
Agenda
Page
Situation overview 1
ShangPharma trading and valuation analysis 5
Appendix 13
PROJECT SIGMA
SHANGPHARMA
1
Executive summary
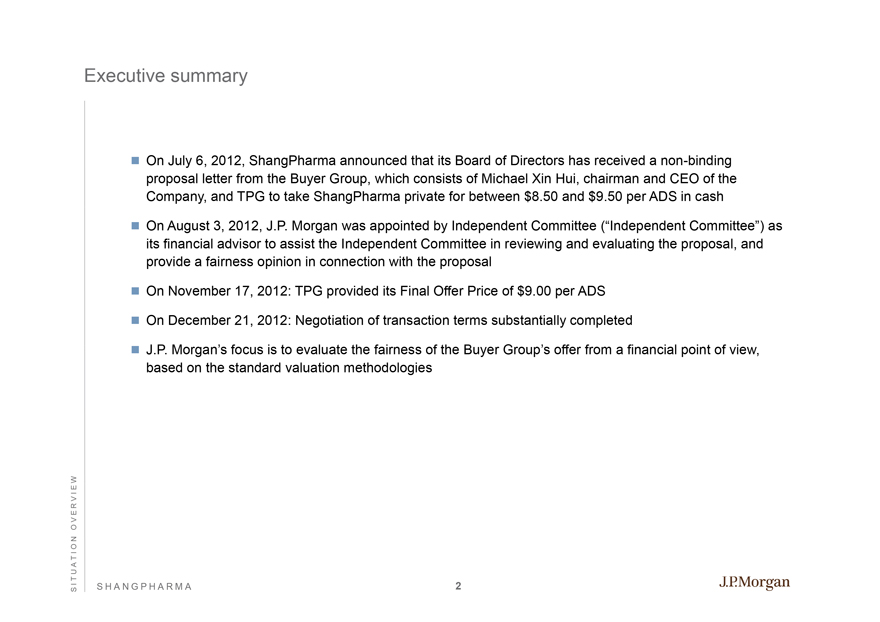
On July 6, 2012, ShangPharma announced that its Board of Directors has received a non-binding proposal letter from the Buyer Group, which consists of Michael Xin Hui, chairman and CEO of the Company, and TPG to take ShangPharma private for between $8.50 and $9.50 per ADS in cash
On August 3, 2012, J.P. Morgan was appointed by Independent Committee (“Independent Committee”) as its financial advisor to assist the Independent Committee in reviewing and evaluating the proposal, and provide a fairness opinion in connection with the proposal
On November 17, 2012: TPG provided its Final Offer Price of $9.00 per ADS
On December 21, 2012: Negotiation of transaction terms substantially completed
J.P. Morgan’s focus is to evaluate the fairness of the Buyer Group’s offer from a financial point of view, based on the standard valuation methodologies
SHANGPHARMA
SITUATION OVERVIEW
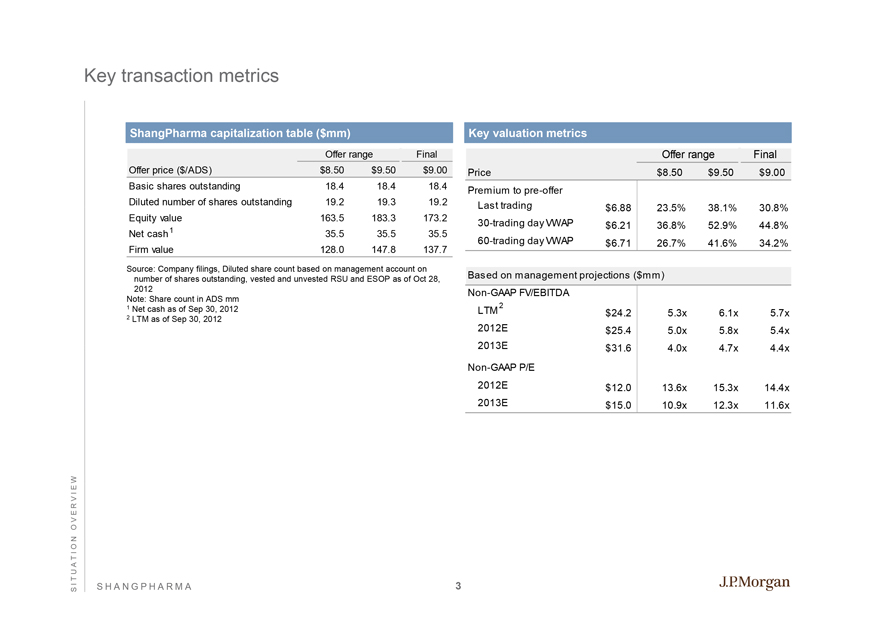
Key transaction metrics
ShangPharma capitalization table ($mm)
Offer range Final
Offer price ($/ADS) $8.50 $9.50 $9.00
Basic shares outstanding 18.4 18.4 18.4
Diluted number of shares outstanding 19.2 19.3 19.2
Equity value 163.5 183.3 173.2
Net cash 1 35.5 35.5 35.5
Firm value 128.0 147.8 137.7
Source: Company filings, Diluted share count based on management account on number of shares outstanding, vested and unvested RSU and ESOP as of Oct 28, 2012 Note: Share count in ADS mm
1 | | Net cash as of Sep 30, 2012 |
Key valuation metrics
Offer range Final
Price $8.50 $9.50 $9.00
Premium to pre-offer
Last trading $ 6.88 23.5% 38.1% 30.8%
30-trading day VWAP $ 6.21 36.8% 52.9% 44.8%
60-trading day VWAP $ 6.71 26.7% 41.6% 34.2%
Based on management projections ($ mm)
Non-GAAP FV/EBITDA
LTM 2 $ 24.2 5.3x 6.1x 5.7x
2012E $ 25.4 5.0x 5.8x 5.4x
2013E $ 31.6 4.0x 4.7x 4.4x
Non-GAAP P/E
2012E $ 12.0 13.6x 15.3x 14.4x
2013E $ 15.0 10.9x 12.3x 11.6x
SHANGPHARMA
SITUATION OVERVIEW
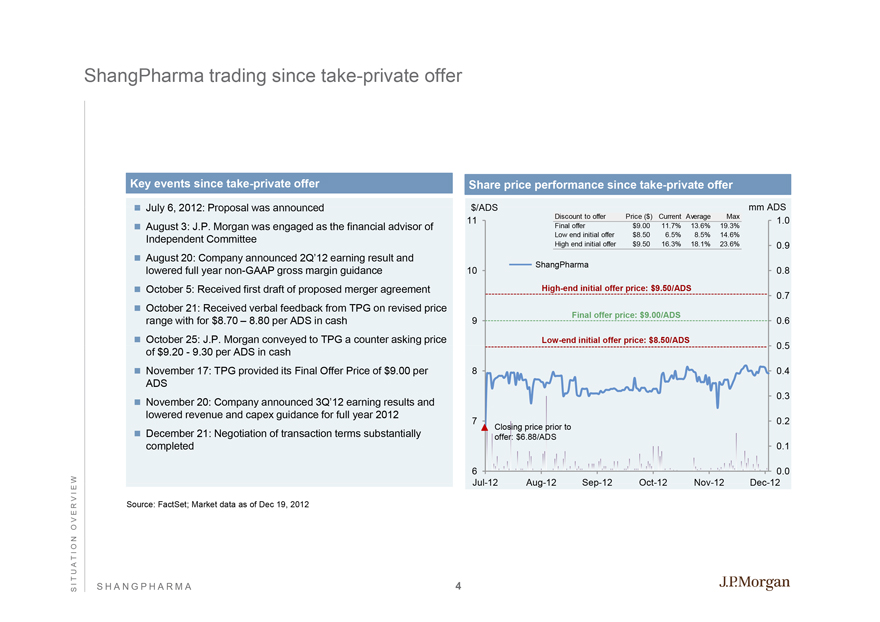
ShangPharma trading since take-private offer
Key events since take-private offer
July 6, 2012: Proposal was announced
August 3: J.P. Morgan was engaged as the financial advisor of Independent Committee
August 20: Company announced 2Q’12 earning result and lowered full year non-GAAP gross margin guidance
October 5: Received first draft of proposed merger agreement
October 21: Received verbal feedback from TPG on revised price range with for $8.70 – 8.80 per ADS in cash October 25: J.P. Morgan conveyed to TPG a counter asking price of $9.20—9.30 per ADS in cash
November 17: TPG provided its Final Offer Price of $9.00 per ADS
November 20: Company announced 3Q’12 earning results and lowered revenue and capex guidance for full year 2012
December 21: Negotiation of transaction terms substantially completed
Share price performance since take-private offer
Discount to offer Price ($) Current Average Max
Final offer $9.00 11.7% 13.6% 19.3%
Low end initial offer $8.50 6.5% 8.5% 14.6%
High end initial offer $9.50 16.3% 18.1% 23.6%
ShangPharma
High-end initial offer price: $9.50/ADS
Final offer price: $9.00/ADS
Low-end initial offer price: $8.50/ADS
Closing price prior to offer: $6.88/ADS
11 10 9 8 7 6
$/ADS
mm ADS
1.0 0.9 0.8 0.7 0.6 0.5 0.4 0.3 0.2 0.1 0.0
Jul-12 Aug-12 Sep-12 Oct-12 Nov-12 Dec-12
Source: FactSet; Market data as of Dec 19, 2012
SHANGPHARMA
SITUATION OVERVIEW
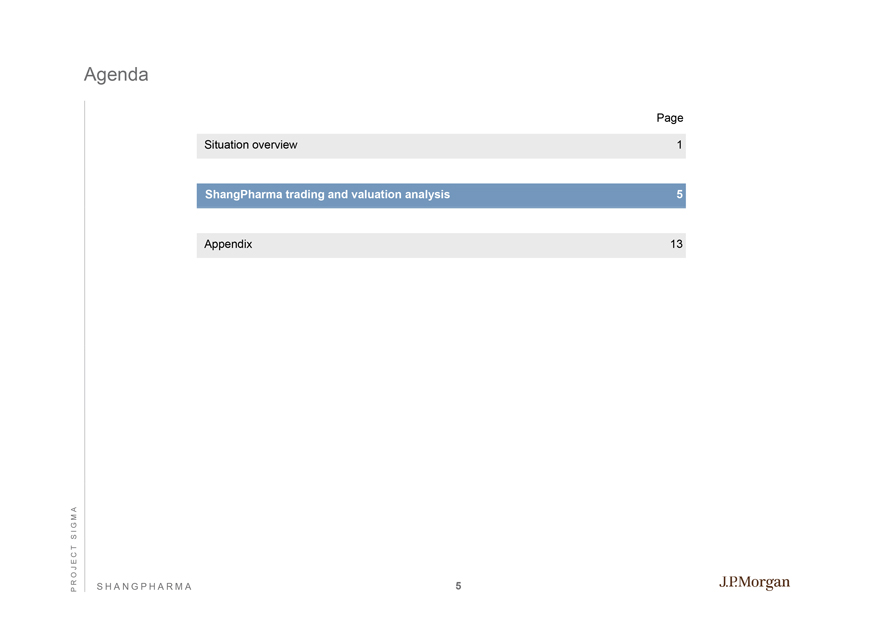
Agenda
Page
Situation overview 1
ShangPharma trading and valuation analysis 5
Appendix 13
PR O J E C TS I G M A
S H ANGPHARMA
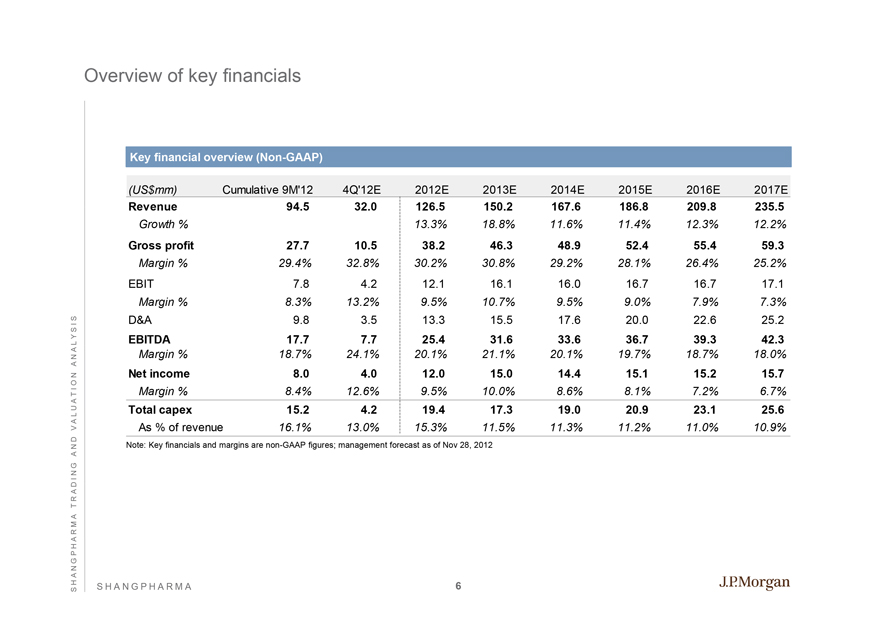
Overview of key financials
Key financial overview (Non-GAAP)
(US$mm) Cumulative 9M’12 4Q’12E 2012E 2013E 2014E 2015E 2016E 2017E
Revenue 94.5 32.0 126.5 150.2 167.6 186.8 209.8 235.5
Growth % 13.3% 18.8% 11.6% 11.4% 12.3% 12.2%
Gross profit 27.7 10.5 38.2 46.3 48.9 52.4 55.4 59.3
Margin % 29.4% 32.8% 30.2% 30.8% 29.2% 28.1% 26.4% 25.2%
EBIT 7.8 4.2 12.1 16.1 16.0 16.7 16.7 17.1
Margin % 8.3% 13.2% 9.5% 10.7% 9.5% 9.0% 7.9% 7.3%
D&A 9.8 3.5 13.3 15.5 17.6 20.0 22.6 25.2
EBITDA 17.7 7.7 25.4 31.6 33.6 36.7 39.3 42.3
Margin % 18.7% 24.1% 20.1% 21.1% 20.1% 19.7% 18.7% 18.0%
Net income 8.0 4.0 12.0 15.0 14.4 15.1 15.2 15.7
Margin % 8.4% 12.6% 9.5% 10.0% 8.6% 8.1% 7.2% 6.7%
Total capex 15.2 4.2 19.4 17.3 19.0 20.9 23.1 25.6
As % of revenue 16.1% 13.0% 15.3% 11.5% 11.3% 11.2% 11.0% 10.9%
Note: Key financials and margins are non-GAAP figures; management forecast as of Nov 28, 2012
SHANGPHARMA
SHANGPHARMA TRADING AND VALUATION ANALYSIS
Valuation analysis
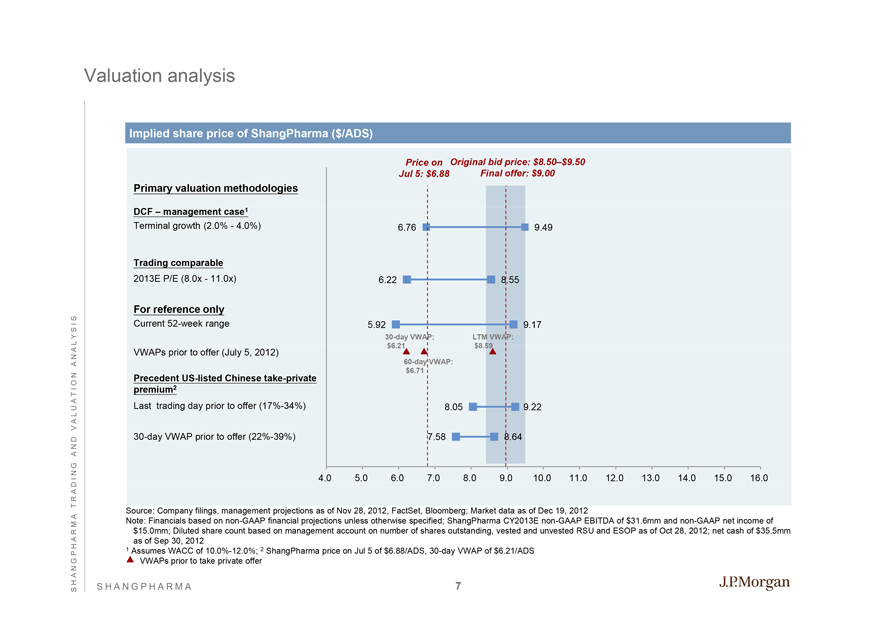
Implied share price of ShangPharma ($/ADS)
Primary valuation methodologies
DCF – management case1
Terminal growth (2.0%—4.0%)
Trading comparable
2013E P/E (8.0x—11.0x)
For reference only
Current 52-week range
VWAPs prior to offer (July 5, 2012)
Precedent US-listed Chinese take-private premium2
Last trading day prior to offer (17%-34%)
30-day VWAP prior to offer (22%-39%)
Price on Original bid price: $8.50–$9.50 Jul 5: $6.88 Final offer: $9.00
6.76
9.49
6.22
8.55
5.92
9.17
30-day VWAP: $6.21
LTM VWAP: $8.59
60-day VWAP: $6.71
8.05
9.22
7.58
8.64
4.0 5.0 6.0 7.0 8.0 9.0 10.0 11.0 12.0 13.0 14.0 15.0 16.0
Source: Company filings, management projections as of Nov 28, 2012, FactSet, Bloomberg; Market data as of Dec 19, 2012
Note: Financials based on non-GAAP financial projections unless otherwise specified; ShangPharma CY2013E non-GAAP EBITDA of $31.6mm and non-GAAP net income of $15.0mm; Diluted share count based on management account on number of shares outstanding, vested and unvested RSU and ESOP as of Oct 28, 2012; net cash of $35.5mm as of Sep 30, 2012
1 | | Assumes WACC of 10.0%-12.0%; 2 ShangPharma price on Jul 5 of $6.88/ADS, 30-day VWAP of $6.21/ADS |
VWAPs prior to take private offer
SHANGPHARMA
SHANGPHARMA TRADING AND VALUATION ANALYSIS
DCF analysis
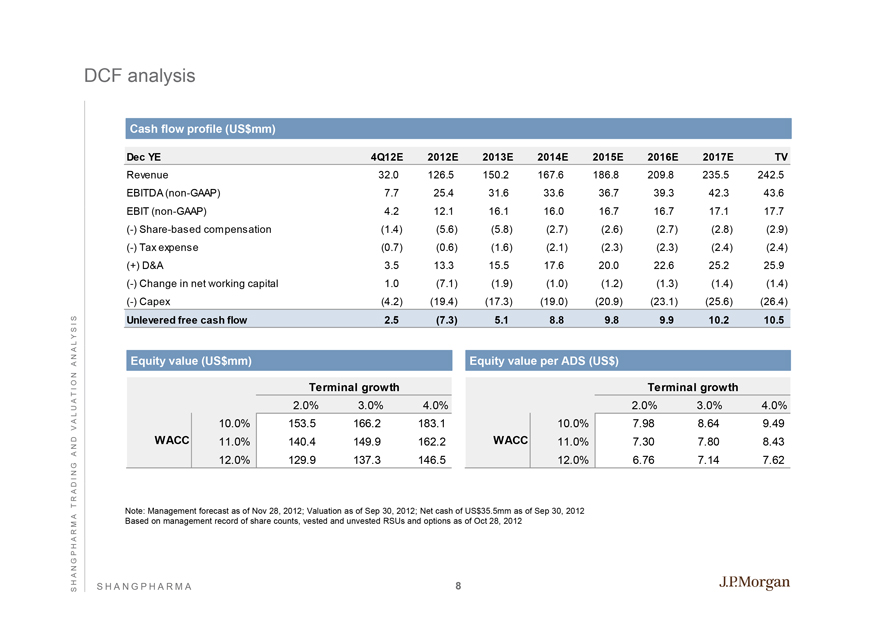
Cash flow profile (US$mm)
Dec YE 4Q12E 2012E 2013E 2014E 2015E 2016E 2017E TV
Revenue 32.0 126.5 150.2 167.6 186.8 209.8 235.5 242.5
EBITDA (non-GAAP) 7.7 25.4 31.6 33.6 36.7 39.3 42.3 43.6
EBIT (non-GAAP) 4.2 12.1 16.1 16.0 16.7 16.7 17.1 17.7
(-) Share-based compensation (1.4) (5.6) (5.8) (2.7) (2.6) (2.7) (2.8) (2.9)
(-) Tax expense (0.7) (0.6) (1.6) (2.1) (2.3) (2.3) (2.4) (2.4)
(+) D&A 3.5 13.3 15.5 17.6 20.0 22.6 25.2 25.9
(-) Change in net working capital 1.0 (7.1) (1.9) (1.0) (1.2) (1.3) (1.4) (1.4)
(-) Capex (4.2) (19.4) (17.3) (19.0) (20.9) (23.1) (25.6) (26.4)
Unlevered free cash flow 2.5 (7.3) 5.1 8.8 9.8 9.9 10.2 10.5
Equity value (US$mm) Equity value per ADS (US$)
Terminal growth Terminal growth
2.0% 3.0% 4.0% 2.0% 3.0% 4.0%
10.0% 153.5 166.2 183.1 10.0% 7.98 8.64 9.49
WACC 11.0% 140.4 149.9 162.2 WACC 11.0% 7.30 7.80 8.43
12.0% 129.9 137.3 146.5 12.0% 6.76 7.14 7.62
Note: Management forecast as of Nov 28, 2012; Valuation as of Sep 30, 2012; Net cash of US$35.5mm as of Sep 30, 2012 Based on management record of share counts, vested and unvested RSUs and options as of Oct 28, 2012
SHANGPHARMA
SHANGPHARMA TRADING AND VALUATION ANALYSIS
ShangPharma discount rate analysis
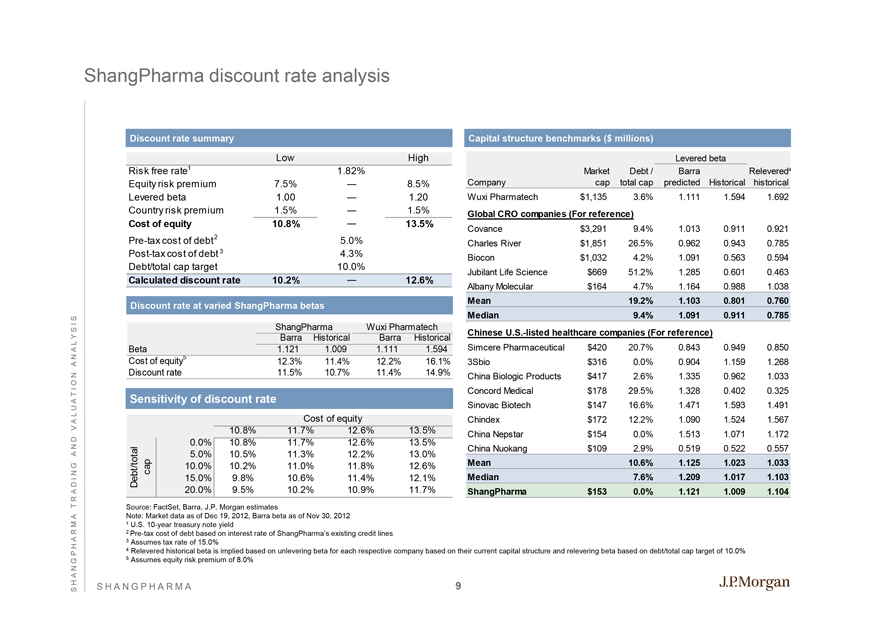
Discount rate summary
Low High
Risk free rate1 1.82%
Equity risk premium 7.5% — 8.5%
Levered beta 1.00 — 1.20
Country risk premium 1.5% — 1.5%
Cost of equity 10.8% — 13.5%
Pre-tax cost of debt2 5.0%
Post-tax cost of debt 3 4.3%
Debt/total cap target 10.0%
Calculated discount rate 10.2% — 12.6%
Discount rate at varied ShangPharma betas
ShangPharma Wuxi Pharmatech
Barra Historical Barra Historical
Beta 1.121 1.009 1.111 1.594
Cost of equity5 12.3% 11.4% 12.2% 16.1%
Discount rate 11.5% 10.7% 11.4% 14.9%
Sensitivity of discount rate
Cost of equity
10.8% 11.7% 12.6% 13.5%
0.0% 10.8% 11.7% 12.6% 13.5%
5.0% 10.5% 11.3% 12.2% 13.0%
cap 10.0% 10.2% 11.0% 11.8% 12.6%
Debt/total 15.0% 9.8% 10.6% 11.4% 12.1%
20.0% 9.5% 10.2% 10.9% 11.7%
Capital structure benchmarks ($ millions)
Levered beta
Market Debt / Barra Relevered4
Company cap total cap predicted Historical historical
Wuxi Pharmatech $1,135 3.6% 1.111 1.594 1.692
Global CRO companies (For reference)
Covance $3,291 9.4% 1.013 0.911 0.921
Charles River $1,851 26.5% 0.962 0.943 0.785
Biocon $1,032 4.2% 1.091 0.563 0.594
Jubilant Life Science $669 51.2% 1.285 0.601 0.463
Albany Molecular $164 4.7% 1.164 0.988 1.038
Mean 19.2% 1.103 0.801 0.760
Median 9.4% 1.091 0.911 0.785
Chinese U.S.-listed healthcare companies (For reference)
Simcere Pharmaceutical $420 20.7% 0.843 0.949 0.850
3Sbio $316 0.0% 0.904 1.159 1.268
China Biologic Products $417 2.6% 1.335 0.962 1.033
Concord Medical $178 29.5% 1.328 0.402 0.325
Sinovac Biotech $147 16.6% 1.471 1.593 1.491
Chindex $172 12.2% 1.090 1.524 1.567
China Nepstar $154 0.0% 1.513 1.071 1.172
China Nuokang $109 2.9% 0.519 0.522 0.557
Mean 10.6% 1.125 1.023 1.033
Median 7.6% 1.209 1.017 1.103
ShangPharma $153 0.0% 1.121 1.009 1.104
Source: FactSet, Barra, J.P. Morgan estimates
Note: Market data as of Dec 19, 2012, Barra beta as of Nov 30, 2012
1 U.S. 10-year treasury note yield
2 Pre-tax cost of debt based on interest rate of ShangPharma’s existing credit lines
3 Assumes tax rate of 15.0%
4 Relevered historical beta is implied based on unlevering beta for each respective company based on their current capital structure and relevering beta based on debt/total cap target of 10.0%
5 Assumes equity risk premium of 8.0%
S H ANGPHARMA
S H A N G P H A R M A T R A D IN G A N D V A L UA T I O N AN A LY SI S
9
Trading comparables
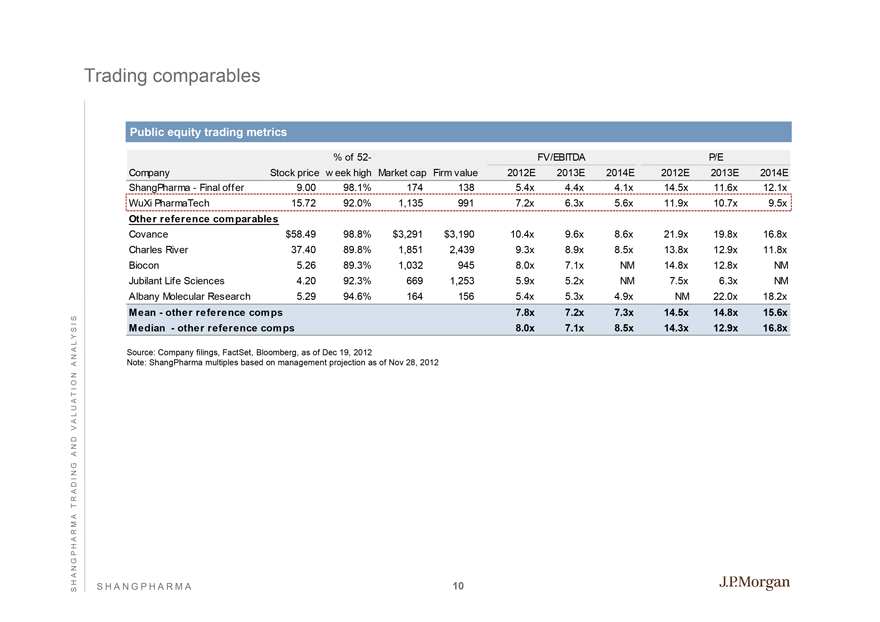
Public equity trading metrics
% of 52- FV/EBITDA P/E
Company Stock price w eek high Market cap Firm value 2012E 2013E 2014E 2012E 2013E 2014E
ShangPharma—Final offer 9.00 98.1% 174 138 5.4x 4.4x 4.1x 14.5x 11.6x 12.1x
WuXi PharmaTech 15.72 92.0% 1,135 991 7.2x 6.3x 5.6x 11.9x 10.7x 9.5x
Other reference comparables
Covance $58.49 98.8% $3,291 $3,190 10.4x 9.6x 8.6x 21.9x 19.8x 16.8x
Charles River 37.40 89.8% 1,851 2,439 9.3x 8.9x 8.5x 13.8x 12.9x 11.8x
Biocon 5.26 89.3% 1,032 945 8.0x 7.1x NM 14.8x 12.8x NM
Jubilant Life Sciences 4.20 92.3% 669 1,253 5.9x 5.2x NM 7.5x 6.3x NM
Albany Molecular Research 5.29 94.6% 164 156 5.4x 5.3x 4.9x NM 22.0x 18.2x
Mean—other reference comps 7.8x 7.2x 7.3x 14.5x 14.8x 15.6x
Median—other reference comps 8.0x 7.1x 8.5x 14.3x 12.9x 16.8x
Source: Company filings, FactSet, Bloomberg, as of Dec 19, 2012
Note: ShangPharma multiples based on management projection as of Nov 28, 2012
S H ANGPHARMA
SH A N G P HA RM A T R A D IN G A N D V A L UA T I O N AN A LY SI S
10
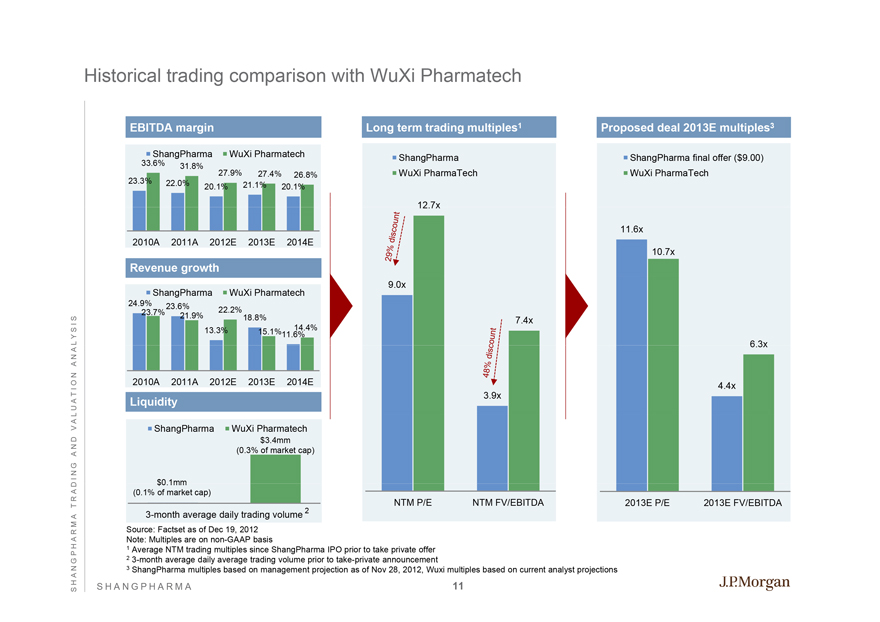
Historical trading comparison with WuXi Pharmatech
EBITDA margin
ShangPharma WuXi Pharmatech
33.6% 31.8%
23.3% 27.9% 27.4% 26.8% 22.0% 20.1% 21.1% 20.1%
2010A 2011A 2012E 2013E 2014E
Revenue growth
ShangPharma WuXi Pharmatech
24.9% 23.6%
23.7% 22.2% 21.9% 18.8%
13.3% 14.4% 15.1%11.6%
2010A 2011A 2012E 2013E 2014E
Liquidity
ShangPharma WuXi Pharmatech $3.4mm (0.3% of market cap)
$0.1mm (0.1% of market cap)
3-month average daily trading volume 2
Long term trading multiples1
ShangPharma WuXi PharmaTech
12.7x
29% discount
9.0x
48% discount
3.9x
7.4x
NTM P/E NTM FV/EBITDA
Proposed deal 2013E multiples3
ShangPharma final offer ($9.00) WuXi PharmaTech
11.6x
10.7x
6.3x
4.4x
2013E P/E 2013E FV/EBITDA
Source: Factset as of Dec 19, 2012 Note: Multiples are on non-GAAP basis
1 | | Average NTM trading multiples since ShangPharma IPO prior to take private offer |
2 | | 3-month average daily average trading volume prior to take-private announcement |
3 ShangPharma multiples based on management projection as of Nov 28, 2012, Wuxi multiples based on current analyst projections
S H A N G P H A R M A
SH A N G P HA RM A T R A D IN G A N D V A L UA T I O N AN A LY SI S
11
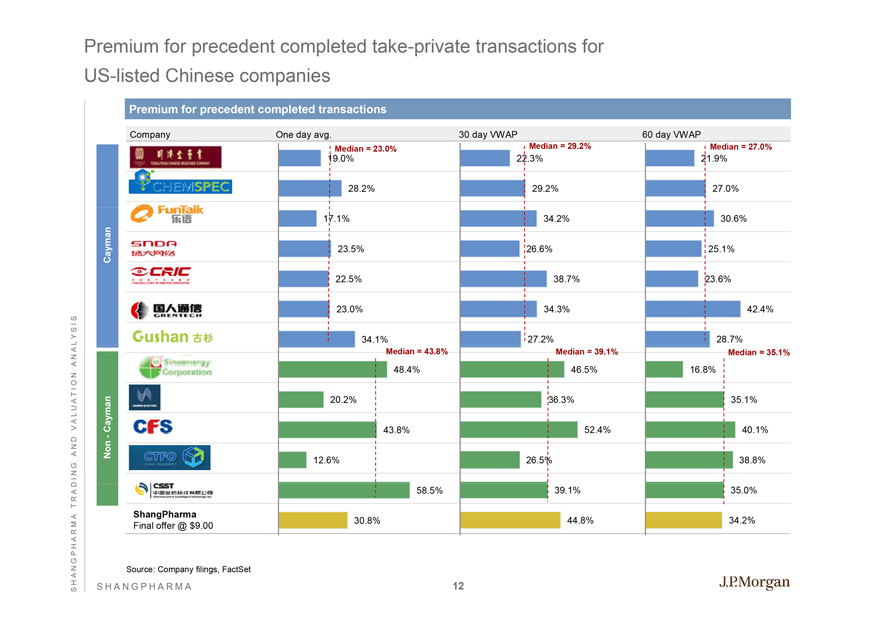
Premium for precedent completed take-private transactions for US-listed Chinese companies
Premium for precedent completed transactions
Company One day avg. 30 day VWAP 60 day VWAP
Median = 23.0% Median = 29.2% Median = 27.0%
19.0% 22.3% 21.9%
28.2% 29.2% 27.0%
17.1% 34.2% 30.6%
23.5% 26.6% 25.1%
Cayman
22.5% 38.7% 23.6%
23.0% 34.3% 42.4%
34.1% 27.2% 28.7%
Median = 43.8% Median = 39.1% Median = 35.1%
48.4% 46.5% 16.8%
20.2% 36.3% 35.1%
Non-Cayman 43.8% 52.4% 40.1%-
12.6% 26.5% 38.8%
58.5% 39.1% 35.0%
ShangPharma
30.8% 44.8% 34.2% Final offer @ $9.00
Source: Company filings, FactSet
S H A N G P H A R M A
SH A N G P HA RM A T R A D IN G A N D V A L UA T I O N AN A LY SI S
12
Agenda
Page
Situation overview 1
ShangPharma trading and valuation analysis 5
Appendix 13
PR O J E C TS I G M A
S H ANGPHARMA
13
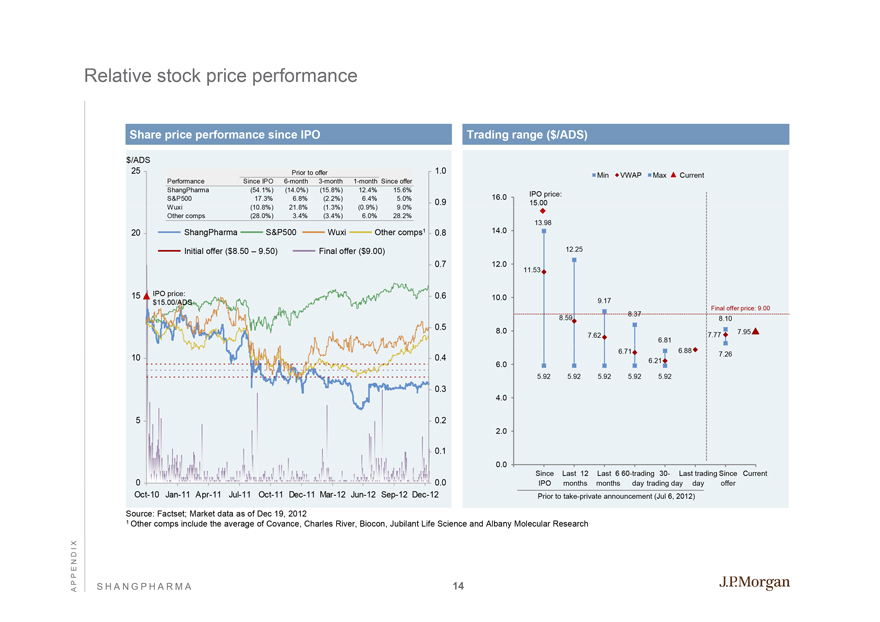
Relative stock price performance
Share price performance since IPO
$/ADS
25 Prior to offer 1.0 Performance Since IPO 6-month 3-month 1-month Since offer ShangPharma (54.1%) (14.0%) (15.8%) 12.4% 15.6% S&P500 17.3% 6.8% (2.2%) 6.4% 5.0% Wuxi (10.8%) 21.8% (1.3%) (0.9%) 9.0% Other comps (28.0%) 3.4% (3.4%) 6.0% 28.2%
20 ShangPharma S&P500 Wuxi Other comps1 0.8
Initial offer ($8.50 – 9.50) Final offer ($9.00)
0.7
15 IPO price: 0.6
$15.00/ADS
0.5
10 0.4
0.3
5 0.2
0.1
0
0.0
Oct-10 Jan-11 Apr-11 Jul-11 Oct-11 Dec-11 Mar-12 Jun-12 Sep-12 Dec-12
Trading range ($/ADS)
Min VWAP Max Current
16.0 IPO price:
15.00
13.98
14.0
12.25
12.0
11.53
10.0 9.17
8.37 Final offer price: 9.00
8.59 8.10
8.0 7.95
7.62 7.77
6.81
6.71 6.88
6.21 7.26
6.0
5.92 5.92 5.92 5.92 5.92
4.0
2.0
0.0
Since Last 12 Last 6 60-trading 30- Last trading Since Current IPO months months day trading day day offer Prior to take-private announcement (Jul 6, 2012)
Source: Factset; Market data as of Dec 19, 2012
1 Other comps include the average of Covance, Charles River, Biocon, Jubilant Life Science and Albany Molecular Research
AP P E N D IX
S H ANGPHARMA
14


