Exhibit (c)(3)

Exhibit (c)(3)
S I G M A—P R E S E N T A T I O N T O S P E C I A L C O M M I T T E E
September 6, 2012
S T R I C T L Y P R I V A T E A N D C O N F I D E N T I A L
J.P.Morgan
This presentation was prepared exclusively for the benefit and internal use of the J.P. Morgan client to whom it is directly addressed and delivered (including such client’s subsidiaries, the “Company”) in order to assist the Company in evaluating, on a preliminary basis, the feasibility of a possible transaction or transactions and does not carry any right of publication or disclosure, in whole or in part, to any other party. This presentation is for discussion purposes only and is incomplete without reference to, and should be viewed solely in conjunction with, the oral briefing provided by J.P. Morgan. Neither this presentation nor any of its contents may be disclosed or used for any other purpose without the prior written consent of J.P. Morgan.
The information in this presentation is based upon any management forecasts supplied to us and reflects prevailing conditions and our views as of this date, all of which are accordingly subject to change. J.P. Morgan’s opinions and estimates constitute J.P. Morgan’s judgment and should be regarded as indicative, preliminary and for illustrative purposes only. In preparing this presentation, we have relied upon and assumed, without independent verification, the accuracy and completeness of all information available from public sources or which was provided to us by or on behalf of the Company or which was otherwise reviewed by us. In addition, our analyses are not and do not purport to be appraisals of the assets, stock, or business of the Company or any other entity. In relying on financial analyses and forecasts provided to J.P. Morgan or derived therefrom, J.P. Morgan has assumed that they have been reasonably prepared based on assumptions reflecting the best currently available estimates and judgments by management as to the expected future results of operations and financial condition of the Company to which such analyses or forecasts related. J.P. Morgan expresses no view as to such analyses or forecasts, the assumptions on which they were based or the likelihood that any forecasts, projections or estimates will be achieved. J.P. Morgan makes no representations as to the actual value which may be received in connection with a transaction nor the legal, tax or accounting effects of consummating a transaction. Unless expressly contemplated hereby, the information in this presentation does not take into account the effects of a possible transaction or transactions involving an actual or potential change of control, which may have significant valuation and other effects.
Notwithstanding anything herein to the contrary, the Company and each of its employees, representatives or other agents may disclose to any and all persons, without limitation of any kind, the U.S. federal and state income tax treatment and the U.S. federal and state income tax structure of the transactions contemplated hereby and all materials of any kind (including opinions or other tax analyses) that are provided to the Company relating to such tax treatment and tax structure insofar as such treatment and/or structure relates to a U.S. federal or state income tax strategy provided to the Company by J.P. Morgan.
J.P. Morgan’s policies prohibit employees from offering, directly or indirectly, a favorable research rating or specific price target, or offering to change a rating or price target, to a subject company as consideration or inducement for the receipt of business or for compensation. J.P. Morgan also prohibits its research analysts from being compensated for involvement in investment banking transactions except to the extent that such participation is intended to benefit investors.
IRS Circular 230 Disclosure: JPMorgan Chase & Co. and its affiliates do not provide tax advice. Accordingly, any discussion of U.S. tax matters included herein (including any attachments) is not intended or written to be used, and cannot be used, in connection with the promotion, marketing or recommendation by anyone not affiliated with JPMorgan Chase & Co. of any of the matters addressed herein or for the purpose of avoiding U.S. tax-related penalties.
J.P. Morgan is a marketing name for investment banking businesses of JPMorgan Chase & Co. and its subsidiaries worldwide. Securities, syndicated loan arranging, financial advisory and other investment banking activities are performed by a combination J.P. Morgan Securities LLC, J.P. Morgan Limited, J.P. Morgan Securities plc and the appropriately licensed subsidiaries of JPMorgan Chase & Co. in Asia-Pacific, and lending, derivatives and other commercial banking activities are performed by JPMorgan Chase Bank, N.A. J.P. Morgan deal team members may be employees of any of the foregoing entities.
This presentation does not constitute a commitment by any J.P. Morgan entity to underwrite, subscribe for or place any securities or to extend or arrange credit or to provide any other services.
S I G M A
S I G M A—P R E S E N T A T I O N T O S P E C I A L C O M M I T T E E
J.P.Morgan
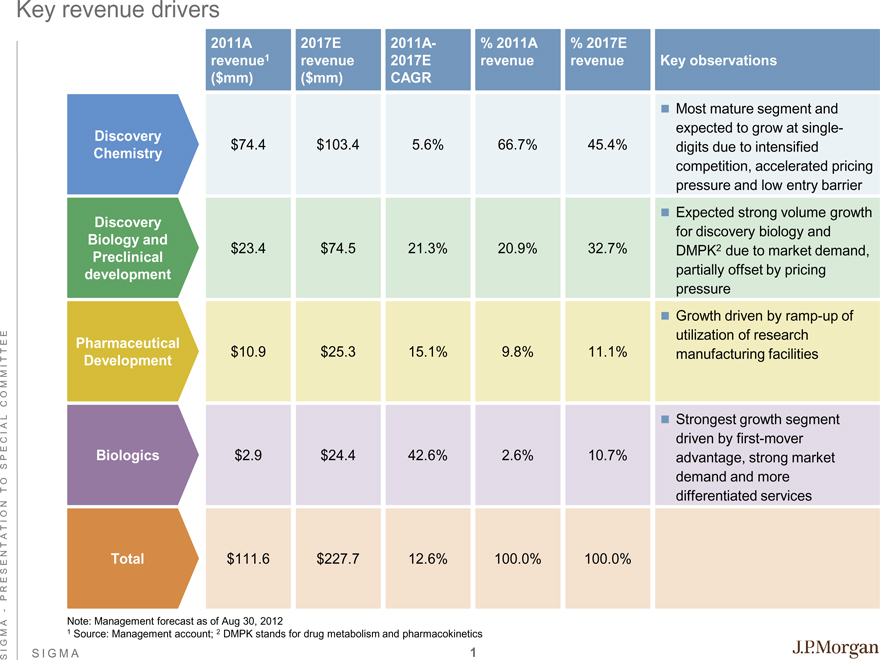
Key revenue drivers
2011A 2017E 2011A- % 2011A % 2017E
revenue1 revenue 2017E revenue revenue Key observations
($mm) ($mm) CAGR
? Most mature segment and
expected to grow at single-
Discovery
Chemistry $74.4 $103.4 5.6% 66.7% 45.4% digits due to intensified
competition, accelerated pricing
pressure and low entry barrier
? Expected strong volume growth
Discovery
for discovery biology and
Biology and
Preclinical $23.4 $74.5 21.3% 20.9% 32.7% DMPK2 due to market demand,
development partially offset by pricing
pressure
? Growth driven by ramp-up of
utilization of research
Pharmaceutical
Development $10.9 $25.3 15.1% 9.8% 11.1% manufacturing facilities
? Strongest growth segment
driven by first-mover
Biologics $2.9 $24.4 42.6% 2.6% 10.7% advantage, strong market
demand and more
differentiated services
Total $111.6 $227.7 12.6% 100.0% 100.0%
Note: Management forecast as of Aug 30, 2012
1 Source: Management account; 2 DMPK stands for drug metabolism and pharmacokinetics
S I G M A
S I G M A—P R E S E N T A T I O N T O S P E C I A L C O M M I T T E E
J.P.Morgan
1 |
|
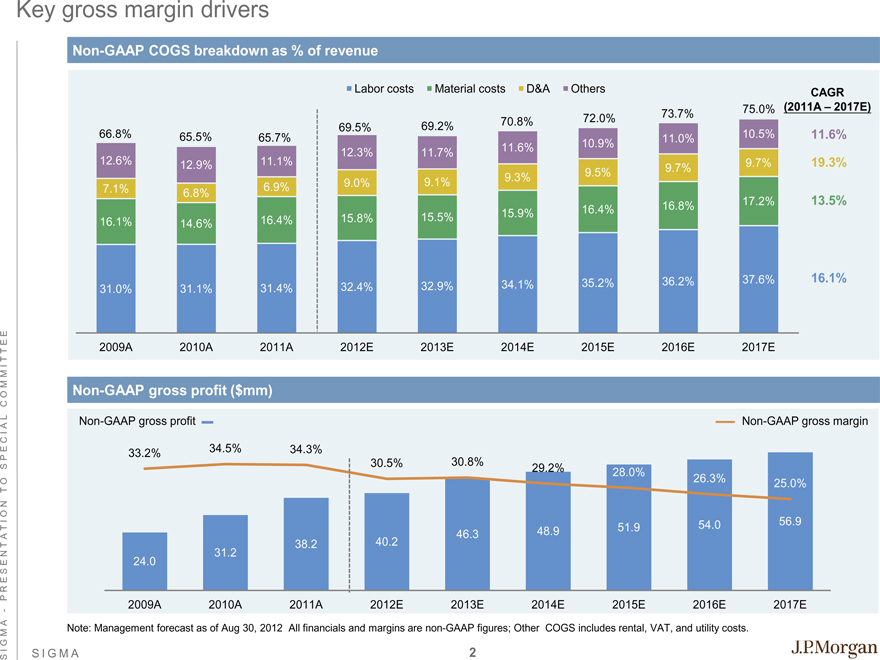
Key gross margin drivers
Non-GAAP COGS breakdown as % of revenue
Labor costs Material costs D&A Others
Labor costs Material costs D&A Others CAGR
75.0% (2011A – 2017E)
73.7%
69.5% 69.2% 70.8% 72.0%
66.8% 65.5% 65.7% 10.5% 11.6%
11.0%
12.3% 11.7% 11.6% 10.9%
12.6% 11.1% 9.7% 19.3%
12.9% 9.7%
9.5%
9.3%
9.0% 9.1%
7.1% 6.9%
6.8%
17.2% 13.5%
16.4% 16.8%
15.5% 15.9%
16.1% 16.4% 15.8%
14.6%
36.2% 37.6% 16.1%
32.4% 32.9% 34.1% 35.2%
31.0% 31.1% 31.4%
2009A 2010A 2011A 2012E 2013E 2014E 2015E 2016E 2017E
Non-GAAP gross profit ($mm)
Non-GAAP gross profit Non-GAAP gross margin
60.0 40.0%
33.2% 34.5% 34.3%
30.5% 30.8% 35.0%
50.0 29.2% 28.0%
26.3% 25.0% 30.0%
40.0 25.0%
30.0 56.9 20.0%
48.9 51.9 54.0
46.3 15.0%
20.0 38.2 40.2
31.2 10.0%
10.0 24.0
5.0%
0.0 0.0%
2009A 2010A 2011A 2012E 2013E 2014E 2015E 2016E 2017E
Note: Management forecast as of Aug 30, 2012 All financials and margins are non-GAAP figures; Other COGS includes rental, VAT, and utility costs.
S I G M A
S I G M A—P R E S E N T A T I O N T O S P E C I A L C O M M I T T E E
J.P.Morgan
2 |
|
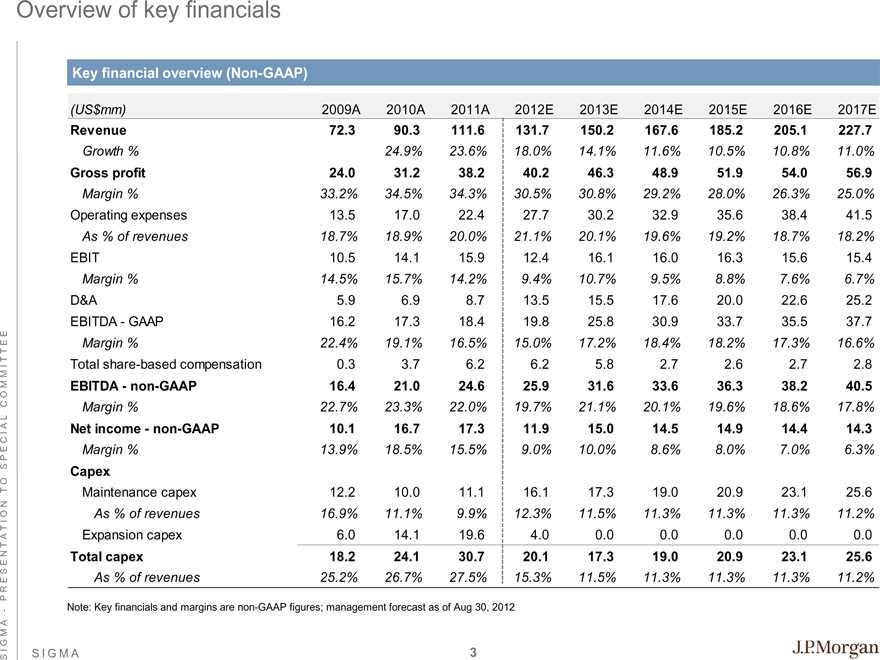
Overview of key financials
Key financial overview (Non-GAAP)
(US$mm) 2009A 2010A 2011A 2012E 2013E 2014E 2015E 2016E 2017E
Revenue 72.3 90.3 111.6 131.7 150.2 167.6 185.2 205.1 227.7
Growth % 24.9% 23.6% 18.0% 14.1% 11.6% 10.5% 10.8% 11.0%
Gross profit 24.0 31.2 38.2 40.2 46.3 48.9 51.9 54.0 56.9
Margin % 33.2% 34.5% 34.3% 30.5% 30.8% 29.2% 28.0% 26.3% 25.0%
Operating expenses 13.5 17.0 22.4 27.7 30.2 32.9 35.6 38.4 41.5
As % of revenues 18.7% 18.9% 20.0% 21.1% 20.1% 19.6% 19.2% 18.7% 18.2%
EBIT 10.5 14.1 15.9 12.4 16.1 16.0 16.3 15.6 15.4
Margin % 14.5% 15.7% 14.2% 9.4% 10.7% 9.5% 8.8% 7.6% 6.7%
D&A 5.9 6.9 8.7 13.5 15.5 17.6 20.0 22.6 25.2
EBITDA—GAAP 16.2 17.3 18.4 19.8 25.8 30.9 33.7 35.5 37.7
Margin % 22.4% 19.1% 16.5% 15.0% 17.2% 18.4% 18.2% 17.3% 16.6%
Total share-based compensation 0.3 3.7 6.2 6.2 5.8 2.7 2.6 2.7 2.8
EBITDA—non-GAAP 16.4 21.0 24.6 25.9 31.6 33.6 36.3 38.2 40.5
Margin % 22.7% 23.3% 22.0% 19.7% 21.1% 20.1% 19.6% 18.6% 17.8%
Net income—non-GAAP 10.1 16.7 17.3 11.9 15.0 14.5 14.9 14.4 14.3
Margin % 13.9% 18.5% 15.5% 9.0% 10.0% 8.6% 8.0% 7.0% 6.3%
Capex
Maintenance capex 12.2 10.0 11.1 16.1 17.3 19.0 20.9 23.1 25.6
As % of revenues 16.9% 11.1% 9.9% 12.3% 11.5% 11.3% 11.3% 11.3% 11.2%
Expansion capex 6.0 14.1 19.6 4.0 0.0 0.0 0.0 0.0 0.0
Total capex 18.2 24.1 30.7 20.1 17.3 19.0 20.9 23.1 25.6
As % of revenues 25.2% 26.7% 27.5% 15.3% 11.5% 11.3% 11.3% 11.3% 11.2%
Note: Key financials and margins are non-GAAP figures; management forecast as of Aug 30, 2012
S I G M A
S I G M A—P R E S E N T A T I O N T O S P E C I A L C O M M I T T E E
J.P.Morgan
3
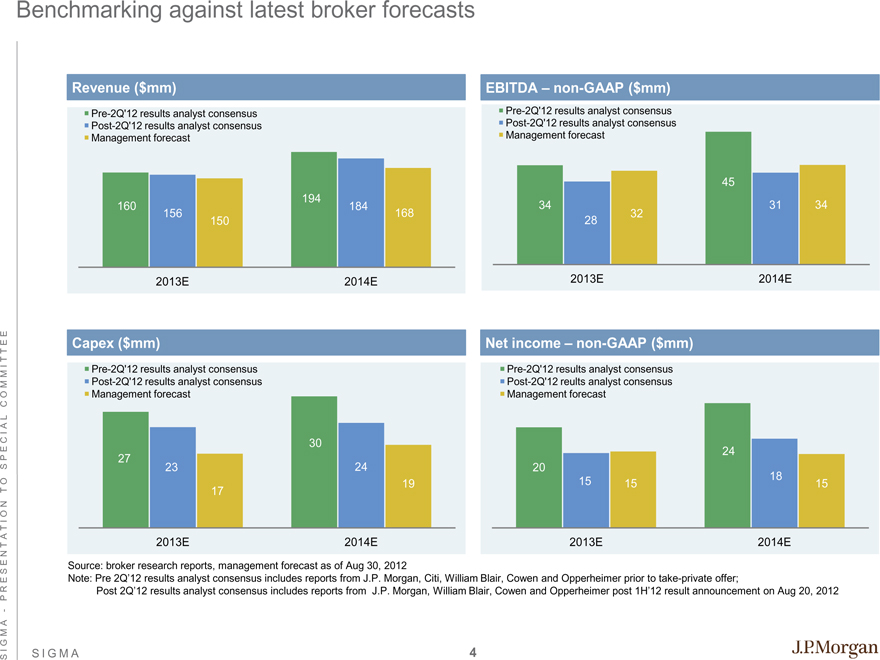
Benchmarking against latest broker forecasts
Revenue ($mm)
Pre-2Q’12 results analyst consensus Post-2Q’12 results analyst consensus Management forecast
194
160 184
156 168
150
2013E 2014E
Capex ($mm)
Pre-2Q’12 results analyst consensus Post-2Q’12 results analyst consensus Management forecast
30
27 23 24
19 17
2013E 2014E
EBITDA – non-GAAP ($mm)
Pre-2Q’12 results analyst consensus Post-2Q’12 results analyst consensus Management forecast
45
34 31 34
32
28
2013E 2014E
Net income – non-GAAP ($mm)
Pre-2Q’12 results analyst consensus Post-2Q’12 reults analyst consensus Management forecast
24
20 18
15 15 15
2013E 2014E
Source: broker research reports, management forecast as of Aug 30, 2012
Note: Pre 2Q’12 results analyst consensus includes reports from J.P. Morgan, Citi, William Blair, Cowen and Opperheimer prior to take-private offer;
Post 2Q’12 results analyst consensus includes reports from J.P. Morgan, William Blair, Cowen and Opperheimer post 1H’12 result announcement on Aug 20, 2012
S I G M A
S I G M A—P R E S E N T A T I O N T O S P E C I A L C O M M I T T E E
J.P.Morgan
4