UNITED STATES
SECURITIES AND EXCHANGE COMMISSION
Washington,D.C. 20549
FORM 6-K
Report of Foreign Private Issuer
Pursuant to Rule 13a-16 or 15d-16 under
the Securities Exchange Act of 1934
For the month of August, 2012
Commission File Number 001-35052
Adecoagro S.A.
(Translation of registrant’s name into English)
13-15 Avenue de la Liberté
L-1931 Luxembourg
R.C.S. Luxembourg B 153 681
(Address of principal executive office)
Indicate by check mark whether the registrant files or will file annual reports under cover of Form 20-F or Form 40-F.
Form 20-F x Form 40-F ¨
Indicate by check mark if the registrant is submitting the Form 6-K in paper as permitted by Regulation S-T Rule 101(b)(1): ¨
Indicate by check mark if the registrant is submitting the Form 6-K in paper as permitted by Regulation S-T Rule 101(b)(7): ¨
Indicate by check mark whether the registrant by furnishing the information contained in this Form is also thereby furnishing the information to the Commission pursuant to Rule 12g3-2(b) under the Securities Exchange Act of 1934.
Yes ¨ No x
If “Yes” is marked, indicate below the file number assigned to the registrant in connection with Rule 12g3-2(b): 82- .
ANNOUNCEMENT OF RESULTS OF OPERATIONS FOR THE THREE MONTH PERIOD ENDED JUNE 30, 2012
On August 15, 2012, the registrant issued a press release pertaining to its results of operations for the three month period ended June 30, 2012. Attached hereto is a copy of the press release. The financial and operational information contained in the press release is based on unaudited condensed consolidated financial statements presented in U.S. Dollars and prepared in accordance with International Financial Reporting Standards.
The attachment contains forward-looking statements. The registrant desires to qualify for the “safe-harbor” provisions of the Private Securities Litigation Reform Act of 1995, and consequently is hereby filing cautionary statements identifying important factors that could cause the registrant’s actual results to differ materially from those set forth in the attachment.
The registrant’s forward-looking statements are based on the registrant’s current expectations, assumptions, estimates and projections about the registrant and its industry. These forward-looking statements can be identified by words or phrases such as “anticipate,” “believe,” “continue,” “estimate,” “expect,” “intend,” “is/are likely to,” “may,” “plan,” “should,” “would,” or other similar expressions.
The forward-looking statements included in the attached relate to, among others: (i) the registrant’s business prospects and future results of operations; (ii) weather and other natural phenomena; (iii) developments in, or changes to, the laws, regulations and governmental policies governing the registrant’s business, including limitations on ownership of farmland by foreign entities in certain jurisdictions in which the registrant operate, environmental laws and regulations; (iv) the implementation of the registrant’s business strategy, including its development of the Ivinhema mill and other current projects; (v) the registrant’s plans relating to acquisitions, joint ventures, strategic alliances or divestitures; (vi) the implementation of the registrant’s financing strategy and capital expenditure plan; (vii) the maintenance of the registrant’s relationships with customers; (viii) the competitive nature of the industries in which the registrant operates; (ix) the cost and availability of financing; (x) future demand for the commodities the registrant produces; (xi) international prices for commodities; (xii) the condition of the registrant’s land holdings; (xiii) the development of the logistics and infrastructure for transportation of the registrant’s products in the countries where it operates; (xiv) the performance of the South American and world economies; and (xv) the relative value of the Brazilian Real, the Argentine Peso, and the Uruguayan Peso compared to other currencies; as well as other risks included in the registrant’s other filings and submissions with the United States Securities and Exchange Commission.
These forward-looking statements involve various risks and uncertainties. Although the registrant believes that its expectations expressed in these forward-looking statements are reasonable, its expectations may turn out to be incorrect. The registrant’s actual results could be materially different from its expectations. In light of the risks and uncertainties described above, the estimates and forward-looking statements discussed in the attached might not occur, and the registrant’s future results and its performance may differ materially from those expressed in these forward-looking statements due to, inclusive, but not limited to, the factors mentioned
2
above. Because of these uncertainties, you should not make any investment decision based on these estimates and forward-looking statements.
The forward-looking statements made in the attached relate only to events or information as of the date on which the statements are made in the attached. The registrant undertakes no obligation to update any forward-looking statements to reflect events or circumstances after the date on which the statements are made or to reflect the occurrence of unanticipated events.
3
SIGNATURES
Pursuant to the requirements of the Securities Exchange Act of 1934, the registrant has duly caused this report to be signed on its behalf by the undersigned, thereunto duly authorized.
| Adecoagro S.A. | ||||
| By | /s/ Carlos A. Boero Hughes | |||
| Name: | Carlos A. Boero Hughes | |||
| Title: | Chief Financial Officer and Chief Accounting Officer | |||
Date: August 14, 2012
2Q12
2Q12
Earnings Release
Conference Call
Aug 15th, 2012 11 a.m. (US EST)
12 p.m. (Buenos Aires and São Paulo time) 5 p.m. (Luxembourg time)
Tel: (877) 317-6776
Participants calling from the US
Tel: +1 (412) 317-6776 Participants calling from other countries
Access Code: Adecoagro
Investor Relations
Charlie Boero Hughes
CFO
Hernan Walker IR Manager
Email ir@adecoagro.com
Website www.adecoagro.com
Adecoagro recorded Adjusted EBITDA of $29.8 million in 2Q12
Luxembourg, August 14, 2012 – Adecoagro S.A. (NYSE: AGRO, Bloomberg: AGRO US, Reuters: AGRO.K), one of the leading agricultural companies in South America, announced today its results for the second quarter of 2012. The financial information contained in this press release is based on unaudited condensed consolidated interim financial statements presented in U.S. dollars and prepared in accordance with International Financial Reporting Standards (IFRS).
Highlights
Financial & Operating Performance $ thousands 2Q12 2Q11 Chg % 6M12 6M11 Chg %
Gross Sales 157,154 176,619 (11.0%) 265,636 234,871 13.1%
Adjusted EBITDA (1)
Farming & Land Transformation 22,548 22,954 (1.8%) 35,221 43,709 (19.4%)
Sugar, Ethanol & Energy 13,524 49,442 (72.6%) 8,778 44,001 (80.0%)
Corporate Expenses (6,320) (6,870) (8.0%) (12,433) (11,846) 5.0% Total Adjusted EBITDA 29,752 65,526 (54.6%) 31,566 75,864 (58.4%)
Net Incom (14,878) 12,736 — % (13,620) 28,097 — %
Farming Planted Area (Hectares 232,708 192,207 21.1% 232,708 192,207 21.1%
Sugarcane Plantation Area (Hectares) 76,517 59,647 28.3% 76,517 59,647 28.3%
In 2Q12, Adecoagro recorded Adjusted EBITDA of $ 29.8 million and an Adjusted EBITDA margin of 19.5%.
6M12 Adjusted EBITDA was $31.6 million and Adjusted EBITDA margin was 12.3%.
Gross Sales in 2Q12 reached $157.2 million, while on an accumulated basis, 6M12 gross sales were $265.6 million.
(1) Please see “Reconciliation of Non-IFRS measures” starting on page 27 for a reconciliation of Adjusted EBITDA and Adjusted EBIT to Profit/Loss. Adjusted EBITDA is defined as consolidated profit from operations before financing and taxation, depreciation, amortization and unrealized changes in fair value of long-term biological assets (sugarcane, coffee and cattle). Adjusted EBIT is defined as consolidated profit from operations before financing and taxation, and unrealized changes in fair value of long-term biological assets (sugarcane, coffee and cattle). Adjusted EBITDA margin and Adjusted EBIT margin are calculated as a percentage of net sales.
2Q12
The Farming and Land Transformation businesses’ Adjusted EBITDA in 2Q12 was $22.5 million, in line with 2Q11. Operating performance was enhanced by an $8.0 million gain generated by the strategic sale of the San Jose farm, and offset by a $1.6 million loss resulting from the mark-to-market of our crop hedge positions, compared to a $3.0 million gain in 2Q11.
Adecoagro’s Sugar, Ethanol and Energy business began the 2012 sugarcane harvest and milling season during 2Q12. Operational and financial performance during the quarter was negatively affected by abundant rainfalls during April, May and June throughout the Brazilian center-south region. The excess rains delayed the harvest and reduced the sucrose content (TRS) in the cane. As a result, sugarcane milling during 2Q12 was 40.4% below that of 2Q11. Consequently, Adjusted EBITDA for the quarter was $13.5 million, compared to $49.4 million in 2Q11. If weather normalizes during the second half of the year, Adecoagro expects to compensate for the lower sugarcane crushing and production volumes and related financial perfomance during 3Q12 and 4Q12.
Net income in 2Q12 totaled negative $14.9 million, $27.6 million less than in 2Q11. The loss for the period is the result of: (i) the delay in the sugarcane harvest, (ii) a $21.4 million foreign exchange loss, mainly non-cash, generated by the impact of the depreciation of the Brazilian Real on our outstanding dollar-denominated debt and non-deliverable forward currency hedges, and (iii) a $10.3 million non-cash loss resulting from the mark-to-market of our sugarcane and coffee biological assets. We expect poor results generated by the delay of the sugarcane harvest to be offset by gains during the next two quarters.
Strategy Execution
Sugar, Ethanol & Energy Expansion
The construction of the Ivinhema greenfield mill in Mato Grosso do Sul is moving ahead as planned and on schedule. We expect the construction of the first phase of the mill, consisting of a nominal annual capacity of 2.0 million tons of sugarcane, to be completed by November 2012. Ivinhema is expected to undergo test runs in late 2012 and start commercial milling operations at the beginning of the 2013 harvest.
Land Transformation – San Jose Farm Sale
During June 2012, Adecoagro completed the sale of the San Jose farm at a 31.4% premium over the Cushman and Wakefield independent appraisal dated September 2011. San Jose is a 7,630 hectare farm purchased by Adecoagro in 2002 for a total of $0.7 million or $85 per hectare. The farm was sold fully developed 10 years later for $9.25 million or $1,212 per hectare, obtaining an internal rate of return of 31.8%. The transaction generated $8.0 million dollars of operating profit for the 2Q12 period.
Dairy and Rice Expansion
The construction of the second free stall dairy is well advanced and is expected to start operating during August 2012 with 230 milking cows, generating additional value to our corn and soy production.
The facility will be gradually populated until reaching full capacity of 3,500 milking cows and an estimated production of over 120 thousand liters of milk per day by November 2013. The new free stall dairy will expand Adecoagro’s milking 7,200 head and annual milk production cow herd to 90 million liters.
The Franck rice mill is expected to be finished by September 2012. Once the assembly is completed the facility will be able to generate additional value to our rough rice production. The mill will have an
2Q12
annual processing capacity of 100,000 tons of rough rice, increasing Adecoagro’s 300,000 tons.
Market Overview
After the summer drought that occurred in South America during the end of 2011 and early 2012, the United States is now facing a similar drought situation in all the main producing states. The US grain and oilseed markets have been significantly impacted by the swing in forecasts which went from a record high production of corn and soybean, to the highest estimated yield losses in 25 years. As a consequence, grain and oilseed prices surged and reached record highs during mid July 2012. Deterioration of crop conditions in the US, coupled with existing low stock-to-use ratios after the South American corn and soybean crop, may lead to a period of extended high prices at least until the 2012/13 South American crop.
Sugar #11 ICE broke the 20 cents/lb barrier, in part as a result of strong Brazilian currency depreciation and the crisis in Europe. Prices rose back through the 22-23 cents/lb level at the end of the quarter due to excess rainfall, which slowed harvesting in both Center-South Brazil and Australia, while delayed monsoons have reduced production expectations for
Environmental Sustainability
Bonsucro Certifiation
On July 5, 2012, Adecoagro’s Sugar, Ethanol and Energy cluster located in the state of Mato Grosso do Sul, Brazil, was certified under the Bonsucro Production Standard. Over 33 thousand hectares of sugarcane plantations were audited, resulting in a certified production of 170 thousand tons of sugar and 125 thousand cubic meters of ethanol. Angelica is the first mill in the state of Mato Grosso do Sul and the sixteenth worldwide to obtain this certification.
The Bonsucro Production Standard is a global multi-stakeholder non-profit initiative focused on improving the social, environmental, and economic sustainability of sugar, ethanol, and energy production from sugarcane. The certification assures buyers, suppliers and consumers that sugar and ethanol are produced with a focus on fulfillment of five key items: (i) legal compliance; (ii) biodiversity and ecosystem impacts; (iii) human rights; (iv) production and processing; and (v) continuous improvement.
We believe this certification will allow Adecoagro to access new markets and expand its commercial opportunities. The Bonsucro certification meets the sustainability criteria set by the European Union Renewable Energy Directive, which mandates 20% renewable energy consumption for its Member States by 2020.
Since its inception, Adecoagro’s business model has been focused on operational efficiency to achieve low cost production, balanced with environmental and social sustainability to ensure long term profitability. During the last 12-months, Adecoagro has achieved other important certifications for its food and renewable energy production: ethanol production has been approved to enter the U.S. market as an advanced biofuel under the Environmental Protection Agency’s Renewable Fuel Standard (RFS2) and the California Air Resources Board Low Carbon Fuel Standard (LCFS). Soybean production has been certified by the Round Table on Responsible Soybean (RTRS). The Bonsucro certification constitutes another proof of Adecoagro’s strong commitment to the highest sustainability standards.

2Q12
Operating Performance
Farming Business
Farming Production Data
Planting & Production
Planted Area (hectares)
2011/2012 Harvested Area
Yields (Tons per hectare)
2011/2012
2010/2011
Chg %
Hectares
% Harvested Production (tons)
2011/2012
2010/2011
Chg %
Soybean
50,726
57,815
(12.3%)
50,406
99.4%
125,140
2.5
2.6
(2.8%)
Soybean 2nd Crop
42,024
32,311
30.1%
41,201
98.0%
62,833
1.5
1.6
(4.9%)
Corn (1)
41,466
28,178
47.2%
24,451
59.0%
123,925
5.1
5.6
(10.3%)
Corn 2nd Crop
6,144
3,516
74.7%
1,595
26.0%
5,903
3.7
3.0
22.9%
Wheat (2)
43,235
28,029
54.3%
43,235
100.0%
113,341
2.6
3.3
(20.9%)
Sunflower
9,596
9,943
(3.5%)
9,596
100.0%
18,667
1.9
2.1
(7.5%)
Cotton Fiber
6,389
3,242
97.1%
3,491
54.6%
3,673
1.1
2.7
(61.0%)
Total Crops
199,579
163,033
22.4%
173,974
87.2%
453,483
2.6
3.0
(13.6%)
Rice
31,497
27,542
14.4%
31,497
100.0%
171,137
5.4
6.2
(13.0%)
Coffee (perennial) (3)
1,632
1,632
— %
1,225
78.0%
2,637
2.2
2.0
10.3%
Total Farming
232,708
192,207
21.1%
206,695
88.8%
627,257
3.0
3.5
(12.5%)
Owned Croppable Area
123,277
118,686
3.9%
Leased Area
61,263
37,694
62.5%
Second Crop Area
48,168
35,827
34.4%
Total Farming Area
232,708
192,207
21.1%
Milking Cows (Average Heads)
Milk Production (MM liters)
Productivity (Liters per cow per day)
Dairy
2Q12
2Q11
Chg %
2Q12
2Q11
Chg %
2Q12
2Q11
Chg %
Milk Production
4,627
4,381
5.6%
12.1
11.4
6.3%
28.8
28.6
0.7%
Processed Rice (thousand tons)
Rice
2Q12
2Q11
Chg %
Processed Rice
66.6
54.0
23.4%
(1) Includes sorghum.
(2) Includes barley.
(3) Percentage of harvested area is calculated over 1,570
Note: Some planted areas may reflect immaterial adjustments compared to previous reports due to a more accurate area measurement, which occurred during
2011/12 Harvest Year
As of June 30, 2012, 206.7 thousand hectares were successfully harvested. The harvest of the remaining
26.0 hectares, including corn, soybean, cotton and coffee, will be concluded during 3Q12.
Wheat: The harvest was completed and reported in the 1Q12 earnings report. Sunflower: The harvest was completed and reported in the 1Q12 earnings report.
Soybean: As of June 30, 2012, 99.4% of soybean first crop was harvested. Average yield was 2.5 tons/ha, slightly lower than the previous harvest year. Yields were below our estimates mainly due to the drought experienced in the Humid Pampas region during November 2011 through early January 2012, coupled with the lack of rain that the northwest of Argentina experienced during the months of March and April 2012. Soybean Second Crop: The harvest of soybean second crop was substantially complete by the end of June 2012, with 98.0% of total area harvested. As a result of the summer drought, the lack of moisture in the soil prevented the timely planting of the crop, which follows immediately after the wheat crop harvest. Although the crop experienced adequate rains during the growth cycle, the late planting reduced the yield potential. In addition, the drought suffered in the northwest of Argentina during March and April 2012 also had an adverse effect on the crop’s development. Despite these adverse conditions, the average soybean yield was 1.5 tons/ha, slightly below last year.
2Q12
Corn: As of June 30, 2012, the harvested area for corn totaled 24,451 hectares, 59.0% of the total planted area. The average yield obtained by the end of 2Q12 was of 5.1 tons/ha, 10.3% lower than the previous harvest year. The lower yield was the result of the lack of rain during November 2011 through January
2012. As of the end of the second quarter, a considerable harvested. This is primarily due to the strategic decision of planting 50% of the area with late corn varieties to diversify climate and water risk, which will continue to be harvested during early 3Q12. We expect final yields for the corn crop to remain in line with the current average yield.
Corn Second Crop: As of the end of 2Q12, the harvest was in its initial stage with only 26.0% of the area harvested. The crop developed well and we expect final yields to be in line with current harvested yields of
3.7 tons per hectare or 22.9% above last year.
Cotton: As of the end of 2Q12, 54.6% of the planted hectares had been harvested. Almost all of the harvested area corresponds to cotton planted in Argentina, which has a lower yield potential than Brazilian cotton. In addition, the cotton in Argentina was negatively affected by the summer drought. We expect average yields to improve as the Brazilian farms continue to be harvested throughout 3Q12.
Rice: The harvest of 31,497 hectares of rice was completed by the end of the 2Q12. Despite the 14.4% growth in planted area, rough rice production remained in line with last year reaching 171.0K tons during the 2011/12 harvest year due to lower yields. The average yield of our rice farms was 5.4 tons/ha, 13.0% lower than the previous harvest year. As mentioned in the 1Q12 report, below average temperatures during the initial growth stage of the crop coupled with high temperatures lack of rain during the flowering stage, reduced the crop’s yield potential.
Coffee: The harvest of our coffee plantation was well advanced as of June 30, 2012, with almost 80% of total estimated production harvested. We expect total production to be 20% above last year as a result of a 12% increase in harvested area and a 10% increase in yields, driven by the improvement in harvesting efficiency.
2012/13 Harvest Year
At the end of 2Q12, Adecoagro began its planting activities for the 2012/13 harvest year. During the end of June through early July, Adecoagro successfully planted 29,453 thousand hectares of wheat in good soil moisture conditions.
2Q12
Sugar, Ethanol & Energy Business
Sugar, Ethanol & Energy - Selected Production Data
2Q12
2Q11
% Chg
6M12
6M11
% Chg
Crushed Cane (Tons)
997,036
1,673,855
(40.4%)
997,036
1,673,855
(40.4%)
Own Cane
974,226
1,583,427
(38.5%)
974,226
1,583,427
(38.5%)
Third Party Cane
22,811
88,729
(74.3%)
22,811
88,729
(74.3%)
Sugar (Tons)
49,396
77,041
(35.9%)
49,396
77,041
(35.9%)
Ethanol (M3)
41,287
69,266
(40.4%)
41,287
69,266
(40.4%)
Exported Energy (MWh)
46,728
89,898
(48.0%)
46,728
89,898
(48.0%)
Expansion & Renewal Area (Hectares)
5,235
2,993
74.9%
11,705
5,985
95.6%
Harvested Area (Hectares)
15,462
17,790
(13.1%)
15,462
17,790
(13.1%)
Sugarcane Plantation (Hectares)
76,517
59,647
28.3%
76,517
59,647
28.3%
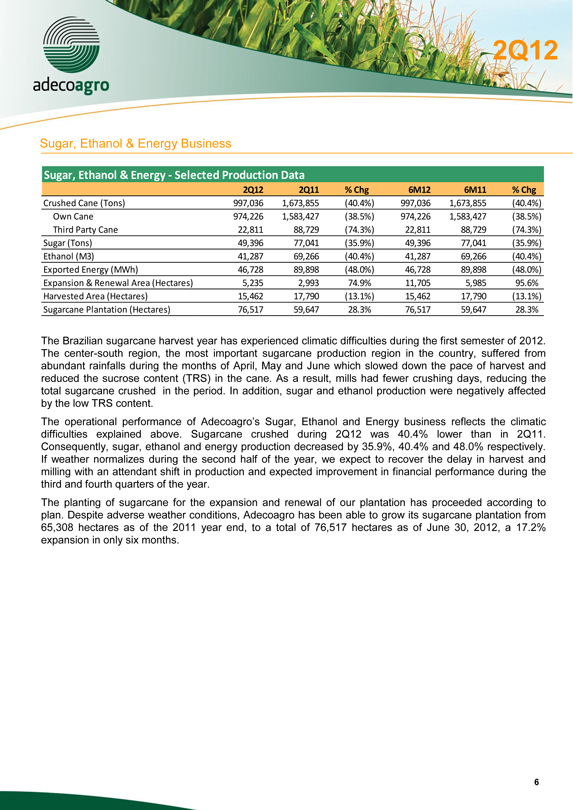
The Brazilian sugarcane harvest year has experienced climatic difficulties during the first semester of 2012. The center-south region, the most important sugarcane production region in the country, suffered from abundant rainfalls during the months of April, May and June which slowed down the pace of harvest and reduced the sucrose content (TRS) in the cane. As a result, mills had fewer crushing days, reducing the total sugarcane crushed in the period. In addition, sugar and ethanol production were negatively affected by the low TRS content.
The operational performance of Adecoagro’s Sugar, Ethanol and Energy business reflects the climatic difficulties explained above. Sugarcane crushed during 2Q12 was 40.4% lower than in 2Q11. Consequently, sugar, ethanol and energy production decreased by 35.9%, 40.4% and 48.0% respectively. If weather normalizes during the second half of the year, we expect to recover the delay in harvest and milling with an attendant shift in production and expected improvement in financial performance during the third and fourth quarters of the year.
The planting of sugarcane for the expansion and renewal of our plantation has proceeded according to plan. Despite adverse weather conditions, Adecoagro has been able to grow its sugarcane plantation from 65,308 hectares as of the 2011 year end, to a total of 76,517 hectares as of June 30, 2012, a 17.2% expansion in only six months.
2Q12
Financial Performance
Farming & Land Transformation Businesses
Farming & Land transformation businesses—Financial highlights
$ thousands
2Q12
2Q11
Chg %
6M12
6M11
Chg %
Gross Sales
Farming
98,385
76,512
28.6%
161,063
125,811
28.0%
Total Sales
98,385
76,512
28.6%
161,063
125,811
28.0%
Adjusted EBITDA (1)
Farming
14,585
22,954
(36.5%)
27,258
43,709
(37.6%)
Land Transformation
7,963
—
— %
7,963
—
— %
Total Adjusted EBITDA(1)
22,548
22,954
(1.8%)
35,221
43,709
(19.4%)
Adjusted EBIT (1)
Farming
12,702
21,327
(40.4%)
23,539
41,067
(42.7%)
Land Transformation
7,963
—
— %
7,963
—
— %
Total Adjusted EBIT(1)
20,665
21,327
(3.1%)
31,502
41,067
(23.3%)
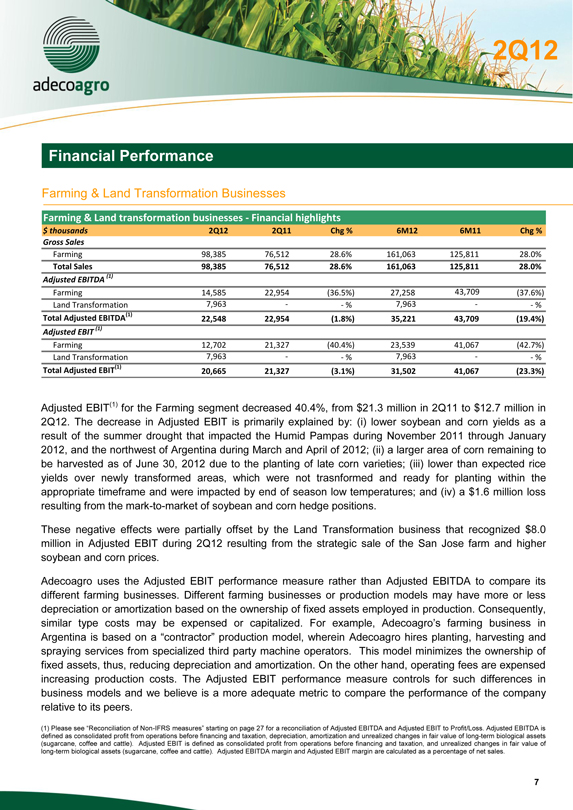
Adjusted EBIT(1) for the Farming segment decreased 40.4%, from $21.3 million in 2Q11 to $12.7 million in 2Q12. The decrease in Adjusted EBIT is primarily explained by: (i) lower soybean and corn yields as a result of the summer drought that impacted the Humid Pampas during November 2011 through January 2012, and the northwest of Argentina during March and April of 2012; (ii) a larger area of corn remaining to be harvested as of June 30, 2012 due to the planting of late corn varieties; (iii) lower than expected rice yields over newly transformed areas, which were not trasnformed and ready for planting within the appropriate timeframe and were impacted by end of season low temperatures; and (iv) a $1.6 million loss resulting from the mark-to-market of soybean and corn hedge positions.
These negative effects were partially offset by the Land Transformation business that recognized $8.0 million in Adjusted EBIT during 2Q12 resulting from the strategic sale of the San Jose farm and higher soybean and corn prices.
Adecoagro uses the Adjusted EBIT performance measure rather than Adjusted EBITDA to compare its different farming businesses. Different farming businesses or production models may have more or less depreciation or amortization based on the ownership of fixed assets employed in production. Consequently,
similar type costs may be expensed or capitalized. For example, Adecoagro’s Argentina is based on a “contractor” Adecoagro hires planting, production harvesting and spraying services from specialized third party machine operators. This model minimizes the ownership of fixed assets, thus, reducing depreciation and amortization. On the other hand, operating fees are expensed increasing production costs. The Adjusted EBIT performance measure controls for such differences in business models and we believe is a more adequate metric to compare the performance of the company relative to its peers.
(1) Please see “Reconciliation -IFRS measures”of starting 7 for Non a reconciliation on of Adjusted page EBITDA 2 and Adjusted EBIT to Profit/Loss. Adjusted EBITDA is defined as consolidated profit from operations before financing and taxation, depreciation, amortization and unrealized changes in fair value of long-term biological assets (sugarcane, coffee and cattle). Adjusted EBIT is defined as consolidated profit from operations before financing and taxation, and unrealized changes in fair value of long-term biological assets (sugarcane, coffee and cattle). Adjusted EBITDA margin and Adjusted EBIT margin are calculated as a percentage of net sales.
2Q12
Crops
Crops—Highlights
metric
2Q12
2Q11
Chg %
6M12
6M11
Chg %
Gross Sales
$ thousands
71,719
50,378
42.4%
107,713
76,149
41.5%
thousand tons
243
196
24.0%
385
305
26.2%
$ per ton
296
258
14.8%
280
250
12.1%
Adjusted EBITDA
$ thousands
11,260
17,354
(35.1%)
23,217
35,030
(33.7%)
Adjusted EBIT
$ thousands
10,810
17,053
(36.6%)
22,333
34,372
(35.0%)
Area under production (1)
hectares
151,411
127,206
19.0%
151,411
127,206
19.0%
(1) Does not include second crop planted area. Areas correspond to 2011/12 and 2010/11 harvest years.
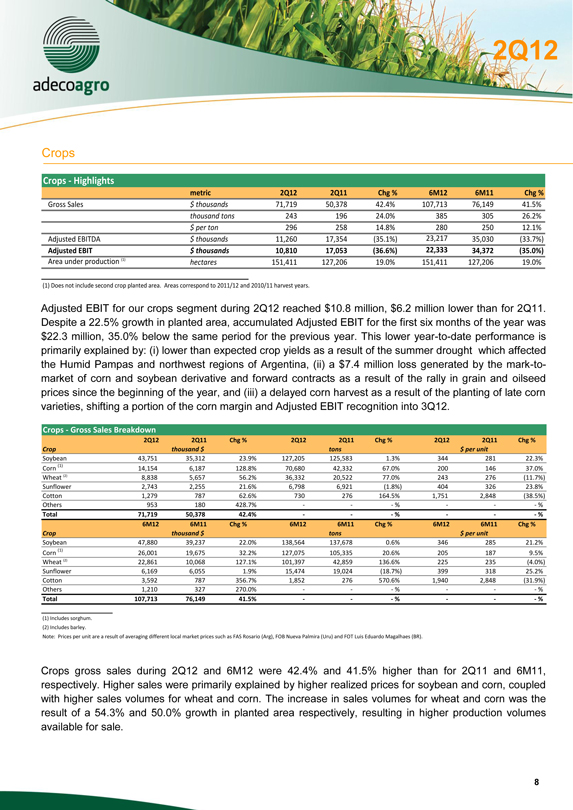
Adjusted EBIT for our crops segment during 2Q12 reached $10.8 million, $6.2 million lower than for 2Q11.
Despite a 22.5% growth in planted area, accumulated Adjusted EBIT for the first six months of the year was $22.3 million, 35.0% below the same period for the previous year. This lower year-to-date performance is primarily explained by: (i) lower than expected crop yields as a result of the summer drought which affected the Humid Pampas and northwest regions of Argentina, (ii) a $7.4 million loss generated by the mark-to-market of corn and soybean derivative and forward contracts as a result of the rally in grain and oilseed prices since the beginning of the year, and (iii) a delayed corn harvest as a result of the planting of late corn varieties, shifting a portion of the corn margin and Adjusted EBIT recognition into 3Q12.
Crops - Gross Sales Breakdown
2Q12
2Q11
Chg %
2Q12
2Q11
Chg %
2Q12
2Q11
Chg %
Crop
thousand $
tons
$ per unit
Soybean
43,751
35,312
23.9%
127,205
125,583
1.3%
344
281
22.3%
Corn (1)
14,154
6,187
128.8%
70,680
42,332
67.0%
200
146
37.0%
Wheat (2)
8,838
5,657
56.2%
36,332
20,522
77.0%
243
276
(11.7%)
Sunflower
2,743
2,255
21.6%
6,798
6,921
(1.8%)
404
326
23.8%
Cotton
1,279
787
62.6%
730
276
164.5%
1,751
2,848
(38.5%)
Others
953
180
428.7%
—
—
— %
—
—
— %
Total
71,719
50,378
42.4%
—
—
— %
—
—
— %
6M12
6M11
Chg %
6M12
6M11
Chg %
6M12
6M11
Chg %
Crop
thousand $
tons
$ per unit
Soybean
47,880
39,237
22.0%
138,564
137,678
0.6%
346
285
21.2%
Corn (1)
26,001
19,675
32.2%
127,075
105,335
20.6%
205
187
9.5%
Wheat (2)
22,861
10,068
127.1%
101,397
42,859
136.6%
225
235
(4.0%)
Sunflower
6,169
6,055
1.9%
15,474
19,024
(18.7%)
399
318
25.2%
Cotton
3,592
787
356.7%
1,852
276
570.6%
1,940
2,848
(31.9%)
Others
1,210
327
270.0%
—
—
— %
—
—
— %
Total
107,713
76,149
41.5%
—
—
— %
—
—
— %
(1) Includes sorghum.
(2) Includes barley.
Note: Prices per unit are a result of averaging different local market prices such as FAS Rosario (Arg), FOB Nueva Palmira (Uru) and FOT Luis Eduardo Magalhaes (BR).
Crops gross sales during 2Q12 and 6M12 were 42.4% and 41.5% higher than for 2Q11 and 6M11, respectively. Higher sales were primarily explained by higher realized prices for soybean and corn, coupled with higher sales volumes for wheat and corn. The increase in sales volumes for wheat and corn was the result of a 54.3% and 50.0% growth in planted area respectively, resulting in higher production volumes available for sale.
2Q12
Crops - Changes in Fair Value Breakdown
Soy 2nd
Corn 2nd
6M12
metric
Soy
Crop
Corn
Crop
Wheat Sunflower
Cotton
Total
2011/12 harvest year
Planting plan (a+b+c+d+e)
hectares
50,726
42,024
41,466
6,144
43,235
9,596
6,389
199,579
Area remaining to be planted (a)
hectares
—
—
—
—
—
—
—
—
Planted area in initial growing stages (b)
hectares
—
—
—
—
—
—
580
580
Planted area with significant biological growth (c)
hectares
320
824
17,014
4,549
—
—
2,319
25,026
Changes in Fair Value 2012 from planted area 2011/2012
$ thousands
174
45
(300)
171
—
—
(598)
(509)
with significant biological growth (i)
Area harvested in previous period (d)
hectares
3,484
429
8,700
—
43,235
9,596
—
65,444
Area harvested in current period (e)
hectares
46,922
40,771
15,751
1,595
—
—
3,491
108,530
Changes in Fair Value 2012 from harvested area 2011/12
(ii)
$ thousands
15,972
5,054
950
35
32
869
(399)
22,513
Total Changes in Fair Value in 6M12 (i+ii)
$ thousands
16,146
5,099
650
205
32
869
(997)
22,004
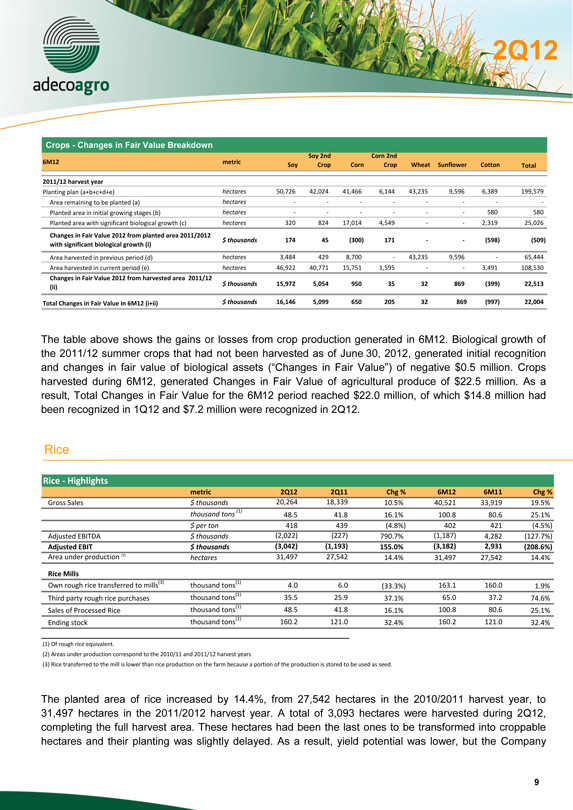
The table above shows the gains or losses from crop production generated in 6M12. Biological growth of the 2011/12 summer crops that had not been harvested as of June 30, 2012, generated initial recognition
and changes in fair value of biological assets (“Changes in Fair negative $0 Value”) .5 million. Crops of
harvested during 6M12, generated Changes in Fair Value of agricultural produce of $22.5 million. As a result, Total Changes in Fair Value for the 6M12 period reached $22.0 million, of which $14.8 million had been recognized in 1Q12 and $7.2 million were recognized in 2Q12.
Rice
Rice—Highlightsmetric
2Q12
2Q11
Chg %
6M12
6M11
Chg %
Gross Sales
$ thousands
20,264
18,339
10.5%
40,521
33,919
19.5%
thousand tons (1)
48.5
41.8
16.1%
100.8
80.6
25.1%
$ per ton
418
439
(4.8%)
402
421
(4.5%)
Adjusted EBITDA
$ thousands
(2,022)
(227)
790.7%
(1,187)
4,282
(127.7%)
Adjusted EBIT
$ thousands
(3,042)
(1,193)
155.0%
(3,182)
2,931
(208.6%)
Area under production (2)
hectares
31,497
27,542
14.4%
31,497
27,542
14.4%
Rice Mills
Own rough rice transferred to mills(3)
thousand tons(1)
4.0
6.0
(33.3%)
163.1
160.0
1.9%
Third party rough rice purchases
thousand tons(1)
35.5
25.9
37.1%
65.0
37.2
74.6%
Sales of Processed Rice
thousand tons(1)
48.5
41.8
16.1%
100.8
80.6
25.1%
Ending stock
thousand tons(1)
160.2
121.0
32.4%
160.2
121.0
32.4%
(1) Of rough rice equivalent.
(2) Areas under production correspond to the 2010/11 and 2011/12 harvest years
(3) Rice transferred to the mill is lower than rice production on the farm because a portion of the production is stored to be used as seed.
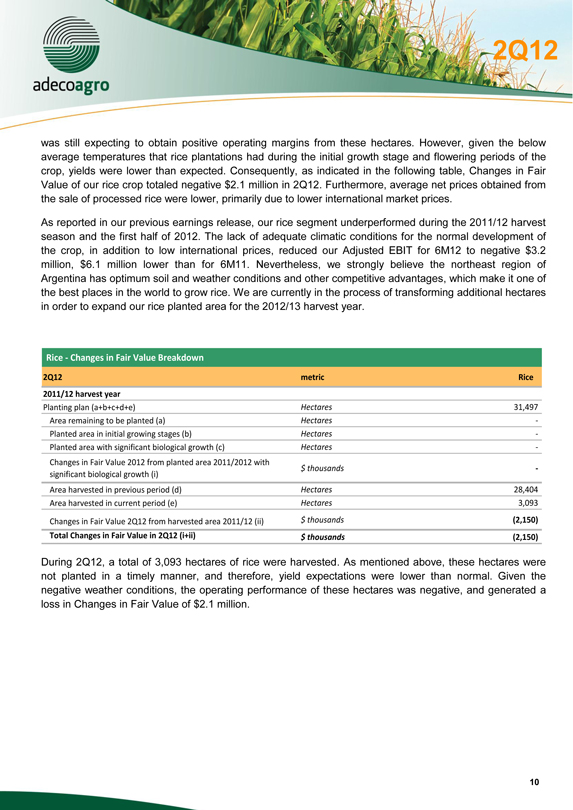
The planted area of rice increased by 14.4%, from 27,542 hectares in the 2010/2011 harvest year, to 31,497 hectares in the 2011/2012 harvest year. A total of 3,093 hectares were harvested during 2Q12, completing the full harvest area. These hectares had been the last ones to be transformed into croppable hectares and their planting was slightly delayed. As a result, yield potential was lower, but the Company
2Q12
was still expecting to obtain positive operating margins from these hectares. However, given the below average temperatures that rice plantations had during the initial growth stage and flowering periods of the crop, yields were lower than expected. Consequently, as indicated in the following table, Changes in Fair Value of our rice crop totaled negative $2.1 million in 2Q12. Furthermore, average net prices obtained from the sale of processed rice were lower, primarily due to lower international market prices.
As reported in our previous earnings release, our rice segment underperformed during the 2011/12 harvest season and the first half of 2012. The lack of adequate climatic conditions for the normal development of the crop, in addition to low international prices, reduced our Adjusted EBIT for 6M12 to negative $3.2 million, $6.1 million lower than for 6M11. Nevertheless, we strongly believe the northeast region of Argentina has optimum soil and weather conditions and other competitive advantages, which make it one of the best places in the world to grow rice. We are currently in the process of transforming additional hectares in order to expand our rice planted area for the 2012/13 harvest year.
Rice - Changes in Fair Value Breakdown
2Q12
metric
Rice
2011/12 harvest year
Planting plan (a+b+c+d+e)
Hectares
31,497
Area remaining to be planted (a)
Hectares
—
Planted area in initial growing stages (b)
Hectares
—
Planted area with significant biological growth (c)
Hectares
—
Changes in Fair Value 2012 from planted area 2011/2012 with
$ thousands
—
significant biological growth (i)
Area harvested in previous period (d)
Hectares
28,404
Area harvested in current period (e)
Hectares
3,093
Changes in Fair Value 2Q12 from harvested area 2011/12 (ii)
$ thousands
(2,150)
Total Changes in Fair Value in 2Q12 (i+ii)
$ thousands
(2,150)
During 2Q12, a total of 3,093 hectares of rice were harvested. As mentioned above, these hectares were not planted in a timely manner, and therefore, yield expectations were lower than normal. Given the negative weather conditions, the operating performance of these hectares was negative, and generated a loss in Changes in Fair Value of $2.1 million.
2Q12
Dairy
Dairy - Highlightsmetric
2Q12
2Q11
Chg %
6M12
6M11
Chg %
Gross Sales
$ thousands
4,604
4,520
1.9%
9,319
8,963
4.0%
million liters
12.1
11.4
6.3%
24.9
22.5
10.4%
$ per liter
0.38
0.40
(4.2%)
0.37
0.40
(5.8%)
Adjusted EBITDA
$ thousands
(696)
68
— %
(484)
835
— %
Adjusted EBIT
$ thousands
(912)
(47)
1,840.4%
(912)
603
— %
Milking Cows
Average Heads
4,627
4,381
5.6%
4,659
4,381
6.4%
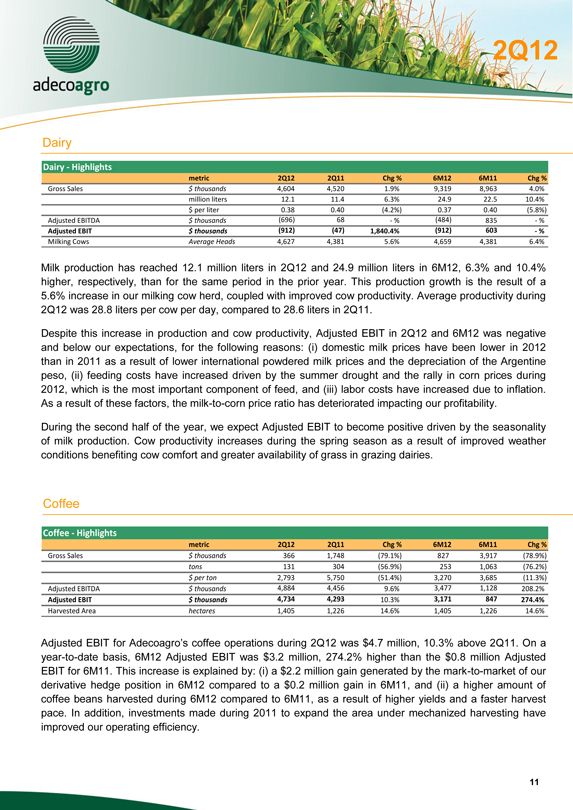
Milk production has reached 12.1 million liters in 2Q12 and 24.9 million liters in 6M12, 6.3% and 10.4% higher, respectively, than for the same period in the prior year. This production growth is the result of a
5.6% increase in our milking cow herd, coupled with improved cow productivity. Average productivity during 2Q12 was 28.8 liters per cow per day, compared to 28.6 liters in 2Q11.
Despite this increase in production and cow productivity, Adjusted EBIT in 2Q12 and 6M12 was negative and below our expectations, for the following reasons: (i) domestic milk prices have been lower in 2012 than in 2011 as a result of lower international powdered milk prices and the depreciation of the Argentine peso, (ii) feeding costs have increased driven by the summer drought and the rally in corn prices during 2012, which is the most important component of feed, and (iii) labor costs have increased due to inflation. As a result of these factors, the milk-to-corn price ratio has deteriorated impacting our profitability.
During the second half of the year, we expect Adjusted EBIT to become positive driven by the seasonality of milk production. Cow productivity increases during the spring season as a result of improved weather conditions benefiting cow comfort and greater availability of grass in grazing dairies.
Coffee
Coffee - Highlightsmetric
2Q12
2Q11
Chg %
6M12
6M11
Chg %
Gross Sales
$ thousands
366
1,748
(79.1%)
827
3,917
(78.9%)
tons
131
304
(56.9%)
253
1,063
(76.2%)
$ per ton
2,793
5,750
(51.4%)
3,270
3,685
(11.3%)
Adjusted EBITDA
$ thousands
4,884
4,456
9.6%
3,477
1,128
208.2%
Adjusted EBIT
$ thousands
4,734
4,293
10.3%
3,171
847
274.4%
Harvested Area
hectares
1,405
1,226
14.6%
1,405
1,226
14.6%
Adjusted EBIT for Adecoagro’sduring coffee 2Q12 wasoperations $4.7 million, 10.3% above 2Q11. On a year-to-date basis, 6M12 Adjusted EBIT was $3.2 million, 274.2% higher than the $0.8 million Adjusted EBIT for 6M11. This increase is explained by: (i) a $2.2 million gain generated by the mark-to-market of our derivative hedge position in 6M12 compared to a $0.2 million gain in 6M11, and (ii) a higher amount of coffee beans harvested during 6M12 compared to 6M11, as a result of higher yields and a faster harvest pace. In addition, investments made during 2011 to expand the area under mechanized harvesting have improved our operating efficiency.
2Q12
Cattle
Cattle - Highlightsmetric
2Q12
2Q11
Chg %
6M12
6M11
Chg %
Gross Sales
$ thousands
1,432
1,527
(6.2%)
2,683
2,863
(6.3%)
Adjusted EBITDA
$ thousands
1,159
1,303
(11.1%)
2,235
2,434
(8.2%)
Adjusted EBIT
$ thousands
1,112
1,221
(8.9%)
2,129
2,314
(8.0%)
Area Leased
hectares
77,654
79,299
(2.1%)
77,654
79,392
(2.2%)
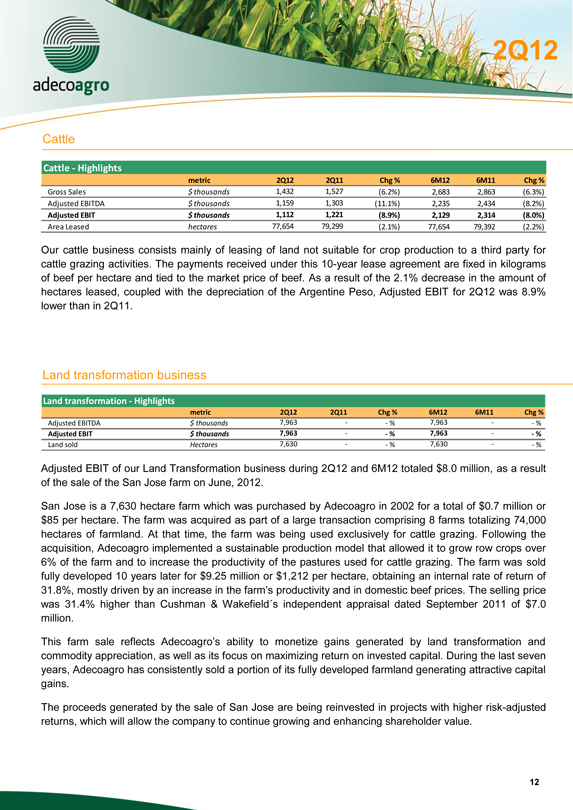
Our cattle business consists mainly of leasing of land not suitable for crop production to a third party for cattle grazing activities. The payments received under this 10-year lease agreement are fixed in kilograms of beef per hectare and tied to the market price of beef. As a result of the 2.1% decrease in the amount of hectares leased, coupled with the depreciation of the Argentine Peso, Adjusted EBIT for 2Q12 was 8.9% lower than in 2Q11.
Land transformation business
Land transformation - Highlightsmetric
2Q12
2Q11
Chg %
6M12
6M11
Chg %
Adjusted EBITDA
$ thousands
7,963
—
— %
7,963
—
— %
Adjusted EBIT
$ thousands
7,963
—
— %
7,963
—
— %
Land sold
Hectares
7,630
—
— %
7,630
—
— %
Adjusted EBIT of our Land Transformation business during 2Q12 and 6M12 totaled $8.0 million, as a result of the sale of the San Jose farm on June, 2012.
San Jose is a 7,630 hectare farm which was purchased by Adecoagro in 2002 for a total of $0.7 million or $85 per hectare. The farm was acquired as part of a large transaction comprising 8 farms totalizing 74,000 hectares of farmland. At that time, the farm was being used exclusively for cattle grazing. Following the acquisition, Adecoagro implemented a sustainable production model that allowed it to grow row crops over 6% of the farm and to increase the productivity of the pastures used for cattle grazing. The farm was sold fully developed 10 years later for $9.25 million or $1,212 per hectare, obtaining an internal rate of return of
31.8%, mostly driven by an increase in the farm’s productivity domestic beef prices. The and selling price in was 31.4% higher than Cushman & Wakefield´s independent appraisal dated September 2011 of $7.0 million.
This farm sale reflects Adecoagro’s ability to commodity appreciation, as well as its focus on maximizing return on invested capital. During the last seven years, Adecoagro has consistently sold a portion of its fully developed farmland generating attractive capital gains.
The proceeds generated by the sale of San Jose are being reinvested in projects with higher risk-adjusted returns, which will allow the company to continue growing and enhancing shareholder value.
2Q12
Sugar, Ethanol & Energy business
Sugar, Ethanol & Energy - Highlights
$ thousands
2Q12
2Q11
% Chg
6M12
6M11
% Chg
Net Sales Angelica (1)
41,069
77,104
(46.7%)
69,608
79,892
(12.9%)
Net Sales UMA (1)
13,112
16,245
(19.3%)
25,215
21,065
19.7%
Total Sales
54,181
93,349
(42.0%)
94,824
100,956
(6.1%)
Gross Profit Manufacturing Activities—Angelica
11,245
37,816
(55.9%)
16,686
38,262
(56.4%)
Gross Profit Manufacturing Activities—UMA
2,244
3,466
120.4%
7,641
5,252
45.5%
Gross Profit Manufacturing Activities
13,489
41,282
(67.3%)
24,327
43,514
(44.1%)
Adjusted EBITDA Angelica
13,850
46,578
(70.3%)
8,631
42,337
(79.6%)
Adjusted EBITDA UMA
(325)
2,864
(111.4%)
147
1,664
(91.2%)
Total Adjusted EBITDA
13,524
49,442
(72.6%)
8,778
44,001
(80.0%)
Adjusted EBITDA Margin Angelica
33.7%
60.4%
(44.2%)
12.4%
53.0%
(76.6%)
Adjusted EBITDA Margin UMA
(2.5%)
17.6%
(114.1%)
0.6%
7.9%
(92.6%)
Adjusted EBITDA Margin Total
25.0%
53.0%
(52.9%)
9.3%
43.6%
(78.8%)
1) Net Sales are calculated as Gross Sales net of sales taxes.
Adecoagro’s Sugar,
Ethanol
and
Energy
business
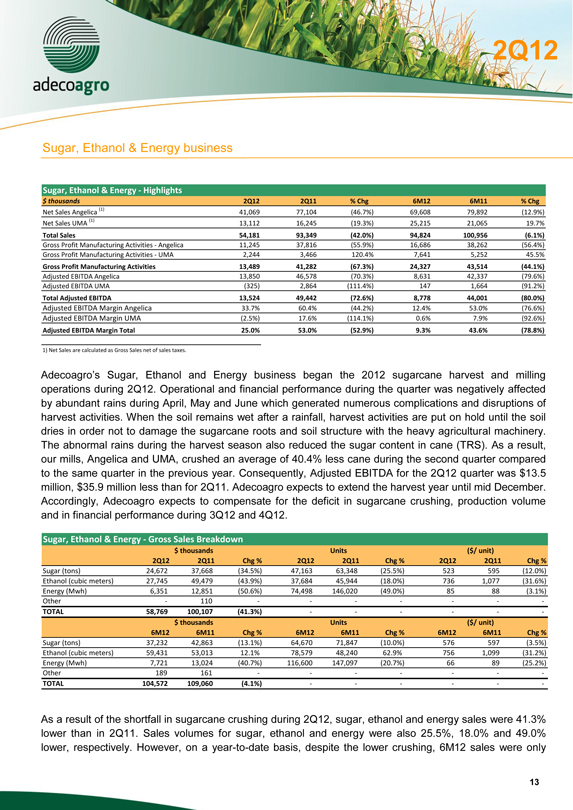
operations during 2Q12. Operational and financial performance during the quarter was negatively affected by abundant rains during April, May and June which generated numerous complications and disruptions of harvest activities. When the soil remains wet after a rainfall, harvest activities are put on hold until the soil dries in order not to damage the sugarcane roots and soil structure with the heavy agricultural machinery. The abnormal rains during the harvest season also reduced the sugar content in cane (TRS). As a result, our mills, Angelica and UMA, crushed an average of 40.4% less cane during the second quarter compared to the same quarter in the previous year. Consequently, Adjusted EBITDA for the 2Q12 quarter was $13.5 million, $35.9 million less than for 2Q11. Adecoagro expects to extend the harvest year until mid December. Accordingly, Adecoagro expects to compensate for the deficit in sugarcane crushing, production volume and in financial performance during 3Q12 and 4Q12.
Sugar, Ethanol & Energy - Gross Sales Breakdown
$ thousands
Units
($/ unit)
2Q12
2Q11
Chg %
2Q12
2Q11
Chg %
2Q12
2Q11
Chg %
Sugar (tons)
24,672
37,668
(34.5%)
47,163
63,348
(25.5%)
523
595
(12.0%)
Ethanol (cubic meters)
27,745
49,479
(43.9%)
37,684
45,944
(18.0%)
736
1,077
(31.6%)
Energy (Mwh)
6,351
12,851
(50.6%)
74,498
146,020
(49.0%)
85
88
(3.1%)
Other
—
110
—
—
—
—
—
—
—
TOTAL
58,769
100,107
(41.3%)
—
—
—
—
—
—
$ thousands
Units
($/ unit)
6M12
6M11
Chg %
6M12
6M11
Chg %
6M12
6M11
Chg %
Sugar (tons)
37,232
42,863
(13.1%)
64,670
71,847
(10.0%)
576
597
(3.5%)
Ethanol (cubic meters)
59,431
53,013
12.1%
78,579
48,240
62.9%
756
1,099
(31.2%)
Energy (Mwh)
7,721
13,024
(40.7%)
116,600
147,097
(20.7%)
66
89
(25.2%)
Other
189
161
—
—
—
—
—
—
—
TOTAL
104,572
109,060
(4.1%)
—
—
—
—
—
—
As a result of the shortfall in sugarcane crushing during 2Q12, sugar, ethanol and energy sales were 41.3% lower than in 2Q11. Sales volumes for sugar, ethanol and energy were also 25.5%, 18.0% and 49.0% lower, respectively. However, on a year-to-date basis, despite the lower crushing, 6M12 sales were only
2Q12
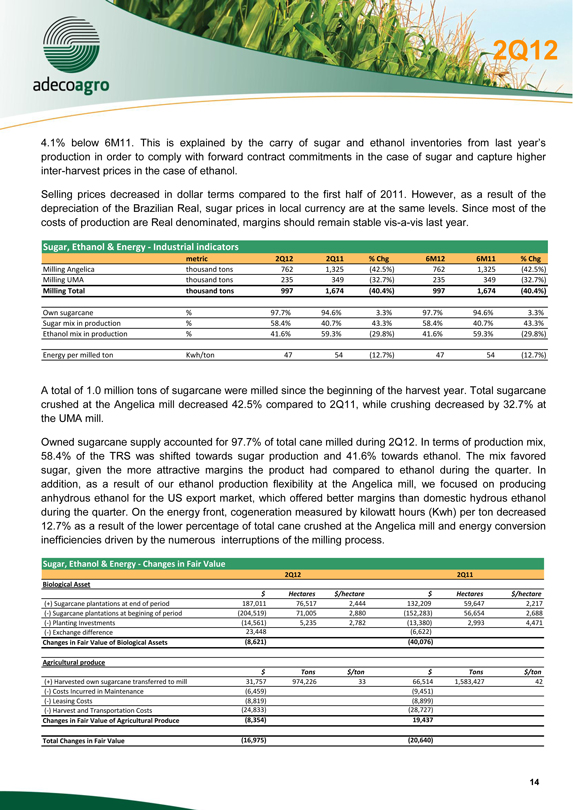
4.1% below 6M11. This is explained by the carry of sugar and ethanol
production in order to comply with forward contract commitments in the case of sugar and capture higher inter-harvest prices in the case of ethanol.
Selling prices decreased in dollar terms compared to the first half of 2011. However, as a result of the depreciation of the Brazilian Real, sugar prices in local currency are at the same levels. Since most of the costs of production are Real denominated, margins should remain stable vis-a-vis last year.
Sugar, Ethanol & Energy - Industrial indicators
metric
2Q12
2Q11
% Chg
6M12
6M11
% Chg
Milling Angelica
thousand tons
762
1,325
(42.5%)
762
1,325
(42.5%)
Milling UMA
thousand tons
235
349
(32.7%)
235
349
(32.7%)
Milling Total
thousand tons
997
1,674
(40.4%)
997
1,674
(40.4%)
Own sugarcane
%
97.7%
94.6%
3.3%
97.7%
94.6%
3.3%
Sugar mix in production
%
58.4%
40.7%
43.3%
58.4%
40.7%
43.3%
Ethanol mix in production
%
41.6%
59.3%
(29.8%)
41.6%
59.3%
(29.8%)
Energy per milled ton
Kwh/ton
47
54
(12.7%)
47
54
(12.7%)
A total of 1.0 million tons of sugarcane were milled since the beginning of the harvest year. Total sugarcane crushed at the Angelica mill decreased 42.5% compared to 2Q11, while crushing decreased by 32.7% at the UMA mill.
Owned sugarcane supply accounted for 97.7% of total cane milled during 2Q12. In terms of production mix,
58.4% of the TRS was shifted towards sugar production and 41.6% towards ethanol. The mix favored sugar, given the more attractive margins the product had compared to ethanol during the quarter. In addition, as a result of our ethanol production flexibility at the Angelica mill, we focused on producing anhydrous ethanol for the US export market, which offered better margins than domestic hydrous ethanol during the quarter. On the energy front, cogeneration measured by kilowatt hours (Kwh) per ton decreased
12.7% as a result of the lower percentage of total cane crushed at the Angelica mill and energy conversion
inefficiencies driven by the numerous interruptions of the milling process.
Sugar, Ethanol & Energy—Changes in Fair Value
2Q12
2Q11
Biological Asset
$
Hectares
$/hectare
$
Hectares
$/hectare
(+) Sugarcane plantations at end of period
187,011
76,517
2,444
132,209
59,647
2,217
(-) Sugarcane plantations at begining of period
(204,519)
71,005
2,880
(152,283)
56,654
2,688
(-) Planting Investments
(14,561)
5,235
2,782
(13,380)
2,993
4,471
(-) Exchange difference
23,448
(6,622)
Changes in Fair Value of Biological Assets
(8,621)
(40,076)
Agricultural produce
$
Tons
$/ton
$
Tons
$/ton
(+) Harvested own sugarcane transferred to mill
31,757
974,226
33
66,514
1,583,427
42
(-) Costs Incurred in Maintenance
(6,459)
(9,451)
(-) Leasing Costs
(8,819)
(8,899)
(-) Harvest and Transportation Costs
(24,833)
(28,727)
Changes in Fair Value of Agricultural Produce
(8,354)
19,437
Total Changes in Fair Value
(16,975)
(20,640)
2Q12
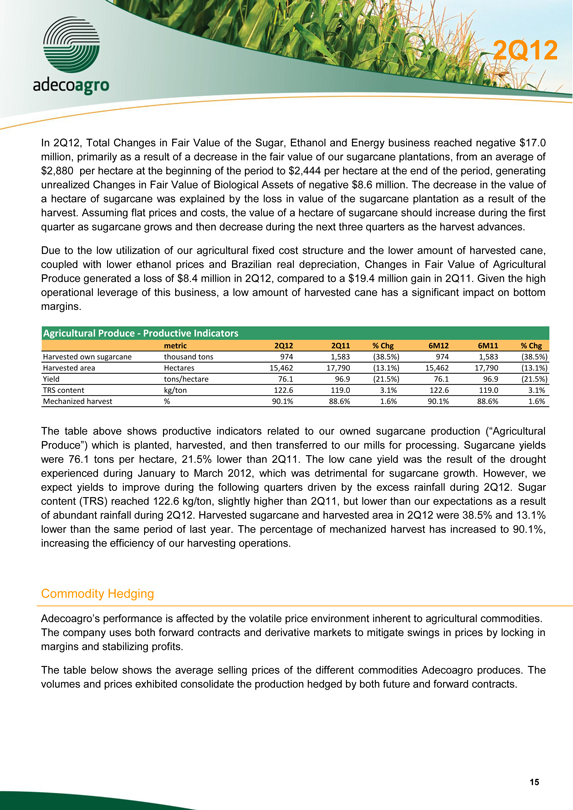
In 2Q12, Total Changes in Fair Value of the Sugar, Ethanol and Energy business reached negative $17.0 million, primarily as a result of a decrease in the fair value of our sugarcane plantations, from an average of $2,880 per hectare at the beginning of the period to $2,444 per hectare at the end of the period, generating unrealized Changes in Fair Value of Biological Assets of negative $8.6 million. The decrease in the value of a hectare of sugarcane was explained by the loss in value of the sugarcane plantation as a result of the harvest. Assuming flat prices and costs, the value of a hectare of sugarcane should increase during the first quarter as sugarcane grows and then decrease during the next three quarters as the harvest advances.
Due to the low utilization of our agricultural fixed cost structure and the lower amount of harvested cane, coupled with lower ethanol prices and Brazilian real depreciation, Changes in Fair Value of Agricultural Produce generated a loss of $8.4 million in 2Q12, compared to a $19.4 million gain in 2Q11. Given the high operational leverage of this business, a low amount of harvested cane has a significant impact on bottom margins.
Agricultural Produce - Productive Indicators
metric
2Q12
2Q11
% Chg
6M12
6M11
% Chg
Harvested own sugarcane
thousand tons
974
1,583
(38.5%)
974
1,583
(38.5%)
Harvested area
Hectares
15,462
17,790
(13.1%)
15,462
17,790
(13.1%)
Yield
tons/hectare
76.1
96.9
(21.5%)
76.1
96.9
(21.5%)
TRS content
kg/ton
122.6
119.0
3.1%
122.6
119.0
3.1%
Mechanized harvest
%
90.1%
88.6%
1.6%
90.1%
88.6%
1.6%
The table above shows productive indicators related Produce”) which is planted, harvested, ills for processing.and Sugarcane then yields
were 76.1 tons per hectare, 21.5% lower than 2Q11. The low cane yield was the result of the drought experienced during January to March 2012, which was detrimental for sugarcane growth. However, we expect yields to improve during the following quarters driven by the excess rainfall during 2Q12. Sugar content (TRS) reached 122.6 kg/ton, slightly higher than 2Q11, but lower than our expectations as a result of abundant rainfall during 2Q12. Harvested sugarcane and harvested area in 2Q12 were 38.5% and 13.1% lower than the same period of last year. The percentage of mechanized harvest has increased to 90.1%, increasing the efficiency of our harvesting operations.
Commodity Hedging
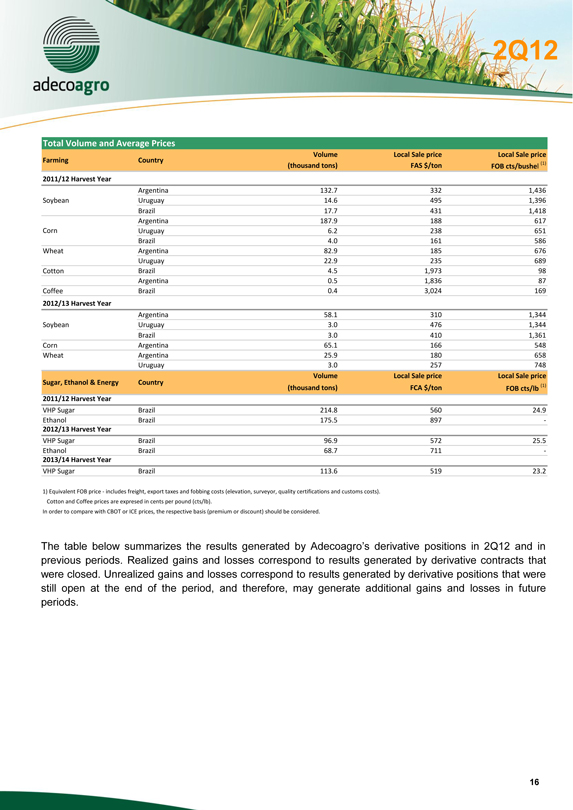
Adecoagro’s performance is affected by the volatile The company uses both forward contracts and derivative markets to mitigate swings in prices by locking in margins and stabilizing profits.
The table below shows the average selling prices of the different commodities Adecoagro produces. The volumes and prices exhibited consolidate the production hedged by both future and forward contracts.
2Q12
Total Volume and Average Prices
Volume
Local Sale price
Local Sale price
Farming
Country
(thousand tons)
FAS $/ton
FOB cts/bushel (1)
2011/12 Harvest Year
Argentina
132.7
332
1,436
Soybean
Uruguay
14.6
495
1,396
Brazil
17.7
431
1,418
Argentina
187.9
188
617
Corn
Uruguay
6.2
238
651
Brazil
4.0
161
586
Wheat
Argentina
82.9
185
676
Uruguay
22.9
235
689
Cotton
Brazil
4.5
1,973
98
Argentina
0.5
1,836
87
Coffee
Brazil
0.4
3,024
169
2012/13 Harvest Year
Argentina
58.1
310
1,344
Soybean
Uruguay
3.0
476
1,344
Brazil
3.0
410
1,361
Corn
Argentina
65.1
166
548
Wheat
Argentina
25.9
180
658
Uruguay
3.0
257
748
Volume
Local Sale price
Local Sale price
Sugar, Ethanol & Energy
Country
(thousand tons)
FCA $/ton
FOB cts/lb (1)
2011/12 Harvest Year
VHP Sugar
Brazil
214.8
560
24.9
Ethanol
Brazil
175.5
897
—
2012/13 Harvest Year
VHP Sugar
Brazil
96.9
572
25.5
Ethanol
Brazil
68.7
711
—
2013/14 Harvest Year
VHP Sugar
Brazil
113.6
519
23.2
1) Equivalent FOB price—includes freight, export taxes and fobbing costs (elevation, surveyor, quality certifications and customs costs).
Cotton and Coffee prices are expresed in cents per pound (cts/lb).
In order to compare with CBOT or ICE prices, the respective basis (premium or discount) should be considered.
The table below summarizes the
results generated by
Adecoagro’s
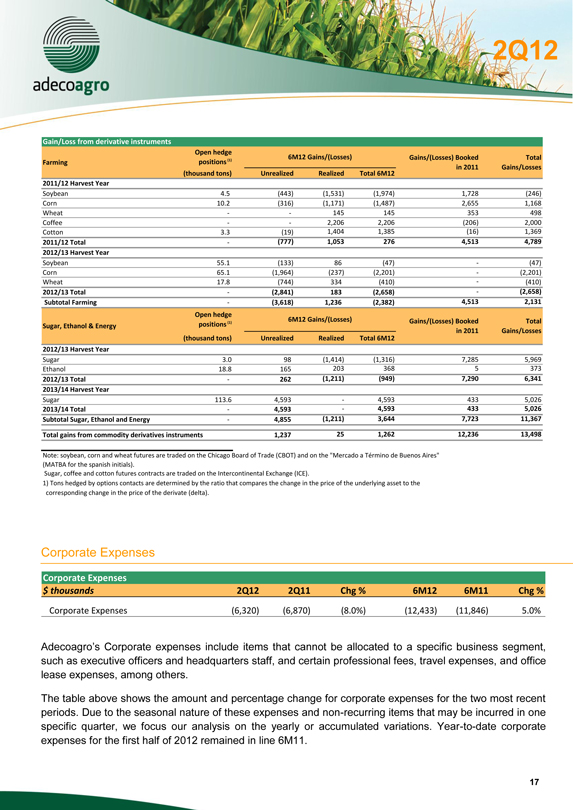
previous periods. Realized gains and losses correspond to results generated by derivative contracts that were closed. Unrealized gains and losses correspond to results generated by derivative positions that were still open at the end of the period, and therefore, may generate additional gains and losses in future periods.
2Q12
Gain/Loss from derivative instruments
Open hedge
6M12 Gains/(Losses)
Gains/(Losses) Booked
Total
Farming
positions (1)
in 2011
Gains/Losses
(thousand tons)
Unrealized
Realized
Total 6M12
2011/12 Harvest Year
Soybean
4.5
(443)
(1,531)
(1,974)
1,728
(246)
Corn
10.2
(316)
(1,171)
(1,487)
2,655
1,168
Wheat
—
—
145
145
353
498
Coffee
—
—
2,206
2,206
(206)
2,000
Cotton
3.3
(19)
1,404
1,385
(16)
1,369
2011/12 Total
—
(777)
1,053
276
4,513
4,789
2012/13 Harvest Year
Soybean
55.1
(133)
86
(47)
—
(47)
Corn
65.1
(1,964)
(237)
(2,201)
—
(2,201)
Wheat
17.8
(744)
334
(410)
—
(410)
2012/13 Total
—
(2,841)
183
(2,658)
—
(2,658)
Subtotal Farming
—
(3,618)
1,236
(2,382)
4,513
2,131
Open hedge
Sugar, Ethanol & Energy
positions (1)
6M12 Gains/(Losses)
Gains/(Losses) Booked
Total
in 2011
Gains/Losses
(thousand tons)
Unrealized
Realized
Total 6M12
2012/13 Harvest Year
Sugar
3.0
98
(1,414)
(1,316)
7,285
5,969
Ethanol
18.8
165
203
368
5
373
2012/13 Total
—
262
(1,211)
(949)
7,290
6,341
2013/14 Harvest Year
Sugar
113.6
4,593
—
4,593
433
5,026
2013/14 Total
—
4,593
—
4,593
433
5,026
Subtotal Sugar, Ethanol and Energy
—
4,855
(1,211)
3,644
7,723
11,367
Total gains from commodity derivatives instruments
1,237
25
1,262
12,236
13,498
Corporate Expenses
Corporate Expenses
$ thousands
2Q12
2Q11
Chg %
6M12
6M11
Chg %
Corporate Expenses
(6,320)
(6,870)
(8.0%)
(12,433)
(11,846)
5.0%
Note: soybean, corn and wheat futures are traded on the Chicago Board of Trade (CBOT) and on the “Mercado a Término de Buenos Aires” (MATBA for the spanish initials).
Sugar, coffee and cotton futures contracts are traded on the Intercontinental Exchange (ICE).
1) Tons hedged by options contacts are determined by the ratio that compares the change in the price of the underlying asset to the
corresponding change in the price of the derivate (delta).
Adecoagro’sexpenses Corporate include items that cannot be allocated to a specific business segment, such as executive officers and headquarters staff, and certain professional fees, travel expenses, and office lease expenses, among others.
The table above shows the amount and percentage change for corporate expenses for the two most recent periods. Due to the seasonal nature of these expenses and non-recurring items that may be incurred in one specific quarter, we focus our analysis on the yearly or accumulated variations. Year-to-date corporate expenses for the first half of 2012 remained in line 6M11.
2Q12
Other Operating Income
Other Operating Income
Concept
2Q12
2Q11
Chg %
6M12
6M11
Chg %
Gain/(Loss) from commodity derivative financial instruments
7,457
2,163
244.7%
1,262
3,649
(65.4%)
Loss from forward contracts
(160)
1,712
— %
(1,731)
(5,632)
(69.3%)
Gain from disposal of subsidiary
7,963
—
— %
7,963
—
— %
Gain/(Loss) from disposal of other property items
(946)
117
— %
(385)
335
— %
Others
1,742
1,400
24.5%
1,252
1,344
(6.8%)
Total
16,056
5,392
197.8%
8,361
(304)
— %
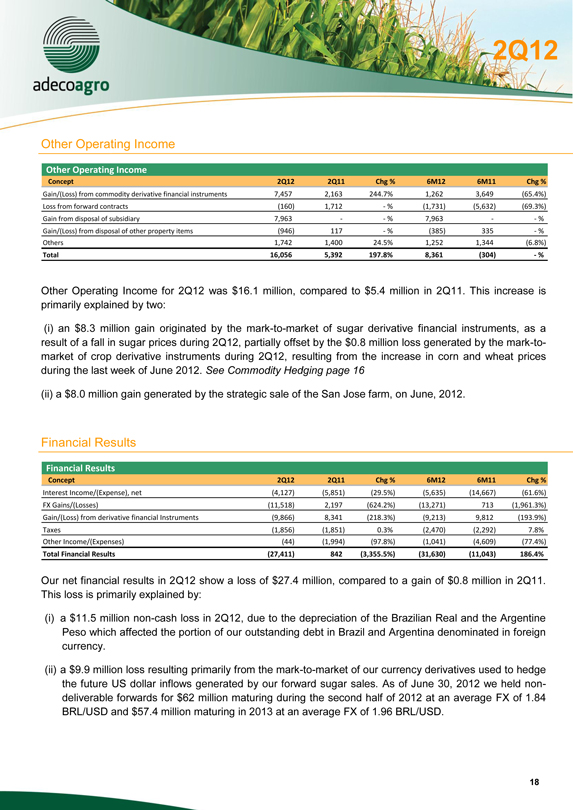
Other Operating Income for 2Q12 was $16.1 million, compared to $5.4 million in 2Q11. This increase is primarily explained by two:
(i) an $8.3 million gain originated by the mark-to-market of sugar derivative financial instruments, as a result of a fall in sugar prices during 2Q12, partially offset by the $0.8 million loss generated by the mark-to-market of crop derivative instruments during 2Q12, resulting from the increase in corn and wheat prices during the last week of June 2012. See Commodity Hedging page 16
(ii) a $8.0 million gain generated by the strategic sale of the San Jose farm, on June, 2012.
Financial Results
Financial Results
Concept
2Q12
2Q11
Chg %
6M12
6M11
Chg %
Interest Income/(Expense), net
(4,127)
(5,851)
(29.5%)
(5,635)
(14,667)
(61.6%)
FX Gains/(Losses)
(11,518)
2,197
(624.2%)
(13,271)
713
(1,961.3%)
Gain/(Loss) from derivative financial Instruments
(9,866)
8,341
(218.3%)
(9,213)
9,812
(193.9%)
Taxes
(1,856)
(1,851)
0.3%
(2,470)
(2,292)
7.8%
Other Income/(Expenses)
(44)
(1,994)
(97.8%)
(1,041)
(4,609)
(77.4%)
Total Financial Results
(27,411)
842
(3,355.5%)
(31,630)
(11,043)
186.4%
Our net financial results in 2Q12 show a loss of $27.4 million, compared to a gain of $0.8 million in 2Q11. This loss is primarily explained by:
(i) a $11.5 million non-cash loss in 2Q12, due to the depreciation of the Brazilian Real and the Argentine Peso which affected the portion of our outstanding debt in Brazil and Argentina denominated in foreign currency.
(ii) a $9.9 million loss resulting primarily from the mark-to-market of our currency derivatives used to hedge the future US dollar inflows generated by our forward sugar sales. As of June 30, 2012 we held non- deliverable forwards for $62 million maturing during the second half of 2012 at an average FX of 1.84 BRL/USD and $57.4 million maturing in 2013 at an average FX of 1.96 BRL/USD.
2Q12
Indebtedness
Net Debt Breakdown
$ thousands
2Q12
1Q12
Chg %
Short Term Debt
230,469
183,337
25.7%
Farming
98,908
80,080
23.5%
Sugar, Ethanol & Energy
131,561
103,257
27.4%
Long Term Debt
205,823
223,194
(7.8%)
Farming
66,760
87,863
(24.0%)
Sugar, Ethanol & Energy
139,063
135,331
2.8%
Total Debt
436,292
406,531
7.3%
Cash & Equivalents (1)
233,743
282,910
(17.4%)
Net Debt
202,549
123,621
63.8%
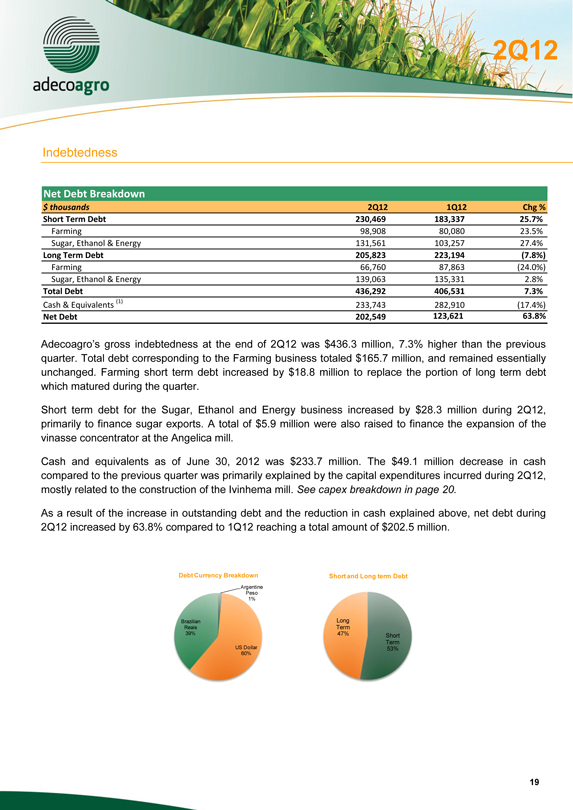
Adecoagro’s debtedness gross at the end in of 2Q12 was $436.3 million, 7.3% higher than the previous quarter. Total debt corresponding to the Farming business totaled $165.7 million, and remained essentially unchanged. Farming short term debt increased by $18.8 million to replace the portion of long term debt which matured during the quarter.
Short term debt for the Sugar, Ethanol and Energy business increased by $28.3 million during 2Q12, primarily to finance sugar exports. A total of $5.9 million were also raised to finance the expansion of the vinasse concentrator at the Angelica mill.
Cash and equivalents as of June 30, 2012 was $233.7 million. The $49.1 million decrease in cash compared to the previous quarter was primarily explained by the capital expenditures incurred during 2Q12, mostly related to the construction of the Ivinhema mill. See capex breakdown in page 20.
As a result of the increase in outstanding debt and the reduction in cash explained above, net debt during 2Q12 increased by 63.8% compared to 1Q12 reaching a total amount of $202.5 million.
Debt Currency Breakdown
Short and Long term Debt
Argentine
Peso
1%
2Q12
Capital Expenditures & Investments
Capital Expenditures & Investments
$ thousands
2Q12
2Q11
Chg %
6M12
6M11
Chg %
Farming & Land Transformation
9,199
3,418
169.1%
16,355
6,603
147.7%
Land Acquisitions
—
—
— %
—
—
— %
Land Transformation
2,596
579
348.2%
4,633
1,410
228.5%
Rice Mill Construction
2,557
2,252
13.5%
4,516
3,814
18.4%
Dairy Free Stall Unit
3,029
145
1,984.9%
5,179
145
3,464.9%
Others
1,016
441
130.4%
2,028
1,233
64.4%
Sugar, Ethanol & Energy
55,721
20,066
177.7%
154,549
38,363
302.9%
Sugar & Ethanol Mills
41,159
6,687
515.6%
113,286
10,208
1,009.8%
Sugarcane Planting
14,561
13,380
8.8%
41,263
28,155
46.6%
Total
64,919
23,484
176.4%
170,904
44,966
280.1%
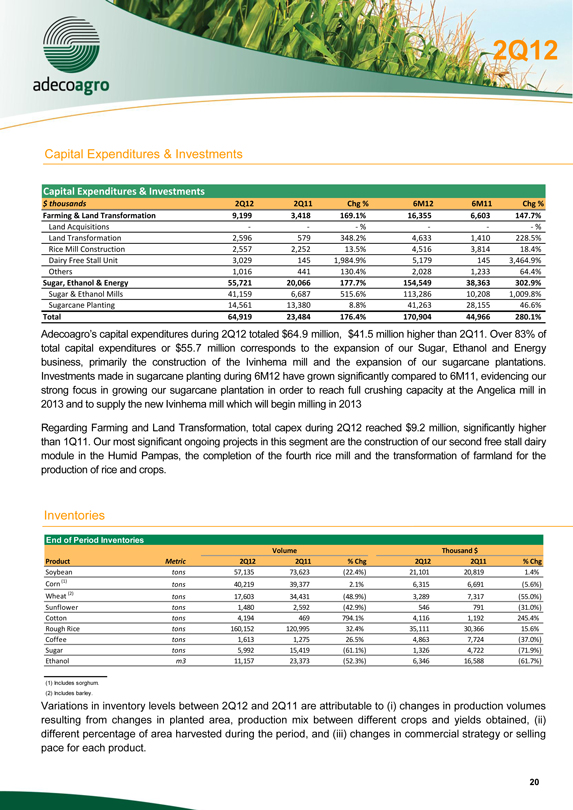
Adecoagro’ s capital expenditures during 2Q12 totaled $64.9 million, $41.5 million higher than 2Q11. Over 83% of
total capital expenditures or $55.7 million corresponds to the expansion of our Sugar, Ethanol and Energy business, primarily the construction of the Ivinhema mill and the expansion of our sugarcane plantations. Investments made in sugarcane planting during 6M12 have grown significantly compared to 6M11, evidencing our strong focus in growing our sugarcane plantation in order to reach full crushing capacity at the Angelica mill in 2013 and to supply the new Ivinhema mill which will begin milling in 2013
Regarding Farming and Land Transformation, total capex during 2Q12 reached $9.2 million, significantly higher than 1Q11. Our most significant ongoing projects in this segment are the construction of our second free stall dairy module in the Humid Pampas, the completion of the fourth rice mill and the transformation of farmland for the production of rice and crops.
Inventories
End of Period Inventories
Volume
Thousand $
Product
Metric
2Q12
2Q11
% Chg
2Q12
2Q11
% Chg
Soybean
tons
57,135
73,623
(22.4%)
21,101
20,819
1.4%
Corn (1)
tons
40,219
39,377
2.1%
6,315
6,691
(5.6%)
Wheat (2)
tons
17,603
34,431
(48.9%)
3,289
7,317
(55.0%)
Sunflower
tons
1,480
2,592
(42.9%)
546
791
(31.0%)
Cotton
tons
4,194
469
794.1%
4,116
1,192
245.4%
Rough Rice
tons
160,152
120,995
32.4%
35,111
30,366
15.6%
Coffee
tons
1,613
1,275
26.5%
4,863
7,724
(37.0%)
Sugar
tons
5,992
15,419
(61.1%)
1,326
4,722
(71.9%)
Ethanol
m3
11,157
23,373
(52.3%)
6,346
16,588
(61.7%)
(1) Includes sorghum.
(2) Includes barley.
Variations in inventory levels between 2Q12 and 2Q11 are attributable to (i) changes in production volumes resulting from changes in planted area, production mix between different crops and yields obtained, (ii) different percentage of area harvested during the period, and (iii) changes in commercial strategy or selling pace for each product.
2Q12
Forward -looking Statements
This press release contains forward-looking statements that are based on our current expectations, assumptions, estimates and projections about us and our industry. These forward-looking statements can be identified by words or phrases such as “anticipate,” “forecast”, ikely “may,” “plan,” “should,” “would,” or other similar
The forward-looking statements included in this press release relate to, among others: (i) our business prospects and future results of operations; (ii) weather and other natural phenomena; (iii) developments in, or changes to, the laws, regulations and governmental policies governing our business, including limitations on ownership of farmland by foreign entities in certain jurisdictions in which we operate, environmental laws and regulations; (iv) the implementation of our business strategy, including our development of the Ivinhema mill and other current projects; (v) our plans relating to acquisitions, joint ventures, strategic alliances or divestitures; (vi) the implementation of our financing strategy and capital expenditure plan; (vii) the maintenance of our relationships with customers; (viii) the competitive nature of the industries in which we operate; (ix) the cost and availability of financing; (x) future demand for the commodities we produce; (xi) international prices for commodities; (xii) the condition of our land holdings; (xiii) the development of the logistics and infrastructure for transportation of our products in the countries where we operate; (xiv) the performance of the South American and world economies; and (xv) the relative value of the Brazilian Real, the Argentine Peso, and the Uruguayan Peso compared to other currencies; as well as other risks included in our other filings and submissions with the United States Securities and Exchange Commission.
These forward-looking statements involve various risks and uncertainties. Although we believe that our expectations expressed in these forward-looking statements are reasonable, our expectations may turn out to be incorrect. Our actual results could be materially different from our expectations. In light of the risks and uncertainties described above, the estimates and forward-looking statements discussed in this press release might not occur, and our future results and our performance may differ materially from those expressed in these forward-looking statements due to, inclusive, but not limited to, the factors mentioned above. Because of these uncertainties, you should not make any investment decision based on these estimates and forward-looking statements.
The forward-looking statements made in this press release related only to events or information as of the date on which the statements are made in this press release. We undertake no obligation to update any forward-looking statements to reflect events or circumstances after the date on which the statements are made or to reflect the occurrence of unanticipated events.
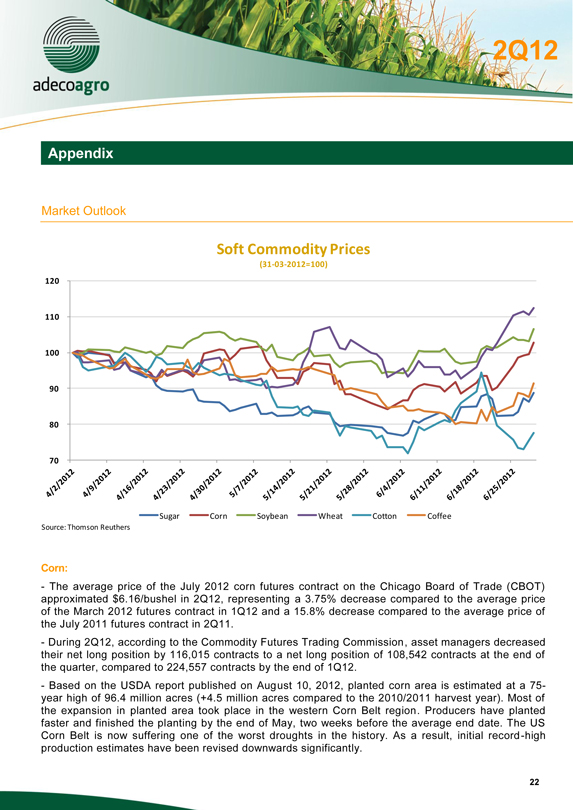
- The average price of the July 2012 corn futures contract on the Chicago Board of Trade (CBOT) approximated $6.16/bushel in 2Q12, representing a 3.75% decrease compared to the average price of the March 2012 futures contract in 1Q12 and a 15.8% decrease compared to the average price of the July 2011 futures contract in 2Q11.
- During 2Q12, according to the Commodity Futures Trading Commission, asset managers decreased their net long position by 116,015 contracts to a net long position of 108,542 contracts at the end of the quarter, compared to 224,557 contracts by the end of 1Q12.
- Based on the USDA report published on August 10, 2012, planted corn area is estimated at a 75-year high of 96.4 million acres (+4.5 million acres compared to the 2010/2011 harvest year). Most of the expansion in planted area took place in the western Corn Belt region. Producers have planted faster and finished the planting by the end of May, two weeks before the average end date. The US Corn Belt is now suffering one of the worst droughts in the history. As a result, initial record-high production estimates have been revised downwards significantly.
Corn:
2Q12
- As of August 6, 2012, 23% of the crop was rated good to excellent, the second lowest after 1988; 50% of the crop was rated poor and very poor, the highest bad rate of ever. The USDA ‘s monthly report, dated August 10, 2012, reported an estimated yield of 123.4 bu/acre and a production of 10,779 million bushels compared to the 12,970 million bushel production estimated in July 2012. As a result of the adjustment to supply and demand, US stock-to-use ratio is forecasted at 5.8%, by the end of the year.
- In South America, the 2011/12 harvest year production is expected to be 10% higher than the 2010/11 harvest as a result of an increase in the production of Brazilian safrinha crops, which now account for more than 50% of total production. Brazilian ports are working at full ca pacity with a competitive basis on the export market.
- For the week ended August 2, 2012, corn export sales decreased to 174,700 metric tons for the 2011/2012 marketing year, 2.5% below export sales for the previous week. According to USDA estimates, as of August 2, 2012, 97% of total estimated exports were completed. USDA lowered US exports by 300 million bushels.
- US weekly ethanol production for the week ended August 02, 2012 was 817 thousand barrels per day, 9 thousand barrels per day above production for the previous week. US corn usage for ethanol is estimated at 4,500 million bushels for the 2011/2012 harvest year, 400 million bushels lower than the July USDA report. USDA lowered US ethanol demand by 400 million bushels.
Soybean:
- The average price for the July 2012 soybean futures contract on CBOT approximated $14.24 per bushel in 2Q12, representing a 12% increase compared to the average price of the March 2012 futures contract in 1Q12 and a 4.6% increase compared to the average price of the J uly 2011 futures contract in 2Q11.
- During 2Q12, according to the Commodity Futures Trading Commission, asset managers increased their net long position by 22,587 contracts to a net long position of 232,589 contracts at the end of the quarter, compared to 210,002 contracts by the end of 1Q12.
- Based on the USDA report published on August 10, 2012, planted soybean area is estimated at
76.1 million acres (+1.1 million acres compared to 11/12). Soybeans were also planted at a record fast pace, and suffered from the North American drought, which has decreased estimated yields significantly. As a consequence, the USDA decreased the US national yield from 40.5 to 36.1 bu/acre. On August 6, 2012, only 29% of US crops were rated good to excellent, considerably below the 5-year average of 61%.
- Globally, Chinese imports totaled 5.62 million tons in June (+31% year-over-year), which represents 38 million accumulated tons since the beginning of the marketing year (+13% year-over-year). As of August 8, uncertainty remains regarding whether South American producers plan to plant more corn as a result of the decrease in the soybean-to-corn price ratio from 2.34 to 1.96 between May and June. Brazilian production could reach a historic high of 80 million tons while Arge ntina is expected to plant 20 million hectares of soybeans and achieve production of approximately 56 million tons.
2Q12
Wheat:
- The average price of the July 2012 wheat futures contract on CBOT approximated $6.41/bushel in 2Q12, a 0.4% decrease compared to the average price of the March 2012 future contract in 1Q12 and a 14% decrease compared to the average price of the July 2011 future contract in 2Q11.
- During 2Q12, according to the Commodity Futures Trading Commission, asset managers decreased their net short position by 71,586 contracts to a net long position of 40,194 contracts at the end of the quarter, compared to a short position of 31,392 contracts by the end of 1Q12.
- US 2012 planted wheat area was reported at 56 million acres, 1.5 million below the average trade estimate, and harvested area is estimated at 48.8 million acres. The USDA rated 63% of the spring wheat planted in the United States from good to excellent as of August 6, 2012, with no change compared to the previous week.
- Export sales were up 29% to 665,300 metric tons during the week ended August 02, 2012. USDA official export projections stand at 32.6 million tons while accumulated exports since the beginning of the marketing year are at 9.6 million tons.
- The Black Sea region is facing difficult climatic conditions which will have a significant impact on regional production. For example, Ukraine production is forecasted at 11 million tons, a 50% decrease compared to the past cycle, whereas Russia is expected to produce 42 million tons of wheat, a 23% decrease year-over-year. Australia’s ed atharvest 23 million tons, a is 10% forecast decrease year-over-year, primarily as a result of excessive rains.
- In South America, Argentina is expected to plant 3.7 million hectares, a 30% decrease year-over-year, which will result in decreased wheat production, from approximately 14 million tons down to 11 million. Brazil is also expected to decrease its wheat production, due to a 12.6% reduction in planted area compared to the 2011/2012 harvest year, which could result in a 13% decline in production.
Cotton:
- The average price of the July 2012 cotton future contract traded on ICE Futures U.S. (ICE) was US¢ 80.7 per pound in 2Q12. This represents a 13% decrease compared to the March 2012 future contract in 1Q12 and a 52% decrease compared to the July 2011 future contract in 2Q11.
- During 2Q12, according to the Commodity Futures Trading Commission, asset managers increased their net short position by 1,869 contracts to a net short position of 2,817 contracts at the end of the quarter, compared to a short position of 948 contracts by the end of 1Q12.
- According to the USDA’s latest report, global
122.67 million bales. Global ending stocks of 67.8 million bales lead to a relatively high stock-to-use ratio of
64.3%, compared to 41% for the prior year. For the 2012/13 cycle, global production is expected to reach 114.11 million bales. 2012/13 global stock-to-use is estimated at a record high of 69%.
- Optimistic weather forecasts for the United States cotton area are expected to drive total production to
15.57 million bales during the 2011/12 cycle despite an area reduction of 14% year-over-year. US cotton exports were 10.05 million bales, 22.4% below the same period of the previous year. For the 2012/2013 harvest year, USDA estimates US planted area at 12.6 million acres, down 14.2% year-over-year.
- After a 20% jump to 42.26 million bales in 2011/12, the volume of cotton traded internationally is expected to drop by 18% to 34.9 million bales in 2012/13, according to the International Cotton Advisory Committee (ICAC).
2Q12
- For the 2011/2012 harvest year, Australian and Brazilian exports are 4.8 (+140% year-over-year) and 4.2 (+110% year-over-year) million bales, respectively. According to CONAB, Brazilian production may reach
8.7 million bales, 3.4% more than last year.
- India, the world’s second ed to export largest 10 million bales exporter, during the 2011/2012 is harvest year (+40% compared last year).
- Initial forecasts for the Brazil’s planted 2012/2013 area show a 35% reduction year-on-year, due to competition with corn and soybeans.
Rice:
- The average price for high-quality milled rice in the South American market was $540/ton FOB during 2Q12, compared to an average of $500/ton in 2Q11 and $520 in 1Q12.
- The Thai government’s rice mortgage scheme to Iraq was have decreased significantly to 400,000 tons, compared to the nearly 10MM tons in total exports in the
prior year. Stocks reached a record high of 15 MMT. There is uncertainty regarding the Thai government’s intended stocks. Prices plans remain relatively for high compared to other sources in
the region, but well below intervention equivalents.
- It is expected that India will continue with its aggressive export campaign as local stocks are abundant. Despite the lack of rainfall in some areas, there is no expected impact on the 2012/2013 crop, which is forecasted to be of approximately 100 MMT.
- The intra-block Mercosur trading continues to be thin. Brazil’s needs cannot be supplied from
Argentina and Uruguay due to the Brazilian Real currency depreciation. There is uncertainty regarding the Brazilian government’s plans related ply barriers to to imports, ap which are being encouraged by the producers.
Coffee:
- The average of the July 2012 coffee future contract traded on ICE was of US¢170/lb in 2Q12, a 17% decrease compared to the average price of the March 2012 future contract in 1Q12 and a 37% decrease compared to the average price of the July 2011 future contract in 2Q11.
- During 2Q12, according to CFTC, asset managers increased their net short position by 3,558 contracts to a net short position of 11,867 contracts by the end of the quarter.
- Current global production is estimated at 131.3 million bags by ICO, a decrease of 2.3% compared to the prior year. Since the beginning of the 2011/2012 marketing year, which started in October 2011, global trade totaled 70.6 million bags, a reduction of 2.3% compared to the 72.3 million bags for the same period in 2010/2011. With the exception of Vietnam and Mexico, exports have fallen in a number of major exporting countries during the first eight months of the 2011/2012 harvest year. Consumption for 2011/2012 is expected at 137.9 million bags, an increase of 0.6% compared to last year.
- Globally, Arabica production is expected to decrease by 5.2% from 85.2 million bags in 2010/11 to
80.8 million in 2011/12 while the production of Robusta is likely to increase from 49.2 million bags in 2010/11 to around 50.5 million in 2011/12.
- The ICO (International Coffee Organization) estimates the 2011/2012 Brazilian production at 43.8 million 60-kg bags while the USDA estimates 54.5 million bags. Brazil may become the
2Q12
largest coffee consumer in the coming years if interior demand continues increasing. From 2005 to 2011, domestic consumption increased 22% to 19.8 million bags.
- According to the ICO, Colombia is expected to produce 7.8 million bags in the 2011/2012 harvest year, a decrease of 8.3% compared to 2010/2012 harvest year.
Sugar and Ethanol:
- Following a very dry rainy season in Center-South Brazil, which hurt initial cane yields, the first two months of crushing were marked by higher-than-average rainfall (+127% compared to the historical average of São Paulo State). This reduced the available crushing days, increasing the number of idle days in June, from 5 last year to 11 this year. At the end of June, the total crush lagged beh ind the previous crop by 50 MM tons (-28%). In addition, rains have reduced the sucrose content of cane, negatively affecting the final production figures. The reduction Year-on-Year was of -29% for sugar and -32% in Europe.
—Anhydrous prices were up by 3% in the quarter (reaching 1,380 R$/m³ with taxes, ESALQ index), widening the spread against hydrous prices, from 5% to 24%. As a result of fewer inexpensive imports available in the market and, in relative terms, higher production of hydrous over anhydr ous. Hydrous prices fell by 11% in the period, being traded at 1,280 R$/m³ with taxes, ESALQ index.
- Meteorological models indicate a good probability of the El Niño phenomenon gaining strength in the 3Q12. The extent of losses in production caused by a delayed Indian monsoon, higher-than-average rainfall in Center-South Brazil and Australia and dry months in Brazil’s in Russia will determine prices and trade flows over the next few months.
2Q12
Segment Information—Reconciliation of Non-IFRS measures (Adjusted EBITDA & Adjusted EBIT) to Profit/(Loss)
We define Adjusted EBITDA for each of our operating segments profit from operations before financing and taxation for the year or period, as applicable, before depreciation and amortization and unrealized changes in fair value of long-term biological assets.
We define Adjusted EBIT for each of our operating from operations before financing and taxation for the year or period, as applicable, before unrealized changes in fair value of long-term biological assets.
We believe that Adjusted EBITDA and Adjusted EBIT are for the Company and each operating segment, respectively important measures of operating performance because they allow investors and others to evaluate and compare our consolidated operating results and to evaluate and compare the operating performance of our segments, respectively, including our return on capital and operating efficiencies, from period to period by removing the impact of our capital structure (interest expense from our outstanding debt), asset base (depreciation and amortization), tax consequences (income taxes), unrealized changes in fair value of long term biological assets (a significant non-cash gain or loss to our consolidated statements of income following IAS 41 accounting), foreign exchange gains or losses and other financial expenses. Other companies may calculate Adjusted EBITDA and Adjusted EBIT differently, and therefore Adjusted EBITDA and Adjusted EBIT may not be comparable to similarly titled measures used by other companies. Adjusted EBITDA and Adjusted EBIT are not a measures of financial performance under IFRS, and should not be considered in isolation or as an alternative to consolidated net profit (loss), cash flows from operating activities, profit from operations before financing and taxation and other measures determined in accordance with IFRS.
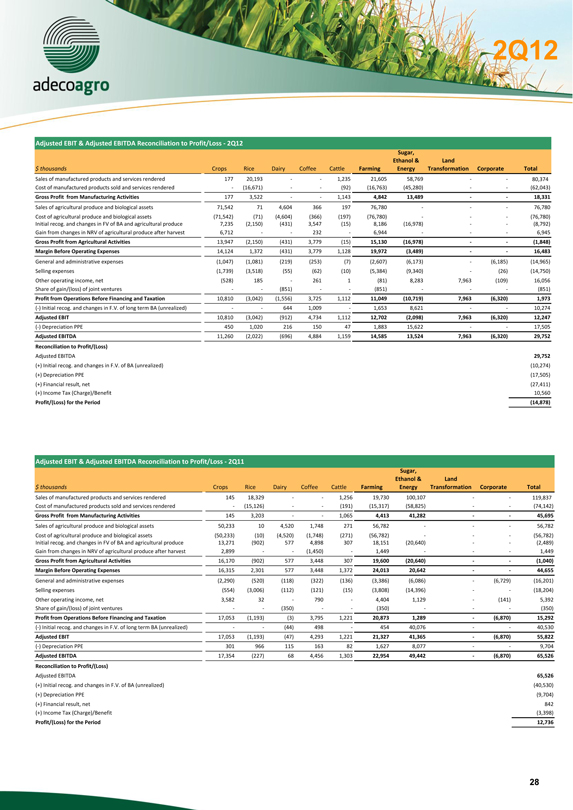
2Q12
Adjusted EBIT & Adjusted EBITDA Reconciliation to Profit/Loss - 2Q12
Sugar,
Ethanol &
Land
$ thousands
Crops
Rice
Dairy
Coffee
Cattle
Farming
Energy
Transformation Corporate
Total
Sales of manufactured products and services rendered
177
20,193
—
—
1,235
21,605
58,769
—
—
80,374
Cost of manufactured products sold and services rendered
—
(16,671)
—
—
(92)
(16,763)
(45,280)
—
—
(62,043)
Gross Profit from Manufacturing Activities
177
3,522
—
—
1,143
4,842
13,489
—
—
18,331
Sales of agricultural produce and biological assets
71,542
71
4,604
366
197
76,780
—
—
—
76,780
Cost of agricultural produce and biological assets
(71,542)
(71)
(4,604)
(366)
(197)
(76,780)
—
—
—
(76,780)
Initial recog. and changes in FV of BA and agricultural produce
7,235
(2,150)
(431)
3,547
(15)
8,186
(16,978)
—
—
(8,792)
Gain from changes in NRV of agricultural produce after harvest
6,712
—
—
232
—
6,944
—
—
—
6,945
Gross Profit from Agricultural Activities
13,947
(2,150)
(431)
3,779
(15)
15,130
(16,978)
—
—
(1,848)
Margin Before Operating Expenses
14,124
1,372
(431)
3,779
1,128
19,972
(3,489)
—
—
16,483
General and administrative expenses
(1,047)
(1,081)
(219)
(253)
(7)
(2,607)
(6,173)
—
(6,185)
(14,965)
Selling expenses
(1,739)
(3,518)
(55)
(62)
(10)
(5,384)
(9,340)
—
(26)
(14,750)
Other operating income, net
(528)
185
—
261
1
(81)
8,283
7,963
(109)
16,056
Share of gain/(loss) of joint ventures
—
—
(851)
—
—
(851)
—
—
—
(851)
Profit from Operations Before Financing and Taxation
10,810
(3,042)
(1,556)
3,725
1,112
11,049
(10,719)
7,963
(6,320)
1,973
(-) Initial recog. and changes in F.V. of long term BA (unrealized)
—
—
644
1,009
—
1,653
8,621
—
—
10,274
Adjusted EBIT
10,810
(3,042)
(912)
4,734
1,112
12,702
(2,098)
7,963
(6,320)
12,247
(-) Depreciation PPE
450
1,020
216
150
47
1,883
15,622
—
—
17,505
Adjusted EBITDA
11,260
(2,022)
(696)
4,884
1,159
14,585
13,524
7,963
(6,320)
29,752
Reconciliation to Profit/(Loss)
Adjusted EBITDA
29,752
(+) Initial recog. and changes in F.V. of BA (unrealized)
(10,274)
(+) Depreciation PPE
(17,505)
(+) Financial result, net
(27,411)
(+) Income Tax (Charge)/Benefit
10,560
Profit/(Loss) for the Period
(14,878)
Adjusted EBIT & Adjusted EBITDA Reconciliation to Profit/Loss—2Q11
Sugar,
Ethanol &
Land
$ thousands
Crops
Rice
Dairy
Coffee
Cattle
Farming
Energy
Transformation
Corporate
Total
Sales of manufactured products and services rendered
145
18,329
—
—
1,256
19,730
100,107
—
—
119,837
Cost of manufactured products sold and services rendered
—
(15,126)
—
—
(191)
(15,317)
(58,825)
—
—
(74,142)
Gross Profit from Manufacturing Activities
145
3,203
—
—
1,065
4,413
41,282
—
—
45,695
Sales of agricultural produce and biological assets
50,233
10
4,520
1,748
271
56,782
—
—
—
56,782
Cost of agricultural produce and biological assets
(50,233)
(10)
(4,520)
(1,748)
(271)
(56,782)
—
—
—
(56,782)
Initial recog. and changes in FV of BA and agricultural produce
13,271
(902)
577
4,898
307
18,151
(20,640)
—
—
(2,489)
Gain from changes in NRV of agricultural produce after harvest
2,899
—
—
(1,450)
—
1,449
—
—
—
1,449
Gross Profit from Agricultural Activities
16,170
(902)
577
3,448
307
19,600
(20,640)
—
—
(1,040)
Margin Before Operating Expenses
16,315
2,301
577
3,448
1,372
24,013
20,642
—
—
44,655
General and administrative expenses
(2,290)
(520)
(118)
(322)
(136)
(3,386)
(6,086)
—
(6,729)
(16,201)
Selling expenses
(554)
(3,006)
(112)
(121)
(15)
(3,808)
(14,396)
—
—
(18,204)
Other operating income, net
3,582
32
—
790
—
4,404
1,129
—
(141)
5,392
Share of gain/(loss) of joint ventures
—
—
(350)
—
—
(350)
—
—
—
(350)
Profit from Operations Before Financing and Taxation
17,053
(1,193)
(3)
3,795
1,221
20,873
1,289
—
(6,870)
15,292
(-) Initial recog. and changes in F.V. of long term BA (unrealized)
—
—
(44)
498
—
454
40,076
—
—
40,530
Adjusted EBIT
17,053
(1,193)
(47)
4,293
1,221
21,327
41,365
—
(6,870)
55,822
(-) Depreciation PPE
301
966
115
163
82
1,627
8,077
—
—
9,704
Adjusted EBITDA
17,354
(227)
68
4,456
1,303
22,954
49,442
—
(6,870)
65,526
Reconciliation to Profit/(Loss)
Adjusted EBITDA
65,526
(+) Initial recog. and changes in F.V. of BA (unrealized)
(40,530)
(+) Depreciation PPE
(9,704)
(+) Financial result, net
842
(+) Income Tax (Charge)/Benefit
(3,398)
Profit/(Loss) for the Period
12,736
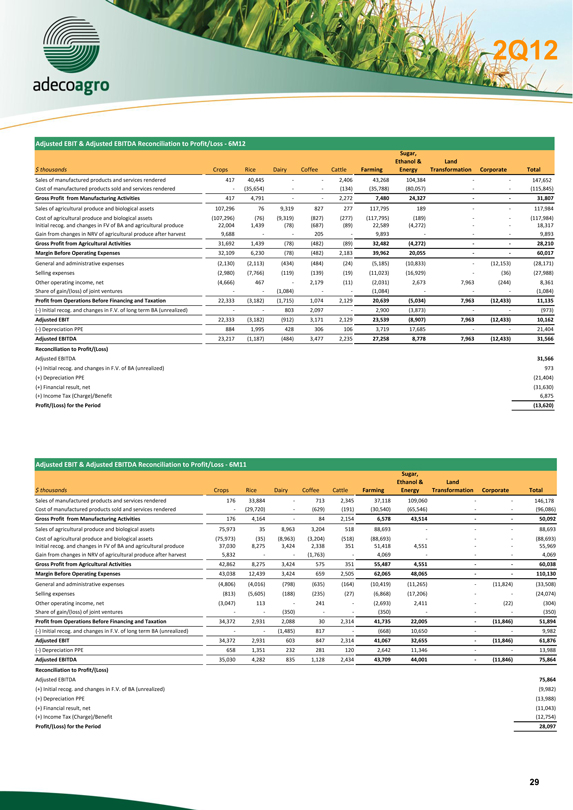
2Q12
Adjusted EBIT & Adjusted EBITDA Reconciliation to Profit/Loss - 6M12
Sugar,
Ethanol &
Land
$ thousands
Crops
Rice
Dairy
Coffee
Cattle
Farming
Energy
Transformation Corporate
Total
Sales of manufactured products and services rendered
417
40,445
—
—
2,406
43,268
104,384
—
—
147,652
Cost of manufactured products sold and services rendered
—
(35,654)
—
—
(134)
(35,788)
(80,057)
—
—
(115,845)
Gross Profit from Manufacturing Activities
417
4,791
—
—
2,272
7,480
24,327
—
—
31,807
Sales of agricultural produce and biological assets
107,296
76
9,319
827
277
117,795
189
—
—
117,984
Cost of agricultural produce and biological assets
(107,296)
(76)
(9,319)
(827)
(277)
(117,795)
(189)
—
—
(117,984)
Initial recog. and changes in FV of BA and agricultural produce
22,004
1,439
(78)
(687)
(89)
22,589
(4,272)
—
—
18,317
Gain from changes in NRV of agricultural produce after harvest
9,688
—
—
205
—
9,893
—
—
—
9,893
Gross Profit from Agricultural Activities
31,692
1,439
(78)
(482)
(89)
32,482
(4,272)
—
—
28,210
Margin Before Operating Expenses
32,109
6,230
(78)
(482)
2,183
39,962
20,055
—
—
60,017
General and administrative expenses
(2,130)
(2,113)
(434)
(484)
(24)
(5,185)
(10,833)
—
(12,153)
(28,171)
Selling expenses
(2,980)
(7,766)
(119)
(139)
(19)
(11,023)
(16,929)
—
(36)
(27,988)
Other operating income, net
(4,666)
467
—
2,179
(11)
(2,031)
2,673
7,963
(244)
8,361
Share of gain/(loss) of joint ventures
—
—
(1,084)
—
—
(1,084)
—
—
—
(1,084)
Profit from Operations Before Financing and Taxation
22,333
(3,182)
(1,715)
1,074
2,129
20,639
(5,034)
7,963
(12,433)
11,135
(-) Initial recog. and changes in F.V. of long term BA (unrealized)
—
—
803
2,097
—
2,900
(3,873)
—
—
(973)
Adjusted EBIT
22,333
(3,182)
(912)
3,171
2,129
23,539
(8,907)
7,963
(12,433)
10,162
(-) Depreciation PPE
884
1,995
428
306
106
3,719
17,685
—
—
21,404
Adjusted EBITDA
23,217
(1,187)
(484)
3,477
2,235
27,258
8,778
7,963
(12,433)
31,566
Reconciliation to Profit/(Loss)
Adjusted EBITDA
31,566
(+) Initial recog. and changes in F.V. of BA (unrealized)
973
(+) Depreciation PPE
(21,404)
(+) Financial result, net
(31,630)
(+) Income Tax (Charge)/Benefit
6,875
Profit/(Loss) for the Period
(13,620)
Adjusted EBIT & Adjusted EBITDA Reconciliation to Profit/Loss - 6M11
Sugar,
Ethanol &
Land
$ thousands
Crops
Rice
Dairy
Coffee
Cattle
Farming
Energy
Transformation Corporate
Total
Sales of manufactured products and services rendered
176
33,884
—
713
2,345
37,118
109,060
—
—
146,178
Cost of manufactured products sold and services rendered
—
(29,720)
—
(629)
(191)
(30,540)
(65,546)
—
—
(96,086)
Gross Profit from Manufacturing Activities
176
4,164
—
84
2,154
6,578
43,514
—
—
50,092
Sales of agricultural produce and biological assets
75,973
35
8,963
3,204
518
88,693
—
—
—
88,693
Cost of agricultural produce and biological assets
(75,973)
(35)
(8,963)
(3,204)
(518)
(88,693)
—
—
—
(88,693)
Initial recog. and changes in FV of BA and agricultural produce
37,030
8,275
3,424
2,338
351
51,418
4,551
—
—
55,969
Gain from changes in NRV of agricultural produce after harvest
5,832
—
—
(1,763)
—
4,069
—
—
—
4,069
Gross Profit from Agricultural Activities
42,862
8,275
3,424
575
351
55,487
4,551
—
—
60,038
Margin Before Operating Expenses
43,038
12,439
3,424
659
2,505
62,065
48,065
—
—
110,130
General and administrative expenses
(4,806)
(4,016)
(798)
(635)
(164)
(10,419)
(11,265)
—
(11,824)
(33,508)
Selling expenses
(813)
(5,605)
(188)
(235)
(27)
(6,868)
(17,206)
—
—
(24,074)
Other operating income, net
(3,047)
113
—
241
—
(2,693)
2,411
—
(22)
(304)
Share of gain/(loss) of joint ventures
—
—
(350)
—
—
(350)
—
—
—
(350)
Profit from Operations Before Financing and Taxation
34,372
2,931
2,088
30
2,314
41,735
22,005
—
(11,846)
51,894
(-) Initial recog. and changes in F.V. of long term BA (unrealized)
—
—
(1,485)
817
—
(668)
10,650
—
—
9,982
Adjusted EBIT
34,372
2,931
603
847
2,314
41,067
32,655
—
(11,846)
61,876
(-) Depreciation PPE
658
1,351
232
281
120
2,642
11,346
—
—
13,988
Adjusted EBITDA
35,030
4,282
835
1,128
2,434
43,709
44,001
—
(11,846)
75,864
Reconciliation to Profit/(Loss)
Adjusted EBITDA
75,864
(+) Initial recog. and changes in F.V. of BA (unrealized)
(9,982)
(+) Depreciation PPE
(13,988)
(+) Financial result, net
(11,043)
(+) Income Tax (Charge)/Benefit
(12,754)
Profit/(Loss) for the Period
28,097
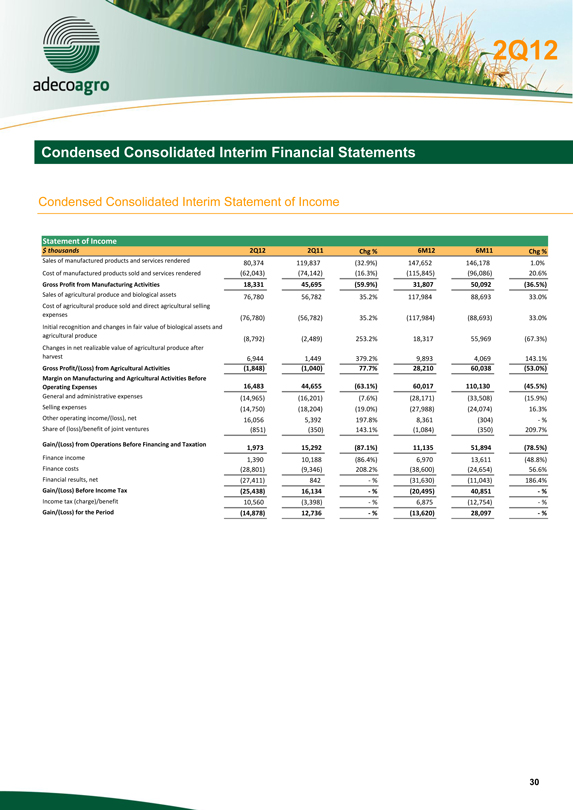
2Q12
Condensed Consolidated Interim Financial Statements
Condensed Consolidated Interim Statement of Income
Statement of Income
$ thousands
2Q12
2Q11
Chg %
6M12
6M11
Chg %
Sales of manufactured products and services rendered
80,374
119,837
(32.9%)
147,652
146,178
1.0%
Cost of manufactured products sold and services rendered
(62,043)
(74,142)
(16.3%)
(115,845)
(96,086)
20.6%
Gross Profit from Manufacturing Activities
18,331
45,695
(59.9%)
31,807
50,092
(36.5%)
Sales of agricultural produce and biological assets
76,780
56,782
35.2%
117,984
88,693
33.0%
Cost of agricultural produce sold and direct agricultural sellingexpenses
(76,780)
(56,782)
35.2%
(117,984)
(88,693)
33.0%
Initial recognition and changes in fair value of biological assets and agricultural produce
(8,792)
(2,489)
253.2%
18,317
55,969
(67.3%)
Changes in net realizable value of agricultural produce after harvest
6,944
1,449
379.2%
9,893
4,069
143.1%
Gross Profit/(Loss) from Agricultural Activities
(1,848)
(1,040)
77.7%
28,210
60,038
(53.0%)
Margin on Manufacturing and Agricultural Activities Before
Operating Expenses
16,483
44,655
(63.1%)
60,017
110,130
(45.5%)
General and administrative expenses
(14,965)
(16,201)
(7.6%)
(28,171)
(33,508)
(15.9%)
Selling expenses
(14,750)
(18,204)
(19.0%)
(27,988)
(24,074)
16.3%
Other operating income/(loss), net
16,056
5,392
197.8%
8,361
(304)
— %
Share of (loss)/benefit of joint ventures
(851)
(350)
143.1%
(1,084)
(350)
209.7%
Gain/(Loss) from Operations Before Financing and Taxation
1,973
15,292
(87.1%)
11,135
51,894
(78.5%)
Finance income
1,390
10,188
(86.4%)
6,970
13,611
(48.8%)
Finance costs
(28,801)
(9,346)
208.2%
(38,600)
(24,654)
56.6%
Financial results, net
(27,411)
842
— %
(31,630)
(11,043)
186.4%
Gain/(Loss) Before Income Tax
(25,438)
16,134
— %
(20,495)
40,851
— %
Income tax (charge)/benefit
10,560
(3,398)
— %
6,875
(12,754)
— %
Gain/(Loss) for the Period
(14,878)
12,736
— %
(13,620)
28,097
— %
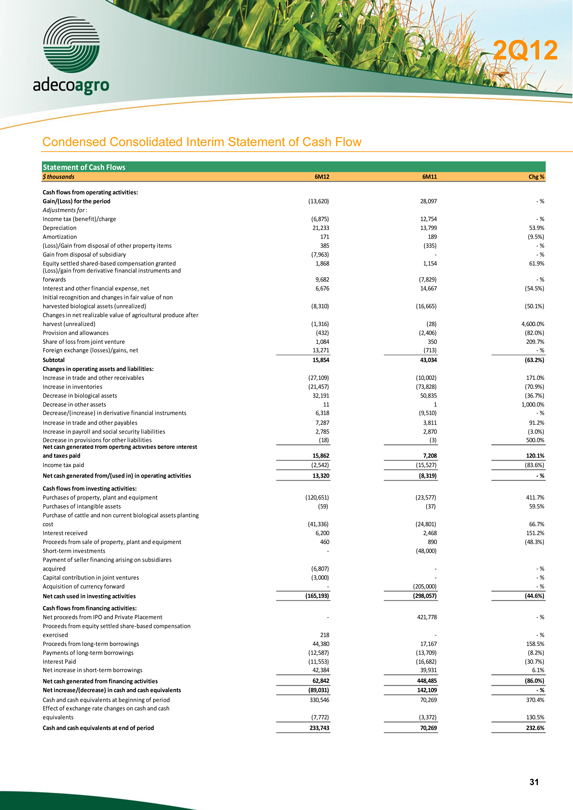
2Q12
Condensed Consolidated Interim Statement of Cash Flow
Statement of Cash Flows
$ thousands
6M12
6M11
Chg %
Cash flows from operating activities:
Gain/(Loss) for the period
(13,620)
28,097
— %
Adjustments for :
Income tax (benefit)/charge
(6,875)
12,754
— %
Depreciation
21,233
13,799
53.9%
Amortization
171
189
(9.5%)
(Loss)/Gain from disposal of other property items
385
(335)
— %
Gain from disposal of subsidiary
(7,963)
—
— %
Equity settled shared-based compensation granted
1,868
1,154
61.9%
(Loss)/gain from derivative financial instruments andforwards
9,682
(7,829)
— %
Interest and other financial expense, net
6,676
14,667
(54.5%)
Initial recognition and changes in fair value of nonharvested biological assets (unrealized)
(8,310)
(16,665)
(50.1%)
Changes in net realizable value of agricultural produce afterharvest (unrealized)
(1,316)
(28)
4,600.0%
Provision and allowances
(432)
(2,406)
(82.0%)
Share of loss from joint venture
1,084
350
209.7%
Foreign exchange (losses)/gains, net
13,271
(713)
— %
Subtotal
15,854
43,034
(63.2%)
Changes in operating assets and liabilities:
Increase in trade and other receivables
(27,109)
(10,002)
171.0%
Increase in inventories
(21,457)
(73,828)
(70.9%)
Decrease in biological assets
32,191
50,835
(36.7%)
Decrease in other assets
11
1
1,000.0%
Decrease/(increase) in derivative financial instruments
6,318
(9,510)
— %
Increase in trade and other payables
7,287
3,811
91.2%
Increase in payroll and social security liabilities
2,785
2,870
(3.0%)
Decrease in provisions for other liabilities
(18)
(3)
500.0%
Net cash generated from operting activities before interestand taxes paid
15,862
7,208
120.1%
Income tax paid
(2,542)
(15,527)
(83.6%)
Net cash generated from/(used in) in operating activities
13,320
(8,319)
— %
Cash flows from investing activities:
Purchases of property, plant and equipment
(120,651)
(23,577)
411.7%
Purchases of intangible assets
(59)
(37)
59.5%
Purchase of cattle and non current biological assets plantingcost
(41,336)
(24,801)
66.7%
Interest received
6,200
2,468
151.2%
Proceeds from sale of property, plant and equipment
460
890
(48.3%)
Short-term investments
—
(48,000)
Payment of seller financing arising on subsidiaresacquired
(6,807)
—
— %
Capital contribution in joint ventures
(3,000)
—
— %
Acquisition of currency forward
—
(205,000)
— %
Net cash used in investing activities
(165,193)
(298,057)
(44.6%)
Cash flows from financing activities:
Net proceeds from IPO and Private Placement
—
421,778
— %
Proceeds from equity settled share-based compensationexercised
218
—
— %
Proceeds from long-term borrowings
44,380
17,167
158.5%
Payments of long-term borrowings
(12,587)
(13,709)
(8.2%)
Interest Paid
(11,553)
(16,682)
(30.7%)
Net increase in short-term borrowings
42,384
39,931
6.1%
Net cash generated from financing activities
62,842
448,485
(86.0%)
Net increase/(decrease) in cash and cash equivalents
(89,031)
142,109
— %
Cash and cash equivalents at beginning of period
330,546
70,269
370.4%
Effect of exchange rate changes on cash and cash equivalents
(7,772)
(3,372)
130.5%
Cash and cash equivalents at end of period
233,743
70,269
232.6%
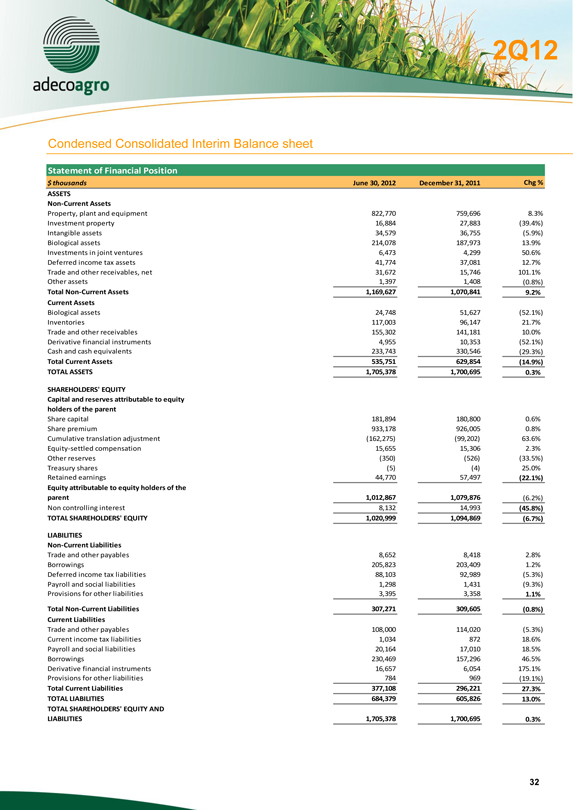
2Q12
Condensed Consolidated Interim Balance sheet
Statement of Financial Position
$ thousands
June 30, 2012
December 31, 2011
Chg %
ASSETS
Non-Current Assets
Property, plant and equipment
822,770
759,696
8.3%
Investment property
16,884
27,883
(39.4%)
Intangible assets
34,579
36,755
(5.9%)
Biological assets
214,078
187,973
13.9%
Investments in joint ventures
6,473
4,299
50.6%
Deferred income tax assets
41,774
37,081
12.7%
Trade and other receivables, net
31,672
15,746
101.1%
Other assets
1,397
1,408
(0.8%)
Total Non-Current Assets
1,169,627
1,070,841
9.2%
Current Assets
Biological assets
24,748
51,627
(52.1%)
Inventories
117,003
96,147
21.7%
Trade and other receivables
155,302
141,181
10.0%
Derivative financial instruments
4,955
10,353
(52.1%)
Cash and cash equivalents
233,743
330,546
(29.3%)
Total Current Assets
535,751
629,854
(14.9%)
TOTAL ASSETS
1,705,378
1,700,695
0.3%
SHAREHOLDERS’ EQUITY
Capital and reserves attributable to equityholders of the parent
Share capital
181,894
180,800
0.6%
Share premium
933,178
926,005
0.8%
Cumulative translation adjustment
(162,275)
(99,202)
63.6%
Equity-settled compensation
15,655
15,306
2.3%
Other reserves
(350)
(526)
(33.5%)
Treasury shares
(5)
(4)
25.0%
Retained earnings
44,770
57,497
(22.1%)
Equity attributable to equity holders of theparent
1,012,867
1,079,876
(6.2%)
Non controlling interest
8,132
14,993
(45.8%)
TOTAL SHAREHOLDERS’ EQUITY
1,020,999
1,094,869
(6.7%)
LIABILITIES
Non-Current Liabilities
Trade and other payables
8,652
8,418
2.8%
Borrowings
205,823
203,409
1.2%
Deferred income tax liabilities
88,103
92,989
(5.3%)
Payroll and social liabilities
1,298
1,431
(9.3%)
Provisions for other liabilities
3,395
3,358
1.1%
Total Non-Current Liabilities
307,271
309,605
(0.8%)
Current Liabilities
Trade and other payables
108,000
114,020
(5.3%)
Current income tax liabilities
1,034
872
18.6%
Payroll and social liabilities
20,164
17,010
18.5%
Borrowings
230,469
157,296
46.5%
Derivative financial instruments
16,657
6,054
175.1%
Provisions for other liabilities
784
969
(19.1%)
Total Current Liabilities
377,108
296,221
27.3%
TOTAL LIABILITIES
684,379
605,826
13.0%
TOTAL SHAREHOLDERS’ EQUITY AND
LIABILITIES
1,705,378
1,700,695
0.3%