UNITED STATES
SECURITIES AND EXCHANGE COMMISSION
Washington, D.C. 20549
FORM 6-K
Report of Foreign Private Issuer
Pursuant to Rule 13a-16 or 15d-16
of the Securities Exchange Act of 1934
For the month of March, 2018
Commission File Number: 001-35052
Adecoagro S.A.
(Translation of registrant’s name into English)
Vertigo Naos Building 6,
Rue Eugene Ruppert,
L-2453, Luxembourg
Grand Duchy of Luxembourg
(Address of principal executive offices)
Indicate by check mark whether the registrant files or will file annual reports under cover of Form 20-F or Form 40-F:
Form 20-F x Form 40-F ¨
Indicate by check mark if the registrant is submitting the Form 6-K in paper as permitted by Regulation S-T Rule 101(b)(1):
Yes ¨ No x
Indicate by check mark if the registrant is submitting the Form 6-K in paper as permitted by Regulation S-T Rule 101(b)(7):
Yes ¨ No x
Indicate by check mark whether by furnishing the information contained in this Form, the Registrant is also thereby furnishing the information to the Commission pursuant to Rule 12g3-2(b) under the Securities Exchange Act of 1934:
Yes ¨ No x
If “Yes” is marked, indicate below the file number assigned to the registrant in connection with Rule 12g3-2(b): N/A
ANNOUNCEMENT OF RESULTS OF OPERATIONS FOR THE TWELVE MONTH PERIOD
ENDED DECEMBER 31, 2017
On March 15, 2018, the registrant issued a press release pertaining to its results of operations for the twelve month period ended December 31, 2017 (the “Release”). Registrant hereby furnishes the attached copy of the Release to the Securities and Exchange Commission. The financial and operational information contained in the Release is based on audited consolidated financial statements presented in U.S. dollars and prepared in accordance with International Financial Reporting Standards.
The attachment contains forward-looking statements. The registrant desires to qualify for the “safe-harbor” provisions of the Private Securities Litigation Reform Act of 1995, and consequently is hereby including cautionary statements identifying important factors that could cause the registrant’s actual results to differ materially from those set forth in the attachment.
The registrant’s forward-looking statements are based on the registrant’s current expectations, assumptions, estimates and projections about the registrant and its industry. These forward-looking statements can be identified by words or phrases such as “anticipate,” “believe,” “continue,” “estimate,” “expect,” “intend,” “is/are likely to,” “may,” “plan,” “should,” “would,” or other similar expressions.
The forward-looking statements included in the attached relate to, among others: (i) the registrant’s business prospects and future results of operations; (ii) weather and other natural phenomena; (iii) developments in, or changes to, the laws, regulations and governmental policies governing the registrant’s business, including limitations on ownership of farmland by foreign entities in certain jurisdictions in which the registrant operate, environmental laws and regulations; (iv) the implementation of the registrant’s business strategy, including its development of the Ivinhema mill and other current projects; (v) the registrant’s plans relating to acquisitions, joint ventures, strategic alliances or divestitures; (vi) the implementation of the registrant’s financing strategy and capital expenditure plan; (vii) the maintenance of the registrant’s relationships with customers; (viii) the competitive nature of the industries in which the registrant operates; (ix) the cost and availability of financing; (x) future demand for the commodities the registrant produces; (xi) international prices for commodities; (xii) the condition of the registrant’s land holdings; (xiii) the development of the logistics and infrastructure for transportation of the registrant’s products in the countries where it operates; (xiv) the performance of the South American and world economies; and (xv) the relative value of the Brazilian Real, the Argentine Peso, and the Uruguayan Peso compared to other currencies; as well as other risks included in the registrant’s other filings and submissions with the United States Securities and Exchange Commission.
These forward-looking statements involve various risks and uncertainties. Although the registrant believes that its expectations expressed in these forward-looking statements are reasonable, its expectations may turn out to be incorrect. The registrant’s actual results could be materially different from its expectations. In light of the risks and uncertainties described above, the estimates and forward-looking statements discussed in the attached might not occur, and the registrant’s future results and its performance may differ materially from those expressed in these forward-looking statements due to, inclusive, but not limited to, the factors mentioned above. Because of these uncertainties, you should not make any investment decision based on these estimates and forward-looking statements.
The forward-looking statements made in the attached relate only to events or information as of the date on which the statements are made in the attached. The registrant undertakes no obligation to update any forward-looking statements to reflect events or circumstances after the date on which the statements are made or to reflect the occurrence of unanticipated events.
SIGNATURES
Pursuant to the requirements of the Securities Exchange Act of 1934, the registrant has duly caused this report to be signed on its behalf by the undersigned, thereunto duly authorized.
| Adecoagro S.A. | |
| By /s/ Carlos A. Boero Hughes | |
| Name: Carlos A. Boero Hughes | |
| Title: Chief Financial Officer and Chief Accounting Officer | |
Date: March 15, 2018
| Financial and Operational Performance |
Sugar, Ethanol & Energy
| ◦ | In our Sugar, Ethanol and Energy business, Adjusted EBITDA in 4Q17 reached $81.3 million, 27.4% lower than in 4Q16. Operating and financial performance in the quarter was negatively affected by: (i) substantial rainfalls, an increase of over 30% compared to the 10 year average, which caused harvest delays, resulting in a 29.4% decrease in sugarcane crushing volumes compared to 4Q16; (ii) lower realized sugar and ethanol prices in US dollars; and (iii) higher production costs driven mainly by the decrease in yields and lower crushing volumes. |
On a full year basis, Adjusted EBITDA was $247.3 million with an Adjusted EBITDA margin net of 3rd party commercialization of 52%. The year-over-year decrease in financial performance is primarily explained by (i) a 7.9% reduction in crushing volumes resulting in lower sugar, ethanol and energy production volumes, (ii) the increase in cost of production for the reasons explained above; and (iii) lower sugar prices in US dollars. These negative effects were mainly offset by: (i) higher industrial efficiencies (milling per hour increased 6.0% year-over-year, reaching 2,072 tons per hour), (ii) higher ethanol selling volumes, (iii) higher realized ethanol and energy prices in US dollars; and (iv) a $43.0 million increase derived from the mark-to-market of our hedging derivatives position.
As a result of excess rains, the unharvested sugarcane as of December 31, 2017 continues to grow on our fields and is expected to be harvested during 2018 with higher yields. This agricultural effect is already factored in the $11.6 million gain derived from the mark-to-market valuation of our unharvested biological asset. At the same time, as we are deferring harvest operations, we expect to crush more sugarcane during 2018. This, in turn, will enhance efficiencies in our industrial operations increasing EBITDA generation.
Farming & Land Transformation
| ◦ | Adjusted EBITDA for the Farming business in 4Q17 was $13.1 million, a $6.5 million increase compared to the same period of the previous year. This increase is mainly explained by higher sales and margins in our Rice business; partially offset by lower margins in our Crops business. |
On a full year basis, Adjusted EBITDA for the Farming business reached $50.7 million, a $3.3 million or 6.1% decrease compared to the same period of last year. This decrease is primarily explained by: (i) lower margins in our Crops business manly driven by the appreciation of the Argentine peso, in real terms; and an $8.5 million decrease in All Other Segments explained by an extraordinary gain recorded in 2016 related to the settlement of an arbitration dispute with Marfrig Argentina SA. These negative effects were partially offset by
2

the outstanding operational and financial performance of our Dairy business. Cow productivity remains at very high levels and we were able to profit from higher raw milk prices as a result of of supply shortages due to excess rainfalls during the first half of the year. At the same time, the $12.1 million hedging gain derived from the mark-to-market of our derivatives position also contributed to offset the negative effects.
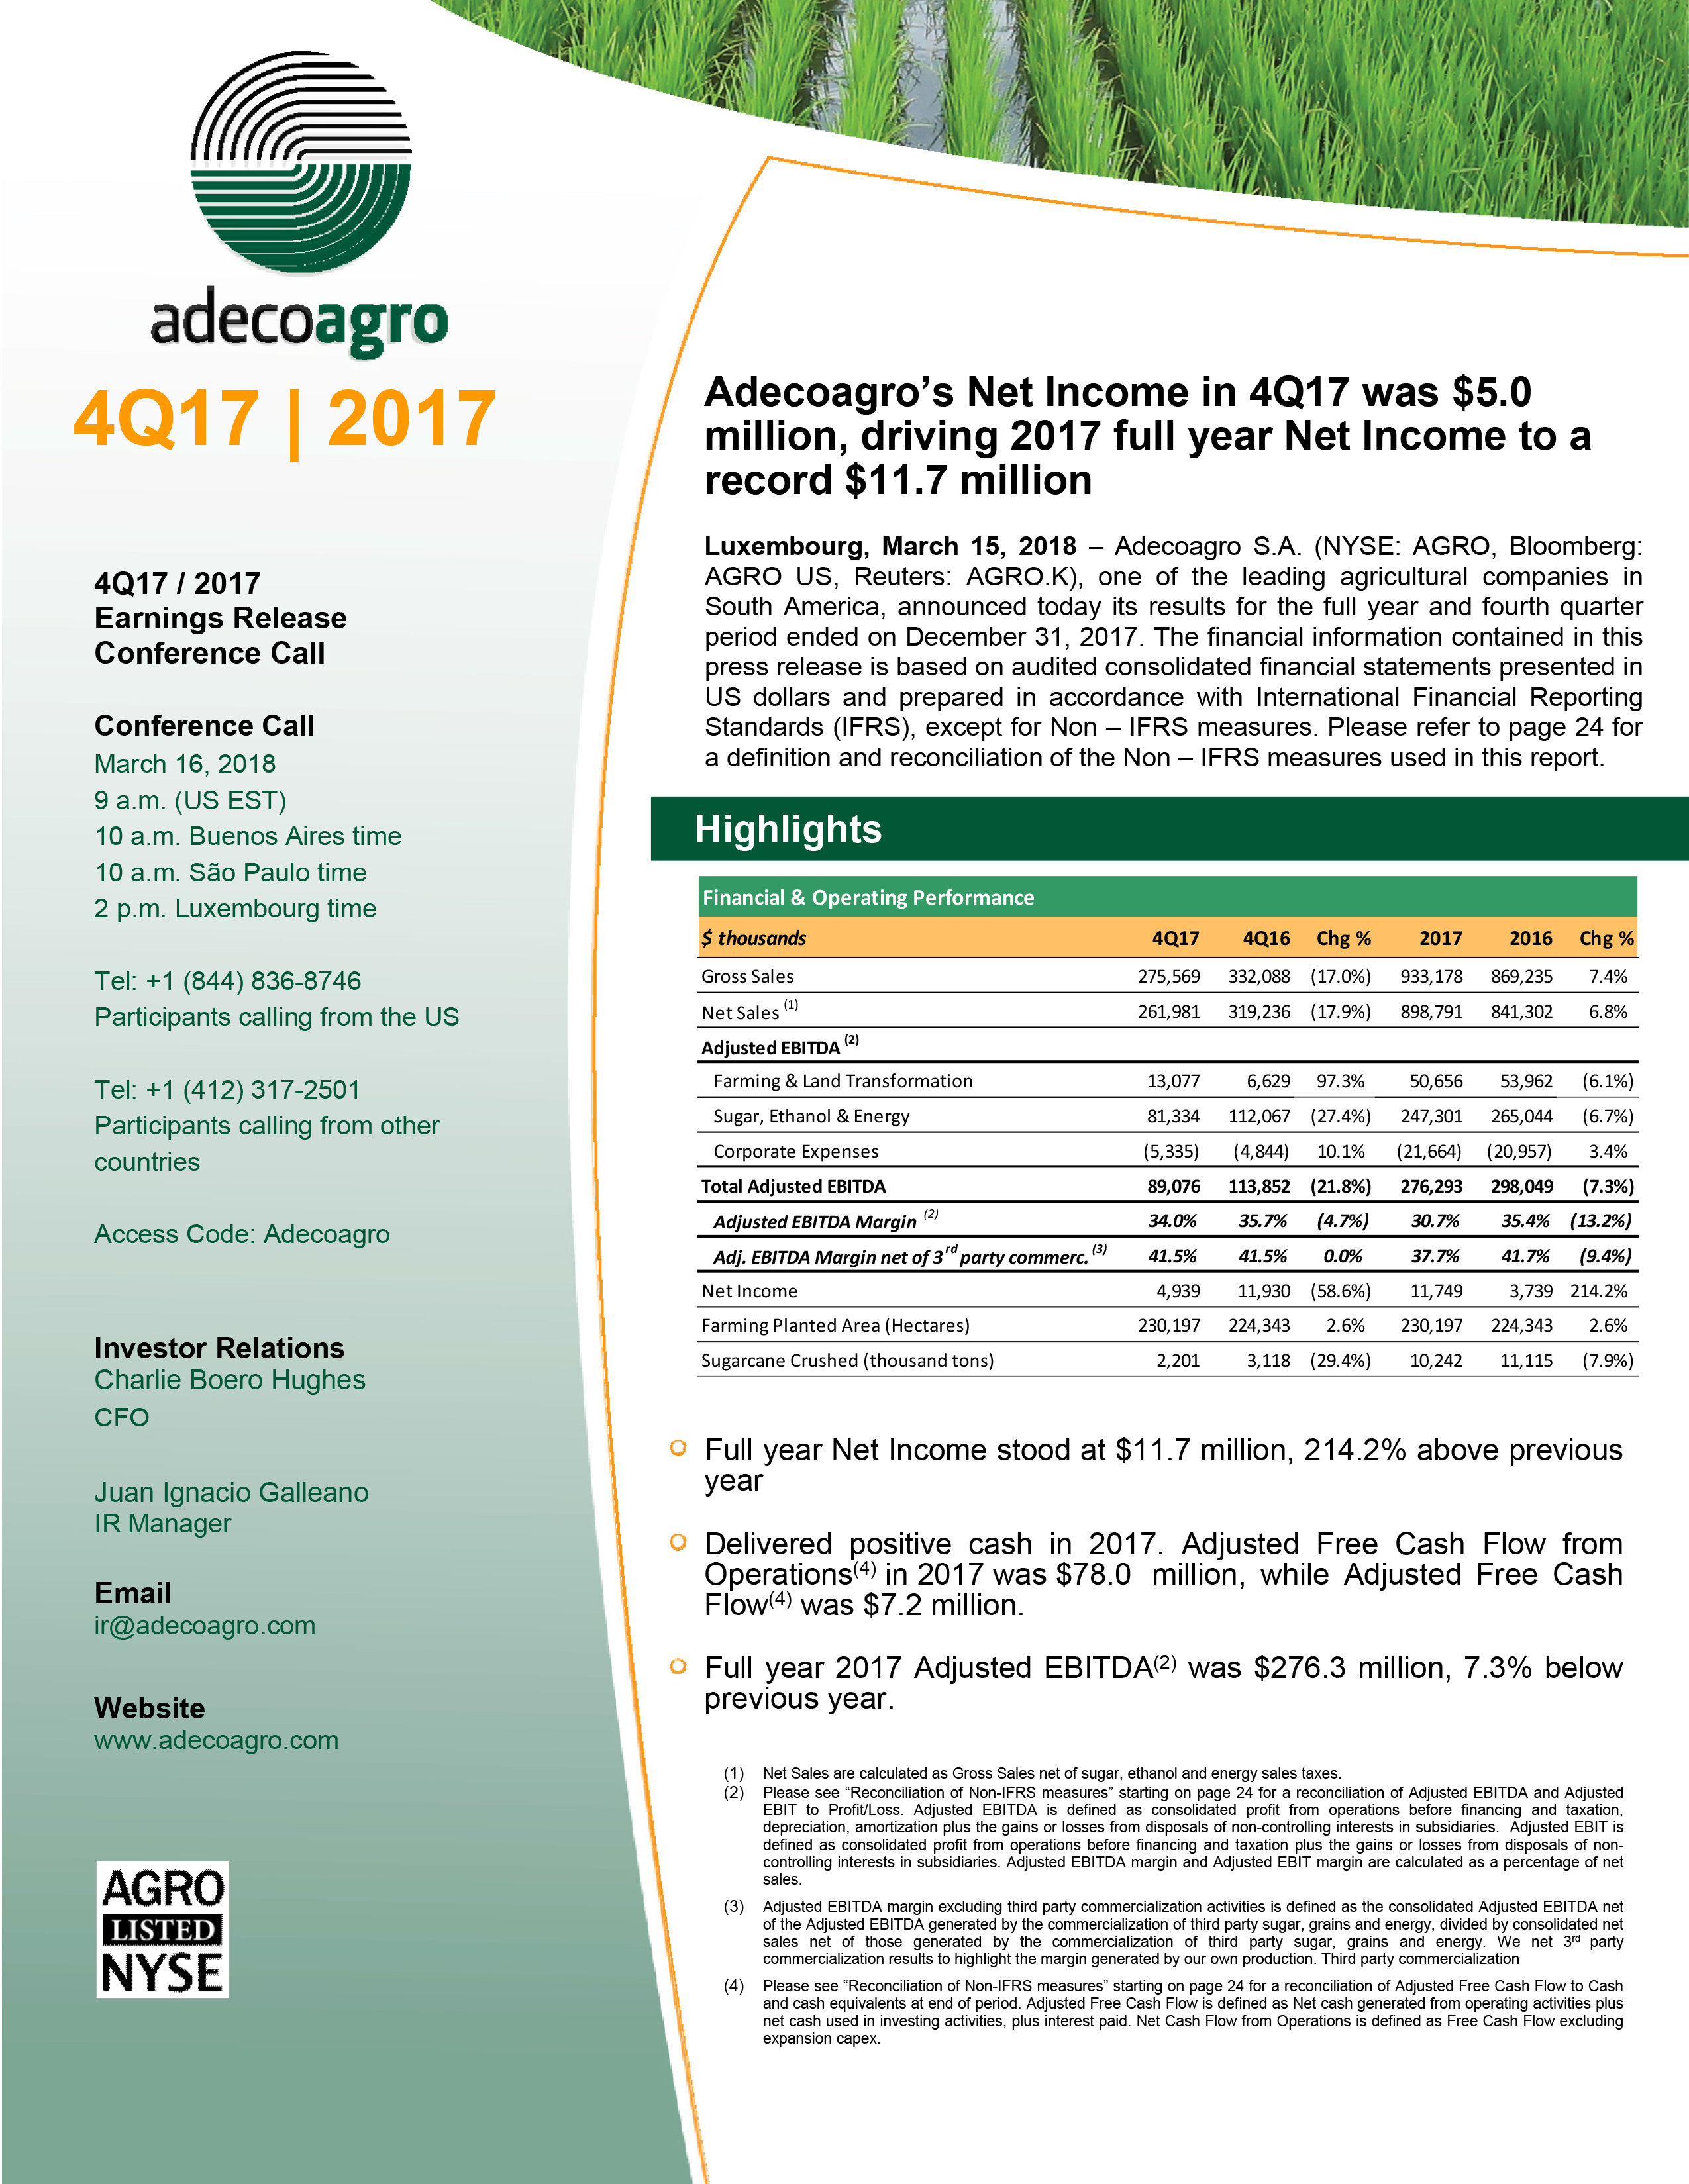
Net Income in 2017 totaled $11.7 million, $8.0 million higher compared to the previous year. The 7.3% lower Adjusted EBITDA was more than offset by the lower foreign currency losses and lower income tax payments.
| Strategy Execution |
Adjusted Free Cash Flow
| • | Last year, as we consolidated and stabilized our operations, especially our Sugar, Ethanol & Energy cluster, we commenced our positive Adjusted Free Cash Flow cycle. We believe that, as a result of our ongoing focus on lowering production costs and enhancing efficiencies, we have been able to generate positive Adjusted Free Cash Flow even in the current low soft commodity price environment. |
During 2017, our operations have delivered $78.0 million of Adjusted Free Cash Flow from Operations (AFCF before expansion capex), 41.5% lower compared to 2016. This decrease is fully explained by the $43.8 million higher maintenance capex invested during 2017, as our planting and operations stabilize and reach sustainable levels. At the same time we anticipated additional maintenance expenses during the fourth quarter as a result of abundant rainfalls.
As for Adjusted Free Cash Flow, we delivered $7.2 million in 2017. As previously announced, we are currently undertaking several organic expansion projects across all our existing businesses. This has driven expansion capex to $70.8 million in 2017. We believe Adjusted EBITDA and Free Cash Flow generation will increase substantially as we ramp-up and consolidate these projects.
Adjusted Free Cash Flow Summary | ||||||
| $ thousands | 2017 | 2016 | Chg % | |||
| Net cash generated from operating activities | 237,105 | 255,401 | (7.2 | )% | ||
| Net cash used in investing activities | (188,328 | ) | (122,014 | ) | 54.3 | % |
| Interest paid | (41,612 | ) | (48,400 | ) | (14.0 | )% |
| Proceeds from the sale of minority interest in subsidiaries | — | — | n.a | |||
| Expansion Capex reversal | 70,804 | 48,295 | 46.6 | % | ||
Adjusted Free Cash Flow from Operations(1) | 77,969 | 133,282 | (41.5 | )% | ||
Expansion Capex(2) | (70,804 | ) | (48,295 | ) | 46.6 | % |
Adjusted Free Cash Flow(1) | 7,165 | 84,987 | (91.6 | )% | ||
3
Organic Businesses Growth Update (5-Year Plan)
| • | As previously announced, there are several organic expansion projects that we are currently undertaking. These projects form part of our strategic 5 Year Plan, and are expected to increase EBTIDA by approximately 50% and also contribute to free cash flow generation.The execution risk associated with these projects is not expected to be significant as we are investing in existing operations were we proved to be highly efficient. It is worth of mention that our expected results do not rely exclusively on rising commodity prices, which we expect to remain constant at current levels. |
| ◦ | Cluster Expansion: The expansion of the cluster in Mato Grosso do Sul is moving forward according to plan. As previously announced, investments in Angelica are already complete and crushing capacity has increased by 17%, from 900 tons/hour to 1,050 tons/hour. As for investments in Ivinhema mill, we are advancing according to schedule and budget and we expect to conclude them by the first half of 2018. |
The expansion of our sugarcane to supply the additional nominal crushing capacity is also advancing well. We expect sugarcane planting to grow at a pace that will allow total milling to increase by approximately 0.5 million tons per year.
| ◦ | Dairy business: The construction of free stall #3 is moving forward according to plan. By July 2018, we expect to start populating the facility, targeting operations at 40% of total capacity by the end of year. We are advancing well in growing and securing corn silage to feed the additional cows. As for the bio-digester, we already stabilized energy production generating attractive results. |
| ◦ | Rice business: We expect to conclude investments by the first half of the year, allowing us to improve our rice processing and distribution, and increase the value of main by-products. |
| ◦ | Crops: We expect to complete the construction of one of the two storage and grain conditioning facilities by end of 2018. This investment will allow us to reduce our conditioning and logistics costs and enhance our commercial flexibility. |
| • | Regarding our Land Transformation business, we are continuously seeking to recycle part of our land portfolio. This allows us to monetize gains generated throughout the process and redeploy the capital into higher yielding investments. Negotiations to sell specific farmland assets are ongoing and we are optimistic that we finalize one or more transactions. |
Share Repurchase Program Update
4
| • | As part of our commitment to generate long term value for our shareholders, we have been actively engaged in the execution of our share repurchase program. Since our last Earnings Release and as of today, we purchased an additional 4.1 million shares at an average price of $9.6 per share. We expect to continue our share repurchases under the program during 2018 subject to necessary investment in our expansion projects. |
We believe that both the organic expansion projects, and the repurchasing of shares represents the best allocation of our capital.
| Market Outlook |
| ◦ | Sugar prices during 4Q17 were, on average, 4% higher than 3Q17, but 30% lower than same period last year. Prices started to rally by the end of October and continued during November, reaching 15.49 c/lb by the end of the month. Strong oil prices, associated with the potential of a strong mix switch towards ethanol in the 18/19 CS Brazil, encouraged funds to cover their short position and build a small long position by early December. The rally created an opportunity for producer pricing, limiting the rise, and triggering funds to sell once again, pressuring prices to as low as 13.64 c/lb by mid-December. Rising oil prices by the end of year paved the way for an increase in purchases, driving prices above 15.00 c/lb. Going forward the next CS Brazil crop and the prospect of a strong mix switch should bring volatility to the market. |
| ◦ | Ethanol market in 4Q17 was marked by a strong recovery in Brazilian domestic demand and prices. According to the Esalq index, both hydrous and anhydrous made a significant improvement relative to previous quarter of 19% and 17% respectively. However, when compared to 4Q16, hydrous made a reduction of 12% and anhydrous 13%. As reported by UNICA, hydrous sales during 4Q17 were 30% higher than same period last year and 13% above previous quarter. Despite lower sugarcane crushing (-1% YoY), ethanol production also showed a recovery and reached 25,22 MM m³ by the end of December, closing the quarter 1% higher YoY, an increase explained by higher TRS and ethanol mix. |
| ◦ | Soybean prices decreased 0.6% during 4Q17 and was in average 2.16% lower year-over-year, while corn prices increased 0.14% in the quarter and were on average 0.8% lower than a year ago. Prices were mostly neutral due to minor changes to both US and global ending stocks, reported by the USDA. However towards the beginning of December, prices found support on concerns about Argentine weather. The US dollar continued to depreciate over the last three months supporting grain prices and making US exports more competitive on the global market. |
5
| Operating Performance |
| Farming Business |
| Farming Production Data | |||||||||||||
| Planting & Production | Planting Plan (hectares) | 2016/17 Planting Progress | |||||||||||
| 2017/2018E | 2016/2017 | Chg % | Planted | % | |||||||||
| Soybean | 58,280 | 55,237 | 5.5 | % | 58,277 | 100.0 | % | ||||||
| Soybean 2nd Crop | 22,919 | 29,197 | (21.5 | )% | 22,826 | 99.6 | % | ||||||
Corn (1) | 55,338 | 44,630 | 24.0 | % | 54,119 | 97.9 | % | ||||||
| Corn 2nd Crop | 10,847 | 10,023 | 8.2 | % | 10,847 | 100.0 | % | ||||||
Wheat (2) | 36,533 | 38,009 | (3.9 | )% | 36,533 | 100.0 | % | ||||||
| Sunflower | 2,869 | 5,413 | (47.0 | )% | 1,899 | 66.2 | % | ||||||
| Cotton | 3,132 | 2,640 | n.a | 2,869 | — | ||||||||
| Total Crops | 189,918 | 185,149 | 2.6 | % | 187,370 | 98.7 | % | ||||||
| Rice | 40,279 | 39,728 | 1.4 | % | 40,279 | 100.0 | % | ||||||
| Total Farming | 230,197 | 224,877 | 2.4 | % | 227,649 | 98.9 | % | ||||||
| Owned Croppable Area | 122,086 | 121,412 | 0.6 | % | |||||||||
| Leased Area | 72,394 | 64,245 | 12.7 | % | |||||||||
| Second Crop Area | 35,717 | 39,220 | (8.9 | )% | |||||||||
| Total Farming Area | 230,197 | 224,877 | 2.4 | % | |||||||||
(1) Includes chia and peanuts.
(2) Includes barley.
2016/17 Harvest Year
During the second half of 2017, we began our planting activities for the 2017/18 harvest year. Planting activities continued throughout early 2018, and as of the date of this report we have seeded a total of 227,648 hectares. Our owned croppable area, which is the area that provides the highest EBITDA contribution, has increased 0.6%. Leased area, which varies in size on the basis of return on invested capital, has also increased by 12.7%.
Since November 2017, Argentina has been experiencing a drought with rain levels below historical averages. Argentina´s Humid Pampas, the country´s corn-belt region, along with the north-east region are amongst the most affected by the dry weather.
As for Adecoagro, the impact has been partially mitigated thanks to both our geographic diversification strategy and no-till production. At the same time, it is also worth noting that as Argentina is an important producer in the
6
global trade market, the decrease in grain production in Argentina is driving prices higher and adding to risk premia in over next years.
Crops Update
Soybean: 58,277 hectares were successfully planted, which represents 100.0% of our revised planting plan. We planted the soybean crop between mid-October and December according to schedule. Crop development has been diverse, according to the region. We are expecting adequate rains and hence, only a mild impact on yields.
Corn: As of late February 2017, 98.2% of our corn crop had been seeded. In an effort to diversify our crop risk and minimize our water requirements, 28% of the area was planted with early corn seeds in September and the remaining 72% of the area was planted with late seed varieties during the end of November and December of 2017. The early corn grew under good conditions and was much less affected by the lack of rains. Soil humidity was adequate during the development of the crops, favored by abundant rainfalls during last year. The late corn planted areas have been more exposed to dry weather and need to receive rains over the next weeks.
Sunflower: Sunflower seeding operations began in mid-September 2017 with 2,869 hectares successfully seeded by January 2018.
Rice: Our rice planting plan that began in August 2017 was successfully completed as of October 31, 2017. Planted area totaled 40,279 hectares, 1.4% above that of the 2016/17 harvest year. The harvest has begun mid-January and is expected to continue until mid-March. As of today, we are achieving higher yields compared to the last harvest year. Our rice crop is less compromised by the lack of rain as production is fully irrigated.
Wheat: As of January 30, 2018, the harvest was completed with 36,533 hectares harvested. Average yield for the wheat crop was 3.02 tons per hectare, 19% higher than the previous harvest year. Wheat area has also grown driven by the elimination of taxes and export controls. At current prices, we expect wheat plantings for 2018 to increase.
7
| Financial Performance |
| Farming & Land Transformation Businesses |
| Farming & Land transformation business - Financial highlights | ||||||||||||
| $ thousands | 4Q17 | 4Q16 | Chg % | 2017 | 2016 | Chg % | ||||||
| Gross Sales | ||||||||||||
| Farming | 89,899 | 59,816 | 50.3 | % | 322,559 | 272,543 | 18.4 | % | ||||
| Total Sales | 89,899 | 59,816 | 50.3 | % | 322,559 | 272,543 | 18.4 | % | ||||
Adjusted EBITDA | ||||||||||||
| Farming | 13,077 | 6,629 | 97.3 | % | 50,656 | 53,962 | (6.1 | )% | ||||
| Total Adjusted EBITDA | 13,077 | 6,629 | 97.3 | % | 50,656 | 53,962 | (6.1 | )% | ||||
| Adjusted EBIT | ||||||||||||
| Farming | 11,182 | 5,126 | 118.1 | % | 44,098 | 48,671 | (9.4 | )% | ||||
| Total Adjusted EBIT | 11,182 | 5,126 | 118.1 | % | 44,098 | 48,671 | (9.4 | )% | ||||
Adjusted EBIT for the Farming business was $44.1 million, 9.4% or $4.6 million lower than 2016. The decrease is mostly explained by (i) lower margins in our Crops business driven by lower selling prices coupled with the appreciation of the Argentine peso, in real terms; and (ii) an $8.5 million decrease in All Other Segments explained by an extraordinary gain recorded in 2016 related to the settlement of an arbitration dispute with Marfrig Argentina SA. These negative effects were partially offset by (i) higher margins in our Dairy business as a result of higher selling prices coupled with enhanced efficiencies in our industrial operations; and (ii) a $12.1 million higher hedging gain derived from the mark-to-market of our derivatives position
On a quarterly basis, Adjusted EBIT for the Farming business was $11.2 million, $6.5 million higher than 4Q16. This increase is mainly explained by higher sales and margins in our Rice business; partially offset by lower margins in our Crops business, for the reasons explained above.
8
| Crops |
| Crops - Highlights | ||||||||||||||
| metric | 4Q17 | 4Q16 | Chg % | 2017 | 2016 | Chg % | ||||||||
| Gross Sales | $ thousands | 53,125 | 32,476 | 63.6 | % | 197,222 | 142,124 | 38.8 | % | |||||
| thousand tons | 331.2 | 191.7 | 72.8 | % | 998.6 | 688.2 | 45.1 | % | ||||||
| $ per ton | 160.4 | 169.4 | (5.3 | )% | 197.5 | 206.5 | (4.4 | )% | ||||||
| Adjusted EBITDA | $ thousands | 2,626 | 4,558 | (42.4 | )% | 25,678 | 27,462 | (6.5 | )% | |||||
| Adjusted EBIT | $ thousands | 2,155 | 4,218 | (48.9 | )% | 24,167 | 26,093 | (7.4 | )% | |||||
Planted Area(1) | hectares | 197,171 | 185,149 | 6.5 | % | 197,171 | 185,149 | 6.5 | % | |||||
(1) Does not include second crop planted area.
Agricultural activities during the fourth quarter of 2017 consist mainly of the harvest of winter crops and the planting of summer crops. Profit during the quarter is derived from the harvest of winter crops (wheat & barley), the fair value recognition of summer crops with significant growth as of December 31, the mark-to-market effect of grain inventories and the mark-to-market effect of commodity hedges.
Adjusted EBIT for our Crops segment during 4Q17 was $2.2 million compared to $4.2 million in 4Q16. The decrease is primarily explained by a $2.2 million loss in Changes in Fair Value as a result of lower commodity prices coupled with higher costs measured in USD after the real appreciation of the Argentine peso. This result was partially offset by a $12.1 million higher gain from the mark-to-market effect of our commodity hedge position.
On a year-to-date basis, Adjusted EBIT for 2017 was $24.2 million, $1.9 million lower compared to the previous year. The reasons for this decrease are in line with those outlined for the quarter.
Crop sales in 2017 reached $197.2 million, 38.8% higher than in 2016. Higher third party commercialization of soybean and corn explain the increase. At the same time, the share of soybean sales in Uruguay increased from 6% to 30%. This accounts for the 15.7% increase in average selling price as we don´t pay export taxes on these sales.
9
| Crops - Gross Sales Breakdown | ||||||||||||||||||||
| Amount ($ '000) | Volume (tons) | $ per unit | ||||||||||||||||||
| Crop | 4Q17 | 4Q16 | Chg % | 4Q17 | 4Q16 | Chg % | 4Q17 | 4Q16 | Chg % | |||||||||||
| Soybean | 18,550 | 7,689 | 141.3 | % | 53,368 | 30,860 | 72.9 | % | 348 | 249 | 39.8 | % | ||||||||
Corn (1) | 27,186 | 12,893 | 110.9 | % | 246,169 | 79,653 | 209.1 | % | 110 | 162 | (32.1 | )% | ||||||||
Wheat (2) | 5,645 | 10,558 | (46.5 | )% | 30,892 | 79,465 | (61.1 | )% | 183 | 133 | 37.6 | % | ||||||||
| Sunflower | 231 | 911 | (74.6 | )% | 204 | 1,495 | (86.4 | )% | 1,131 | 609 | 85.7 | % | ||||||||
| Cotton | 110 | 159 | (30.8 | )% | 238 | 238 | — | % | 462 | 669 | (30.9 | )% | ||||||||
| Peanut | 248 | — | n.a. | 546 | — | n.a. | 454 | — | n.a. | |||||||||||
| Others | 1,155 | 266 | 334.2 | % | — | — | n.a | |||||||||||||
| Total | 53,125 | 32,476 | 63.6 | % | 331,417 | 191,711 | 72.9 | % | ||||||||||||
| Amount ($ '000) | Volume (tons) | $ per unit | ||||||||||||||||||
| Crop | 2017 | 2016 | Chg % | 2017 | 2016 | Chg % | 2017 | 2016 | Chg % | |||||||||||
| Soybean | 85,527 | 63,797 | 34.1 | % | 282,518 | 243,755 | 15.9 | % | 303 | 262 | 15.6 | % | ||||||||
Corn (1) | 82,482 | 48,502 | 70.1 | % | 595,085 | 294,696 | 101.9 | % | 139 | 165 | (15.8 | )% | ||||||||
Wheat (2) | 16,723 | 18,191 | (8.1 | )% | 103,566 | 129,561 | (20.1 | )% | 161 | 140 | 15.0 | % | ||||||||
| Sunflower | 3,163 | 7,275 | (56.5 | )% | 9,313 | 18,793 | (50.4 | )% | 340 | 387 | (12.1 | )% | ||||||||
| Cotton | 420 | 1,434 | (70.7 | )% | 411 | 1,434 | (71.3 | )% | 1,022 | 1,000 | 2.2 | % | ||||||||
| Peanut | 3,648 | 1,703 | 114.2 | % | 7,699 | 4,170 | 84.6 | % | 474 | 408 | 16.2 | % | ||||||||
| Others | 5,259 | 2,925 | 79.8 | % | — | — | n.a | |||||||||||||
| Total | 197,222 | 143,827 | 37.1 | % | 998,592 | 692,409 | 44.2 | % | ||||||||||||
(1) Includes sorghum
(2) Includes barley
The table on the next page shows the gains or losses from crop production generated in 2017. Our crop operations related to the 2016/17 season, which was harvested between January and June, generated Changes in Fair Value of $13.9 million. As of December 31, 2017, 30,244 hectares pertaining to the 2017/18 harvest (mainly corn, soybean and sunflower) had attained significant biological growth, generating initial recognition and Changes in Fair Value of biological assets of $1.9 million. In addition, 34,123 hectares of 2017/18 winter crops (wheat and barley) had been harvested, generating Changes in Fair Value of $1.3 million. As a result, total Changes in Fair Value of Biological Assets and Agricultural Produce during 2017 reached $17.2 million, compared to $48.8 million generated in 2016. The decrease is mainly attributable to lower commodity prices in Argentina and higher production costs due to the appreciation of the Argentine peso, in real terms.
10
| Crops - Changes in Fair Value Breakdown | |||||||||||||||||
| 12M17 | metric | Soy | Soy 2nd Crop | Corn | Corn 2nd Crop | Wheat | Sunflower | Cotton | Total | ||||||||
| 2016/17 Harvest Year | |||||||||||||||||
| Total Harvested Area | Hectares | 54,768 | 30,604 | 44,527 | 9,982 | 39,100 | 5,454 | 2,640 | 187,075 | ||||||||
| Area harvested in previous periods | Hectares | 37,601 | 844 | 38,445 | |||||||||||||
| Area harvested in current period | Hectares | 54,768 | 30,604 | 44,527 | 9,982 | 1,499 | 4,610 | 2,640 | 148,630 | ||||||||
| Planted area with significant biological growth | Hectares | — | — | — | — | — | — | — | — | ||||||||
| Changes in Fair Value 12M17 from harvested area 2016/17 (i) | $ thousands | 7,786 | 4,351 | 1,628 | 236 | (849 | ) | 525 | 165 | 13,842 | |||||||
| 2017/18 Harvest Year | |||||||||||||||||
| Total Planted Area | Hectares | 58,069 | 21,374 | 45,823 | 4,156 | 35,519 | 2,863 | 3,132 | 170,936 | ||||||||
| Area planted in initial growth stages | Hectares | 53,987 | 21,374 | 23,830 | 4,156 | — | — | 3,132 | 106,479 | ||||||||
| Area planted with significant biological growth | Hectares | 4,082 | 21,993 | 1,306 | 2,863 | 30,244 | |||||||||||
| Area harvested in current period | Hectares | 34,213 | 34,213 | ||||||||||||||
| Changes in Fair Value 12M17 from planted area 2017/18 (ii) | $ thousands | 402 | — | 1,208 | — | 23 | 356 | — | 1,989 | ||||||||
| Changes in Fair Value 12M17 from harvested area 2017/18 (i) | $ thousands | 1,326 | 1,326 | ||||||||||||||
| Total Changes in Fair Value in 12M17 (i+ii) | $ thousands | 8,188 | 4,351 | 2,836 | 236 | 500 | 881 | 165 | 17,157 | ||||||||
| Rice |
| Rice - Highlights | ||||||||||||||
| metric | 4Q17 | 4Q16 | Chg % | 2017 | 2016 | Chg % | ||||||||
| Gross Sales | $ thousands | 26,981 | 15,673 | 72.2 | % | 86,478 | 96,562 | (10.4 | )% | |||||
| Gross Sales of White Rice | thousand tons(1) | 85.6 | 39.6 | 116.1 | % | 248.9 | 278.2 | (10.5 | )% | |||||
| $ thousands | 22,008 | 10,937 | 101.2 | % | 68,463 | 75,432 | (9.2 | )% | ||||||
| $ per ton | 257 | 276 | (6.9 | )% | 275 | 271 | 1.5 | % | ||||||
| Gross Sales of By-products | $ thousands | 4,973 | 4,736 | 5.0 | % | 18,015 | 21,130 | (14.7 | )% | |||||
| Adjusted EBITDA | $ thousands | 5,272 | (328.5 | ) | n.a | 12,179 | 11,698 | 4.1 | % | |||||
| Adjusted EBIT | $ thousands | 4,218 | (1,006 | ) | n.a | 8,328 | 8,932 | (6.8 | )% | |||||
Area under production (2) | hectares | 39,728 | 37,565 | 5.8 | % | 39,728 | 37,565 | 5.8 | % | |||||
| Rice Mills | ||||||||||||||
| Total Rice Produced | thousand tons(1) | 53.6 | 49.2 | 9.0 | % | 241.6 | 232.0 | 4.1 | % | |||||
| Ending stock | thousand tons(1) | 55.3 | 40.7 | 35.8 | % | 55.3 | 40.7 | 35.8 | % | |||||
(1) Of rough rice equivalent.
(2) Areas under production correspond to the 2015/16 and 2016/17 harvest years
11
Adjusted EBIT corresponding to Adecoagro’s 2017 rice segment is primarily explained by the harvest of the 2016/17 crop season during 1Q17 and 2Q17, and the biological growth of the 2017/18 season at year-end. The rice crop is planted during the end of the third quarter, grows mainly throughout the fourth quarter, and is mostly harvested during the first quarter of the following year. Harvested rough rice is processed throughout the year and transformed into white rice, which is sold in the local and export markets year round. The majority of the segment’s margins are generated in the first quarter as the crop is harvested, while only a small portion of the margin is generated as the rice is processed and sold during the fourth quarter.
Rice sales during 2017 reached $86.5 million, 10.4% lower than the previous year. This decrease responds to the commercial decision to postpone white rice sales to the first half of next year in order to capture higher prices and enhanced margins.
Nonetheless, despite lower selling volumes, Adjusted EBITDA reached $12.2 million, marking a 4.1% increased year-over-year. Higher yields coupled with a 5.8% increase in planted area allowed us to dilute fixed costs while at the same time increasing our rough rice production, redounding in less 3rd party purchases.
| Dairy |
| Dairy - Highlights | ||||||||||||||
| metric | 4Q17 | 4Q16 | Chg % | 2017 | 2016 | Chg % | ||||||||
| Gross Sales | $ thousands(1) | 9,428 | 11,451 | (17.7 | )% | 37,678 | 32,864 | 14.6 | % | |||||
| million liters(2) | 24.7 | 31.9 | (22.6 | )% | 97.8 | 104.4 | (6.3 | )% | ||||||
| $ per liter(3) | 0.34 | 0.33 | 3.0 | % | 0.35 | 0.28 | 25.0 | % | ||||||
| Adjusted EBITDA | $ thousands | 4,627 | 1,920 | 141.0 | % | 12,243 | 5,717 | 114.2 | % | |||||
| Adjusted EBIT | $ thousands | 4,327 | 1,679 | 157.7 | % | 11,206 | 4,753 | 135.8 | % | |||||
| Milking Cows | Average Heads | 7,166 | 6,967 | 2.9 | % | 6,967 | 6,880 | 1.3 | % | |||||
| Cow Productivity | Liter/Cow/Day | 38.1 | 38.6 | (1.3 | )% | 36.6 | 36.7 | (0.3 | )% | |||||
| Total Milk Produced | million liters | 25.1 | 24.7 | 1.6 | % | 93.2 | 92.4 | 0.9 | % | |||||
(1) Includes (i) $0.7 million from sales of culled cows in 4Q17 and $0.8 million in 4Q16, (ii) $0.05 million from sales of whey 4Q16; and (iii) $3.2 million from sales of powder milk in 4Q16
(2) Selling volumes include (i) 8.1 million liters of powder milk in 4Q16
(3) Sales price includes the sale of fluid milk and whole milk powder and excludes cattle and whey sales
Our Dairy business delivered outstanding operational and financial performance during 2017.
12
From an operational standpoint, cow productivity remains at very high levels. At the same time, improved cow management has also allowed us to increase operating capacity to 6,967 cows, 1.3% above last year. Milk production reached a total of 93.2 million liters in 2017, slightly above 2016.
Adjusted EBIT in 2017 reached $11.2 million, $6.5 million or 135.8% higher than the same period of 2016. This increase was primarily explained by a higher raw milk prices as a result of supply shortages due to excess rainfalls during the first half of the year. This proves the efficiency and stability of our production system. Unlike the typical grazing system, our milk production is not affected by any weather event such as floods, storms, etc. Thus, we were able to fully profit from the price increase and enhance our margins.
| All Other Segments |
| All Other Segments - Highlights | |||||||||||||
| metric | 4Q17 | 4Q16 | Chg % | 2017 | 2016 | Chg % | |||||||
| Gross Sales | $ thousands | 523 | 183 | 185.8 | % | 1,336 | 960 | 39.2 | % | ||||
| Adjusted EBITDA | $ thousands | 552 | 270 | 104.4 | % | 556 | 9,085 | (93.9 | )% | ||||
| Adjusted EBIT | $ thousands | 482 | 234 | 106.0 | % | 397 | 8,893 | (95.5 | )% | ||||
All Other Segments is primarily composed of our Cattle segment, among others. Our Cattle segment consists of over 60 thousand hectares of pasture land that is not suitable for crop production and is leased to third parties for cattle grazing activities. As of 2017, 27 thousand hectares are currently under lease agreements.
Adjusted EBIT for All Other Segments increased by $0.2 million in 4Q17, compared to the same period last year. Regarding full year 2017, adjusted EBIT reached $0.4 million, compared to a $8.9 million gain during 2016. As previously explained in our 3Q16 Earnings Release, $8.1 million corresponds to the settlement of an arbitration dispute with Marfrig Argentina SA, subsidiary of Marfrig Alimentos SA. The settlement compensates Adecoagro for unpaid invoices and provides indemnification for early termination of lease agreements for cattle grazing activities entered in December 2009, in which Marfrig Argentina SA acted as the lessee and Adecoagro’s subsidiaries as lessors.
13
| Land Transformation business |
| Land transformation - Highlights | ||||||||||||
| metric | 4Q17 | 4Q16 | Chg % | 2017 | 2016 | Chg % | ||||||
| Adjusted EBITDA | $ thousands | — | — | - % | — | — | - % | |||||
| Adjusted EBIT | $ thousands | — | — | - % | — | — | - % | |||||
| Land sold | Hectares | — | — | - % | — | — | - % | |||||
There were no farm sales in 4Q17. Land transformation is an ongoing process in our farms, which consists of transforming undervalued and undermanaged land into its highest production capabilities. Adecoagro is currently engaged in the transformation of several farms in the northeastern region of Argentina, where farms formerly used for cattle grazing are being successfully transformed into high yielding crop and rice farms.
The company is continuously seeking to recycle its capital by disposing of a portion of its developed farms. This allows the company to monetize the capital gains generated by its transformed farms and re-allocate its capital to other farms or assets with higher risk-adjusted returns, thereby enhancing return on invested capital.
14
| Sugar, Ethanol & Energy Business |
| Operational Performance |
| Sugar, Ethanol & Energy - Selected Information | ||||||||||||||
| metric | 4Q17 | 4Q16 | Chg % | 2017 | 2016 | Chg % | ||||||||
| Milling | ||||||||||||||
| Sugarcane Milled | tons | 2,201,322 | 3,117,916 | (29.4 | )% | 10,241,803 | 11,114,509 | (7.9 | )% | |||||
| Own Cane | tons | 1,968,749 | 2,813,302 | (30.0 | )% | 9,068,844 | 10,164,671 | (10.8 | )% | |||||
| Third Party Cane | tons | 232,573 | 304,614 | (23.6 | )% | 1,172,959 | 949,837 | 23.5 | % | |||||
| Production | ||||||||||||||
| Sugar | tons | 96,939 | 212,925 | (54.5 | )% | 567,068 | 701,060 | (19.1 | )% | |||||
| Ethanol | M3 | 106,237 | 121,199 | (12.3 | )% | 434,015 | 422,395 | 2.8 | % | |||||
| Hydrous Ethanol | M3 | 70,424 | 70,675 | (0.4 | )% | 262,530 | 252,908 | 3.8 | % | |||||
| Anhydrous Ethanol | M3 | 35,813 | 50,524 | (29.1 | )% | 171,485 | 169,487 | 1.2 | % | |||||
| TRS Equivalent Produced | tons | 282,012 | 429,405 | (34.3 | )% | 1,332,744 | 1,453,184 | (8.3 | )% | |||||
| Sugar mix in production | 38 | % | 52 | % | (26.9 | )% | 47 | % | 50 | % | (6.0 | )% | ||
| Ethanol mix in production | 62 | % | 48 | % | 29.2 | % | 53 | % | 50 | % | 6.0 | % | ||
| Energy Exported (sold to grid) | MWh | 168,843 | 257,993 | (34.6 | )% | 712,425 | 751,037 | (5.1 | )% | |||||
| Cogen efficiency (KWh sold per ton crushed) | KWh/ton | 76.7 | 82.7 | (7.3 | )% | 69.6 | 67.6 | 3.0 | % | |||||
| Agricultural Metrics | ||||||||||||||
| Harvested own sugarcane | tons | 1,968,749 | 2,813,302 | (30.0 | )% | 9,068,844 | 10,164,671 | (10.8 | )% | |||||
| Harvested area | Hectares | 22,287 | 30,907 | (27.9 | )% | 106,537 | 103,559 | 2.9 | % | |||||
| Yield | tons/hectare | 88.3 | 90.9 | (2.9 | )% | 85.1 | 98.2 | (13.3 | )% | |||||
| TRS content | kg/ton | 126.0 | 134.4 | (6.3 | )% | 127.0 | 127.3 | (0.2 | )% | |||||
| TRS per hectare | kg/hectare | 11,127 | 12,220 | (8.9 | )% | 10,812 | 12,500 | (13.5 | )% | |||||
| Mechanized harvest | % | 99.0 | % | 98.0 | % | 1.0 | % | 98.3 | % | 98.4 | % | (0.1 | )% | |
| Area | ||||||||||||||
| Sugarcane Plantation | hectares | 143,617 | 134,591 | 6.7 | % | 143,617 | 134,591 | 6.7 | % | |||||
| Expansion & Renewal Area | hectares | 5,436 | 5,475 | (0.7 | )% | 23,318 | 20,255 | 15.1 | % | |||||
The fourth quarter of 2017 was marked by abundant rainfalls in the Center South region, which generated disruptions and delays in harvesting operations. As a result, sugarcane crushing during the quarter reached 2.2 million tons, 29.4% lower than in 4Q16. This negative weather effect was partially offset by higher milling efficiency. In fact, milling per hour reached 2,109 tons in 4Q17, marking a 7% increase compared to 4Q16. Lower crushing volumes are reflected in a 34.3% decrease in sugar and ethanol production, measured in TRS equivalent and a
15
34.6% reduction in energy exports. The unharvested sugarcane as of December 31, 2017 remains on our fields and is expected to be harvested during 2018.
Our production mix was slanted towards ethanol production during 4Q17 to profit from higher ethanol prices when compared to sugar prices (16.5% higher for hydrous and 33.1% for anhydrous). On average, during the quarter, 38% of the total sugar content (TRS) was used for sugar production whereas 62% was used for ethanol production.
On a full year basis, sugarcane crushing reached 10.2 million tons, 7.9% lower than the previous year. This is explained by the reduction in crushing of 900,00 mt due to rain. Sugar production during the year reached 567.1 thousand tons, 19.1% lower compared to the same period of last year. As for ethanol, total production reached 434.0 thousand cubic meters, 2.8% higher than the previous year.
In terms of agricultural productivity, sugarcane yields in 2017 reached 85.1 tons/ha, 13.3% lower than the previous year, while TRS content per ton of sugarcane remained flat at 127.0 kg/ton. The combination of these two effects resulted in TRS production per hectare of 10.8 tons/ha, 13.5% below 2016. Last year´s agricultural performance was mainly explained by the extremely favorable weather conditions. Indeed, during the last quarter of 2015, the region received abundant rainfalls, positively affecting the yields of the cane harvested during 2016. At the same time, over 50% of the cane that was harvested in 2016 was 18-months cane. For its part, yields obtained during 2017 are higher compared to the region´s average.
As of December 31, 2017, our sugarcane plantation consisted of 137,697 hectares, representing a 2,3% growth year-over-year. Sugarcane planting continues to be a key strategy to supply our mills with sufficient quality raw material to operate at full capacity. During 2017 we planted a total of 23,318 hectares of sugarcane. Of this total area, 9.026 hectares correspond to expansion areas planted to supply the additional sugarcane needed in 2017 to operate at full capacity under the “continuous harvest” model; and 14,292 hectares correspond to areas planted to renew old plantations with younger high-yielding sugarcane, thus allowing us to maintain the productivity of our plantation.
16
| Financial Performance |
| Sugar, Ethanol & Energy - Highlights | |||||||||||||
| $ thousands | 4Q17 | 4Q16 | Chg % | 2017 | 2016 | Chg % | |||||||
Net Sales (1) | 172,082 | 259,420 | (33.7 | )% | 576,232 | 568,759 | 1.3 | % | |||||
| Gross Profit Manufacturing Activities | 44,630 | 80,144 | (44.3 | )% | 149,113 | 176,199 | (15.4 | )% | |||||
| Adjusted EBITDA | 81,334 | 112,067 | (27.4 | )% | 247,301 | 265,044 | (6.7 | )% | |||||
| Adjusted EBITDA Margin | 47.3 | % | 43.2 | % | 9.5 | % | 42.9 | % | 46.6 | % | (7.9 | )% | |
| Adjusted EBITDA Margin (net of third party commercialization) | 57.4 | % | 48.4 | % | 18.6 | % | 51.9 | % | 54.7 | % | (5.1 | )% | |
(1) Net Sales are calculated as Gross Sales net of sales taxes.
Net sales reached $172.1 million, 33.7% lower than 4Q16. This decrease was primarily driven by the 36.7% and 3.1% reduction in sugar and ethanol sales volumes, respectively. This, in turn, is explained by lower production in the quarter as a result of heavy rains experienced mainly during the months of November and December.
Adjusted EBITDA during 4Q17 was $81.3 million , 27.4% lower compared to previous year. Adjusted EBITDA was positively affected by the increase in the fair value of our sugarcane plantations. Indeed, rainy weather favors the development of the unharvested sugarcane. This effect were offset by the lower sugar, ethanol and energy selling volumes, coupled with lower sugar and ethanol selling prices.
On a cumulative basis, Adjusted EBITDA in 2017 reached $247.3 million, marking a 6.7% decrease compared to the same period of last year. This reduction is mainly explained by the increase in production cost (see next page); coupled with lower average realized sugar prices. These effects were partially offset by: (i) the increase in net sales as a result of higher ethanol and energy prices, (ii) the positive mark-to-market of our financial derivatives; and (iii) a $12.4 million increase in the fair value of our unharvested biological asset.
17
The table below reflects the breakdown of net sales for the Sugar, Ethanol & Energy business.
Sugar, Ethanol & Energy - Net Sales Breakdown (1) | ||||||||||||||||||||
| $ thousands | Units | ($/unit) | ||||||||||||||||||
| 4Q17 | 4Q16 | Chg % | 4Q17 | 4Q16 | Chg % | 4Q17 | 4Q16 | Chg % | ||||||||||||
Sugar (tons)(2) | 72,611 | 144,173 | (49.6 | )% | 215,913 | 341,315 | (36.7 | )% | 336 | 422 | (20.4 | )% | ||||||||
| Ethanol (cubic meters) | 85,353 | 93,972 | (9.2 | )% | 171,495 | 176,902 | (3.1 | )% | 498 | 531 | (6.3 | )% | ||||||||
Energy (Mwh)(3) | 14,118 | 21,275 | (33.6 | )% | 213,805 | 488,403 | (56.2 | )% | 66 | 44 | 51.6 | % | ||||||||
| TOTAL | 172,082 | 259,420 | (33.7 | )% | ||||||||||||||||
| $ thousands | Units | ($/unit) | ||||||||||||||||||
| 2017 | 2016 | Chg % | 2017 | 2016 | Chg % | 2017 | 2016 | Chg % | ||||||||||||
Sugar (tons)(2) | 304,761 | 330,459 | (7.8 | )% | 822,567 | 859,331 | (4.3 | )% | 370 | 385 | (3.7 | )% | ||||||||
| Ethanol (cubic meters) | 216,976 | 191,190 | 13.5 | % | 439,694 | 395,922 | 11.1 | % | 493 | 483 | 2.2 | % | ||||||||
Energy (Mwh)(3) | 54,495 | 47,110 | 15.7 | % | 860,814 | 1,028,323 | (16.3 | )% | 63 | 46 | 38.2 | % | ||||||||
| TOTAL | 576,232 | 568,759 | 1.3 | % | ||||||||||||||||
(1) Net Sales are calculated as Gross Sales net of ICMS, PIS, CONFINS, INSS and IPI taxes.
(2) Includes commercialization of third party sugar: 55.1k tons ($25.7m) in 4Q16; 195.5k tons ($81.8m) in 2016; 53.5k tons ($16.4m) in 4Q15; 117.6k tons ($39.6m) in 2015.
(3) Includes commercialization of energy from third parties.
Net sales during 4Q17 reached $172.1 million, 33.7% lower than 4Q16. As previously noted, abundant rainfalls during the quarter prevented us from undertaking harvesting operations and thus, lowered our production.
Sugar sales volumes fell by 36.7% year-over-year, mainly as a result of an 29.4% decrease in the volume of sugarcane crushed coupled with a lower sugar mix, resulting in a 54.5% reduction in sugar production. Our average realized selling price was $336 per ton, 20.4% lower than 4Q16, resulting in an 49.6% decrease in net sales. Ethanol sales in 4Q17 were 9.2% lower year-over-year, mainly as a result of a 6.3% decrease in average selling prices coupled with a slight decrease of 3.1% in selling volumes.
On a year-to-date basis, net sales of sugar, ethanol and energy reached $576.2 million, 1.3% higher than the previous year. The growth in sales has been mainly driven by higher ethanol sales volumes and average selling prices; and higher energy selling prices. Despite lower sugarcane crushing, ethanol production increased by 2.8% as a result of our decision to both maximize the ethanol mix and to sell part of our inventories, in order to profit from higher selling prices.
In the case of energy, average selling price increased by 38.2%, allowing us to offset the decrease in volumes as a result of lower sugarcane crushing. Overall, energy sales in 2017 reached $54.5 million, 15.7% higher year-over-year.
18
| Sugar, Ethanol & Energy - Total Production Costs | ||||||||||||
| $ thousands | 4Q17 | 4Q16 | Chg % | 2017 | 2016 | Chg % | ||||||
| Industrial costs | 27,043 | 23,625 | 14.5 | % | 105,390 | 82,608 | 27.6 | % | ||||
| Industrial costs | 19,177 | 13,860 | 38.4 | % | 71,229 | 56,053 | 27.1 | % | ||||
| Cane from 3rd parties | 7,866 | 9,765 | (19.4 | )% | 34,161 | 26,555 | 28.6 | % | ||||
| Agricultural costs | 66,442 | 77,753 | (14.5 | )% | 265,308 | 243,948 | 8.8 | % | ||||
| Harvest costs | 27,499 | 33,210 | (17.2 | )% | 111,018 | 110,317 | 0.6 | % | ||||
| Cane depreciation | 11,808 | 19,282 | (38.8 | )% | 53,920 | 42,396 | 27.2 | % | ||||
| Leasing costs | 8,809 | 10,046 | (12.3 | )% | 41,082 | 38,380 | 7.0 | % | ||||
| Maintenance costs | 18,326 | 15,215 | 20.4 | % | 59,288 | 52,855 | 12.2 | % | ||||
| Total Production Costs | 93,485 | 101,378 | (7.8 | )% | 370,698 | 326,556 | 13.5 | % | ||||
As shown in the table above, total production costs during 2017 reached $370.7 million, 13.5% higher compared to the same period of last year. The increase was mainly driven by (i) lower yields which resulted not only in higher agricultural costs but also in a 28.6% increase in 3rd party cane; (ii) the elimination of the PIS COFINS tax rebate, negatively affecting industrial costs; and (iii) the average appreciation of the Brazilian Real. Indeed, total costs measured in local currency increased by only 7.8%.
| Sugar, Ethanol & Energy - Changes in Fair Value | ||||||||||
| $ thousands | 4Q17 | 4Q16 | Chg % | 2017 | 2016 | Chg % | ||||
| Sugarcane Valuation Model current period | 93.2 | 82.4 | 13.1 | % | 93.2 | 82.4 | 13.1 | % | ||
| Sugarcane Valuation Model previous period | 68.9 | 106.3 | (35.2 | )% | 82.4 | 59.1 | 39.4 | % | ||
| Total Changes in Fair Value | 24.3 | (23.9) | n.a | 10.8 | 23.3 | (53.7 | )% | |||
Total Changes in Fair Value of Unharvested Biological Assets (what is currently growing on the fields and will be harvested during the next 12 months) reached $10.8 million, $12.5 million higher compared to 2016. The increase is mainly attributable to (i) the increase in planting area; coupled with (ii) higher projected yields as the cane that was not harvested continue to grow in the fields. These positive effects were partially offset by lower projected sugar prices.
19
| Corporate Expenses |
| Corporate Expenses | ||||||||||||
| $ thousands | 4Q17 | 4Q16 | Chg % | 2017 | 2016 | Chg % | ||||||
| Corporate Expenses | (5,335 | ) | (4,844 | ) | 10.1 | % | (21,664 | ) | (20,957 | ) | 3.4 | % |
Adecoagro’s corporate expenses include items that have not been allocated to a specific business segment, such as directors, executive officers and headquarters staff, and certain professional fees, travel expenses, and office lease expenses, among others. As shown on the table above, corporate expenses during 2017 reached $21.7 million, marking a 3.4% increase compared to the previous year. The increase is primarily explained by the year-over-year appreciation of the Argentine Peso, in real terms.
| Other Operating Income |
| Other Operating Income | |||||||||||||
| $ thousands | 4Q17 | 4Q16 | Chg % | 2017 | 2016 | Chg % | |||||||
| Gain / (Loss) from commodity derivative financial instruments | 9 | 15,694 | (99.9 | )% | 40,842 | (16,007 | ) | n.a | |||||
| Gain from disposal of other property items | (457 | ) | (1,334 | ) | (65.7 | )% | (986 | ) | (1,255 | ) | (21.4 | )% | |
| Other | 509 | 296 | 72.0 | % | (395 | ) | 8,965 | (104.4 | )% | ||||
| Total | 61 | 14,656 | (99.6 | )% | 39,461 | (8,297 | ) | (575.6 | )% | ||||
On a full year basis, we recorded a $39.5 million gain in Other Operating Income, marking $47.8 million increase compared to 2016. This is mainly explained by: (i) a $42.9 million increase related to our sugar hedge position; and (ii) a $3.7 million gain related to our soybean and corn hedge position, marking a $12.1 million increase compared to the previous year.
20
| Financial Results |
| Financial Results | |||||||||||||
| $ thousands | 4Q17 | 4Q16 | Chg % | 2017 | 2016 | Chg % | |||||||
| Interest Expenses, net | (9,571 | ) | (11,821 | ) | (19.0 | )% | (41,078 | ) | (40,527 | ) | 1.4 | % | |
| Cash Flow Hedge - Transfer from Equity | (10,069 | ) | (33,028 | ) | (69.5 | )% | (20,758 | ) | (85,214 | ) | (75.6 | )% | |
| FX Gain/(Loss), net | (20,198 | ) | (3,878 | ) | 420.8 | % | (38,708 | ) | (19,062 | ) | 103.1 | % | |
| Gain/(Loss) from derivative financial Instruments | (111 | ) | 1,145 | (109.7 | )% | (2,163 | ) | (5,694 | ) | (62.0 | )% | ||
| Taxes | (1,429 | ) | (806 | ) | 77.3 | % | (3,705 | ) | (2,719 | ) | 36.3 | % | |
| Prepayment related expenses | (10,847 | ) | — | n.a. | (10,847 | ) | — | n.a. | |||||
| Other Expenses, net | 557 | (1,917 | ) | (129.1 | )% | (2,346 | ) | (4,207 | ) | (44.2 | )% | ||
| Total Financial Results | (51,668 | ) | (50,305 | ) | 2.7 | % | (119,605 | ) | (157,423 | ) | (24.0 | )% | |
Net Financial Results in 2017 totaled a loss of $119.6 million, compared to a loss of $157.4 million in 2016. The most relevant changes year-over-year are:
| ◦ | Foreign currency losses (reflected in “Cash Flow Hedge(1)” and “FX Gain/Loss” line items) totaled $59.5 million in 2017 compared to $104.3 million in 2016. The decrease in losses in 2017 is mostly attributed to the fact that most of the accumulated loss was already recognized in 2016 as a substantial portion of our debt matured in that year (cash flow hedge currency losses are reclassified from equity to the P/L as debt is amortized). This positive effect was partially offset by the increase in Fx Loss associated with the 17% and 6% depreciaiton of the Argentine Peso and Brazilian Real, respectively during 2017, compared with a 14% depreciation of the Argentine Peso and a 19% appreciation of the Brazilian Real during 2016. |
| ◦ | As stated in our 3Q17 Earnings Release, the proceeds from our recent bond issuance were mostly used to repay existing debt of our Brazilian subsidiaries. During 2017 we paid $10.9 million in early termination fees. The bond issuance allowed us to marginally reduce our interest rate payments, and also strengthened our balance sheet by extending our debt maturity to an average of 8.5 years. |
21
| Commodity Hedging |
Adecoagro’s performance is affected by the volatile price environment inherent to agricultural commodities. The company uses both forward contracts and derivative instruments to mitigate swings in prices by locking margins and stabilizing profits. The table below shows the average selling prices for Adecoagro’s physical sales (i.e., volumes and average prices including past sales invoiced/delivered and fixed-price forward contracts).
| Commodity Hedge Position - as of December 31, 2017 | ||||||||
| Consolidated Hedge Position | ||||||||
| Farming | Avg. FAS Price | CBOT FOB | ||||||
Volume (1) | USD/Ton | USD/Bu | ||||||
| 2016/2017 Harvest season< | ||||||||
| Soybeans | 202,226 | 244.2 | 929.3 | |||||
| Corn | 247,050 | 159.5 | 426.9 | |||||
| 2017/2018 Harvest season | ||||||||
| Soybeans | 116,830 | 276.8 | 1,047.3 | |||||
| Corn | 85,422 | 186.9 | 485.7 | |||||
| Consolidated Hedge Position | ||||||||
| Sugar, Ethanol & Energy | Avg. FOB Price | ICE FOB | ||||||
Volume (1) | USD/Unit | Cents/Lb | ||||||
| 2016/2017 Harvest season | ||||||||
| Sugar (tons) | 537,971 | 387.6 | 17.6 | |||||
| Ethanol (m3) | 371,676 | 484.3 | n.a | |||||
| Energy (MW/h) (2) | 500,106 | 72.1 | n.a | |||||
| 2017/2018 Harvest season | ||||||||
| Sugar (tons) | 360,426 | 367.3 | 16.7 | |||||
| Ethanol (m3) | - | - | n.a | |||||
| Energy (MW/h) (2) | 350,400 | 75.2 | n.a | |||||
The table below shows the EBITDA Price, defined as the average selling price (at which the physical volumes are sold), plus the result originated from the mark-to-market of our derivatives position. These are the prices to be used when calculating EBITDA for the 2017 and 2016 fiscal year. Conceptually, they consider not only the
22
average selling price but also the results from our derivatives hedge positions that were booked in each fiscal year, independently on the harvest season
| EBITDA Price | |||||||||
| USD/Ton ; Cts/Lb | 2017 | 2016 | 2015 | ||||||
| Soybean | 320.0 | 207.7 | 304.5 | ||||||
| Average Selling Price | 302.7 | 261.7 | 265.5 | ||||||
| Hedging Result | 17.2 | (54.0 | ) | 39.0 | |||||
| 2014/15 Harvest | — | — | 19.6 | ||||||
| 2015/16 Harvest | — | (21.1 | ) | 18.6 | |||||
| 2016/17 Harvest | 11.7 | (32.9 | ) | 0.8 | |||||
| 2017/18 Harvest | 5.5 | — | — | ||||||
| Corn | 151.7 | 176.9 | 165.3 | ||||||
| Average Selling Price | 138.6 | 164.6 | 149.1 | ||||||
| Hedging Result | 13.1 | 12.3 | 16.2 | ||||||
| 2014/15 Harvest | — | — | 8.5 | ||||||
| 2015/16 Harvest | — | 2.7 | 7.3 | ||||||
| 2016/17 Harvest | 2.7 | 9.6 | 0.4 | ||||||
| 2017/18 Harvest | 10.4 | — | — | ||||||
| Sugar | 18.7 | 17.0 | 14.0 | ||||||
| Average Selling Price | 16.8 | 17.4 | 13.5 | ||||||
| Hedging Result | 1.9 | (0.4 | ) | 0.5 | |||||
| 2015/16 Harvest | — | — | 0.8 | ||||||
| 2016/17 Harvest | — | (0.4 | ) | (0.2 | ) | ||||
| 2017/18 Harvest | 1.3 | — | — | ||||||
| 2018/19 Harvest | 0.6 | — | — | ||||||
| Ethanol | 14.0 | 13.7 | 10.9 | ||||||
| Average Selling Price | 14.0 | 13.7 | 10.9 | ||||||
23
| Indebtedness |
| Net Debt Breakdown | |||||||||||
| $ thousands | 4Q17 | 3Q17 | Chg % | 4Q16 | Chg % | ||||||
| Farming | 136,135 | 165,989 | (17.99 | )% | 102,097 | 133,238.9 | % | ||||
| Short term Debt | 90,058 | 115,946 | (22.33 | )% | 44,546 | 202,068.5 | % | ||||
| Long term Debt | 46,077 | 50,043 | (7.93 | )% | 57,551 | 79,962.9 | % | ||||
| Sugar, Ethanol & Energy | 681,822 | 641,301 | 6.32 | % | 533,298 | 127,750.1 | % | ||||
| Short term Debt | 64,840 | 67,226 | (3.55 | )% | 160,545 | 40,287.4 | % | ||||
| Long term Debt | 616,982 | 574,075 | 7.47 | % | 372,753 | 165,420.3 | % | ||||
| Total Short term Debt | 154,898 | 183,172 | (15.44 | )% | 205,091 | 75,426.5 | % | ||||
| Total Long term Debt | 663,059 | 925,705 | (28.37 | )% | 430,304 | 153,990.8 | % | ||||
| Gross Debt | 817,958 | 1,108,878 | (26.24 | )% | 635,395 | 128,632.2 | % | ||||
| Cash & Equivalents | 269,195 | 523,175 | (48.5 | )% | 158,568 | 169,666.3 | % | ||||
| Net Debt | 548,763 | 585,703 | (6.31 | )% | 476,827 | 114,986.4 | % | ||||
| Net Debt / Adj. EBITDA | 1.98 | x | 1.95 | x | 1.54 | % | 1.60 | x | 23.8 | % | |
Adecoagro’s net debt as of 2017 year-end was $548.8 million, marking 15.0% increase compared to December 31, 2016. The increase in net debt was mainly driven by the $70.1 million deployed in expansion capex, which was financed with debt and cash from operations after share repurchases.
On a consolidated basis, gross debt stands at $818.0 million, compared to $635.4 million in 2016. In order to profit from lower interest rates, we decided to increase borrowings as of year-end and anticipate the funds needed to finance working capital and maintenance capex in our Sugar business during the first quarter of 2018.
Our net debt ratio (Net Debt / LTM Adj. EBITDA) reached 1.98x. As already noted, we consider our balance sheet to be in a solid position, considering not only the conservative debt levels but also its long term structure.
Cash and equivalents as of December 31, 2017, stood at $269.8 million, 70.1% higher year-over-year.
24
| Capital Expenditures & Investments |
| Capital Expenditures & Investments | |||||||||||||
| $ thousands | 4Q17 | 4Q16 | Chg % | 2017 | 2016 | Chg % | |||||||
| Farming & Land Transformation | 15,503 | 5,479 | 182.9 | % | 27,437 | 13,683 | 100.5 | % | |||||
| Maintenance | 2,159 | 1,637 | 31.8 | % | 6,241 | 4,291 | 47.0 | % | |||||
| Expansion | 13,344 | 3,842 | 247.4 | % | 21,197 | 9,392 | 124.6 | % | |||||
| SE&E | 41,006 | 36,152 | 13.4 | % | 172,235 | 119,533 | 44.1 | % | |||||
| Maintenance | 23,404 | 22,451 | 4.2 | % | 122,628 | 80,631 | 51.6 | % | |||||
| Planting | 11,141 | 10,647 | 4.6 | % | 51,142 | 45,741 | 11.8 | % | |||||
| Industrial & Agricultural Machinery | 12,262 | 11,804 | 3.9 | % | 71,485 | 34,889 | 103.5 | % | |||||
| Expansion | 17,602 | 13,701 | 28.5 | % | 49,607 | 38,902 | 28.3 | % | |||||
| Planting | 11,265 | 12,576 | (10.4 | )% | 32,871 | 28,434 | 15.6 | % | |||||
| Industrial & Agricultural Machinery | 6,337 | 1,125 | 463.2 | % | 16,736 | 10,469 | 63.5 | % | |||||
| Total | 56,509 | 41,631 | 35.7 | % | 199,673 | 133,216 | 49.9 | % | |||||
Adecoagro’s capital expenditures during 2017 totaled $199.7 million, 49.9% higher than 2016.
The Sugar, Ethanol and Energy business accounted for 86.3% or $172.2 million of total capex. Expansion capex reached $49.6 million, and was mostly destined to expansion of our sugarcane plantation to supply cane to the increase in capacity related to the organic growth project by which nominal crushing capacity will increase by 30% at the cluster. Maintenance capex increased by 51.6%, reaching $122.6 million . Maintenance capex consists mainly of renewal planting to maintain the productivity of our sugarcane plantation and maintenance of the mills and agricultural equipment (combine, tractors, trucks, etc). The increase in maintenance capex is related to an increase in renewal planting area explained by the growth and stabilization of our sugarcane plantation; coupled with the fact that this year we renewed most of our truck and tractor fleet. These effects were partially offset by the 6% BRL depreciation, since most of our capex is expensed in local currency.
Farming and Land transformation expenditures accounted for 13.7% or $27.4 million million of total capex in 2017. the increase is mainly driven by expansion capex in the Dairy business. During 2017, as part of our organic growth plan, we commenced the construction of a third free stall dairy. As already mentioned in previous Earnings Releases, we intend to double current operations in our Dairy business by building two additional free stalls. We believe this investment will allow us to leverage on our expertise and generate attractive returns.
25
| Inventories |
| End of Period Inventories | ||||||||||||||
| Volume | thousand $ | |||||||||||||
| Product | Metric | 4Q17 | 4Q16 | % Chg | 4Q17 | 4Q16 | % Chg | |||||||
| Soybean | tons | 29,733 | 15,642 | 90.1 | % | 8,769 | 3,775 | 132.3 | % | |||||
Corn (1) | tons | 27,386 | 13,422 | 104.0 | % | 3,345 | 1,774 | 88.6 | % | |||||
Wheat (2) | tons | 51,033 | 59,371 | (14.0 | )% | 7,136 | 7,281 | (2.0 | )% | |||||
| Sunflower | tons | — | 165 | n.a. | — | 44 | n.a. | |||||||
| Cotton | tons | 232 | 7 | 3,214.3 | % | 12 | 6 | 100.0 | % | |||||
Rough Rice (3) | tons | 27,455 | 24,734 | 11.0 | % | 8,350 | 4,837 | 72.6 | % | |||||
| Sugar | tons | 14,199 | 48,793 | (70.9 | )% | 4,282 | 15,131 | (71.7 | )% | |||||
| Ethanol | m3 | 69,148 | 69,291 | (0.2 | )% | 27,984 | 34,470 | (18.8 | )% | |||||
| Others | tons | 2,902 | — | n.a. | 2,010 | — | n.a. | |||||||
| Total | 222,088 | 231,424 | (4.0 | )% | 61,888 | 67,317 | (8.1 | )% | ||||||
(1) Includes sorghum.
(2) Includes barley.
(3) Expressed in rough rice equivalent
Variations in inventory levels between 2017 and 2016 are attributable to (i) changes in production volumes resulting from changes in planted area, the production mix between different crops and in yields obtained, (ii) a different percentage of area being harvested during the period, and (iii) changes in the commercial and selling strategy for each product. As of the end of February 2017, sugar and ethanol inventories have decreased significantly due to sales during January and February.
26
| Forward-looking Statements |
This press release contains forward-looking statements that are based on our current expectations, assumptions, estimates and projections about us and our industry. These forward-looking statements can be identified by words or phrases such as “anticipate,” “forecast”, “believe,” “continue,” “estimate,” “expect,” “intend,” “is/are likely to,” “may,” “plan,” “should,” “would,” or other similar expressions.
The forward-looking statements included in this press release relate to, among others: (i) our business prospects and future results of operations; (ii) weather and other natural phenomena; (iii) developments in, or changes to, the laws, regulations and governmental policies governing our business, including limitations on ownership of farmland by foreign entities in certain jurisdictions in which we operate, environmental laws and regulations; (iv) the implementation of our business strategy, including our development of the Ivinhema mill and other current projects; (v) our plans relating to acquisitions, joint ventures, strategic alliances or divestitures; (vi) the implementation of our financing strategy and capital expenditure plan; (vii) the maintenance of our relationships with customers; (viii) the competitive nature of the industries in which we operate; (ix) the cost and availability of financing; (x) future demand for the commodities we produce; (xi) international prices for commodities; (xii) the condition of our land holdings; (xiii) the development of the logistics and infrastructure for transportation of our products in the countries where we operate; (xiv) the performance of the South American and world economies; and (xv) the relative value of the Brazilian Reais, the Argentine Peso, and the Uruguayan Peso compared to other currencies; as well as other risks included in the registrant’s other filings and submissions with the United States Securities and Exchange Commission.
These forward-looking statements involve various risks and uncertainties. Although we believe that our expectations expressed in these forward-looking statements are reasonable, our expectations may turn out to be incorrect. Our actual results could be materially different from our expectations. In light of the risks and uncertainties described above, the estimates and forward-looking statements discussed in this press release might not occur, and our future results and our performance may differ materially from those expressed in these forward-looking statements due to, inclusive, but not limited to, the factors mentioned above. Because of these uncertainties, you should not make any investment decision based on these estimates and forward-looking statements.
The forward-looking statements made in this press release relate only to events or information as of the date on which the statements are made in this press release. We undertake no obligation to update any forward-looking statements to reflect events or circumstances after the date on which the statements are made or to reflect the occurrence of unanticipated events.
27
| Reconciliation of Non-IFRS measures |
To supplement our consolidated financial statements, which are prepared and presented in accordance with IFRS, we use the following non-IFRS financial measures in this press release:
| • | Adjusted EBITDA |
| • | Adjusted EBIT |
| • | Adjusted EBITDA margin |
| • | Adjusted Free Cash Flow from Operations |
| • | Adjusted Free Cash Flow |
| • | Net Debt |
| • | Net Debt to Adjusted EBITDA |
In this section, we intend to provide an explanation and a reconciliation of each of our non-IFRS financial measures to their most directly comparable IFRS measures of each non-IFRS measure. The presentation of these financial measures is not intended to be considered in isolation or as a substitute for, or superior to, financial information prepared and presented in accordance with IFRS.
We use non-IFRS measures to internally evaluate and analyze financial results. We believe these non-IFRS financial measures provide investors with useful supplemental information about the financial performance of our business, enable comparison of financial results between periods where certain items may vary independent of business performance, and enable comparison of our financial results with other public companies, many of which present similar non-IFRS financial measures.
There are limitations associated with the use of non-IFRS financial measures as an analytical tool. In particular, many of the adjustments to our IFRS financial measures reflect the exclusion of items, such as depreciation and amortization, changes in fair value and the related income tax effects of the aforementioned exclusions, that are recurring and will be reflected in our financial results for the foreseeable future. In addition, these measures may be different from non-IFRS financial measures used by other companies, limiting their usefulness for comparison purposes.
Adjusted EBITDA, Adjusted EBIT & Adjusted EBITDA margin
We define Adjusted EBITDA for each of our operating segments as the segment’s share of consolidated profit from operations before financing and taxation for the year or period, as applicable, before depreciation and amortization and adjusted by profit or loss from discontinued operations and by gains or losses from disposals of non-controlling interests in subsidiaries whose main underlying asset is farmland which are reflected in our Shareholders Equity under the line item “Reserve from the sale of minority interests in subsidiaries”.
We define Adjusted EBIT for each of our operating segments as the segment’s share of consolidated profit from operations before financing and taxation for the year or period, as applicable, adjusted by profit from discontinued
28
operations and by gains or losses from disposals of non-controlling interests in subsidiaries whose main underlying asset is farmland which are reflected in our Shareholders Equity under “Reserve from the sale of minority interests in subsidiaries”.
We believe that Adjusted EBITDA and Adjusted EBIT are for the Company and each operating segment, respectively important measures of operating performance because they allow investors and others to evaluate and compare our consolidated operating results and to evaluate and compare the operating performance of our segments, respectively, including our return on capital and operating efficiencies, from period to period by removing the impact of our capital structure (interest expense from our outstanding debt), asset base (depreciation and amortization), tax consequences (income taxes), foreign exchange gains or losses and other financial expenses. In addition, by including the gains or losses from disposals of non-controlling interests in subsidiaries whose main underlying asset is farmland, investors can evaluate the full value and returns generated by our land transformation activities. Other companies may calculate Adjusted EBITDA and Adjusted EBIT differently, and therefore Adjusted EBITDA and Adjusted EBIT may not be comparable to similarly titled measures used by other companies. Adjusted EBITDA and Adjusted EBIT are not a measures of financial performance under IFRS, and should not be considered in isolation or as an alternative to consolidated net profit (loss), cash flows from operating activities, profit from operations before financing and taxation and other measures determined in accordance with IFRS.
We define Adjusted EBITDA margin as Adjusted EBITDA to net sales. We consider that the presentation of adjusted EBITDA margin provides useful information on how successfully we operate our Company and enhances the ability of investors to compare profitability between segments, periods and with other public companies.
Reconciliation of both Adjusted EBITDA and Adusted EBIT starts on page 33.
Adjusted Free Cash Flow and Adjusted Free Cash Flow from Operations
We believe that the measures of Adjusted Free Cash Flow and Adjusted Free Cash Flow from Operations are important measures of liquidity that enable investors to draw important comparisons year to year of the amount of cash generated by the Company’s principal business and financing activities, which includes the cash generated from our land transformation activities, after paying for recurrent items, including interest, taxes and maintenance capital expenditures.
We define Adjusted Free Cash Flow as (i) net cash generated from operating activities, less (ii) net cash used in investing activities, less (iii) interest paid, plus (iv) proceeds from the sale of non-controlling interest in farming subsidiaries. We define Adjusted Free Cash Flow from Operations as (i) net cash generated from operating activities less (ii) net cash used in investing activities, less (iii) interest paid, plus (iv) proceeds from the sale of non-controlling interest in subsidiaries; plus (v) expansion capital expenditures ("expansion capex").
Expansion capex is defined as the required investment to expand current production capacity including organic growth, joint ventures and acquisitions. We define maintenance capital expenditures ("maintenance capex") as the necessary investments in order to maintain the current level of productivity both at an agricultural and at an industrial level. Proceeds from the sale of non-controlling interest in farming subsidiaries is a measure of the cash
29
generated from our land transformation business that is included under cash from financing activities pursuant to IFRS.
We believe Adjusted Free Cash Flow is an important liquidity measure for the Company because it allows investors and others to evaluate and compare the amount of cash generated by the Company business and financing activities to undertake growth investments, to fund acquisitions, to reduce outstanding financial debt. and to provie a return to shareholders in the form of dividends and/or share repurchases, among other things.
We believe Adjusted Free Cash Flow from Operations is an additional important liquidity metric for the Company because it allows investors and others to evaluate and compare the total amount of cash generated by the Company´s business and financing activities after paying for recurrent items including interest, taxes and maintanance capex. We belived this metric is relevant in evaluating the overall performance of our business.
Other companies may calculate Adjusted Free Cash Flow and Adjusted Free Cash Flow from Operations differently, and therefore our formulation may not be comparable to similarly titled measures used by other companies. Adjusted Free Cash Flow and Adjusted Free Cash Flow from Operations are not measures of liquidity under IFRS, and should not be considered in isolation or as an alternative to consolidated cash flows from operating activities, net increase (decrease) in cash and cash equivalents and other measures determined in accordance with IFRS.
| Reconciliation - Adjusted Free Cash Flow | ||||
| $ thousands | 2017 | 2016 | ||
| Net increase/(decrease) in cash and cash equivalents | 119,050 | (48,295 | ) | |
| Proceeds from the sale of minority interest in subsidiaries | — | — | ||
| Interest paid | (41,612 | ) | (48,400 | ) |
| Cash Flow from Financing Activities | (70,272 | ) | 181,682 | |
| Adjusted Free Cash Flow | 7,166 | 84,987 | ||
| Reconciliation - Adjusted Free Cash Flow from Operations | ||||
| $ thousands | 2017 | 2016 | ||
| Net increase/(decrease) in cash and cash equivalents | 119,050 | (48,295 | ) | |
| Expansion Capex | 71,891 | 48,295 | ||
| Proceeds from the sale of minority interest in subsidiaries | — | — | ||
| Interest paid | (41,612 | ) | (48,400 | ) |
| Cash Flow from Financing Activities | (70,272 | ) | 181,682 | |
| Adjusted Free Cash Flow from Operations | 79,057 | 133,282 | ||
30
Net Debt & Net Debt to Adjusted EBITDA
Net debt is defined as the sum of long- and short-term debt less cash and cash equivalents. This measure is widely used by management and investment analysts and we believe it shows the financial strength of the Company
Management is consistently tracking our leverage position and our ability to repay and service our debt obligations over time. We have therefore set a leverage ratio target that is measured by net debt divided by Adjusted EBITDA.
We believe that this metric provides useful information to investors because management uses it to manage our debt-equity ratio in order to promote access to debt financing instruments in the capital markets and our ability to meet scheduled debt service obligations.
| Reconciliation - Net Debt | ||||||
| $ thousands | 2017 | 2016 | ||||
| Total Borrowings | 817,958 | 635,395 | ||||
| Cash and Cash equivalents | 269,195 | 158,568 | ||||
| Net Debt | 548,763 | 476,827 | ||||
31
| Adjusted EBIT & Adjusted EBITDA Reconciliation to Profit/Loss - 12M17 | |||||||||||||||||||||||
| $ thousands | Crops | Rice | Dairy | Others | Farming | Sugar, Ethanol & Energy | Land Transformation | Corporate | Total | ||||||||||||||
| Sales of manufactured products and services rendered | 197,222 | 86,478 | 37,523 | 1,336 | 322,559 | 610,619 | — | — | 933,178 | ||||||||||||||
| Cost of manufactured products sold and services rendered | (196,302 | ) | (71,087 | ) | (36,979 | ) | (853 | ) | (305,221 | ) | (461,506 | ) | — | — | (766,727 | ) | |||||||
| Initial recog. and changes in FV of BA and agricultural produce | 17,158 | 10,236 | 11,769 | 267 | 39,430 | 23,790 | — | — | 63,220 | ||||||||||||||
| Gain from changes in NRV of agricultural produce after harvest | 8,852 | — | — | — | 8,852 | — | — | — | 8,852 | ||||||||||||||
| Gross Profit from Agricultural Activities | 26,930 | 25,627 | 12,313 | 750 | 65,620 | 172,903 | — | — | 238,523 | ||||||||||||||
| General and administrative expenses | (2,981 | ) | (4,699 | ) | (1,058 | ) | (174 | ) | (8,912 | ) | (26,806 | ) | — | (21,581 | ) | (57,299 | ) | ||||||
| Selling expenses | (7,501 | ) | (13,324 | ) | (711 | ) | (156 | ) | (21,692 | ) | (73,664 | ) | — | (43 | ) | (95,399 | ) | ||||||
| Other operating income, net | 7,719 | 724 | 662 | (23 | ) | 9,082 | 30,419 | — | (40 | ) | 39,461 | ||||||||||||
| Share of gain/(loss) of joint ventures | — | — | — | — | — | — | — | — | — | ||||||||||||||
| Profit from Operations Before Financing and Taxation | 24,167 | 8,328 | 11,206 | 397 | 44,098 | 102,852 | — | (21,664 | ) | 125,286 | |||||||||||||
| Reserve from the sale of minority interests in subsidiaries | — | — | — | — | — | — | — | — | — | ||||||||||||||
| Adjusted EBIT | 24,167 | 8,328 | 11,206 | 397 | 44,098 | 102,852 | — | (21,664 | ) | 125,286 | |||||||||||||
| (-) Depreciation PPE | 1,511 | 3,851 | 1,037 | 159 | 6,558 | 144,449 | — | — | 151,007 | ||||||||||||||
| Adjusted EBITDA | 25,678 | 12,179 | 12,243 | 556 | 50,656 | 247,301 | — | (21,664 | ) | 276,293 | |||||||||||||
| Reconciliation to Profit/(Loss) | |||||||||||||||||||||||
| Adjusted EBITDA | 276,293 | ||||||||||||||||||||||
| Reserve from the sale of minority interests in subsidiaries | — | ||||||||||||||||||||||
| (+) Depreciation PPE | (151,007 | ) | |||||||||||||||||||||
| (+) Financial result, net | (119,605 | ) | |||||||||||||||||||||
| (+) Income Tax (Charge)/Benefit | 6,068 | ||||||||||||||||||||||
| Profit/(Loss) for the Period | 11,749 | ||||||||||||||||||||||
32
| Adjusted EBIT & Adjusted EBITDA Reconciliation to Profit/Loss - 12M16 | |||||||||||||||||||||||
| $ thousands | Crops | Rice | Dairy | Others | Farming | Sugar, Ethanol & Energy | Land Transformation | Corporate | Total | ||||||||||||||
| Sales of manufactured products and services rendered | 142,124 | 96,562 | 32,897 | 960 | 272,543 | 596,692 | — | — | 869,235 | ||||||||||||||
| Cost of manufactured products sold and services rendered | (141,731 | ) | (83,574 | ) | (32,571 | ) | (212 | ) | (258,088 | ) | (420,493 | ) | — | — | (678,581 | ) | |||||||
| Initial recog. and changes in FV of BA and agricultural produce | 48,790 | 10,498 | 5,476 | (13 | ) | 64,751 | 60,705 | — | — | 125,456 | |||||||||||||
| Gain from changes in NRV of agricultural produce after harvest | (5,841 | ) | — | — | — | (5,841 | ) | — | — | — | (5,841 | ) | |||||||||||
| Gross Profit from Agricultural Activities | 43,342 | 23,486 | 5,802 | 735 | 73,365 | 236,904 | — | — | 310,269 | ||||||||||||||
| General and administrative expenses | (2,770 | ) | (3,373 | ) | (983 | ) | (290 | ) | (7,416 | ) | (22,648 | ) | — | (20,686 | ) | (50,750 | ) | ||||||
| Selling expenses | (5,692 | ) | (11,583 | ) | (752 | ) | (49 | ) | (18,076 | ) | (62,518 | ) | — | (79 | ) | (80,673 | ) | ||||||
| Other operating income, net | (8,787 | ) | 402 | 686 | 8,497 | 798 | (8,903 | ) | — | (192 | ) | (8,297 | ) | ||||||||||
| Share of gain/(loss) of joint ventures | — | — | — | — | — | — | — | — | — | ||||||||||||||
| Profit from Operations Before Financing and Taxation | 26,093 | 8,932 | 4,753 | 8,893 | 48,671 | 142,835 | — | (20,957 | ) | 170,549 | |||||||||||||
| Reserve from the sale of minority interests in subsidiaries | — | — | — | — | — | — | — | — | — | ||||||||||||||
| Adjusted EBIT | 26,093 | 8,932 | 4,753 | 8,893 | 48,671 | 142,835 | — | (20,957 | ) | 170,549 | |||||||||||||
| (-) Depreciation PPE | 1,369 | 2,766 | 964 | 192 | 5,291 | 122,209 | — | — | 127,500 | ||||||||||||||
| Adjusted EBITDA | 27,462 | 11,698 | 5,717 | 9,085 | 53,962 | 265,044 | — | (20,957 | ) | 298,049 | |||||||||||||
| Reconciliation to Profit/(Loss) | |||||||||||||||||||||||
| Adjusted EBITDA | 298,049 | ||||||||||||||||||||||
| Reserve from the sale of minority interests in subsidiaries | — | ||||||||||||||||||||||
| (+) Depreciation PPE | (127,500 | ) | |||||||||||||||||||||
| (+) Financial result, net | (157,423 | ) | |||||||||||||||||||||
| (+) Income Tax (Charge)/Benefit | (9,387 | ) | |||||||||||||||||||||
| Profit/(Loss) for the Period | 3,739 | ||||||||||||||||||||||
33
| Adjusted EBIT & Adjusted EBITDA Reconciliation to Profit/Loss - 4Q17 | |||||||||||||||||||||||
| $ thousands | Crops | Rice | Dairy | Others | Farming | Sugar, Ethanol & Energy | Land Transformation | Corporate | Total | ||||||||||||||
| Sales of goods and services rendered | 53,125 | 26,981 | 9,270 | 523 | 89,899 | 185,670 | — | — | 275,569 | ||||||||||||||
| Cost of goods sold and services rendered | (52,947 | ) | (20,954 | ) | (9,058 | ) | (529 | ) | (83,488 | ) | (141,040 | ) | — | — | (224,528 | ) | |||||||
| Initial recog. and changes in FV of BA and agricultural produce | 3,707 | 4,008 | 4,343 | 511 | 12,569 | 26,425 | — | — | 38,994 | ||||||||||||||
| Gain from changes in NRV of agricultural produce after harvest | 816 | — | — | — | 816 | — | — | — | 816 | ||||||||||||||
| Margin on Manufacturing and Agricultural Act. Before Opex | 4,701 | 10,035 | 4,555 | 505 | 19,796 | 71,055 | — | — | 90,851 | ||||||||||||||
| General and administrative expenses | (813 | ) | (1,315 | ) | (316 | ) | (44 | ) | (2,488 | ) | (4,956 | ) | — | (5,372 | ) | (12,816 | ) | ||||||
| Selling expenses | (2,251 | ) | (4,603 | ) | (44 | ) | (117 | ) | (7,015 | ) | (23,674 | ) | — | 48 | (30,641 | ) | |||||||
| Other operating income, net | 518 | 101 | 132 | 138 | 889 | (817 | ) | — | (11 | ) | 61 | ||||||||||||
| Share of gain/(loss) of joint ventures | — | — | — | — | — | — | — | — | — | ||||||||||||||
| Profit from Operations Before Financing and Taxation | 2,155 | 4,218 | 4,327 | 482 | 11,182 | 41,608 | — | (5,335 | ) | 47,455 | |||||||||||||
| Reserve from the sale of minority interests in subsidiaries | — | — | — | — | — | — | — | — | — | ||||||||||||||
| Adjusted EBIT | 2,155 | 4,218 | 4,327 | 482 | 11,182 | 41,608 | — | (5,335 | ) | 47,455 | |||||||||||||
| (-) Depreciation PPE | 471 | 1,054 | 300 | 70 | 1,895 | 39,726 | — | — | 41,621 | ||||||||||||||
| Adjusted EBITDA | 2,626 | 5,272 | 4,627 | 552 | 13,077 | 81,334 | — | (5,335 | ) | 89,076 | |||||||||||||
| Reconciliation to Profit/(Loss) | |||||||||||||||||||||||
| Adjusted EBITDA | 89,076 | ||||||||||||||||||||||
| Reserve from the sale of minority interests in subsidiaries | — | ||||||||||||||||||||||
| (+) Depreciation PPE | (41,621 | ) | |||||||||||||||||||||
| (+) Financial result, net | (51,668 | ) | |||||||||||||||||||||
| (+) Income Tax (Charge)/Benefit | 9,152 | ||||||||||||||||||||||
| Profit/(Loss) for the Period | 4,939 | ||||||||||||||||||||||
34
| Adjusted EBIT & Adjusted EBITDA Reconciliation to Profit/Loss - 4Q16 | |||||||||||||||||||||||
| $ thousands | Crops | Rice | Dairy | Others | Farming | Sugar, Ethanol & Energy | Land Transformation | Corporate | Total | ||||||||||||||
| Sales of manufactured products and services rendered | 32,476 | 15,673 | 11,484 | 183 | 59,816 | 272,272 | — | — | 332,088 | ||||||||||||||
| Cost of manufactured products sold and services rendered | (32,463 | ) | (13,782 | ) | (11,273 | ) | (70 | ) | (57,588 | ) | (192,128 | ) | — | — | (249,716 | ) | |||||||
| Initial recog. and changes in FV of BA and agricultural produce | 5,938 | 451 | 1,769 | (141 | ) | 8,017 | 8,515 | — | — | 16,532 | |||||||||||||
| Gain from changes in NRV of agricultural produce after harvest | 365 | — | — | — | 365 | — | — | — | 365 | ||||||||||||||
| Gross Profit from Agricultural Activities | 6,316 | 2,342 | 1,980 | (28 | ) | 10,610 | 88,659 | — | — | 99,269 | |||||||||||||
| General and administrative expenses | (836 | ) | (1,090 | ) | (243 | ) | (95 | ) | (2,264 | ) | (7,479 | ) | — | (4,803 | ) | (14,546 | ) | ||||||
| Selling expenses | (1,271 | ) | (2,345 | ) | (276 | ) | (3 | ) | (3,895 | ) | (26,715 | ) | — | (48 | ) | (30,658 | ) | ||||||
| Other operating income, net | 9 | 88 | 218 | 360 | 675 | 13,974 | — | 7 | 14,656 | ||||||||||||||
| Share of gain/(loss) of joint ventures | — | — | — | — | — | — | — | — | — | ||||||||||||||
| Profit from Operations Before Financing and Taxation | 4,218 | (1,005 | ) | 1,679 | 234 | 5,126 | 68,439 | — | (4,844 | ) | 68,721 | ||||||||||||
| Reserve from the sale of minority interests in subsidiaries | — | — | — | — | — | — | — | — | — | ||||||||||||||
| Adjusted EBIT | 4,218 | (1,005 | ) | 1,679 | 234 | 5,126 | 68,439 | — | (4,844 | ) | 68,721 | ||||||||||||
| (-) Depreciation PPE | 340 | 886 | 241 | 36 | 1,503 | 43,628 | — | — | 45,131 | ||||||||||||||
| Adjusted EBITDA | 4,558 | (119 | ) | 1,920 | 270 | 6,629 | 112,067 | — | (4,844 | ) | 113,852 | ||||||||||||
| Reconciliation to Profit/(Loss) | |||||||||||||||||||||||
| Adjusted EBITDA | 113,852 | ||||||||||||||||||||||
| Reserve from the sale of minority interests in subsidiaries | — | ||||||||||||||||||||||
| (+) Depreciation PPE | (45,131 | ) | |||||||||||||||||||||
| (+) Financial result, net | (50,305 | ) | |||||||||||||||||||||
| (+) Income Tax (Charge)/Benefit | (6,486 | ) | |||||||||||||||||||||
| Profit/(Loss) for the Period | 11,930 | ||||||||||||||||||||||
35
| Condensed Consolidated Statement of Income |
| Statement of Income | |||||||||||||||||
| $ thousands | 4Q17 | 4Q16 | Chg % | 2017 | 2016 | Chg % | |||||||||||
| Sales of goods and services rendered | 275,569 | 332,088 | (17.0 | )% | 933,178 | 869,235 | 7.4 | % | |||||||||
| Cost of goods sold and services rendered | (224,528 | ) | (249,716 | ) | (10.1 | )% | (766,727 | ) | (678,581 | ) | 13.0 | % | |||||
| Initial recognition and changes in fair value of biological assets and agricultural produce | 38,994 | 16,532 | 135.9 | % | 63,220 | 125,456 | (49.6 | )% | |||||||||
| Changes in net realizable value of agricultural produce after harvest | 816 | 365 | 123.6 | % | 8,852 | (5,841 | ) | (251.5 | )% | ||||||||
| Margin on manufacturing and agricultural activities before operating Expenses | 90,851 | 99,269 | (8.5 | )% | 238,523 | 310,269 | (23.1 | )% | |||||||||
| General and administrative expenses | (12,816 | ) | (14,546 | ) | (11.9 | )% | (57,299 | ) | (50,750 | ) | 12.9 | % | |||||
| Selling expenses | (30,641 | ) | (30,658 | ) | (0.1 | )% | (95,399 | ) | (80,673 | ) | 18.3 | % | |||||
| Other operating income, net | 61 | 14,656 | (99.6 | )% | 39,461 | (8,297 | ) | (575.6 | )% | ||||||||
| Profit from operations | 47,455 | 68,721 | (30.9 | )% | 125,286 | 170,549 | (26.5 | )% | |||||||||
| Finance income | 3,002 | 982 | 205.7 | % | 11,744 | 7,957 | 47.6 | % | |||||||||
| Finance costs | (54,670 | ) | (51,287 | ) | 6.6 | % | (131,349 | ) | (165,380 | ) | (20.6 | )% | |||||
| Financial results, net | (51,668 | ) | (50,305 | ) | 2.7 | % | (119,605 | ) | (157,423 | ) | (24.0 | )% | |||||
| Profit / (Loss) before income tax | (4,213 | ) | 18,416 | (122.9 | )% | 5,681 | 13,126 | (56.7 | )% | ||||||||
| Income tax benefit / (expense) | 9,152 | (6,486 | ) | (241.1 | )% | 6,068 | (9,387 | ) | (164.6 | )% | |||||||
| Profit / (Loss) for the Year | 4,939 | 11,930 | (58.6 | )% | 11,749 | 3,739 | 214.2 | % | |||||||||
36
| Condensed Consolidated Statement of Cash Flow |
| Statement of Cashflows | ||||||||||||||||||
| $ thousands | 4Q17 | 4Q16 | Chg % | 12M17 | 12M16 | Chg % | ||||||||||||
| Cash flows from operating activities: | ||||||||||||||||||
| Profit for the period | 4,939 | 11,930 | (58.6 | )% | 11,749 | 3,739 | 214.2 | % | ||||||||||
| Adjustments for: | ||||||||||||||||||
| Income tax benefit | (9,152 | ) | 6,486 | (241.1 | )% | (6,068 | ) | 9,387 | (164.6 | )% | ||||||||
| Depreciation | 41,350 | 44,912 | (7.9 | )% | 150,071 | 126,799 | 18.4 | % | ||||||||||
| Amortization | 271 | 219 | 23.7 | % | 936 | 701 | 33.5 | % | ||||||||||
| Loss/(Gain)from of disposal of other property items | 457 | 1,332 | (65.7 | )% | 986 | 1,255 | (21.4 | )% | ||||||||||
| Equity settled share-based compensation granted | 1,328 | 871 | 52.5 | % | 5,552 | 4,796 | 15.8 | % | ||||||||||
| Loss/(Gain) from derivative financial instruments and forwards | 102 | (16,810 | ) | (100.6 | )% | (38,679 | ) | 21,745 | (277.9 | )% | ||||||||
| Interest and other expense, net | 19,709 | 13,738 | 43.5 | % | 53,446 | 44,734 | 19.5 | % | ||||||||||
| Initial recognition and changes in fair value of non harvested biological assets (unrealized) | (23,035 | ) | 26,653 | (186.4 | )% | (14,645 | ) | (9,811 | ) | 49.3 | % | |||||||
| Changes in net realizable value of agricultural produce after harvest (unrealized) | 840 | (750 | ) | (212.0 | )% | (2,371 | ) | 90 | (2,734.4 | )% | ||||||||
| Provision and allowances | 152 | 256 | (40.6 | )% | 825 | 341 | 141.9 | % | ||||||||||
| Foreign exchange gains, net | 20,198 | 3,878 | 420.8 | % | 38,708 | 19,062 | 103.1 | % | ||||||||||
| Cash flow hedge – transfer from equity | 10,069 | 33,028 | (69.5 | )% | 20,758 | 85,214 | (75.6 | )% | ||||||||||
| Subtotal | 67,228 | 125,743 | (46.5 | )% | 221,268 | 308,052 | (28.2 | )% | ||||||||||
| Changes in operating assets and liabilities: | ||||||||||||||||||
| (Increase) in trade and other receivables | 39,054 | 46,365 | (15.8 | )% | (9,476 | ) | (30,996 | ) | (69.4 | )% | ||||||||
| (Increase) in inventories | 52,803 | (69,237 | ) | (176.3 | )% | (4,089 | ) | (22,301 | ) | (81.7 | )% | |||||||
| (Increase) in biological assets | (42,573 | ) | 83,637 | (150.9 | )% | (18,013 | ) | (23,677 | ) | (23.9 | )% | |||||||
| Decrease / (Increase) in other assets | 209 | 32 | 553.1 | % | 2 | 83 | (97.6 | )% | ||||||||||
| Decrease / (Increase) in derivative financial instruments | 774 | 9,519 | (91.9 | )% | 40,910 | (17,892 | ) | (328.6 | )% | |||||||||
| Increase / (Decrease) in trade and other payables | 26,497 | 27,068 | (2.1 | )% | 6,555 | 39,054 | (83.2 | )% | ||||||||||
| Increase in payroll and social security liabilities | (5,315 | ) | (2,836 | ) | 87.4 | % | 1,953 | 3,052 | (36.0 | )% | ||||||||
| Increase in provisions for other liabilities | 426 | 167 | 155.1 | % | 855 | 1,175 | (27.2 | )% | ||||||||||
| Net cash generated in operating activities before interest and taxes paid | 139,103 | 220,458 | (36.9 | )% | 239,965 | 256,550 | (6.5 | )% | ||||||||||
| Income tax paid | (612 | ) | (148 | ) | 313.5 | % | (2,860 | ) | (1,149 | ) | 148.9 | % | ||||||
| Net cash generated from operating activities | 138,491 | 220,310 | (37.1 | )% | 237,105 | 255,401 | (7.2 | )% | ||||||||||
| Cash flows from investing activities: | ||||||||||||||||||
| Continuing operations: | ||||||||||||||||||
| Purchases of property, plant and equipment | (56,327 | ) | (41,175 | ) | 36.8 | % | (198,550 | ) | (132,392 | ) | 50.0 | % | ||||||
| Purchases of intangible assets | (751 | ) | (201 | ) | 273.6 | % | (2,141 | ) | (1,218 | ) | 75.8 | % | ||||||
| Purchase of cattle and non current biological assets | (687 | ) | — | n.a | (1,694 | ) | (1,713 | ) | (1.1 | )% | ||||||||
| Interest received | 2,784 | 948 | 193.7 | % | 11,230 | 7,671 | 46.4 | % | ||||||||||
| Proceeds from disposal of other property items | 961 | 2,215 | (56.6 | )% | 2,820 | 2,215 | 27.3 | % | ||||||||||
| Proceeds from disposal of subsidiaries | — | — | n.a | — | 3,423 | n.a | ||||||||||||
| Net cash used in investing activities | (54,020 | ) | (38,213 | ) | 41.4 | % | (188,335 | ) | (122,014 | ) | 54.4 | % | ||||||
| Cash flows from financing activities: | ||||||||||||||||||
| Proceeds from equity settled share-based compensation exercised | — | 104 | (100.0 | )% | 39 | 380 | (89.7 | )% | ||||||||||
| Proceeds from long-term borrowings | 2,042 | 55,805 | (96.3 | )% | 232,433 | 167,385 | 38.9 | % | ||||||||||
| Payments of long-term borrowings | (272,828 | ) | (115,184 | ) | 136.9 | % | (602,700 | ) | (277,913 | ) | 116.9 | % | ||||||
| Proceeds from short-term borrowings | 14,002 | 49,949 | (72.0 | )% | 106,730 | 257,395 | (58.5 | )% | ||||||||||
| Payment of short-term borrowings | (36,295 | ) | (127,513 | ) | (71.5 | )% | (64,787 | ) | (272,033 | ) | (76.2 | )% | ||||||
| Interest paid | (8,174 | ) | (16,585 | ) | (50.7 | )% | (41,612 | ) | (48,400 | ) | (14.0 | )% | ||||||
| Prepayment related expenses | (9,365 | ) | — | n.a | (6,080 | ) | — | n.a | ||||||||||
| Issuance of senior notes | (473 | ) | — | n.a | 495,678 | — | n.a | |||||||||||
| Payment of derivatives financial instruments | (112 | ) | (1,394 | ) | (92.0 | )% | (9,476 | ) | (3,724 | ) | 154.5 | % | ||||||
| Purchase of own shares | (27,025 | ) | (3,744 | ) | 621.8 | % | (38,367 | ) | (4,772 | ) | 704.0 | % | ||||||
| Dividends paid to non-controlling interest | (158 | ) | — | n.a | (1,664 | ) | — | n.a | ||||||||||
| Net cash generated from financing activities | (338,386 | ) | (158,562 | ) | 113.4 | % | 70,194 | (181,682 | ) | (138.6 | )% | |||||||
| Net increase/(decrease) in cash and cash equivalents | (253,915 | ) | 23,535 | (1,178.9 | )% | 118,964 | (48,295 | ) | (346.3 | )% | ||||||||
| Cash and cash equivalents at beginning of period | 523,175 | 136,482 | 283.3 | % | 158,568 | 198,894 | (20.3 | )% | ||||||||||
| Effect of exchange rate changes on cash and cash equivalents | (3,350 | ) | 101 | (3,416.8 | )% | (8,337 | ) | 7,969 | (204.6 | )% | ||||||||
| Cash and cash equivalents at end of period | 265,910 | 160,118 | 66.1 | % | 269,195 | 158,568 | 69.8 | % | ||||||||||
37
| Condensed Consolidated Balance Sheet |
| Statement of Financial Position | |||||||||
| $ thousands | December 31, 2017 | December 31, 2016 | Chg % | ||||||
| ASSETS | |||||||||
| Non-Current Assets | |||||||||
| Property, plant and equipment | 820,931 | 802,608 | 2.3 | % | |||||
| Investment property | 2,271 | 2,666 | (14.8 | )% | |||||
| Intangible assets | 17,192 | 17,252 | (0.3 | )% | |||||
| Biological assets | 11,276 | 8,516 | 32.4 | % | |||||
| Deferred income tax assets | 43,437 | 38,586 | 12.6 | % | |||||
| Trade and other receivables | 22,107 | 17,412 | 27.0 | % | |||||
| Other assets | 535 | 566 | (5.5 | )% | |||||
| Total Non-Current Assets | 917,749 | 887,606 | 3.4 | % | |||||
| Current Assets | |||||||||
| Biological assets | 156,718 | 136,888 | 14.5 | % | |||||
| Inventories | 108,919 | 111,754 | (2.5 | )% | |||||
| Trade and other receivables | 150,107 | 157,528 | (4.7 | )% | |||||
| Derivative financial instruments | 4,483 | 3,398 | 31.9 | % | |||||
| Cash and cash equivalents | 269,195 | 158,568 | 69.8 | % | |||||
| Other assets | 30 | 24 | 25.0 | % | |||||
| Total Current Assets | 689,452 | 568,160 | 21.3 | % | |||||
| TOTAL ASSETS | 1,607,201 | 1,455,766 | 10.4 | % | |||||
| SHAREHOLDERS EQUITY | |||||||||
| Capital and reserves attributable to equity holders of the parent | |||||||||
| Share capital | 183,573 | 183,573 | — | % | |||||
| Share premium | 908,934 | 937,250 | (3.0 | )% | |||||
| Cumulative translation adjustment | (541,545 | ) | (527,364 | ) | 2.7 | % | |||
| Equity-settled compensation | 17,852 | 17,218 | 3.7 | % | |||||
| Cash flow hedge | (24,691 | ) | (37,299 | ) | (33.8 | )% | |||
| Reserve for the sale of non contolling interests in subsidiaries | 41,574 | 41,574 | — | % | |||||
| Treasury shares | (6,967 | ) | (1,859 | ) | 274.8 | % | |||
| Retained earnings | 60,984 | 50,998 | 19.6 | % | |||||
| Equity attributable to equity holders of the parent | 639,714 | 664,091 | (3.7 | )% | |||||
| Non controlling interest | 5,417 | 7,582 | (28.6 | )% | |||||
| TOTAL SHAREHOLDERS EQUITY | 645,131 | 671,673 | (4.0 | )% | |||||
| LIABILITIES | |||||||||
| Non-Current Liabilities | |||||||||
| Trade and other payables | 827 | 1,427 | (42.0 | )% | |||||
| Borrowings | 663,060 | 430,304 | 54.1 | % | |||||
| Deferred income tax liabilities | 10,457 | 14,689 | (28.8 | )% | |||||
| Payroll and social security liabilities | 1,240 | 1,235 | 0.4 | % | |||||
| Derivatives financial instruments | — | 662 | (100.0 | )% | |||||
| Provisions for other liabilities | 4,078 | 3,299 | 23.6 | % | |||||
| Total Non-Current Liabilities | 679,662 | 451,616 | 50.5 | % | |||||
| Current Liabilities | |||||||||
| Trade and other payables | 98,423 | 92,158 | 6.8 | % | |||||
| Current income tax liabilities | 503 | 1,387 | (63.7 | )% | |||||
| Payroll and social security liabilities | 27,267 | 26,844 | 1.6 | % | |||||
| Borrowings | 154,898 | 205,092 | (24.5 | )% | |||||
| Derivative financial instruments | 552 | 6,406 | (91.4 | )% | |||||
| Provisions for other liabilities | 765 | 590 | 29.7 | % | |||||
| Total Current Liabilities | 282,408 | 332,477 | (15.1 | )% | |||||
| TOTAL LIABILITIES | 962,070 | 784,093 | 22.7 | % | |||||
| TOTAL SHAREHOLDERS EQUITY AND LIABILITIES | 1,607,201 | 1,455,766 | 10.4 | % | |||||
38