UNITED STATES
SECURITIES AND EXCHANGE COMMISSION
Washington, D.C. 20549
FORM 6-K
Report of Foreign Private Issuer
Pursuant to Rule 13a-16 or 15d-16
of the Securities Exchange Act of 1934
For the month of May 2018
Commission File Number: 001-35052
Adecoagro S.A.
(Translation of registrant’s name into English)
Vertigo Naos Building 6,
Rue Eugene Ruppert,
L-2453, Luxembourg
Grand Duchy of Luxembourg
(Address of principal executive offices)
Indicate by check mark whether the registrant files or will file annual reports under cover of Form 20-F or Form 40-F:
Form 20-F x Form 40-F ¨
Indicate by check mark if the registrant is submitting the Form 6-K in paper as permitted by Regulation S-T Rule 101(b)(1):
Yes ¨ No x
Indicate by check mark if the registrant is submitting the Form 6-K in paper as permitted by Regulation S-T Rule 101(b)(7):
Yes ¨ No x
Indicate by check mark whether by furnishing the information contained in this Form, the Registrant is also thereby furnishing the information to the Commission pursuant to Rule 12g3-2(b) under the Securities Exchange Act of 1934:
Yes ¨ No x
If “Yes” is marked, indicate below the file number assigned to the registrant in connection with Rule 12g3-2(b): N/A
ANNOUNCEMENT OF RESULTS OF OPERATIONS FOR THE THREE MONTH PERIOD
ENDED MARCH 31, 2018
On May 14, 2018, the registrant issued a press release pertaining to its results of operations for the three month period ended March 31, 2018 (the “Release”). Registrant hereby furnishes the attached copy of the Release to the Securities and Exchange Commission. The financial and operational information contained in the Release is based on audited consolidated financial statements presented in U.S. dollars and prepared in accordance with International Financial Reporting Standards.
The attachment contains forward-looking statements. The registrant desires to qualify for the “safe-harbor” provisions of the Private Securities Litigation Reform Act of 1995, and consequently is hereby including cautionary statements identifying important factors that could cause the registrant’s actual results to differ materially from those set forth in the attachment.
The registrant’s forward-looking statements are based on the registrant’s current expectations, assumptions, estimates and projections about the registrant and its industry. These forward-looking statements can be identified by words or phrases such as “anticipate,” “believe,” “continue,” “estimate,” “expect,” “intend,” “is/are likely to,” “may,” “plan,” “should,” “would,” or other similar expressions.
The forward-looking statements included in the attached relate to, among others: (i) the registrant’s business prospects and future results of operations; (ii) weather and other natural phenomena; (iii) developments in, or changes to, the laws, regulations and governmental policies governing the registrant’s business, including limitations on ownership of farmland by foreign entities in certain jurisdictions in which the registrant operate, environmental laws and regulations; (iv) the implementation of the registrant’s business strategy; (v) the registrant’s plans relating to acquisitions, joint ventures, strategic alliances or divestitures; (vi) the implementation of the registrant’s financing strategy and capital expenditure plan; (vii) the maintenance of the registrant’s relationships with customers; (viii) the competitive nature of the industries in which the registrant operates; (ix) the cost and availability of financing; (x) future demand for the commodities the registrant produces; (xi) international prices for commodities; (xii) the condition of the registrant’s land holdings; (xiii) the development of the logistics and infrastructure for transportation of the registrant’s products in the countries where it operates; (xiv) the performance of the South American and world economies; and (xv) the relative value of the Brazilian Real, the Argentine Peso, and the Uruguayan Peso compared to other currencies; as well as other risks included in the registrant’s other filings and submissions with the United States Securities and Exchange Commission.
These forward-looking statements involve various risks and uncertainties. Although the registrant believes that its expectations expressed in these forward-looking statements are reasonable, its expectations may turn out to be incorrect. The registrant’s actual results could be materially different from its expectations. In light of the risks and uncertainties described above, the estimates and forward-looking statements discussed in the attached might not occur, and the registrant’s future results and its performance may differ materially from those expressed in these forward-looking statements due to, inclusive, but not limited to, the factors mentioned above. Because of these uncertainties, you should not make any investment decision based on these estimates and forward-looking statements.
The forward-looking statements made in the attached relate only to events or information as of the date on which the statements are made in the attached. The registrant undertakes no obligation to update any forward-looking statements to reflect events or circumstances after the date on which the statements are made or to reflect the occurrence of unanticipated events.
SIGNATURES
Pursuant to the requirements of the Securities Exchange Act of 1934, the registrant has duly caused this report to be signed on its behalf by the undersigned, thereunto duly authorized.
| Adecoagro S.A. | |
| By /s/ Carlos A. Boero Hughes | |
| Name: Carlos A. Boero Hughes | |
| Title: Chief Financial Officer and Chief Accounting Officer | |
Date: May 14, 2018
4
| Financial & Operational Performance Highlights |
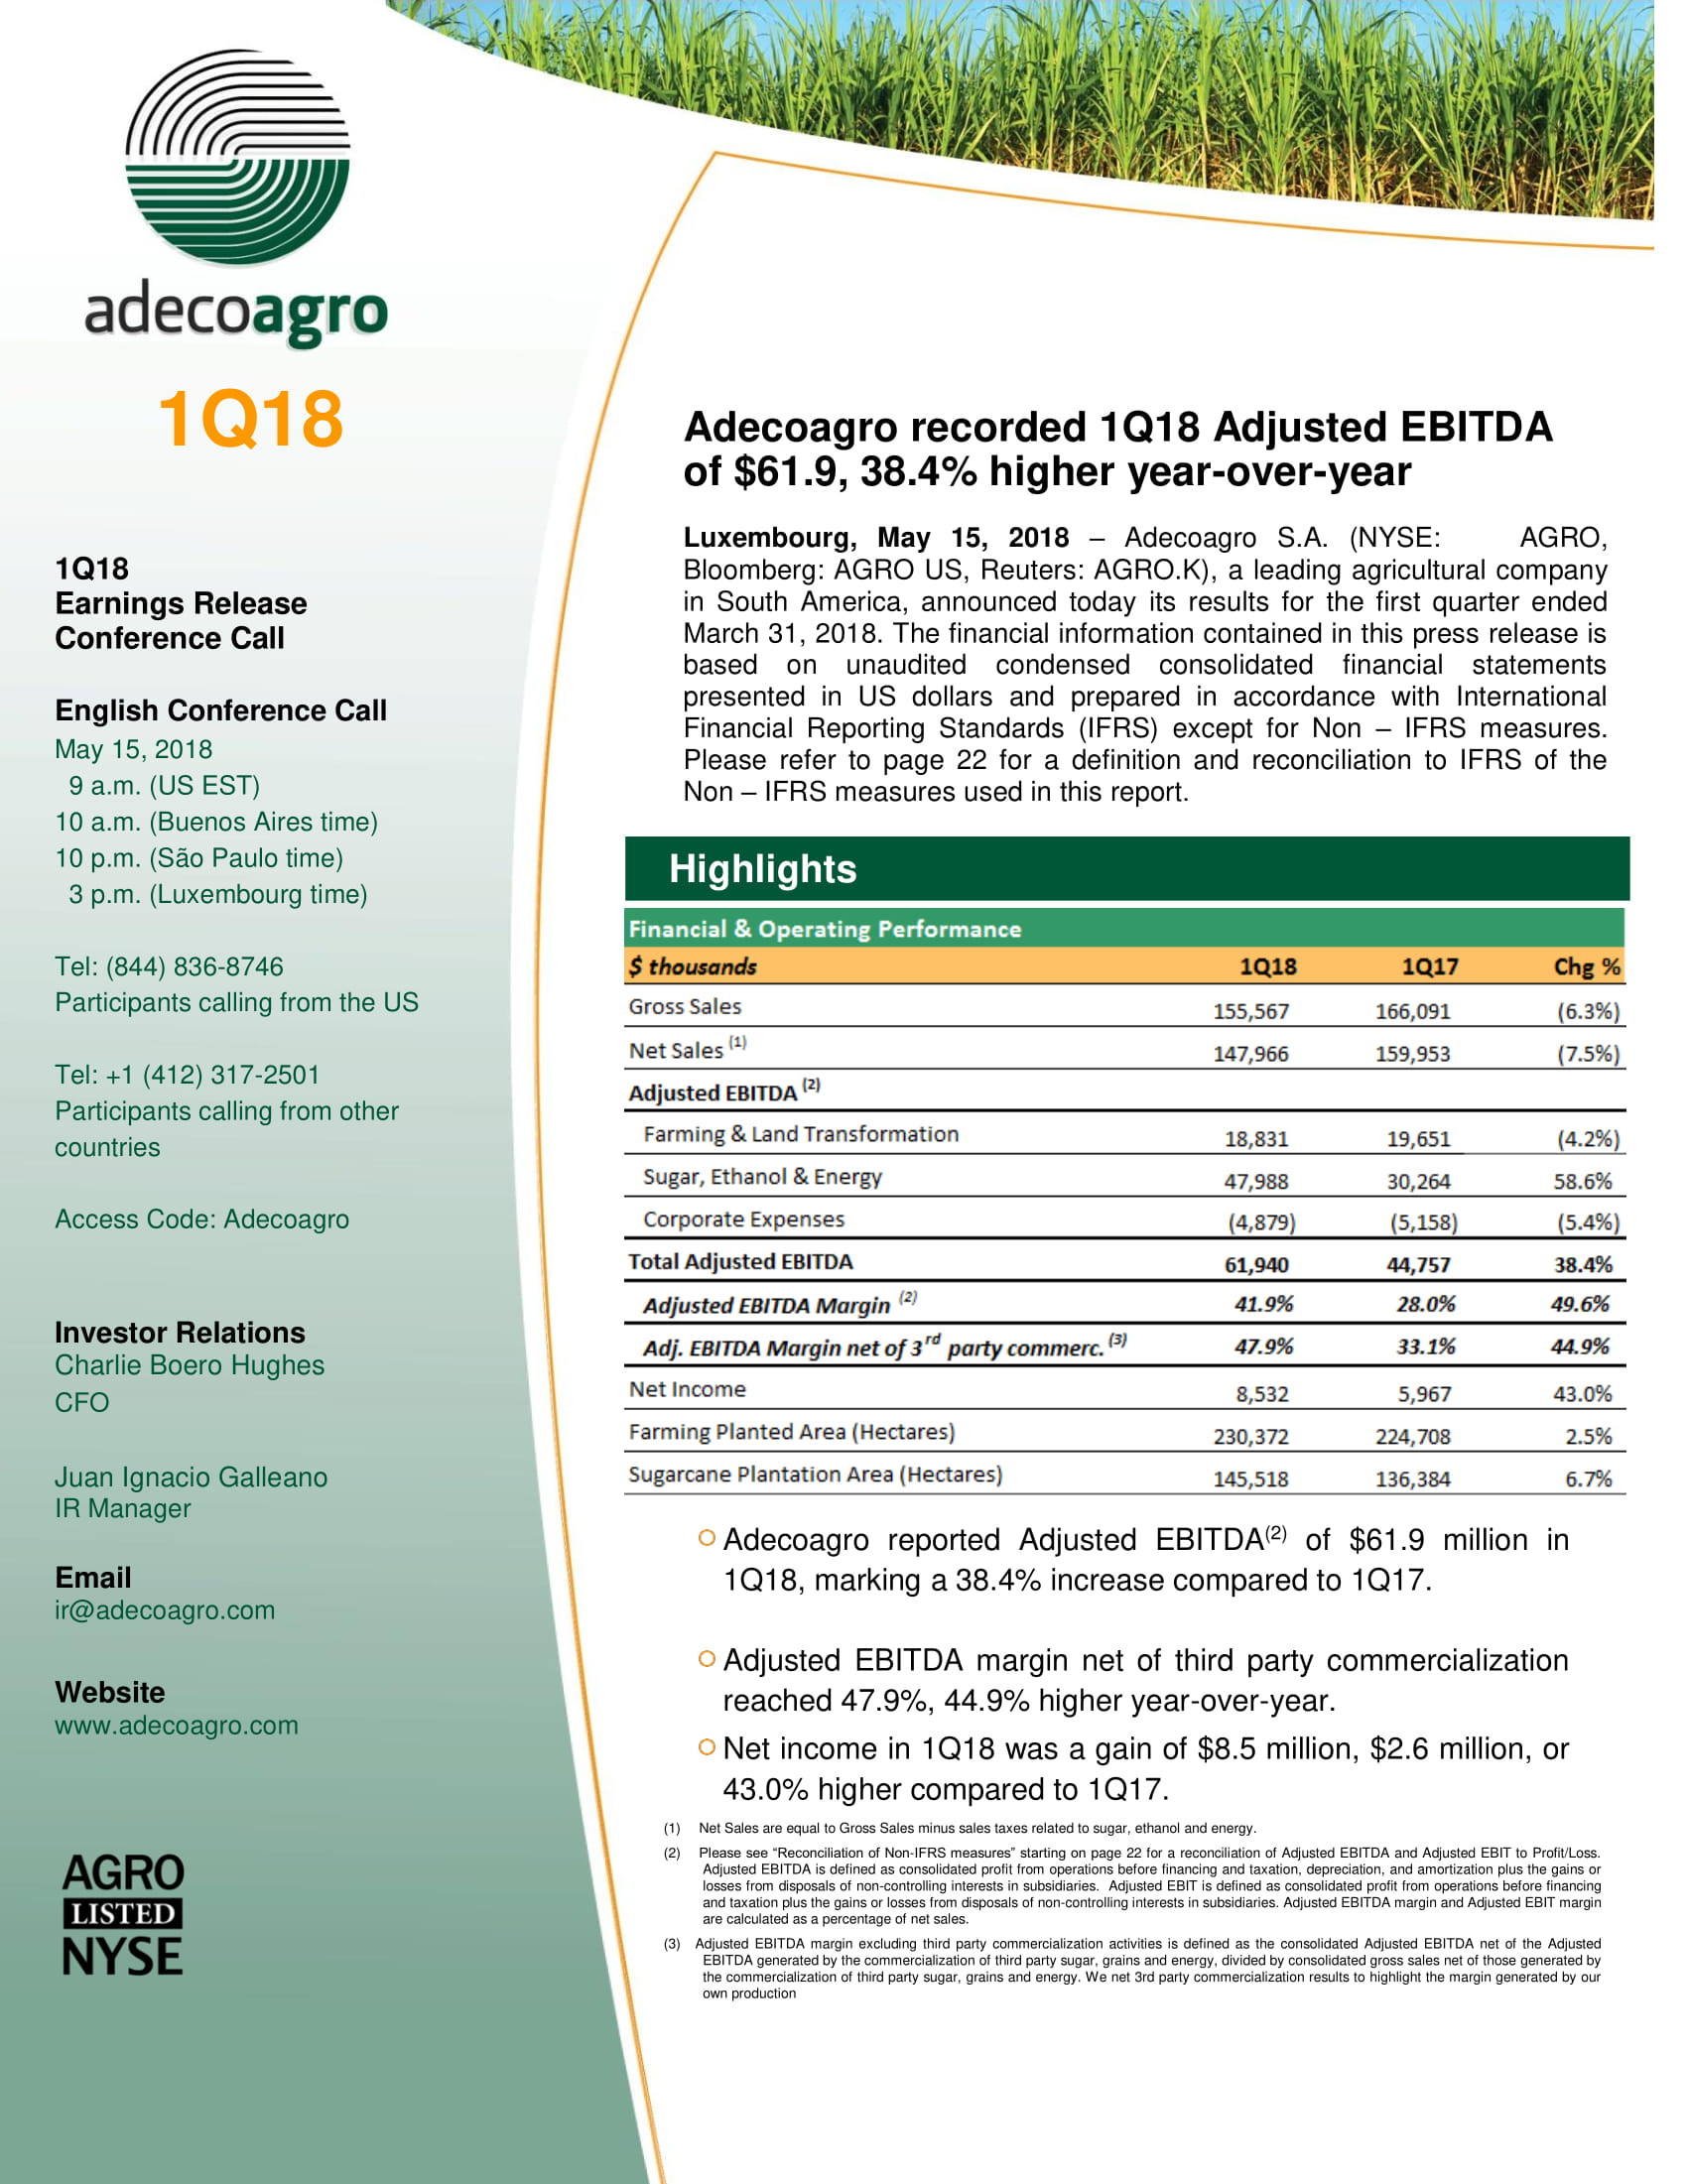
| ◦ | Adjusted EBITDA of our Sugar, Ethanol & Energy business in 1Q18 reached $48.0 million, $17.7 million or 58.6% higher than 1Q17. Results were mainly driven by (i) a 16% increase in milling per hour, offsetting the 10% decrease in effective milling days as a result of rainfalls, (ii) the maximization of ethanol production (87% of TRS went towards ethanol), which enabled us to profit from significantly higher relative prices. Indeed, anhydrous and hydrous ethanol traded at cts/lb20.4 and cts/lb19.1 sugar equivalent during the quarter, implying a 40% premium to sugar, (iii) a $13.1 million increase driven by the mark-to-market of our hedging derivatives position; and (iv) lower production costs as a result of higher crushing volumes and enhanced operating efficiencies. The offsetting effect of lower sugar prices were twofold. On the one hand, it resulted in lower sales revenues while on the other, it implied a lower margin recognition of our unharvested biological asset, captured in the Changes in Fair Value line. |
| ◦ | Adjusted EBITDA for the Farming and Land Transformation businesses in 1Q18 was $18.8 million, slightly below 1Q17. Results were primarily explained by a $2.7 million lower gain in our Crops business partially offset by a $1.9 million higher gain in our Rice business. |
In our Crops business, results were mainly explained by lower registered and projected yields as a result of the dry weather that has been affecting Argentina since the beginning of the year. At the same time, soybean and corn prices in the local market increased significantly during the quarter resulting in: (i) a higher margin recognition of our unharvested biological asset; and (ii) a negative mark-to-market of our commodity hedge position.
As for the Rice business, higher results were explained by the enhancements in farming margins, which are captured in the Changes in Fair Value line, driven by productivity gains (yields were 15.9% higher compared to the previous harvest year); coupled with the depreciation of the Argentine peso.
| ◦ | Net Income in 1Q18 was a $8.5 million, $2.6 million or 43.0% higher compared to 1Q17. This increase is explained by a $17.2 million increase in Adjusted EBITDA; partially offset by (i) a $6.8 million increase in depreciation and amortization charges, coupled with (ii) a $7.9 million increase in financial losses. |
| Strategy Execution |
5-Year Plan Update
| ◦ | Cluster Expansion: The expansion of the cluster in Mato Grosso do Sul is moving forward according to plan. As previously announced, investments in Angelica mill are completed and the mill has reached a nominal crushing capacity of 1,050 tons/hour. Investments in Ivinhema mill are advancing well and we expect to conclude them during the next quarter. The expansion of our sugarcane to supply the additional nominal crushing capacity is also advancing well. |
5
The expansion of the cluster will generate important efficiency gains and cost dilution. Even at current forward sugar prices, this project is highly accretive and generates returns well above our cost of capital.
| ◦ | Dairy Business: The construction of free stall #3 is almost fully completed. We expect to soon start populating the facility and start operating activities by August. By the end of the year, we target to operate at 45% of total capacity. The free stall will be populated with cows of our own breed to avoid sanitary issues and guarantee high quality milk. As a result, the ramp up pace is mainly determined by the biological reproductive cycle of the cow herd. By mid-2019, we expect to be operating at full capacity. Free stall #4 is under construction and will be populated with cows in 2019. |
| ◦ | Rice Business: We expect to conclude the investments of the packaging machine for branded white rice and the expansion of finished goods storage capacity during the second quarter. This will allow us to improve our rice processing and distribution, enhancing margins. |
SanCor - Investment Proposal
| ◦ | On March 23, Adecoagro submitted an investment proposal to partner with SanCor, one of the largest milk processors in Argentina. The offer remains subject to the full compliance of specific conditions, including but not limited to the restructuring of its fiscal and financial liabilities; and the negotiations of definitive agreements. We are currently in the due-diligence phase, ensuring the fulfillment of all the necessary conditions to make this deal accretive for existing shareholders. |
Share Repurchase Update
| ◦ | Since January 1, we purchased 1,6 million shares equivalent to 1.4% of outstanding shares or $15.4 million, at an average price per share of $9.39 |
| ◦ | We expect to continue our share repurchases under the program during 2018 subject to the already committed investments in our expansion projects. |
Farmland sales at strong premium to independent appraisal
| ◦ | In May 2018, we signed sale agreements for Rio de Janeiro and Conquista farms, located in western Bahia and Tocantins, respectively. The farms total 9,300 of croppable hectares and the selling price for both farms was $53.0 million (70% in cash), representing a 37% premium to Cushman and Wakefield´s independent farmland appraisal dated September 30, 2017. At the agreed selling price, we estimate that we would record capital gains in excess of $35.0 million, which would be recognized in the second quarter 2018. The sale of the farms remains subject to the completion of due-diligence. |
6
| Market Overview |
| ◦ | Sugar prices during 1Q18 were, on average, 7% lower than 4Q17 and 19% lower year-over-year. Sugar prices continued the uptrend during the first week of January, trading as high as 15.37 c/lb. However, the rally was short lived and prices collapsed to 13.00 c/lb by mid-January. The decrease was the result of higher production estimations in India, Thailand and the EU. Lower sugar production in CS of Brazil will not be enough to resolve the surplus. Prices partially recovered in February, reaching 14.00 c/lb, and traded within a 100 points range for most of the month. However, India and Thailand revised their production numbers higher once again. Indian production is now expected to reach 31 million tons, a sharp increase of over 2 million tons from the last forecast. In addition, Thailand production has also been revised up by 2 million tons. Going forward, prices are expected to remain under pressure. Longer term, the low price environment should reduce cane/beet planted area from October 2019. Also, low prices are aggravating the fragile financial situation of many Brazilian sugar mills, which eventually should result in lower cane planting and future cane yields. |
| ◦ | Ethanol market in 1Q18 was marked by a sharp increase in prices, supported by stronger demand and higher oil prices. According to the Esalq index, hydrous prices increased 12,4% and anhydrous 8,7% versus previous quarter. Compared to 1Q17 hydrous presented an improvement of 11,3% and anhydrous 6,6%. As reported by UNICA, hydrous sales during 1Q18 were 39,6% higher than 1Q17, but 11,5% below previous quarter. Despite the expectations of higher ethanol production in the next Center-South harvest, current demand and higher international gasoline prices should continue to support prices throughout 2018. |
| ◦ | Energy spot prices in the southeast region of Brazil during 1Q18 were 26% higher than 1Q17. In January, energy prices were 180.07 BRL/MWh and increased to 188.79 BRL/MWh in February and to 219.23 BRL/MWh in March. Prices decreased during the first week of April but is already back to levels above 130BRL/MWh. Weather forecast indicates rainfall levels at the historical average to next weeks. Consumption is increasing as the economy is recovering. The level of the southeast reservoirs increased to 44.59% at the end of March, 5% higher than the same period of 2017 (39.35%). |
| ◦ | Soybean prices increased 10.5% during 1Q18 and were on average 5.9% lower year-over-year. Corn prices increased 10.6% in the quarter and were on average 4.2% lower than a year ago. Prices were mostly driven by the drought in Argentina. The US dollar continued to depreciate over the last three months supporting grain prices and making US exports more competitive on the global market. In early April, China threatened with reciprocal 25% tariffs on US Soybeans, that would come into effect as early as June. CBOT prices saw increased volatility , and Brazilian premiums soared on the news, but then both reversed as investors realized that these are so far only threats, that China cannot easily replace US imports, and non-Chinese buyers opportunistically switched to cheaper US soybeans. |
7
| Operational Performance |
2017/18 Harvest Year
| Farming Production Data | |||||||||||
| Planting & Production | Planted Area (hectares) | 2017/18 Harvested Area | Yields (Tons per hectare) (3) | ||||||||
| 2017/18 | 2016/17 | Chg % | Hectares | % Harvested | Production | 2017/18 | 2016/17 | Chg % | |||
| Soybean | 58,120 | 55,237 | 5.2% | 34,872.0 | 60.0% | 93,457 | 2.7 | 3.8 | (29.5)% | ||
| Soybean 2nd Crop | 23,254 | 29,197 | (20.4)% | 6,976.0 | 30.0% | 11,231 | 1.6 | 3.4 | (52.6)% | ||
| Corn (1) | 45,964 | 38,790 | 18.5% | 40,908.0 | 89.0% | 257,720 | 6.3 | 6.7 | (6.0)% | ||
| Corn 2nd Crop | 10,847 | 10,023 | 8.2% | — | —% | — | — | — | ��% | ||
| Wheat (2) | 36,533 | 38,009 | (3.9)% | 36,529.7 | 100.0% | 79,624 | 2.2 | 3.0 | (28.2)% | ||
| Sunflower | 2,869 | 5,413 | (47.0)% | 2,166.0 | 75.5% | 3,600 | 1.7 | 1.8 | (8.7)% | ||
| Cotton | 3,132 | 2,640 | 18.7% | — | —% | — | — | — | —% | ||
| Peanut | 9,375 | 5,840 | 60.5% | — | —% | — | — | — | —% | ||
| Corn Silage | 2,749 | 2,171 | 26.6% | 2,749.0 | 100.0% | 37,689 | 13.7 | 27.3 | (49.8)% | ||
| Total Crops | 192,842 | 187,320 | 2.9% | 124,201 | 64.4% | 483,322 | |||||
| Rice | 40,279 | 39,728 | 1.4% | 35,701 | 88.6% | 245,630 | 6.9 | 5.9 | 15.9% | ||
| Total Farming | 233,121 | 227,048 | 2.4% | 159,901 | 68.6% | 728,952 | |||||
| Owned Croppable Area | 124,912 | 123,431 | 1.2% | ||||||||
| Leased Area | 72,157 | 64,223 | 12.4% | ||||||||
| Second Crop Area | 36,052 | 39,393 | (8.5)% | ||||||||
| Total Farming Area | 233,121 | 227,048 | 2.7% | ||||||||
| Milking Cows (Average Heads) | Milk Production (MM liters)(1) | Productivity (Liters per cow per day) | |||||||||
| Dairy | 1Q18 | 1Q17 | Chg % | 1Q18 | 1Q17 | Chg % | 1Q18 | 1Q17 | Chg % | ||
| Milk Production | 7,302 | 6,774 | 7.8% | 23.3 | 21.6 | 7.8% | 35.5 | 35.5 | —% | ||
(1) Includes sorghum.
(2) Includes barley.
(3) Yields for 2017/18 season are partial yields related to the harvested area as of April 30, 2018. Yields for 2016/17 reflect the full harvest season.
As of January 31, 2018, Adecoagro´s planting activities for the 2017/18 harvest year were completed. Our total planted area reached 233,121 hectares, 2.7% higher compared to the previous harvest year. Adecoagro’s owned croppable area, increased by 1.2%. Leased area, which is driven by return on invested capital, has increased by 12.4% compared to the 2016/17 harvest year. Second crop area, (mostly wheat followed by a soybean 2nd crop) decreased by 8.5%.
As of the end of April 2018, harvest operations for most of our crops were well underway, with 64.4% of total area already harvested. On a consolidated basis, yield performance has been variable depending on the region. Broadly
8
speaking, early crops in certain regions of Humid Pampas were the least affected by the dry weather as a result of adequate soil moisture. Crops in the northern regions of Argentina were severely affected by the lack of rains. Rice yields were highly benefited by the dry weather resulting in higher yields and better quality, proving the advantages of product diversification as a strategy to mitigate weather risk.
Crops Update
Soybean: As of the end of April, we harvested 60% of the soybean crop. So far, yields reached 2.7 tons per hectare. As we start harvesting the farms in the north-east region, we expect yields to slightly decline.
Corn: Nearly 41,000 hectares of corn were harvested, representing 89% of total planted area. Most of it was an early corn variety. Consequently, as already explained, the crop was not much affected by the dry weather and yields were in line with the previous harvest year.
Corn Silage: As of the end of April, we successfully harvested 2,749 hectares of corn silage, 26.6% higher compared to the previous harvest year. In the coming years, we expect the production of corn silage to increase in tandem with our milking cows.
Sunflower: The harvest of the sunflower crop began in late December 2017. As of the end of April 2017, 75.5% of sunflower had been harvested yielding an average of 1.7 tons per hectare, in line with the previous harvest season.
Rice: As of the end of April, 88.6% of total planted area was already harvested. Dry weather coupled with a longer exposure to solar radiation allowed the crop to properly develop resulting in a 15.9% higher yields compared to the previous harvest.
| Farming & Land Transformation Financial Performance |
| Farming & Land transformation business - Financial highlights | |||
| $ thousands | 1Q18 | 1Q17 | Chg % |
| Gross Sales | |||
| Farming | 57,656 | 55,439 | 4.0% |
| Total Sales | 57,656 | 55,439 | 4.0% |
Adjusted EBITDA (1) | |||
| Farming | 18,831 | 19,651 | (4.2)% |
| Land Transformation | — | — | —% |
Total Adjusted EBITDA(1) | 18,831 | 19,651 | (4.2)% |
Adjusted EBIT(1) | |||
Farming | 16,987 | 18,126 | (6.3)% |
| Land Transformation | — | — | —% |
| (1) | Please see “Reconciliation of Non-IFRS measures” starting on page 21 for a reconciliation of Adjusted EBITDA and Adjusted EBIT to Profit/Loss. Adjusted EBITDA is defined as consolidated profit from operations before financing and taxation, depreciation and amortization plus the gains or losses from disposals of non-controlling interests in subsidiaries. Adjusted EBIT is defined as consolidated profit from operations before financing and taxation plus the gains or losses from disposals of non-controlling interests in subsidiaries. Adjusted EBITDA margin and Adjusted EBIT margin are calculated as a percentage of net sales. |
9
Adjusted EBITDA(2) in the Farming and Land Transformation businesses was $18.8 million in 1Q18, $0.8 million lower than 1Q17. The 4.2% decrease is primarily attributed to the $2.7 million loss in our Crops business mostly due to mark-to-market of our hedges, partially offset by higher margins in our Rice business.
In the case of the Crops business, local prices for soybean and corn increased by 17.0% as a consequence of the drought suffered in Argentina. Mark-to-market effect of our commodity hedge position, resulted in a $10.4 million lower gain than 1Q17
Regarding the Rice business, higher margins were explained by the increase in productivity in our farm operations coupled with lower costs in dollar terms, as a result of the depreciation of the Argentine peso. Dry weather coupled with a longer exposure to solar radiation allowed the rice to properly develop resulting in a 15.9% higher yields compared to the previous harvest. This evidence the benefits derived from both product and geographic diversification.
10
| Crops Segment |
| Crops - Highlights | |||||
| metric | 1Q18 | 1Q17 | Chg % | ||
| Gross Sales | $ thousands | 33,701 | 25,196 | 33.8% | |
| thousand tons | 158 | 138 | 14.5% | ||
| $ per ton | 213 | 183 | 16.2% | ||
| Adjusted EBITDA | $ thousands | 9,849 | 12,520 | (21.3)% | |
| Adjusted EBIT | $ thousands | 9,388 | 12,185 | (23.0)% | |
Planted Area (1) | hectares | 190,093 | 185,149 | 2.7% | |
(1) Does not include second crop planted area.
Adjusted EBITDA in our Crops segment was $9.8 million in 1Q18, 21.3% lower compared to the same period of last year. As a result of the crops and geographic diversification we were able to significantly mitigate the impact of the drought. At the same time, and as a direct consequence of the dry weather, soybean and corn prices in the domestic market increased by 16% and 17%, respectively. The combination of these two factors, coupled with the depreciation of the Argentine Peso, resulted in a $6.0 million increase in Changes in Fair Value of Biological Assets, which reflects the margin recognized throughout the biological growth cycle and harvest of our crops. This result was partially offset by a $10.4 million lower gain from the mark-to-market effect of our commodity hedge position. This hedge was more than offset by Changes in Fair Value of crops in the field (next section).
| Crops - Changes in Fair Value Breakdown | ||||||||||
| 1Q18 | metric | Soy | Soy 2nd Crop | Corn | Corn 2nd Crop | Wheat | Sunflower | Cotton | Peanut | Total |
| 2017/18 Harvest Year | ||||||||||
| Total Planted Area | Hectares | 58,120 | 23,254 | 45,964 | 10,847 | 36,533 | 2,869 | 3,132 | 9,375 | 190,094 |
| Area planted in initial growth stages | Hectares | 485 | — | — | — | — | — | — | — | 485 |
| Area planted with significant biological growth | Hectares | 43,714 | 23,254 | 34,534 | 10,847 | — | 458 | 3,132 | 9,375 | 125,314 |
| Changes in Fair Value 3M18 from planted area 2017/18 (i) | $ thousands | 4,321 | 36 | 7,265 | 752 | — | 2 | 81 | (1,956) | 10,501 |
| Area harvested in previous periods | Hectares | — | — | — | — | 35,226 | — | — | — | 35,226 |
| Area harvested in current period | Hectares | 13,921 | — | 11,430 | — | 1,306 | 2,412 | — | — | 29,069 |
| Changes in Fair Value 3M18 from harvested area 2017/18 (ii) | $ thousands | 4,783 | — | 2,310 | — | 30 | 283 | — | — | 7,406 |
| Total Changes in Fair Value in 3M18 (i+ii) | $ thousands | 9,104 | 36 | 9,575 | 752 | 30 | 285 | 81 | (1,956) | 17,907 |
11
The table above shows the gains or losses from crop production generated during 1Q18. A total of 190,094 hectares were planted in the 2017/18 crop. As of March 31, 2018, total Changes in Fair Value, which reflects the margin of both the crops that have already been harvested and the expected margin of those that are still on the ground with significant biological growth, was $17.9 million, compared to $11.9 million generated during the same period last year. As explained above, the main drivers for the increase in margins are higher commodity prices at harvest, coupled with lower costs of production, measured in USD.
As shown in the table below, crops sales in 1Q18 reached $33.7 million, 33.8% above last year, primarily explained by an increase in average selling prices, coupled with higher soybean and corn volumes.
| Crops - Gross Sales Breakdown | |||||||||||
| Amount ($ '000) | Volume | $ per unit | |||||||||
| Crop | 1Q18 | 1Q17 | Chg % | 1Q18 | 1Q17 | Chg % | 1Q18 | 1Q17 | Chg % | ||
| Soybean | 11,716 | 5,362 | 118.5% | 38,722 | 16,668 | 132.3% | 303 | 322 | (5.9)% | ||
Corn (1) | 13,615 | 9,414 | 44.6% | 85,283 | 56,242 | 51.6% | 160 | 167 | (4.2)% | ||
Wheat (2) | 4,435 | 9,700 | (54.3)% | 32,279 | 63,507 | (49.2)% | 137 | 153 | (10.5)% | ||
| Sunflower | 710 | 422 | 68.2% | 2,153 | 1,193 | 80.5% | 330 | 354 | (6.8)% | ||
| Others | 3,225 | 298 | 982.2% | — | |||||||
| Total | 33,701 | 25,196 | 33.8% | 158,437 | 137,610 | 15.1% | |||||
(1) Includes sorghum (2) Includes barley
| Rice Segment |
| Rice - Highlights | ||||
| metric | 1Q18 | 1Q17 | Chg % | |
| Gross Sales | $ thousands | 15,348 | 19,260 | (20.3)% |
| Sales of white rice | thousand tons(1) | 29.0 | 60.0 | (51.6)% |
| $ per ton | 333 | 274 | 21.7% | |
| $ thousands | 9,672 | 16,415 | (41.1)% | |
| Sales of By-products | $ thousands | 5,676 | 2,845 | 99.5% |
| Adjusted EBITDA | $ thousands | 6,783 | 4,732 | 43.3% |
| Adjusted EBIT | $ thousands | 5,745 | 3,810 | 50.8% |
Area under production (2) | hectares | 40,279 | 39,728 | 1.4% |
| Rice Mills | ||||
| Total Procesed Rough Rice | thousand tons(1) | 46.8 | 56.7 | (17.4)% |
| Ending stock | thousand tons(1) | 144.0 | 114.6 | 25.7% |
(1) Of rough rice equivalent.
(2) Areas under production correspond to the 2014/15 and 2013/14 harvest.
12
Financial performance of our Rice segment during 1Q18 is primarily explained by the harvest of the 2017/18 rice crop and to a lesser extent by the sales of processed rice and by-products.
In our farm operations we successfully harvested 35,701 hectares of rice with an average yield of 6.9 tons per hectare, 15.9% higher compared to the 2016/17 harvest. The rice harvest resulted in Changes in Fair Value of $10.6 million, compared to $6.0 million last season. The 76% increase in farming margins, captured in the Changes in Fair Value line, is explained by the increase in productivity coupled with lower costs in dollar terms, as a result of the depreciation of the Argentine peso.
Rice sales during 1Q18 reached $15.3 million, 20.3% lower than 1Q17. This decrease was explained by the postponement in a shipment to Iraq. As a result, the mix of domestic sales was larger compared to 1Q17, explaining the 21.7% increase in average selling price.
| Dairy Segment |
| Dairy - Highlights | ||||
| metric | 1Q18 | 1Q17 | Chg % | |
| Gross Sales | $ thousands (1) | 8,263 | 10,812 | (23.6)% |
million liters (2) | 22.8 | 27.6 | (17.4)% | |
$ per liter (3) | 0.32 | 0.36 | (11.2)% | |
| Adjusted EBITDA | $ thousands | 2,304 | 2,278 | 1.1% |
| Adjusted EBIT | $ thousands | 2,000 | 2,040 | (2.0)% |
| Milking Cows | Average Heads | 7,302 | 6,774 | 7.8% |
| Cow Productivity | Liter/Cow/Day | 35.5 | 35.5 | —% |
| Total Milk Produced | million liters | 23.3 | 21.6 | 7.8% |
(1) Includes (i) $0.54 million from sales of culled cows in 1Q18 and $0.73 million in 1Q17; and (ii) $0.05 million from sales of whey 1Q17
(2) Selling volumes includes 6.4 million liters of milk destined towards powder milk production in 1Q17
(3) Sales price includes the sale of fluid milk and whole milk powder and excludes cattle and whey sales
Our Dairy operation continues to deliver strong operational and financial performance. Milk production reached 23.3 million liters in 1Q18, 7.8% higher year-over-year, fully explained by the increase in the cow herd.
Adjusted EBITDA in the quarter reached $2.3 million, in line with 1Q17. Higher milk production and lower costs in USD as a result of the depreciation of the Argentine peso, were partially offset by lower average selling prices.
We expect to keep enhancing efficiencies as we start operating our third free-stall and leveraging our industrial assets.
13
| All Other Segments |
| All Other Segments - Highlights | ||||
| metric | 1Q18 | 1Q17 | Chg % | |
| Gross Sales | $ thousands | 344 | 171 | 101.2% |
| Adjusted EBITDA | $ thousands | (105) | 121 | —% |
| Adjusted EBIT | $ thousands | (146) | 91 | —% |
All Other Segments primarily encompasses our cattle business. Our cattle segment consists of pasture land that is not suitable for crop production due to soil quality and is leased to third parties for cattle grazing activities.
Adjusted EBIT for All Other Segment during 1Q18 was a loss of $0.1 million, in line with 1Q17.
| Land transformation business |
In May 2018, we signed sale agreements for Rio de Janeiro and Conquista farms, located in western Bahia and Tocantins, respectively. The farms total 9,300 of croppable hectares and the selling price for both farms was $53.0 million (70% in cash), representing a 37% premium to Cushman and Wakefield´s independent farmland appraisal dated September 30, 2017. At the agreed selling price, we estimate that we would record capital gains in excess of $35.0 million, which would be recognized in the second quarter 2018. The sale of the farms remains subject to the completion of due-diligence.
14
| Operational Performance |
| Sugar, Ethanol & Energy - Selected Information | ||||
| metric | 1Q18 | 1Q17 | Chg % | |
| Milling | ||||
| Sugarcane Milled | tons | 1,523,835 | 1,460,668 | 4.3% |
| Own Cane | tons | 1,510,103 | 1,238,748 | 21.9% |
| Third Party Cane | tons | 13,732 | 221,920 | (93.8)% |
| Production | ||||
| Sugar | tons | 20,363 | 59,684 | (65.9)% |
| Ethanol | M3 | 89,983 | 61,081 | 47.3% |
| Hydrous Ethanol | M3 | 74,555 | 40,819 | 82.7% |
| Anhydrous Ethanol | M3 | 15,427 | 20,263 | (23.9)% |
| TRS Equivalent Produced | tons | 173,233 | 166,247 | 4.2% |
| Sugar mix in production | 13% | 38% | (66.1)% | |
| Ethanol mix in production | 87% | 62% | 41.3% | |
| Energy Exported (sold to grid) | MWh | 72,918 | 104,969 | (30.5)% |
| Cogen efficiency (KWh sold per ton crushed) | KWh/ton | 47.9 | 71.9 | (33.4)% |
| Agricultural Metrics | ||||
| Harvested own sugarcane | tons | 1,510,103 | 1,238,748 | 21.9% |
| Harvested area | Hectares | 14,064 | 13,166 | 6.8% |
| Yield | tons/hectare | 107.4 | 94.1 | 14.0% |
| TRS content | kg/ton | 108.0 | 110.0 | (1.7)% |
| TRS per hectare | kg/hectare | 11,601 | 10,353 | 12.1% |
| Mechanized harvest | % | 99.8% | 99.9% | (0.1)% |
| Area | ||||
| Sugarcane Plantation | hectares | 145,518 | 136,384 | 6.7% |
| Expansion & Renewal Area | hectares | 5,534 | 5,513 | 0.4% |
Rains in our cluster in Mato Grosso do Sul during the first quarter were 19% above the 10-year average, resulting in a 10% reduction in effective milling days compared to 1Q17. This effect was more than offset by higher crushing capacity at Angelica mill, coupled with enhanced operating efficiencies at a farm and industrial level. In fact, milling per hour reached 1,833 tons, 16% higher than 1Q17, allowing us to increase sugarcane crushing by 4.3%. This is in contrast to drought conditions in other path of CS Brasil.
Production mix in the quarter shifted significantly towards ethanol to profit from higher relative prices, reaching 87% of total TRS, an all-time record. During the quarter, hydrous and anhydrous ethanol prices traded at a 41% and 46% premium to sugar, respectively. As a result, ethanol production increased 47.3% year-over-year to 89.9
15
thousand cubic meters while sugar production was significantly down by 65.9% to 20.4 thousand tons due to lower prices.
Our cogeneration efficiency ratio was 47.9 KWh/ton, 33.4% lower year-over-year. The reduction is mainly explained by: (i) the adopted strategy to redirect steam to maximize sugarcane crushing, (ii) one of our boilers was under maintenance works; (iii) that energy consumption in Angelica is now higher as a result of the increase in crushing capacity; and (iv) ethanol production consumes more energy. It´s worth noting that the bagasse that was left over will be carried and burnt during the next quarter.
In terms of agricultural productivity, sugarcane yields reached 107.4 tons/ha, 14.0% higher year-over-year. Higher yields were mainly explained by abundant rainfalls in 4Q17 and during 1Q18 favoring cane development; coupled with our continuous focus on improving agricultural operations. Examples include: (i) effective implementation of pest controls, (ii) utilization of best cane varieties for the region, (iii) harvesting the cane at its optimum growth cycle; and (iv) the renewal of the sugarcane plantation.
As of March 31, 2018, our sugarcane plantation consisted of 145,518 hectares, marking a 6.7% growth year-over-year. Sugarcane planting continues to be a key strategy to supply our mills with quality raw material at low cost. During 1Q18 we planted a total of 5,534 hectares of sugarcane. Of this total area, 1,901 hectares correspond to expansion areas planted to supply our growing milling capacity and 3,633 hectares correspond to areas planted to renew old plantations with newer and high-yielding sugarcane, thus allowing us to maintain the productivity of our plantation.
| Financial Performance |
| Sugar, Ethanol & Energy - Highlights | |||
| $ thousands | 1Q18 | 1Q17 | Chg % |
Net Sales (1) | 90,310 | 104,422 | (13.5)% |
| Margin on Manufacturing and Agricultural Act. Before Opex | 21,176 | 21,724 | (2.5)% |
| Adjusted EBITDA | 47,988 | 30,264 | 58.6% |
| Adjusted EBITDA Margin | 53.1% | 29.0% | 83.3% |
| Adjusted EBITDA Margin (net of third party commercialization) | 60.8% | 33.2% | 83.1% |
Net sales in 1Q18 reached $90.3 million, $14.1 million or 13.5% lower than 1Q17. This decrease was primarily driven by the combination of: (i) a 48.8% decrease in sugar selling volumes coupled with a 19.0% decrease in average selling prices; and (ii) a 42.9% reduction in energy volumes, (iii) weather related reduction in crushing hours.
Adjusted EBITDA during 1Q18 was $48 million, marking a 58.6% increase compared to 1Q17. Adjusted EBITDA was positively affected by: (i) a 4.3% increase in sugarcane crushing, contributing to enhancements in industrial efficiencies ; (ii) higher average selling prices and selling volumes for ethanol; and (iii) a 13.2 million higher result
16
from the mark-to-market effect of our commodity hedge position. These positive effects were partially offset by a $11.8 million higher loss resulting from the mark-to-market of our unharvested biological asset, as a result of lower sugar prices.
The table below reflects the breakdown of net sales for the Sugar, Ethanol & Energy business.
| Sugar, Ethanol & Energy - Net Sales Breakdown (1) | |||||||||||||
| $ thousands | Units | ($/unit) | |||||||||||
| 1Q18 | 1Q17 | Chg % | 1Q18 | 1Q17 | Chg % | 1Q18 | 1Q17 | Chg % | |||||
Sugar (tons)(2) | 19,464 | 46,878 | (58.5)% | 54,395 | 106,169 | (48.8)% | 358 | 442 | (19.0)% | ||||
| Ethanol (cubic meters) | 66,862 | 51,931 | 28.8% | 116,899 | 94,880 | 23.2% | 572 | 547 | 4.5% | ||||
Energy (Mwh)(3) | 3,984 | 5,612 | (29.0)% | 71,764 | 125,670 | (42.9)% | 56 | 45 | 24.3% | ||||
| TOTAL | 90,310 | 104,422 | (13.5)% | ||||||||||
(1) Net Sales are calculated as Gross Sales net of ICMS, PIS, COFINS, INSS and IPI taxes.
(2) Includes commercialization of third party sugar: 12.0k tons ($31.5m) in 1Q18 and 13.5k tons ($27.9m) in1Q17
(3) Includes commercialization of energy from third parties.
Sugar sales volumes in 1Q18 reached 54.4 thousand tons, 48.8% lower year-over-year, as a result of our strategic decision to maximize ethanol production. Average realized selling prices during the quarter reached $358/ton, 19.0% lower compared to 1Q17. As a result, net sales reached $19.5 million, 58.5% lower, compared to 1Q17.
Ethanol sales volumes increased 23.2% compared to the same quarter of last year. Ethanol prices traded to the highest premium to VHP sugar over the last 10 years. As a result, selling volumes increased 23.2% to capture higher relative margins.
In the case of energy, selling volumes reached 71.8 thousands MWh, marking a 42.9% decrease. This is fully explained by i) the decrease in production as a result of the execution of maintenance works in our boilers; coupled with ii) the increase in crushing capacity as a result of the investment made, in Angelica mill resulting in more energy requirements, thus lowering the export ratio.
17
| Sugar, Ethanol & Energy - Total Production Costs | |||||||
| Total Cost (´000) | Total Cost per Ton ($/ton) | ||||||
| 1Q18 | 1Q17 | Chg % | 1Q18 | 1Q17 | Chg % | ||
| Industrial costs | 10,054 | 12,739 | (21.1)% | 6.6 | 8.7 | (24.4)% | |
| Industrial costs | 9,639 | 7,500 | 28.5% | 6.3 | 5.1 | 23.5% | |
| Cane from 3rd parties | 414 | 5,239 | (92.1)% | 30.2 | 23.6 | 28.0% | |
| Agricultural costs | 44,690 | 39,313 | 13.7% | 29.6 | 31.7 | (6.7)% | |
| Harvest costs | 14,639 | 13,614 | 7.5% | 9.7 | 11.0 | (11.8)% | |
| Cane depreciation | 8,009 | 7,418 | 8.0% | 5.3 | 6.0 | (11.7)% | |
| Leasing costs | 6,884 | 4,557 | 51.1% | 4.6 | 3.7 | 24.3% | |
| Maintenance costs | 15,158 | 13,724 | 10.4% | 10.0 | 11.1 | (9.9)% | |
| Total Production Costs | 54,743 | 52,051 | 5.2% | 35.9 | 35.6 | 0.8% | |
| Depreciation & Amortization | (22,649) | (16,124) | 40.5% | (14.9) | (11.0) | 35.5% | |
| Total EBITDA Production Costs (excl. D&A) | 32,094 | 35,927 | (10.7)% | 21.1 | 24.6 | (14.2)% | |
As shown in the table above, total production costs per ton crushed during 1Q18 remained virtually flat year-over-year. Agricultural costs marked a 6.7% reduction mainly as a result of enhanced efficiencies coupled with higher crushing volumes. These effects were offset by higher depreciation costs as a result of the ongoing capital expenditures (related to the industry and the sugarcane planting). Indeed, total EBITDA production costs per ton marked a 14.2% reduction compared to 1Q17.
| Sugar, Ethanol & Energy - Changes in Fair Value | |||
| $ thousands | 1Q18 | 1Q17 | Chg % |
| Sugarcane Valuation Model current period | 84,982 | 81,406 | 4.4% |
| Sugarcane Valuation Model previous period | 93,177 | 82,380 | 13.1% |
| Total Changes in Fair Value | (8,195) | (974) | 741.4% |
Total Changes in Fair Value of Unharvested Biological Assets (what is currently growing on the fields and will be harvested during the next 12 months) represented an $8.2 million loss. This is mainly attributable to the decrease in sugar prices, partially offset by higher sugarcane yields as a result of good weather conditions.
| Corporate Expenses |
| Corporate Expenses | |||
| $ thousands | 1Q18 | 1Q17 | Chg % |
| Corporate Expenses | (4,879) | (5,158) | 5.4% |
18
Adecoagro’s corporate expenses include items that have not been allocated to a specific business segment, such as executive officers and headquarter staff, certain professional fees, travel expenses, and office lease expenses, among others. As shown in the table above, corporate expenses for 1Q18 were $4.9 million, 5.4% lower compared to 1Q17, mainly as a result of the depreciation of the Brazilian Real and the Argentine peso.
| Other Operating Income |
| Other Operating Income | ||||||
| $ thousands | 1Q18 | 1Q17 | Chg % | |||
| Gain from commodity derivative financial instruments | 19,790 | 16,274 | 21.6 | % | ||
| Gain / (Loss) from disposal of other property items | 120 | (557 | ) | — | % | |
| Other | (974 | ) | (2,445 | ) | 60.2 | % |
| Total | 18,936 | 13,272 | 42.7 | % | ||
Other Operating Income in 1Q18 reported a gain of $18.9 million, 42.7% higher than 1Q17. The increase is primarily explained by a $20.0 million gain derived from the mark-to-market of our commodity hedge position, mainly related to sugar compared to $16.2 million gain of 1Q17.
| Commodity Hedging |
Adecoagro’s financial performance is affected by the volatile price environment inherent to agricultural commodities. The company uses forward and derivative markets to mitigate swings in commodity prices by locking-in margins and stabilizing cash flows.
The table below shows the average selling price of our hedged production volumes, including volumes that have already been invoiced and delivered, forward contracts with fixed-price and volumes hedged through derivative instruments.
19
| Commodity Hedge Position - as of March 31, 2018 | |||
| Consolidated Hedge Position | |||
| Farming | Avg. FAS Price | CBOT FOB | |
Volume | USD/Ton | USD/Bu | |
| 2016/2017 Harvest season | |||
| Soybeans | 136,190 | 283 | 1,047.9 |
| Corn | 90,653 | 173 | 449.8 |
| 2017/2018 Harvest season | |||
| Soybeans | 17,680 | 296.2 | 1,042.9 |
| Corn | - | - | - |
| Consolidated Hedge Position | |||
| Sugar, Ethanol & Energy | Avg. FOB Price | ICE FOB | |
Volume | USD/Unit | Cents/Lb | |
| 2018/2019 Harvest season | |||
| Sugar (tons) | 399,135 | 367.9 | 16.7 |
| Ethanol (m3) | 62,673 | 543.0 | n.a |
Energy (MW/h) | 594,206 | 70.3 | n.a |
| 2019/2020 Harvest season | |||
| Sugar (tons) | 114,300 | 336.6 | 15.3 |
| Ethanol (m3) | - | - | n.a |
Energy (MW/h) | 459,958 | 72.6 | n.a |
| Financial Results |
| Financial Results | |||
| $ thousands | 1Q18 | 1Q17 | Chg % |
| Interest Expenses, net | (11,167) | (11,831) | 5.6% |
| Cash Flow Hedge - Transfer from Equity | (2,101) | 666 | —% |
| FX (Losses), net | (9,348) | (3,684) | (153.7)% |
| Gain from derivative financial Instruments | (1,458) | (1,703) | 14.4% |
| Taxes | (1,050) | (517) | (103.1)% |
| Other Expenses, net | (87) | (261) | 66.7% |
| Total Financial Results | (25,211) | (17,330) | (45.5)% |
Our financial results in 1Q18 was a loss of $25.2 million, compared to a loss of $17.3 million in 1Q17.
20
These results are primarily composed of interest expense and foreign exchange losses, as described below:
| (i) | Net interest expense in 1Q18 was 11.2 million, 5.6% below the previous quarter. This difference is mainly explained by an increase in interest income, resulting mainly from short term cash investments in Brazil. |
| (ii) | Foreign exchange losses (composed of “Cash Flow Hedge – Transfer from Equity”(1) and “Fx Gain/Loss” line items) reflect the impact of foreign exchange variations on our net dollar denominated debt. Foreign exchange losses totaled $9.3 million in 1Q18, $5.7 million higher compared to 1Q17. This is explained by the 5% and 3% depreciation of the Brazilian Real and the Argentine Peso, respectively. |
| (1) | Effective July 1, 2014, Adecoagro formally documented and designated cash flow hedging relationships to hedge the foreign exchange rate risk of a portion of its highly probable future sales in US dollars using a portion of its borrowings denominated in US dollars and foreign currency forward contracts. Cash flow hedge accounting permits that gains and losses arising from the effect of changes in foreign currency exchange rates on derivative and non-derivative hedging instruments not be immediately recognized in profit or loss, but be reclassified from equity to profit or loss in the same periods during which the future sales occur, thus allowing for a more appropriate presentation of the results for the period reflecting Adecoagro's Risk Management Policy. |
| Indebtedness |
| Net Debt Breakdown | |||||
| $ thousands | 1Q18 | 4Q17 | Chg % | 1Q17 | Chg % |
| Farming | 171,714 | 138,792 | 23.7% | 152,849 | 12.3% |
| Short term Debt | 131,343 | 90,058 | 45.8% | 95,527 | 37.5% |
| Long term Debt | 40,371 | 48,734 | (17.2)% | 57,322 | (29.6)% |
| Sugar, Ethanol & Energy | 611,714 | 633,638 | (3.5)% | 642,981 | (4.9)% |
| Short term Debt | 52,592 | 64,840 | (18.9)% | 134,686 | (61.0)% |
| Long term Debt | 604,225 | 614,326 | (1.7)% | 508,295 | 10.0% |
| Total Short term Debt | 183,935 | 154,898 | 18.7% | 230,213 | (20.1)% |
| Total Long term Debt | 644,596 | 663,060 | (2.8)% | 565,617 | 14.0% |
| Gross Debt | 828,531 | 817,958 | 1.3% | 795,830 | 4.1% |
| Cash & Equivalents | 183,775 | 269,761 | (31.9)% | 231,321 | (20.6)% |
| Net Debt | 644,756 | 548,197 | 17.6% | 564,509 | 14.2% |
| EOP Net Debt / Adj. EBITDA LTM | 2.2x | 1.98x | 11.1% | 2.23x | (1.3)% |
Adecoagro’s net debt as of 1Q18 was $644.8 million, 14.2% and 17.6% higher than 1Q17 and 4Q17, respectively.
As of March 31, 2018, outstanding debt related to our Farming business was $171.7 million, increasing 23.7% or $32.9 million year-over-year. From a seasonality point of view, the first quarter has the highest working capital requirements, since all of our crops are planted and most costs incurred, but only a small amount of the crops are harvested and sold. As we continue harvesting throughout the second and third quarter we expect to reduce working capital invested and debt. On a year-over-year basis, debt increased by 12.3% or $18.8 million.
21
In the Sugar and Ethanol business, debt as of March 31, 2018 fell by 4.9% or $31.3 million year-over-year. As previously explained, the bond proceeds will be used for the prepayment of financial debt in Brazil. This explains the decrease in gross debt during 1Q18.
Cash and equivalents as of March 31, 2018, stood at $183.8 million, 31.9% lower than 4Q17, as we financed working capital needs and capital expenditures during the quarter.
| Capital Expenditures & Investments |
| Capital Expenditures & Investments | |||
| $ thousands | 1Q18 | 1Q17 | Chg % |
| Farming & Land Transformation | 7,121 | 3,694 | 92.8% |
| Expansion | 6,642 | 2,467 | 169.2% |
| Maintenance | 479 | 1,227 | (60.9)% |
| Sugar, Ethanol & Energy | 55,617 | 54,843 | 1.4% |
| Maintenance | 38,888 | 45,289 | (14.1)% |
| Planting | 10,779 | 12,659 | (14.8)% |
| Industrial & Agricultural Machinery | 28,109 | 32,630 | (13.9)% |
| Expansion | 16,729 | 9,554 | 75.1% |
| Planting | 7,022 | 5,608 | 25.2% |
| Industrial & Agricultural Machinery | 9,707 | 3,947 | 146.0% |
| Total | 62,738 | 58,537 | 7.2% |
Adecoagro’s capital expenditures during 1Q18 totaled $62.7 million, 7.2% higher than in 1Q17.
The Sugar, Ethanol and Energy business accounted for 88.6% or $55.6 million of total capex. Expansion capex reached $16.7 million, mainly as a result of the investments related to the increase in nominal crushing capacity, and to new sugarcane hectares planted to supply the growing industrial capacity. Maintenance capex reached $38.9 million, 14.1% lower year-over-year. The decrease is explained by the fact we anticipated part of the maintenance expenses during 4Q17, as a result of the abundant rainfalls suffered during the quarter.
Farming & Land Transformation businesses accounted for 11.4% or $7.1 million of total capex in 1Q18. The increase is mainly driven by the expansion capex in the Dairy business. During the quarter, we finalized the construction of our third free stall and is now ready to operate. By the end of the year, we expect to operate at a 45% of total capacity.
22
| Inventories |
| End of Period Inventories | ||||||||
| Volume | thousand $ | |||||||
| Product | Metric | 1Q18 | 1Q17 | % Chg | 1Q18 | 1Q17 | % Chg | |
| Soybean | tons | 38,218 | 52,154 | (26.7)% | 11,315 | 3,562 | 217.7% | |
Corn (1) | tons | 38,739 | 27,675 | 40.0% | 4,857 | 3,589 | 35.3% | |
Wheat (2) | tons | 23,837 | 29,848 | (20.1)% | 4,100 | 3,662 | 12.0% | |
| Sunflower | tons | 1,468 | 7,645 | (80.8)% | 475 | 2,790 | (83.0)% | |
Rough Rice(3) | tons | 46,960 | 29,571 | 58.8% | 9,639 | 6,153 | 56.7% | |
| Sugar | tons | 12,046 | 30,434 | (60.4)% | 3,134 | 8,615 | (63.6)% | |
| Ethanol | m3 | 41,394 | 44,623 | (7.2)% | 17,451 | 21,812 | (20.0)% | |
| Total | 202,663 | 221,949 | (8.7)% | 50,970 | 50,183 | 1.6% | ||
(1) Includes sorghum.
(2) Includes barley.
(3) Expressed in rough rice equivalent
Variations in inventory levels between 1Q18 and 1Q17 are attributable to changes in (i) production volumes resulting from changes in planted area, (ii) production mix between different crops and in yields obtained, (ii) different percentage of area harvested during the period, and (iii) commercial strategy or selling pace for each product.
23
| Forward-looking Statements |
This press release contains forward-looking statements that are based on our current expectations, assumptions, estimates and projections about us and our industry. These forward-looking statements can be identified by words or phrases such as “anticipate,” “forecast”, “believe,” “continue,” “estimate,” “expect,” “intend,” “is/are likely to,” “may,” “plan,” “should,” “would,” or other similar expressions.
The forward-looking statements included in this press release relate to, among others: (i) our business prospects and future results of operations; (ii) weather and other natural phenomena; (iii) developments in, or changes to, the laws, regulations and governmental policies governing our business, including limitations on ownership of farmland by foreign entities in certain jurisdictions in which we operate, environmental laws and regulations; (iv) the implementation of our business strategy, including the expansion of our sugarcane cluster in Mato Grosso do Sul and other current projects; (v) our plans relating to acquisitions, joint ventures, strategic alliances or divestitures; (vi) the implementation of our financing strategy and capital expenditure plan; (vii) the maintenance of our relationships with customers; (viii) the competitive nature of the industries in which we operate; (ix) the cost and availability of financing; (x) future demand for the commodities we produce; (xi) international prices for commodities; (xii) the condition of our land holdings; (xiii) the development of the logistics and infrastructure for transportation of our products in the countries where we operate; (xiv) the performance of the South American and world economies; and (xv) the relative value of the Brazilian Reais, the Argentine Peso, and the Uruguayan Peso compared to other currencies; as well as other risks included in the registrant’s other filings and submissions with the United States Securities and Exchange Commission.
These forward-looking statements involve various risks and uncertainties. Although we believe that our expectations expressed in these forward-looking statements are reasonable, our expectations may turn out to be incorrect. Our actual results could be materially different from our expectations. In light of the risks and uncertainties described above, the estimates and forward-looking statements discussed in this press release might not occur, and our future results and our performance may differ materially from those expressed in these forward-looking statements due to, inclusive, but not limited to, the factors mentioned above. Because of these uncertainties, you should not make any investment decision based on these estimates and forward-looking statements.
The forward-looking statements made in this press release related only to events or information as of the date on which the statements are made in this press release. We undertake no obligation to update any forward-looking statements to reflect events or circumstances after the date on which the statements are made or to reflect the occurrence of unanticipated events.
24
| Reconciliation of Non-IFRS measures |
To supplement our consolidated financial statements, which are prepared and presented in accordance with IFRS, we use the following non-IFRS financial measures in this press release:
| • | Adjusted EBITDA |
| • | Adjusted EBIT |
| • | Adjusted EBITDA margin |
| • | Net Debt |
| • | Net Debt to Adjusted EBITDA |
In this section, we provide an explanation and a reconciliation of each of our non-IFRS financial measures to their most directly comparable IFRS measures. The presentation of these financial measures is not intended to be considered in isolation or as a substitute for, or superior to, financial information prepared and presented in accordance with IFRS.
We use non-IFRS measures to internally evaluate and analyze financial results. We believe these non-IFRS financial measures provide investors with useful supplemental information about the financial performance of our business, enable comparison of financial results between periods where certain items may vary independent of business performance, and enable comparison of our financial results with other public companies, many of which present similar non-IFRS financial measures.
There are limitations associated with the use of non-IFRS financial measures as an analytical tool. In particular, many of the adjustments to our IFRS financial measures reflect the exclusion of items, such as depreciation and amortization, changes in fair value and the related income tax effects of the aforementioned exclusions, that are recurring and will be reflected in our financial results for the foreseeable future. In addition, these measures may be different from non-IFRS financial measures used by other companies, limiting their usefulness for comparison purposes.
Adjusted EBITDA, Adjusted EBIT & Adjusted EBITDA margin
We define Adjusted EBITDA for each of our operating segments as the segment’s share of consolidated profit from operations before financing and taxation for the year or period, as applicable, before depreciation and amortization and adjusted by profit or loss from discontinued operations and by gains or losses from disposals of non-controlling interests in subsidiaries whose main underlying asset is farmland which are reflected in our Shareholders Equity under the line item “Reserve from the sale of minority interests in subsidiaries.”
We define Adjusted EBIT for each of our operating segments as the segment’s share of consolidated profit from operations before financing and taxation for the year or period, as applicable, adjusted by profit from discontinued operations and by gains or losses from disposals of non-controlling interests in subsidiaries whose main underlying asset is farmland which are reflected in our Shareholders Equity under “Reserve from the sale of minority interests in subsidiaries.”
25
We believe that Adjusted EBITDA and Adjusted EBIT are for the Company and each operating segment, respectively important measures of operating performance because they allow investors and others to evaluate and compare our consolidated operating results and to evaluate and compare the operating performance of our segments, respectively, including our return on capital and operating efficiencies, from period to period by removing the impact of our capital structure (interest expense from our outstanding debt), asset base (depreciation and amortization), tax consequences (income taxes), foreign exchange gains or losses and other financial expenses. In addition, by including the gains or losses from disposals of non-controlling interests in subsidiaries whose main underlying asset is farmland, investors can evaluate the full value and returns generated by our land transformation activities. Other companies may calculate Adjusted EBITDA and Adjusted EBIT differently, and therefore Adjusted EBITDA and Adjusted EBIT may not be comparable to similarly titled measures used by other companies. Adjusted EBITDA and Adjusted EBIT are not measure of financial performance under IFRS, and should not be considered in isolation or as an alternative to consolidated net profit (loss), cash flows from operating activities, profit from operations before financing and taxation and other measures determined in accordance with IFRS.
We define Adjusted EBITDA margin as Adjusted EBITDA to net sales. We consider that the presentation of adjusted EBITDA margin provides useful information on how successfully we operate our Company and enhances the ability of investors to compare profitability between segments, periods and with other public companies.
Reconciliation of both Adjusted EBITDA and Adjusted EBIT starts on page 24.
Net Debt & Net Debt to Adjusted EBITDA
Net debt is defined as the sum of long- and short-term debt less cash and cash equivalents. This measure is widely used by management and investment analysts and we believe it shows the financial strength of the Company
Management is consistently tracking our leverage position and our ability to repay and service our debt obligations over time. We have therefore set a leverage ratio target that is measured by net debt divided by Adjusted EBITDA.
We believe that this metric provides useful information to investors because management uses it to manage our debt-equity ratio in order to promote access to debt financing instruments in the capital markets and our ability to meet scheduled debt service obligations.
| Reconciliation - Net Debt | ||||||
| $ thousands | 1Q18 | 1Q17 | ||||
| Total Borrowings | 828,531 | 795,830 | ||||
| Cash and Cash equivalents | 183,775 | 231,321 | ||||
| Net Debt | 644,756 | 564,509 | ||||
26
| Adjusted EBIT & Adjusted EBITDA Reconciliation to Profit/Loss - 1Q18 | |||||||||||||||||||||||
| $ thousands | Crops | Rice | Dairy | Others | Farming | Sugar, Ethanol & Energy | Land Transformation | Corporate | Total | ||||||||||||||
| Sales of manufactured products and services rendered | 33,701 | 15,348 | 8,263 | 344 | 57,656 | 97,911 | — | — | 155,567 | ||||||||||||||
| Cost of manufactured products sold and services rendered | (33,996 | ) | (16,457 | ) | (8,040 | ) | (220 | ) | (58,713 | ) | (62,235 | ) | — | — | (120,948 | ) | |||||||
| Initial recog. and changes in FV of BA and agricultural produce | 17,894 | 10,622 | 2,250 | (185 | ) | 30,581 | (14,500 | ) | — | — | 16,081 | ||||||||||||
| Gain from changes in NRV of agricultural produce after harvest | (691 | ) | — | — | — | (691 | ) | — | — | — | (691 | ) | |||||||||||
| Gross Profit from Agricultural Activities | 16,908 | 9,513 | 2,473 | (61 | ) | 28,833 | 21,176 | — | — | 50,009 | |||||||||||||
| General and administrative expenses | (905 | ) | (1,310 | ) | (391 | ) | (40 | ) | (2,646 | ) | (7,651 | ) | — | (4,875 | ) | (15,172 | ) | ||||||
| Selling expenses | (1,401 | ) | (2,593 | ) | (60 | ) | (43 | ) | (4,097 | ) | (12,219 | ) | — | (10 | ) | (16,326 | ) | ||||||
| Other operating income, net | (5,214 | ) | 135 | (22 | ) | (2 | ) | (5,103 | ) | 24,033 | — | 6 | 18,936 | ||||||||||
| Share of gain/(loss) of joint ventures | — | — | — | — | — | — | — | — | — | ||||||||||||||
| Profit from Operations Before Financing and Taxation | 9,388 | 5,745 | 2,000 | (146 | ) | 16,987 | 25,339 | — | (4,879 | ) | 37,447 | ||||||||||||
| Reserve from the sale of minority interests in subsidiaries | — | — | — | — | — | — | — | — | — | ||||||||||||||
| Adjusted EBIT | 9,388 | 5,745 | 2,000 | (146 | ) | 16,987 | 25,339 | — | (4,879 | ) | 37,447 | ||||||||||||
| (-) Depreciation PPE | 461 | 1,038 | 304 | 41 | 1,844 | 22,649 | — | — | 24,493 | ||||||||||||||
| Adjusted EBITDA | 9,849 | 6,783 | 2,304 | (105 | ) | 18,831 | 47,988 | — | (4,879 | ) | 61,940 | ||||||||||||
| Reconciliation to Profit/(Loss) | |||||||||||||||||||||||
| Adjusted EBITDA | 61,940 | ||||||||||||||||||||||
| Reserve from the sale of minority interests in subsidiaries | — | ||||||||||||||||||||||
| (+) Depreciation PPE | (24,493 | ) | |||||||||||||||||||||
| (+) Financial result, net | (25,211 | ) | |||||||||||||||||||||
| (+) Income Tax (Charge)/Benefit | (3,704 | ) | |||||||||||||||||||||
| Profit/(Loss) for the Period | 8,532 | ||||||||||||||||||||||
27
| Adjusted EBIT & Adjusted EBITDA Reconciliation to Profit/Loss - 1Q17 | |||||||||||||||||||||||
| $ thousands | Crops | Rice | Dairy | Others | Farming | Sugar, Ethanol & Energy | Land Transformation | Corporate | Total | ||||||||||||||
| Sales of manufactured products and services rendered | 25,196 | 19,260 | 10,812 | 171 | 55,439 | 110,652 | — | — | 166,091 | ||||||||||||||
| Cost of manufactured products sold and services rendered | (25,136 | ) | (17,436 | ) | (10,485 | ) | (56 | ) | (53,113 | ) | (86,249 | ) | — | — | (139,362 | ) | |||||||
| Initial recog. and changes in FV of BA and agricultural produce | 11,897 | 6,022 | 1,941 | 184 | 20,044 | (2,679 | ) | — | — | 17,365 | |||||||||||||
| Gain from changes in NRV of agricultural produce after harvest | (227 | ) | — | — | — | (227 | ) | — | — | — | (227 | ) | |||||||||||
| Gross Profit from Agricultural Activities | 11,730 | 7,846 | 2,268 | 299 | 22,143 | 21,724 | — | — | 43,867 | ||||||||||||||
| General and administrative expenses | (673 | ) | (1,125 | ) | (239 | ) | (43 | ) | (2,080 | ) | (6,865 | ) | — | (5,072 | ) | (14,017 | ) | ||||||
| Selling expenses | (1,032 | ) | (3,085 | ) | (239 | ) | (4 | ) | (4,360 | ) | (11,606 | ) | — | (48 | ) | (16,014 | ) | ||||||
| Other operating income, net | 2,160 | 174 | 250 | (161 | ) | 2,423 | 10,887 | — | (38 | ) | 13,272 | ||||||||||||
| Share of gain/(loss) of joint ventures | — | — | — | — | — | — | — | — | — | ||||||||||||||
| Profit from Operations Before Financing and Taxation | 12,185 | 3,810 | 2,040 | 91 | 18,126 | 14,140 | — | (5,158 | ) | 27,108 | |||||||||||||
| Reserve from the sale of minority interests in subsidiaries | — | — | — | — | — | — | — | — | — | ||||||||||||||
| Adjusted EBIT | 12,185 | 3,810 | 2,040 | 91 | 18,126 | 14,140 | — | (5,158 | ) | 27,108 | |||||||||||||
| (-) Depreciation PPE | 335 | 922 | 238 | 30 | 1,525 | 16,124 | — | — | 17,649 | ||||||||||||||
| Adjusted EBITDA | 12,520 | 4,732 | 2,278 | 121 | 19,651 | 30,264 | — | (5,158 | ) | 44,757 | |||||||||||||
| Reconciliation to Profit/(Loss) | |||||||||||||||||||||||
| Adjusted EBITDA | 44,757 | ||||||||||||||||||||||
| Reserve from the sale of minority interests in subsidiaries | — | ||||||||||||||||||||||
| (+) Depreciation PPE | (17,649 | ) | |||||||||||||||||||||
| (+) Financial result, net | (17,330 | ) | |||||||||||||||||||||
| (+) Income Tax (Charge)/Benefit | (3,811 | ) | |||||||||||||||||||||
| Profit/(Loss) for the Period | 5,967 | ||||||||||||||||||||||
28
| Condensed Consolidated Statement of Income |
| Statement of Income | ||||||||
| $ thousands | 1Q18 | 1Q17 | Chg % | |||||
| Sales of goods and services rendered | 155,567 | 166,091 | (6.3 | )% | ||||
| Cost of goods sold and services rendered | (120,948 | ) | (139,362 | ) | (13.2 | )% | ||
| Initial recognition and changes in fair value of biological assets and agricultural produce | 16,081 | 17,365 | (7.4 | )% | ||||
| Changes in net realizable value of agricultural produce after harvest | (691 | ) | (227 | ) | 204.4 | % | ||
| Margin on manufacturing and agricultural activities before operating Expenses | 50,009 | 43,867 | 14.0 | % | ||||
| General and administrative expenses | (15,172 | ) | (14,017 | ) | 8.2 | % | ||
| Selling expenses | (16,326 | ) | (16,014 | ) | 1.9 | % | ||
| Other operating income, net | 18,936 | 13,272 | 42.7 | % | ||||
| Profit from operations | 37,447 | 27,108 | 38.1 | % | ||||
| Finance income | 3,006 | 2,112 | 42.3 | % | ||||
| Finance costs | (28,217 | ) | (19,442 | ) | 45.1 | % | ||
| Financial results, net | (25,211 | ) | (17,330 | ) | 45.5 | % | ||
| Profit before income tax | 12,236 | 9,778 | 25.1 | % | ||||
| Income tax expense | (3,704 | ) | (3,811 | ) | (2.8 | )% | ||
| Profit for the period | 8,532 | 5,967 | 43.0 | % | ||||
29
Condensed Consolidated Interim Statement of Cash Flow |
| Statement of Cashflows | |||||||||
| $ thousands | 1Q18 | 1Q17 | Chg % | ||||||
| Cash flows from operating activities: | |||||||||
| Profit for the period | 8,532 | 5,967 | 43.0 | % | |||||
| Adjustments for: | |||||||||
| Income tax benefit | 3,704 | 3,811 | (2.8 | )% | |||||
| Depreciation | 24,228 | 17,458 | 38.8 | % | |||||
| Amortization | 265 | 191 | 38.7 | % | |||||
| (Gain) / Loss from of disposal of other property items | (120 | ) | 557 | n.a | |||||
| Equity settled share-based compensation granted | 1,345 | 1,429 | (5.9 | )% | |||||
| (Gain) from derivative financial instruments | (16,572 | ) | (14,571 | ) | 13.7 | % | |||
| Interest and other expense, net | 11,225 | 12,024 | (6.6 | )% | |||||
| Initial recognition and changes in fair value of non harvested biological assets (unrealized) | (9,296 | ) | (5,843 | ) | 59.1 | % | |||
| Changes in net realizable value of agricultural produce after harvest (unrealized) | (910 | ) | 174 | n.a | |||||
| Provision and allowances | 29 | 68 | (57.4 | )% | |||||
| Foreign exchange gains, net | 9,348 | 3,684 | 153.7 | % | |||||
| Cash flow hedge – transfer from equity | 2,101 | (666 | ) | n.a | |||||
| Subtotal | 33,879 | 24,283 | 39.5 | % | |||||
| Changes in operating assets and liabilities: | |||||||||
| Increase in trade and other receivables | (32,399 | ) | (20,864 | ) | 55.3 | % | |||
| (Increase) / Decrease in inventories | (17,801 | ) | 2,276 | n.a | |||||
| Decrease in biological assets | 9,332 | 2,616 | 256.7 | % | |||||
| Decrease / (Increase) in other assets | 6 | (17 | ) | n.a | |||||
| Decrease in derivative financial instruments | 12,579 | 8,066 | 56.0 | % | |||||
| Decrease in trade and other payables | (13,699 | ) | (28,522 | ) | (52.0 | )% | |||
| Increase in payroll and social security liabilities | 3,690 | 3,860 | (4.4 | )% | |||||
| (Decrease) / Increase in provisions for other liabilities | (221 | ) | 111 | n.a | |||||
| Net cash generated in operating activities before interest and taxes paid | (4,634 | ) | (8,191 | ) | (43.4 | )% | |||
| Income tax paid | (131 | ) | (278 | ) | (52.9 | )% | |||
| Net cash generated from operating activities | (4,765 | ) | (8,469 | ) | (43.7 | )% | |||
| Cash flows from investing activities: | |||||||||
| Continuing operations: | |||||||||
| Purchases of property, plant and equipment | (62,418 | ) | (58,535 | ) | 6.6 | % | |||
| Purchases of intangible assets | (456 | ) | (101 | ) | 351.5 | % | |||
| Purchase of cattle and non current biological assets | (1,464 | ) | — | n.a | |||||
| Interest received | 2,463 | 1,422 | 73.2 | % | |||||
| Proceeds from sale of property, plant and equipment | 508 | 222 | 128.8 | % | |||||
| Net cash used in investing activities | (61,367 | ) | (56,992 | ) | 7.7 | % | |||
| Cash flows from financing activities: | |||||||||
| Proceeds from long-term borrowings | 8,728 | 149,801 | (94.2 | )% | |||||
| Payments of long-term borrowings | (6,074 | ) | (45,567 | ) | (86.7 | )% | |||
| Proceeds from short-term borrowings | 39,335 | 52,604 | (25.2 | )% | |||||
| Payment of short-term borrowings | (23,934 | ) | (2,021 | ) | 1,084.3 | % | |||
| Interest paid | (21,035 | ) | (10,046 | ) | 109.4 | % | |||
| Payment of derivatives financial instruments | (190 | ) | (2,704 | ) | (93.0 | )% | |||
| Purchase of own shares | (13,492 | ) | (1,230 | ) | 996.9 | % | |||
| Dividends paid to non-controlling interest | (1,195 | ) | (659 | ) | 81.3 | % | |||
| Net cash generated from financing activities | (17,857 | ) | 140,178 | n.a | |||||
| Net increase/(decrease) in cash and cash equivalents | (83,989 | ) | 74,717 | n.a | |||||
| Cash and cash equivalents at beginning of period | 269,195 | 158,568 | 69.8 | % | |||||
| Effect of exchange rate changes on cash and cash equivalents | (1,431 | ) | (1,964 | ) | (27.1 | )% | |||
| Cash and cash equivalents at end of period | 183,775 | 231,321 | (20.6 | )% | |||||
30
Condensed Consolidated Interim Balance Sheet |
| Statement of Financial Position | |||||||||
| $ thousands | March 31, 2018 | December 31, 2017 | Chg % | ||||||
| ASSETS | |||||||||
| Non-Current Assets | |||||||||
| Property, plant and equipment | 852,159 | 820,931 | 3.8 | % | |||||
| Investment property | 2,102 | 2,271 | (7.4 | )% | |||||
| Intangible assets | 16,850 | 17,192 | (2.0 | )% | |||||
| Biological assets | 11,639 | 11,276 | 3.2 | % | |||||
| Deferred income tax assets | 39,586 | 43,437 | (8.9 | )% | |||||
| Trade and other receivables | 21,462 | 22,107 | (2.9 | )% | |||||
| Other assets | 522 | 535 | (2.4 | )% | |||||
| Total Non-Current Assets | 944,320 | 917,749 | 2.9 | % | |||||
| Current Assets | |||||||||
| Biological assets | 138,815 | 156,718 | (11.4 | )% | |||||
| Inventories | 136,614 | 108,919 | 25.4 | % | |||||
| Trade and other receivables | 180,036 | 150,107 | 19.9 | % | |||||
| Derivative financial instruments | 12,058 | 4,483 | 169.0 | % | |||||
| Cash and cash equivalents | 183,775 | 269,195 | (31.7 | )% | |||||
| Other assets | 25 | 30 | (16.7 | )% | |||||
| Total Current Assets | 651,323 | 689,452 | (5.5 | )% | |||||
| TOTAL ASSETS | 1,595,643 | 1,607,201 | (0.7 | )% | |||||
| SHAREHOLDERS EQUITY | |||||||||
| Capital and reserves attributable to equity holders of the parent | |||||||||
| Share capital | 183,573 | 183,573 | — | % | |||||
| Share premium | 897,536 | 908,934 | (1.3 | )% | |||||
| Cumulative translation adjustment | (545,834 | ) | (541,545 | ) | 0.8 | % | |||
| Equity-settled compensation | 19,185 | 17,852 | 7.5 | % | |||||
| Cash flow hedge | (28,311 | ) | (24,691 | ) | 14.7 | % | |||
| Reserve for the sale of non contolling interests in subsidiaries | 41,574 | 41,574 | — | % | |||||
| Treasury shares | (9,061 | ) | (6,967 | ) | 30.1 | % | |||
| Retained earnings | 67,897 | 60,984 | 11.3 | % | |||||
| Equity attributable to equity holders of the parent | 626,559 | 639,714 | (2.1 | )% | |||||
| Non controlling interest | 6,576 | 5,417 | 21.4 | % | |||||
| TOTAL SHAREHOLDERS EQUITY | 633,135 | 645,131 | (1.9 | )% | |||||
| LIABILITIES | |||||||||
| Non-Current Liabilities | |||||||||
| Trade and other payables | 823 | 827 | (0.5 | )% | |||||
| Borrowings | 643,845 | 663,060 | (2.9 | )% | |||||
| Deferred income tax liabilities | 8,526 | 10,457 | (18.5 | )% | |||||
| Payroll and social security liabilities | 1,373 | 1,240 | 10.7 | % | |||||
| Provisions for other liabilities | 3,877 | 4,078 | (4.9 | )% | |||||
| Total Non-Current Liabilities | 658,444 | 679,662 | (3.1 | )% | |||||
| Current Liabilities | |||||||||
| Trade and other payables | 83,747 | 98,423 | (14.9 | )% | |||||
| Current income tax liabilities | 774 | 503 | 53.9 | % | |||||
| Payroll and social security liabilities | 30,150 | 27,267 | 10.6 | % | |||||
| Borrowings | 184,686 | 154,898 | 19.2 | % | |||||
| Derivative financial instruments | 2,321 | 552 | 320.5 | % | |||||
| Provisions for other liabilities | 2,386 | 765 | 211.9 | % | |||||
| Total Current Liabilities | 304,064 | 282,408 | 7.7 | % | |||||
| TOTAL LIABILITIES | 962,508 | 962,070 | — | % | |||||
| TOTAL SHAREHOLDERS EQUITY AND LIABILITIES | 1,595,643 | 1,607,201 | (0.7 | )% | |||||
31