UNITED STATES
SECURITIES AND EXCHANGE COMMISSION
Washington, D.C. 20549
FORM 6-K
Report of Foreign Private Issuer
Pursuant to Rule 13a-16 or 15d-16
of the Securities Exchange Act of 1934
For the month of November 2018
Commission File Number: 001-35052
Adecoagro S.A.
(Translation of registrant’s name into English)
Vertigo Naos Building 6,
Rue Eugene Ruppert,
L-2453, Luxembourg
Grand Duchy of Luxembourg
(Address of principal executive offices)
Indicate by check mark whether the registrant files or will file annual reports under cover of Form 20-F or Form 40-F:
Form 20-F x Form 40-F ¨
Indicate by check mark if the registrant is submitting the Form 6-K in paper as permitted by Regulation S-T Rule 101(b)(1):
Yes ¨ No x
Indicate by check mark if the registrant is submitting the Form 6-K in paper as permitted by Regulation S-T Rule 101(b)(7):
Yes ¨ No x
Indicate by check mark whether by furnishing the information contained in this Form, the Registrant is also thereby furnishing the information to the Commission pursuant to Rule 12g3-2(b) under the Securities Exchange Act of 1934:
Yes ¨ No x
If “Yes” is marked, indicate below the file number assigned to the registrant in connection with Rule 12g3-2(b): N/A
ANNOUNCEMENT OF RESULTS OF OPERATIONS FOR THE NINE MONTH PERIOD
ENDED SEPTEMBER 30, 2018
On November 15, 2018, the registrant issued a press release pertaining to its results of operations for the nine month period ended September 30, 2018 (the “Release”). Registrant hereby furnishes the attached copy of the Release to the Securities and Exchange Commission. The financial and operational information contained in the Release is based on audited consolidated financial statements presented in U.S. dollars and prepared in accordance with International Financial Reporting Standards.
The attachment contains forward-looking statements. The registrant desires to qualify for the “safe-harbor” provisions of the Private Securities Litigation Reform Act of 1995, and consequently is hereby including cautionary statements identifying important factors that could cause the registrant’s actual results to differ materially from those set forth in the attachment.
The registrant’s forward-looking statements are based on the registrant’s current expectations, assumptions, estimates and projections about the registrant and its industry. These forward-looking statements can be identified by words or phrases such as “anticipate,” “believe,” “continue,” “estimate,” “expect,” “intend,” “is/are likely to,” “may,” “plan,” “should,” “would,” or other similar expressions.
The forward-looking statements included in the attached relate to, among others: (i) the registrant’s business prospects and future results of operations; (ii) weather and other natural phenomena; (iii) developments in, or changes to, the laws, regulations and governmental policies governing the registrant’s business, including limitations on ownership of farmland by foreign entities in certain jurisdictions in which the registrant operate, environmental laws and regulations; (iv) the implementation of the registrant’s business strategy; (v) the registrant’s plans relating to acquisitions, joint ventures, strategic alliances or divestitures; (vi) the implementation of the registrant’s financing strategy and capital expenditure plan; (vii) the maintenance of the registrant’s relationships with customers; (viii) the competitive nature of the industries in which the registrant operates; (ix) the cost and availability of financing; (x) future demand for the commodities the registrant produces; (xi) international prices for commodities; (xii) the condition of the registrant’s land holdings; (xiii) the development of the logistics and infrastructure for transportation of the registrant’s products in the countries where it operates; (xiv) the performance of the South American and world economies; and (xv) the relative value of the Brazilian Real, the Argentine Peso, and the Uruguayan Peso compared to other currencies; as well as other risks included in the registrant’s other filings and submissions with the United States Securities and Exchange Commission.
These forward-looking statements involve various risks and uncertainties. Although the registrant believes that its expectations expressed in these forward-looking statements are reasonable, its expectations may turn out to be incorrect. The registrant’s actual results could be materially different from its expectations. In light of the risks and uncertainties described above, the estimates and forward-looking statements discussed in the attached might not occur, and the registrant’s future results and its performance may differ materially from those expressed in these forward-looking statements due to, inclusive, but not limited to, the factors mentioned above. Because of these uncertainties, you should not make any investment decision based on these estimates and forward-looking statements.
The forward-looking statements made in the attached relate only to events or information as of the date on which the statements are made in the attached. The registrant undertakes no obligation to update any forward-looking statements to reflect events or circumstances after the date on which the statements are made or to reflect the occurrence of unanticipated events.
SIGNATURES
Pursuant to the requirements of the Securities Exchange Act of 1934, the registrant has duly caused this report to be signed on its behalf by the undersigned, thereunto duly authorized.
| Adecoagro S.A. | |
| By /s/ Carlos A. Boero Hughes | |
| Name: Carlos A. Boero Hughes | |
| Title: Chief Financial Officer and Chief Accounting Officer | |
Date: November 15, 2018

1
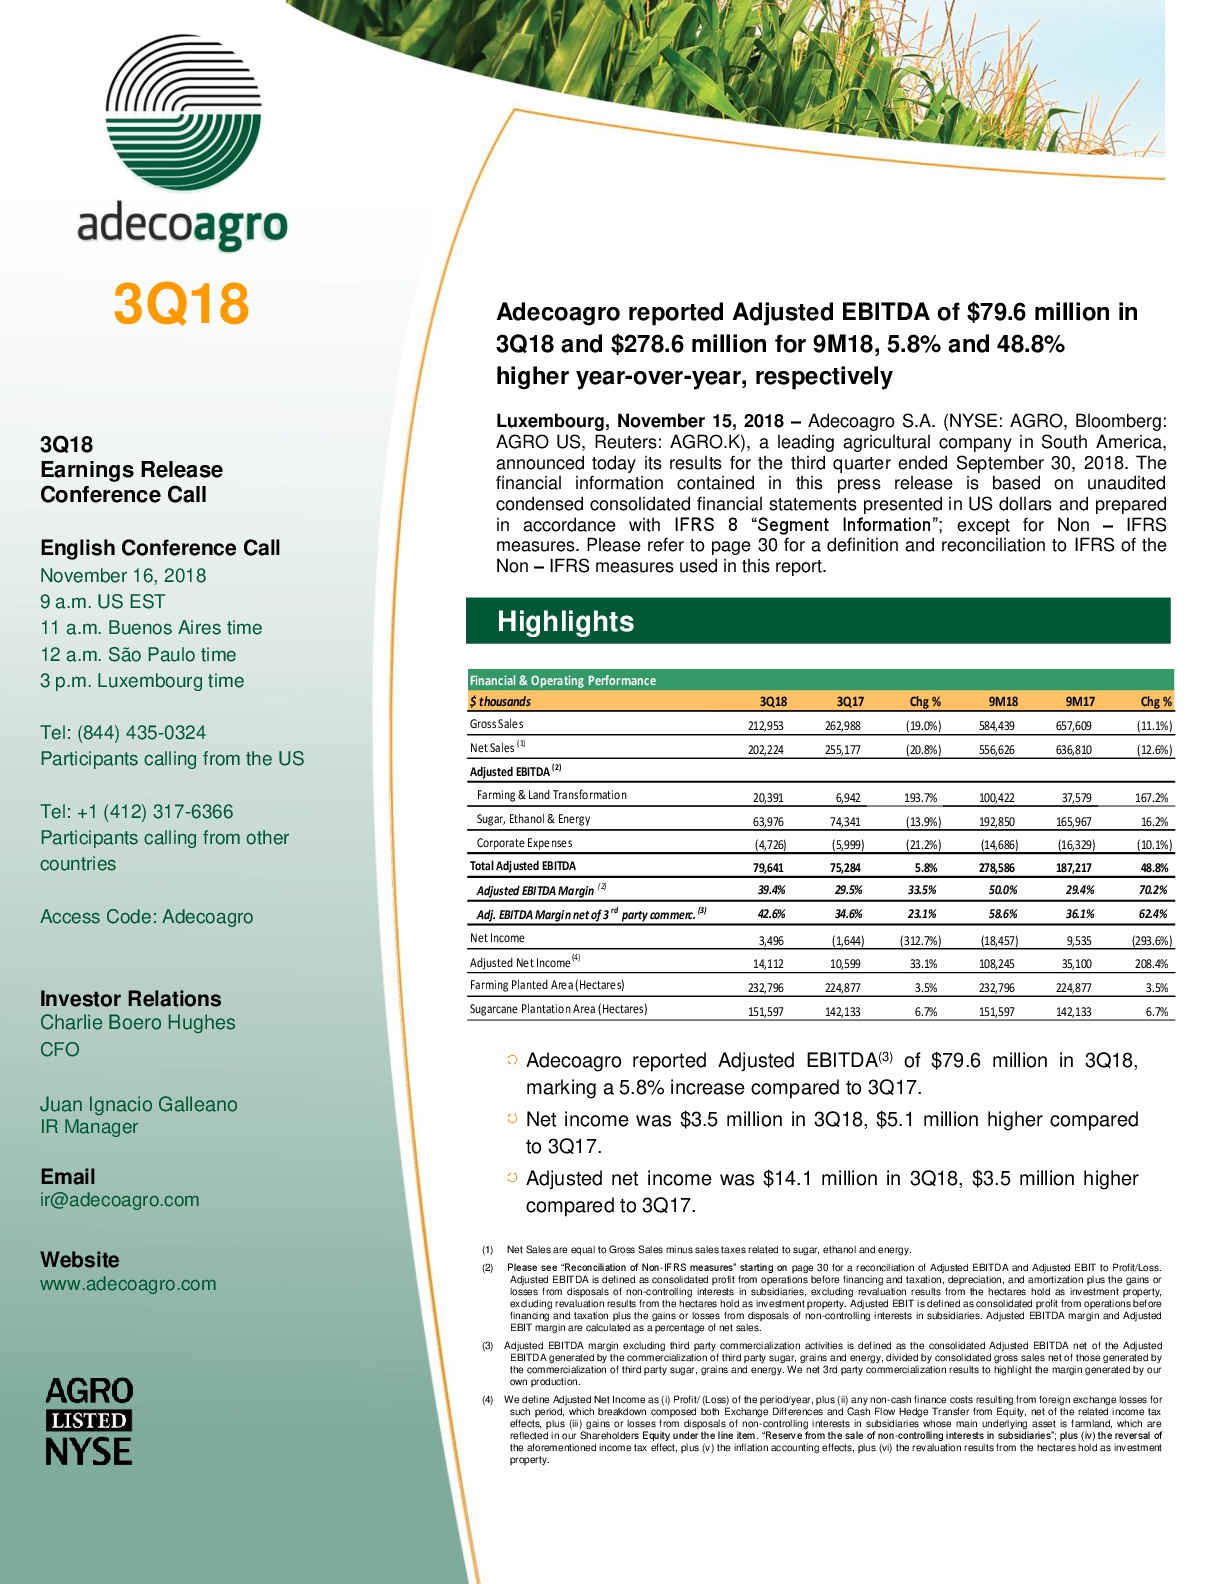
| Financial & Operational Performance Highlights |
| ◦ | Adjusted EBITDA for our Sugar, Ethanol & Energy business reached $64.0 million in 3Q18, $10.4 million million or 13.9% lower than 3Q17. Adjusted EBITDA was positively affected by: (i) a 14.0% reduction in total production costs, on a per unit basis, as a result of enhanced agricultural and industrial efficiencies, coupled with the depreciation of the Brazilian Real, (ii) a $14.2 million higher gain derived from the mark-to-market of our commodity hedge position; and (iii) our ethanol maximization strategy (66.9% of total TRS produced), enabling us to profit from higher relative prices. Indeed, anhydrous and hydrous ethanol traded at 14.1 cts/lb and 13.1 cts/lb sugar equivalent during the quarter, 30.1% and 20.6% premiums to sugar respectively. These positive effects were offset by (i) lower sales, driven by the combination of lower sugar and energy selling volumes, coupled with lower sugar and ethanol prices, measured in U.S. dollar (prices measured in local currency increased by 2.4% year-over-year); coupled with (ii) a $16.2 million loss from the fair value of the unharvested cane, mainly explained by lower sugar prices. |
Year-to-date, Adjusted EBITDA totaled $192.9 million million, marking a 16.2% increase compared to the same period of last year. The main drivers for the increase were (i) a 13.0% reduction in total production costs mainly explained by higher crushing volumes which allowed us to dilute fixed costs, coupled with the 13.1% depreciation of the Brazilian Real; (ii) $19.0 million higher gain derived from the mark-to-market of our commodity hedge position.
| ◦ | Adjusted EBITDA in our Farming and Land Transformation businesses was $20.4 million in 3Q18, $13.5 million higher year-over-year. This increase is mainly attributable to the performance of both our Crops and Rice businesses. Enhanced operational efficiencies and the depreciation of the Argentine Peso, which allowed us to further reduce total cost of production, were responsible for the $10.1 and $5.0 million increase in our Crops and Rice businesses´ EBITDA, respectively. |
On a year-to-date basis, Total Adjusted EBITDA grew by 167.2%, reaching $100.4 million. Once again, the performance of our Crops and Rice businesses were responsible for the increase. Higher margin recognition as a result of higher commodity prices in the local market coupled with a reduction in production costs, explain the $13.9 million increase in our Crops business. As for our Rice business, we registered a $14.3 million increase, as a result of a 17% increase in agricultural yields, coupled with lower production costs, measured in U.S dollar. In addition, the increase in EBITDA is partially explained by the sale of Rio de Janeiro and Conquista farms during 2Q18, which contributed with $36.2 million in capital gains.
| ◦ | On a quarterly basis, Net Income reached $3.5 million, compared to a loss of $1.6 million. Positive results were mainly driven by a better economic performance in our Farming business, partially offset by higher accrued income taxes |
Net Income on a year-to-date basis was a loss of $19.0 million, compared to a $9.5 million gain recorded in the same period of last year. Higher EBITDA generation, as a result of better economic performance
2
was offset by: (i) the $196.1 million non-cash loss derived from the revaluation of our U.S dollar denominated financial debt, measured in local currency; coupled with (ii) a $22.6 million loss resulting from the application of IAS 21: "The Effects of Changes in Foreign Exchange Rates" . Please refer to Market Overview section for more information.
| ◦ | Adjusted Net Income, by definition, excludes: (i) any non-cash result derived from bilateral exchange variations, (ii) any revaluation result from the hectares held as investment property, (iii) any inflation accounting result; and includes (iv) any gains or losses from disposals of non-controlling interests in subsidiaries whose main underlying asset is farmland (the latter is already included in Adj. EBITDA). We believe Adjusted Net Income is a more appropriate metric to reflect the Company´s performance. During the first nine months of the year, Adjusted Net Income reached $108.2 million, $73.1 million higher compared to 9M17. (Please refer to page 34 for a reconciliation of Adjusted Net Income to Profit/Loss). |
| Strategy Execution |
Independent Farmland Appraisal Report
| ◦ | As of September 30, 2018, Cushman & Wakefield (C&W) updated its independent appraisal of Adecoagro´s farmland. Adecoagro´s subsidiaries held 252,104 hectares valued by C&W at $846.7 million. Net of minority interests, Adecoagro´s land portfolio consists of 231,712 hectares valued at $790.6 million. Without considering the sale of farmland in Brazil, the total value of our land portfolio reached $829.7 million, or 1.6%. Lower land prices in Uruguay following five years of low crop prices- resulting in deterioration of crop margins-, explain the decrease. At the same time, higher margins in Argentina - as a result of the sharp depreciation of the Argentine Peso partially offset by the reimplementation of export taxes - are not reflected in the valuation of the farmland in Argentina because not many significant transactions throughout the year materialized. |
Factoring the sale of Rio de Janeiro and Conquista farms, which together contributed with $38.5 in value, the year-over-year value decrease totaled $54.1 million, or 6.0%
Please visit ir.adecoagro.com for the Cushman & Wakefield 2018 Appraisal Report. These appraisals are subject to change based on a host of variables and market conditions. Please also refer to page 66 of our Annual Report on Form 20-F for the methodology employed in the appraisals of our farmland by Cushman & Wakefield.
3
Farmland Revaluation
| ◦ | As of September 30, 2018, the Company changed its accounting policies for its farmland. It is now recognized at fair value following the annual update of Cushman & Wakefield´s independent appraisal. It´s worth highlighting that, before this revaluation, farmland was booked at historical cost in local currency. Accordingly, the book value ($69.1 million as of June 30th), did not properly reflect the actual value of our farmland portfolio. Higher margins, as a result of the ongoing implementation of best practices and cutting edge technology - the essence of our land transformation process - were reflected in the valuation. Furthermore, every time the Argentine peso depreciated, we registered a decrease in the Company´s Equity, measured in U.S. dollar. For more information regarding the change in accounting polices, please refer to page F-25 in our Financial Statements |
From an accounting perspective, there is a distinction between the hectares that are being leased to third parties from those that are not. Leased land is generally not suitable for agriculture production and is mainly used for cattle ranching, and is treated as Investment Property (IP), while the others are treated as Property, Plant & Equipment (PP&E). From an accounting standpoint the revaluation results of hectares treated as PP&E are not recorded in the Profit and Loss Account. Instead, they are directly credited to "Revaluation Surplus" line in shareholder´s equity - we registered a $422.9 million surplus, net of deferred taxes, as of September 30th. In contrast, those related to IP are recorded in "Other Operating Income". We are not including this revaluation results in the Adj. EBITDA or in the Adj. Net Income. It´s worth remembering that results related to the sale of land are registered under the Land Transformation segment. Please refer to page 30 for a full definition of these concepts.
5-Year Plan Update
| ◦ | The expansion of our cluster in Mato Grosso do Sul is proceeding according to plan. A total of 33,000 hectares have been secured for planting so far, representing 70.5% of the total hectares needed to fully supply the 3 million tons of additional crushing capacity. It´s worth noting that we managed to negotiate the existing terms and conditions for all the new contracts. Low rates constitute one of our main competitive advantages which allow us to be one of the lowest and efficient sugar, ethanol and energy producers within the space. Planting operations are also well underway. As a matter of fact,17,500 hectares have already been planted. We feel very confident that we will be able to lease the remaining hectares throughout 2019. At an industry level, investments in Angelica, as previously announced, are already done and the mill reached a nominal crushing capacity of 1,050 tons/hour. As for Ivinhema mill, investments to increase nominal crushing capacity up to 1,400 tons/hour, are well underway. We expect to conclude them during 2019. |
At the same time, we already commenced with marginal investments to build four additional ethanol tanks. This investment in the amount of BRL 21.2 million will allow us to increase total storage capacity by 80 thousand cubic meters, reaching a total capacity of 257 thousand cubic meters. This investment goes in line with our plan to further divert TRS into ethanol production during 2019. As a matter of fact, increasing ethanol production without complementing it with additional storage capacity would put us in a position in which we would be
4
forced to sell ethanol during the peak of the harvest. The additional storage capacity, indeed, will allow us to postpone ethanol sales for 3 to 6 months and maximize sales during the inter-harvest season, profiting from higher seasonal prices.
Milk Processing Facilities Investment Update
| ◦ | As of September 12, 2018, Adecoagro announced the withdrawal of its joint-venture offer to SanCor, and submitted a new investment proposal to acquire two milk processing plants and two trademarks. This new offer was formally approved by the constituent member of the Cooperative on October 31. Closing, however, still remains subject to the satisfaction of certain conditions precedent. |
The transaction will allow us to benefit from synergies of our efficient free stall production system, while at the same time provide us with the necessary flexibility to divert sales into the export and domestic market, based on relative profitability with a view to generate attractive returns.
| Application of IAS 29 in financial reporting of Argentine subsidiaries |
| ◦ | As of 2Q18, Argentina´s 3-year accumulated Consumer Price Index (CPI) exceeded 100%. As a result, all necessary conditions set by IAS 29 "Financial Reporting in Hyperinflationary Economies" to be deemed as a hyperinflationary economy were met in Argentina. Accordingly, financial statements of Argentinian Companies need to comply with IAS 29 . This standard requires, as a way to overcome the deficiencies of historical cost basis accounting in high inflation economies, to restate all non-monetary items by applying a general price index since the day they were booked. Many of the historical numbers, under an inflationary scenario, are not economically relevant as prices changed since they were incurred. Figures are simply not additive as they embody different purchasing power. |
At the same time, the standard also requires that all items in the statement of income be expressed in terms of the measuring unit current at the end of the reporting period, consequently, results of operation measured in Argentine Pesos for each monthly reporting period are adjusted for inflation by the applicable monthly inflation rate each month.
To properly assess the implications of adopting this new accounting standard, it´s convenient to distinguish between the impact of inflation accounting per se (IAS 29) and translation effects (IAS 21).
Inflation Accounting Effects
The impact of applying IAS 29 differs across the financial statements, as follows:
•The balance sheet measured in local currency, will increase with the new standard. All non-monetary items (including equity) need to be restated. This will result in an increase in shareholder´s equity.
•Margins measured in local currency, will be reduced since the accrued cost will now be higher. Inventories are now booked at a higher value. This will result in a reduction in EBITDA, measured in local currency.
5
•The impact on net income is less obvious. The effect will depend on the Company´s monetary position. Since monetary assets and liabilities are not adjusted by the general inflation index, they are, by definition, exposed to inflation. In this line, if the Company´s net monetary position is positive, i.e. more monetary assets than liabilities, a negative result will be generated, other things equal.
Translation Effects
The implications of the standard are quite different when accounting for the translation effects. In paragraph 42, IAS 21 establishes that, “…all amounts shall be translated at the closing rate at the date of the most recent statement of financial position…” Under this standard, booked results, after adjusted for inflation pursuant to IAS 29, must then be converted into U.S dollar at the closing exchange rate for such monthly reported period.
This conversion changes every prior reported monthly statement of income in U.S dollar as each monthly amount is readjusted under IAS 29 for inflation as described above and reconverted at different exchange rates for each monthly reported period under IAS 21. As a result the impact of monthly inflationary adjustments and monthly conversion adjustments vary the results of operation month to month until year end.
Results in the following Earnings Release have been prepared following the methodology applied for our Segment presentation in our Financial Statements (IFRS 8 Operating Segments).We have included results of operation based on monthly data that has been adjusted for inflation and converted into US dollars (i.e. hard currency) each month but not readjusted as described above under IAS 29 and IAS 21. The Company believes that it is more useful and accurate to remain results unaltered, once translated into hard currency. For more information please refer to Financial Note #3 “Segment Information” in our Financial Statements for more information.
6
| Market Overview |
| ◦ | Sugar prices continued the downward trend during 3Q18 and were, on average, 23% lower compared to the same period last year. When compared to 2Q18, prices were 9% lower. The large global surplus and the announcement from the Indian government of another subsidy package weighted heavily into prices, with Oct 18 futures trading as low as 9.90 c/lb by the end of September. Since then prices recovered impressively, trading above 14 c/lb for the first time since February this year. The recovery was result of production numbers being revised down in the EU, Thailand and India due to weather issues. The Center South of Brazil reducing sugar production by almost 10 mln mt, from last year, resulted in the Indian exports turning from a source of oversupply to a source of stability to balance the trade flows. |
| ◦ | Ethanol market in the 3Q18 was influenced by its traditional seasonal downward movement, as a result of the substantial increase in the Center-South production. Lower prices, in turn, favored hydrous ethanol to remain competitive at the pumps, leading demand to reach record high levels. As a result, ethanol started to gain support throughout the quarter, with prices increasing 23% from August to end-September. According to the ESALQ index, both hydrous and anhydrous prices in BRL were down on the quarter by 3% and 4%, respectively. However when compared to same period last year both prices are 10% up. As reported by UNICA, hydrous sales have exceeded expectations, increasing 31% versus previous quarter and 43% year-on-year, favoring a positive outlook for the inter-harvest period. |
| ◦ | Energy spot prices in the southeast region of Brazil during 3Q18 were 12% higher than 3Q17. During July, energy prices were 505.18 BRL/MWh, 505.18 BRL/MWh in August and 472.75 BRL/MWh in September. Recent rains in October drove prices down to 271,83 BRL/MWh. Demand has been increasing to record levels and the seasonal peak is in the fourth quarter. Reservoirs decreased to 28,34% in September, 3% higher than the same period of 2017 (24,8%). |
7
| Operational Performance |
2017/18 Harvest Year
| Farming Production Data | |||||||||||
| Planting & Production | Planted Area (hectares) | 2017/18 Harvested Area | Yields (Tons per hectare) (3) | ||||||||
| 2017/18 | 2016/17 | Chg % | Hectares | % Harvested | Production | 2017/2018 | 2016/2017 | Chg % | |||
| Soybean | 58,119 | 55,237 | 5.2% | 58,120 | 100.0% | 127,782 | 2.2 | 2.9 | (23.3)% | ||
| Soybean 2nd Crop | 23,150 | 29,197 | (20.7)% | 23,150 | 100.0% | 27,499 | 1.2 | 2.5 | (52.2)% | ||
Corn (1) | 45,894 | 34,779 | 32.0% | 44,417 | 96.8% | 205,210 | 4.6 | 6.1 | (24.4)% | ||
| Corn 2nd Crop | 10,847 | 10,023 | 8.2% | 10,613 | 97.8% | 38,688 | 3.6 | 4.5 | (19.1)% | ||
| Corn Silage | 2,589 | 2,355 | 9.9% | 2,589 | 100.0% | 33,392 | 12.9 | 16.0 | (19.2)% | ||
| Wheat (2) | 36,533 | 38,009 | (3.9)% | 34,631 | 94.8% | 78,640 | 2.3 | 3.0 | (25.2)% | ||
| Sunflower | 2,869 | 5,413 | (47.0)% | 2,869 | 100.0% | 5,181 | 1.8 | 1.9 | (3.3)% | ||
| Cotton | 3,132 | 2,640 | 18.7% | 3,132 | 100.0% | 886 | 0.3 | 0.3 | (8.7)% | ||
| Peanut | 9,375 | 9,851 | (4.8)% | 9,375 | 100.0% | 19,901 | 2.1 | 2.2 | (2.5)% | ||
| Total Crops | 192,507 | 187,504 | 2.7% | 188,895 | 98.1% | 537,181 | n.a | ||||
| Rice | 40,289 | 39,728 | 1.4% | 40,289 | 100.0% | 276,693 | 6.9 | 5.9 | 16.2% | ||
| Total Farming | 232,796 | 227,232 | 2.4% | 229,184 | 98.4% | 813,874 | |||||
| Owned Croppable Area | 124,733 | 121,412 | 2.7% | ||||||||
| Leased Area | 72,115 | 64,245 | 12.2% | ||||||||
| Second Crop Area | 35,948 | 39,220 | (8.3)% | ||||||||
| Total Farming Area | 232,796 | 224,877 | 3.5% | ||||||||
| Milking Cows (Average Heads) | Milk Production (MM liters)(1) | Productivity (Liters per cow per day) | |||||||||
| Dairy | 3Q18 | 3Q17 | Chg % | 3Q18 | 3Q17 | Chg % | 3Q18 | 3Q17 | Chg % | ||
| Milk Production | 7,545 | 7,094 | 6.4% | 26.1 | 24.5 | 6.3% | 37.6 | 37.6 | —% | ||
As of the end of October 2018, we harvested 229.2 thousand hectares related to the last crop season 17/18 and produced 813.9 thousand tons of aggregate grains.
8
2018/19 Harvest Year
| Farming Production Data | |||||||||||
| Planting & Production | Planting Plan (hectares) | 2018/19 Planting Progress | |||||||||
| 2018/2019 | 2017/2018 | Chg % | 2018/2019 | Chg % | |||||||
| Soybean | 51,992 | 58,119 | (10.5 | )% | 2,517 | 4.8 | % | ||||
| Soybean 2nd Crop | 27,981 | 23,150 | 20.9 | % | — | — | % | ||||
Corn (1) | 45,358 | 45,894 | (1.2 | )% | 10,480 | 23.2 | % | ||||
| Corn 2nd Crop | 12,096 | 10,847 | 11.5 | % | — | — | % | ||||
| Corn Silage | 3,042 | 2,589 | 17.5 | % | 2,030 | 66.7 | % | ||||
Wheat (2) | 39,719 | 36,533 | 8.7 | % | 39,678 | 99.9 | % | ||||
| Sunflower | 4,250 | 2,869 | 48.1 | % | 2,978 | 70.1 | % | ||||
| Cotton | 3,925 | 3,132 | 25.3 | % | — | — | % | ||||
| Peanut | 8,881 | 9,375 | (5.3 | )% | 3,154 | 35.5 | % | ||||
| Total Crops | 197,244 | 192,507 | 2.5 | % | 60,836 | 30.8 | % | ||||
| Rice | 40,000 | 40,289 | (0.7 | )% | 18,361 | 45.9 | % | ||||
| Total Farming | 237,244 | 232,796 | 1.9 | % | 79,197 | 33.4 | % | ||||
| Owned Croppable Area | 114,261 | 124,733 | (8.4 | )% | |||||||
| Leased Area | 81,161 | 72,115 | 12.5 | % | |||||||
| Second Crop Area | 41,822 | 35,948 | 16.3 | % | |||||||
| Total Farming Area | 237,244 | 232,796 | 1.9 | % | |||||||
(1) Includes chia.
(2) Includes barley.
Adecoagro began its planting activities for the 2018/19 harvest year. We expect to plant 237,244 hectares, 1.9% higher than the previous harvest season. This increase is expected to come primarily from a greater leased area, partially offset by a 8.4% decrease in owned land as a result of the sale of Rio de Janeiro and Conquista farms during 2Q18.
As of the end of October, 2018, a total of 79.2 thousand hectares or 33.4% of the target area has been seeded. We expect to continue planting rice up until mid-November, and corn and soybean until early January. The wheat crop has developed as expected and we are preparing for the start of harvest.
9
| Farming & Land Transformation Financial Performance |
| Farming & Land transformation business - Financial highlights | ||||||||||||
| $ thousands | 3Q18 | 3Q17 | Chg % | 9M18 | 9M17 | Chg % | ||||||
| Gross Sales | ||||||||||||
| Farming | 74,996 | 84,726 | (11.5 | )% | 228,130 | 232,660 | (1.9 | )% | ||||
| Total Sales | 74,996 | 84,726 | (11.5 | )% | 228,130 | 232,660 | (1.9 | )% | ||||
Adjusted EBITDA (1) | ||||||||||||
| Farming | 20,391 | 6,942 | 193.7 | % | 64,195 | 37,579 | 70.8 | % | ||||
| Land Transformation | — | — | n.a | 36,227 | — | n.a | ||||||
Total Adjusted EBITDA (1) | 20,391 | 6,942 | 193.7 | % | 100,422 | 37,579 | 167.2 | % | ||||
| Adjusted EBIT (1) | ||||||||||||
| Farming | 19,057 | 5,411 | 252.2 | % | 59,483 | 32,916 | 80.7 | % | ||||
| Land Transformation | — | — | n.a | 36,227 | — | n.a | ||||||
Total Adjusted EBIT (2) | 19,057 | 5,411 | 252.2 | % | 95,710 | 32,916 | 190.8 | % | ||||
(1) Please see “Reconciliation of Non-IFRS measures” starting on page 31 for a reconciliation of Adjusted EBITDA and Adjusted EBIT to Profit/Loss. Adjusted EBITDA is defined as consolidated profit from operations before financing and taxation, depreciation and amortization plus the gains or losses from disposals of non-controlling interests in subsidiaries. Adjusted EBIT is defined as consolidated profit from operations before financing and taxation plus the gains or losses from disposals of non-controlling interests in subsidiaries. Adjusted EBITDA margin and Adjusted EBIT margin are calculated as a percentage of net sales.
Adjusted EBITDA in the Farming and Land Transformation businesses was $20.4 million in 3Q18, $13.5 million higher compared to the same period last year. The improvement in financial performance is primarily the result of a $10.1 million and $5.0 million increase in results in our crops and rice businesses. This, was the result of enhanced operational efficiencies and the depreciation of the Argentine Peso, which resulted in a reduction of production costs. These positive results, were partially offset by the $1.6 million reduction in results in our dairy business, mainly explained by world dairy product prices.
On an accumulated basis, Adjusted EBITDA totaled $100.4 million, more than doubling last year´s results. This increase is mostly explained by (i) a $35.9 million increase in our Crops business, due to a higher margin recognition as a result of higher commodity prices in the local market coupled with a reduction in production costs, (ii) a $14.3 million increase in our Rice business, as a result of higher yields and lower production costs, measured in U.S dollar; and (iii) the sale of the farms during 2Q18. These positive effects were partially offset by a $5.7 million loss difference resulting from the mark-to-market of our crops hedging position.
10
| Crops Segment |
| Crops - Highlights | ||||||||
| metric | 3Q18 | 3Q17 | Chg % | 9M18 | 9M17 | Chg % | ||
| Gross Sales | $ thousands | 34,804 | 59,201 | (41.2)% | 115,316 | 144,097 | (20.0)% | |
| tons | 145,997 | 264,539 | (44.8)% | 465,864 | 667,414 | (30.2)% | ||
| $ per ton | 238.4 | 223.8 | 6.5% | 247.5 | 215.9 | 14.6% | ||
| Adjusted EBITDA | $ thousands | 12,786 | 2,628 | 386.5% | 36,990 | 23,052 | 60.5% | |
| Adjusted EBIT | $ thousands | 12,481 | 2,280 | 447.4% | 35,888 | 22,012 | 63.0% | |
Planted Area | hectares | 192,507 | 185,149 | 3.97% | 192,507 | 185,149 | 4.0% | |
Adjusted EBITDA in our Crops segment was $37.0 million in 9M18, 60.5% higher compared to the same period of last year. This is mainly explained by a $10.6 million increase in Changes in Fair Value of Biological Assets and Agricultural Produce and Changes in Net Realizable Value, which reflects the margin recognized throughout the biological growth cycle and harvest of our crops. Higher margins are explained by (i) enhanced operating efficiencies, (ii) lower production costs, measured in U.S dollars, as a result of the depreciation of the Argentine Peso; and (iii) higher commodity prices in the local market as the drought in Argentina during the first quarter resulted in lower grain production putting pressure on supply and therefore, increasing domestic prices. These positive effects were partially offset by the $5.7 million negative mark-to-market of our crops hedge position.
11
| Crops - Changes in Fair Value Breakdown - as of September 30, 2018 | |||||||||||||||||||
| 9M18 | metric | Soy | Soy 2nd Crop | Corn | Corn 2nd Crop | Wheat | Sunflower | Cotton | Peanut | Total | |||||||||
| 2017/18 Harvest Year | |||||||||||||||||||
| Total Harvested Area | Hectares | 54,768 | 23,030 | 44,777 | 11,549 | 35,519 | 2,863 | 3,132 | 9,375 | 185,013 | |||||||||
| Area harvested in previous periods | Hectares | — | — | — | — | 34,213 | — | — | — | 34,213 | |||||||||
| Area harvested in current period | Hectares | 54,768 | 23,030 | 44,777 | 11,549 | 1,306 | 2,863 | 3,132 | 9,375 | 150,800 | |||||||||
| Changes in Fair Value 9M18 from harvested area 2017/18 (i) | $ thousands | 10,349 | 2,804 | 10,995 | 1,916 | 672 | 55 | (61 | ) | 85 | 26,814 | ||||||||
| 2018/19 Harvest Year | |||||||||||||||||||
| Total Planted Area | Hectares | 8,734 | 39,374 | 2,034 | 50,142 | ||||||||||||||
| Area planted in initial growth stages | Hectares | — | |||||||||||||||||
| Changes in Fair Value 9M18 from planted area 2018/19 (ii) | $ thousands | 716 | 716 | ||||||||||||||||
| Total Changes in Fair Value in 9M18 (i+ii) | $ thousands | 10,349 | 2,804 | 10,995 | 1,916 | 1,388 | 55 | (61 | ) | 85 | 27,530 | ||||||||
The table above shows the gains or losses from crop production generated during 9M18. A total of 185,013 hectares were harvested in the 2017/18 crop. As of September 30, 2018, total Changes in Fair Value, which reflects the margin of both the crops that have already been harvested and the expected margin of those that are still on the ground with significant biological growth, was $27.5 million, compared to $13.6 million generated during the same period last year. As explained above, the main drivers for the increase in margins are (i) higher operating efficiencies, (ii) higher domestic prices; coupled with (iii) lower costs of production, measured in USD.
Planting activities related to the new 2018/19 crop are underway. We planted 39.7 thousand hectares of wheat, 10.5 thousand of corn, 3.0 thousandof sunflower, 2.5 thousand of soybeans and 3.2 thousand hectares of peanuts . Abundant rainfalls during this and the previous quarter have provided good soil humidity, necessary for planting activities.
As shown in the table below, crops sales year-to-date reached $115.3 million, 20.0% below last year, primarily explained by lower selling volumes as a consequence of the drought that hit the country early in the year, significantly impacting achieved yields.
12
| Crops - Gross Sales Breakdown | |||||||||||
| Amount ($ '000) | Volume | $ per unit | |||||||||
| Crop | 3Q18 | 3Q17 | Chg % | 3Q18 | 3Q17 | Chg % | 3Q18 | 3Q17 | Chg % | ||
| Soybean | 21,297 | 26,213 | (18.8)% | 71,942 | 86,408 | (16.7)% | 296 | 303 | (2.4)% | ||
Corn (1) | 9,910 | 23,784 | (58.3)% | 66,042 | 158,609 | (58.4)% | 150 | 150 | 0.1% | ||
Wheat (2) | 1,279 | 555 | 130.5% | 6,397 | 4,078 | 56.9% | 200 | 136 | 46.9% | ||
| Sunflower | 471 | 2,494 | (81.1)% | 1,616 | 7,905 | (79.6)% | 291 | 315 | (7.6)% | ||
| Cotton Lint | — | 264 | (100.0)% | — | 148 | (100.0)% | n.a | 1,784 | n.a | ||
| Others | 1,847 | 5,891 | (68.6)% | 7,391 | |||||||
| Total | 34,804 | 59,201 | (41.2)% | 145,997 | 264,539 | (44.8)% | |||||
| Crops - Gross Sales Breakdown | |||||||||||
| Amount ($ '000) | Volume | $ per unit | |||||||||
| Crop | 9M18 | 9M17 | Chg % | 9M18 | 9M17 | Chg % | 9M18 | 9M17 | Chg % | ||
| Soybean | 70,209 | 66,977 | 4.8% | 216,738 | 229,151 | (5.4)% | 324 | 292 | 11% | ||
Corn (1) | 31,289 | 55,296 | (43.4)% | 201,322 | 348,917 | (42.3)% | 155 | 158 | (2)% | ||
Wheat (2) | 7,483 | 11,078 | (32.5)% | 43,204 | 72,673 | (40.5)% | 173 | 152 | 14% | ||
| Sunflower | 1,454 | 2,932 | (50.4)% | 4,599 | 9,109 | (49.5)% | 316 | 322 | (2)% | ||
| Cotton Lint | — | 310 | (100.0)% | — | 173 | (100.0)% | n.a | 1,792 | n.a | ||
| Others | 4,881 | 7,504 | (35.0)% | 7,391 | |||||||
| Total | 115,316 | 144,097 | (20.0)% | 465,864 | 667,414 | (30.2)% | |||||
(1) Includes sorghum
(2) Includes barley
13
| Rice Segment |
| Rice - Highlights | |||||||||||||
| metric | 3Q18 | 3Q17 | Chg % | 9M18 | 9M17 | Chg % | |||||||
| Gross Sales | $ thousands | 31,271 | 16,218 | 92.8 | % | 87,482 | 59,497 | 47.0 | % | ||||
| Gross Sales of White Rice | thousand tons(1) | 84 | 47 | 79.1 | % | 219 | 163 | 34.4 | % | ||||
| $ per ton | 277 | 281 | (1.2 | )% | 286 | 288 | (0.8 | )% | |||||
| $ thousands | 23,324 | 13,183 | 76.9 | % | 62,621 | 46,959 | 33.4 | % | |||||
| Gross Sales By-products | $ thousands | 7,947 | 3,035 | 161.8 | % | 24,861 | 12,537 | 98.3 | % | ||||
| Adjusted EBITDA | $ thousands | 6,755 | 1,692 | 299.2 | % | 21,211 | 6,907 | 207.1 | % | ||||
| Adjusted EBIT | $ thousands | 6,024 | 781 | 671.3 | % | 18,521 | 4,110 | 350.6 | % | ||||
Area under production (2) | 40,289 | 39,728 | 1.4 | % | 40,289 | 39,728 | 1.4 | % | |||||
| Rice Mills | |||||||||||||
| Total Processed Rough Rice | thousand tons(1) | 80 | 65 | 22.8 | % | 212 | 183 | 15.8 | % | ||||
| Ending stock | thousand tons(1) | 83 | 78 | 6.7 | % | 83 | 78 | 6.7 | % | ||||
(1) Of rough rice equivalent.
(2) Areas under production correspond to the 2017/18 and 2016/17 harvest.
Due to the seasonality and growth cycle of the rice crop, Adjusted EBITDA generation during the second half of the year is usually driven by sales of processed rice and by-products, net of selling expenses and overhead costs.
Rice sales during 3Q18 reached $31.3 million, 92.8% higher than 3Q17. This was attributable to the 79.1% increase in selling volumes. Rough rice was available and enhanced efficiencies at the industry level, allowed us to increase processing operations. Total sales were partially offset by a slight reduction in average selling prices. This decrease, is explained by the change in selling mix and the reduction in selling prices for the domestic market measured in USD . During 3Q18 78.0% of total selling volumes were diverted to the export market compared to the 68% in 3Q17. That margins in the export market are higher than in the domestic one since selling costs are considerable lower. This coupled with the cost dilution in USD, explain the almost 4.0x increase in 3Q18 EBITDA year-over-year.
On a cumulative basis adjusted EBITDA was $21.2 million, $14.3 million or 207.1% higher than 9M17. This is mainly explained by: (i) higher margins in our agricultural operations driven by higher yields and lower production costs as a result of the depreciation of the Argentine Peso; coupled with a better mill out ratio of white rice (less broken) due to high quality of our rough rice.
14
| Dairy Segment |
| Dairy - Highlights | |||||||
| metric | 3Q18 | 3Q17 | Chg % | 9M18 | 9M17 | Chg % | |
| Gross Sales | $ thousands (1) | 8,549 | 8,931 | (4.3)% | 24,176 | 28.253 | (14.4)% |
million liters (2) | 25.4 | 24.1 | 5.5% | 69.8 | 73.1 | (4.5)% | |
$ per liter (3) | 0.30 | 0.34 | (13.0)% | 0.31 | 0.36 | (14.0)% | |
| Adjusted EBITDA | $ thousands | 1,183 | 2,801 | (57.8)% | 6,140 | 7,616 | (19.4)% |
| Adjusted EBIT | $ thousands | 900 | 2,559 | (64.8)% | 5,296 | 6,879 | (23.0)% |
| Milking Cows | Average Heads | 7,545 | 7,094 | 6.4% | 7,429 | 6,901 | 7.7% |
| Cow Productivity | Liter/Cow/Day | 37.6 | 37.6 | —% | 36.2 | 36.1 | 0.3% |
| Total Milk Produced | million liters | 26.1 | 24.5 | 6.3% | 73.5 | 68.1 | 7.9% |
(1) Includes (i) $0.50 million from sales of culled cows in 3Q18 and $0.77 million in 3Q17, (ii) $0.06 million from sales of cream in 3Q18, (iii) $3.0 million from sales of powder milk in 3Q18; and (v) $0.51 million from electricity sales in 3Q18
(2) Selling volumes includes 7.4 million liters of milk destined towards powder milk production in 3Q18.
(3) Sales price includes the sale of fluid milk and whole milk powder and excludes cattle, electricity, cream and whey sales.
Our Dairy operation continues to deliver strong operational results. On a year-to-date basis, milk production reached 73.5 million, 7.9% higher compared to the same period of last year. This increase is primarily attributable to an 7.7% increase in our dairy cow herd, coupled with a slight increase in cow productivity.
Despite higher production volumes, Adjusted EBITDA reached $6.1 million, 19.4% lower year-over-year. This decrease is primarily explained by lower gross sales as a result of the 14.0% reduction in average selling prices, measured in U.S. dollar after the sharp depreciation of the Argentine peso. This negative effect was partialy offset by: (i) the reduction in unitary production cost as a result of enhanced operational efficiencies; and (iii) the $1.4 million derived from electricity sales.
We expect to keep enhancing efficiencies as we continue populating our third free-stall facility and achieve stable production.
15
| All Other Segments |
| All Other Segments - Highlights | |||||||
| metric | 3Q18 | 3Q17 | Chg % | 9M18 | 9M17 | Chg % | |
| Gross Sales | $ thousands | 344 | 375 | (8.3)% | 1,148 | 813 | 41.2% |
| Adjusted EBITDA | $ thousands | (333) | (180) | 84.8% | (146) | 4 | n.a |
| Adjusted EBIT | $ thousands | (348) | (209) | 66.3% | (222) | (85) | 160.7% |
All Other Segments primarily encompasses our cattle business. Our cattle segment consists of pasture land that is not suitable for crop production due to soil quality and is leased to third parties for cattle grazing activities.
Adjusted EBITDA for All Other Segment during 3Q18 was a loss of $0.3 million.
| Land transformation business |
| Land transformation - Highlights | |||||||
| metric | 3Q18 | 3Q17 | Chg % | 9M18 | 9M17 | Chg % | |
| Adjusted EBITDA | $ thousands | — | — | n.a | 36,227 | — | n.a |
| Adjusted EBIT | $ thousands | — | — | n.a | 36,227 | — | n.a |
| Land sold | Hectares | — | — | n.a | 9,300 | — | n.a |
Adjusted EBITDA for our Land Transformation business during 9M18 totaled $36.2, compared to a null result during 9M17.
During June 2018, we completed the sale of Rio de Janeiro and Conquista farms, located in western Bahia and Tocantins, respectively. The aggregate selling price reached $53.0 million for a total of 9,300 croppable hectares. The selling price represent a 37% premium to the latest Cushman and Wakefield´s independent appraisal, as of September 30, 2017.
Over the last 12 years, we have been able to generate gains of over $200 million by strategically selling at least one of our fully mature farms per year. Monetizing a portion our land transformation gains allows us to redeploy the capital into higher yielding activities, enabling us to continue growing and enhancing shareholder value.
16
| Operational Performance |
| Sugar, Ethanol & Energy - Selected Information | |||||||
| metric | 3Q18 | 3Q17 | Chg % | 9M18 | 9M17 | Chg % | |
| Milling | |||||||
| Sugarcane Milled | tons | 3,295,659 | 4,116,044 | (19.9)% | 8,611,975 | 8,040,480 | 7.1% |
| Own Cane | tons | 3,005,049 | 3,529,781 | (14.9)% | 8,103,449 | 7,100,094 | 14.1% |
| Third Party Cane | tons | 290,610 | 586,263 | (50.4)% | 508,526 | 940,386 | (45.9)% |
| Production | |||||||
| TRS Equivalent Produced | tons | 487,941 | 584,646 | (16.5)% | 1,151,316 | 1,050,732 | 9.6% |
| Sugar | tons | 140,770 | 267,674 | (47.4)% | 282,474 | 470,129 | (39.9)% |
| Ethanol | M3 | 200,390 | 178,363 | 12.3% | 504,116 | 327,778 | 53.8% |
| Hydrous Ethanol | M3 | 133,070 | 97,773 | 36.1% | 352,301 | 192,106 | 83.4% |
| Anhydrous Ethanol | M3 | 67,320 | 80,590 | (16.5)% | 151,815 | 135,672 | 11.9% |
| Sugar mix in production | % | 33% | 48% | (30.8)% | 28% | 47% | (40.1)% |
| Ethanol mix in production | % | 67% | 52% | 28.3% | 72% | 53% | 35.2% |
| Energy Exported (sold to grid) | MWh | 252,781 | 273,804 | (7.7)% | 554,211 | 543,583 | 2.0% |
| Cogen efficiency (KWh sold per ton crushed) | KWh/ton | 76.7 | 66.5 | 15.3% | 64.4 | 67.6 | (4.8)% |
| Agricultural Metrics | |||||||
| Harvested own sugarcane | tons | 3,005,049 | 3,529,781 | (14.9)% | 8,103,449 | 7,100,094 | 14.1% |
| Harvested area | Hectares | 37,015 | 44,059 | (16.0)% | 90,221 | 84,249 | 7.1% |
| Yield | tons/hectare | 81.2 | 80.1 | 1.3% | 89.8 | 84.3 | 6.6% |
| TRS content | kg/ton | 143.3 | 137.7 | 4.1% | 128.7 | 127.2 | 1.2% |
| TRS per hectare | kg/hectare | 11,635 | 11,030 | 5.5% | 11,563 | 10,722 | 7.8% |
| Mechanized harvest | % | 98.3% | 98.2% | 0.1% | 98.6% | 98.3% | 0.3% |
| Area | |||||||
| Sugarcane Plantation | hectares | 151,597 | 142,133 | 6.7% | 151,597 | 142,133 | 6.7% |
| Expansion & Renewal Area | hectares | 8,095 | 7,503 | 7.9% | 23,599 | 17,881 | 32.0% |
Year-to-date, a total of 8.6 million tons of sugarcane were crushed, 7.1% higher compared to the same period of last year. Considering crushing volumes during the third quarter, the increase during the first nine months is entirely explained by what happened during the first half of the year.
On a quarterly basis, sugarcane milling marked a 19.9% decrease compared to 3Q17, reaching 3.3 million tons. This was mainly explained by the reduction in effective milling days due to weather related issues. A total of 323 mm of water fell during 3Q18 in the region, 57.9% higher compared to 3Q17.
17
Production mix continued to favor ethanol to profit from higher relative prices. During the first nine months of the year, hydrous and anhydrous ethanol traded at a 29.0% and 34.5% premium to sugar. 72% of total TRS produced was slanted towards ethanol, compared to 53% in 9M17. This explains, the 53.8% increase in total ethanol production, reaching 504 thousand cubic meters. Sugar production totaled 282 thousand tons, 39.9% lower year-over-year.
In terms of agricultural productivity, sugarcane yields during the nine-month period reached 89.8 tons/ha, 6.6% higher than the previous year, while TRS content per ton of sugarcane reached 128.7 kg/ton. The combination of these two effects resulted in TRS production per hectare of 11.6 thousand, 7.8% higher year-over-year. Higher yields were mainly explained by: (i) above average rainfalls, which favored cane development; and (ii) a longer growth cycle for a greater proportion of the sugarcane harvested in 2018 than the sugarcane harvested in 2017.
Exported energy during the quarter totaled 252,781 MWh, marking a 7.7% decrease year-over-year. The 19.9% reduction in crushing volumes was partially offset by (i) the large bagasse availability carried over from the previous quarter; coupled with (ii) enhanced efficiencies at an industry level. This explains, at the same time, the 15.3% increase in cogeneration efficiency. On a year-to-date basis, total exported energy marked a slight increase, reaching 554,211 MWh.
As of September 30, 2018, our sugarcane plantation consisted of 151,597 hectares, 6.7% higher year-over-year. Sugarcane planting continues to be a key strategy to supply our mills with quality raw material at low cost. During 3Q18 we planted a total of 8,095 hectares of sugarcane. Of this total area, 2,361 hectares correspond to expansion areas planted to supply our growing milling capacity and 5,734 hectares correspond to areas planted to renew old plantations with newer and high-yielding sugarcane, thus allowing us to maintain the productivity of our plantation.
18
| Financial Performance |
| Sugar, Ethanol & Energy - Highlights | ||||||
| $ thousands | 3Q18 | 3Q17 | Chg % | 9M18 | 9M17 | Chg % |
Net Sales (1) | 127,228 | 170,451 | (25.4)% | 328,496 | 404,150 | (18.7)% |
| Margin on Manufacturing and Agricultural Act. Before Opex | 35,141 | 54,041 | (35.0)% | 103,907 | 101,848 | 2.0% |
| Adjusted EBITDA | 63,976 | 74,341 | (13.9)% | 192,850 | 165,967 | 16.2% |
| Adjusted EBITDA Margin | 50.3% | 43.6% | 15.3% | 58.7% | 41.1% | 43.0% |
| Adjusted EBITDA Margin (net of third party commercialization) | 54.8% | 51.2% | 7.2% | 67.9% | 48.0% | 41.4% |
| (1) Net Sales are calculated as Gross Sales net of sales taxes. | ||||||
Net sales in 3Q18 reached $127.2 million, $43.2 million or 25.4% lower than 3Q17. This decrease was primarily driven by the combination of lower sugar and energy selling volumes, coupled with lower sugar and ethanol prices, measured in USD. Ethanol prices in BRL increased by 4.2% during the quarter .
Adjusted EBITDA during 3Q18 was $64.0 million, 13.9% lower compared to 3Q17. Adjusted EBITDA was positively affected by: (i) a 14% reduction in total production costs, on a per unit basis, a a result of enhanced agricultural and industrial efficiencies, coupled with the depreciation of the Brazilian Real; (ii) $14.2 million higher gain derived from the mark-to-market of our commodity hedge position. These positive effects were offset by lower sales coupled with a $16.2 million loss from the fair value of the unharvested cane
On a cumulative basis, Adjusted EBITDA in 9M18 grew by 16.2% reaching $192.9 million. Main drivers for the increase are explained by a reduction in cost of production coupled with and increase of other operating income and partially offset by a decrease in sales.
19
The table below reflects the breakdown of net sales for the Sugar, Ethanol & Energy business.
Sugar, Ethanol & Energy - Net Sales Breakdown (1) | |||||||||||
| $ thousands | Units | ($/unit) | |||||||||
| 3Q18 | 3Q17 | Chg % | 3Q18 | 3Q17 | Chg % | 3Q18 | 3Q17 | Chg % | |||
Sugar (tons)(2) | 42,991 | 110,552 | (61.1)% | 158,121 | 320,612 | (50.7)% | 272 | 345 | (21.2)% | ||
| Ethanol (cubic meters) | 64,469 | 36,889 | 74.8% | 169,588 | 81,123 | 109.1% | 380 | 455 | (16.4)% | ||
Energy (Mwh)(3) | 19,769 | 23,011 | (14.1)% | 277,658 | 328,887 | (15.6)% | 71 | 70 | 1.8% | ||
| TOTAL | 127,228 | 170,451 | (25.4)% | ||||||||
| $ thousands | Units | ($/unit) | |||||||||
| 9M18 | 9M17 | Chg % | 9M18 | 9M17 | Chg % | 9M18 | 9M17 | Chg % | |||
Sugar (tons)(2) | 95,076 | 232,149 | (59.0)% | 318,330 | 606,654 | (47.5)% | 299 | 383 | (22.0)% | ||
| Ethanol (cubic meters) | 194,067 | 131,623 | 47.4% | 424,140 | 268,199 | 58.1% | 458 | 491 | (6.8)% | ||
Energy (Mwh)(3) | 39,352 | 40,377 | (2.5)% | 581,787 | 647,009 | (10.1)% | 68 | 62 | 8.4% | ||
| TOTAL | 328,496 | 404,150 | (18.7)% | ||||||||
| (1) Net Sales are calculated as Gross Sales net of ICMS, PIS, COFINS, INSS and IPI taxes. | |||||||||||
| (2) Includes commercialization of third party sugar: 22.3k tons ($8.5m) in 3Q18 and 72.7k tons ($26.0.8m) in 3Q17; 82.1k tons ($32.4m) in 9M18 and 149.6k tons ($60.6m) in 9M17 | |||||||||||
| (3) Includes commercialization of energy from third parties. | |||||||||||
On a quarterly basis, ethanol selling volumes increased 109.1%. This increase reflects our strategic decision to maximize ethanol production to profit from higher relative prices. Hydrous and anhydrous ethanol traded, during the nine-month period, at a 29.0% and a 34.5% premium to VHP sugar. Measured in U.S. dollars, ethanol prices decreased 16.4% year-over-year, less than the 25% depreciation of the Brazilian Real. Compared to the same period of last year, we are executing a more aggressive carry strategy aiming to profit from higher prices during the inter-harvest season.
In the case of energy, selling volumes reached 277,658 MWh, a 15.6% decrease. This is mainly explained by lower crushing activities; partially offset by (i) bagasse inventories carried from the first semester, (ii) enhanced efficiencies, coupled with (iii) a commercial effort to maximize energy sales in order to capture higher selling prices. We expect prices to remain at attractive levels, despite the recent drop in spot prices, in the wake of increasing demand and lower levels of water reservoirs in the south-east region of Brazil.
Sugar sales volumes reached 158,121 tons, 50.7% lower year-over-year. Average realized selling prices reached $254/ton, 21.2% lower compared to 3Q17. Lower prices are primarily explained by global supply and demand. In the case of India, for instance the government has officially announced its subsidies policies for exports and cane production, and on top of that it has increased its export quota from 3 to 5 million tons. As a result, net sales reached $43.0 million, 61.1% lower compared to the same period of last year.
20
| Sugar, Ethanol & Energy - Total Production Costs | |||||||
| Total Cost (´000) | Total Cost per Pound (cts/lbs) | ||||||
| 3Q18 | 3Q17 | Chg % | 3Q18 | 3Q17 | Chg % | ||
| Industrial costs | 27,428 | 42,228 | (35)% | 2.8 | 3.5 | (22.1)% | |
| Industrial costs | 21,132 | 25,021 | (15.5)% | 2.1 | 2.1 | 1.3% | |
| Cane from 3rd parties | 6,296 | 17,207 | (63.4)% | 0.6 | 1.4 | (56.1)% | |
| Agricultural costs | 70,155 | 93,914 | (25.3)% | 7 | 7.9 | (10.4)% | |
| Harvest costs | 30,068 | 40,065 | (25)% | 3 | 3.4 | (10)% | |
| Cane depreciation | 17,027 | 22,158 | (23.2%) | 1.7 | 1.9 | (7.8)% | |
| Agricultural Partnership Costs | 9,419 | 17,078 | (44.8)% | 0.9 | 1.4 | (33.8)% | |
| Maintenance costs | 13,640 | 14,612 | (6.7)% | 1.4 | 1.2 | 12% | |
| Total Production Costs | 97,583 | 136,142 | (28.3)% | 9.8 | 11.4 | (14)% | |
| Depreciation & Amortization | (39,736) | (51,689) | (23.1%) | (4) | (4.3) | (7.8%) | |
| Total Production Costs (excl. D&A) | 57,847 | 84,452 | (31.5)% | 5.8 | 7.1 | (17.8)% | |
| Sugar, Ethanol & Energy - Total Production Costs | |||||||
| Total Cost (´000) | Total Cost per Pound (cts/lbs) | ||||||
| 9M18 | 9M17 | Chg % | 9M18 | 9M17 | Chg % | ||
| Industrial costs | 64,720 | 78,255 | (17.3)% | 2.8 | 3.3 | (16.6)% | |
| Industrial costs | 53,677 | 51,961 | 3.3% | 2.3 | 2.4 | (4.7)% | |
| Cane from 3rd parties | 11,043 | 26,295 | (58.0)% | 0.5 | 1.2 | (61.3)% | |
| Agricultural costs | 191,182 | 199,734 | (4.3)% | 8.2 | 9.3 | (11.7)% | |
| Harvest costs | 77,351 | 83,520 | (7.4)% | 3.3 | 3.9 | (14.5)% | |
| Cane depreciation | 45,091 | 42,112 | 7.1% | 1.9 | 2.0 | (1.2)% | |
| Agricultural Partnership Costs | 25,646 | 32,273 | (20.5)% | 1.1 | 1.5 | (26.7%) | |
| Maintenance costs | 43,093 | 41,828 | 3.0% | 1.8 | 1.9 | (4.9)% | |
| Total Production Costs | 255,902 | 277,989 | (7.9)% | 10.9 | 12.6 | (13.0)% | |
| Depreciation & Amortization | (106,355) | (104,723) | 1.6% | (4.5) | (4.9) | (6.3%) | |
| Total Production Costs (excl. D&A) | 149,547 | 173,266 | (13.7)% | 6.4 | 7.7 | (17.2)% | |
As shown in the table above, total production costs excluding depreciation and amortization fell a 17.2%, on a per unit basis. This decrease was explained by: (i) enhanced agricultural efficiencies that contributed to reduce harvest costs, (ii) lower sugar prices which resulted in a reduction in Consecana price and thus, in our agricultural partnership costs; and (iii) a reduction in the share of third party cane. Unit costs, measured in U.S. dollars, were further reduced by the year-over-year depreciation of the Brazilian Real.
21
| Sugar, Ethanol & Energy - Changes in Fair Value | |||||||
| $ thousands | 3Q18 | 3Q17 | Chg % | 9M18 | 9M17 | Chg % | |
| Sugarcane Valuation Model current period | 54,575 | 68,865 | (20.8)% | 54,575 | 68,865 | (20.8%) | |
| Sugarcane Valuation Model previous period | 70,785 | 71,017 | (0.3)% | 93,177 | 82,380 | 13.1% | |
| Total Changes in Fair Value | (16,210) | (2,152) | 653.1% | (38,603) | (13,515) | 185.6% | |
Total Changes in Fair Value of Unharvested Biological Assets (what is currently growing on the fields and will be harvested during the next 12 months) represented an $2.3 million loss. This loss is mainly attributable to a decrease in Consecana price as a result of sugar price dynamics. On a year to date basis, there was a $38.6 million loss in line with the explanation for the quarter.
| Corporate Expenses |
| Corporate Expenses | ||||||
| $ thousands | 3Q18 | 3Q17 | Chg % | 9M18 | 9M17 | Chg % |
| Corporate Expenses | (4,726) | (5,999) | (21.2)% | (14,686) | (16,329) | (10.1)% |
Adecoagro’s corporate expenses include items that have not been allocated to a specific business segment, such as executive officers and headquarter staff, certain professional fees, travel expenses, and office lease expenses, among others. As shown in the table above, corporate expenses for 3Q18 were $4.7 million, 21.2% lower compared to 3Q17, mainly as a result of the depreciation of the Brazilian Real and the Argentine peso.
22
| Other Operating Income |
| Other Operating Income | ||||||||||||
| $ thousands | 3Q18 | 3Q17 | Chg % | 9M18 | 9M17 | Chg % | ||||||
| Gain from the sale of subsidiaries | 123 | — | n.a. | 36,350 | — | n.a. | ||||||
| Gain / (Loss) from commodity derivative financial instruments | 19,840 | 2,080 | 853.8 | % | 51,982 | 40,833 | 27.3 | % | ||||
| Gain from disposal of other property items | (160 | ) | 89 | (279.8 | )% | (217 | ) | (529 | ) | (59.0 | )% | |
| Net Gain from FV Adjustement in Investment Property | 2,465 | 1,753 | 40.6 | % | 18,457 | 3,634 | 407.9 | % | ||||
| Other | (111.313 | ) | 976 | n.a. | 1,206 | (904 | ) | n.a. | ||||
| Total | 37,891 | 5,015 | 656 | % | 107,520 | 43,034 | 149.8 | % | ||||
Other Operating Income on a year-to-date basis reported a gain of $107.5 million, 149.8%or $64.5 million higher than the same period of last year. This increase is mainly attributable to the proceeds from the sale of Rio de Janeiro and Conquista farms coupled with a higher gain derived from the mark-to-market of our sugar hedge position.
23
| Commodity Hedging |
Adecoagro’s financial performance is affected by the volatile price environment inherent to agricultural commodities. The company uses forward and derivative markets to mitigate swings in commodity prices by locking-in margins and stabilizing cash flows.
The table below shows the average selling price of our hedged production volumes, including volumes that have already been invoiced and delivered, forward contracts with fixed-price and volumes hedged through derivative instruments.
| Commodity Hedge Position - as of September 30, 2018 | |||
| Consolidated Hedge Position | |||
| Farming | Avg. FAS Price | CBOT FOB | |
Volume (1) | USD/Ton | USD/Bu | |
| 2017/2018 Harvest season | |||
| Soybeans | 146,372 | 278.5 | 994.5 |
| Corn | 106,765 | 162.8 | 476.1 |
| 2018/2019 Harvest season | |||
| Soybeans | 17,965 | 288.0 | 994.5 |
| Corn | 106,765 | 162.8 | 476.1 |
| Consolidated Hedge Position | |||
| Sugar, Ethanol & Energy | Avg. FOB Price | ICE FOB | |
Volume (1) | USD/Unit | Cents/Lb | |
| 2018/2019 Harvest season (2017/18 for ethanol) | |||
| Sugar (tons) | 363,626 | 380.6 | 17.3 |
| Ethanol (m3) | 369,452 | 434.5 | n.a |
Energy (MW/h) | 751,015 | 71.1 | n.a |
| 2019/2020 Harvest season (2018/19 for ethanol) | |||
| Sugar (tons) | 147,320 | 328.0 | 14.9 |
| Ethanol (m3) | - | - | - |
Energy (MW/h) | 477,478 | 64.2 | n.a |
24
| Financial Results |
| Financial Results | ||||||||||||
| $ thousands | 3Q18 | 3Q17 | Chg % | 9M18 | 9M17 | Chg % | ||||||
| Interest Expenses, net | (7,381 | ) | (10,730 | ) | (31.2 | )% | (30,543 | ) | (31,507 | ) | (3.1 | )% |
| Cash Flow Hedge - Transfer from Equity | (519 | ) | (7,369 | ) | (93.0 | )% | (7,846 | ) | (10,689 | ) | (26.6 | )% |
| FX (Losses), net | (62,932 | ) | (6,627 | ) | n.m | (188,204 | ) | (18,510 | ) | n.m | ||
| Gain/loss from derivative financial Instruments | 923 | 143 | 545.5 | % | (5,836 | ) | (2,052 | ) | 184.4 | % | ||
| Taxes | (13 | ) | (972 | ) | (98.7 | )% | (2,081 | ) | (2,276 | ) | (8.6 | )% |
| Inflation accounting effects | 50,370 | — | n.a. | 50,370 | — | n.a. | ||||||
| Other Expenses, net | (1,080 | ) | (2,194 | ) | (50.8 | )% | (1,338 | ) | (2,903 | ) | (53.9 | )% |
| Total Financial Results | (20,632 | ) | (27,749 | ) | (25.6 | )% | (185,478 | ) | (67,937 | ) | 173 | % |
Our net financial results in 3Q18 presented a loss of $20.6 million, compared to a loss of $27.7 million in the same period of last year. The financial results loss is primarily composed of (i) foreign exchange losses, (ii) net interest expenses; and (iii) inflation accounting effects as described below:
| (i) | Foreign exchange losses (composed of “Cash Flow Hedge - Transfer from Equity (1) and “Fx Gain/Loss line” items) reflect the impact of foreign exchange variations on our dollar denominated monetary assets and liabilities. As a result of the sharp depreciations experienced by the Argentina Peso and Brazilian Real (43.0% and 3.8%, respectively) during 3Q18, foreign exchange losses stood at $63.5 , marking a $49.5 higher loss compared to 3Q17. It´s worth highlighting that these results are non-cash in nature and represent no equity loss, in US dollar. |
| (ii) | Interest expenses: our net interest expenses in 3Q18 were $7.4 million, 25.6% lower year-over-year. This difference is mainly explained by the depreciation of the Brazilian Real, coupled with a lower average debt compared to 3Q17. |
| (iii) | Inflation accounting effects reflect the results derived from the exposure of our net monetary position to inflation. In this line, monetary assets generate a loss when exposed to inflation while monetary liabilities generate a gain, every time inflation reduces the owed balance, in real terms. During 3Q18, since we had a negative net monetary position (monetary liabilities were higher than monetary assets), we registered a $50.4 million gain. |
(1) Effective July 1, 2014, Adecoagro formally documented and designated cash flow hedging relationships to hedge the foreign exchange rate risk of a portion of its highly probable future sales in US dollars using a portion of its borrowings denominated in US dollars and foreign currency forward contracts. Cash flow hedge accounting permits that gains and losses arising from the effect of changes in foreign currency exchange rates on derivative and non-derivative hedging instruments not be immediately recognized in profit or loss, but be reclassified from equity to profit or loss in the same periods during which the future sales occur, thus allowing for a more appropriate presentation of the results for the period reflecting Adecoagro's Risk Management Policy.
25
| Indebtedness |
| Net Debt Breakdown | |||||
| $ thousands | 3Q18 | 2Q18 | Chg % | 3Q17 | Chg % |
| Farming | 179,813 | 177,307 | 1.4% | 165,989 | 8.3% |
| Short term Debt | 94,446 | 86,210 | 9.6% | 115,946 | (18.5)% |
| Long term Debt | 85,367 | 91,097 | (6.3)% | 50,043 | 70.6% |
| Sugar, Ethanol & Energy | 635,319 | 633,614 | 0.3% | 641,301 | (0.9)% |
| Short term Debt | 71,633 | 59,212 | 21.0% | 67,226 | 6.6% |
| Long term Debt | 563,686 | 574,402 | (1.9)% | 574,075 | (1.8)% |
| Bond Proceeds at Holding | — | — | n.a | 301,587 | (100.0)% |
| Total Short term Debt | 166,079 | 145,422 | 14.2% | 183,172 | (9.3)% |
| Total Long term Debt | 649,053 | 665,498 | (2.5)% | 925,705 | (29.9)% |
| Gross Debt | 815,132 | 810,920 | 0.5% | 1,108,877 | (26.5)% |
| Cash & Equivalents | 180,829 | 144,708 | 25.0% | 523,175 | (65.4)% |
| Net Debt | 634,303 | 666,212 | (4.8)% | 585,702 | 8.3% |
| EOP Net Debt / Adj. EBITDA LTM | 1.73x | 1.83x | (5.9)% | 1.95x | (11.3)% |
Adecoagro’s consolidated gross debt as of 3Q18 stood at $815.1 million, 26.5% lower year-over-year. As of September 30th,2017, $301.6 million out of the $500 million bond proceeds remained in our cash balance. $251.6 million were subsequently used to keep refinancing our existing debt and extending debt maturity.
Net debt as of 3Q18 was $634.3 million, 4.8% lower and 8.3% higher than 2Q18 and 3Q17, respectively. Adjusted by the excess cash balance from the bond proceeds as of September 30th 2017; the $48.6 million increase in net debt from a yearly perspective is primarily driven by a $7.8 million higher gross debt, mainly explained by our investment program, coupled with a $40.8 million reduction in cash & equivalents mainly as a result of lower sales proceeds from crops sales as a consequence of lower selling volumes because of the drought,
Due to the growth in Adjusted EBITDA, however, Net debt ratio (Net debt / LTM Adj. EBITDA) reached 1.73x,11.3% lower year-over-year.
26
| Capital Expenditures & Investments |
| Capital Expenditures & Investments | ||||||
| $ thousands | 3Q18 | 3Q17 | Chg % | 9M18 | 9M17 | Chg % |
| Farming & Land Transformation | 22,664 | 4,575 | 395.4% | 33,700 | 11,935 | 182.4% |
| Expansion | 21,100 | 3,165 | 566.8% | 30,856 | 7,853 | 292.9% |
| Maintenance | 1,564 | 1,410 | 10.9% | 2,844 | 4,082 | (30.3)% |
| Sugar, Ethanol & Energy | 91,380 | 32,168 | 184.1% | 131,484 | 131,229 | 0.2% |
| Maintenance | 70,637 | 18,741 | 276.9% | 98,717 | 99,224 | (0.5)% |
| Planting | 31,239 | 16,833 | 85.6% | 45,658 | 40,001 | 14.1% |
| Industrial & Agricultural Machinery | 39,398 | 1,908 | 1,964.9% | 53,058 | 59,223 | (10.4)% |
| Expansion | 20,744 | 13,427 | 54.5% | 32,768 | 32,005 | 2.4% |
| Planting | 13,303 | 7,946 | 67.4% | 24,965 | 21,606 | 15.5% |
| Industrial & Agricultural Machinery | 7,441 | 5,481 | 35.7% | 7,802 | 10,399 | (25.0)% |
| Total | 114,045 | 36,743 | 210.4% | 165,184 | 143,164 | 15.4% |
Adecoagro’s capital expenditures during during 9M18 totaled $165.2 million, 15.4% higher compared to the same period of last year.
The Sugar, Ethanol and Energy business accounted for 79.6% or $131.5 million of total capex. Expansion capex reached $32.8 million, mainly as a result of the investments related to the increase in nominal crushing capacity and to new sugarcane hectares planted to supply the growing industrial capacity. Maintenance capex, in turn, reached $98.7 million million, in line with the previous year.
Farming & Land Transformation businesses accounted for 20.5% or $33.7 million of total capex in 9M18. The increase is mainly driven by the expansion capex in the Dairy and Rice businesses. We completed the construction of our third free stall last quarter and during this quarter we started operating and populating it. In our Rice business, the main projects that account for the increase are the construction of the parboil plant and a packaging machine. With these investments, we expect to enhance industrial efficiencies and capture higher margins.
27
| Inventories |
| End of Period Inventories | ||||||||
| Volume | thousand $ | |||||||
| Product | Metric | 3Q18 | 3Q17 | % Chg | 3Q18 | 3Q17 | % Chg | |
| Soybean | tons | 67,138 | 96,735 | (30.6)% | 17,139 | 24,162 | (29.1)% | |
Corn (1) | tons | 96,454 | 56,965 | 69.3% | 11,847 | 7,207 | 64.4% | |
Wheat (2) | tons | 7,770 | 15,127 | (48.6)% | 1,775 | 2,143 | (17.2)% | |
| Sunflower | tons | 2,180 | 16 | n.m. | 735 | 6 | n.m. | |
Rough Rice(3) | tons | 25,333 | 54,287 | (53.3)% | 3,060 | 11,633 | (73.7)% | |
| Sugar | tons | 52,892 | 66,080 | (20.0)% | 11,433 | 17,139 | (33.3)% | |
| Ethanol | m3 | 144,817 | 135,771 | 6.7% | 47,817 | 70,469 | (32.1)% | |
| Total | 397,056 | 424,982 | (6.6)% | 94,255 | 132,757 | (29.0)% | ||
(1) Includes sorghum.
(2) Includes barley.
(3) Expressed in rough rice equivalent
Variations in inventory levels between 3Q18 and 3Q17 are attributable to changes in (i) production volumes resulting from changes in planted area, (ii) production mix between different crops and in yields obtained, (ii) different percentage of area harvested during the period, and (iii) commercial strategy or selling pace for each product.
28
| Forward-looking Statements |
This press release contains forward-looking statements that are based on our current expectations, assumptions, estimates and projections about us and our industry. These forward-looking statements can be identified by words or phrases such as “anticipate,” “forecast”, “believe,” “continue,” “estimate,” “expect,” “intend,” “is/are likely to,” “may,” “plan,” “should,” “would,” or other similar expressions.
The forward-looking statements included in this press release relate to, among others: (i) our business prospects and future results of operations; (ii) weather and other natural phenomena; (iii) developments in, or changes to, the laws, regulations and governmental policies governing our business, including limitations on ownership of farmland by foreign entities in certain jurisdictions in which we operate, environmental laws and regulations; (iv) the implementation of our business strategy, including the expansion of our sugarcane cluster in Mato Grosso do Sul and other current projects; (v) our plans relating to acquisitions, joint ventures, strategic alliances or divestitures; (vi) the implementation of our financing strategy and capital expenditure plan; (vii) the maintenance of our relationships with customers; (viii) the competitive nature of the industries in which we operate; (ix) the cost and availability of financing; (x) future demand for the commodities we produce; (xi) international prices for commodities; (xii) the condition of our land holdings; (xiii) the development of the logistics and infrastructure for transportation of our products in the countries where we operate; (xiv) the performance of the South American and world economies; and (xv) the relative value of the Brazilian Reais, the Argentine Peso, and the Uruguayan Peso compared to other currencies; as well as other risks included in the registrant’s other filings and submissions with the United States Securities and Exchange Commission.
These forward-looking statements involve various risks and uncertainties. Although we believe that our expectations expressed in these forward-looking statements are reasonable, our expectations may turn out to be incorrect. Our actual results could be materially different from our expectations. In light of the risks and uncertainties described above, the estimates and forward-looking statements discussed in this press release might not occur, and our future results and our performance may differ materially from those expressed in these forward-looking statements due to, inclusive, but not limited to, the factors mentioned above. Because of these uncertainties, you should not make any investment decision based on these estimates and forward-looking statements.
The forward-looking statements made in this press release related only to events or information as of the date on which the statements are made in this press release. We undertake no obligation to update any forward-looking statements to reflect events or circumstances after the date on which the statements are made or to reflect the occurrence of unanticipated events.
29
| Reconciliation of Non-IFRS measures |
To supplement our consolidated financial statements, which are prepared and presented in accordance with IFRS, we use the following non-IFRS financial measures in this press release:
| • | Adjusted EBITDA |
| • | Adjusted EBIT |
| • | Adjusted EBITDA margin |
| • | Net Debt |
| • | Net Debt to Adjusted EBITDA |
| • | Adjusted Net Income |
In this section, we provide an explanation and a reconciliation of each of our non-IFRS financial measures to their most directly comparable IFRS measures. The presentation of these financial measures is not intended to be considered in isolation or as a substitute for, or superior to, financial information prepared and presented in accordance with IFRS.
We believe these non-GAAP financial measures provide investors with useful supplemental information about the financial performance of our business, enable comparison of financial results between periods where certain items may vary independent of business performance, and allow for greater transparency with respect to key metrics used by management for financial and operational decision making and as a means to evaluate period-to-period.
There are limitations associated with the use of non-IFRS financial measures as an analytical tool. In particular, many of the adjustments to our IFRS financial measures reflect the exclusion of items, such as depreciation and amortization, changes in fair value and the related income tax effects of the aforementioned exclusions and exchange differences generated by the net liability monetary position in USD in the countries where the functional currency is the local currency, that are recurring and will be reflected in our financial results for the foreseeable future. In addition, these measures may be different from non-IFRS financial measures used by other companies, limiting their usefulness for comparison purposes.
Adjusted EBITDA, Adjusted EBIT & Adjusted EBITDA margin
We define Adjusted EBITDA for each of our operating segments as the segment’s share of consolidated profit from operations before financing and taxation for the year or period, as applicable, before depreciation and amortization, excluding the revaluation result of the hectares hold as investment property, and adjusted by profit or loss from discontinued operations and by gains or losses from disposals of non-controlling interests in subsidiaries whose main underlying asset is farmland which are reflected in our Shareholders Equity under the
30
line item “Reserve from the sale of minority interests in subsidiaries.” Revaluation results from the farmland held as Property, Plant & Equipment
We define “Adjusted Consolidated EBITDA” as (i) consolidated net profit (loss) for the year, as applicable, before interest expense, income taxes, depreciation and amortization, net gain from fair value adjustments of investment property land, foreign exchange gains or losses, other net financial expenses; and (ii) adjusted by profit or loss from discontinued operations if any; and (iii) adjusted by those items, that do not impact profit and loss, but are recorded directly in shareholders’ equity, i.e., (x) the gains or losses from disposals of non-controlling interests in subsidiaries whose main underlying asset is farmland , reflected under the line item: "Reserve from the sale of non-controlling interests in subsidiaries; and (y) the net increase in value of sold farmland, which has been recognized in either Revaluation surplus or retained earnings.
We believe that Adjusted EBITDA and Adjusted EBIT are for the Company and each operating segment, respectively important measures of operating performance because they allow investors and others to evaluate and compare our consolidated operating results and to evaluate and compare the operating performance of our segments, respectively, including our return on capital and operating efficiencies, from period to period by removing the impact of our capital structure (interest expense from our outstanding debt), asset base (depreciation and amortization), tax consequences (income taxes), foreign exchange gains or losses and other financial expenses. In addition, by including the gains or losses from disposals of non-controlling interests in subsidiaries whose main underlying asset is farmland, investors can evaluate the full value and returns generated by our land transformation activities. Other companies may calculate Adjusted EBITDA and Adjusted EBIT differently, and therefore Adjusted EBITDA and Adjusted EBIT may not be comparable to similarly titled measures used by other companies. Adjusted EBITDA and Adjusted EBIT are not measure of financial performance under IFRS, and should not be considered in isolation or as an alternative to consolidated net profit (loss), cash flows from operating activities, profit from operations before financing and taxation and other measures determined in accordance with IFRS.
We define Adjusted EBITDA margin as Adjusted EBITDA to net sales. We consider that the presentation of adjusted EBITDA margin provides useful information on how successfully we operate our Company and enhances the ability of investors to compare profitability between segments, periods and with other public companies.
Reconciliation of both Adjusted EBITDA and Adjusted EBIT starts on page 39.
Net Debt & Net Debt to Adjusted EBITDA
Net debt is defined as the sum of long- and short-term debt less cash and cash equivalents. This measure is widely used by management and investment analysts and we believe it shows the financial strength of the Company
Management is consistently tracking our leverage position and our ability to repay and service our debt obligations over time. We have therefore set a leverage ratio target that is measured by net debt divided by Adjusted EBITDA.
We believe that this metric provides useful information to investors because management uses it to manage our debt-equity ratio in order to promote access to debt financing instruments in the capital markets and our ability to meet scheduled debt service obligations.
31
| Reconciliation - Net Debt | |||||||||||||||
| $ thousands | 3Q18 | 2Q 18 | % Chg | 3Q17 | % Chg | ||||||||||
| Total Borrowings | 815,132 | 810,920 | 0.5 | % | 1,108,877 | (26.5 | )% | ||||||||
| Cash and Cash equivalents | 180,829 | 144,708 | 25.0 | % | 523,175 | (65.4 | )% | ||||||||
| Net Debt | 634,303 | 666,212 | (4.8 | )% | 585,702 | 8.3 | % | ||||||||
Adjusted Net Income
We define Adjusted Net Income as (i) Profit/ (Loss) of the period/year before net gain from fair value adjustments of investment property land; plus (ii) any non-cash finance costs resulting from foreign exchange gain/losses for such period, which are composed by both Exchange Differences and Cash Flow Hedge Transfer from Equity, included in Financial Results, net, in our statement of income; net of the related income tax effects, plus (iii) gains or losses from disposals of non-controlling interests in subsidiaries whose main underlying asset is farmland, which are reflected in our Shareholders Equity under the line item. “Reserve from the sale of non-controlling interests in subsidiaries”, plus (iv) the reversal of the aforementioned income tax effect, plus (v) any inflation accounting effect; plus (vi) the net increase in value of sold farmland, which has been recognized in either Revaluation surplus or Retained earnings, net of the related income tax effect.
We believe that Adjusted Net Income is an important measure of performance for our company allowing investors to properly assess the impact of the results of our operations in our Equity. In effect, results arising from the revaluation effect of our net monetary position held in foreign currency in the countries where our functional currency is the local currency do not affect the Equity of the Company, when measured in foreign / reporting currency. Conversely, the tax effect resulting from the aforementioned revaluation effect does impact the Equity of the Company, since it reduces/increases the income tax to be paid in each country; which is why we decided to add back the income tax effect to the Adjusted Net Income considering this tax effect.
In addition, by including the gains or losses from disposals of non-controlling interests in subsidiaries whose main underlying asset is farmland, investors can also include the full value and returns generated by our land transformation activities.
Other companies may calculate Adjusted Net Income differently, and therefore our Adjusted Net Income may not be comparable to similarly titled measures used by other companies. Adjusted Net Income is not a measures of financial performance under IFRS, and should not be considered in isolation or as an alternative to consolidated net profit (loss). This non-IFRS measure should be considered in addition to, but not as a substitute for or superior to, the information contained in our financial statements.
32
| Adjusted Net Income | ||||||||||||
| $ thousands | 3Q18 | 3Q17 | Chg % | 9M18 | 9M17 | Chg % | ||||||
| Net Income | 3,496 | (1,644 | ) | n.a | (18,978 | ) | 9,535 | n.a | ||||
| Foreign exchange losses, net | 62,932 | 6,627 | 850 | % | 188,204 | 18,510 | 917 | % | ||||
| Cash flow hedge - transfer from equity | 519 | 7,369 | (93 | )% | 7,846 | 10,689 | (27 | )% | ||||
| Income tax effect on Exchange Differences and Cash Flow Hedge | (19,992 | ) | (4,616 | ) | 333 | % | (62,588 | ) | (9,392 | ) | 566 | % |
| Inflation Accounting Effects | (50,370 | ) | — | n.a | (50,370 | ) | — | n.a | ||||
| Revaluation Result - Investment Property | (2,465 | ) | (1,753 | ) | (18,457 | ) | (3,634 | ) | ||||
| Reverse of Income tax effect on Exchange Differences and Cash Flow Hedge | 19,992 | 4,616 | 333 | % | 62,588 | 9,392 | ||||||
| Adjusted Net Income | 14,112 | 10,599 | 33 | % | 108,245 | 35,100 | 208 | % | ||||
33
| Adjusted EBIT & Adjusted EBITDA Reconciliation to Profit/Loss - 3Q18 | |||||||||||||||||||||||
| $ thousands | Crops | Rice | Dairy | Others | Farming | Sugar, Ethanol & Energy | Land Transformation | Corporate | Total | ||||||||||||||
| Sales of manufactured products and services rendered | 34,804 | 31,271 | 8,577 | 344 | 74,996 | 137,957 | — | — | 212,953 | ||||||||||||||
| Cost of manufactured products sold and services rendered | (34,860 | ) | (19,764 | ) | (7,998 | ) | (221 | ) | (62,844 | ) | (94,437 | ) | — | — | (157,281 | ) | |||||||
| Initial recog. and changes in FV of BA and agricultural produce | 3,757 | 489 | 763 | (460 | ) | 4,549 | (8,379 | ) | — | — | (3,830 | ) | |||||||||||
| Gain from changes in NRV of agricultural produce after harvest | 7,236 | — | — | — | 7,236 | — | — | — | 7,236 | ||||||||||||||
| Gross Profit from Agricultural Activities | 10,937 | 11,996 | 1,342 | (337 | ) | 23,937 | 35,141 | — | — | 59,078 | |||||||||||||
| General and administrative expenses | (1,071 | ) | (985 | ) | 882 | (9 | ) | (1,183 | ) | (6,146 | ) | — | (4,652 | ) | (11,981 | ) | |||||||
| Selling expenses | (1,504 | ) | (4,952 | ) | (216 | ) | (1 | ) | (6,673 | ) | (19,126 | ) | — | (67 | ) | (25,866 | ) | ||||||
| Other operating income, net | 4,120 | (35 | ) | (1,109 | ) | — | 2,976 | 14,371 | — | (7 | ) | 17,340 | |||||||||||
| Share of gain/(loss) of joint ventures | — | — | — | — | — | — | — | — | — | ||||||||||||||
| Profit from Operations Before Financing and Taxation | 12,482 | 6,024 | 899 | (347 | ) | 19,057 | 24,240 | — | (4,726 | ) | 38,571 | ||||||||||||
| Reserve from the sale of minority interests in subsidiaries | — | — | — | — | — | — | — | — | — | ||||||||||||||
| Adjusted EBIT | 12,482 | 6,024 | 899 | (347 | ) | 19,057 | 24,240 | — | (4,726 | ) | 38,571 | ||||||||||||
| (-) Depreciation PPE | 305 | 731 | 283 | 15 | 1,334 | 39,736 | — | — | 41,070 | ||||||||||||||
| Adjusted EBITDA | 12,787 | 6,755 | 1,182 | (332 | ) | 20,391 | 63,976 | — | (4,726 | ) | 79,641 | ||||||||||||
| Reconciliation to Profit/(Loss) | |||||||||||||||||||||||
| Adjusted EBITDA | 79,641 | ||||||||||||||||||||||
| Reserve from the sale of minority interests in subsidiaries | — | ||||||||||||||||||||||
| (+) Depreciation PPE | (41,070 | ) | |||||||||||||||||||||
| (+) Financial result, net | (20,632 | ) | |||||||||||||||||||||
| (+) Revaluation Result - Investment Property | 2,465 | ||||||||||||||||||||||
| (+) Income Tax (Charge)/Benefit | (10,889 | ) | |||||||||||||||||||||
| (+) Translation Effect (IAS 21) | (6,019 | ) | |||||||||||||||||||||
| Profit/(Loss) for the Period | 3,496 | ||||||||||||||||||||||
34
| Adjusted EBIT & Adjusted EBITDA Reconciliation to Profit/Loss - 3Q17 | |||||||||||||||||||||||
| $ thousands | Crops | Rice | Dairy | Others | Farming | Sugar, Ethanol & Energy | Land Transformation | Corporate | Total | ||||||||||||||
| Sales of manufactured products and services rendered | 59,201 | 16,219 | 8,931 | 375 | 84,726 | 178,262 | — | — | 262,988 | ||||||||||||||
| Cost of manufactured products sold and services rendered | (58,663 | ) | (12,431 | ) | (8,933 | ) | (149 | ) | (80,176 | ) | (126,714 | ) | — | — | (206,890 | ) | |||||||
| Initial recog. and changes in FV of BA and agricultural produce | (3,892 | ) | 432 | 2,898 | (407 | ) | (969 | ) | 2,493 | — | — | 1,524 | |||||||||||
| Gain from changes in NRV of agricultural produce after harvest | 4,843 | — | — | — | 4,843 | — | — | — | 4,843 | ||||||||||||||
| Gross Profit from Agricultural Activities | 1,489 | 4,220 | 2,896 | (181 | ) | 8,424 | 54,041 | — | — | 62,465 | |||||||||||||
| General and administrative expenses | (767 | ) | (1,105 | ) | (246 | ) | (42 | ) | (2,160 | ) | (7,866 | ) | — | (5,956 | ) | (15,982 | ) | ||||||
| Selling expenses | (2,304 | ) | (2,320 | ) | (199 | ) | 14 | (4,809 | ) | (22,840 | ) | — | (32 | ) | (27,681 | ) | |||||||
| Other operating income, net | 3,862 | (14 | ) | 108 | — | 3,956 | (683 | ) | — | (11 | ) | 3,262 | |||||||||||
| Share of gain/(loss) of joint ventures | — | — | — | — | — | — | — | — | — | ||||||||||||||
| Profit from Operations Before Financing and Taxation | 2,280 | 781 | 2,559 | (209 | ) | 5,411 | 22,652 | — | (5,999 | ) | 22,064 | ||||||||||||
| Reserve from the sale of minority interests in subsidiaries | — | — | — | — | — | — | — | — | — | ||||||||||||||
| Adjusted EBIT | 2,280 | 781 | 2,559 | (209 | ) | 5,411 | 22,652 | — | (5,999 | ) | 22,064 | ||||||||||||
| (-) Depreciation PPE | 348 | 911 | 243 | 29 | 1,531 | 51,689 | — | — | 53,220 | ||||||||||||||
| Adjusted EBITDA | 2,628 | 1,692 | 2,802 | (180 | ) | 6,942 | 74,341 | — | (5,999 | ) | 75,284 | ||||||||||||
| Reconciliation to Profit/(Loss) | |||||||||||||||||||||||
| Adjusted EBITDA | 75,284 | ||||||||||||||||||||||
| Reserve from the sale of minority interests in subsidiaries | — | ||||||||||||||||||||||
| (+) Depreciation PPE | (53,220 | ) | |||||||||||||||||||||
| (+) Financial result, net | (27,749 | ) | |||||||||||||||||||||
| (+) Revaluation Result - Investment Property | 1,753 | ||||||||||||||||||||||
| (+) Income Tax (Charge)/Benefit | 2,288 | ||||||||||||||||||||||
| (+) Translation Effect (IAS 21) | — | ||||||||||||||||||||||
| Profit/(Loss) for the Period | (1,644 | ) | |||||||||||||||||||||
35
| Adjusted EBIT & Adjusted EBITDA Reconciliation to Profit/Loss - 9M18 | |||||||||||||||||||||||
| $ thousands | Crops | Rice | Dairy | Others | Farming | Sugar, Ethanol & Energy | Land Transformation | Corporate | Total | ||||||||||||||
| Sales of manufactured products and services rendered | 115,316 | 87,482 | 24,184 | 1,148 | 228,130 | 356,309 | — | — | 584,439 | ||||||||||||||
| Cost of manufactured products sold and services rendered | (115,449 | ) | (66,037 | ) | (22,977 | ) | (761 | ) | (205,225 | ) | (237,551 | ) | — | — | (442,776 | ) | |||||||
| Initial recog. and changes in FV of BA and agricultural produce | 27,530 | 13,192 | 6,263 | (456 | ) | 46,529 | (14,851 | ) | — | — | 31,678 | ||||||||||||
| Gain from changes in NRV of agricultural produce after harvest | 14,584 | — | — | — | 14,584 | — | — | — | 14,584 | ||||||||||||||
| Gross Profit from Agricultural Activities | 41,980 | 34,637 | 7,471 | (70 | ) | 84,018 | 103,907 | — | — | 187,925 | |||||||||||||
| General and administrative expenses | (3,111 | ) | (3,443 | ) | (611 | ) | (59 | ) | (7,224 | ) | (20,181 | ) | — | (14,460 | ) | (41,865 | ) | ||||||
| Selling expenses | (4,499 | ) | (12,920 | ) | (417 | ) | (91 | ) | (17,927 | ) | (47,456 | ) | — | (127 | ) | (65,510 | ) | ||||||
| Other operating income, net | 1,518 | 247 | (1,147 | ) | (2 | ) | 616 | 50,225 | 36,227 | (99 | ) | 86,969 | |||||||||||
| Share of gain/(loss) of joint ventures | — | — | — | — | — | — | — | — | — | ||||||||||||||
| Profit from Operations Before Financing and Taxation | 35,888 | 18,521 | 5,296 | (222 | ) | 59,483 | 86,495 | 36,227 | (14,686 | ) | 167,519 | ||||||||||||
| Reserve from the sale of minority interests in subsidiaries | — | — | — | — | — | — | — | — | — | ||||||||||||||
| Adjusted EBIT | 35,888 | 18,521 | 5,296 | (222 | ) | 59,483 | 86,495 | 36,227 | (14,686 | ) | 167,519 | ||||||||||||
| (-) Depreciation PPE | 1,102 | 2,690 | 844 | 76 | 4,712 | 106,355 | — | — | 111,067 | ||||||||||||||
| Adjusted EBITDA | 36,990 | 21,211 | 6,140 | (146 | ) | 64,195 | 192,850 | 36,227 | (14,686 | ) | 278,586 | ||||||||||||
| Reconciliation to Profit/(Loss) | |||||||||||||||||||||||
| Adjusted EBITDA | 278,586 | ||||||||||||||||||||||
| Reserve from the sale of minority interests in subsidiaries | — | ||||||||||||||||||||||
| (+) Depreciation PPE | (111,067 | ) | |||||||||||||||||||||
| (+) Financial result, net | (185,478 | ) | |||||||||||||||||||||
| (+) Revaluation Result - Investment Property | 18,457 | ||||||||||||||||||||||
| (+) Income Tax (Charge)/Benefit | 3,151 | ||||||||||||||||||||||
| (+) Translation Effect (IAS 21) | (22,627 | ) | |||||||||||||||||||||
| Profit/(Loss) for the Period | (18,978 | ) | |||||||||||||||||||||
36
| Adjusted EBIT & Adjusted EBITDA Reconciliation to Profit/Loss - 9M17 | |||||||||||||||||||||||
| $ thousands | Crops | Rice | Dairy | Others | Farming | Sugar, Ethanol & Energy | Land Transformation | Corporate | Total | ||||||||||||||
| Sales of manufactured products and services rendered | 144,097 | 59,497 | 28,253 | 813 | 232,660 | 424,949 | — | — | 657,609 | ||||||||||||||
| Cost of manufactured products sold and services rendered | (143,355 | ) | (50,133 | ) | (27,921 | ) | (324 | ) | (221,733 | ) | (320,466 | ) | — | — | (542,199 | ) | |||||||
| Initial recog. and changes in FV of BA and agricultural produce | 13,451 | 6,228 | 7,426 | (244 | ) | 26,861 | (2,635 | ) | — | — | 24,226 | ||||||||||||
| Gain from changes in NRV of agricultural produce after harvest | 8,036 | — | — | — | 8,036 | — | — | — | 8,036 | ||||||||||||||
| Gross Profit from Agricultural Activities | 22,229 | 15,592 | 7,758 | 245 | 45,824 | 101,848 | — | — | 147,672 | ||||||||||||||
| General and administrative expenses | (2,168 | ) | (3,384 | ) | (742 | ) | (130 | ) | (6,424 | ) | (21,850 | ) | — | (16,209 | ) | (44,483 | ) | ||||||
| Selling expenses | (5,250 | ) | (8,721 | ) | (667 | ) | (39 | ) | (14,677 | ) | (49,990 | ) | — | (91 | ) | (64,758 | ) | ||||||
| Other operating income, net | 7,201 | 623 | 530 | (161 | ) | 8,193 | 31,236 | — | (29 | ) | 39,400 | ||||||||||||
| Share of gain/(loss) of joint ventures | — | — | — | — | — | — | — | — | — | ||||||||||||||
| Profit from Operations Before Financing and Taxation | 22,012 | 4,110 | 6,879 | (85 | ) | 32,916 | 61,244 | — | (16,329 | ) | 77,831 | ||||||||||||
| Reserve from the sale of minority interests in subsidiaries | — | — | — | — | — | — | — | — | — | ||||||||||||||
| Adjusted EBIT | 22,012 | 4,110 | 6,879 | (85 | ) | 32,916 | 61,244 | — | (16,329 | ) | 77,831 | ||||||||||||
| (-) Depreciation PPE | 1,040 | 2,797 | 737 | 89 | 4,663 | 104,723 | — | — | 109,386 | ||||||||||||||
| Adjusted EBITDA | 23052 | 6,907 | 7616 | 4 | 37579 | 165967 | — | (16,329 | ) | 187,217 | |||||||||||||
| Reconciliation to Profit/(Loss) | 0 | ||||||||||||||||||||||
| Adjusted EBITDA | 187,217 | ||||||||||||||||||||||
| Reserve from the sale of minority interests in subsidiaries | — | ||||||||||||||||||||||
| (+) Depreciation PPE | (109,386 | ) | |||||||||||||||||||||
| (+) Financial result, net | (67,937 | ) | |||||||||||||||||||||
| (+) Revaluation Result - Investment Property | 3,634 | ||||||||||||||||||||||
| (+) Income Tax (Charge)/Benefit | (3,993 | ) | |||||||||||||||||||||
| (+) Translation Effect (IAS 21) | — | ||||||||||||||||||||||
| Profit/(Loss) for the Period | 9,535 | ||||||||||||||||||||||
37
| Condensed Consolidated Statement of Income |
| Statement of Income | |||||||||||||||||
| $ thousands | 3Q18 | 3Q17 | Chg % | 9M18 | 9M17 | Chg % | |||||||||||
| Sales of goods and services rendered | 178,744 | 262,988 | (32.0 | )% | 550,230 | 657,609 | (16.3 | )% | |||||||||
| Cost of goods sold and services rendered | (129,954 | ) | (206,890 | ) | (37.2 | )% | (415,449 | ) | (542,199 | ) | (23.4 | )% | |||||
| Initial recognition and changes in fair value of biological assets and agricultural produce | (23,369 | ) | 1,524 | (1,633.4 | )% | 12,139 | 24,226 | (49.9 | )% | ||||||||
| Changes in net realizable value of agricultural produce after harvest | 2,204 | 4,843 | (54.5 | )% | 9,552 | 8,036 | 18.9 | % | |||||||||
| Margin on manufacturing and agricultural activities before operating expenses | 27,625 | 62,465 | (55.8 | )% | 156,472 | 147,672 | 6.0 | % | |||||||||
| General and administrative expenses | (9,428 | ) | (15,982 | ) | (41.0 | )% | (39,312 | ) | (44,483 | ) | (11.6 | )% | |||||
| Selling expenses | (21,688 | ) | (27,681 | ) | (21.7 | )% | (61,332 | ) | (64,758 | ) | (5.3 | )% | |||||
| Other operating income, net | 37,892 | 5,015 | 655.6 | % | 107,521 | 43,034 | 149.9 | % | |||||||||
| Profit from operations before financing and taxation | 34,401 | 23,817 | 44.4 | % | 163,349 | 81,465 | 100.5 | % | |||||||||
| Finance income | 1,651 | 3,520 | (53.1 | )% | 6,494 | 8,742 | (25.7 | )% | |||||||||
| Finance costs | (72,653 | ) | (31,269 | ) | 132.3 | % | (242,342 | ) | (76,679 | ) | 216.0 | % | |||||
| Other financial, results | 50,370 | — | 50,370 | — | |||||||||||||
| Financial results, net | (20,632 | ) | (27,749 | ) | (25.6 | )% | (185,478 | ) | (67,937 | ) | 173.0 | % | |||||
| (Loss)/Profit before income tax | 13,769 | (3,932 | ) | (450.2 | )% | (22,129 | ) | 13,528 | (263.6 | )% | |||||||
| Income tax benefit/(expense) | (10,273 | ) | 2,288 | (549.0 | )% | 3,151 | (3,993 | ) | (178.9 | )% | |||||||
| (Loss)/Profit for the period | 3,496 | (1,644 | ) | (312.7 | )% | (18,978 | ) | 9,535 | (299.0 | )% | |||||||
38
| Condensed Consolidated Interim Statement of Cash Flow |
| Statement of Cashflows | |||||||||||||||||
| $ thousands | 3Q18 | 3Q17 | Chg % | 9M18 | 9M17 | Chg % | |||||||||||
| Cash flows from operating activities: | |||||||||||||||||
| (Loss)/Profit for the period | 3,496 | (1,644 | ) | (312.7 | )% | (18,978 | ) | 9,535 | (299.0 | )% | |||||||
| Adjustments for: | |||||||||||||||||
| Income tax (benefit) /expense | 10,273 | (2,288 | ) | (549.0 | )% | (3,151 | ) | 3,993 | (178.9 | )% | |||||||
| Depreciation | 42,582 | 52,971 | (19.6 | )% | 112,056 | 108,721 | 3.1 | % | |||||||||
| Amortization | 278 | 249 | 11.6 | % | 801 | 665 | 20.5 | % | |||||||||
| Loss from disposal of other property items | 160 | (89 | ) | — | % | 217 | 529 | — | % | ||||||||
| Gain from the sale of subsidiaries | — | — | — | % | (36,227 | ) | — | — | % | ||||||||
| Net gain from the Fair value adjustment of Investment properties | (18,457 | ) | (1,753 | ) | (100.0 | )% | (18,457 | ) | (3,634 | ) | (100.0 | )% | |||||
| Equity settled share-based compensation granted | 1,208 | 1,417 | (14.7 | )% | 3,752 | 4,224 | (11.2 | )% | |||||||||
| Gain from derivative financial instruments | (21,009 | ) | (2,223 | ) | 845.1 | % | (46,146 | ) | (38,781 | ) | 19.0 | % | |||||
| Interest and other expense, net | 7,792 | 12,549 | (37.9 | )% | 30,936 | 33,737 | (8.3 | )% | |||||||||
| Initial recognition and changes in fair value of non harvested biological assets (unrealized) | 15,100 | 5,949 | 153.8 | % | 7,604 | 8,390 | (9.4 | )% | |||||||||
| Changes in net realizable value of agricultural produce after harvest (unrealized) | (3,492 | ) | (2,595 | ) | 34.6 | % | (11,355 | ) | (3,211 | ) | 253.6 | % | |||||
| Provision and allowances | 669 | 375 | 78.4 | % | 945 | 673 | 40.4 | % | |||||||||
| Net gain of inflation effects on the monetary items | (50,370 | ) | — | — | % | (50,370 | ) | — | — | % | |||||||
| Foreign exchange losses, net | 62,932 | 6,627 | 849.6 | % | 188,204 | 18,510 | 916.8 | % | |||||||||
| Cash flow hedge – transfer from equity | 519 | 7,369 | (93.0 | )% | 7,846 | 10,689 | (26.6 | )% | |||||||||
| Subtotal | 51,681 | 76,914 | (32.8 | )% | 167,677 | 154,040 | 8.9 | % | |||||||||
| Changes in operating assets and liabilities: | |||||||||||||||||
| Increase in trade and other receivables | (58,520 | ) | (19,475 | ) | 200.5 | % | (112,738 | ) | (48,530 | ) | 132.3 | % | |||||
| Increase in inventories | 12,769 | (27,168 | ) | (147.0 | )% | (69,716 | ) | (56,892 | ) | 22.5 | % | ||||||
| Decrease in biological assets | 5,333 | (1,111 | ) | (580.0 | )% | 37,894 | 24,560 | 54.3 | % | ||||||||
| Increase in other assets | (207 | ) | (231 | ) | (10.4 | )% | (274 | ) | (207 | ) | 32.4 | % | |||||
| Decrease in derivative financial instruments | 23,366 | 126 | 18,444.4 | % | 51,023 | 40,136 | 27.1 | % | |||||||||
| Decrease / (increase) in trade and other payables | 32,358 | 13,048 | 148.0 | % | 23,208 | (19,942 | ) | (216.4 | )% | ||||||||
| Increase in payroll and social security liabilities | 3,503 | 5,690 | (38.4 | )% | 6,156 | 7,268 | (15.3 | )% | |||||||||
| (Increase) / decrease in provisions for other liabilities | (17 | ) | 517 | (103.3 | )% | (333 | ) | 429 | (177.6 | )% | |||||||
| Net cash generated in operating activities before taxes paid | 70,266 | 48,310 | 45.4 | % | 102,897 | 100,862 | 2.0 | % | |||||||||
| Income tax paid | (576 | ) | (595 | ) | (3.2 | )% | (1,473 | ) | (2,248 | ) | (34.5 | )% | |||||
| Net cash generated from operating activities | 69,690 | 47,715 | 46.1 | % | 101,424 | 98,614 | 2.8 | % | |||||||||
| Cash flows from investing activities: | |||||||||||||||||
| Purchases of property, plant and equipment | (39,549,000 | ) | (36,170 | ) | 9.3 | % | (152,496 | ) | (142,223 | ) | 7.2 | % | |||||
| Purchases of cattle and non current biological assets | (432 | ) | (426 | ) | 1.4 | % | (3,547 | ) | (1,007 | ) | 252.2 | % | |||||
| Purchases of intangible assets | (210 | ) | (814 | ) | (74.2 | )% | (2,359 | ) | (1,390 | ) | 69.7 | % | |||||
| Interest received | 1,538 | 3,425 | (55.1 | )% | 5,780 | 8,446 | (31.6 | )% | |||||||||
| Proceeds from sale of property, plant and equipment | 487 | 1,061 | 100.0 | % | 1,233 | 1,859 | 100.0 | % | |||||||||
| Proceeds from sale of subsidiaries | 26,304,000 | — | — | % | 31,511 | — | — | % | |||||||||
| Net cash used in investing activities | (11,862 | ) | (32,924 | ) | (64.0 | )% | (119,878 | ) | (134,315 | ) | (10.7 | )% | |||||
| Cash flows from financing activities: | |||||||||||||||||
| Proceeds from equity settled share-based compensation exercise | — | 39 | — | % | — | 39 | — | % | |||||||||
| Issuance of senior notes | — | 496,151 | — | % | — | 496,151 | (100.0 | )% | |||||||||
| Proceeds from long-term borrowings | (13,512 | ) | 40,622 | (133.3 | )% | 37,217 | 230,391 | (83.8 | )% | ||||||||
| Payments of long-term borrowings | 13,033 | (226,148 | ) | (105.8 | )% | (49,834 | ) | (329,872 | ) | (84.9 | )% | ||||||
| Proceeds from short-term borrowings | 36,915 | 8,133 | 353.9 | % | 179,127 | 92,728 | 93.2 | % | |||||||||
| Payment of short-term borrowings | (29,121 | ) | (18,961 | ) | 53.6 | % | (151,667 | ) | (28,492 | ) | 432.3 | % | |||||
| Payments of derivatives financial instruments | (1,588 | ) | 55 | — | % | (1,230 | ) | (9,364 | ) | ' | |||||||
| Interest paid | (17,123 | ) | (10,898 | ) | 57.1 | % | (43,483 | ) | (33,438 | ) | 30.0 | % | |||||
| Purchase of own shares | — | (2,661 | ) | (100.0 | )% | (15,725 | ) | (11,342 | ) | 38.6 | % | ||||||
| Dividends paid to non-controlling interest | — | — | — | % | (1,195 | ) | (1,506 | ) | (20.7 | )% | |||||||
| Net cash (used)/generated from financing activities | (11,396 | ) | 286,332 | (104.0 | )% | (46,790 | ) | 405,295 | (111.5 | )% | |||||||
| Net decrease in cash and cash equivalents | 46,432 | 301,123 | (84.6 | )% | (65,244 | ) | 369,594 | (117.7 | )% | ||||||||
| Cash and cash equivalents at beginning of period | 144,708 | 219,934 | (34.2 | )% | 269,195 | 158,568 | 69.8 | % | |||||||||
| Effect of exchange rate changes and inflation on cash and cash equivalents | (10,312 | ) | 2,118 | (586.9 | )% | (23,123 | ) | (4,987 | ) | 363.7 | % | ||||||
| Cash and cash equivalents at end of period | 180,828 | 523,175 | (65.4 | )% | 180,828 | 523,175 | (65.4 | )% | |||||||||
39
Condensed Consolidated Interim Balance Sheet |
| Statement of Financial Position | |||||||||
| $ thousands | September 30, 2018 | December 31, 2017 | Chg % | ||||||
| ASSETS | |||||||||
| Non-Current Assets | |||||||||
| Property, plant and equipment | 1,416,269 | 831,377 | 70.4 | % | |||||
| Investment property | 40,725 | 42,342 | (3.8 | )% | |||||
| Intangible assets | 24,191 | 17,192 | 40.7 | % | |||||
| Biological assets | 8,890 | 11,276 | (21.2 | )% | |||||
| Deferred income tax assets | 22,541 | 30,808 | — | % | |||||
| Trade and other receivables | 22,747 | 22,107 | 2.9 | % | |||||
| Other assets | 646 | 535 | 20.7 | % | |||||
| Total Non-Current Assets | 1,536,009 | 955,637 | 60.7 | % | |||||
| Current Assets | |||||||||
| Biological assets | 73,749 | 156,718 | (52.9 | )% | |||||
| Inventories | 159,712 | 108,919 | 46.6 | % | |||||
| Trade and other receivables | 198,950 | 150,107 | 32.5 | % | |||||
| Derivative financial instruments | 5,285 | 4,483 | 17.9 | % | |||||
| Other assets | 60 | 30 | 100.0 | % | |||||
| Cash and cash equivalents | 180,828 | 269,195 | (32.8 | )% | |||||
| Total Current Assets | 618,584 | 689,452 | (10.3 | )% | |||||
| TOTAL ASSETS | 2,154,593 | 1,645,089 | 31.0 | % | |||||
| SHAREHOLDERS EQUITY | |||||||||
| Capital and reserves attributable to equity holders of the parent | |||||||||
| Share capital | 183,573 | 183,573 | — | % | |||||
| Share premium | 900,503 | 908,934 | (0.9 | )% | |||||
| Cumulative translation adjustment | (679,854 | ) | (552,604 | ) | 23.0 | % | |||
| Equity-settled compensation | 15,391 | 17,852 | (13.8 | )% | |||||
| Cash flow hedge | (76,934 | ) | (24,691 | ) | 211.6 | % | |||
| Treasury shares | (8,741 | ) | (6,967 | ) | 25.5 | % | |||
| Revaluation surplus | 398,096 | — | |||||||
| Reserve from the sale of non-controlling interests in subsidiaries | 41,574 | 41,574 | — | % | |||||
| Retained earnings | 244,998 | 106,209 | 130.7 | % | |||||
| Equity attributable to equity holders of the parent | 1,018,606 | 673,880 | 51.2 | % | |||||
| Non-controlling interest | 43,831 | 9,139 | 379.6 | % | |||||
| TOTAL SHAREHOLDERS EQUITY | 1,062,437 | 683,019 | 55.6 | % | |||||
| LIABILITIES | |||||||||
| Non-Current Liabilities | |||||||||
| Trade and other payables | 1,991 | 827 | 140.7 | % | |||||
| Borrowings | 649,761 | 663,060 | (2.0 | )% | |||||
| Deferred income tax liabilities | 158,391 | 10,457 | 1,414.7 | % | |||||
| Payroll and social security liabilities | 1,109 | 1,240 | (10.6 | )% | |||||
| Derivatives financial instruments | — | — | — | % | |||||
| Provisions for other liabilities | 2,971 | 4,078 | (27.1 | )% | |||||
| Total Non-Current Liabilities | 814,223 | 679,662 | 19.8 | % | |||||
| Current Liabilities | |||||||||
| Trade and other payables | 77,143 | 98,423 | (21.6 | )% | |||||
| Current income tax liabilities | 1,111 | 503 | 120.9 | % | |||||
| Payroll and social security liabilities | 26,797 | 27,267 | (1.7 | )% | |||||
| Borrowings | 165,372 | 154,898 | 6.8 | % | |||||
| Derivative financial instruments | 6,820 | 552 | 1,135.5 | % | |||||
| Provisions for other liabilities | 690 | 765 | (9.8 | )% | |||||
| Total Current Liabilities | 277,933 | 282,408 | (1.6 | )% | |||||
| TOTAL LIABILITIES | 1,092,156 | 962,070 | 13.5 | % | |||||
| TOTAL SHAREHOLDERS EQUITY AND LIABILITIES | 2,154,593 | 1,645,089 | 31.0 | % | |||||
40