Exhibit 99.1
Operating and Financial Review and Prospects
OPERATING RESULTS
Description of accounting policies changed during the period.
We disclose herein the new accounting policy that has been applied from January 1, 2019, where it is different to those applied in prior periods.
Leases:
For fiscal years beginning on January 1st 2019 and onward it is mandatory the adoption of IFRS 16 - Leases.
The Company has adopted IFRS 16 Leases from January 1, 2019, but has not restated comparatives for previous reporting period as permitted under the specific transition provisions in the Standard, following the simplified approach .
On adoption of IFRS 16, the Company recognized lease liabilities in relation to leases which had previously been classified as ‘operating leases’ under the principles of IAS 17 Leases. In the previous year, the Company only recognized lease liabilities in relation to leases that were classified as "Finance leases" under IAS 17 Leases. For the initial recognition, these liabilities were measured at the present value of the remaining lease payments, discounted using the lessee’s incremental borrowing rate as of January 1, 2019.
The adoption of IFRS 16 Leases from January 1, 2019, resulted in changes in accounting policies and adjustments to the amounts recognized in the financial statements.
Short term leases are recognized on a straight line basis as an expense in the income statement.
Trends and Factors Affecting Our Results of Operations
Our results of operations have been influenced and will continue to be influenced by the following factors:
(i) Effects of Yield Fluctuations
The occurrence of severe adverse weather conditions, especially droughts, hail, floods or frost, are unpredictable and may have a potentially devastating impact on agricultural production and may otherwise adversely affect the supply and prices of the agricultural commodities that we sell and use in our business. The effects of severe adverse weather conditions may also reduce yields at our farms. Yields may also be affected by plague, disease or weed infection and operational problems.
The following table sets forth our average crop, rice and sugarcane yields per hectare for the periods indicated:
| 2018/2019 | 2017/2018 | % Change | |||||||||
| Harvest Year (1) | Harvest Year (1) | 2018/2019 - 2017/2018 | |||||||||
Corn (2) | 6.5 | 4.9 | 32.7 | % | |||||||
| Soybean | 3.2 | 2.5 | 28.0 | % | |||||||
| Soybean (second harvest) | 1.5 | 1.2 | 25.0 | % | |||||||
Wheat (3) | 2.9 | 2.2 | 31.8 | % | |||||||
| Peanut | 3.1 | 2.1 | 47.6 | % | |||||||
| Sunflower | 1.6 | 1.8 | (11.1) | % | |||||||
| Rice | 5.9 | 6.9 | (14.5) | % | |||||||
| Sugarcane | 77.3 | 89.8 | (13.9) | % | |||||||
(1) The table above sets forth current yields in respect of harvest years as of September 30. The portion of harvested area completed as of September 30, 2019 was 100% for corn, soybean (first harvest and second harvest), wheat, peanut,
1
sunflower and rice. The portion of harvested area completed as of September 30, 2018 was 99.7% for corn, 100% for soybean (first harvest and second harvest), wheat, peanut, sunflower and rice.
(2) Includes sorghum and chia.
(3) Includes barley, rye, oats and chickpea.
(ii) Effects of Fluctuations in Production Costs
We experience fluctuations in our production costs due to the fluctuation in the costs of (i) fertilizers, (ii) agrochemicals, (iii) seeds, (iv) fuel, (v) farm leases and (vi) labor. The use of advanced technology, however, allows us to increase our efficiency, in large part mitigating the fluctuations in production costs. Some examples of how the implementation of production technology has allowed us to increase our efficiency and reduce our costs include the use of no-till technology (also known as “direct sowing”, which involves farming without the use of tillage, leaving plant residues on the soil to form a protective cover which positively impacts costs, yields and the soil), crop rotation, second harvest in one year, integrated pest management, and balanced fertilization techniques to increase the productive efficiency in our farmland. Increased mechanization of harvesting and planting operations in our sugarcane plantations and utilization of modern, high pressure boilers in our sugar and ethanol mills has also yielded higher rates of energy production per ton of sugarcane milled.
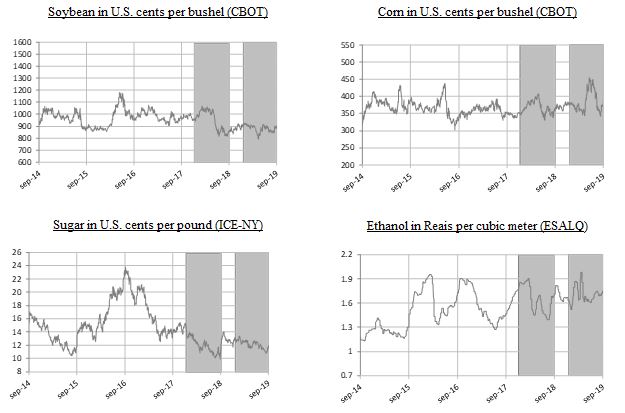
(iii) Effects of Fluctuations in Commodities Prices
Commodity prices have historically experienced substantial fluctuations. For example, between January 1, 2019 and September 30, 2019, ethanol prices increased by 4.8%, according to Escuela Superior de Agricultura “Luiz de Queiroz” (“ESALQ”) data, sugar prices decreased by 0.9%, according to Intercontinental Exchange of New York (“ICE-NY”) data. Also, based on Chicago Board of Trade (“CBOT”) data, from January 1, 2019 to September 30, 2019, soybean prices increased by 2.7%, and corn prices increased by 3.5%. Commodity price fluctuations impact our statement of income as follows:
•Initial recognition and changes in the fair value of biological assets and agricultural produce in respect of unharvested biological assets undergoing biological transformation;
•Changes in net realizable value of agricultural produce for inventory carried at its net realizable value; and
•Sales of manufactured products and agricultural produce to third parties.
The following graphs show the spot market price of some of our main products since March 31, 2014 to September 30, 2019, highlighting the periods from January 1 to September 30, 2018 and January 1 to September 30, 2019:
2
(iv) Fiscal Year and Harvest Year
Our fiscal year begins on January 1 and ends on December 31 of each year. However, our production is based on the harvest year for each of our crops and rice. A harvest year varies according to the crop or rice plant and to the climate in which it is grown. Due to the geographic diversity of our farms, the planting period for a given crop or rice may start earlier on one farm than on another, causing differences for their respective harvesting periods. The presentation of production volume (tons) and production area (hectares) in this report in respect of the harvest years for each of our crops and rice starts with the first day of the planting period at the first farm to start planting in that harvest year to the last day of the harvesting period of the crop or rice planting on the last farm to finish harvesting that harvest year.
On the other hand, production volumes for dairy and production volume and production area for sugar, ethanol and energy business are presented on a fiscal year basis.
The financial results in respect of all of our products are presented on a fiscal year basis.
(v) Effects of Fluctuations of the Production Area
Our results of operations also depends on the size of the production area. The size of our own and leased area devoted to crop, rice and sugarcane production fluctuates from period to period in connection with the purchase and development of new farmland, the sale of developed farmland, the lease of new farmland and the termination of existing farmland lease agreements. Lease agreements are usually settled following the harvest season, from July to September in crops and rice, and from May to April in sugarcane. The length of the lease agreements are usually one year for crops, one to five years for rice and six to seven years for sugarcane. Regarding crops, the production area can be planted and harvested one or two times per year. As an example, wheat can be planted in July and harvested in December. Right after it´s harvest, soybean can be planted in the same area and harvested in April. As a result, planted and harvested area can exceed the production area during one year. The production area for sugarcane can exceed the harvested area in one year. Grown sugarcane can be left in the fields and then harvested the following year. The following table sets forth the production area for the periods indicated:
3
| Nine-month period ended September 30, | |||||||||||||||||
| 2019 | 2018 | Change (%) | |||||||||||||||
| (Hectares) | |||||||||||||||||
| Crops (1) | 153,085 | 153,969 | (0.6) | % | |||||||||||||
| Rice | 40,417 | 40,289 | 0.3 | % | |||||||||||||
| Sugar, Ethanol and Energy | 164,687 | 151,597 | 8.6 | % | |||||||||||||
(1) Does not include second crop area or forage.
Crops and rice production area during the nine-month period ended September 30, 2019 compared to the same period in 2018, show no significant changes. The increase in sugar, ethanol and energy production area in 2019 is explained by an increase in leased hectares that provide sufficient cane supply for the entire year.
(vi) Effect of Acquisitions, dispositions and land transformation
Our business model includes the transformation of pasture and unproductive land into land suitable for growing various crops and the transformation of inefficient farms into farms suitable for more efficient uses through the implementation of advanced and sustainable agricultural practices, such as "no-till" technology and crop rotation. During approximately the first three to five years of the land transformation process of any given parcel, we must invest heavily in transforming the land, and, accordingly, crop yields during such period tend to be lower than crop yields once the land is completely transformed. After the transformation process has been completed, the land requires less investment, and crop yields gradually increase. As a result, there may be variations in our results from one season to the next according to the amount of land in the process of transformation.
Our business model also includes the identification, acquisition, development and selective disposition of farmlands or other rural properties that after implementing agricultural best practices and increasing crop yields we believe have the potential to appreciate in terms of their market value. As a part of this strategy, we purchase and sell farms and other rural properties from time to time. Please see also “Risk Factors—Risks Related to Argentina-Argentine law concerning foreign ownership of rural properties may adversely affect our results of operations and future investments in rural properties in Argentina” and “Risk Factors—Risks Related to Brazil—Changes in Brazilian rules concerning foreign investment in rural properties may adversely affect our investments.” included in “Item 3. Risk Factors” in our Form 20-F.
The results included in the Land Transformation segment are related to the acquisition and disposition of farmland businesses and not to the physical transformation of the land. The decision to acquire and/or dispose of a farmland business depends on several market factors that vary from period to period, rendering the results of these activities in one financial period when an acquisition of disposition occurs not directly comparable to the results in other financial periods when no acquisitions or dispositions occurred.
Our results of operations for earlier periods that do not include a recently completed acquisition or do include farming operations subsequently disposed of may not be comparable to the results of a more recent period that reflects the results of such acquisition or disposition. During the nine-month period ended September 30, 2019 we sold one farm in Brazil, "Alto Alegre", for a total consideration of $16.8 million -of which net present value is $13.8 million- for 6,080 hectares.
(vii) Macroeconomic Developments in Emerging Markets
We generate nearly all of our revenue from the production of food and renewable energy in emerging markets. Therefore, our operating results and financial condition are directly impacted by macroeconomic and fiscal developments, including fluctuations in currency exchange rates, inflation and interest rate fluctuations, in those markets. The emerging markets where we conduct our business (including Argentina, Brazil and Uruguay) remain subject to such fluctuations.
(viii) Effects of Export Taxes on Our Products
Since December 2015, the only product that had remained subject to export taxes was soybean and its derivatives. However, in September 2018 due to economic volatility, the government imposed a 12% export tax on all goods exported from Argentina. The 12% export tax will be imposed on the FOB export price of “primary product” goods (including agricultural goods), subject to a cap of four pesos (ARS 4) per U.S. dollar of the corresponding tax value or official FOB price for primary product goods. For all other products, the cap amount will be fixed at three pesos (ARS 3) per U.S. dollar of the corresponding tax value or official FOB price.
4
As local prices are determined taking into consideration the export parity reference, any increase or decrease in export taxes would affect our financial results.
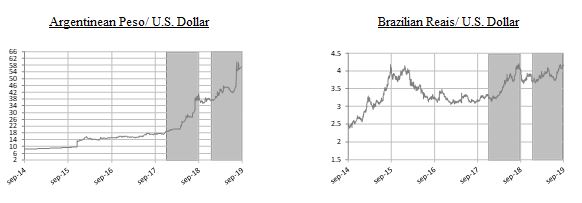
(ix) Effects of Foreign Currency Fluctuations
Each of our Argentine, Brazilian and Uruguayan subsidiaries use local currency as its functional currency. A significant portion of our operating costs in Argentina are denominated in Argentine Pesos and most of our operating costs in Brazil are denominated in Brazilian Reais. For each of our subsidiaries’ statements of income, foreign currency transactions are translated to local currency, as such subsidiaries’ functional currency, using the exchange rates prevailing as of the dates of the relevant specific transactions. Exchange differences resulting from the settlement of such transactions and from the translation at year-end exchange rates of monetary assets and liabilities denominated in foreign currencies are recognized in the statement of income under “finance income” or “finance costs,” as applicable. Our Consolidated Financial Statements are presented in U.S. dollars, and foreign exchange differences that arise in the translation process are disclosed in the consolidated statement of comprehensive income.
As of September 30, 2019, the Peso-U.S. dollar exchange rate was Ps. 57.59 per U.S. dollar as compared to Ps. 41.25 per U.S. dollar as of September 30, 2018. As of September 30, 2019, the Real-U.S. dollar exchange rate was R$4.16 per U.S. dollar as compared to R$4.05 per U.S. dollar as of September 30, 2018.
The following graph shows the Argentine Peso-U.S. dollar rate and the Real-U.S. dollar rate of exchange for the periods since September 31, 2014 to September 30, 2019, highlighting the periods January 1 to September 30, 2018 and January 1 to September 30, 2019:
Our principal foreign currency fluctuation risk involves changes in the value of the Brazilian Reais relative to the U.S. dollar. Periodically, we evaluate our exposure and consider opportunities to mitigate the effects of currency fluctuations by entering into currency forward contracts and other hedging instruments.
(x) Seasonality
Our business activities are inherently seasonal. We generally harvest and sell most of our grains (corn, soybean, rice and sunflower) between February and August, with the exception of wheat, which is harvested from December to January. Peanut is harvested from April to May, and sales are executed with higher intensity during the third quarter of the year. Cotton is a unique in that while it is typically harvested from June to August, it requires processing which takes about two to three months to complete. Sales in our dairy business segment tend to be more stable. However, milk production is generally higher during the fourth quarter, when the weather is more suitable for production. Although our Sugar, Ethanol and Electricity cluster is currently operating under a “non-stop” or “continuous” harvest and without stopping during traditional off-season, the rest of the sector in Brazil is still primarily operating with large off-season periods from December/January to March/April. The result of large off-season periods is fluctuations in our sugar and ethanol sales and in our inventories, usually peaking in December to take advantage of higher prices during the traditional off-season period (i.e., January through April). As a result of the above factors, there may be significant variations in our financial results from one quarter to another. In addition our quarterly results may vary as a result of the effects of fluctuations in commodities prices, production yields and costs on the determination of changes in fair value of biological assets and agricultural produce. See “Item 5. Operating and Financial Review and Prospects-A. Operating Results-Critical Accounting Policies and Estimates-Biological Assets and Agricultural Produce.”
5
(xi) Capital Expenditures and Other Investments
Our capital expenditures during the last two years consisted mainly of expenses related to (i) transforming and increasing the productivity of our land, (ii) planting sugarcane and (iii) expanding and upgrading our production facilities in concordance to our five year plan. Capital expenditures (including both maintenance and expansion) totaled $210.1 million for the nine-month period ended September 30, 2019 in comparison to $165.2 million in the same period of 2018. See also “—Capital Expenditure Commitments.”
(xii) Effects of Corporate Taxes on Our Income
We are subject to a variety of taxes on our results of operations. The following table shows the income tax rates in effect for 2019 in each of the countries in which we operate:
| Tax Rate (%) | |||||
| Argentina(1) | 30 | ||||
| Brazil(2) | 34 | ||||
| Uruguay | 25 | ||||
____________
(1) During 2017, the Argentine Government introduced changes in the income tax law. Under the new law, the income tax rate will be reduced to 30% for the years 2018 and 2019, and to 25% from 2020 onwards. A new tax on dividends has been introduced with a rate of 7% for the years 2018 and 2019, and 13% from 2020 onwards.
(2) Including the Social Contribution on Net Profit (CSLL)
Critical Accounting Policies and Estimates
The Company’s critical accounting policies and estimates are consistent with those described in Note 33 to the Audited Consolidated Financial Statements included in our Form 20-F, except for the adoption of IFRS 16. (See Note 29 of our Interim Financial Statements as of September 30, 2019).
Operating Segments
IFRS 8 “Operating Segments” requires an entity to report financial and descriptive information about its reportable segments, which are operating segments or aggregations of operating segments that meet the specified criteria. Operating segments are components of an entity about which separate financial information is available that is evaluated regularly by the chief operating decision maker (“CODM”) in deciding how to allocate resources and in assessing performance. The CODM evaluates the business based on the differences in the nature of its operations, products and services. The amount reported for each segment item is the measure reported to the CODM for these purposes.
The Company operates in three major lines of business, namely, Farming; Sugar, Ethanol and Energy; and Land Transformation.
•The Company’s ‘Farming’ business is comprised of four reportable segments:
▪The Company’s ‘Crops’ segment consists of planting, harvesting and sale of grains, oilseeds and fibers (including wheat, corn, soybeans, peanut, cotton and sunflowers, among others), and to a lesser extent the provision of grain warehousing/conditioning, handling and drying services to third parties and the purchase and sale of crops produced by third parties. Each underlying crop in this segment does not represent a separate operating segment. Management seeks to maximize the use of the land through the cultivation of one or more type of crops. Types and surface amount of crops cultivated may vary from harvest year to harvest year depending on several factors, some of them out of the Group´s control. Management is focused on the long-term performance of the productive land, and to that extent, the performance is assessed considering the aggregated combination, if any, of crops planted in the land. A single manager is responsible for the management of operating activity of all crops rather than for each individual crop.
▪The Company’s ‘Rice’ segment consists of planting, harvesting, processing and marketing of rice;
▪The Company’s ‘Dairy’ segment consists of the production and sale of milk;
6
▪The Company’s ‘All other segments’ segment consists of the aggregation of the remaining non-reportable operating segments, which do not meet the quantitative thresholds for disclosure and for which the Group’s management does not consider them to be of continuing significance, namely, Coffee and Cattle.
•The Company’s ‘Sugar, Ethanol and Energy’ segment consists of cultivating sugarcane which is processed in owned sugar mills, transformed into ethanol, sugar and electricity and marketed;
•The Company’s ‘Land Transformation’ segment comprises the (i) identification and acquisition of underdeveloped and undermanaged farmland businesses; and (ii) realization of value through the strategic disposition of assets (generating profits).
•The Company’s ‘Corporate’ segment comprises certain other activities of a holding function nature not allocable to the segments
In order to evaluate the economic performance of businesses on a monthly basis, results of operations are based on monthly data that have been adjusted for inflation and converted into the average exchange rate of the US dollar each month in Argentine subsidiaries. These already converted figures are subsequently not readjusted and reconverted. It should be noted that this translation methodology for evaluating segment information is the same that the company uses to translate results of operation from its other subsidiaries from other countries that have not been designated hyperinflationary economies because it allows for a more accurate analysis of the economic performance of its business as a whole.
The following table presents selected financial and operating data solely for the periods indicated below as it is used for our discussion of results of operations. In respect of production data only as of September 30, 2019 and 2018, we have not yet completed the 2018/2019 harvest year crops and 2017/2018 respectively. The harvested tons presented correspond to the harvest completed as of September 30, 2019 and September 30, 2018.
| Nine-month period ended September 30, | |||||||||||||||||
| 2019 (Unaudited) | 2018 (Unaudited) | Change (%) | |||||||||||||||
| (In thousands of $) | |||||||||||||||||
| Sales | |||||||||||||||||
| Farming Business | 247,236 | 193,921 | 27.5 | % | |||||||||||||
| Crops | 124,582 | 97,490 | 27.8 | % | |||||||||||||
| Soybean (1) | 40,571 | 70,209 | (42.2) | % | |||||||||||||
| Corn (2) | 54,491 | 30,367 | 79.4 | % | |||||||||||||
| Wheat (3) | 13,477 | 7,483 | 80.1 | % | |||||||||||||
| Peanut | 17,213 | 922 | 1,766.9 | % | |||||||||||||
| Sunflower | 5,687 | 1,454 | 291.1 | % | |||||||||||||
| Other crops(4) | 2,599 | 4,881 | (46.8) | % | |||||||||||||
| Adjustments(5) | (9,456) | (17,826) | (47.0) | % | |||||||||||||
| Rice(6) | 71,513 | 78,160 | (8.5) | % | |||||||||||||
| Dairy (7) | 49,082 | 17,462 | 181.1 | % | |||||||||||||
| All other segments (8) | 2,059 | 809 | 154.5 | % | |||||||||||||
| Sugar, Ethanol and Energy Business | 360,677 | 356,309 | 1.2 | % | |||||||||||||
| Sugar | 67,530 | 95,407 | (29.2) | % | |||||||||||||
| Ethanol | 245,720 | 216,049 | 13.7 | % | |||||||||||||
| Energy | 46,985 | 44,769 | 4.9 | % | |||||||||||||
| Other (9) | 442 | 84 | 426.2 | % | |||||||||||||
| Total | 607,913 | 550,230 | 10.5 | % | |||||||||||||
| Land Transformation (10) | 1,354 | 36,227 | (96.3) | % | |||||||||||||
7
| 2018/2019 | 2017/2018 | ||||||||||
| Harvest Year (11) (Unaudited) | Harvest Year (11) (Unaudited) | Chg (%) | |||||||||
| Production | |||||||||||
| Farming Business | |||||||||||
| Crops (tons)(12) | 649,585 | 532,338 | 22.0 | % | |||||||
| Soybean (tons) | 187,042 | 171,844 | 8.8 | % | |||||||
| Corn (tons) (2) | 294,290 | 256,249 | 14.8 | % | |||||||
| Wheat (tons) (3) | 114,129 | 78,640 | 45.1 | % | |||||||
| Peanut (tons) | 47,785 | 19,901 | 140.1 | % | |||||||
| Sunflower (tons) | 5,937 | 5,181 | 14.6 | % | |||||||
| Cotton Lint (tons) | 402 | 523 | (23.1) | % | |||||||
| Rice (13) (tons) | 239,223 | 276,693 | (13.5) | % | |||||||
| Nine-month period ended September 30, | |||||||||||||||||
| 2019 (Unaudited) | 2018 (Unaudited) | Chg (%) | |||||||||||||||
| Processed rice (14) (tons) | 221,162 | 217,362 | 1.7 | % | |||||||||||||
| Dairy (15) (thousand liters) | 87,082 | 73,452 | 18.6 | % | |||||||||||||
| Processed milk (16) (thousand liters) | 102,382 | — | N/A | ||||||||||||||
| Sugar, Ethanol and Energy Business | |||||||||||||||||
| Sugar (tons) | 198,549 | 282,474 | (29.7) | % | |||||||||||||
| Ethanol (cubic meters) | 604,185 | 504,116 | 19.9 | % | |||||||||||||
| Energy (MWh) | 675,660 | 554,211 | 21.9 | % | |||||||||||||
| Land Transformation Business (hectares traded) | 6,080 | 9,300 | (34.6) | % | |||||||||||||
| 2018/2019 | 2017/2018 | |||||||||||||
| Harvest Year (Unaudited) | Harvest Year (Unaudited) | Chg (%) | ||||||||||||
| (Hectares) | ||||||||||||||
| Planted Area | ||||||||||||||
| Farming Business (17) | ||||||||||||||
| Crops | 191,320 | 195,928 | (2.4) | % | ||||||||||
| Soybean | 73,309 | 81,269 | (9.8) | % | ||||||||||
| Corn (2) | 47,167 | 56,740 | (16.9) | % | ||||||||||
| Wheat (3) | 40,210 | 36,533 | 10.1 | % | ||||||||||
| Peanut | 15,479 | 9,375 | 65.1 | % | ||||||||||
| Sunflower | 3,825 | 2,869 | 33.3 | % | ||||||||||
| Cotton | 5,316 | 3,132 | 69.7 | % | ||||||||||
| Forage | 6,014 | 6,010 | 0.1 | % | ||||||||||
| Rice | 40,417 | 40,289 | 0.3 | % | ||||||||||
| Total Planted Area | 231,737 | 236,217 | (1.9) | % | ||||||||||
| Second Harvest Area | 32,221 | 35,948 | (10.4) | % | ||||||||||
| Leased Area | 86,132 | 72,115 | 19.4 | % | ||||||||||
| Owned Croppable Area (18) | 107,370 | 122,144 | (12.1) | % | ||||||||||
8
| 2019 | 2018 | Chg (%) | |||||||||
| Sugar, Ethanol and Energy Business | |||||||||||
| Sugarcane plantation | 164,687 | 151,597 | 8.6 | % | |||||||
| Owned land | 8,748 | 9,145 | (4.3) | % | |||||||
| Leased land | 155,939 | 142,452 | 9.5 | % | |||||||
(1) Includes soybean, soybean oil and soybean meal.
(2) Includes sorghum and chia.
(3) Includes barley, rye, oats and chickpea.
(4) Includes seeds and farming services.
(5) Accumulated adjustment of Hyperinflation accounting translation for our Crops segment sales.
(6) Sales of processed rice including rough rice purchased from third parties and processed in our own facilities, rice seeds and services.
(7) Includes sales of energy from our biodigester, which produces biogas from effluents of our cows.
(8) All other segments include our cattle business which primarily consists of leasing land to a third party based on the price of beef. See “Item 4. Information on the Company—B. Business Overview—Cattle Business.” in our Form 20-F.
(9) Includes operating leases and other services.
(10) Represents capital gain from the sale of land.
(11) The table reflects the production in respect of harvest years as of September 30.
(12) Crop production does not include 193,358 tons and 128,151 tons of forage produced as of September 30, in the 2018/2019 and 2017/2018 harvest years, respectively.
(13) Expressed in tons of rough rice produced on owned and leased farms. The rough rice we produce, along with additional rough rice we purchase from third parties, is ultimately processed and constitutes the product sold in respect of the rice business.
(14) Includes rough rice purchased from third parties and processed in our own facilities. Expressed in tons of rough rice (1 ton of processed rice is approximately equivalent to 1.6 tons of rough rice).
(15) Raw milk produced at our dairy farms.
(16) Own and third parties raw milk processed in our industral facilities of Morteros and Chivilcoy.
(17) Includes hectares planted in the second harvest.
(18) Does not include potential croppable areas being evaluated for transformation and does not include forage area.
9
Nine-month period ended September 30, 2019 as compared to nine-month period ended September 30, 2018
The following table sets forth certain financial information with respect to our consolidated results of operations for the periods indicated.
| Nine-month period ended September 30, | |||||||||||
| 2019 (Unaudited) | 2018 (Unaudited) | ||||||||||
| (In thousands of $ ) | |||||||||||
| Sales of goods and services rendered | 607,913 | 550,230 | |||||||||
| Cost of goods sold and services rendered | (460,953) | (415,449) | |||||||||
| Initial recognition and Changes in fair value of biological assets and agricultural produce | 59,318 | 12,139 | |||||||||
| Changes in net realizable value of agricultural produce after harvest | 1,245 | 9,552 | |||||||||
Margin on manufacturing and agricultural activities before operating expenses | 207,523 | 156,472 | |||||||||
| General and administrative expenses | (40,487) | (39,312) | |||||||||
| Selling expenses | (70,732) | (61,332) | |||||||||
| Other operating (expense) / income, net | 615 | 107,521 | |||||||||
Profit from operations before financing and taxation | 96,919 | 163,349 | |||||||||
| Finance income | 7,290 | 6,494 | |||||||||
| Finance costs | (170,858) | (242,342) | |||||||||
| Other financial results - Net gain of inflation effects on the monetary items | 62,584 | 50,370 | |||||||||
| Financial results, net | (100,984) | (185,478) | |||||||||
Profit / (Loss) before income tax | (4,065) | (22,129) | |||||||||
| Income tax expense | (5,215) | 3,151 | |||||||||
| Profit for the period / (Loss) | (9,280) | (18,978) | |||||||||
Sales of Goods and Services Rendered
| Nine-month period ended September 30, | Crops | Rice | Dairy | All other segments | Sugar, Ethanol and Energy | Total | |||||||||||||||||||||||||||||
| (In thousands of $) | |||||||||||||||||||||||||||||||||||
| 2019 (Unaudited) | 124,582 | 71,513 | 49,082 | 2,059 | 360,677 | 607,913 | |||||||||||||||||||||||||||||
| 2018 (Unaudited) | 97,490 | 78,160 | 17,462 | 809 | 356,309 | 550,230 | |||||||||||||||||||||||||||||
Sales of goods and services rendered increased 10.5%, from $550.2 million during the nine-month period ended September 30, 2018 to $607.9 million during the same period in 2019, primarily as a result of:
• A $31.6 million increase in our Dairy segment mainly caused by (i) a 43.3% increase in volume of milk sold, measured in liters equivalent, from 61.6 million liters during the nine-month period ended September 30, 2018 to 88.3 million liters during the same period in 2019; and (ii) a 67.7% increase in rough milk selling prices, from $0.31 per liter during the nine-month period ended September 30, 2018 to $0.52 per liter during the same period in 2019, mainly explained by the selling of manufactured production from our new industrial facilities in Morteros and Chivilcoy; and (iii) a negative impact of $6.7 million effect of hyperinflation accounting and translation for our Argentine operations during the nine-month period ended September 30, 2018 compared to a negative impact of $4.9 million during the same period in 2019.
The increase in the volume of processed milk sold is mainly explained by an increase of 18.6% of fluid milk production in our own free-stalls, due to a 19.9% increase in volume of cows herd, from 7,429 average heads during the nine-month period ended September 30, 2018 to 8,906 average heads for the same period in 2019, coupled with 28.4 million liters of third parties fluid milk purchases that were processed in our industrial facilities.
10
•A $27.1 million increase in our Crops segment mainly driven by (i) a 83.4% increase in the volume of corn sold, from 201.3 thousand tons during the nine-month period ended September 30, 2018 to 369.2 thousand tons for the same period in 2019, driven by (a) higher yields, from 4.9 tons per hectare during the nine-month period ended September 30, 2018 to 6.5 tons per hectare during the same period in 2019, (b) an inventory build-up of 69.2 thousand tons during the nine-month period ended September 30, 2018, compared to an inventory build-up of 9.4 thousand tons during the same period in 2019; and (c) by an increase in the volume of corn traded from Uruguay, from 41.8 thousand tons during the nine-month period ended September 30, 2018, compared to 120.0 thousand tons during the same period in 2019, (ii) an increase in volume of peanut sold, from 1.8 thousand tons of non-processed peanut in the nine-month period ended September 30, 2018 to 19.9 thousand tons of industrialized peanut in the same period in 2019 from our new processing facility of Mani del Plata, (iii) a 58.6% increase in the volume of wheat sold, from 43.2 thousand tons during the nine-month period ended September 30, 2018 to 68.5 thousand tons during the same period in 2019, due to higher yields, from 2.2 tons per hectare during the nine-month period ended September 30, 2018 to 2.9 tons per hectare during the same period in 2019; and (iv) a 13.5% increase in wheat selling prices, from $173.6 per ton during the nine-month period ended September 30, 2018 to $197.1 per ton during the same period in 2019; (v) a negative impact of $17.8 million effect of hyperinflation accounting and translation for our Argentine operations during the nine-month period ended September 30, 2018 compared to a negative impact of $9.5 million during the same period in 2019.
This increase was partially offset by (i) a 27.0% decrease in soybean prices, from $319.8 per ton in the nine-month period ended September 30, 2018 to $233.4 per ton in the same period in 2019, mainly explained by lower sales from Uruguay, which has higher prices as no export taxes are charged (ii) a 20.8% decrease in the volume of soybean sold, from 219.5 thousand tons in the nine-month period ended September 30, 2018 to 173.8 thousand tons in the same period in 2019. The decrease in the volume of soybean sold was mainly driven by lower planted area from 81.3 thousand hectares in the nine-month period ended September 30, 2018 to 73.3 thousand hectares for the same period of 2019, coupled with lower inventories carried from 2018, from 29.7 thousand tons by December 2017, to 22.8 thousand tons by December 2018; and (iii) a 2.3% decrease in corn prices, from $151.0 per ton in the nine-month period ended September 30, 2018 to $147.6 per ton in the same period in 2019.
The following table sets forth the breakdown of sales of manufactured products for the periods indicated.
| Nine-month period ended September 30, | |||||||||||||||||||||||||||||||||||||||||||||||||||||
| 2019 | 2018 | Chg % | 2019 | 2018 | Chg % | 2019 | 2018 | Chg % | |||||||||||||||||||||||||||||||||||||||||||||
| (Unaudited) | |||||||||||||||||||||||||||||||||||||||||||||||||||||
| (In millions of $) | (In thousands of tons) | (In $ per ton) | |||||||||||||||||||||||||||||||||||||||||||||||||||
| Soybean | 40.6 | 70.2 | (42.2) | % | 173.8 | 219.5 | (20.8) | % | 233.4 | 319.8 | (27.0) | % | |||||||||||||||||||||||||||||||||||||||||
| Corn (1) | 54.5 | 30.4 | 79.3 | % | 369.2 | 201.3 | 83.4 | % | 147.6 | 151.0 | (2.3) | % | |||||||||||||||||||||||||||||||||||||||||
| Wheat (2) | 13.5 | 7.5 | 80.0 | % | 68.5 | 43.2 | 58.6 | % | 197.1 | 173.6 | 13.5 | % | |||||||||||||||||||||||||||||||||||||||||
| Peanut | 17.2 | 0.9 | 1,811.1 | % | 19.9 | 1.8 | 1,005.6 | % | 864.3 | 500.0 | 72.9 | % | |||||||||||||||||||||||||||||||||||||||||
| Others | 8.3 | 6.3 | 31.7 | % | |||||||||||||||||||||||||||||||||||||||||||||||||
| Adjustments | (9.5) | (17.8) | (46.6) | % | |||||||||||||||||||||||||||||||||||||||||||||||||
Total | 124.6 | 97.5 | 27.8 | % | |||||||||||||||||||||||||||||||||||||||||||||||||
(1) Includes sorghum, popcorn.
(2) Includes barley, oats and chickpea.
• A $4.4 million increase in our Sugar, Ethanol and Energy segment, mainly due to: (i) a 4.0% increase in the volume of sugar and ethanol sold, measured in TRS(*), from 1050.0 thousand tons during the nine-month period ended September 30, 2018 to 1092.0 thousand tons during the same period in 2019; and (ii) a 32.3% higher volume of energy sold due to a 14.2% increase in cogeneration efficiency, from 65.4 KWh per ton during the nine-month period ended September 30, 2018 to 74.7 KWh per ton during the same period in 2019 due to the burning of a stockpile of bagasse that was carried over from 2018 and by the burning of woodchips, coupled with higher commercialization of third parties energy, from 27.6 MWh during the nine-month period ended September 30, 2018 to 107.4 MWh during the same period in 2019.
The increase in volume of sugar and ethanol sold measured in TRS was mainly due to (i) a 5.0% increase in milling, from 8.6 million tons during the nine-month period ended September 30, 2018 to 9.0 million tons during the same period in 2019; and (ii) a 1.4% increase in TRS content of our sugarcane, from 128.7 kilograms per ton of sugarcane during the nine-month period ended September 30, 2018 to 130.5 kilograms per ton of sugarcane during the same
11
period in 2019, mainly explained by the dry weather conditions experienced in Mato Grosso do Sul since March 2019. The increase in milling is explained by higher harvested area, from 90.2 thousand hectares during the nine-month period ended September 30, 2018 to 111.7 thousand hectares during the same period in 2019. The increase in harvested sugarcane was partially offset by lower yields, from 89.8 tons per hectare during the nine-month period ended September 30, 2018 to 77.3 tons per hectare during the same period in 2019, mainly caused by the dry weather experienced.
The increase in volume sold was partially offset by (i) a 4.7% decrease in the price of ethanol, from $509.4 per cubic meter during the nine-month period ended September 30, 2018 to $485.7 per cubic meter during the same period in 2019, and (ii) a 20.6% decrease in the price of energy, from $77.0 per MWh during the nine-month period ended September 30, 2018 to $61.1 per MWh during the same period in 2019.
The following chart sets forth the variables that determine our Sugar and Ethanol sales:
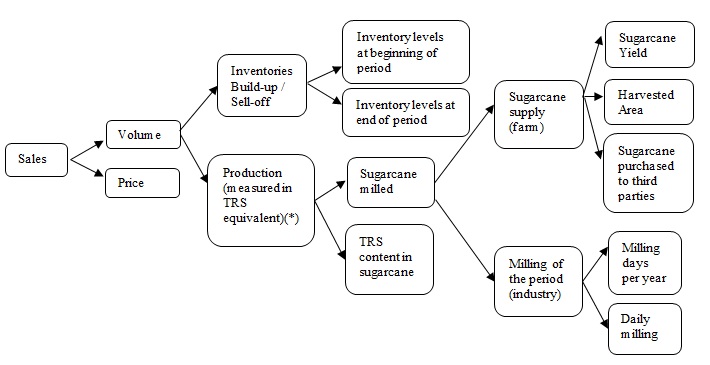
(*) On average, one metric ton of sugarcane contains 140 kilograms of TRS (Total Recoverable Sugar). While a mill can produce either sugar or ethanol, the TRS input requirements differ between these two products. On average, 1.045 kilograms of TRS equivalent are required to produce 1.0 kilogram of sugar, while the amount of TRS required to produce 1 liter of ethanol is 1.691 kilograms.
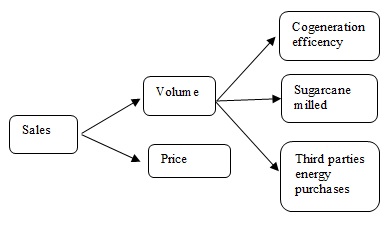
The following chart sets forth the variables that determine our Energy sales:
The following table sets forth the breakdown of sales of manufactured products for the periods indicated.
12
| Nine-month period ended September 30, | |||||||||||||||||||||||||||||||||||||||||||||||||||||
| 2019 | 2018 | Change % | 2019 | 2018 | Change % | 2019 | 2018 | Change % | |||||||||||||||||||||||||||||||||||||||||||||
| (Unaudited) | |||||||||||||||||||||||||||||||||||||||||||||||||||||
| (In millions of $) | (In thousands units) | (In dollars per unit) | |||||||||||||||||||||||||||||||||||||||||||||||||||
| Ethanol (M3) | 245.7 | 216.0 | 13.8 | % | 505.9 | 424.1 | 19.3 | % | 485.7 | 509.4 | (4.7) | % | |||||||||||||||||||||||||||||||||||||||||
| Sugar (tons) | 67.5 | 95.4 | (29.2) | % | 226.4 | 318.3 | (28.9) | % | 298.1 | 299.7 | (0.5) | % | |||||||||||||||||||||||||||||||||||||||||
| Energy (MWh) | 47.0 | 44.8 | 4.9 | % | 769.7 | 581.8 | 32.3 | % | 61.1 | 77.0 | (20.6) | % | |||||||||||||||||||||||||||||||||||||||||
| Others | 0.5 | 0.1 | 400.0 | % | |||||||||||||||||||||||||||||||||||||||||||||||||
Total | 360.7 | 356.3 | 1.2 | % | |||||||||||||||||||||||||||||||||||||||||||||||||
This was partially offset by:
•A $6.6 million decrease in our Rice segment, mainly explained by (i) a reduction in average selling prices from $450.6 per ton during the nine-month period ended September 30, 2018 to $422.0 per ton during the same period in 2019; and (ii) a 41.5% lower sales of By-products, from $25.8 million during the nine-month period ended September 30, 2018, to $15.1 million during the same period in 2019.
This decrease was partially offset by (i) a 3.5% increase in the volume of white rice sold, from 136.8 thousand tons during the nine-month period ended September 30, 2018 to 141.6 thousand tons during the same period in 2019; and (ii) a negative impact of $9.3 million effect of hyperinflation accounting and translation for our Argentine operations during the nine-month period ended September 30, 2018 compared to a negative impact of $3.3 million during the same period in 2019.
Cost of Goods and Services Rendered
| Nine-month period ended September 30, | Crops | Rice | Dairy | All other segments | Sugar, Ethanol and Energy | Total | |||||||||||||||||||||||||||||
| (In thousands of $) | |||||||||||||||||||||||||||||||||||
| 2019 (Unaudited) | (120,631) | (55,905) | (44,762) | (1,727) | (237,928) | (460,953) | |||||||||||||||||||||||||||||
| 2018 (Unaudited) | (97,643) | (63,099) | (16,624) | (532) | (237,551) | (415,449) | |||||||||||||||||||||||||||||
In the case of our agricultural produce sold to third parties (i.e. soybean, corn, wheat and fluid milk), the value of Cost of Goods and Services Rendered is equal to the value of Sales and Services Rendered. The profit of these products is fully recognized under the line items “Initial recognition and changes in fair value of biological assets and agricultural produce” and “Changes in net realizable value of agricultural produce after harvest.” When the agricultural produce is sold to third parties we do not record any additional profit as the gain or loss has already been recognized.
In the case of our manufactured products sold to third parties (i.e. sugar, ethanol, energy, white rice, processed milk and peanut), the profit is recognized when they are sold. The Cost of Goods and Services Rendered of these products includes, among others, the cost of the agricultural produce (i.e. harvested sugarcane and rough rice), which is the raw material used in the industrial process and is transferred internally from the farm to the industry at fair market value.
Cost of manufactured products sold and services rendered increased 11.0%, from $415.4 million during the nine-month
period ended September 30, 2018 to $461.0 million during the same period in 2019. This increase was primarily due to:
•a $28.1 million increase in our Dairy segment, explained by increase in volume of processed milk sold by our new industrial facilities in Morteros and Chivilcoy, compared to null processed milk during the nine-month period ended September 30, 2018, coupled with the effect of hyperinflation accounting and translation for our Argentine operations, from positive impact of $6.4 million effect during the nine-month period ended September 30, 2018 compared to a positive impact of $4.4 million during the same period in 2019.
•a $0.4 million increase in our Sugar, Ethanol and Energy segment, mainly due to a 1.2% increase in Sales of Goods and Services Rendered.
13
Partially offset by:
•a $7.2 million decrease in our Rice segment, mainly due to (i) 14.5% lower unitary cost in dollar terms due to depreciation of the Argentine Peso, coupled with efficiency gains in industrial performance. This was partially offset, (i) by a 3.5% increase in the volume of white rice sold; and (ii) the effect of hyperinflation accounting and translation for our Argentine operations, from positive impact of $2.9 million effect during the nine-month period ended September 30, 2018 compared to a positive impact of $1.5 million during the same period in 2019.
Initial Recognition and Changes in Fair Value of Biological Assets and Agricultural Produce
| Nine-month period ended September 30, | Crops | Rice | Dairy | All other segments | Sugar, Ethanol and Energy | Total | |||||||||||||||||||||||||||||
| (In thousands of $) | |||||||||||||||||||||||||||||||||||
| 2019 (Unaudited) | 22,289 | 13,483 | 9,173 | (512) | 14,885 | 59,318 | |||||||||||||||||||||||||||||
| 2018 (Unaudited) | 17,166 | 6,902 | 3,608 | (686) | (14,851) | 12,139 | |||||||||||||||||||||||||||||
Initial recognition and changes in fair value of biological assets and agricultural produce increased 388.7%, from $12.1
million during the nine-month period ended September 30, 2018 to $59.3 million during the same period in 2019. The increase was mainly due to:
•A $29.7 million increase in our Sugar, Ethanol and Energy segment from a loss of $14.9 million during the nine-month period ended September 30, 2018 (of which $24.0 million were unrealized losses) to a gain of $14.9 million during the same period in 2019 (which includes $10.1 million of unrealized gains). This increase was mainly due to:
- A $34.1 million increase in the recognition at fair value less cost to sell of non-harvested sugarcane, from a loss of $24.0 million during the nine-month period ended September 30, 2018 to a gain of $10.1 million in the same period in 2019, mainly generated by a decrease in projected sugar prices during the nine-month period ended September 30, 2018, compared to an increase in projected sugar prices in the same period in 2019, coupled with increase in sugarcane area.
Partially offset by:
- A $4.4 million decrease in the recognition at fair value less cost to sell of harvested sugarcane, from a gain of $9.2 million during the nine-month period ended September 30, 2018 to a gain of $4.8 million during the same period in 2019 due to the decrease in sugarcane yields.
•A $6.6 million increase in our Rice segment, due to, (i) an increase in the recognition at fair value less cost to sell of harvested rice at the point of harvest, from $13.2 million during the nine-month period ended September 30, 2018 (of which $7.9 million were realized) to $15.4 million during the same period in 2019 (of which $10.3 million were realized), mainly explained by lower costs in dollar terms, due to the Argentine Peso real depreciation during the last year; and (ii) a negative impact of $6.3 million effect of hyperinflation accounting and translation for our Argentine operations during the nine-month period ended September 30, 2018 compared to a negative impact of $2.0 million during the same period in 2019.
•a $5.6 million increase in our Dairy segment, mainly due to the increase in the recognition at fair value less cost to sell of fluid milk, from $3.6 million during the nine-month period ended September 30, 2018 (of which $6.1 million were realized) to $9.2 million during the same period in 2019 (of which $13.0 million were realized), mainly due to:
- A $6.9 million increase in the recognition at fair value less cost to sell of realized production, from $6.1 million during the nine-month period ended September 30, 2018 to $13.0 million in the same period in 2019, mainly due to (i) a 19.9% increase in milking cows, 7,429 average heads during the nine-month period ended September 30, 2018 to 8,906 average heads for the same period in 2019 as we are completing capacity of our third free-stall; and (ii) higher milk selling prices, from 0.31 dollar per liter during the nine-month period ended September 30, 2018 to 0.33 dollar per liter for the same period in 2019.
14
- A negative impact of $2.7 million effect of hyperinflation accounting and translation for our Argentine operations during the nine-month period ended September 30, 2018 compared to a negative impact of $1.0 million during the same period in 2019.
Partially offset by:
- A $3.0 million decrease in the recognition at fair value less cost to sell of unrealized production, from a gain of $0.2 million during the nine-month period ended September 30, 2018 to a loss of $2.8 million in the same period in 2019, mainly due to a 73.7% higher real depreciation of the Argentine Peso during the nine-month period ended September 30, 2018, compared to the same period in 2019, which impacts on the valuation of the cow herd.
•A $5.1 million increase in our Crops segment from $17.2 million during the nine-month period ended September 30, 2018 (of which $17.1 million were realized) to $22.3 million during the same period in 2019 (of which $13.7 million were realized). This increase is primarily due to:
- A negative impact of $10.4 million effect of hyperinflation accounting and translation for our Argentine operations during the nine-month period ended September 30, 2018 compared to a negative impact of $2.3 million during the same period in 2019.
Partially offset by:
- A decrease of $3.4 million in the recognition at fair value less cost to sell of harvested crops at the point of harvest, from $17.1 million in the nine-month period ended September 30, 2018 to $13.7 million in the same period in 2019, mainly due to lower local commodities prices at the moment of harvesting. This decrease was partially offset by (i) higher grain production; (ii) lower production costs in dollar terms, due to the depreciation of the Argentine Peso.
Changes in Net Realizable Value of Agricultural Produce after Harvest
| Nine-month period ended September 30, | Crops | Rice | Dairy | All other segments | Sugar, Ethanol and Energy | Total | |||||||||||||||||||||||||||||
| (In thousands of $) | |||||||||||||||||||||||||||||||||||
| 2019 (Unaudited) | 1,245 | (1) | 4 | — | — | 1,245 | |||||||||||||||||||||||||||||
| 2018 (Unaudited) | 9,552 | — | — | — | — | 9,552 | |||||||||||||||||||||||||||||
Changes in net realizable value of agricultural produce after harvest is mainly composed by: (i) profit or loss from commodity price fluctuations during the period of time the agricultural produce is in inventory, which impacts its fair value; (ii) profit or loss from the valuation of forward contracts related to agricultural produce in inventory; and (iii) profit from direct exports.
Changes in net realizable value of agricultural produce after harvest decreased from a gain of $9.6 million during the
nine-month period ended September 30, 2018 to a loss of $1.2 million during the same period in 2019. This decrease is mainly
explained by the result of the valuation of soybean and corn forward contracts which generated a lower gain due to a increase in prices during the nine-month period ended September 30, 2019, compared to a higher fair value of our crops held in inventories during the same period in 2018.
15
General and Administrative Expenses
| Nine-month period ended September 30, | Crops | Rice | Dairy | All other segments | Sugar, Ethanol and Energy | Corporate | Total | |||||||||||||||||||||||||||||||||||||
| (In thousands of $) | ||||||||||||||||||||||||||||||||||||||||||||
| 2019 (Unaudited) | (3,344) | (4,539) | (2,764) | (107) | (16,845) | (12,888) | (40,487) | |||||||||||||||||||||||||||||||||||||
| 2018 (Unaudited) | (3,072) | (4,384) | (1,168) | (91) | (20,181) | (10,416) | (39,312) | |||||||||||||||||||||||||||||||||||||
Our general and administrative expenses increased 3.0%, from $39.3 million during the nine-month period ended September 30, 2018 to $40.5 million during the same period in 2019. The increase is mainly explained by an increase in depreciation expenses for Crops, Rice and Dairy segments, mainly due to recent investments. This was partially offset by the depreciation of the Argentine Peso and the Brazilian Real.
Selling Expenses
| Nine-month period ended September 30, | Crops | Rice | Dairy | All other segments | Sugar, Ethanol and Energy | Corporate | Total | ||||||||||||||||||||||||||||||||||
| (In thousands of $) | |||||||||||||||||||||||||||||||||||||||||
| 2019 (Unaudited) | (8,057) | (14,260) | (3236) | (143) | (44,963) | (73) | (70,732) | ||||||||||||||||||||||||||||||||||
| 2018 (Unaudited) | (3,501) | (9,939) | (309) | (54) | (47,456) | (73) | (61,332) | ||||||||||||||||||||||||||||||||||
Selling expenses increased 15.3%, from $61.3 million during the nine-month period ended September 30, 2018 to $70.7 million during the same period in 2019. This increase is explained by:
•a $4.6 million increase in our Crops segment, mainly due to export taxes paid from export sales of peanut during the nine-month period ended in September 30, 2019 compared to null exports taxes of peanut during the same period of 2018, coupled with the effect of hyperinflation accounting and translation for our Argentine operations, from positive impact of $1.0 million effect during the nine-month period ended September 30, 2018 compared to a positive impact of $0.7 million during the same period in 2019.
•a $4.3 million increase in the Rice segment, due to the increase in white rice sales by 3.5%, coupled with a higher mix of sales destined to export market which has higher selling expenses due to export taxes in Argentina since September 2018, coupled with the effect of hyperinflation accounting and translation for our Argentine operations, from positive impact of $3.0 million effect during the nine-month period ended September 30, 2018 compared to a positive impact of $1.5 million during the same period in 2019.
•a $2.9 million increase in the Dairy segment, mainly due to higher exports of powder milk, from 8.3 thousand liters equivalent during the nine-month period ended September 30, 2018 to 15.7 thousand liters equivalent during the same period for 2019.
Other Operating (Expense) /Income, Net
| Nine-month period ended September 30, | Crops | Rice | Dairy | All other segments | Sugar, Ethanol and Energy | Corporate | Land Transformation | Total segment reporting | |||||||||||||||||||||||||||||||||||||||
| (In thousands of $) | |||||||||||||||||||||||||||||||||||||||||||||||
| 2019 (Unaudited) | (3,491) | 222 | (683) | 2,061 | 1,400 | (246) | 1,354 | 615 | |||||||||||||||||||||||||||||||||||||||
| 2018 (Unaudited) | 3,406 | 155 | (889) | 18,457 | 50,225 | (59) | 36,227 | 107,521 | |||||||||||||||||||||||||||||||||||||||
Other operating income decreased from a gain of $107.5 million during the nine-month period ended September 30, 2018 to a gain of $0.6 million during the same period in 2019, primarily due to:
16
•a $48.8 million decrease in our Sugar, Ethanol & Energy segment mainly explained by the mark-to-market effect of our sugar hedge positions. The $50.2 million for the period ended September 30, 2018 is explained by the decrease in prices, which generated a positive effect in our sugar hedge positions.
•a $34.9 million decrease in Land Transformation segment due to $36.2 million for sale of "Rio de Janeiro" and "Conquista" farms, located in Brazil, for a total consideration of $53.0 million for 9,300 croppable hectares, during the nine-month period ended September 30, 2018 to $1.4 million for the sale of "Alto Alegre" farm, located in Brazil, for a total consideration of $16.8 million for 6,080 hectares, during the same period in 2019.
•a $16.4 million decrease in All Other Segments related to lower net gains from the fair value adjustment of Investment property, composed of own farms under lease agreements (i.e. beef cattle farms).
•a $6.9 million decrease in our Crops segment due to the mark-to-market effect of our soybean and corn hedge positions.
Financial Results, Net
Our financial results, net increased from a loss of $185.5 million during the nine-month period ended September 30, 2018 to a loss of $101.0 million during the same period in 2019. This was mainly due to (i) a 46.5% decrease in foreign exchange losses, from a loss of $188.2 million during the nine-month period ended September 30,2018 to a loss of $100.7 million during the same period in 2019, mainly explained by a lower impact on our dollar denominated debt by the 121.8% depreciation of the Argentine Peso during the nine-month period ended September 30, 2018 compared to a 52.9% depreciation of the Argentine Peso during the same period in 2019; and (ii) a positive impact of $62.6 million regarding inflation accounting effect during the nine-month period ended September 2019, compared to a $50.4 million positive effect during the same period in 2018. This was partially offset by; (a) a 21.9% increase of interest expense, from $36.3 million during the nine-month period ended September 30,2018 to $44.3 million during the same period in 2019, mainly explained by higher indebtedness position during the nine-month period ended September 30, 2019; and (b) a $9.4 million increase in lease liabilities due to adoption of IFRS 16 in relation to leases which had previously been classified as ‘operating leases’ under the principles of IAS 17 Leases.
The following table sets forth the breakdown of financial results for the periods indicated.
| Nine-month period ended September 30, | |||||||||||||||||
| 2019 (Unaudited) | 2018 (Unaudited) | % Change | |||||||||||||||
| (In $ thousands) | |||||||||||||||||
| Interest income | 5,198 | 5,780 | (10.1) | % | |||||||||||||
| Interest expense | (44,262) | (36,323) | 21.9 | % | |||||||||||||
| Finance Cost - Related to lease liabilities | (9,417) | — | 100.0 | % | |||||||||||||
| Foreign exchange losses, net | (100,693) | (188,204) | (46.5) | % | |||||||||||||
| Cash flow hedge – transfer from equity | (10,758) | (7,846) | 37.1 | % | |||||||||||||
| Gain / (Loss) from interest rate /foreign exchange rate derivative financial instruments | 1,019 | (5,836) | (117.5) | % | |||||||||||||
| Taxes | (2,878) | (2,081) | 38.3 | % | |||||||||||||
| Other income / (expense) | (1,777) | (1,338) | 32.8 | % | |||||||||||||
| Other financial results - Net gain of inflation effects on the monetary items | 62,584 | 50,370 | 24.2 | % | |||||||||||||
Total Financial Results | (100,984) | (185,478) | (45.6) | % | |||||||||||||
17
Income Tax expense
Current income tax expense totaled a loss of $5.2 million during the nine-month period ended September 30, 2019. For the same period in 2018, we registered an income tax gain of $3.2 million. In 2019, we recorded non-taxable income for $10.5 million, mainly in our Brazilian subsidiaries and effects of the changes in the statutory income tax rate in Argentina for $3.5 million. This effects was partially offset by a loss of $15.0 related to the effects of the application of IAS 29 on Argentina Shareholder's equity.
(Loss)/Profit for the period
As a result of the foregoing, our net income during the nine-month period ended September 30, 2019 increased $9.7 million, from a loss of $19.0 million during the same period in 2018 to a loss of $9.3 million in 2019.
18
LIQUIDITY AND CAPITAL RESOURCES
Our liquidity and capital resources are and will be influenced by a variety of factors, including:
• our ability to generate cash flows from our operations;
• the level of our outstanding indebtedness and the interest that we are obligated to pay on such outstanding indebtedness;
• our capital expenditure requirements, which consist primarily of investments in new farmland, in our operations, in equipment and plant facilities and maintenance costs; and
• our working capital requirements.
Our principal sources of liquidity have traditionally consisted of shareholders’ contributions, short and long term borrowings and proceeds received from the disposition of transformed farmland or subsidiaries.
We believe that our working capital will be sufficient during the next 12 months to meet our liquidity requirements.
Nine-month period ended September 30, 2019 and 2018
The table below reflects our statements of Cash Flow for the nine-month period ended September 30, 2019 and 2018.
| For the nine-month period ended September 30, | |||||||||||
| 2019 | 2018 | ||||||||||
| (Unaudited, in thousands of $) | |||||||||||
| Cash and cash equivalent at the beginning of the period | 273,635 | 269,195 | |||||||||
| Net cash generated from operating activities | 168,694 | 101,424 | |||||||||
| Net cash used in investing activities | (197,997) | (119,878) | |||||||||
| Net cash used from financial activities | (78,130) | (46,790) | |||||||||
| Effect of exchange rate changes on cash and cash equivalent | (20,369) | (23,123) | |||||||||
| Cash and cash equivalent at the end of the period | 145,833 | 180,828 | |||||||||
Operating Activities
Period ended September 30, 2019
Net cash generated by operating activities was 168.7 million for the nine-month period ended September 30, 2019. During this period, we generated a net gain of 9.3 million that included non-cash charges relating primarily to depreciation of fixed assets and right of use asset and amortization for $165.1 million, losses from interest and other expenses, net of $48.8 million, losses from foreign exchange, net of $100.7 million and $10.8 million Cash Flow hedge transfer from Equity. All these effects were partially offset by a gain in initial recognition and changes in fair value of non-harvested biological assets unrealized for $23.6 and a net gain of inflation effects on the monetary items for $62.6 million.
In addition, other changes in operating assets and liability balances resulted in a net decrease in cash of $61.8 million, primarily due to an increase of $20.1 million in trade and other receivables, an increase of $74.5 million in inventories and a decrease of $5.5 million in trade and other payables. All these effects were partially offset by a decrease of $30.8 million in biological assets.
Period ended September 30, 2018
Net cash generated by operating activities was $101.4 million for the nine-month period ended September 30, 2018. During this period, we generated a net gain of $19.0 million that included non-cash charges relating primarily to depreciation and amortization of $112.9 million, losses from interest and other expenses, net of $30.9 million, losses from foreign exchange, net of $188.2 million and $7.8 million Cash Flow hedge transfer from Equity. All these effects were partially offset by a gain from the sale of subsidiaries of $36.2, a gain from derivative financial instruments of $46.1 million, net gain from fair value
19
adjustment of Investment property for $18.5 million and a gain from changes in net realizable value of agricultural produce after harvest unrealized of $11.4.
In addition, other changes in operating assets and liability balances resulted in a net decrease in cash of $64.8 million, primarily due to an increase of $112.7 million in trade and other receivables and an increase of $69.7 million in inventories. All these effects were partially offset by a decrease of $51.0 million in derivative financial instruments, a decrease of $37.9 million in biological assets and an increase in trade and other payables of $23.2.
Investing Activities
Period ended September 30, 2019
Net cash used in investing activities totaled 198.0 million in the nine-month period ended September 30, 2019. Capital expenditures totaled 209.6 million, with the following amounts directed as follows: (i) $73.0 million, to the renewal and expansion of our sugarcane plantation and (ii) $136.6 million, mainly driven by the purchase of agricultural and industrial equipment related to the ongoing investment in the expansion of crushing capacity in Ivinhema and the acquisition of two milk processing facilities, two brands from SanCor and one peanut processing facility, partially offset by collections from farm sales of $5.8 million and interest gains of $5.1 million.
Period ended September 30, 2018
Net cash used in investing activities totaled $119.9 million in the nine-month period ended September 30, 2018. Capital expenditures totaled $158.4 million, with the following amounts directed as follows: (i) $70.6 million, to the renewal and expansion of our sugarcane plantation and (ii) $85.4 million, to the construction of our Free stall number 3, which started operating as of August 27, 2018, coupled with the purchase of agricultural and industrial equipment related to the ongoing investment in the expansion of crushing capacity in Ivinhema, partially offset by collections from farm sales of $31.5 million and interest gains of $5.8 million.
Financing Activities
Period ended September 30, 2019
Net cash used in financing activities was 78.1 million in the period ended September 30, 2019, primarily derived from the incurrence of new long and short term borrowings for $12.6 million and $172.4 million, respectively which will be used to finance part of the capital expenditure plan. This effect was primarily offset by net payments of long and short term borrowings in the amounts of $79.8 million and $89.7 million, respectively, and $51.5 million of interest paid.
In December 2019, Adecoagro Vale do Ivinhema placed R$ 400.0 million in Certificados de Recebíveis do Agronegócio (CRA), due in November 2027 and bearing an interest of IPCA (Brazilian official inflation rate) + 3.80% per annum.
Period ended September 30, 2018
Net cash used in financing activities was $46.8 million in the period ended September 30, 2018 , primarily derived from the incurrence of (i) a new $37.2 million long term loan with Rabobank which will be used to finance part of the capital expenditure plan; and (ii) a short term debt of $27.5 million to finance working capital. This effect was primarily offset by net payments of long term borrowings in the amounts of $49.8 million, $43.5 million of interest paid and $15.7 million of shares repurchased.
Cash and Cash Equivalents
Historically, since our cash flows from operations were insufficient to fund our working capital needs and investment plans, we funded our operations with proceeds from short-term and long-term indebtedness and capital contributions from existing and new private investors. In 2011 we obtained $421.8 million from the IPO and the sale of shares in a concurrent private placement (See “Item 4. Information on the Company—A. History and Development of the Company” in our Form 20-F). As of September 30, 2019, our cash and cash equivalents amounted to 145.8 million.
However, we may need additional cash resources in the future to continue our investment plans. Also, we may need additional cash if we experience a change in business conditions or other developments. We also might need additional cash resources in the future if we find and wish to pursue opportunities for investment, acquisitions, strategic alliances or other similar investments. If we ever determine that our cash requirements exceed our amounts of cash and cash equivalents on hand, we might seek to issue debt or additional equity securities or obtain additional credit facilities or realize the disposition of
20
transformed farmland and/or subsidiaries. Any issuance of equity securities could cause dilution for our shareholders. Any incurrence of additional indebtedness could increase our debt service obligations and cause us to become subject to additional restrictive operating and financial covenants, and could require that we pledge collateral to secure those borrowings, if permitted to do so. It is possible that, when we need additional cash resources, financing will not be available to us in amounts or on terms that would be acceptable to us or at all.
We believe we have sufficient liquidity to meet our current working capital requirements for next twelve months.
Projected Sources and Uses of Cash
We anticipate that we will generate cash from the following sources:
• operating cash flow;
• debt financing;
• the dispositions of transformed farmland and/or subsidiaries; and
• debt or equity offerings.
We anticipate that we will use our cash:
• for other working capital purposes;
• to meet our budgeted capital expenditures;
• to make investment in new projects related to our business; and
• to refinance our current debts.
Indebtedness and Financial Instruments
The table below illustrates the maturity of our indebtedness (excluding lease liabilities and obligations under finance leases) and our exposure to fixed and variable interest rates:
| September 30, 2019 | December 31, 2018 | ||||||||||
| (unaudited) | |||||||||||
| Fixed rate: | |||||||||||
| Less than 1 year | 134,650 | 105,708 | |||||||||
| Between 1 and 2 years | 27,528 | 16,287 | |||||||||
| Between 2 and 3 years | 36,912 | 25,704 | |||||||||
| Between 3 and 4 years | 44,679 | 43,507 | |||||||||
| Between 4 and 5 years | 38,776 | 26,415 | |||||||||
| More than 5 years | 505,817 | 505,456 | |||||||||
| 788,362 | 723,077 | ||||||||||
| Variable rate: | |||||||||||
| Less than 1 year | 70,914 | 37,724 | |||||||||
| Between 1 and 2 years | 23,053 | 17,278 | |||||||||
| Between 2 and 3 years | 10,324 | 29,861 | |||||||||
| Between 3 and 4 years | 6,614 | 22,886 | |||||||||
| Between 4 and 5 years | — | 18,251 | |||||||||
| More than 5 years | — | 12,444 | |||||||||
| 110,905 | 138,444 | ||||||||||
| 899,267 | 861,521 | ||||||||||
(1) The Company plans to partially rollover its short term debt using new available lines of credit, or on using operating cash flow to cancel such debt.
21
During 2019 and 2018 the Company was in compliance with all financial covenants.
Short-term Debt.
As of September 30, 2019, our short term debt totaled 205.6 million.
We maintain lines of credit with several banks in order to finance our working capital requirements. We believe that we will continue to be able to obtain additional credit to finance our working capital needs in the future based on our past track record and current market conditions.
Capital Expenditure Commitments
During the nine-month period ended September 30, 2019, our capital expenditures totaled 209.6 million. Our capital expenditures consisted mainly of purchases of property, plant and equipment, mainly related to the renewal and expansion of our sugarcane plantation $73.0 million, $129.6 million related to purchase of agricultural and industrial equipment and $7.0 million related with trademarks and to the peanut processing facility, totaling $209.6 million.
22