Exhibit (c)-(2)
DUFF & PHELPS
Le Gaga
July 30, 2014
Le Gaga Holdings Limited
Fairness Analysis Presented to the Special Committee of Independent Directors
The information contained herein is of a confidential nature and is intended for the use of the persons or firm to whom it is furnished by us.
Reproduction, publication, or dissemination of portions hereof may not be made without prior approval of Duff & Phelps, LLC and its affiliates.
Duff & Phelps Disclaimer
The following pages contain material that is being provided by Duff & Phelps, LLC (“Duff & Phelps”) to the special committee of independent directors (the “Special Committee”) of the board of directors (the “Board of Directors”) of Le Gaga Holdings Limited (“Le Gaga” or the “Company”) in the context of a meeting held to consider a Proposed Transaction (defined herein).
The accompanying material was, and any Opinion (as defined herein) will be, compiled on a confidential basis for the use and benefit of the Special Committee in connection with their evaluation of the Proposed Transaction and may not be distributed to any other party, publicly disclosed, or relied upon for any other purpose without the prior written consent of Duff & Phelps.
Because this material was prepared for use in the context of an oral presentation to the Special Committee, whose members are familiar with the business and affairs of the Company, neither the Company nor Duff & Phelps, nor any of their respective legal or financial advisors or accountants, take any responsibility for the accuracy or completeness of any of the material if used by persons other than the Special Committee.
These materials are not intended to represent an Opinion but rather to serve as discussion materials for the Special Committee and as a summary of the basis upon which Duff & Phelps may render an Opinion.
Any Opinion provided by Duff & Phelps would not: (i) address the merits of the underlying business decision of the Special Committee, the Board of Directors or the Company or any other party to the Proposed Transaction to enter into the Proposed Transaction versus any alternative strategy or transaction; (ii) constitute a recommendation to the Special Committee, the Board of Directors, the Company or any other person as to how such person should vote or as to any other specific action that should be taken in connection with the Proposed Transaction; or (iii) create any fiduciary duty on Duff & Phelps’ part to any party.
The information utilized in preparing this presentation was obtained from the Company and from public sources. Any estimates and projections contained herein have been prepared by the management of the Company and involve numerous and significant subjective determinations, which may or may not prove to be correct. No representation or warranty, expressed or implied, is made as to the accuracy or completeness of such information and nothing contained herein is, or shall be relied upon as, a representation, whether as to the past or the future. Duff & Phelps did not attempt to independently verify such information.
No selected company or selected transaction used in our analysis is directly comparable to the Company or the Proposed Transaction.
CONFIDENTIAL 2 DUFF & PHELPS
Table of Contents
1. Introduction and Transaction Overview
2. Valuation Analysis
Discounted Cash Flow Analysis
Selected Public Companies / M&A Transactions Analysis
3. Valuation Summary
Appendix
1. Assumptions, Qualifications, and Limiting Conditions
2. Premiums Paid Analysis – Supplemental
3. Industry Agnostic Chinese Going-Private Transactions – Supplemental
CONFIDENTIAL 3 DUFF & PHELPS
Section 01 Introduction and Transaction Overview
Introduction and Transaction Overview
The Engagement
Duff & Phelps was retained by the Company to serve as an independent financial advisor to the Special Committee (solely in its capacity as such).
Specifically, Duff & Phelps has been asked to provide an opinion (the “Opinion”) to the Special Committee as to the fairness, from a financial point of view, to the holders of ordinary shares, par value US $0.01 per share, of the Company (individually, a “Share” and collectively, the “Shares”), including Shares represented by American Depositary Shares of the Company, each representing 50 Shares (each, an “ADS” and collectively, “ADSs”), other than the Excluded Shares (as defined below), of the Merger Consideration (as defined below) to be received by such holders in the Proposed Transaction (as defined below) (without giving effect to any impact of the Proposed Transaction on any particular holder of the Shares or ADSs other than in their capacity as holders of Shares or ADSs).
The Proposed Transaction
It is Duff & Phelps’ understanding that the Company, Harvest Parent Limited (“Parent”), an exempted company with limited liability incorporated under the laws of the Cayman Islands and Harvest Merger Limited (“Merger Subsidiary”), an exempted company with limited liability incorporated under the laws of the Cayman Islands and a wholly-owned subsidiary of Parent, propose to enter into an Agreement and Plan of Merger (the “Merger Agreement”), dated as of July 30, 2014. Pursuant to the Merger Agreement, among other things, Merger Subsidiary will merge with and into the Company, whereupon the separate existence of Merger Subsidiary will cease and the Company will be the surviving corporation, and in connection with such merger each issued and outstanding Share, including Shares represented by ADSs, issued and outstanding immediately prior to the effective time of the merger, other than Excluded Shares (as defined below) shall be cancelled in exchange for the right to receive US$0.0812 in cash per Share without interest (the “Per Share Merger Consideration”) and, as each ADS represents fifty (50) Shares, each ADS issued and outstanding immediately prior to the Effective Time, other than ADSs representing Excluded Shares, shall represent the right to receive US$4.06 in cash without interest (the “Per ADS Merger Consideration” and collectively with the Per Share Merger Consideration, the “Merger Consideration”) (collectively, the “Proposed Transaction”).
“Excluded Shares” shall mean, (i) Shares beneficially owned (as determined pursuant to Rule 13d-3 under the Securities Exchange Act of 1934, as amended) by each of Parent, its direct and indirect shareholders and their respective affiliates (including Merger Subsidiary) immediately prior to the effective time of the merger including, for the avoidance of doubt, each Rollover Share (as defined in the Merger Agreement) contributed to Parent by the Rollover Shareholders (as defined in the Merger Agreement) in accordance with the Rollover Agreement (as defined in the Merger Agreement) and each Additional Rollover Share (as defined in the Merger Agreement) (if any) contributed to Parent by any Rollover Shareholders in accordance with the Additional Rollover Agreements (as defined in the Merger Agreement) (if any), and (ii) Shares owned by holders of Shares who have validly exercised and not effectively withdrawn or lost their dissenter’s rights pursuant to Section 238 of the Cayman Islands Companies Law, Cap. 22 (Law 3 of 1961, as consolidated and revised). The terms and conditions of the Merger are more fully set forth in the Merger Agreement.
CONFIDENTIAL 5 DUFF & PHELPS
Introduction and Transaction Overview
Scope of Analysis
In connection with our analysis, Duff & Phelps has made such reviews, analyses and inquiries as we have deemed necessary and appropriate under the circumstances.
1. Reviewed the following documents:
– The Company’s annual reports and audited financial statements on Form 20-F filed with the Securities and Exchange Commission (“SEC”) for the fiscal years ended March 31, 2011 and 2012, the three months ended June 30, 2012 and the fiscal year ended June 30, 2013* ;
– The Company’s unaudited interim financial statements included in the Company’s Form 6-K filed with the SEC for the six months ended December 31, 2013;
– A detailed financial projections model, prepared by and provided to us by management of the Company, upon which we have relied in performing our analysis (the “Management Projections”);
– Certain publicly available business and financial information relating to the Company that we deemed to be relevant;
– A letter dated July 28, 2014 from the management of the Company which made certain representations as to the Management Projections and the underlying assumptions for the Company (the “Management Representation Letter”); and
– (i) the Merger Agreement, (ii) the draft equity commitment letter, substantially in the form of the draft dated June 10, 2014, from Yiheng Capital LLC; (iii) the execution version of facility agreement between Harvest Holdings Limited, Harvest Parent Limited, Harvest Merger Limited and China Minsheng Banking Corp., Ltd., Hong Kong Branch ((ii) and (iii) collectively, the “Financing Commitments”) and (iv) the execution version of Rollover Agreement from the Rollover Shareholders;
2. Discussed the information referred to above and the background and other elements of the Proposed Transaction with the management of the Company;
3. Reviewed the current and historical trading price and trading volume of the Company’s ADSs, and the current and historical market prices and trading volume of the publicly traded securities of certain other companies that we deemed to be relevant;
4. Reviewed the financial terms, to the extent publicly available, of certain comparable acquisition transactions
5. Performed certain valuation and comparative analyses using generally accepted valuation and analytical techniques, including a discounted cash flow analysis, an analysis of selected public companies that Duff & Phelps deemed relevant, an analysis of selected transactions that Duff & Phelps deemed relevant, and an analysis of premiums paid in selected transactions that Duff & Phelps deemed relevant; and
6. Conducted such other analyses and considered such other factors as Duff & Phelps deemed appropriate.
* The Company changed the financial year-end from March 31 to June 30, in 2012.
CONFIDENTIAL 6 DUFF & PHELPS
Introduction and Transaction Overview
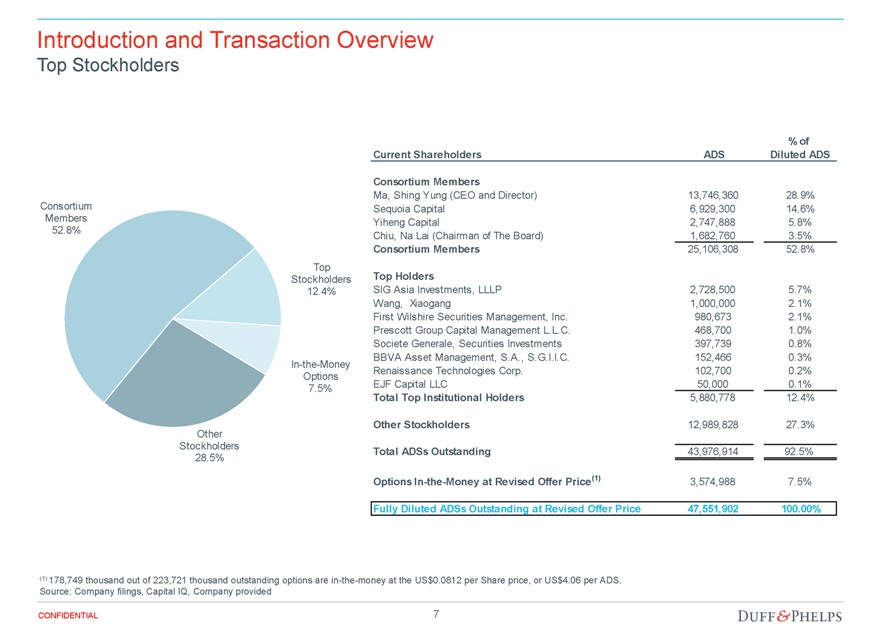
Top Stockholders
Consortium Members
52.8%
Top Stockholders
12.4%
In-the-Money Options
7.5%
Other Stockholders
28.5%
Current Shareholders ADS % of Diluted ADS
Consortium Members
Ma, Shing Yung (CEO and Director) 13,746,360 28.9%
Sequoia Capital 6,929,300 14.6%
Yiheng Capital 2,747,888 5.8%
Chiu, Na Lai (Chairman of The Board) 1,682,760 3.5%
Consortium Members 25,106,308 52.8%
Top Holders
SIG Asia Investments, LLLP 2,728,500 5.7%
Wang, Xiaogang 1,000,000 2.1%
First Wilshire Securities Management, Inc. 980,673 2.1%
Prescott Group Capital Management L.L.C. 468,700 1.0%
Societe Generale, Securities Investments 397,739 0.8%
BBVA Asset Management, S.A., S.G.I.I.C. 152,466 0.3%
Renaissance Technologies Corp. 102,700 0.2%
EJF Capital LLC 50,000 0.1%
Total Top Institutional Holders 5,880,778 12.4%
Other Stockholders 12,989,828 27.3%
Total ADSs Outstanding 43,976,914 92.5%
Options In-the-Money at Revised Offer Price (1) 3,574,988 7.5%
Fully Diluted ADSs Outstanding at Revised Offer Price 47,551,902 100.00%
(1) 178,749 thousand out of 223,721 thousand outstanding options are in-the-money at the US$0.0812 per Share price, or US$4.06 per ADS. Source: Company filings, Capital IQ, Company provided
CONFIDENTIAL 7 DUFF & PHELPS
Introduction and Transaction Overview
Trading Analysis
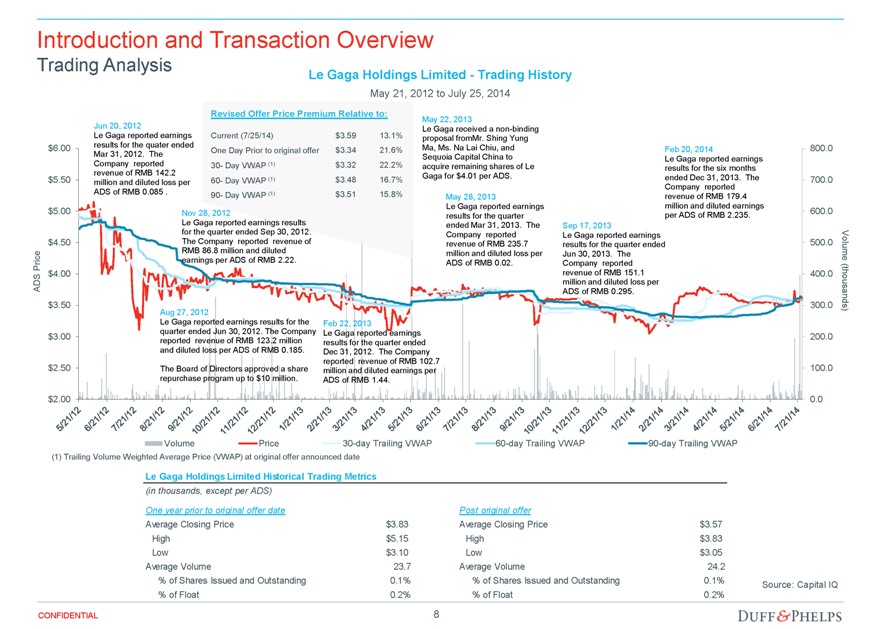
Le Gaga Holdings Limited - Trading History
May 21, 2012 to July 25, 2014
Jun 20, 2012
Le Gaga reported earnings results for the quater ended Mar 31, 2012. The Company reported revenue of RMB 142.2 million and diluted loss per ADS of RMB 0.085 .
Revised Offer Price Premium Relative to:
Current (7/25/14) $3.59 13.1%
One Day Prior to original offer $3.34 21.6%
30- Day VWAP (1) $3.32 22.2%
60- Day VWAP (1) $3.48 16.7%
90- Day VWAP (1) $3.51 15.8%
May 22, 2013
Le Gaga received a non-binding proposal fromMr. Shing Yung Ma, Ms. Na Lai Chiu, and Sequoia Capital China to acquire remaining shares of Le Gaga for $4.01 per ADS.
May 28, 2013
Le Gaga reported earnings results for the quarter ended Mar 31, 2013. The Company reported revenue of RMB 235.7 million and diluted loss per ADS of RMB 0.02.
Sep 17, 2013
Le Gaga reported earnings results for the quarter ended Jun 30, 2013. The Company reported revenue of RMB 151.1 million and diluted loss per ADS of RMB 0.295.
Feb 20, 2014
Le Gaga reported earnings results for the six months ended Dec 31, 2013. The Company reported revenue of RMB 179.4 million and diluted earnings per ADS of RMB 2.235.
Nov 28, 2012
Le Gaga reported earnings results for the quarter ended Sep 30, 2012. The Company reported revenue of RMB 86.8 million and diluted earnings per ADS of RMB 2.22.
Aug 27, 2012
Le Gaga reported earnings results for the quarter ended Jun 30, 2012. The Company reported revenue of RMB 123.2 million and diluted loss per ADS of RMB 0.185.
The Board of Directors approved a share repurchase program up to $10 million.
Feb 22, 2013
Le Gaga reported earnings results for the quarter ended Dec 31, 2012. The Company reported revenue of RMB 102.7 million and diluted earnings per ADS of RMB 1.44.
ADS Price
$6.00
$5.50
$5.00
$4.50
$4.00
$3.50
$3.00
$2.50
$2.00
800.0
700.0
600.0
500.0
400.0
300.0
200.0
100.0
0.0
5/21/12 6/21/12 7/21/12 8/21/12 9/21/12 10/21/12 11/21/12 12/21/12 1/21/13 2/21/13 3/21/13 4/21/13 5/21/13 6/21/13 7/21/13 8/21/13 9/21/13 10/21/13 11/21/13 12/21/13 1/21/14 2/21/14 3/21/14 4/21/14/ 5/21/14 6/21/14 7/21/14
Volume (thousands)
Volume Price 30-day Trailing VWAP 60-day Trailing VWAP 90-day Trailing VWAP
(1) Trailing Volume Weighted Average Price (VWAP) at original offer announced date
Le Gaga Holdings Limited Historical Trading Metrics
(in thousands, except per ADS)
One year prior to original offer date Post original offer
Average Closing Price $3.83 Average Closing Price $3.57
High $5.15 High $3.83
Low $3.10 Low $3.05
Average Volume 23.7 Average Volume 24.2
% of Shares Issued and Outstanding 0.1% % of Shares Issued and Outstanding 0.1%
% of Float 0.2% % of Float 0.2%
Source: Capital IQ
CONFIDENTIAL
8 DUFF & PHELPS
Introduction and Transaction Overview
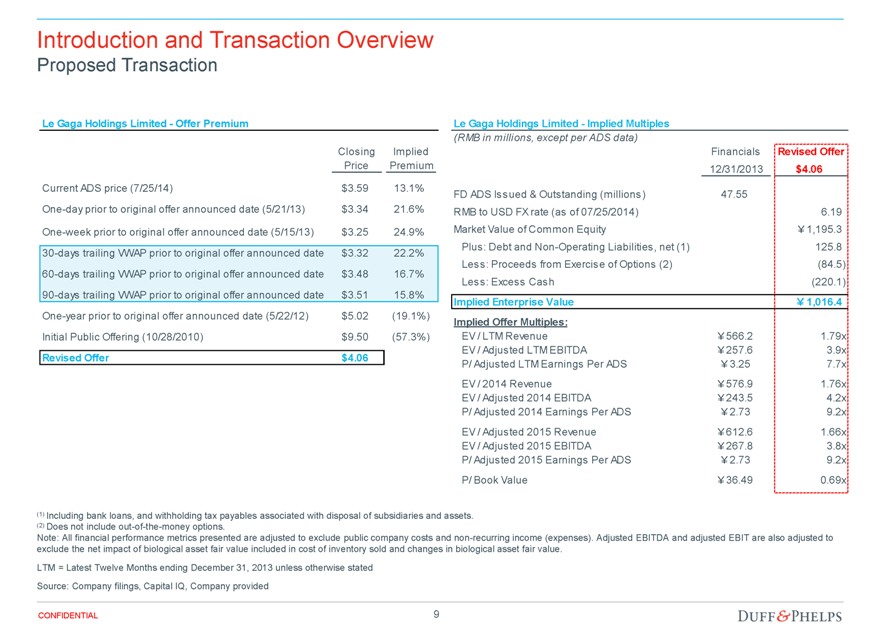
Proposed Transaction
Le Gaga Holdings Limited - Offer Premium
Closing Implied
Price Premium
Current ADS price (7/25/14) $3.59 13.1%
One-day prior to original offer announced date (5/21/13) $3.34 21.6%
One-week prior to original offer announced date (5/15/13) $3.25 24.9%
30-days trailing VWAP prior to original offer announced date $3.32 22.2%
60-days trailing VWAP prior to original offer announced date $3.48 16.7%
90-days trailing VWAP prior to original offer announced date $3.51 15.8%
One-year prior to original offer announced date (5/22/12) $5.02 (19.1%)
Initial Public Offering (10/28/2010) $9.50 (57.3%)
Revised Offer $4.06
Le Gaga Holdings Limited - Implied Multiples
(RMB in millions, except per ADS data)
Financials Revised Offer
12/31/2013 $4.06
FD ADS Issued & Outstanding (millions) 47.55
RMB to USD FX rate (as of 07/25/2014) 6.19
Market Value of Common Equity ¥1,195.3
Plus: Debt and Non-Operating Liabilities, net (1) 125.8
Less: Proceeds from Exercise of Options (2) (84.5)
Less: Excess Cash (220.1)
Implied Enterprise Value ¥1,016.4
Implied Offer Multiples:
EV / LTM Revenue ¥566.2 1.79x
EV / Adjusted LTM EBITDA ¥257.6 3.9x
P/ Adjusted LTM Earnings Per ADS ¥3.25 7.7x
EV / 2014 Revenue ¥576.9 1.76x
EV / Adjusted 2014 EBITDA ¥243.5 4.2x
P/ Adjusted 2014 Earnings Per ADS ¥2.73 9.2x
EV / Adjusted 2015 Revenue ¥612.6 1.66x
EV / Adjusted 2015 EBITDA ¥267.8 3.8x
P/ Adjusted 2015 Earnings Per ADS ¥2.73 9.2x
P/ Book Value ¥36.49 0.69x
(1) Including bank loans, and withholding tax payables associated with disposal of subsidiaries and assets. (2) Does not include out-of-the-money options.
Note: All financial performance metrics presented are adjusted to exclude public company costs and non-recurring income (expenses). Adjusted EBITDA and adjusted EBIT are also adjusted to exclude the net impact of biological asset fair value included in cost of inventory sold and changes in biological asset fair value.
LTM = Latest Twelve Months ending December 31, 2013 unless otherwise stated
Source: Company filings, Capital IQ, Company provided
CONFIDENTIAL 9 DUFF & PHELPS
Introduction and Transaction Overview
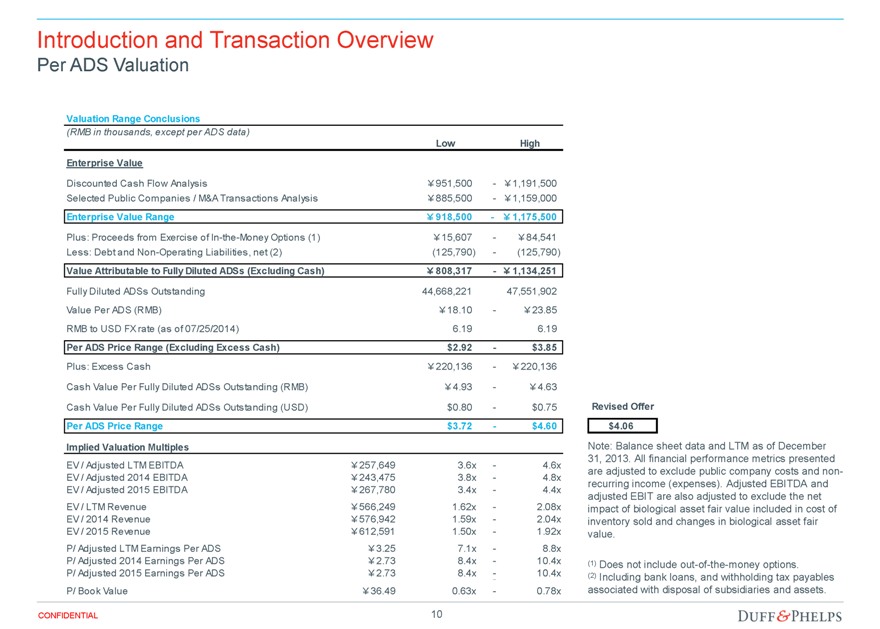
Per ADS Valuation
Valuation Range Conclusions
(RMB in thousands, except per ADS data)
Low High
Enterprise Value
Discounted Cash Flow Analysis ¥951,500 - ¥1,191,500
Selected Public Companies / M&A Transactions Analysis ¥885,500 - ¥1,159,000
Enterprise Value Range ¥918,500 - ¥1,175,500
Plus: Proceeds from Exercise of In-the-Money Options (1) ¥15,607 - ¥84,541
Less: Debt and Non-Operating Liabilities, net (2) (125,790) - (125,790)
Value Attributable to Fully Diluted ADSs (Excluding Cash) ¥808,317 - ¥1,134,251
Fully Diluted ADSs Outstanding 44,668,221 47,551,902
Value Per ADS (RMB) ¥18.10 - ¥23.85
RMB to USD FX rate (as of 07/25/2014) 6.19 6.19
Per ADS Price Range (Excluding Excess Cash) $2.92 - $3.85
Plus: Excess Cash ¥220,136 - ¥220,136
Cash Value Per Fully Diluted ADSs Outstanding (RMB) ¥4.93 - ¥4.63
Cash Value Per Fully Diluted ADSs Outstanding (USD) $0.80 - $0.75
Per ADS Price Range $3.72 - $4.60
Implied Valuation Multiples
EV / Adjusted LTM EBITDA ¥257,649 3.6x - 4.6x
EV / Adjusted 2014 EBITDA ¥243,475 3.8x - 4.8x
EV / Adjusted 2015 EBITDA ¥267,780 3.4x - 4.4x
EV / LTM Revenue ¥566,249 1.62x - 2.08x
EV / 2014 Revenue ¥576,942 1.59x - 2.04x
EV / 2015 Revenue ¥612,591 1.50x - 1.92x
P/ Adjusted LTM Earnings Per ADS ¥3.25 7.1x - 8.8x
P/ Adjusted 2014 Earnings Per ADS ¥2.73 8.4x - 10.4x
P/ Adjusted 2015 Earnings Per ADS ¥2.73 8.4x - 10.4x
P/ Book Value ¥36.49 0.63x - 0.78x
Revised Offer
$4.06
Note: Balance sheet data and LTM as of December 31, 2013. All financial performance metrics presented are adjusted to exclude public company costs and non-recurring income (expenses). Adjusted EBITDA and adjusted EBIT are also adjusted to exclude the net impact of biological asset fair value included in cost of inventory sold and changes in biological asset fair value.
(1) Does not include out-of-the-money options.
(2) Including bank loans, and withholding tax payables associated with disposal of subsidiaries and assets.
CONFIDENTIAL
10 DUFF & PHELPS
Introduction and Transaction Overview
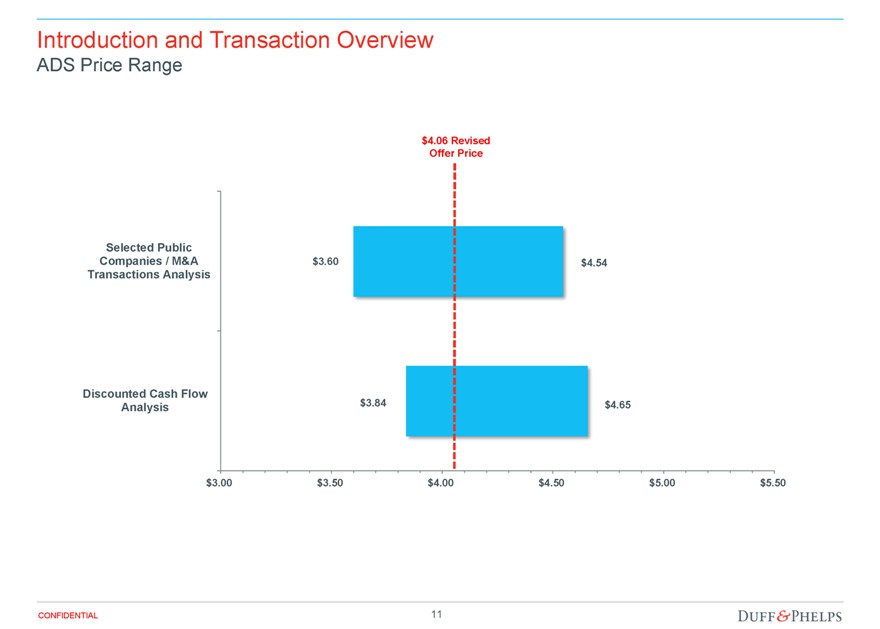
ADS Price Range
$4.06 Revised Offer Price
Selected Public Companies / M&A
Transactions Analysis
Discounted Cash Flow Analysis
$3.60 $4.54
$3.84 $4.65
$3.00 $3.50 $4.00 $4.50 $5.00 $5.50
CONFIDENTIAL
11 DUFF & PHELPS
Section 02 Valuation Analysis
Valuation Analysis
Discounted Cash Flow Analysis - Methodology and Key Assumptions
Discounted Cash Flow Methodology
Duff & Phelps performed a discounted cash flow analysis of the projected unlevered free cash flows.
Unlevered free cash flow is defined as cash generated by the business that is available to either reinvest or to distribute to security holders.
Projected free cash flows are discounted to the present using a discount rate which reflects their relative risk.
The discount rate is equivalent to the rate of return that security holders could expect to realize on alternative investment opportunities with similar risk profiles.
Projected free cash flows are converted at each period from RMB to USD based on the forward rates. The cash flows are discounted using a USD-based weighted average cost of capital and converted back into RMB using a current spot exchange rate.
Discounted Cash Flow Key Assumptions
Duff & Phelps used financial projections as provided by the Company’s management for the years ending June 30, 2014-2019 (excluding public company expenses, as provided by Company management) and extrapolated such financial projections for another four years.
Beyond the projection period, Duff & Phelps estimated the “terminal value” using a perpetuity formula.
Duff & Phelps discounted the resulting free cash flows and terminal value using a weighted average cost of capital range of 14.5% to 16.0%, derived from the Capital Asset Pricing Model.
The following is a summary of the Management Projections and extrapolations of such projections utilized in the discounted cash flow analysis:
– The Company’s net revenue is projected to increase at a compound annual growth rate (“CAGR”) of 10.3% over the ten-year period ending 2023.
– Adjusted EBITDA is projected to increase at a CAGR of 10.1% over the ten-year period ending 2023.
– The Company’s average Adjusted EBITDA margin over the 2014-2023 projection period is 43.4%.
– Capital expenditures (“Capex”) are projected to average approximately 37.3% of net revenue over the period from 2014 through 2023.
CONFIDENTIAL
13 DUFF & PHELPS
Valuation Analysis
Financial Performance
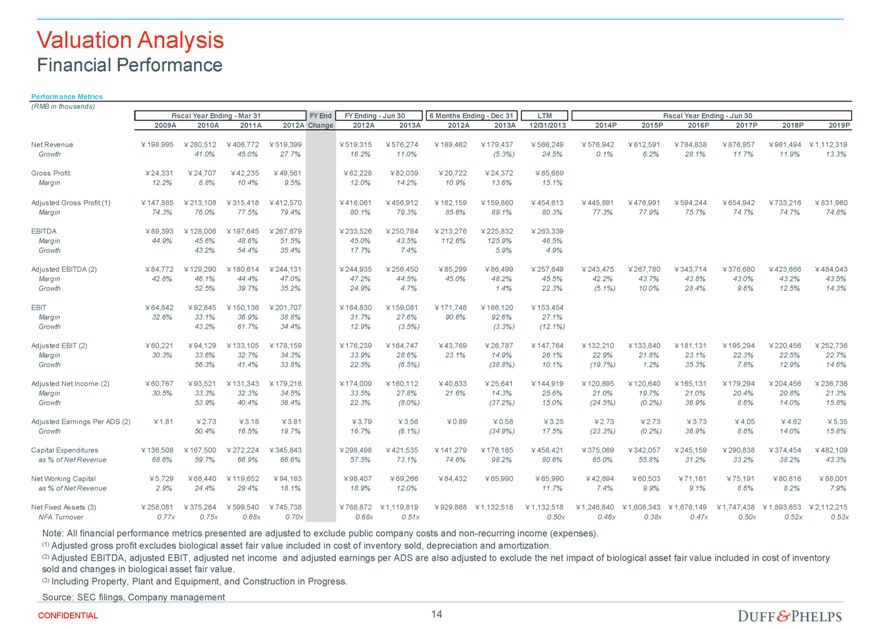
Performance Metrics
(RMB in thousands)
Fiscal Year Ending - Mar 31 FY End FY Ending - Jun 30 6 Months Ending - Dec 31 LTM Fiscal Year Ending - Jun 30
2009A 2010A 2011A 2012A Change 2012A 2013A 2012A 2013A 12/31/2013 2014P 2015P 2016P 2017P 2018P 2019P
Net Revenue ¥198,995 ¥280,512 ¥406,772 ¥519,399 ¥519,315 ¥576,274 ¥189,462 ¥179,437 ¥566,249 ¥576,942 ¥612,591 ¥784,838 ¥876,957 ¥981,494 ¥1,112,319
Growth 41.0% 45.0% 27.7% 16.2% 11.0% (5.3%) 24.5% 0.1% 6.2% 28.1% 11.7% 11.9% 13.3%
Gross Profit ¥24,331 ¥24,707 ¥42,235 ¥49,561 ¥62,228 ¥82,039 ¥20,722 ¥24,372 ¥85,689
Margin 12.2% 8.8% 10.4% 9.5% 12.0% 14.2% 10.9% 13.6% 15.1%
Adjusted Gross Profit (1) ¥147,885 ¥213,108 ¥315,418 ¥412,570 ¥416,061 ¥456,912 ¥162,159 ¥159,860 ¥454,613 ¥445,891 ¥476,991 ¥594,244 ¥654,942 ¥733,216 ¥831,960
Margin 74.3% 76.0% 77.5% 79.4% 80.1% 79.3% 85.6% 89.1% 80.3% 77.3% 77.9% 75.7% 74.7% 74.7% 74.8%
EBITDA ¥89,393 ¥128,006 ¥197,645 ¥267,679 ¥233,526 ¥250,784 ¥213,276 ¥225,832 ¥263,339
Margin 44.9% 45.6% 48.6% 51.5% 45.0% 43.5% 112.6% 125.9% 46.5%
Growth 43.2% 54.4% 35.4% 17.7% 7.4% 5.9% 4.9%
Adjusted EBITDA (2) ¥84,772 ¥129,290 ¥180,614 ¥244,131 ¥244,935 ¥256,450 ¥85,299 ¥86,499 ¥257,649 ¥243,475 ¥267,780 ¥343,714 ¥376,680 ¥423,666 ¥484,043
Margin 42.6% 46.1% 44.4% 47.0% 47.2% 44.5% 45.0% 48.2% 45.5% 42.2% 43.7% 43.8% 43.0% 43.2% 43.5%
Growth 52.5% 39.7% 35.2% 24.9% 4.7% 1.4% 22.3% (5.1%) 10.0% 28.4% 9.6% 12.5% 14.3%
EBIT ¥64,842 ¥92,845 ¥150,136 ¥201,707 ¥164,830 ¥159,081 ¥171,746 ¥166,120 ¥153,454
Margin 32.6% 33.1% 36.9% 38.8% 31.7% 27.6% 90.6% 92.6% 27.1%
Growth 43.2% 61.7% 34.4% 12.9% (3.5%) (3.3%) (12.1%)
Adjusted EBIT (2) ¥60,221 ¥94,129 ¥133,105 ¥178,159 ¥176,239 ¥164,747 ¥43,769 ¥26,787 ¥147,764 ¥132,210 ¥133,840 ¥181,131 ¥195,294 ¥220,456 ¥252,736
Margin 30.3% 33.6% 32.7% 34.3% 33.9% 28.6% 23.1% 14.9% 26.1% 22.9% 21.8% 23.1% 22.3% 22.5% 22.7%
Growth 56.3% 41.4% 33.8% 22.5% (6.5%) (38.8%) 10.1% (19.7%) 1.2% 35.3% 7.8% 12.9% 14.6%
Adjusted Net Income (2) ¥60,767 ¥93,521 ¥131,343 ¥179,216 ¥174,009 ¥160,112 ¥40,833 ¥25,641 ¥144,919 ¥120,895 ¥120,640 ¥165,131 ¥179,294 ¥204,456 ¥236,736
Margin 30.5% 33.3% 32.3% 34.5% 33.5% 27.8% 21.6% 14.3% 25.6% 21.0% 19.7% 21.0% 20.4% 20.8% 21.3%
Growth 53.9% 40.4% 36.4% 22.3% (8.0%) (37.2%) 15.0% (24.5%) (0.2%) 36.9% 8.6% 14.0% 15.8%
Adjusted Earnings Per ADS (2) ¥1.81 ¥2.73 ¥3.18 ¥3.81 ¥3.79 ¥3.56 ¥0.89 ¥0.58 ¥3.25 ¥2.73 ¥2.73 ¥3.73 ¥4.05 ¥4.62 ¥5.35
Growth 50.4% 16.5% 19.7% 16.7% (6.1%) (34.9%) 17.5% (23.3%) (0.2%) 36.9% 8.6% 14.0% 15.8%
Capital Expenditures ¥136,508 ¥167,500 ¥272,224 ¥345,843 ¥298,498 ¥421,535 ¥141,279 ¥176,165 ¥456,421 ¥375,069 ¥342,057 ¥245,159 ¥290,838 ¥374,454 ¥482,109
as % of Net Revenue 68.6% 59.7% 66.9% 66.6% 57.5% 73.1% 74.6% 98.2% 80.6% 65.0% 55.8% 31.2% 33.2% 38.2% 43.3%
Net Working Capital ¥5,729 ¥68,440 ¥119,652 ¥94,183 ¥98,407 ¥69,266 ¥84,432 ¥65,990 ¥65,990 ¥42,894 ¥60,503 ¥71,161 ¥75,191 ¥80,816 ¥88,001
as % of Net Revenue 2.9% 24.4% 29.4% 18.1% 18.9% 12.0% 11.7% 7.4% 9.9% 9.1% 8.6% 8.2% 7.9%
Net Fixed Assets (3) ¥258,081 ¥375,264 ¥599,540 ¥745,738 ¥768,872 ¥1,119,819 ¥929,868 ¥1,132,518 ¥1,132,518 ¥1,246,840 ¥1,608,343 ¥1,676,149 ¥1,747,438 ¥1,893,653 ¥2,112,215
NFA Turnover 0.77x 0.75x 0.68x 0.70x 0.68x 0.51x 0.50x 0.46x 0.38x 0.47x 0.50x 0.52x 0.53x
Note: All financial performance metrics presented are adjusted to exclude public company costs and non-recurring income (expenses). (1) Adjusted gross profit excludes biological asset fair value included in cost of inventory sold, depreciation and amortization.
(2) Adjusted EBITDA, adjusted EBIT, adjusted net income and adjusted earnings per ADS are also adjusted to exclude the net impact of biological asset fair value included in cost of inventory sold and changes in biological asset fair value.
(3) Including Property, Plant and Equipment, and Construction in Progress. Source: SEC filings, Company management
CONFIDENTIAL
14 DUFF & PHELPS
Valuation Analysis
DCF Valuation Summary
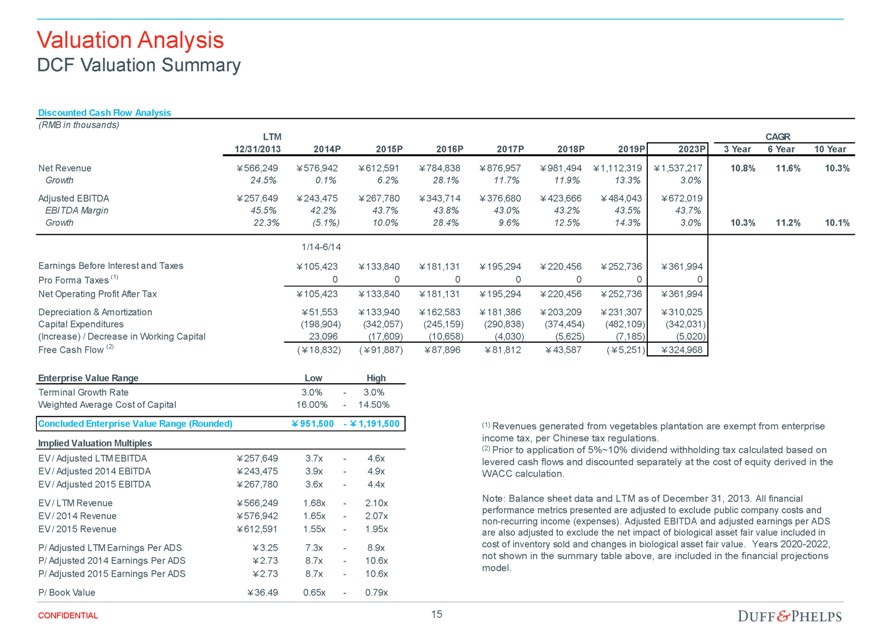
Discounted Cash Flow Analysis
(RMB in thousands)
LTM CAGR
12/31/2013 2014P 2015P 2016P 2017P 2018P 2019P 2023P 3 Year 6 Year 10 Year
Net Revenue ¥566,249 ¥576,942 ¥612,591 ¥784,838 ¥876,957 ¥981,494 ¥1,112,319 ¥1,537,217 10.8% 11.6% 10.3%
Growth 24.5% 0.1% 6.2% 28.1% 11.7% 11.9% 13.3% 3.0%
Adjusted EBITDA ¥257,649 ¥243,475 ¥267,780 ¥343,714 ¥376,680 ¥423,666 ¥484,043 ¥672,019
EBITDA Margin 45.5% 42.2% 43.7% 43.8% 43.0% 43.2% 43.5% 43.7%
Growth 22.3% (5.1%) 10.0% 28.4% 9.6% 12.5% 14.3% 3.0% 10.3% 11.2% 10.1%
1/14-6/14
Earnings Before Interest and Taxes ¥105,423 ¥133,840 ¥181,131 ¥195,294 ¥220,456 ¥252,736 ¥361,994
Pro Forma Taxes (1) 0 0 0 0 0 0 0
Net Operating Profit After Tax ¥105,423 ¥133,840 ¥181,131 ¥195,294 ¥220,456 ¥252,736 ¥361,994
Depreciation & Amortization ¥51,553 ¥133,940 ¥162,583 ¥181,386 ¥203,209 ¥231,307 ¥310,025
Capital Expenditures (198,904) (342,057) (245,159) (290,838) (374,454) (482,109) (342,031)
(Increase) / Decrease in Working Capital 23,096 (17,609) (10,658) (4,030) (5,625) (7,185) (5,020)
Free Cash Flow (2) (¥18,832) (¥91,887) ¥87,896 ¥81,812 ¥43,587 (¥5,251) ¥324,968
Enterprise Value Range Low High
Terminal Growth Rate 3.0% - 3.0%
Weighted Average Cost of Capital 16.00% - 14.50%
Concluded Enterprise Value Range (Rounded) ¥951,500 - ¥1,191,500
Implied Valuation Multiples
EV / Adjusted LTM EBITDA ¥257,649 3.7x - 4.6x
EV / Adjusted 2014 EBITDA ¥243,475 3.9x - 4.9x
EV / Adjusted 2015 EBITDA ¥267,780 3.6x - 4.4x
EV / LTM Revenue ¥566,249 1.68x - 2.10x
EV / 2014 Revenue ¥576,942 1.65x - 2.07x
EV / 2015 Revenue ¥612,591 1.55x - 1.95x
P/ Adjusted LTM Earnings Per ADS ¥3.25 7.3x - 8.9x
P/ Adjusted 2014 Earnings Per ADS ¥2.73 8.7x - 10.6x
P/ Adjusted 2015 Earnings Per ADS ¥2.73 8.7x - 10.6x
P/ Book Value ¥36.49 0.65x - 0.79x
(1) Revenues generated from vegetables plantation are exempt from enterprise income tax, per Chinese tax regulations.
(2) Prior to application of 5%~10% dividend withholding tax calculated based on levered cash flows and discounted separately at the cost of equity derived in the WACC calculation.
Note: Balance sheet data and LTM as of December 31, 2013. All financial performance metrics presented are adjusted to exclude public company costs and non-recurring income (expenses). Adjusted EBITDA and adjusted earnings per ADS are also adjusted to exclude the net impact of biological asset fair value included in cost of inventory sold and changes in biological asset fair value. Years 2020-2022, not shown in the summary table above, are included in the financial projections model.
CONFIDENTIAL 15 DUFF & PHELPS
Valuation Analysis
Selected Public Companies / M&A Transactions Analysis Methodology
Selected Public Companies Analysis
Duff & Phelps reviewed the current trading multiples of 11 publicly traded companies that we determined to be relevant to our analysis.
These companies operate in the global Agricultural Products industry.
Duff & Phelps analyzed the LTM and projected revenue, EBITDA, EBITDA Less Capex, EBIT and EPS for each of the selected publicly traded companies.
Selected M&A Transactions Analysis
Duff & Phelps selected merger and acquisition transactions involving target companies that Duff & Phelps determined to be relevant to its analysis. Duff & Phelps computed the LTM EBITDA and LTM Revenue for each of the target companies (where publicly disclosed). Duff & Phelps then calculated, for each transaction, the ratios of the implied enterprise value to the target’s respective revenue and EBITDA.
Duff & Phelps selected 11 precedent transactions within the China Agricultural / Food Products industry.
Duff & Phelps analyzed a number of factors in comparing the Company to the selected public companies and the targets in the selected M&A transactions, including historical and forecasted growth in revenue and profits, profit margins and other characteristics that we deemed relevant.
Rather than applying the average or median multiple from the public company set, Duff & Phelps selected multiples that reflect the Company’s size, growth outlook, capital requirements, profit margins, revenue mix, and other characteristics relative to the group.
Based on our review of publicly available information, none of the companies utilized for comparative purposes in the following analysis are directly comparable to the Company, and none of the transactions utilized for comparative purposes in the following analysis are directly comparable to the Proposed Transaction. Duff & Phelps does not have access to nonpublic information of any of the companies used for comparative purposes. Accordingly, a complete valuation analysis of the Company and the Proposed Transaction cannot rely solely upon a quantitative review of the selected companies and selected transactions, and involves complex considerations and judgments concerning differences in financial and operating characteristics of such companies and targets, as well as other factors that could affect their value relative to that of the Company. Therefore, the Selected Public Companies / Selected M&A Transactions Analysis are subject to certain limitations.
CONFIDENTIAL 16 DUFF & PHELPS
Valuation Analysis
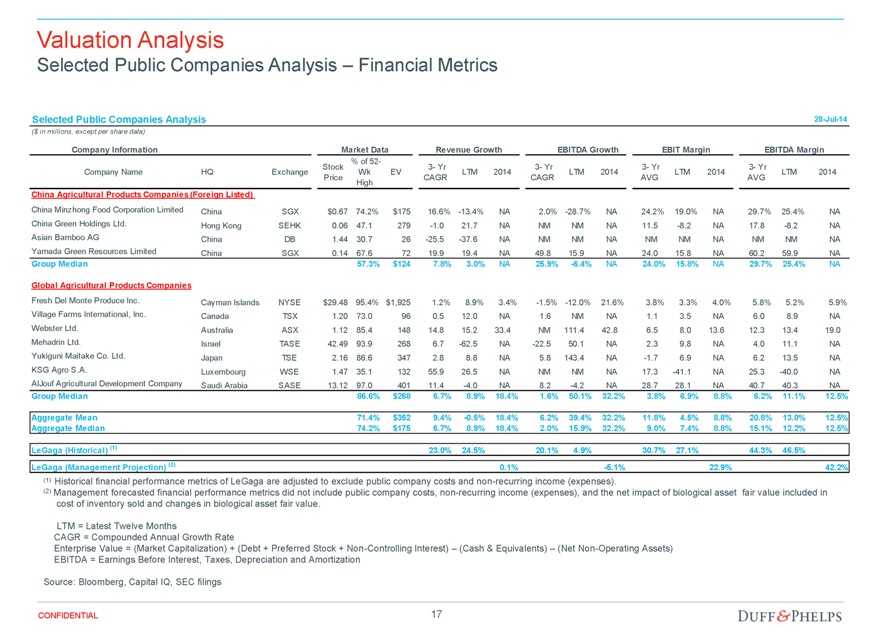
Selected Public Companies Analysis – Financial Metrics
Selected Public Companies Analysis 28-Jul-14
($ in millions, except per share data)
Company Information Market Data Revenue Growth EBITDA Growth EBIT Margin EBITDA Margin
Company Name HQ Exchange Stock Price % of 52- Wk High EV 3- Yr CAGR LTM 2014 3- Yr CAGR LTM 2014 3- Yr AVG LTM 2014 3- Yr AVG LTM 2014
China Agricultural Products Companies (Foreign Listed)
China Minzhong Food Corporation Limited China SGX $0.67 74.2% $175 16.6% -13.4% NA 2.0% -28.7% NA 24.2% 19.0% NA 29.7% 25.4% NA
China Green Holdings Ltd. Hong Kong SEHK 0.06 47.1 279 -1.0 21.7 NA NM NM NA 11.5 -8.2 NA 17.8 -8.2 NA
Asian Bamboo AG China DB 1.44 30.7 26 -25.5 -37.6 NA NM NM NA NM NM NA NM NM NA
Yamada Green Resources Limited China SGX 0.14 67.6 72 19.9 19.4 NA 49.8 15.9 NA 24.0 15.8 NA 60.2 59.9 NA
Group Median 57.3% $124 7.8% 3.0% NA 25.9% -6.4% NA 24.0% 15.8% NA 29.7% 25.4% NA
Global Agricultural Products Companies
Fresh Del Monte Produce Inc. Cayman Islands NYSE $29.48 95.4% $1,925 1.2% 8.9% 3.4% -1.5% -12.0% 21.6% 3.8% 3.3% 4.0% 5.8% 5.2% 5.9%
Village Farms International, Inc. Canada TSX 1.20 73.0 96 0.5 12.0 NA 1.6 NM NA 1.1 3.5 NA 6.0 8.9 NA
Webster Ltd. Australia ASX 1.12 85.4 148 14.8 15.2 33.4 NM 111.4 42.8 6.5 8.0 13.6 12.3 13.4 19.0
Mehadrin Ltd. Israel TASE 42.49 93.9 268 6.7 -62.5 NA -22.5 50.1 NA 2.3 9.8 NA 4.0 11.1 NA
Yukiguni Maitake Co. Ltd. Japan TSE 2.16 86.6 347 2.8 8.8 NA 5.8 143.4 NA -1.7 6.9 NA 6.2 13.5 NA
KSG Agro S.A. Luxembourg WSE 1.47 35.1 132 55.9 26.5 NA NM NM NA 17.3 -41.1 NA 25.3 -40.0 NA
AlJouf Agricultural Development Company Saudi Arabia SASE 13.12 97.0 401 11.4 -4.0 NA 8.2 -4.2 NA 28.7 28.1 NA 40.7 40.3 NA
Group Median 86.6% $268 6.7% 8.9% 18.4% 1.6% 50.1% 32.2% 3.8% 6.9% 8.8% 6.2% 11.1% 12.5%
Aggregate Mean 71.4% $352 9.4% -0.5% 18.4% 6.2% 39.4% 32.2% 11.8% 4.5% 8.8% 20.8% 13.0% 12.5%
Aggregate Median 74.2% $175 6.7% 8.9% 18.4% 2.0% 15.9% 32.2% 9.0% 7.4% 8.8% 15.1% 12.2% 12.5%
LeGaga (Historical) (1) 23.0% 24.5% 20.1% 4.9% 30.7% 27.1% 44.3% 46.5%
LeGaga (Management Projection) (2) 0.1% -5.1% 22.9% 42.2%
(1) Historical financial performance metrics of LeGaga are adjusted to exclude public company costs and non-recurring income (expenses).
(2) Management forecasted financial performance metrics did not include public company costs, non-recurring income (expenses), and the net impact of biological asset fair value included in cost of inventory sold and changes in biological asset fair value.
LTM = Latest Twelve Months
CAGR = Compounded Annual Growth Rate Enterprise Value = (Market Capitalization) + (Debt + Preferred Stock + Non-Controlling Interest) – (Cash & Equivalents) – (Net Non-Operating Assets)
EBITDA = Earnings Before Interest, Taxes, Depreciation and Amortization
Source: Bloomberg, Capital IQ, SEC filings
CONFIDENTIAL 17 DUFF & PHELPS
Valuation Analysis
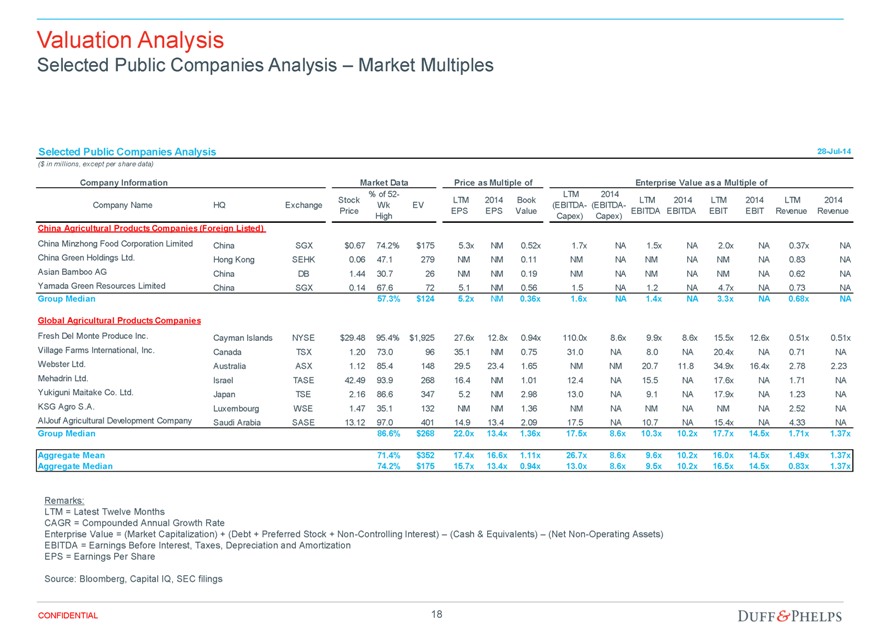
Selected Public Companies Analysis – Market Multiples
Selected Public Companies Analysis 28-Jul-14
($ in millions, except per share data)
Company Information Market Data Price as Multiple of Enterprise Value as a Multiple of
Company Name HQ Exchange Stock Price % of 52- Wk High EV LTM EPS 2014 EPS Book Value LTM (EBITDA-Capex) 2014 (EBITDA-Capex) LTM EBITDA 2014 EBITDA LTM EBIT 2014 EBIT LTM Revenue 2014 Revenue
China Agricultural Products Companies (Foreign Listed)
China Minzhong Food Corporation Limited China SGX $0.67 74.2% $175 5.3x NM 0.52x 1.7x NA 1.5x NA 2.0x NA 0.37x NA
China Green Holdings Ltd. Hong Kong SEHK 0.06 47.1 279 NM NM 0.11 NM NA NM NA NM NA 0.83 NA
Asian Bamboo AG China DB 1.44 30.7 26 NM NM 0.19 NM NA NM NA NM NA 0.62 NA
Yamada Green Resources Limited China SGX 0.14 67.6 72 5.1 NM 0.56 1.5 NA 1.2 NA 4.7x NA 0.73 NA
Group Median 57.3% $124 5.2x NM 0.36x 1.6x NA 1.4x NA 3.3x NA 0.68x NA
Global Agricultural Products Companies
Fresh Del Monte Produce Inc. Cayman Islands NYSE $29.48 95.4% $1,925 27.6x 12.8x 0.94x 110.0x 8.6x 9.9x 8.6x 15.5x 12.6x 0.51x 0.51x
Village Farms International, Inc. Canada TSX 1.20 73.0 96 35.1 NM 0.75 31.0 NA 8.0 NA 20.4x NA 0.71 NA
Webster Ltd. Australia ASX 1.12 85.4 148 29.5 23.4 1.65 NM NM 20.7 11.8 34.9x 16.4x 2.78 2.23
Mehadrin Ltd. Israel TASE 42.49 93.9 268 16.4 NM 1.01 12.4 NA 15.5 NA 17.6x NA 1.71 NA
Yukiguni Maitake Co. Ltd. Japan TSE 2.16 86.6 347 5.2 NM 2.98 13.0 NA 9.1 NA 17.9x NA 1.23 NA
KSG Agro S.A. Luxembourg WSE 1.47 35.1 132 NM NM 1.36 NM NA NM NA NM NA 2.52 NA
AlJouf Agricultural Development Company Saudi Arabia SASE 13.12 97.0 401 14.9 13.4 2.09 17.5 NA 10.7 NA 15.4x NA 4.33 NA
Group Median 86.6% $268 22.0x 13.4x 1.36x 17.5x 8.6x 10.3x 10.2x 17.7x 14.5x 1.71x 1.37x
Aggregate Mean 71.4% $352 17.4x 16.6x 1.11x 26.7x 8.6x 9.6x 10.2x 16.0x 14.5x 1.49x 1.37x
Aggregate Median 74.2% $175 15.7x 13.4x 0.94x 13.0x 8.6x 9.5x 10.2x 16.5x 14.5x 0.83x 1.37x
Remarks:
LTM = Latest Twelve Months
CAGR = Compounded Annual Growth Rate
Enterprise Value = (Market Capitalization) + (Debt + Preferred Stock + Non-Controlling Interest) – (Cash & Equivalents) – (Net Non-Operating Assets) EBITDA = Earnings Before Interest, Taxes, Depreciation and Amortization EPS = Earnings Per Share
Source: Bloomberg, Capital IQ, SEC filings
CONFIDENTIAL 18 DUFF & PHELPS
Valuation Analysis
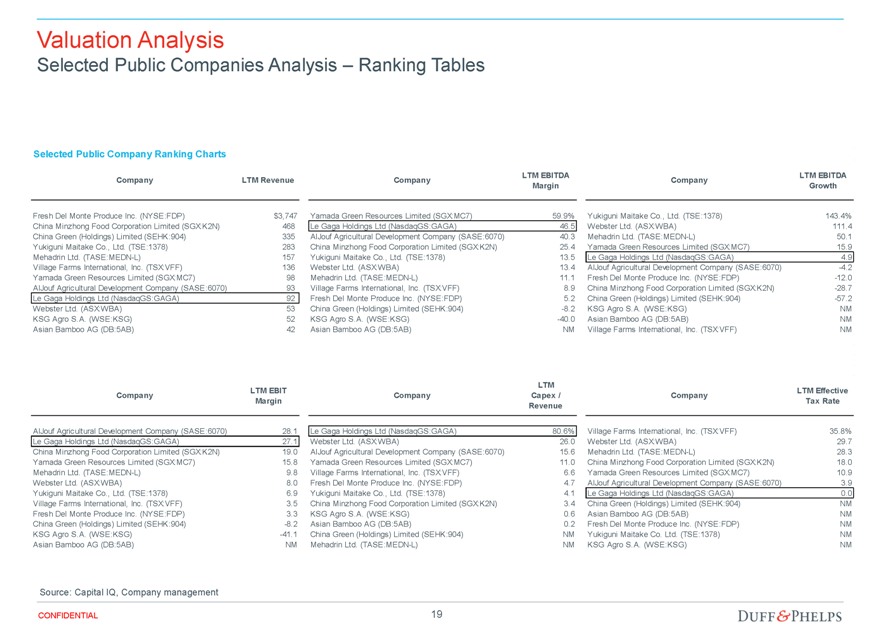
Selected Public Companies Analysis – Ranking Tables
Selected Public Company Ranking Charts
Company LTM Revenue
Fresh Del Monte Produce Inc. (NYSE:FDP) $3,747
China Minzhong Food Corporation Limited (SGX:K2N) 468
China Green (Holdings) Limited (SEHK:904) 335
Yukiguni Maitake Co., Ltd. (TSE:1378) 283
Mehadrin Ltd. (TASE:MEDN-L) 157
Village Farms International, Inc. (TSX:VFF) 136
Yamada Green Resources Limited (SGX:MC7) 98
AlJouf Agricultural Development Company (SASE:6070) 93
Le Gaga Holdings Ltd (NasdaqGS:GAGA) 92
Webster Ltd. (ASX:WBA) 53
KSG Agro S.A. (WSE:KSG) 52
Asian Bamboo AG (DB:5AB) 42
Company LTM EBITDA Margin
Yamada Green Resources Limited (SGX:MC7) 59.9%
Le Gaga Holdings Ltd (NasdaqGS:GAGA) 46.5
AlJouf Agricultural Development Company (SASE:6070) 40.3
China Minzhong Food Corporation Limited (SGX:K2N) 25.4
Yukiguni Maitake Co., Ltd. (TSE:1378) 13.5
Webster Ltd. (ASX:WBA) 13.4
Mehadrin Ltd. (TASE:MEDN-L) 11.1
Village Farms International, Inc. (TSX:VFF) 8.9
Fresh Del Monte Produce Inc. (NYSE:FDP) 5.2
China Green (Holdings) Limited (SEHK:904) -8.2
KSG Agro S.A. (WSE:KSG) -40.0
Asian Bamboo AG (DB:5AB) NM
Company LTM EBITDA Growth
Yukiguni Maitake Co., Ltd. (TSE:1378) 143.4%
Webster Ltd. (ASX:WBA) 111.4
Mehadrin Ltd. (TASE:MEDN-L) 50.1
Yamada Green Resources Limited (SGX:MC7) 15.9
Le Gaga Holdings Ltd (NasdaqGS:GAGA) 4.9
AlJouf Agricultural Development Company (SASE:6070) -4.2
Fresh Del Monte Produce Inc. (NYSE:FDP) -12.0
China Minzhong Food Corporation Limited (SGX:K2N) -28.7
China Green (Holdings) Limited (SEHK:904) -57.2
KSG Agro S.A. (WSE:KSG) NM
Asian Bamboo AG (DB:5AB) NM
Village Farms International, Inc. (TSX:VFF) NM
Company LTM EBIT Margin
AlJouf Agricultural Development Company (SASE:6070) 28.1
Le Gaga Holdings Ltd (NasdaqGS:GAGA) 27.1
China Minzhong Food Corporation Limited (SGX:K2N) 19.0
Yamada Green Resources Limited (SGX:MC7) 15.8
Mehadrin Ltd. (TASE:MEDN-L) 9.8
Webster Ltd. (ASX:WBA) 8.0
Yukiguni Maitake Co., Ltd. (TSE:1378) 6.9
Village Farms International, Inc. (TSX:VFF) 3.5
Fresh Del Monte Produce Inc. (NYSE:FDP) 3.3
China Green (Holdings) Limited (SEHK:904) -8.2
KSG Agro S.A. (WSE:KSG) -41.1
Asian Bamboo AG (DB:5AB) NM
Company LTM Capex / Revenue
Le Gaga Holdings Ltd (NasdaqGS:GAGA) 80.6%
Webster Ltd. (ASX:WBA) 26.0
AlJouf Agricultural Development Company (SASE:6070) 15.6
Yamada Green Resources Limited (SGX:MC7) 11.0
Village Farms International, Inc. (TSX:VFF) 6.6
Fresh Del Monte Produce Inc. (NYSE:FDP) 4.7
Yukiguni Maitake Co., Ltd. (TSE:1378) 4.1
China Minzhong Food Corporation Limited (SGX:K2N) 3.4
KSG Agro S.A. (WSE:KSG) 0.6
Asian Bamboo AG (DB:5AB) 0.2
China Green (Holdings) Limited (SEHK:904) NM
Mehadrin Ltd. (TASE:MEDN-L) NM
Company LTM Effective Tax Rate
Village Farms International, Inc. (TSX:VFF) 35.8%
Webster Ltd. (ASX:WBA) 29.7
Mehadrin Ltd. (TASE:MEDN-L) 28.3
China Minzhong Food Corporation Limited (SGX:K2N) 18.0
Yamada Green Resources Limited (SGX:MC7) 10.9
AlJouf Agricultural Development Company (SASE:6070) 3.9
Le Gaga Holdings Ltd (NasdaqGS:GAGA) 0.0
China Green (Holdings) Limited (SEHK:904) NM
Asian Bamboo AG (DB:5AB) NM
Fresh Del Monte Produce Inc. (NYSE:FDP) NM
Yukiguni Maitake Co. Ltd. (TSE:1378) NM
KSG Agro S.A. (WSE:KSG) NM
Source: Capital IQ, Company management
CONFIDENTIAL 19 DUFF & PHELPS
Valuation Analysis
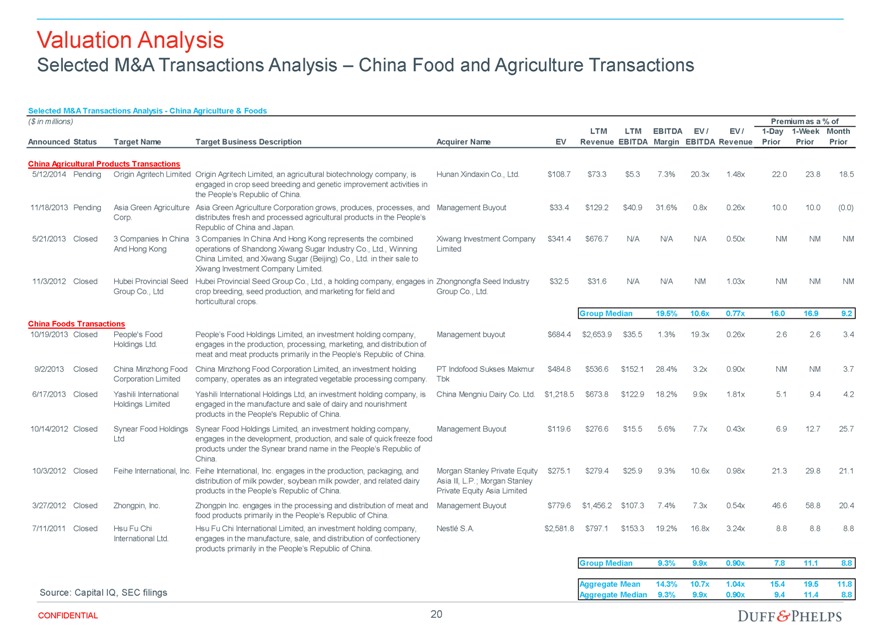
Selected M&A Transactions Analysis – China Food and Agriculture Transactions
Selected M&A Transactions Analysis - China Agriculture & Foods
($ in millions)
Announced Status Target Name Target Business Description Acquirer Name EV LTM Revenue LTM EBITDA EBITDA Margin EV / EBITDA EV / Revenue Premium as a % of 1-Day Prior 1-Week Prior Month Prior
China Agricultural Products Transactions
5/12/2014 Pending Origin Agritech Limited Origin Agritech Limited, an agricultural biotechnology company, is engaged in crop seed breeding and genetic improvement activities in the People’s Republic of China. Hunan Xindaxin Co., Ltd. $108.7 $73.3 $5.3 7.3% 20.3x 1.48x 22.0 23.8 18.5
11/18/2013 Pending Asia Green Agriculture Corp. Asia Green Agriculture Corporation grows, produces, processes, and distributes fresh and processed agricultural products in the People’s Republic of China and Japan. Management Buyout $33.4 $129.2 $40.9 31.6% 0.8x 0.26x 10.0 10.0 (0.0)
5/21/2013 Closed 3 Companies In China And Hong Kong 3 Companies In China And Hong Kong represents the combined operations of Shandong Xiwang Sugar Industry Co., Ltd., Winning China Limited, and Xiwang Sugar (Beijing) Co., Ltd. in their sale to Xiwang Investment Company Limited. Xiwang Investment Company Limited $341.4 $676.7 N/A N/A N/A 0.50x NM NM NM
11/3/2012 Closed Hubei Provincial Seed Group Co., Ltd Hubei Provincial Seed Group Co., Ltd., a holding company, engages in crop breeding, seed production, and marketing for field and horticultural crops. Zhongnongfa Seed Industry Group Co., Ltd. $32.5 $31.6 N/A N/A NM 1.03x NM NM NM
Group Median 19.5% 10.6x 0.77x 16.0 16.9 9.2
China Foods Transactions
10/19/2013 Closed People’s Food Holdings Ltd. People’s Food Holdings Limited, an investment holding company, engages in the production, processing, marketing, and distribution of meat and meat products primarily in the People’s Republic of China. Management buyout $684.4 $2,653.9 $35.5 1.3% 19.3x 0.26x 2.6 2.6 3.4
9/2/2013 Closed China Minzhong Food Corporation Limited China Minzhong Food Corporation Limited, an investment holding company, operates as an integrated vegetable processing company. PT Indofood Sukses Makmur Tbk $484.8 $536.6 $152.1 28.4% 3.2x 0.90x NM NM 3.7
6/17/2013 Closed Yashili International Holdings Limited Yashili International Holdings Ltd, an investment holding company, is engaged in the manufacture and sale of dairy and nourishment products in the People’s Republic of China. China Mengniu Dairy Co. Ltd. $1,218.5 $673.8 $122.9 18.2% 9.9x 1.81x 5.1 9.4 4.2
10/14/2012 Closed Synear Food Holdings Ltd Synear Food Holdings Limited, an investment holding company, engages in the development, production, and sale of quick freeze food products under the Synear brand name in the People’s Republic of China. Management Buyout $119.6 $276.6 $15.5 5.6% 7.7x 0.43x 6.9 12.7 25.7
10/3/2012 Closed Feihe International, Inc. Feihe International, Inc. engages in the production, packaging, and distribution of milk powder, soybean milk powder, and related dairy products in the People’s Republic of China. Morgan Stanley Private Equity Asia III, L.P.; Morgan Stanley Private Equity Asia Limited $275.1 $279.4 $25.9 9.3% 10.6x 0.98x 21.3 29.8 21.1
3/27/2012 Closed Zhongpin, Inc. Zhongpin Inc. engages in the processing and distribution of meat and food products primarily in the People’s Republic of China. Management Buyout $779.6 $1,456.2 $107.3 7.4% 7.3x 0.54x 46.6 58.8 20.4
7/11/2011 Closed Hsu Fu Chi International Ltd. Hsu Fu Chi International Limited, an investment holding company, engages in the manufacture, sale, and distribution of confectionery products primarily in the People’s Republic of China. Nestlé S.A. $2,581.8 $797.1 $153.3 19.2% 16.8x 3.24x 8.8 8.8 8.8
Group Median 9.3% 9.9x 0.90x 7.8 11.1 8.8
Aggregate Mean 14.3% 10.7x 1.04x 15.4 19.5 11.8
Source: Capital IQ, SEC filings Aggregate Median 9.3% 9.9x 0.90x 9.4 11.4 8.8
CONFIDENTIAL 20 DUFF & PHELPS
Valuation Analysis
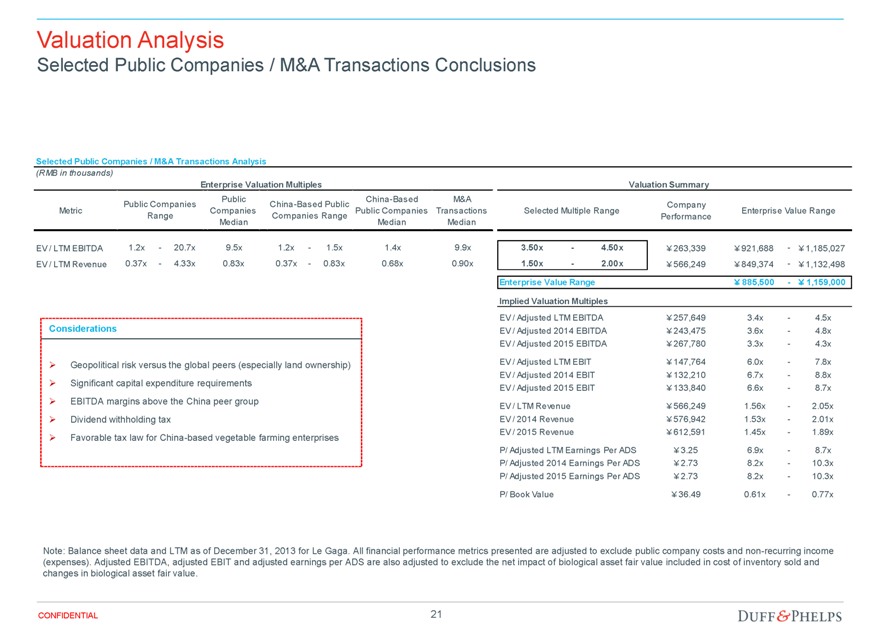
Selected Public Companies / M&A Transactions Conclusions
Selected Public Companies / M&A Transactions Analysis
(RMB in thousands)
Enterprise Valuation Multiples
Metric Public Companies Range Public Companies Median China-Based Public Companies Range China-Based Public Companies Median M&A Transactions Median
EV / LTM EBITDA 1.2x - 20.7x 9.5x 1.2x - 1.5x 1.4x 9.9x
EV / LTM Revenue 0.37x - 4.33x 0.83x 0.37x - 0.83x 0.68x 0.90x
Considerations
Geopolitical risk versus the global peers (especially land ownership)
Significant capital expenditure requirements
EBITDA margins above the China peer group
Dividend withholding tax
Favorable tax law for China-based vegetable farming enterprises
Valuation Summary
Selected Multiple Range Company Performance Enterprise Value Range
3.50x - 4.50x ¥263,339 ¥921,688 - ¥1,185,027
1.50x - 2.00x ¥566,249 ¥849,374 - ¥1,132,498
Enterprise Value Range ¥885,500 - ¥1,159,000
Implied Valuation Multiples
EV / Adjusted LTM EBITDA ¥257,649 3.4x - 4.5x
EV / Adjusted 2014 EBITDA ¥243,475 3.6x - 4.8x
EV / Adjusted 2015 EBITDA ¥267,780 3.3x - 4.3x
EV / Adjusted LTM EBIT ¥147,764 6.0x - 7.8x
EV / Adjusted 2014 EBIT ¥132,210 6.7x - 8.8x
EV / Adjusted 2015 EBIT ¥133,840 6.6x - 8.7x
EV / LTM Revenue ¥566,249 1.56x - 2.05x
EV / 2014 Revenue ¥576,942 1.53x - 2.01x
EV / 2015 Revenue ¥612,591 1.45x - 1.89x
P/ Adjusted LTM Earnings Per ADS ¥3.25 6.9x - 8.7x
P/ Adjusted 2014 Earnings Per ADS ¥2.73 8.2x - 10.3x
P/ Adjusted 2015 Earnings Per ADS ¥2.73 8.2x - 10.3x
P/ Book Value ¥36.49 0.61x - 0.77x
Note: Balance sheet data and LTM as of December 31, 2013 for Le Gaga. All financial performance metrics presented are adjusted to exclude public company costs and non-recurring income (expenses). Adjusted EBITDA, adjusted EBIT and adjusted earnings per ADS are also adjusted to exclude the net impact of biological asset fair value included in cost of inventory sold and changes in biological asset fair value.
CONFIDENTIAL 21 DUFF & PHELPS
Section 03 Valuation Summary
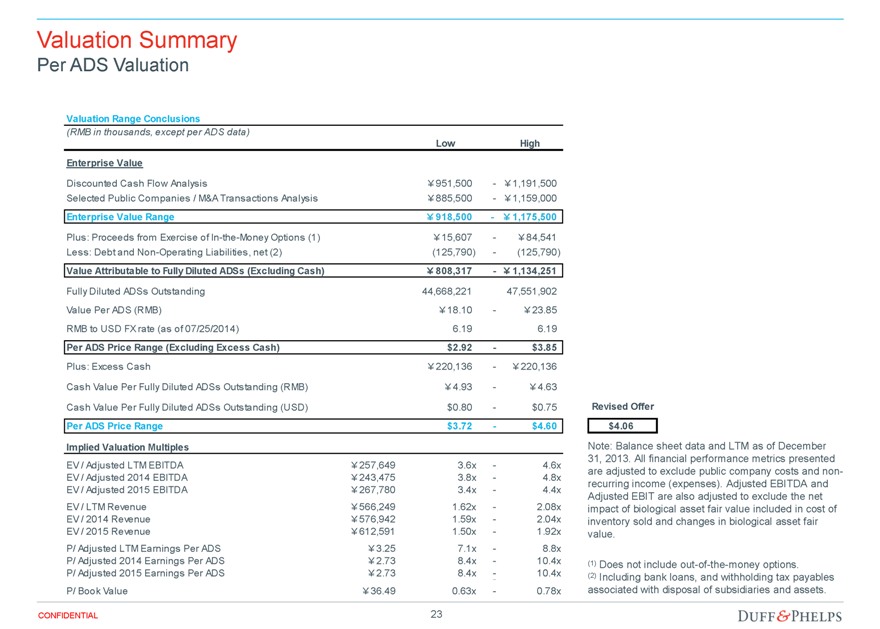
Valuation Summary
Per ADS Valuation
Valuation Range Conclusions
(RMB in thousands, except per ADS data)
Low High
Enterprise Value
Discounted Cash Flow Analysis ¥951,500 - ¥1,191,500
Selected Public Companies / M&A Transactions Analysis ¥885,500 - ¥1,159,000
Enterprise Value Range ¥918,500 - ¥1,175,500
Plus: Proceeds from Exercise of In-the-Money Options (1) ¥15,607 - ¥84,541
Less: Debt and Non-Operating Liabilities, net (2) (125,790) - (125,790)
Value Attributable to Fully Diluted ADSs (Excluding Cash) ¥808,317 - ¥1,134,251
Fully Diluted ADSs Outstanding 44,668,221 47,551,902
Value Per ADS (RMB) ¥18.10 - ¥23.85
RMB to USD FX rate (as of 07/25/2014) 6.19 6.19
Per ADS Price Range (Excluding Excess Cash) $2.92 - $3.85
Plus: Excess Cash ¥220,136 - ¥220,136
Cash Value Per Fully Diluted ADSs Outstanding (RMB) ¥4.93 - ¥4.63
Cash Value Per Fully Diluted ADSs Outstanding (USD) $0.80 - $0.75
Per ADS Price Range $3.72 - $4.60
Implied Valuation Multiples
EV / Adjusted LTM EBITDA ¥257,649 3.6x - 4.6x
EV / Adjusted 2014 EBITDA ¥243,475 3.8x - 4.8x
EV / Adjusted 2015 EBITDA ¥267,780 3.4x - 4.4x
EV / LTM Revenue ¥566,249 1.62x - 2.08x
EV / 2014 Revenue ¥576,942 1.59x - 2.04x
EV / 2015 Revenue ¥612,591 1.50x - 1.92x
P/ Adjusted LTM Earnings Per ADS ¥3.25 7.1x - 8.8x
P/ Adjusted 2014 Earnings Per ADS ¥2.73 8.4x - 10.4x
P/ Adjusted 2015 Earnings Per ADS ¥2.73 8.4x - 10.4x
P/ Book Value ¥36.49 0.63x - 0.78x
Revised Offer
$4.06
Note: Balance sheet data and LTM as of December 31, 2013. All financial performance metrics presented are adjusted to exclude public company costs and non-recurring income (expenses). Adjusted EBITDA and Adjusted EBIT are also adjusted to exclude the net impact of biological asset fair value included in cost of inventory sold and changes in biological asset fair value.
(1) Does not include out-of-the-money options.
(2) Including bank loans, and withholding tax payables associated with disposal of subsidiaries and assets.
CONFIDENTIAL 23 DUFF & PHELPS
Appendix 01 Assumptions, Qualifications, and Limiting Conditions
Assumptions, Qualifications, and Limiting Conditions
If issued, our Opinion letter will include assumptions, qualifications and limiting conditions similar to the following. This is not meant to be a complete list of the assumptions, qualifications and limiting conditions which will be included in our Opinion letter, if rendered.
Assumptions and Reliance – In performing its analyses and rendering this Opinion with respect to the Proposed Transaction, Duff & Phelps, with the Company’s consent:
Relied upon and assumed the accuracy, completeness, and fair presentation of all information, data, advice, opinions and representations obtained from public sources or provided to it from private sources, including Company management, and did not independently verify such information;
Relied upon the fact that the Special Committee, the Board of Directors and the Company have been advised by counsel as to all legal matters with respect to the Proposed Transaction, including whether all procedures required by law to be taken in connection with the Proposed Transaction have been duly, validly and timely taken;
Assumed that any estimates, evaluations, forecasts and projections including, without limitation, the Management Projections, furnished to Duff & Phelps were reasonably prepared and based upon the best currently available information and good faith judgment of the person furnishing the same and Duff & Phelps has relied upon such matters in performing its analysis;
Assumed that information supplied and representations made to Duff & Phelps by and on behalf of the Company are substantially accurate;
Assumed that the representations and warranties made by all parties in the Merger Agreement and the Management Representation Letter are true and correct and that each party will fully and timely perform all covenants and agreements required to be performed by such party;
Assumed that the final versions of all documents reviewed by Duff & Phelps in draft form, including the Merger Agreement, conform in all material respects to the drafts reviewed;
Assumed that there has been no material change in the assets, liabilities, financial condition, businesses, results of operations or prospects of the Company since the date of the most recent financial statements and other information made available to Duff & Phelps;
Assumed that all of the conditions required to implement the Proposed Transaction will be satisfied and that the Proposed Transaction will be completed in accordance with the Merger Agreement, without any waiver, amendment or delay of any terms or conditions, including, among other things, that (i) Parent and Merger Subsidiary will obtain financing in accordance with the terms set forth in the Financing Commitments and (ii) the actions contemplated by the Rollover Agreement will be consummated in accordance with its terms; and
Assumed that all governmental, regulatory or other consents and approvals necessary for the consummation of the Proposed Transaction will be obtained without any undue delay, limitation, restriction or condition that would have any material adverse effect on the Company or on any other party to the Proposed Transaction, and without any material adverse effect on the contemplated benefits expected to be derived in the Proposed Transaction.
To the extent that any of the foregoing assumptions or any of the facts on which this Opinion is based prove to be untrue in any material respect, this Opinion cannot and should not be relied upon for any purpose. Furthermore, in Duff & Phelps’ analysis and in connection with the preparation of this Opinion, Duff & Phelps has made numerous assumptions with respect to industry performance, general business, market and economic conditions and other matters, many of which are beyond the control of any party involved in the Proposed Transaction and as to which Duff & Phelps does not express any view or opinion in this Opinion, including as to the reasonableness of such assumptions.
CONFIDENTIAL
25
DUFF & PHELPS
Assumptions, Qualifications, and Limiting Conditions
Qualifications – If issued, our Opinion will be qualified by the following:
Duff & Phelps has prepared this Opinion effective as of the date hereof. This Opinion is necessarily based upon the information made available to Duff & Phelps as of the date hereof and market, economic, financial and other conditions as they exist and can be evaluated as of the date hereof, and Duff & Phelps disclaims any undertaking or obligation to advise any person of any change in any fact or matter affecting this Opinion which may come or be brought to the attention of Duff & Phelps after the date hereof.
Duff & Phelps did not evaluate the Company’s solvency or fair value under any applicable laws relating to bankruptcy, solvency or similar matters or conduct an independent appraisal, evaluation or physical inspection of any assets or liabilities (contingent or otherwise) or properties of the Company and we were not provided with any such appraisal or evaluation. Duff & Phelps has not undertaken any independent analysis of any potential or actual litigation, regulatory action, possible unasserted claims or other contingent liabilities to which the Company is or may be a party or is or may be subject or any governmental investigation of any possible unasserted claims or other contingent liabilities to which the Company is or may be party or is or may be subject.
In connection with this Opinion, to date, Duff & Phelps has not been requested to, and did not, (i) initiate any discussions with, or solicit any indications of interest from, third parties with respect to an acquisition of all or any part of the Company, its assets, businesses or operations, or any alternatives to the Proposed Transaction, (ii) negotiate the terms of the Proposed Transaction (and therefore, Duff & Phelps has assumed that such terms are the most beneficial terms from the Company’s perspective that could, under the circumstances, be negotiated among the parties to the Merger Agreement and the Proposed Transaction), or (iii) advise the Special Committee or any other party with respect to alternatives to the Proposed Transaction.
Duff & Phelps is not expressing any opinion as to the market price or value of the Shares or ADSs (or anything else) after the announcement or the consummation of the Proposed Transaction (or any other time). Duff & Phelps expresses no opinion on any aspect of the Proposed Transaction other than the Per Share Consideration and Per ADS Consideration to be received pursuant to the Merger Agreement as of the date hereof. This Opinion should not be construed as a valuation opinion, a credit rating, a solvency opinion, an analysis of the Company’s credit worthiness, tax advice, or accounting advice. Duff & Phelps has not made, and assumes no responsibility to make, any representation, or render any opinion, as to any legal matter.
In rendering this Opinion, Duff & Phelps is not expressing any opinion with respect to the amount or nature or any other aspect of any compensation payable to or to be received by any of the Company’s officers, directors or employees, or any class of such persons, relative to the Merger Consideration, or with respect to the fairness of any such compensation. In addition, this Opinion does not address the fairness to, or any other consideration of, the holders of any class of securities, creditors or other constituencies of the Company, other than the holders of the Shares or ADSs (excluding the Excluded Shares and ADSs representing Excluded Shares).
CONFIDENTIAL
26
DUFF & PHELPS
Assumptions, Qualifications, and Limiting Conditions
Limiting Conditions – If issued, the use of our Opinion will be strictly limited and will state:
This Opinion is furnished for the use and benefit of the Special Committee in connection with its consideration of the Proposed Transaction and is not intended to, and does not, confer any rights or remedies upon any other person, and is not intended to be used, and may not be used, by any other person or for any other purpose, without Duff & Phelps’ express consent. This Opinion (i) does not address the merits of the underlying business decision to enter into the Proposed Transaction versus any alternative strategy or transaction; (ii) does not address any transaction related to the Proposed Transaction; (iii) is not a recommendation as to how holders of Shares and ADSs should vote or act with respect to any matters relating to the Proposed Transaction, or whether to proceed with the Proposed Transaction or any related transaction, and (iv) does not indicate that the Merger Consideration is the best possibly attainable under any circumstances; instead, it merely states whether the Merger Consideration is within a range suggested by certain financial analyses.
The decision as to whether to proceed with the Proposed Transaction or any related transaction may depend on an assessment of factors unrelated to the financial analysis on which this Opinion is based. This letter should not be construed as creating any fiduciary duty on the part of Duff & Phelps to any party.
This Opinion is solely that of Duff & Phelps, and Duff & Phelps’ liability in connection with this Opinion shall be limited in accordance with the terms set forth in the engagement letter between Duff & Phelps and the Company dated June 6, 2013 (the “Engagement Letter”). This Opinion letter is confidential, and its use and disclosure is strictly limited in accordance with the terms set forth in the Engagement Letter, except that a copy of this Opinion may be included in its entirety in any filing the Company is required to make with the SEC in connection with the Proposed Transaction, if such inclusion is required by applicable law, in which case you may summarize or otherwise reference the existence of the Opinion in such documents, provided that any such summary or reference language shall be subject to prior approval by Duff & Phelps.
Duff & Phelps has acted as financial advisor to the Special Committee (solely in its capacity as such) in connection with the Proposed Transaction. Pursuant to the terms of the Engagement Letter, a substantial portion of Duff & Phelps’ fee in respect of this Opinion is payable upon delivery of the Opinion, however, no portion of Duff & Phelps’ fee is contingent upon either the conclusion expressed in this Opinion or whether or not the Proposed Transaction is successfully consummated. In addition, the Company has agreed to reimburse certain of our expenses (subject to a cap) and indemnify us for certain liabilities arising out of our engagement.
CONFIDENTIAL
27
DUFF & PHELPS
Appendix 02 Premiums Paid Analysis - Supplemental
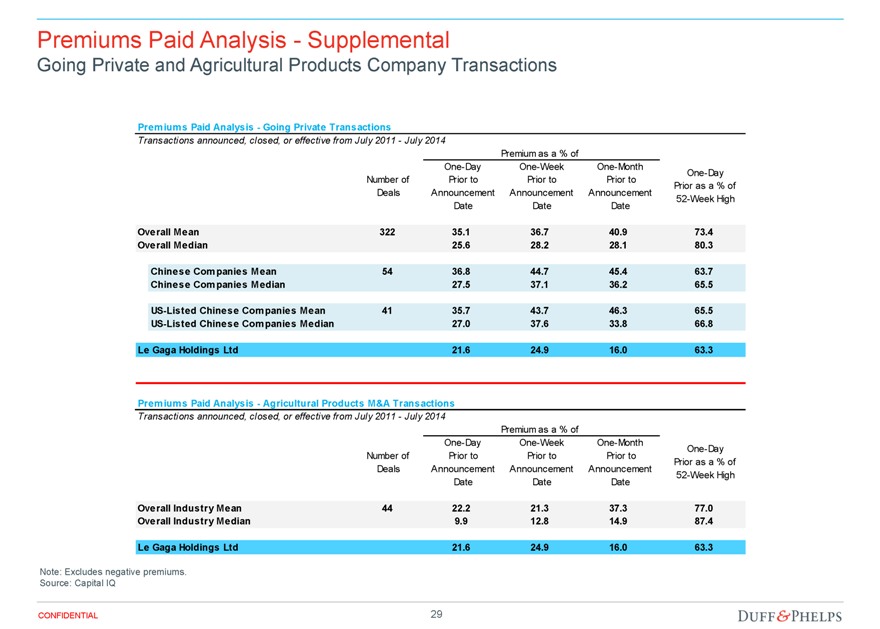
Premiums Paid Analysis - Supplemental
Going Private and Agricultural Products Company Transactions
Premiums Paid Analysis - Going Private Transactions
Transactions announced, closed, or effective from July 2011 - July 2014
Premium as a % of
Number of Deals
One-Day Prior to Announcement Date
One-Week Prior to Announcement Date
One-Month Prior to Announcement Date
One-Day Prior as a % of 52-Week High
Overall Mean 322 35.1 36.7 40.9 73.4
Overall Median 25.6 28.2 28.1 80.3
Chinese Companies Mean 54 36.8 44.7 45.4 63.7
Chinese Companies Median 27.5 37.1 36.2 65.5
US-Listed Chinese Companies Mean 41 35.7 43.7 46.3 65.5
US-Listed Chinese Companies Median 27.0 37.6 33.8 66.8
Le Gaga Holdings Ltd 21.6 24.9 16.0 63.3
Premiums Paid Analysis - Agricultural Products M&A Transactions
Transactions announced, closed, or effective from July 2011 - July 2014
Premium as a % of
Number of Deals
One-Day Prior to Announcement Date
One-Week Prior to Announcement Date
One-Month Prior to Announcement Date
One-Day Prior as a % of 52-Week High
Overall Industry Mean 44 22.2 21.3 37.3 77.0
Overall Industry Median 9.9 12.8 14.9 87.4
Le Gaga Holdings Ltd 21.6 24.9 16.0 63.3
Note: Excludes negative premiums. Source: Capital IQ
CONFIDENTIAL
29
DUFF & PHELPS
Appendix 03 Industry Agnostic Chinese Going-Private Transactions - Supplemental
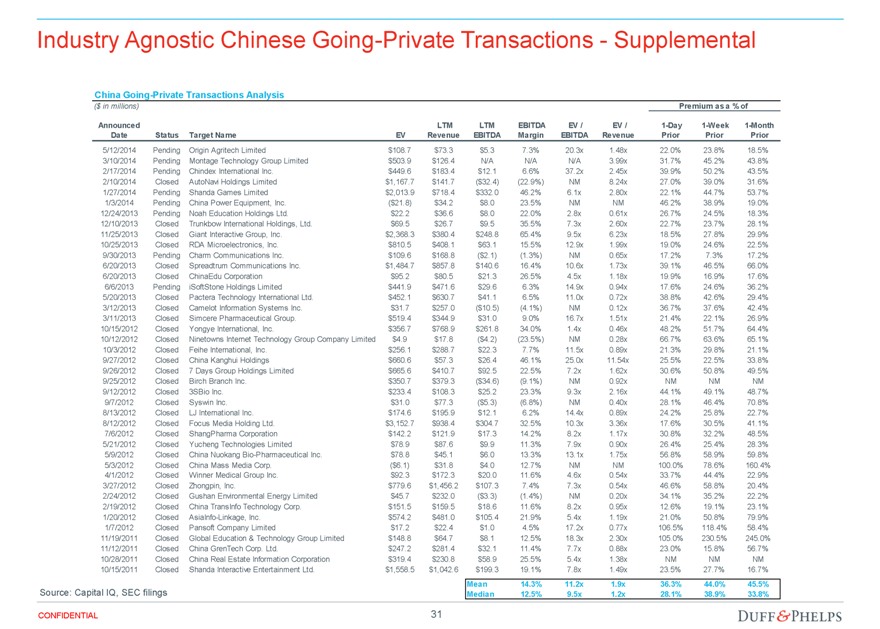
Industry Agnostic Chinese Going-Private Transactions - Supplemental
China Going-Private Transactions Analysis
($ in millions) Premium as a % of
Announced Date Status Target Name EV LTM Revenue LTM EBITDA EBITDA Margin EV / EBITDA EV / Revenue 1-Day Prior 1-Week Prior 1-Month Prior
5/12/2014 Pending Origin Agritech Limited $108.7 $73.3 $5.3 7.3% 20.3x 1.48x 22.0% 23.8% 18.5%
3/10/2014 Pending Montage Technology Group Limited $503.9 $126.4 N/A N/A N/A 3.99x 31.7% 45.2% 43.8%
2/17/2014 Pending Chindex International Inc. $449.6 $183.4 $12.1 6.6% 37.2x 2.45x 39.9% 50.2% 43.5%
2/10/2014 Closed AutoNavi Holdings Limited $1,167.7 $141.7 ($32.4) (22.9%) NM 8.24x 27.0% 39.0% 31.6%
1/27/2014 Pending Shanda Games Limited $2,013.9 $718.4 $332.0 46.2% 6.1x 2.80x 22.1% 44.7% 53.7%
1/3/2014 Pending China Power Equipment, Inc. ($21.8) $34.2 $8.0 23.5% NM NM 46.2% 38.9% 19.0%
12/24/2013 Pending Noah Education Holdings Ltd. $22.2 $36.6 $8.0 22.0% 2.8x 0.61x 26.7% 24.5% 18.3%
12/10/2013 Closed Trunkbow International Holdings, Ltd. $69.5 $26.7 $9.5 35.5% 7.3x 2.60x 22.7% 23.7% 28.1%
11/25/2013 Closed Giant Interactive Group, Inc. $2,368.3 $380.4 $248.8 65.4% 9.5x 6.23x 18.5% 27.8% 29.9%
10/25/2013 Closed RDA Microelectronics, Inc. $810.5 $408.1 $63.1 15.5% 12.9x 1.99x 19.0% 24.6% 22.5%
9/30/2013 Pending Charm Communications Inc. $109.6 $168.8 ($2.1) (1.3%) NM 0.65x 17.2% 7.3% 17.2%
6/20/2013 Closed Spreadtrum Communications Inc. $1,484.7 $857.8 $140.6 16.4% 10.6x 1.73x 39.1% 46.5% 66.0%
6/20/2013 Closed ChinaEdu Corporation $95.2 $80.5 $21.3 26.5% 4.5x 1.18x 19.9% 16.9% 17.6%
6/6/2013 Pending iSoftStone Holdings Limited $441.9 $471.6 $29.6 6.3% 14.9x 0.94x 17.6% 24.6% 36.2%
5/20/2013 Closed Pactera Technology International Ltd. $452.1 $630.7 $41.1 6.5% 11.0x 0.72x 38.8% 42.6% 29.4%
3/12/2013 Closed Camelot Information Systems Inc. $31.7 $257.0 ($10.5) (4.1%) NM 0.12x 36.7% 37.6% 42.4%
3/11/2013 Closed Simcere Pharmaceutical Group. $519.4 $344.9 $31.0 9.0% 16.7x 1.51x 21.4% 22.1% 26.9%
10/15/2012 Closed Yongye International, Inc. $356.7 $768.9 $261.8 34.0% 1.4x 0.46x 48.2% 51.7% 64.4%
10/12/2012 Closed Ninetowns Internet Technology Group Company Limited $4.9 $17.8 ($4.2) (23.5%) NM 0.28x 66.7% 63.6% 65.1%
10/3/2012 Closed Feihe International, Inc. $256.1 $288.7 $22.3 7.7% 11.5x 0.89x 21.3% 29.8% 21.1%
9/27/2012 Closed China Kanghui Holdings $660.6 $57.3 $26.4 46.1% 25.0x 11.54x 25.5% 22.5% 33.8%
9/26/2012 Closed 7 Days Group Holdings Limited $665.6 $410.7 $92.5 22.5% 7.2x 1.62x 30.6% 50.8% 49.5%
9/25/2012 Closed Birch Branch Inc. $350.7 $379.3 ($34.6) (9.1%) NM 0.92x NM NM NM
9/12/2012 Closed 3SBio Inc. $233.4 $108.3 $25.2 23.3% 9.3x 2.16x 44.1% 49.1% 48.7%
9/7/2012 Closed Syswin Inc. $31.0 $77.3 ($5.3) (6.8%) NM 0.40x 28.1% 46.4% 70.8%
8/13/2012 Closed LJ International Inc. $174.6 $195.9 $12.1 6.2% 14.4x 0.89x 24.2% 25.8% 22.7%
8/12/2012 Closed Focus Media Holding Ltd. $3,152.7 $938.4 $304.7 32.5% 10.3x 3.36x 17.6% 30.5% 41.1%
7/6/2012 Closed ShangPharma Corporation $142.2 $121.9 $17.3 14.2% 8.2x 1.17x 30.8% 32.2% 48.5%
5/21/2012 Closed Yucheng Technologies Limited $78.9 $87.6 $9.9 11.3% 7.9x 0.90x 26.4% 25.4% 28.3%
5/9/2012 Closed China Nuokang Bio-Pharmaceutical Inc. $78.8 $45.1 $6.0 13.3% 13.1x 1.75x 56.8% 58.9% 59.8%
5/3/2012 Closed China Mass Media Corp. ($6.1) $31.8 $4.0 12.7% NM NM 100.0% 78.6% 160.4%
4/1/2012 Closed Winner Medical Group Inc. $92.3 $172.3 $20.0 11.6% 4.6x 0.54x 33.7% 44.4% 22.9%
3/27/2012 Closed Zhongpin, Inc. $779.6 $1,456.2 $107.3 7.4% 7.3x 0.54x 46.6% 58.8% 20.4%
2/24/2012 Closed Gushan Environmental Energy Limited $45.7 $232.0 ($3.3) (1.4%) NM 0.20x 34.1% 35.2% 22.2%
2/19/2012 Closed China TransInfo Technology Corp. $151.5 $159.5 $18.6 11.6% 8.2x 0.95x 12.6% 19.1% 23.1%
1/20/2012 Closed AsiaInfo-Linkage, Inc. $574.2 $481.0 $105.4 21.9% 5.4x 1.19x 21.0% 50.8% 79.9%
1/7/2012 Closed Pansoft Company Limited $17.2 $22.4 $1.0 4.5% 17.2x 0.77x 106.5% 118.4% 58.4%
11/19/2011 Closed Global Education & Technology Group Limited $148.8 $64.7 $8.1 12.5% 18.3x 2.30x 105.0% 230.5% 245.0%
11/12/2011 Closed China GrenTech Corp. Ltd. $247.2 $281.4 $32.1 11.4% 7.7x 0.88x 23.0% 15.8% 56.7%
10/28/2011 Closed China Real Estate Information Corporation $319.4 $230.8 $58.9 25.5% 5.4x 1.38x NM NM NM
10/15/2011 Closed Shanda Interactive Entertainment Ltd. $1,558.5 $1,042.6 $199.3 19.1% 7.8x 1.49x 23.5% 27.7% 16.7%
Source: Capital IQ, SEC filings
Mean 14.3% 11.2x 1.9x 36.3% 44.0% 45.5%
Median 12.5% 9.5x 1.2x 28.1% 38.9% 33.8%
CONFIDENTIAL 31 DUFF & PHELPS