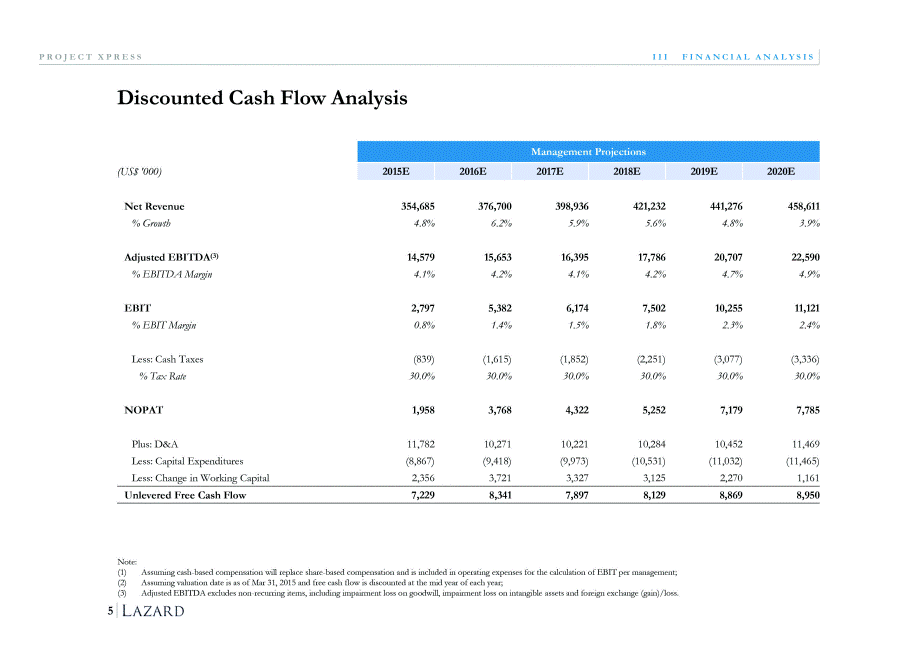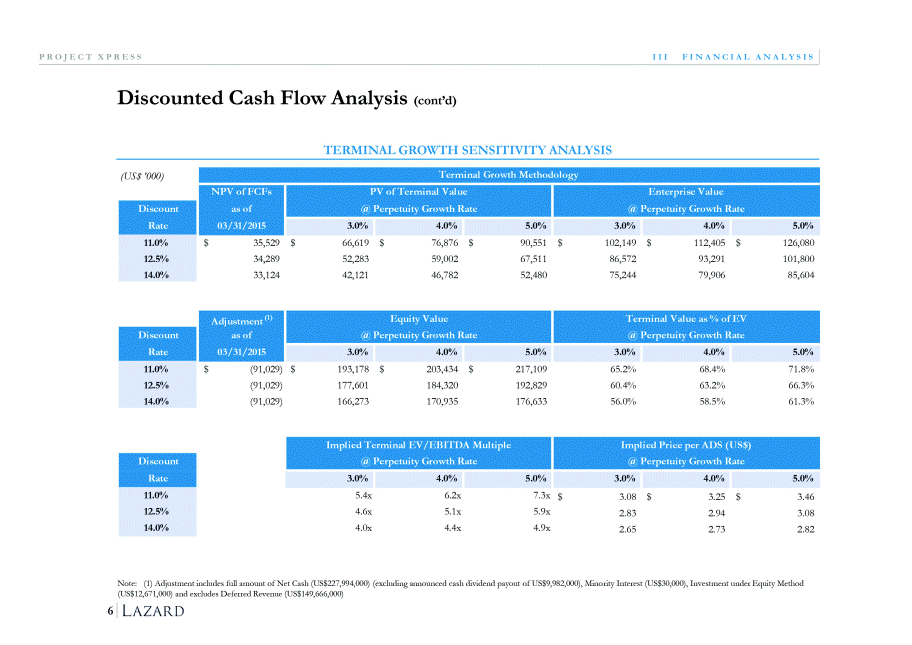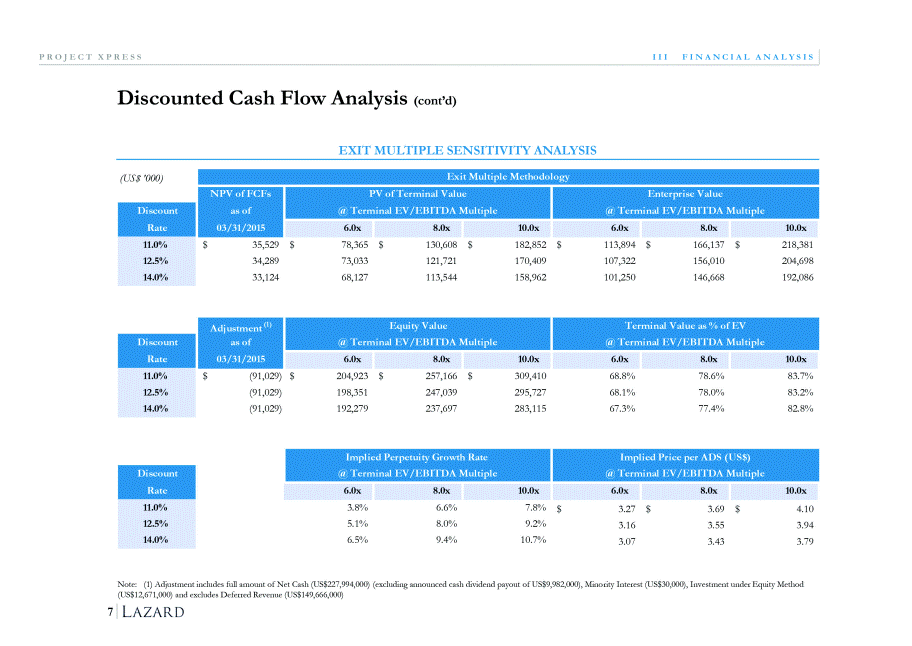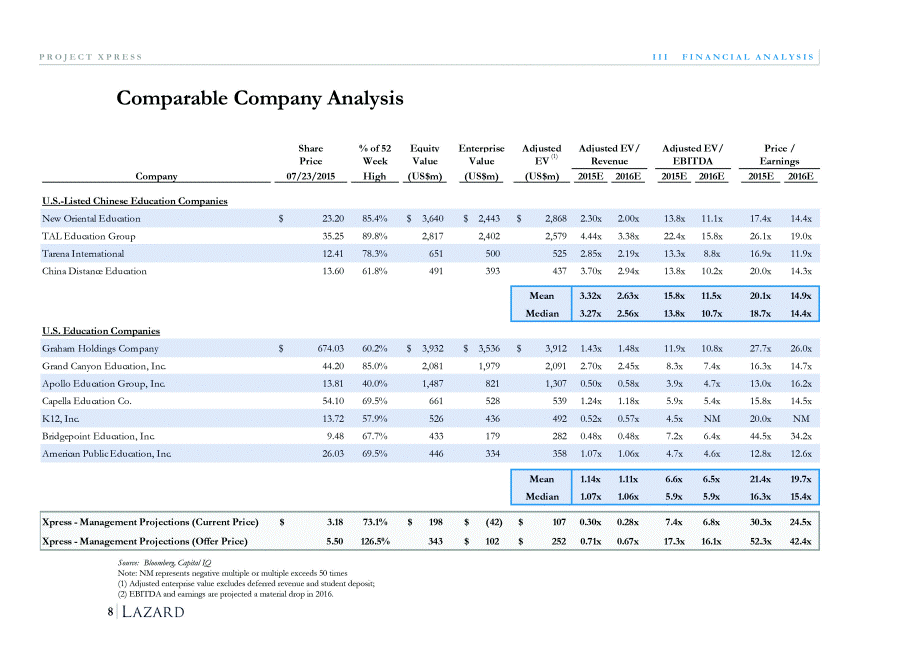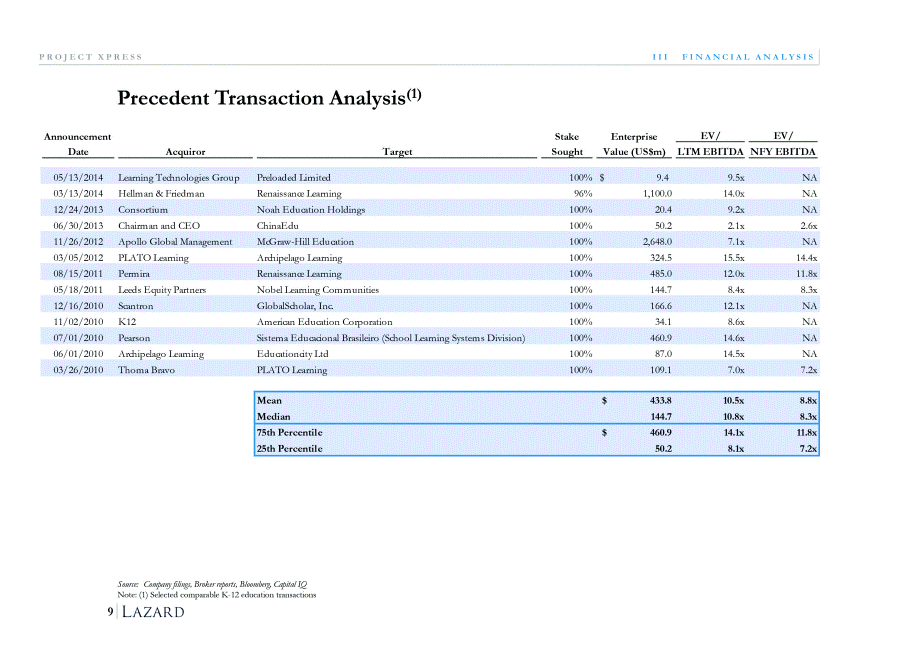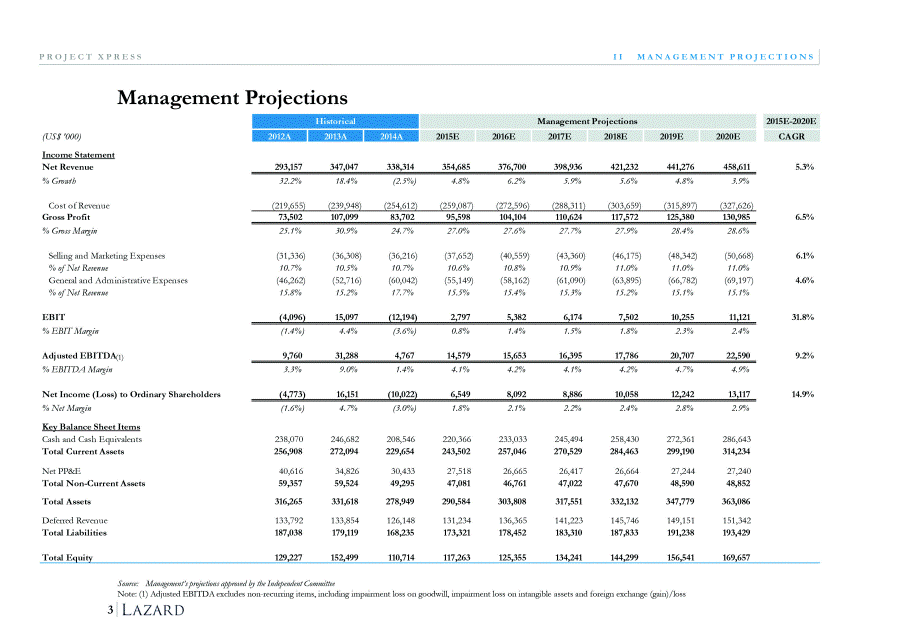
| Management Projections (US$ '000) Income Statement Net Revenue % Growth 293,157 347,047 338,314 354,685 376,700 398,936 421,232 441,276 458,611 5.3% 32.2% 18.4% (2.5%) 4.8% 6.2% 5.9% 5.6% 4.8% 3.9% Cost of Revenue Gross Profit % Gross Margin (219,655) (239,948) (254,612) (259,087) (272,596) (288,311) (303,659) (315,897) (327,626) 73,502 107,099 83,702 95,598 104,104 110,624 117,572 125,380 130,985 6.5% 25.1% 30.9% 24.7% 27.0% 27.6% 27.7% 27.9% 28.4% 28.6% Selling and Marketing Expenses % of Net Revenue General and Adm inistrative Expenses % of Net Revenue (31,336) 10.7% (46,262) 15.8% (36,308) 10.5% (52,716) 15.2% (36,216) 10.7% (60,042) 17.7% (37,652) 10.6% (55,149) 15.5% (40,559) 10.8% (58,162) 15.4% (43,360) 10.9% (61,090) 15.3% (46,175) 11.0% (63,895) 15.2% (48,342) 11.0% (66,782) 15.1% (50,668) 11.0% (69,197) 15.1% 6.1% 4.6% EBIT % EBIT Margin (4,096) 15,097 (12,194) 2,797 5,382 6,174 7,502 10,255 11,121 31.8% (1.4%) 4.4% (3.6%) 0.8% 1.4% 1.5% 1.8% 2.3% 2.4% Adjusted EBITDA(1) % EBITDA Margin 9,760 31,288 4,767 14,579 15,653 16,395 17,786 20,707 22,590 9.2% 3.3% 9.0% 1.4% 4.1% 4.2% 4.1% 4.2% 4.7% 4.9% Net Income (Loss) to Ordinary Shareholders % Net Margin Key Balance Sheet Items (4,773) 16,151 (10,022) 6,549 8,092 8,886 10,058 12,242 13,117 14.9% (1.6%) 4.7% (3.0%) 1.8% 2.1% 2.2% 2.4% 2.8% 2.9% Cash and Cash Equivalents Total Current Assets 238,070 256,908 246,682 272,094 208,546 229,654 220,366 243,502 233,033 257,046 245,494 270,529 258,430 284,463 272,361 299,190 286,643 314,234 Net PP&E Total Non-Current Assets Total Assets Deferred Revenue Total Liabilities 40,616 59,357 316,265 133,792 187,038 34,826 59,524 331,618 133,854 179,119 30,433 49,295 278,949 126,148 168,235 27,518 47,081 290,584 131,234 173,321 26,665 46,761 303,808 136,365 178,452 26,417 47,022 317,551 141,223 183,310 26,664 47,670 332,132 145,746 187,833 27,244 48,590 347,779 149,151 191,238 27,240 48,852 363,086 151,342 193,429 Total Equity 129,227 152,499 110,714 117,263 125,355 134,241 144,299 156,541 169,657 Source: Management’s projections approved by the Independent Committee Note: (1) Adjusted EBITDA excludes non-recurring items, including impairment loss on goodwill, impairment loss on intangible assets and foreign exchange (gain)/loss 3 2015E-2020E CAGR Historical Management Projections 2012A 2013A 2014A 2015E 2016E 2017E 2018E 2019E 2020E P R O J E C T X P R E S SI IM A N A G E M E N T P R O J E C T I O N S |
