Table of Contents
Filed Pursuant to Rule 424(b)(4)
RegistrationNo. 333-169650
RegistrationNo. 333-169650

TAL Education Group
12,000,000 American Depositary Shares
Representing
24,000,000 Class A Common Shares
This is an initial public offering of American depositary shares, or ADSs, of TAL Education Group. We are offering 12,000,000 ADSs. Each ADS represents two Class A common shares, par value $0.001 per share.
Prior to this offering, there has been no public market for our ADSs or our shares. Our ADSs have been approved for listing on the New York Stock Exchange under the symbol “XRS.”
See “Risk Factors” beginning on page 12 to read about risks you should consider before buying the ADSs.
PRICE $10.00 PER ADS
| Underwriting | ||||||||||||
| discounts and | Proceeds | |||||||||||
| Price to public | commissions | before expenses | ||||||||||
| Per ADS | $ | 10.00 | $ | 0.70 | $ | 9.30 | ||||||
| Total | $ | 120,000,000 | $ | 8,400,000 | $ | 111,600,000 | ||||||
The underwriters have an option to purchase up to an additional 1,800,000 ADSs from us at the initial public offering price less underwriting discounts and commissions, within 30 days from the date of this prospectus.
Neither the United States Securities and Exchange Commission nor any state securities commission or other regulatory body has approved or disapproved of these securities or passed upon the accuracy or adequacy of this prospectus. Any representation to the contrary is a criminal offense.
The underwriters expect to deliver the ADSs to purchasers on or about October 25, 2010.
| Credit Suisse | Morgan Stanley |
| Piper Jaffray | Oppenheimer & Co. |
The date of this prospectus is October 19, 2010.
Table of Contents

TABLE OF CONTENTS
| 1 | ||||
| 12 | ||||
| 40 | ||||
| 41 | ||||
| 42 | ||||
| 43 | ||||
| 44 | ||||
| 46 | ||||
| 47 | ||||
| 49 | ||||
| 55 | ||||
| 58 | ||||
| 85 | ||||
| 90 | ||||
| 103 | ||||
| 113 | ||||
| 119 | ||||
| 121 | ||||
| 122 | ||||
| 130 | ||||
| 140 | ||||
| 142 | ||||
| 149 | ||||
| 155 | ||||
| 156 | ||||
| 157 | ||||
| 158 | ||||
| F-1 |
You should rely only on the information contained in this prospectus. We have not authorized anyone to provide you with information different from that contained in this prospectus. We are offering to sell, and seeking offers to buy, the ADSs only in jurisdictions where offers and sales are permitted. The information contained in this prospectus is current only as of the date of this prospectus, regardless of the time of delivery of this prospectus or of any sale of the ADSs.
We have not taken any action to permit a public offering of the ADSs outside the United States or to permit the possession or distribution of this prospectus outside the United States. Persons outside the United States who come into possession of this prospectus must inform themselves about and observe any restrictions relating to the offering of the ADSs and the distribution of the prospectus outside the United States.
Through and including November 13, 2010 (the 25th day after the date of this prospectus), all dealers effecting transactions in these securities, whether or not participating in this offering, may be required to deliver a prospectus. This is in addition to a dealer’s obligation to deliver a prospectus when acting as an underwriter and with respect to an unsold allotment or subscription.
i
Table of Contents
THIS PAGE INTENTIONALLY LEFT BLANK
Table of Contents
SUMMARY
This summary highlights information contained elsewhere in this prospectus and does not contain all of the information that you should consider in making your investment decision. Before investing in the ADSs, you should carefully read the entire prospectus, including our financial statements and related notes included in this prospectus and the information set forth under the headings “Risk Factors” and “Management’s Discussion and Analysis of Financial Condition and Results of Operations.” In addition, we commissioned iResearch Consulting Group, or iResearch, an independent market research firm, to prepare a report for the purpose of providing various industry and other information and illustrating our position in the K-12 after-school tutoring service market in China. Information from the report prepared by iResearch, or the iResearch Report, appears in “Summary,” “Management’s Discussion and Analysis of Financial Condition and Results of Operations,” “Market Opportunity,” “Business” and other sections of this prospectus. We have taken such care as we consider reasonable in the reproduction and extraction of information from the iResearch Report and other third-party sources. Student enrollments in this prospectus refer to the cumulative total number of courses enrolled in and paid for by our students, including multiple courses enrolled in and paid for by the same student; if one student enrolls in two separate tutoring courses, we count that as two student enrollments.
Our Business
We are the largestK-12 after-school tutoring service provider in China as measured by income from operations in 2009, according to iResearch. In terms of revenues in 2009, we are one of the largest K-12 after-school tutoring service providers in China, according to iResearch. We offer comprehensive tutoring services toK-12 students covering core academic subjects, including mathematics, English, Chinese, physics, chemistry and biology. We have successfully established “Xueersi” as a leading brand in China’s K-12 private education market closely associated with high teaching quality and academic excellence in China, as evidenced by our students’ outstanding academic performance, our over 70% annual retention rate, our ability to recruit most of our students throughword-of-mouth referrals as well as the numerous recognitions and awards we have received. The K-12 after-school tutoring service market in China is highly fragmented. In 2009, we had a 0.26% market share in China and a 4.5% market share in Beijing, in each case as measured by revenues for the year according to iResearch.
We deliver our tutoring services through small classes, personalized premium services (i.e.,one-on-one tutoring) and online course offerings. Our extensive network consists of 109 learning centers and 87 service centers in Beijing, Shanghai, Shenzhen, Guangzhou, Tianjin and Wuhan, as well as our online platform. Our student enrollments increased from 67,996 in the fiscal year ended February 29, 2008 to 382,505 in the fiscal year ended February 28, 2010, representing a compound annual growth rate, or CAGR, of 137.2%. Our student enrollment growth has been predominantly driven by new students.
We are committed to providing our students with high-quality services and an exceptional learning experience. Our commitment is reflected in our continual focus on recruiting, training and retaining teachers with strong academic credentials, relevant experience and a passion for education; our emphasis on developing, updating and improving our curricula and course materials; and our focus on standardizing operating procedures throughout our network. This in turn has led to a strong track record of outstanding student achievement. In 2010, 169 out of our 430 high school graduates were admitted to Peking University or Tsinghua University, the two most prestigious universities in China that collectively enroll only less than 0.1% of the high school graduates across the country. In the same year, approximately 5,700 of our students in Beijing and Shanghai were admitted to key high schools, representing approximately 77% enrollment rate in comparison to the regional average of approximately 30%; and more than 5,500 of our students in Beijing and Shanghai were admitted to key middle schools, representing approximately 81% enrollment rate in comparison to the regional average of 15-25%. In addition, our students have won a significant number of regional, national and international math competitions, including three gold medals in the International Mathematical Olympiad in 2008 and 2009.
Our online platform, www.eduu.com, hosts China’s largest and most active online education community for our existing and potential students and their parents, and is the largest Internet education portal in China,
1
Table of Contents
based on the average monthly page views and average monthly unique visitors in the first six months of 2010. It provides our existing and potential students access to learning resources beyond our physical network, increases student loyalty and stickiness and enhances our brand awareness. In addition, our online platform enables us to continue to roll out and expand our online course offerings. As word-of-mouth referrals and our online communities have contributed significantly to student recruitment, we have not incurred significant advertising expenses in the past. Revenues generated from our online course offerings have accounted for less than 1.5% of our total net revenues since we began offering online courses in 2010.
We have experienced significant growth in recent years. Our total net revenues increased from $8.9 million in the fiscal year ended February 29, 2008 to $69.6 million in the fiscal year ended February 28, 2010, representing a CAGR of 179.9%. Our net income increased from $1.5 million in the fiscal year ended February 29, 2008 to $14.2 million in the fiscal year ended February 28, 2010, representing a CAGR of 206.9%. Our total net revenues for the six months ended August 31, 2010 were $53.0 million, and our net income for the same period was $13.2 million.
Due to PRC legal restrictions on foreign ownership and investment in the education business in China, we operate our after-school tutoring service business primarily through our variable interest entities and their subsidiaries and schools in China. We do not hold equity interests in our variable interest entities; however, through a series of contractual arrangements with these variable interest entities and their respective shareholders, we effectively control, and are able to derive substantially all of the economic benefits from, these variable interest entities.
Market Opportunity
We believe that the K-12 after-school tutoring market is the most attractive sector in China’s private education market given the large addressable market it serves, its rapid growth rate and its highly fragmented nature. According to statistics published by the Ministry of Education of China, there were approximately 180 million students in primary, middle and high schools in China at the end of 2008, presenting a large addressable market for K-12 after-school tutoring services. The primary purpose ofK-12 after school tutoring services in China is to help students in kindergarten through high school improve academic performance in their regular school courses across a range of subject areas and prepare for admission exams. The growth of theK-12 after-school tutoring market is compelling. According to iResearch, the K-12 after-school tutoring market in China grew from RMB123.8 billion in 2007 to RMB189.7 billion ($27.8 billion) in 2009, representing a CAGR of 23.8%, and is projected to grow to RMB447.2 billion ($65.5 billion) in 2014, representing a CAGR of 18.7% from 2009. We believe that rising levels of disposable income, increasing spending on private education, and intense competition for quality education and job opportunities in China are among the key factors that will contribute to the future growth of the K-12 after-school tutoring market. Moreover, the K-12 after-school tutoring market in China is highly fragmented with no player holding over 1% market share. This fragmented market presents opportunities for private tutoring service providers that offer high-quality services and have a strong track record, brand and reputation to attract and retain more students and increase market share.
Our Competitive Strengths and Strategies
We believe that the following competitive strengths have contributed to our success and differentiate us from our competitors:
| • | largest K-12 after-school tutoring service provider in China; | |
| • | brand strength; | |
| • | outstanding student performance; | |
| • | high teaching quality, strong content development and efficient education management system; | |
| • | largest Internet education platform in China; and | |
| • | innovative and entrepreneurial management team with a passion for education. |
2
Table of Contents
We intend to pursue the following key growth strategies:
| • | further penetrate our existing markets; | |
| • | extend our geographic network into attractive new markets; | |
| • | expand our personalized premium services; and | |
| • | further develop our online course offerings. |
Our Challenges
The successful execution of our strategies is subject to risks and uncertainties related to our business and industry, including those relating to:
| • | our ability to continue to attract students to enroll in our courses; | |
| • | our ability to continue to recruit, train and retain qualified teachers; | |
| • | our ability to improve the content of our existing course offerings and to develop new courses in a timely and cost-effective manner; | |
| • | our ability to maintain and enhance our brand; | |
| • | our historical financial and operating results, growth rates and profitability may not serve as an adequate basis to judge our future prospects and results of operations; | |
| • | our ability to maintain and continue to improve our teaching results in terms of student performance and the level of satisfaction with our services; and | |
| • | our ability to compete effectively against our competitors. |
In addition, we are subject to risks and uncertainties related to our corporate structure and doing business in China, including, but not limited to:
| • | risks associated with our control of our variable interest entities, which control is based upon contractual arrangements rather than equity ownership; | |
| • | risks associated with our ability to fund our expansion plan due to PRC legal restrictions on foreign currency conversion and restrictions on distribution of school profits, among others; | |
| • | uncertainties with respect to PRC regulatory restrictions on after-school tutoring services, including regulations issued by certain provincial governmental authorities prohibiting private schools from offering after-school tutoring classes to primary and secondary school students; and | |
| • | risks associated with our ability to obtain various operating licenses and permits and to make registrations and filings for all of our learning centers in China. |
See “Risk Factors” and “Special Note Regarding Forward-Looking Statements” for a discussion of these and other risks and uncertainties associated with our business and investing in our ADSs.
Our Corporate History and Structure
Our founders, Mr. Bangxin Zhang and Mr. Yundong Cao, offered our first after-school mathematics tutoring class in August 2003 when they were still attending graduate school in Peking University. In 2005, our founders established a domestic company in China named Beijing Xueersi Education Technology Co., Ltd., or Xueersi Education. In order to facilitate foreign investment in our company, in January 2008, we incorporated TAL Education Group, or TAL Group, to become our offshore holding company under the laws of the Cayman Islands. TAL Group established Xueersi International Education Group Limited, or Xueersi Hong Kong, in Hong Kong in March 2008 as our intermediary holding company. See “Management’s Discussion and Analysis of Financial Condition and Results of Operations—Taxation—PRC” for a discussion of tax implications of having Xueersi Hong Kong as our intermediary holding company. Xueersi Hong Kong
3
Table of Contents
subsequently established three wholly owned subsidiaries in China: TAL Education Technology (Beijing) Co., Ltd., or TAL Beijing, in May 2008; Beijing Huanqiu Zhikang Shidai Education Consulting Co., Ltd, or Huanqiu Zhikang, in September 2009; and Beijing Yidu Huida Education Technology Co., Ltd., or Yidu Huida, in November 2009.
The following diagram illustrates our current corporate structure:
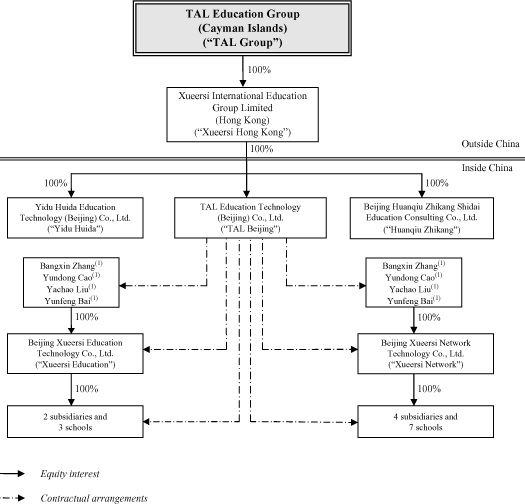
| (1) | Each person is an ultimate beneficial owner and also a director or executive officer of TAL Group. |
Due to the PRC legal restriction on foreign ownership and investment in the education business in China, we rely on a series of contractual arrangements among TAL Beijing, Beijing Xueersi Education Technology Co., Ltd., or Xueersi Education, Beijing Xueersi Network Technology Co., Ltd., or Xueersi Network, and their respective shareholders, subsidiaries and schools to conduct most of our tutoring services in China, while our personalized premium services in Beijing are offered through our subsidiary, Huanqiu Zhikang. These contractual arrangements enable us to:
| • | exercise effective control over Xueersi Education, Xueersi Network and their respective subsidiaries; | |
| • | receive substantially all of the economic benefits of Xueersi Education, Xueersi Network and their respective subsidiaries in consideration for the services provided by us; and |
4
Table of Contents
| • | have an exclusive option to purchase all of the equity interests in Xueersi Education and Xueersi Network when and to the extent permitted under PRC law. |
We do not have equity interests in Xueersi Education and Xueersi Network; however, as a result of these contractual arrangements, we are the primary beneficiary of Xueersi Education and Xueersi Network and treat them as our variable interest entities under generally accepted accounting principles in the United States, or U.S. GAAP. Accordingly, we refer to Xueersi Education and Xueersi Network collectively as our “variable interest entities,” or “VIEs.” We refer to our VIEs and the VIEs’ direct and indirect subsidiaries and schools collectively as “affiliated entities.” Moreover, in the contractual arrangements, the shareholders of the VIEs, in exchange for relinquishing effective control over the VIEs, received pro rata equity interests in TAL Group, which serves to align their interests with our company’s in performing those contracts. For a more detailed discussion of the risk of potential conflicts of interest associated with our corporate structure, see “Risk Factors — Risks Related to Our Corporate Structure — The beneficial owners of Xueersi Education and Xueersi Network may have potential conflicts of interest with us, which may materially and adversely affect our business and financial condition.”
We have consolidated the financial results of our VIEs and their subsidiaries in our consolidated financial statements in accordance with U.S. GAAP. For the fiscal years ended February 29, 2008 and February 28, 2009 and 2010, $8.9 million, $37.5 million and $68.9 million, or 100%, 100% and 99.0% of our total net revenues, respectively, are attributable to our VIEs.
Huanqiu Zhikang operates our personalized premium services in Beijing. Except for our personalized premium services in Beijing, none of our existing services is conducted directly by our subsidiaries. Yidu Huida was formed as part of our corporate strategic planning and has yet to conduct any significant business operations. Yidu Huida may in the future provide information technology support to our other subsidiaries and affiliated entities, which is within the business scope of Yidu Huida.
For a more detailed description of our corporate history and structure, see “Our Corporate History and Structure.” For a detailed description of the regulatory environment for private education that necessitates the adoption of our corporate structure, see “Regulation.” For a detailed description of the risks associated with our corporate structure and the contractual arrangements that support our corporate structure, see “Risk Factors—Risks Related to Our Corporate Structure.”
Our Corporate Information
Our principal executive offices are located at 18/F, Hesheng Building, 32 Zhongguancun Avenue, Haidian District, Beijing 100080, People’s Republic of China. Our telephone number at this address is +86 (10) 5292 6669. Our registered office in the Cayman Islands is located at Maples Corporate Services Limited, PO Box 309, Ugland House, Grand Cayman, KY1-1104, Cayman Islands.
Our corporate website address is www.xueersi.org. The information contained on our websites is not a part of this prospectus. Our agent for service of process in the U.S. is Law Debenture Corporate Services Inc.
5
Table of Contents
Conventions Used in this Prospectus
In this prospectus, unless otherwise indicated or the context otherwise requires, references to:
| • | “we,” “us,” “our company,” or “our” refers to TAL Education Group, its subsidiaries and its affiliated entities; | |
| • | “common shares” refers to our Class A and Class B common shares, par value US$0.001 per share; | |
| • | “preferred shares” or “Series A preferred shares” refers to our Series A convertible redeemable preferred shares, par value US$0.001 per share; | |
| • | “ADSs” refers to American depositary shares, each of which representing two Class A common shares; | |
| • | “variable interest entities,” or “VIEs,” refers to Beijing Xueersi Network Technology Co., Ltd. and Beijing Xueersi Education Technology Co., Ltd., which are domestic PRC companies in which we do not have equity interests but whose financial results have been consolidated into our consolidated financial statements in accordance with U.S. GAAP due to our having effective control over, and our being the primary beneficiary of, these companies; and “affiliated entities” refers to our VIEs and the VIEs’ direct and indirect subsidiaries and schools; | |
| • | “student enrollments” refers to the cumulative total number of courses enrolled in and paid for by our students, including multiple courses enrolled in and paid for by the same student; | |
| • | “annual retention rate” refers to the percentage of our students who subsequently enroll in one or more of our courses after enrolling in at least one course in the previous fiscal year; | |
| • | “China” or “PRC” refers to the People’s Republic of China, excluding for purposes of this prospectus only, Taiwan, Hong Kong and Macau; | |
| • | “K-12” refers to the year before the first grade through the last year of high school; | |
| • | “Renminbi” or “RMB” refers to the legal currency of China; and | |
| • | ‘‘$,” “dollars” or “U.S. dollars” refers to the legal currency of the United States. |
Except as otherwise indicated, all information in this prospectus assumes no exercise by the underwriters of their option to purchase additional ADSs.
6
Table of Contents
THE OFFERING
| Offering price | $10.00 per ADS. | |
| ADSs offered by us | 12,000,000 ADSs. | |
| ADSs outstanding immediately after this offering | 12,000,000 ADSs. | |
| Common shares outstanding immediately after this offering | 149,000,000 shares, par value $0.001 per share, comprised of (i) 24,000,000 Class A common shares, and (ii) 125,000,000 Class B common shares. | |
| ADS to Class A common share ratio | 1:2 | |
| New York Stock Exchange symbol | XRS. | |
| Common shares | Our common shares are divided into Class A common shares and Class B common shares. Holders of Class A common shares and Class B common shares have the same rights except for voting and conversion rights. In respect of matters requiring shareholders’ vote, each Class A common share is entitled to one vote, and each Class B common share is entitled to ten votes. Each Class B common share is convertible into one Class A common share at any time by the holder thereof. Class A common shares are not convertible into Class B common shares under any circumstances. Upon any transfer of Class B common shares by a holder thereof to any person or entity which is not an affiliate of such holder, such Class B common shares shall be automatically and immediately converted into the equal number of Class A common shares. | |
| Depositary | JPMorgan Chase Bank, N.A. | |
| Over-allotment option | The underwriters have a30-day option to purchase up to 1,800,000 additional ADSs from us at the initial public offering price less underwriting discounts and commissions. | |
| Reserved ADSs | At our request, the underwriters have reserved for sale, at the initial public offering price, up to 5% of the total number of ADSs offered in this offering (assuming no exercise of the over-allotment option) to some of our directors, officers, employees, business associates and related persons through a directed share program. | |
| Use of proceeds | We plan to use the net proceeds received from this offering to expand our network of learning centers and service centers, build a national training center, pay a declared cash dividend in the amount of $30.0 million to our shareholders of record as of the dividend declaration date conditional upon the completion of this offering, improve our existing facilities, and for other general corporate purposes, including strategic investments in and acquisitions of complementary businesses, although we are not currently negotiating any such investment or acquisition. See “Use of Proceeds” for more information. |
7
Table of Contents
| Lock-up | We, our directors and executive officers and all of our existing shareholders have agreed with the underwriters, subject to certain exceptions, not to sell, transfer or dispose of any ADSs, common shares or similar securities for a period of 180 days after the date this prospectus. See “Underwriting” for more information. | |
| Risk factors | See “Risk Factors” and other information included in this prospectus for a discussion of risks you should carefully consider before investing in the ADSs. |
The number of common shares that will be outstanding immediately after this offering:
| • | assumes that the underwriters do not exercise their over-allotment option to purchase 1,800,000 additional ADSs; | |
| • | reflects the conversion of all outstanding Series A preferred shares into 5,000,000 Class B common shares immediately prior to the completion of this offering; | |
| • | excludes 5,419,500 Class A common shares issuable upon the vesting of restricted shares issued under our 2010 share incentive plan that are outstanding as of the date of this prospectus; and | |
| • | excludes Class A common shares reserved for future grants under our 2010 share incentive plan. |
8
Table of Contents
Summary Consolidated Financial Data and Operating Data
You should read the following information concerning us in conjunction with our consolidated financial statements and related notes and “Management’s Discussion and Analysis of Financial Condition and Results of Operations” included elsewhere in this prospectus.
The following summary consolidated statements of operations data for the three fiscal years ended February 29, 2008 and February 28, 2009 and 2010 and the summary consolidated balance sheet data as of February 28, 2009 and 2010 are derived from our audited consolidated financial statements included elsewhere in this prospectus. The summary consolidated balance sheet data as of February 29, 2008 are derived from our audited financial statements, which are not included in this prospectus. Our audited consolidated financial statements are prepared in accordance with U.S. GAAP and have been audited by Deloitte Touche Tohmatsu CPA Ltd., an independent registered public accounting firm.
The summary consolidated statements of operations data for the six months ended August 31, 2009 and 2010 and the summary consolidated balance sheet data as of August 31, 2010 have been derived from our unaudited interim condensed consolidated financial statements included elsewhere in this prospectus. We have prepared the unaudited interim condensed consolidated financial information on the same basis as our audited consolidated financial statements. The unaudited financial information includes all adjustments, consisting only of normal and recurring adjustments, that we consider necessary for a fair presentation of our financial position and operating results for the periods presented. You should read the summary consolidated financial information in conjunction with our consolidated financial statements and related notes and “Management’s Discussion and Analysis of Financial Condition and Results of Operations” included elsewhere in this prospectus. Our historical results are not necessarily indicative of results to be expected in any future period.
| For the Year Ended February 29/28, | For the Six Months Ended August 31, | |||||||||||||||||||
| 2008 | 2009 | 2010 | 2009 | 2010 | ||||||||||||||||
| (in thousands of $, except for shares, | ||||||||||||||||||||
| per share and per ADS data) | ||||||||||||||||||||
Summary Consolidated Statements of Operations Data: | ||||||||||||||||||||
| Net revenues | $ | 8,882 | $ | 37,476 | $ | 69,594 | $ | 32,983 | $ | 53,022 | ||||||||||
| Total cost of revenues | (4,367 | ) | (18,554 | ) | (37,649 | ) | (16,068 | ) | (26,255 | )(1) | ||||||||||
| Gross profit | 4,515 | 18,922 | 31,945 | 16,915 | 26,767 | |||||||||||||||
| Operating expenses | ||||||||||||||||||||
| Selling and marketing | (370 | ) | (2,353 | ) | (5,608 | ) | (1,958 | ) | (4,184 | )(2) | ||||||||||
| General and administrative | (2,478 | ) | (5,890 | ) | (10,872 | ) | (4,602 | ) | (7,808 | )(3) | ||||||||||
| Impairment losses on intangible assets and goodwill | — | (1,615 | ) | — | — | — | ||||||||||||||
| Total operating expenses | (2,848 | ) | (9,858 | ) | (16,480 | ) | (6,560 | ) | (11,992 | ) | ||||||||||
| Income from operations | 1,667 | 9,064 | 15,465 | 10,355 | 14,775 | |||||||||||||||
| Interest income, net | 11 | 77 | 283 | 103 | 162 | |||||||||||||||
| Other expenses | — | (210 | ) | (124 | ) | (119 | ) | (27 | ) | |||||||||||
Impairment loss onavailable-for-sale securities | — | (363 | ) | — | — | — | ||||||||||||||
| Gain from sales of available-for-sale securities | — | — | — | — | 6 | |||||||||||||||
| Gain on extinguishment of liabilities | — | 731 | — | — | — | |||||||||||||||
| Income before income tax provision | 1,678 | 9,299 | 15,624 | 10,339 | 14,916 | |||||||||||||||
| Provision for income tax | (165 | ) | (2,018 | ) | (1,379 | ) | (912 | ) | (1,670 | ) | ||||||||||
| Net income | $ | 1,513 | $ | 7,281 | $ | 14,245 | $ | 9,427 | $ | 13,246 | ||||||||||
| Deemed dividends on Series A convertible redeemable preferred shares | — | (4,113 | ) | — | — | — | ||||||||||||||
| Net income attributable to common shareholders | $ | 1,513 | $ | 3,168 | $ | 14,245 | $ | 9,427 | $ | 13,246 | ||||||||||
| Net income per common share: | ||||||||||||||||||||
| Basic | $ | 0.01 | $ | 0.03 | $ | 0.11 | $ | 0.08 | $ | 0.11 | ||||||||||
| Diluted | $ | 0.01 | $ | 0.03 | $ | 0.11 | $ | 0.08 | $ | 0.11 | ||||||||||
9
Table of Contents
| For the Year Ended February 29/28, | For the Six Months Ended August 31, | |||||||||||||||||||
| 2008 | 2009 | 2010 | 2009 | 2010 | ||||||||||||||||
| (in thousands of $, except for shares, | ||||||||||||||||||||
| per share and per ADS data) | ||||||||||||||||||||
| Net income per Series A convertible redeemable preferred share-basic | — | $ | 17.69 | $ | 0.11 | $ | 0.08 | $ | 0.11 | |||||||||||
Net income per ADS(5): | ||||||||||||||||||||
| Basic | $ | 0.03 | $ | 0.05 | $ | 0.23 | $ | 0.15 | $ | 0.22 | ||||||||||
| Diluted | $ | 0.03 | $ | 0.05 | $ | 0.23 | $ | 0.15 | $ | 0.22 | ||||||||||
| Weighted average shares used in calculating net income per common share | ||||||||||||||||||||
| Basic | 120,000,000 | 120,000,000 | 120,000,000 | 120,000,000 | 120,000,000 | |||||||||||||||
| Diluted | 120,000,000 | 120,000,000 | 125,000,000 | 125,000,000 | 125,193,360 | |||||||||||||||
Pro forma net income per common share(4) | ||||||||||||||||||||
| Basic | — | — | $ | 0.11 | — | $ | 0.10 | |||||||||||||
| Diluted | — | — | $ | 0.11 | — | $ | 0.10 | |||||||||||||
Pro forma net income per ADS(4)(5) | ||||||||||||||||||||
| Basic | — | — | $ | 0.22 | — | $ | 0.21 | |||||||||||||
| Diluted | — | — | $ | 0.22 | — | $ | 0.21 | |||||||||||||
Weighted average shares used in calculating pro forma net income per common share(4) | ||||||||||||||||||||
| Basic | — | — | 123,151,008 | — | 123,350,832 | |||||||||||||||
| Diluted | — | — | 128,151,008 | — | 128,350,832 | |||||||||||||||
| Notes: | ||
| (1) | Includes share-based compensation expenses of $110 thousand. | |
| (2) | Includes share-based compensation expenses of $163 thousand. | |
| (3) | Includes share-based compensation expenses of $647 thousand. | |
| (4) | Unaudited pro forma net income per common share is computed by dividing net income attributable to common shareholders by the sum of (i) the weighted average number of common shares outstanding and (ii) the number of common shares whose proceeds, calculated using the initial public offering price of $10.00 per ADS, or $5.00 per common share, would be necessary to pay the amount by which the conditional $30.0 million cash dividend exceeds our earnings for the fiscal year ended February 28, 2010. | |
| (5) | Each ADS represents two Class A common shares. |
| As of February 29/28, | As of August 31, | |||||||||||||||||||
| 2008 | 2009 | 2010 | 2010 | |||||||||||||||||
| Actual | Pro Forma(1) | |||||||||||||||||||
| (in thousands of $) | ||||||||||||||||||||
Summary Consolidated Balance Sheet Data: | ||||||||||||||||||||
| Cash and cash equivalents | $ | 5,704 | $ | 29,693 | $ | 50,752 | $ | 81,495 | $ | 81,495 | ||||||||||
| Total assets | 8,131 | 38,553 | 65,504 | 97,515 | 97,515 | |||||||||||||||
| Deferred revenue | 5,714 | 18,023 | 29,408 | 42,101 | 42,101 | |||||||||||||||
| Convertible loan | — | — | 500 | 500 | 500 | |||||||||||||||
| Total liabilities | 7,012 | 26,198 | 38,578 | 56,234 | 86,234 | |||||||||||||||
| Net assets | 1,119 | 12,355 | 26,926 | 41,281 | 11,281 | |||||||||||||||
| Series A convertible redeemable preferred shares | — | 9,000 | 9,000 | 9,000 | — | |||||||||||||||
| Total equity | 1,119 | 3,355 | 17,926 | 32,281 | 11,281 | |||||||||||||||
| Note: | ||
| (1) | Reflects the automatic conversion of all of our Series A preferred shares into 5,000,000 Class B common shares immediately prior to the completion of this offering and the accrual of a $30.0 million cash dividend declared to our shareholders of record as of the dividend declaration date and payable upon the completion of this offering. |
10
Table of Contents
The following table sets forth a summary of our cash flow data for the periods indicated:
| For the Year Ended February 29/28, | For the Six-Month Period Ended August 31, | |||||||||||||||||||
| 2008 | 2009 | 2010 | 2009 | 2010 | ||||||||||||||||
| (in thousands of $) | ||||||||||||||||||||
Summary Consolidated Cash Flow Data: | ||||||||||||||||||||
| Net cash provided by operating activities | $ | 6,324 | $ | 23,468 | $ | 27,175 | 16,198 | 30,955 | ||||||||||||
| Net cash provided by/(used in) investing activities | (1,470 | ) | (5,116 | ) | (5,250 | ) | (696 | ) | (214 | ) | ||||||||||
| Net cash provided by/(used in) financing activities | 132 | 5,252 | (903 | ) | (1,622 | ) | (163 | ) | ||||||||||||
The following table presents our selected operating data as of the dates and for the periods indicated:
| As of and for the | ||||||||||||||||||||
| As of and for the Year Ended February 29/28, | Six Months Ended August 31, | |||||||||||||||||||
| 2008 | 2009 | 2010 | 2009 | 2010 | ||||||||||||||||
Selected Operating Data: | ||||||||||||||||||||
| Student enrollments | 67,996 | 215,080 | 382,505 | 175,638 | 236,919 | |||||||||||||||
| Learning centers | 30 | 73 | 98 | 83 | 108 | |||||||||||||||
11
Table of Contents
RISK FACTORS
You should consider carefully all of the information in this prospectus, including the risks and uncertainties described below, before making an investment in our ADSs. Any of the following risks could have a material adverse effect on our business, financial condition and results of operations. Additional risks and uncertainties not currently known to us or that we currently deem to be immaterial may also materially and adversely affect our business, financial condition and results of operations. In any such case, the market price of our ADSs could decline, and you may lose all or part of your investment.
Risks Related to Our Business
If we are not able to continue to attract students to enroll in our courses, our business and prospects will be materially and adversely affected.
The success of our business depends primarily on the number of students enrolled in our courses. Therefore, our ability to continue to attract students to enroll in our courses is critical to the continued success and growth of our business. This in turn will depend on several factors, including our ability to develop new programs and enhance existing programs to respond to changes in market trends and student demands, expand our geographic reach, manage our growth while maintaining consistent and high teaching quality, effectively market our programs to a broader base of prospective students, develop additional high-quality educational content and respond effectively to competitive pressures. If we are unable to continue to attract students to enroll in our courses, our revenues may decline, which may have a material adverse effect on our business, financial condition and results of operations.
We may not be able to continue to recruit, train and retain qualified teachers, who are critical to the success of our business and effective delivery of our tutoring services to students.
Our teachers are critical to maintaining the quality of our services and our reputation. We seek to hire highly qualified teachers who are dedicated to teaching and are able to deliver effective and inspirational instruction. There is a limited pool of teachers with these attributes, and we must provide highly competitive compensation packages to attract and retain such qualified teachers. We must also provide continued training to our teachers to ensure that they stay abreast of changes in student demands, academic standards and other key trends necessary to teach effectively. Although we have not experienced major difficulties in recruiting, training or retaining qualified teachers in the past, we may not always be able to recruit, train and retain enough qualified teachers in the future to keep pace with our growth while maintaining consistent teaching quality in the different markets we serve. A shortage of qualified teachers or a decrease in the quality of our teachers’ classroom performance, whether actual or perceived, or a significant increase in compensation we must pay to retain qualified teachers, would have a material adverse effect on our business, financial condition and results of operations.
We may not be able to improve the content of our existing courses or to develop new courses on a timely basis and in a cost-effective manner.
We constantly update and improve the content of our existing courses and develop new courses to meet market demands. Revisions to our existing courses and our newly developed courses may not always be well received by existing or prospective students or their parents. If we cannot respond effectively to changes in market demands, our business may be adversely affected. Even if we are able to develop new courses that are well received, we may not be able to introduce them as quickly as our students may require. If we do not respond adequately to changes in market requirements, our ability to attract and retain students could be impaired and our financial results could suffer.
Offering new courses or modifying existing courses may require us to make investments in content development, increase marketing efforts and re-allocate resources away from other uses. We may have limited experience with the content of new courses and may need to modify our systems and strategies to incorporate new courses into our existing course offerings. If we are unable to improve the content of our existing courses,
12
Table of Contents
offer new courses on a timely basis and in a cost-effective manner, our results of operations and financial condition could be adversely affected.
If we are not able to maintain and enhance our brand, our business and operating results may be harmed.
We believe that market awareness of our “Xueersi” brand has contributed significantly to the success of our business, and that maintaining and enhancing our brand is critical to maintaining our competitive advantage. If we are unable to successfully promote and market our brand and services, our ability to attract and enroll new students could be adversely impacted and, consequently, our financial performance could suffer. We mainly rely on word-of-mouth referrals to attract prospective students. We also use marketing tools such as the Internet, public lectures, outdoor advertising campaigns and distribution of marketing materials to promote our brand and service offerings. In order to maintain and increase our brand recognition and promote our new service offerings, we have increased our marketing personnel and expenses over the last several years. A number of factors could prevent us from successfully promoting our brand, including student dissatisfaction with our services and the failure of our marketing tools and strategies to attract prospective students. If we are unable to maintain and enhance our brand or utilize marketing tools in a cost-effective manner, our revenues and profitability may suffer.
Moreover, we offer a variety of courses to primary, middle and high school students in some of the largest cities in China. As we continue to grow in size, expand our course offerings and extend our geographic reach, it may be more difficult to maintain quality and uniform standards of our services and to protect and promote our brand name.
We cannot provide assurance that our sales and marketing efforts will be successful in further promoting our brand in a competitive and cost-effective manner. If we are unable to further enhance our brand recognition and increase awareness of our services, or if we incur excessive sales and marketing expenses, our business and results of operations may be materially and adversely affected.
Our historical financial and operating results, growth rates and profitability may not be indicative of future performance.
Although we commenced operations in 2003, our significant growth in terms of employees, operations and revenues has occurred since 2008. Our total net revenues increased from $8.9 million in the fiscal year ended February 29, 2008 to $69.6 million in the fiscal year ended February 28, 2010. Any evaluation of our business and our prospects must be considered in light of the risks and uncertainties encountered by companies at our stage of development. In addition, the after-school tutoring service market in China is still at the early stage of development, which makes it difficult to evaluate our business and future prospects. Furthermore, our results of operations may vary from period to period in response to a variety of other factors beyond our control, including general economic conditions and regulations or government actions pertaining to the private education service sector in China, changes in spending on private education, our ability to control cost of revenues and operating expenses, and non-recurring charges incurred in connection with acquisitions or other extraordinary transactions or under unexpected circumstances. Due to the above factors, we believe that our historical financial and operating results, growth rates and profitability may not be indicative of our future performance and you should not rely on our past results or our historic growth rates as indications of our future performance.
If our students’ level of performance falls or satisfaction with our services declines, our annual retention rate may decline and our business, financial condition, results of operations and reputation would be adversely affected.
The success of our business depends on our ability to deliver a satisfactory learning experience and improved academic results. Our tutoring services may fail to improve a student’s academic performance and a student may perform below expectations even after completing our courses. Additionally, student and parent satisfaction with our services may decline. A student’s learning experience may also suffer if his or her
13
Table of Contents
relationship with our teachers does not meet expectations. We generally offer refunds for remaining classes to students who decide to withdraw from a course. Although we have not experienced any significant refunds in the past, if an increasing number of students request refunds, our revenues and results of operations may be adversely affected. In addition, if a significant number of students fail to improve their performance after attending our courses or if their learning experiences with us are unsatisfactory, they may decide not to continue to enroll in our courses, and our business, financial condition, results of operations and reputation would be adversely affected.
We face significant competition, and if we fail to compete effectively, we may lose our market share and our profitability may be adversely affected.
The private education market in China is rapidly evolving, highly fragmented and competitive, and we expect competition to persist and intensify. We face competition in each type of services we offer and in each geographic market in which we operate. Our competitors include New Oriental Education & Technology Group Inc., Juren Education, Ambow Education Holding Ltd., China Xueda Education Ltd., and ChinaEdu Corporation.
Our student enrollments may decrease due to intense competition. Some of our competitors may have more resources than we do. These competitors may be able to devote greater resources than we can to the development, promotion and sale of their programs, services and products and respond more quickly than we can to changes in student needs, testing materials, admission standards, market trends or new technologies. In addition, some smaller local companies may be able to respond more quickly to changes in student preferences in some of our targeted markets. Moreover, the increasing use of the Internet and advances in Internet- and computer-related technologies, such as web video conferencing and online testing simulators, are eliminating geographic and physical facility-related entry barriers to providing private education services. As a result, smaller local companies may be able to use the Internet to quickly and cost-effectively offer their programs, services and products to a large number of students with less capital expenditure than previously required. Consequently, we may be required to reduce course fees or increase spending in response to competition in order to retain or attract students or pursue new market opportunities, which could result in a decrease in our revenues and profitability. We will also face increased competition as we expand our operations. We cannot assure you that we will be able to compete successfully against current or future competitors. If we are unable to maintain our competitive position or otherwise respond to competitive pressure effectively, we may lose our market share and our profitability may be adversely affected.
Failure to effectively and efficiently manage the expansion of our service network may materially and adversely affect our ability to capitalize on new business opportunities.
Our business has experienced significant growth in recent years. The number of our learning centers increased from 30 as of February 29, 2008 to 109 to date. We plan to continue to expand our operations in different geographic markets in China. Establishing new learning centers poses challenges and requires us to make investments in management, capital expenditures, marketing expenses and other resources. The expansion has resulted, and will continue to result, in substantial demands on our management and staff as well as our financial, operational, technological and other resources. Our planned expansion will also place significant pressure on us to maintain the teaching quality and uniform standards, controls and policies to ensure that our brand does not suffer as a result of any decrease, whether actual or perceived, in the quality of our programs. To manage and support our expansion, we must improve our existing operational, administrative and technological systems and our financial and management controls, and recruit, train and retain additional qualified teachers and management personnel as well as other administrative and marketing personnel. We cannot assure you that we will be able to effectively and efficiently manage the growth of our operations, maintain or accelerate our current growth rate, recruit and retain qualified teachers and management personnel, successfully integrate new learning centers into our operations and otherwise effectively manage our growth. Our failure to effectively and efficiently manage our expansion may materially and adversely affect our ability to capitalize on new business opportunities, which in turn may have a material adverse impact on our financial condition and results of operations.
14
Table of Contents
If we fail to successfully execute our growth strategies, our business and prospects may be materially and adversely affected.
Our growth strategies include further penetrating our existing markets, extending the geographic scope of our network into attractive markets, expanding personalized premium services and further developing our online course offerings. We may not succeed in executing our growth strategies due to a number of factors, including, without limitation, the following:
| • | we may fail to identify new cities with sufficient growth potential into which to expand our network; | |
| • | it may be difficult to increase the number of learning centers in more developed cities; | |
| • | we may fail to effectively market our services in new markets or promote new courses in existing markets; | |
| • | we may not be able to replicate our successful growth model in Beijing and Shanghai to other geographic markets; | |
| • | our analysis for selecting suitable new locations may not be accurate and the demand for our services at such new locations may not materialize or increase as rapidly as we expect; | |
| • | we may fail to obtain the requisite licenses and permits necessary to open learning centers at our desired locations from local authorities; | |
| • | we may not be able to continue to enhance our online course offerings, generate profits from online courses, or adapt online courses to changing student needs and technological advances; and | |
| • | we may fail to achieve the benefits we expect from our expansion. |
If we fail to successfully execute our growth strategies, we may not be able to maintain our growth rate and our business and prospects may be materially and adversely affected as a result.
At present, we derive a majority of our revenues from Beijing and Shanghai. Any event negatively affecting the private education market in Beijing or Shanghai could have a material adverse effect on our overall business and results of operations.
Our services in Beijing and Shanghai currently contribute to most of our revenues. We derived approximately 98% and 97% of our total net revenues for the fiscal year ended February 28, 2010 and the six months ended August 31, 2010, respectively, from these two cities and we expect our services in Beijing and Shanghai to continue to represent the main sources of our income. If either city experiences an event negatively affecting its private education market, such as a serious economic downturn, natural disaster or outbreak of contagious disease, or if either city adopts regulations relating to private education that place additional restrictions or burdens on us, our overall business and results of operations may be materially and adversely affected.
If we fail to expand our personalized premium services efficiently and cost-effectively, our business and prospects could be harmed.
One of our growth strategies is to further expand our personalized premium services in Beijing and replicate that model in other geographic regions in China. The expansion may entail significant investment of human capital, financial resources and management time and attention as suchone-on-one tutoring services impose a different set of requirements on our teachers and many other aspects of our operations than small classes, which currently constitute the main format of our service offerings. If we fail to manage our expansion in personalized premium services efficiently and cost-effectively, it could have an adverse effect on our business and prospects.
15
Table of Contents
Accidents or injuries suffered by our students or other people on our premises may adversely affect our reputation, subject us to liability and cause us to incur substantial costs.
Even though we carry certain liability insurance for our students and their parents, in the event of accidents or injuries or other harm to students or other people on our premises, including those caused by or otherwise arising from the actions of our employees or contractors on our premises, our facilities may be perceived to be unsafe, which may discourage prospective students from attending our classes. We could also face claims alleging that we were negligent, provided inadequate supervision to our employees or contractors and therefore should be held jointly liable for harm caused by them or are otherwise liable for injuries suffered by our students or other people on our premises. For instance, in 2009, a student was injured while attending our classes in a learning center in Beijing and claimed that we were negligent and thus liable for the injury. Although that incident was resolved without any material damages to our reputation or business, there may be similar incidents in the future. A liability claim against us or any of our teachers or independent contractors could adversely affect our reputation, enrollment and revenues. Even if unsuccessful, such a claim could create unfavorable publicity, cause us to incur substantial expenses and divert the time and attention of our management.
Failure to adequately and promptly respond to changes in examination systems, admission standards and technologies in China could render our courses and services less attractive to students.
Under China’s education system, school admissions rely heavily on examination results. College and high school entrance examinations in most cases are mandatory for graduating seniors in high schools and middle schools in order to gain admission to colleges and high schools, respectively, and therefore, a student’s performance in those examinations is critical to his or her education career and future employment prospects. Although examinations are not required for entering middle schools, many key middle schools administer their own assessment tests to disqualify prospective students. It is therefore common for students to take after-school tutoring classes to improve test performance, and the success of our business to a large extent depends on the continued use of assessment tests by schools and colleges in their admissions. However, such heavy emphasis on examination scores may decline or fall out of favor with educational institutions or education authorities in China. For example, education authorities in Yunnan Province stopped administering provincial-level middle school entrance examinations in 2010. Instead, high schools in Yunnan will start to admit students based on a combination of middle school examination results that have replaced raw scores with letter grades and comprehensive evaluations of students’ aptitude and performance by their middle schools. Yunnan Province also prohibits subject competitions in primary and middle schools. Although we do not offer after-school tutoring services in the Yunnan Province, nor do we expect to do so in the near future, it is possible that the local governments in the areas where we have operations may adopt similar measures. Furthermore, approximately 80 universities in China have been allowed to recruit generally no more than 5% of their students through independently administered examinations and admission procedures in recent years. Candidates for admission to those universities are still required to take college entrance examinations and meet certain threshold requirements for minimum scores, but their college entrance exam scores are no longer the sole determining factor in the admission processes of those universities. If we fail to adjust our services to respond to any such material changes, our business may be materially and adversely affected. In addition, admission and assessment tests in China constantly undergo changes and development in terms of subject and skill focus, question type, examination format and the manner in which tests are administered. We therefore must continually update and improve our course materials and our teaching methods. A failure to track and respond to any such changes in a timely and cost-effective manner could make our courses and services less attractive to students, which may materially and adversely affect our reputation and ability to continue to attract students and in turn have a material adverse effect on our business, financial condition and results of operations.
Our new courses and services may compete with our existing offerings.
We are constantly developing new courses and services to meet changes in student demands, testing materials, admission standards, market trends and technologies. While some of the courses and services that
16
Table of Contents
we develop will expand our current offerings and increase student enrollment, others may compete with or render obsolete our existing offerings without increasing our total student enrollment. For example, our online courses might attract students away from our classroom-based courses. If we are unable to increase our total student enrollment and profitability as we expand our course and service offerings, our business and growth may be adversely affected.
If we are not able to continually enhance our online courses and services and adapt to rapid changes in technological demands and student needs, we may lose market share and our business could be adversely affected.
Widespread use of the Internet for educational purposes is a relatively recent occurrence, and the market for Internet-based courses and services is characterized by rapid technological changes and innovations, as well as unpredictable product life cycles and user preferences. We have limited experience with generating revenues from online courses and services, and their results are largely uncertain. We must be able to adapt quickly to changing student needs and preferences, technological advances and evolving Internet practices in order to compete successfully in online education. Ongoing enhancement of our online offerings and technologies may entail significant expenses and technological risks. We may not be able to use new technologies effectively or may fail to adapt to changes in the online education market on a timely and cost-effective basis. Revenues generated from our online course offerings have been insignificant, accounting for less than 1.5% of our total net revenues since we began offering online courses in 2010. We expect that revenues from our online course offerings will increase. However, if improvements to our online offerings and technologies are delayed, result in systems interruptions or are not aligned with market expectations or preferences, we may not gain market share and our growth prospects could be adversely affected.
Our success depends on the continuing efforts of our senior management team and other key personnel and our business may be harmed if we lose their services.
Our future success depends heavily upon the continuing services of the members of our senior management team, which includes Bangxin Zhang, our chairman and chief executive officer, Yundong Cao, our director and president, Yachao Liu, our vice president, Yunfeng Bai, our vice president and Joseph Kauffman, our chief financial officer. If any member of our senior management team leaves us and we fail to effectively manage a transition to new personnel, or if we fail to attract and retain qualified and experienced professionals on acceptable terms, our business, financial conditions and results of operations could be adversely affected. Competition for experienced management personnel in the education industry is intense, and we may not be able to retain the services of our senior executives or key personnel, or to attract and retain high quality senior executives or key personnel in the future.
Our success also depends on our having highly trained financial, technical, human resource, sales and marketing staff, management personnel and qualified teachers for local markets. We will need to continue to hire additional personnel as our business grows. A shortage in the supply of personnel with requisite skills or our failure to recruit them could impede our ability to increase revenues from our existing courses and services, to launch new course and service offerings and to expand our operations, and would have an adverse effect on our business and financial results.
Failure to control rental costs, obtain leases at desired locations at reasonable prices or protect our leasehold interests could materially and adversely affect our business.
All of our offices and service and learning centers are presently located on leased premises. At the end of each lease term, which generally ranges from two to five years, we must negotiate an extension of the lease and if we are not able to negotiate an extension on terms acceptable to us, we will be forced to move to a different location, or the rent may increase significantly. This could disrupt our operations and adversely affect our profitability. All of our leases are subject to renewal at market prices, which could result in a substantial rent increase at each time of renewal. We compete with many other businesses for sites in certain highly desirable locations and some landlords may have entered into long-term leases with our competitors for prime locations. As a result, we may not be able to obtain new leases at desirable locations or renew our existing
17
Table of Contents
leases on acceptable terms or at all, which could adversely affect our business. In addition, we have not been able to receive from our lessors copies of title certificates or proof of authorization to lease the properties to us for five of our leased properties of approximately 26,000 square feet in total involving aggregate annual rentals of approximately RMB2.3 million. Operations on these five leased properties contributed approximately 3.2% and 2.8% of our total net revenues for the fiscal year ended February 28, 2010 and the six months ended August 31, 2010, respectively. As of the date of this prospectus, we are not aware of any actions, claims or investigations threatened against us or our lessors with respect to the defects in our leasehold interests. However, if any of our leases are terminated as a result of challenges by third parties or governmental authorities for lack of title certificates or proof of authorization to lease, we do not expect to be subject to any fines or penalties but we may be forced to relocate the affected learning centers and incur additional expenses relating to such relocation. If we fail to find suitable replacement sites in a timely manner or on terms acceptable to us, our business and results of operations could be materially and adversely affected. We were aware of the defects when we entered into those leases. In many cases, we entered into leases upon promises from the lessors that relevant certificates and authorizations would be delivered at a later time, which did not eventually materialize. Our business and legal teams followed an internal guideline to identify and assess risks in connection with leasing the properties, and a final business decision was made after our analysis of the likely impact of the defects on the leasehold interests and the value of the properties to our expansion plan. However, there is no assurance that our decision would always lead to the favorable outcome we expected to achieve.
Capacity constraints of our teaching facilities could cause us to lose students to our competitors.
The teaching facilities of our physical network are limited in size and number of classrooms. We may not be able to admit all students who would like to enroll in our courses due to the capacity constraints of our teaching facilities. This would deprive us of the opportunity to serve them and to potentially develop a long-term relationship with them for continued services. If we fail to expand our physical capacity as quickly as the demand for our classroom-based services grows, we could lose potential students to our competitors, and our results of operations and business prospects could suffer as a result.
If we fail to protect our intellectual property rights, our brand and business may suffer.
We consider our copyrights, trademarks, trade names and Internet domain names invaluable to our ability to continue to develop and enhance our brand recognition. Unauthorized use of our copyrights, trademarks, trade names and domain names may damage our reputation and brand. Our major brand names and logos are registered trademarks in China. Our proprietary curricula and course materials are protected by copyrights. However, preventing copyright, trademark and trade name infringement or misuse could be difficult, costly and time-consuming, particularly in China. The measures we take to protect our copyrights, trademarks and other intellectual property rights are currently based upon a combination of trademark and copyright laws in China and may not be adequate to prevent unauthorized uses. Furthermore, application of laws governing intellectual property rights in China is uncertain and evolving, and could involve substantial risks to us. There had been several incidents in the past where third parties used our brand “Xueersi” without our authorization and we had to resort to litigation to protect our intellectual property rights. These proceedings were all resolved in our favor and our brand and business were not materially harmed. However, if we are unable to adequately protect our trademarks, copyrights and other intellectual property rights in the future, we may lose these rights, our brand name may be harmed, and our business may suffer materially. Furthermore, our management’s attention may be diverted by violations of our intellectual property rights, and we may be required to enter into costly litigation to protect our proprietary rights against any infringement or violation.
We may encounter disputes from time to time relating to our use of the intellectual property of third parties.
We cannot assure you that our course materials, online platform or other intellectual property developed or used by us do not or will not infringe upon valid copyrights or other intellectual property rights held by third parties. We may encounter disputes from time to time over rights and obligations concerning intellectual
18
Table of Contents
property, and we may not prevail in those disputes. Our teachers may, against our policies, use third-party copyrighted materials without proper authorization in our classes or our students may post unauthorized third-party content on our websites. We may incur liability for unauthorized duplication or distribution of materials posted on our websites or used in our classes. Third parties may bring claims against us alleging our infringement of their intellectual property rights. Any such intellectual property infringement claim could result in costly litigation and divert our management attention and resources.
If we fail to integrate or negotiate successfully any future acquisitions, our business and operating results could be adversely affected.
We may acquire complementary businesses in the future. If we are unable to successfully integrate the acquired businesses, it could harm our business and operating results. In addition, we may revalue or write down the value of goodwill and other intangible assets in connection with future acquisitions which would harm our operating results. For example, we recognized an impairment loss on goodwill of $1.2 million in the fiscal year ended February 28, 2009 in connection with some of our acquisitions. In order to remain competitive or to expand our business, we may find it necessary or desirable to acquire other businesses and we may be unable to identify appropriate acquisition targets. If we identify an appropriate acquisition target, we may not be able to negotiate the terms of the acquisition successfully, finance the acquisition or integrate the acquired businesses into our existing business and operations. Furthermore, completing a potential acquisition and integrating an acquired business may strain our resources and require significant management time.
Seasonal and other fluctuations in our results of operations could adversely affect the trading price of the ADSs.
Our revenues and operating results may fluctuate as a result of seasonal variations in our business, principally due to changes in student enrollments. The fluctuations may result in volatility or have an adverse effect on the market price of the ADSs. In addition, comparisons of our operating results between different periods within a single financial year, or between the same periods in different financial years, may not be meaningful and should not be relied upon as good indicators of our performance.
We have limited liability insurance coverage and do not carry business disruption insurance.
We have limited liability insurance coverage for our students and their parents in our major learning centers. A successful liability claim against us due to injuries suffered by our students or other people on our premises could materially and adversely affect our financial conditions, results of operations and reputation. Even if unsuccessful, such a claim could cause adverse publicity to us, require substantial cost to defend and divert the time and attention of our management. In addition, we do not have any business disruption insurance. Any business disruption event could result in substantial cost to us and diversion of our resources.
System disruptions to our websites or computer systems or a leak of student data could damage our reputation and limit our ability to retain students and increase student enrollment.
The performance and reliability of our websites and computer systems is critical to our reputation and ability to retain students and increase student enrollment. Any system error or failure, or a sudden and significant increase in online traffic, could disrupt or slow access to our websites. We cannot assure you that we will be able to expand our online infrastructure in a timely and cost-effective manner to meet the increasing demands of our students and their parents. In addition, our computer systems store and process important information including, without limitation, class schedules, registration information and student data and could be vulnerable to interruptions or malfunctions due to events beyond our control, such as natural disasters and technology failures. For instance, we have in the past experienced interruptions to our operations due to temporary computer system failures. Although we have a daily backup system that runs on different servers for our operating data, we may still lose important student data or suffer disruption to our operations if there is a failure of the database system or the backup system. Moreover, we would suffer economic and reputational damages if a technical failure of our systems causes a leak of student data, including
19
Table of Contents
identification or contact information, although there has not been any such leak in the past. Any disruption to our computer systems could therefore have a material adverse effect on ouron-site operations and ability to retain students and increase student enrollments.
We face risks related to natural disasters, health epidemics and other outbreaks, which could significantly disrupt our operations.
Our business could be materially and adversely affected by natural disasters or widespread epidemics. On May 12, 2008 and April 14, 2010, severe earthquakes affected parts of Sichuan province in southeastern China and parts of Qinghai province in western China, respectively, resulting in significant numbers of casualties and property damages. While we did not suffer any loss or experience any significant increase in costs as a result of the earthquakes, if a similar disaster were to occur in the future affecting any of the cities in which we have major operations, our business could be materially and adversely affected. In April 2009, a new strain of influenza A virus subtype H1N1, commonly known as “swine flu,” was first discovered in North America and quickly spread to other parts of the world, including China. In early June 2009, the World Health Organization declared the outbreak to be a pandemic. Any outbreak of similar epidemics in China, including severe acute respiratory syndrome, could require temporary closure of our learning centers and have a material and adverse effect on our business operations.
In the course of preparing our consolidated financial statements, a material weakness in our internal control over financial reporting was identified. If we fail to maintain an effective system of internal control over financial reporting, we may be unable to accurately report our financial results or prevent fraud, and investor confidence and the market price of our ADSs may be adversely affected.
Our reporting obligations as a public company will place a significant strain on our management, operational and financial resources and systems for the foreseeable future. Prior to this offering, we have been a private company and have had limited accounting personnel and other resources with which to address our internal control over financial reporting. We and our independent registered public accounting firm, in connection with the preparation and external audit of our consolidated financial statements as of and for the fiscal year ended February 28, 2010, identified a material weakness in our internal control over financial reporting. The material weakness identified related to insufficient accounting personnel with appropriate U.S. GAAP knowledge. We have not undertaken a comprehensive assessment and our independent registered public accounting firm has not conducted an audit of our internal control over financial reporting. Had we performed a formal assessment of our internal control over financial reporting or had our independent registered public accounting firm performed an audit of our internal control over financial reporting, additional material weakness and deficiencies may have been identified. A “material weakness” is a deficiency, or a combination of deficiencies, in internal control over financial reporting, such that there is a reasonable possibility that a material misstatement of the company’s annual or interim financial statements will not be prevented or detected on a timely basis.
We have taken measures and plan to continue to take measures to remedy these deficiencies. However, the implementation of these measures may not fully address the control deficiencies in our internal control over financial reporting. Our failure to address any control deficiency could result in inaccuracies in our financial statements and could also impair our ability to comply with applicable financial reporting requirements and related regulatory filings on a timely basis. Moreover, effective internal control over financial reporting is important to prevent fraud. As a result, our business, financial condition, results of operations and prospects, as well as the trading price of our ADSs, may be materially and adversely affected.
Upon completion of this offering, we will become subject to the Sarbanes-Oxley Act of 2002. Section 404 of the Sarbanes-Oxley Act requires that we include a report from management on the effectiveness of our internal control over financial reporting in our annual report onForm 20-F beginning with our annual report for the fiscal year ending February 29, 2012. In addition, beginning at the same time, our independent registered public accounting firm must report on the effectiveness of our internal control over financial reporting. Our management and our independent registered public accounting firm may conclude that our internal control over financial reporting is not effective. This could adversely impact the market price of
20
Table of Contents
our ADSs due to a loss of investor confidence in the reliability of our reporting processes. We will need to incur significant costs and use significant management and other resources in order to comply with Section 404 of the Sarbanes-Oxley Act.
Implementation of the new labor laws in China may adversely affect our business operations.
On June 29, 2007, the Chinese government promulgated a new labor contract law which became effective on January 1, 2008, and subsequently issued the implementation rules of the new labor contract law. Pursuant to the new law, employers are subject to stricter requirements in terms of signing labor contracts, fixing compensation levels, setting lengths of employees’ probation periods and unilaterally terminating labor contracts. The new law and the related implementation rules impose greater liabilities on employers and may significantly increase the costs to an employer if it decides to reduce its workforce. In the event we decide to significantly reduce our workforce, the new labor contract law could adversely affect our ability to downsize based on business needs or to do so in a timely and cost-effective manner, which in turn may materially and adversely affect our financial condition and results of operations.
We may be classified as a passive foreign investment company under US tax law, which could result in adverse U.S. federal income tax consequences to U.S. holders of our ADSs.
Depending upon the value of our assets based on the market value of our common shares and ADSs and the nature of our assets and income over time, we could be classified as a passive foreign investment company or PFIC, for U.S. federal income tax purposes. Based on our current income and assets and projections as to the value of our common shares and ADSs pursuant to this offering, we do not expect to be classified as a PFIC for the current taxable year. While we do not anticipate becoming a PFIC for the current taxable year, fluctuations in the market price of our ADSs or common shares may cause us to become a PFIC for the current or any subsequent taxable year. We will make a separate determination for each taxable year as to whether we are a PFIC (after the close of each taxable year) and disclose such determination in our annual reports onForm 20-F to be filed with the SEC.
We will be classified as a PFIC for any taxable year if either (i) at least 75% of our gross income for the taxable year is passive income or (ii) at least 50% of the value of our assets (determined on the basis of a quarterly average) is attributable to assets that produce or are held for the production of passive income. Although the law in this regard is unclear, we treat Xueersi Education, Xueersi Network and their respective subsidiaries as being owned by us for United States federal income tax purposes, not only because we control their management decisions but also because we are entitled to substantially all of the economic benefits associated with these entities, and, as a result, we consolidate these entities’ operating results in our consolidated U.S. GAAP financial statements. If it were determined, however, that we are not the owner of Xueersi Education, Xueersi Network and their respective subsidiaries for United States federal income tax purposes, we would likely be treated as a PFIC for our taxable year ending on February 28, 2011 and any subsequent taxable year. Because of the uncertainties in the application of the relevant rules and because PFIC status is a factual determination made annually after the close of each taxable year on the basis of the composition of our income and the value of our active versus passive assets, there can be no assurance that we will not be a PFIC for the taxable year ending on February 28, 2011 or any future taxable year. The overall level of our passive assets will also be affected by how, and how quickly, we spend our liquid assets and the cash raised in this offering. Under circumstances where we determine not to deploy significant amounts of cash for active purposes, our risk of becoming classified as a PFIC may substantially increase.
If we were to be or become classified as a PFIC, a U.S. Holder (as defined in “Taxation—Material United States Federal Income Tax Considerations—General”) may be subject to reporting requirements and may incur significantly increased United States income tax on gain recognized on the sale or other disposition of the ADSs or common shares and on the receipt of distributions on the ADSs or common shares to the extent such gain or distribution is treated as an “excess distribution” under the United States federal income tax rules. Further, if we were a PFIC for any year during which a U.S. Holder held our ADSs or common shares, we generally would continue to be treated as a PFIC for all succeeding years during which such U.S. Holder held our ADSs or common shares. You are urged to consult your tax advisor concerning the
21
Table of Contents
United States federal income tax consequences of acquiring, holding, and disposing of ADSs or common shares if we are or become classified as a PFIC. For more information see “Taxation—Material United States Federal Income Tax Considerations—PFIC Considerations.”
We have granted and will continue to grant restricted shares, share options and other share-based awards in the future, which may materially reduce our net income.
We adopted a share incentive plan in 2010 that permits granting of options to purchase our Class A common shares, restricted shares and restricted share units under the plan. The maximum aggregate number of Class A common shares that may be issued pursuant to all awards under our share incentive plan is 18,750,000. As of the date of this prospectus, we have granted 5,419,500 restricted shares under our share incentive plan to our employees. As a result of these grants and potential future grants under the plan, we have incurred and will continue to incur share-based compensation expenses. We had share-based compensation expenses of $0.9 million for the six months ended August 31, 2010. As of August 31, 2010, the unrecognized compensation expenses related to the non-vested restricted shares amounted to $18.3 million, which will be recognized over vesting periods up to 4 years. Expenses associated with share-based compensation awards granted under our share incentive plan may materially reduce our future net income. However, if we limit the size of grants under our share incentive plan to minimize share-based compensation expenses, we may not be able to attract or retain key personnel.
Risks Related to Our Corporate Structure
If the PRC government determines that the agreements that establish the structure for operating our business in China are not in compliance with applicable PRC laws and regulations, we could be subject to severe penalties.
PRC laws and regulations currently require any foreign entity that invests in the education business in China to be an educational institution with relevant experience in providing education services outside China. Our Cayman Islands holding company is not an educational institution and does not provide education services. We conduct our education business in China through contractual arrangements with Xueersi Education and Xueersi Network and their respective subsidiaries, schools and shareholders. Xueersi Education and Xueersi Network are directly owned by four of our directors or officers who are citizens of the PRC. To comply with PRC laws and regulations, we rely on a series of contractual arrangements entered into among TAL Beijing, Xueersi Network, Xueersi Education and their respective shareholders, subsidiaries and schools to conduct most of our tutoring services in China. We have been and are expected to continue to be dependent on our affiliated entities in China to operate our education business until we qualify for direct ownership of educational businesses in China. Pursuant to our contractual arrangements with our affiliated entities, we, through our wholly owned subsidiaries in China, provide exclusive teaching support, technical service support and other services to our affiliated entities in exchange for payments from them. In addition, we have entered into agreements with Xueersi Education and Xueersi Network, and each of their respective shareholders, which provide us with the ability to effectively control Xueersi Education and Xueersi Network and their respective existing and future subsidiaries and schools.
If the corporate structure and contractual arrangements through which we conduct our business in China are found to be in violation of any existing or future PRC laws or regulations, or if we fail to obtain or maintain any of the required permits or approvals, we would be subject to potential actions by the relevant PRC regulatory authorities with broad discretions, which actions could include:
| • | revoking the business and operating licenses of our PRC subsidiaries and affiliated entities; | |
| • | restricting or prohibiting related party transactions between our PRC subsidiaries and affiliated entities; | |
| • | imposing fines or other requirements with which we or our PRC subsidiaries and affiliated entities may find difficult or impossible to comply; |
22
Table of Contents
| • | requiring us or our PRC subsidiaries and affiliated entities to restructure the relevant ownership structure or operations; and | |
| • | restricting or prohibiting the use of any proceeds from our additional public offering to finance our business and operations in China. |
The imposition of any of these penalties could result in a material adverse effect on our ability to conduct our business.
We rely on contractual arrangements with our affiliated entities for our China operations, which may not be as effective in providing operational control as direct ownership.
We have relied and expect to continue to rely on contractual arrangements with our affiliated entities to operate our education business. For a description of these contractual arrangements, see “Our Corporate History and Structure—Contractual Arrangements with Our Consolidated Affiliated Entities.” These contractual arrangements may not be as effective in providing us with control over these affiliated entities as direct ownership. If we had direct ownership of Xueersi Education and Xueersi Network, we would be able to exercise our rights as a shareholder to effect changes in the board of directors of Xueersi Network or Xueersi Education, which in turn could effect changes, subject to any applicable fiduciary obligations, at the management level. However, under the current contractual arrangements, we rely on the performance by our affiliated entities and their respective shareholders of their obligations under the contracts to exercise control over our affiliated entities. In addition, we may not be able to renew these contracts with Xueersi Network, Xueersi Education and their respective subsidiaries or shareholders if the beneficial owners of Xueersi Network or Xueersi Education do not act in the best interests of our company when conflicts of interest arise. Therefore, our contractual arrangements with our affiliated entities may not be as effective in ensuring our control over our China operations as direct ownership would be.
Any failure by our affiliated entities or their respective shareholders to perform their obligations under our contractual arrangements with them would have a material adverse effect on our business and financial condition.
If Xueersi Network, Xueersi Education or any of their respective subsidiaries or schools or any of their respective shareholders fails to perform its obligations under the contractual arrangements, we may have to incur substantial costs and resources to enforce our rights under the contracts, and rely on legal remedies under the PRC law, including seeking specific performance or injunctive relief and claiming damages, which may not be effective. For example, if the shareholders of Xueersi Network or Xueersi Education were to refuse to transfer their equity interest in Xueersi Network or Xueersi Education to us or our designee when we exercise the call option pursuant to these contractual arrangements, or if they were otherwise to act in bad faith toward us, then we may have to take legal actions to compel them to perform their contractual obligations.
All the material agreements under our contractual arrangements are governed by the PRC law and provide for the resolution of disputes under the agreements through arbitration in Beijing. Accordingly, these contracts would be interpreted in accordance with the PRC law and any disputes would be resolved in accordance with PRC legal procedures. The legal system in the PRC is not as developed as some other jurisdictions, such as the United States. As a result, uncertainties in the PRC legal system could limit our ability to enforce these contractual arrangements. Under PRC law, rulings by arbitrators are final, parties cannot appeal the arbitration results in courts, and the prevailing parties may only enforce the arbitration awards in PRC courts through arbitration award recognition proceedings, which would incur additional expenses and delay. In the event we are unable to enforce these contractual arrangements, we may not be able to exert effective control over our affiliated entities, and our ability to conduct our business may be negatively affected.
23
Table of Contents
The beneficial owners of Xueersi Education and Xueersi Network may have potential conflicts of interest with us, which may materially and adversely affect our business and financial condition.
The four beneficial owners of Xueersi Education and Xueersi Network are also beneficial owners, directors or officers of TAL Group. Among them, Mr. Bangxin Zhang and Mr. Yundong Cao are directors of TAL Group and also directors of Xueersi Education and Xueersi Network. Currently, these four individuals beneficially own an aggregate of 76% of the outstanding share capital of TAL Group on an as-converted basis. Upon the completion of this offering, these four shareholders will beneficially own an aggregate of 63.8% of the outstanding share capital of TAL Group, representing 74.6% of our total voting power, assuming no exercise of the over-allotment option granted to the underwriters. As such, the beneficial owners of Xueersi Education and Xueersi Network may have potential conflicts of interest with us. We cannot assure you that when conflicts of interest arise, any or all of these individuals will act in the best interests of our company or such conflicts will be resolved in our favor. In addition, these individuals may breach, or cause our affiliated entities to breach, or refuse to renew, the existing contractual arrangements we have with them and our affiliated entities. Currently, we do not have any arrangements to address potential conflicts of interest between these individuals and our company. We rely on these individuals to abide by the laws of the Cayman Islands and China, which provide that directors owe a fiduciary duty to the company that requires them to act in good faith and in the best interests of the company and not to use their positions for personal gains. If we cannot resolve any conflict of interest or dispute between us and the beneficial owners of Xueersi Network or Xueersi Education, we would have to rely on legal proceedings, which could result in disruption of our business and subject us to substantial uncertainty as to the outcome of any such legal proceedings.
Our affiliated entities may be subject to significant limitations on their ability to operate private schools or make payments to related parties, or otherwise be materially and adversely affected by changes in PRC laws governing private education providers.
The principal regulations governing private education in China are The Law for Promoting Private Education (2003) and The Implementation Rules for The Law for Promoting Private Education (2004). Under these regulations, a private school may elect to be a school that does not require reasonable returns or a school that requires reasonable returns. At the end of each fiscal year, every private school is required to allocate a certain amount to its development fund for the construction or maintenance of the school or procurement or upgrade of educational equipment. In the case of a private school that requires reasonable returns, this amount shall be no less than 25% of annual net balance of the school, while in the case of a private school that does not require reasonable returns, this amount shall be equivalent to no less than 25% of the annual increase in the net assets of the school, if any. A private school that requires reasonable returns must publicly disclose such election and additional information required under the regulations. A private school shall consider factors such as the school’s tuition, ratio of the funds used for education-related activities to the course fees collected, admission standards and educational quality when determining the percentage of the school’s net income that would be distributed to the investors as reasonable returns. However, none of the current PRC laws and regulations provides a formula or guidelines for determining “reasonable returns.” In addition, none of the current PRC laws and regulations sets forth clear requirements or restrictions on a private school’s ability to operate its education business based on such school’s status as a school that requires reasonable returns or a school that does not require reasonable returns.
Our schools are registered as schools that require reasonable returns in some cities and as schools that do not require reasonable returns in others. Unlike typical schools in China’s K-12 system which grant diplomas to students upon graduation, we provide after-school tutoring services and do not grant any diploma or certification to our students. However, the current PRC laws and regulations governing private education may be amended or replaced by new laws and regulations that (i) impose significant limitations on the ability of our schools to operate their business, charge course fees or make payments to related parties for services, (ii) specify the formula for calculating “reasonable returns,” or (iii) change the preferential tax treatment policies applicable to private schools. We cannot predict the timing and effects of any such amendments or new laws and regulations. Changes in PRC laws and regulations governing private education could materially and adversely affect our business prospects and results of operations.
24
Table of Contents
Contractual arrangements our subsidiaries have entered into with our affiliated entities may be subject to scrutiny by the PRC tax authorities and a finding that we or our affiliated entities owe additional taxes could substantially reduce our consolidated net income and the value of your investment.
Under PRC laws and regulations, arrangements and transactions among related parties may be subject to audit or challenge by the PRC tax authorities within ten years after the taxable year when the transactions are conducted. We could face material and adverse tax consequences if the PRC tax authorities determine that the contractual arrangements between our wholly owned subsidiaries in China and our affiliated entities do not represent an arm’s-length price and consequently adjust our affiliated entities’ income in the form of a transfer pricing adjustment. A transfer pricing adjustment could, among other things, result in a reduction, for PRC tax purposes, of expense deductions recorded by our affiliated entities, which could in turn increase their tax liabilities. In addition, the PRC tax authorities may impose late payment fees and other penalties to our affiliated entities for unpaid taxes. Our consolidated net income may be materially and adversely affected if our affiliated entities’ tax liabilities increase or if they are subject to late payment fees or other penalties.
If any of our PRC subsidiaries, affiliated entities and their subsidiaries becomes the subject of a bankruptcy or liquidation proceeding, we may lose the ability to use and enjoy certain important assets, which could reduce the size of our operations and materially and adversely affect our business, ability to generate revenue and the market price of our ADSs.
We currently conduct our operations in China through contractual arrangements with our affiliated entities. As part of these arrangements, our affiliated entities hold operating permits and licenses and some of the assets that are important to the operation of our business. If any of these entities goes bankrupt and all or part of their assets become subject to liens or rights of third-party creditors, we may be unable to continue some or all of our business activities, which could materially and adversely affect our business, financial condition and results of operations. If any of our affiliated entities undergoes a voluntary or involuntary liquidation proceeding, its shareholders or unrelated third-party creditors may claim rights to some or all of these assets, thereby hindering our ability to operate our business, which could materially and adversely affect our business, our ability to generate revenue and the market price of our ADSs.
Risks Related to Doing Business in China
Uncertainties with respect to the PRC legal system could have a material adverse effect on us.
The PRC legal system is a civil law system based on written statutes. Unlike the common law system, prior court decisions in a civil law system may be cited for reference but have limited precedential value. Since 1979, PRC legislation and regulations have significantly enhanced the protections afforded to various forms of foreign investments in China. However, since these laws and regulations are relatively new and the PRC legal system continues to rapidly evolve, the interpretations of many laws, regulations and rules are not always consistent, and enforcement of these laws, regulations and rules involve uncertainties, which may limit the available legal protections. In addition, the PRC administrative and court authorities have significant discretion in interpreting and implementing or enforcing statutory rules and contractual terms, and it may be more difficult to predict the outcome of administrative and court proceedings and the level of legal protection we may enjoy in the PRC than under some more developed legal systems. These uncertainties may affect our judgment on the relevance of legal requirements and our decisions on the measures and actions to be taken to fully comply therewith and may affect our ability to enforce our contractual or tort rights. In addition, the regulatory uncertainties may be exploited through unmerited legal actions or threats in an attempt to extract payments or benefits from us. Such uncertainties may therefore increase our operating expenses and costs, and materially and adversely affect our business and results of operations.
Uncertainties with respect to PRC regulatory restrictions on after-school services could have a material adverse effect on us.
In 2009, the Ministry of Education, together with a few other PRC government agencies, issued implementation rules on administration of education-related fee collection, which provide, among other things,
25
Table of Contents
that schools that are part of the compulsory education system are not allowed to charge students additional fees for any type of after-school tutoring classes, and that public schools and their teachers, whether or not in cooperation with private schools, are prohibited from offering any type of after-school tutoring or training classes for a fee outside the school. Private schools, which are not part of the compulsory education system, generally are permitted to offer after-school tutoring services pursuant to their private school operating permits issued by the relevant PRC governmental authorities pursuant to the Law for Promoting Private Education and implementation rules promulgated thereunder. However, several provincial government agencies issued notices or rules applicable in their respective provinces expressly prohibiting even private schools from offering after-school tutoring classes to primary and secondary school students. Among the areas where we offer after-school tutoring services, local governments in Shanghai and Tianjin issued notices in 2004 and 2005, respectively, prohibiting private schools from offering after-school tutoring services to primary and secondary school students. Nevertheless, we are not aware of any instances in Shanghai or Tianjin where the governmental authorities took actions enforcing the aforementioned notices; nor have we received any notices, warnings or inquiries from these governmental authorities with respect to our tutoring services. Net revenues attributable to tutoring services in Shanghai and Tianjin accounted for less than 10% of our total net revenues for the fiscal year ended February 28, 2010 and the six months ended August 31, 2010. The aforementioned notices do not provide any monetary penalties for violations and thus we are not able to quantify the penalties that we may be subject to if we are deemed not to be in compliance with these notices. We are not aware of any imminent risks in connection with the aforementioned notices. However, since PRC regulatory authorities have significant discretion in interpreting and implementing rules and regulations and that regulatory enforcements can be inconsistent, we cannot assure you that we will not in the future be subject to the above mentioned regulations, fined or otherwise penalized by government authorities for offering such classes, in which case our business and operations could be materially and adversely affected.
We are required to obtain various operating licenses and permits and to make registrations and filings for our after-school tutoring services in China; failure to comply with these requirements may materially adversely affect our business operations.
We are required to obtain and maintain various licenses and permits and fulfill registration and filing requirements in order to conduct and operate our after-school tutoring business. For instance, to establish and operate a school to provide after-school tutoring services, we are required to obtain a private school operating permit and to make necessary filings for each learning center with the Ministry of Education and the Ministry of Civil Affairs or their local bureaus. As of the date of this prospectus, 26 of our 109 centers in operation may be subject to fines or other penalties due to their failure to obtain the requisite operating permits from, or make requisite filings with, the relevant governmental authorities. These 26 learning centers in the aggregate accounted for 15.3% of our total net revenues for the fiscal year ended February 28, 2010. We were unable to obtain certain requisite permits or make certain filings in some districts in Beijing because the local authorities discontinued granting permits or accepting filings for administrative reasons for a period of time. Some of these local authorities have recently begun to accept applications and filings, and we are in the process of preparing filings and applying for permits for these learning centers and expect to complete and obtain most filings and permits in the near future. In a few other cases, we were not able to obtain certain permits because we have not yet met all the detailed requirements set forth by the local authorities for granting the permits, and we are taking steps to meet these requirements. We intend to ensure compliance with applicable rules and regulations in establishing new learning centers. Our business and legal teams are required to follow an internal guideline to obtain all requisite permits and make necessary filings on a timely basis for our new learning centers. However, there is no assurance that our efforts will result in full compliance given the significant amount of discretion the PRC authorities have in interpreting, implementing or enforcing rules and regulations and due to other factors beyond our control. Although we have not been subject to any material fines or other penalties in relation to any non-compliance of licensing requirements in the past, if we fail to cure any non-compliance in a timely manner, we may be subject to fines, confiscation of the gains derived from our noncompliant operations or the suspension of our noncompliant operations, which may materially and adversely affect our business and results of operations.
26
Table of Contents
If the relevant PRC regulatory authorities subsequently determine that personalized premium services must be operated through registered schools or non-foreign-invested PRC companies, our personalized premium services business may be exposed to increased risks associated with the contractual arrangements.
We currently offer our personalized premium tutoring services in Beijing through Huanqiu Zhikang, our wholly owned subsidiary, which is a foreign-invested company under PRC laws and regulations. Huanqiu Zhikang’s sole business is offering personalized premium tutoring services in Beijing, which contributed less than 1% of our total net revenues for the fiscal year ended February 28, 2010. In Shanghai, our personalized premium tutoring services are offered through our affiliated schools pursuant to the local legal requirements. We offer the personalized premium tutoring services in Beijing through Huanqiu Zhikang, as opposed to through our PRC affiliated entities, primarily because we believe thatone-on-one tutoring services fall within the scope of “for-profit training activities” and are not “educational activities” under the jurisdiction of the Beijing Municipal Education Commission, based on telephone inquiries we and our PRC counsel made to the Beijing Municipal Education Commission, which is the local bureau of the Ministry of Education in Beijing. In addition, Huanqiu Zhikang has obtained a business license from Beijing Administration of Industry and Commerce, expressly permitting Huanqiu Zhikang to conduct “educational consulting services,” which we believe covers our personalized premium services in Beijing. We also believe that providing personalized premium services through Huanqiu Zhikang, a wholly owned subsidiary, enhances our effective control over such business and improves management efficiency. To the extent we view that the benefits resulting from our current structure is greater than the risks associated with the legal uncertainties, we intend to continue to offer personalized premium services through Huanqiu Zhikang in Beijing in our future expansion plan for these services.
However, the differences between “educational activities,” on the one hand, and “for-profit training activities” and “educational consulting services,” on the other hand, remain unclear under the PRC laws and regulations. The Law for Promoting Private Education provides that “educational activities,” which are required to be conducted through schools or educational institutions, shall be regulated by the Ministry of Education whereas “for-profit training activities” shall be regulated by the Administration of Industry and Commerce in accordance with separate regulations to be issued by the State Council. To date, the State Council has not promulgated any regulations with respect to “for-profit training activities” and in practice, regulators in different local jurisdictions may have different views and administrative policies onone-on-one tutoring activities. Therefore, we cannot be certain that the relevant government authorities will reach the same conclusion in the future as we have regardingone-on-one personalized premium tutoring services.
If the relevant PRC regulatory authorities subsequently determine that personalized premium services must be operated through registered schools or non-foreign-invested PRC companies, we may be required to restructure our operations to offer personalized premium services through our affiliated schools, which may expose our personalized premium services business to increased risks associated with the contractual arrangements with affiliated entities. See “—Risks Related to Our Corporate Structure.” If we fail to cure our non-compliance in a timely manner, we may be subject to fines of up to RMB100,000, suspension of such operations or other penalties, which may materially and adversely affect our business and results of operations.
Adverse changes in political and economic policies of the PRC government could have a material adverse effect on the overall economic growth of China, which could reduce the demand for our products and services and materially and adversely affect our competitive position.
All of our business operations are conducted in China and all of our sales are made in China. Accordingly, our business, financial condition, results of operations and prospects are affected significantly by economic, political and legal developments in China. The economy in China differs from the economies of most developed countries in many respects, including:
| • | degree of government involvement; | |
| • | level of development; |
27
Table of Contents
| • | rate of economic growth; | |
| • | control of foreign exchange rates and currency conversion; | |
| • | access to financing; and | |
| • | allocation of resources. |
Although China has been transitioning from a planned economy to a more market-oriented economy since the 1970s, the PRC government continues to exercise significant control over China’s economy through resource allocation, foreign exchange control, monetary policies and administrative regulations of certain industries and entities. In recent years, the PRC government has implemented measures emphasizing the reliance on market forces to promote economic reform, reduce state ownership of productive assets and establish corporate governance structures in business enterprises. Nevertheless, a substantial portion of the productive assets in China are still owned by the PRC government. The continued control of these assets and other aspects of the national economy by the government could materially and adversely affect our business.
While the Chinese economy has grown significantly in the past 30 years, the growth has been uneven geographically among various sectors of the economy, and during different periods. We cannot assure you that the Chinese economy will continue to grow, or that if there is growth, such growth will be steady and uniform, or that if there is a slowdown, such slowdown will not have a negative effect on our business.
We may rely on dividends paid by our subsidiaries for our cash needs, and any limitation on the ability of our subsidiaries to make payments to us could limit our ability to pay dividends to holders of our ADSs and common shares.
We are a holding company and conduct substantially all of our business through our operating subsidiaries and consolidated affiliated entities, which are limited liability companies established in China. We may rely on dividends paid by our subsidiaries for our cash needs, including the funds necessary to pay dividends and other cash distributions to our shareholders, to service any debt we may incur and to pay our operating expenses. The payment of dividends by entities organized in China is subject to limitations. In particular, regulations in China currently permit payment of dividends only out of accumulated profits as determined in accordance with PRC accounting standards and regulations. PRC companies are also required to set aside at least 10% of their after-tax profit based on PRC accounting standards each year to their general reserves until the accumulative amount of such reserves reaches 50% of their registered capital. These reserves are not distributable as cash dividends. In addition, PRC companies may allocate a portion of their after-tax profit to their staff welfare and bonus fund at the discretion of their boards of directors. Our PRC subsidiaries and VIEs historically have not allocated any of their after-tax profits to staff welfare and bonus funds, since there is no legal requirement to do so, but they may nevertheless decide to set aside such funds in the future. There is no maximum amount of after-tax profit that a company may contribute to such funds. Moreover, each of our affiliated schools is required to allocate certain amount of profits to its development fund for the construction or maintenance of school facilities or procurement or upgrade of educational equipment at the end of each fiscal year. See “Regulation—Regulation on Private Education—The Law for Promoting Private Education (2003) and the Implementation Rules for the Law for Promoting Private Education (2004)” for a discussion on the requirements for private schools to make allocations to school development funds. Any direct or indirect limitation on the ability of our PRC subsidiaries to distribute dividends and other distributions to us could materially and adversely limit our ability to make investments or acquisitions at the holding company level, pay dividends or otherwise fund and conduct our business.
PRC regulation of loans and direct investment by offshore holding companies to PRC entities may limit the use of the proceeds we receive from this offering for our expansion or operations.
In utilizing the proceeds we receive from this offering in the manner described in “Use of Proceeds,” as an offshore holding company with PRC subsidiaries, we may (i) make additional capital contributions to our PRC subsidiaries, (ii) establish new PRC subsidiaries and make capital contributions to these new PRC subsidiaries, (iii) make loans to our PRC subsidiaries or our VIEs, or (iv) acquire offshore entities with
28
Table of Contents
business operations in China in an offshore transaction. However, most of these uses are subject to PRC regulations and approvals. For example:
| • | capital contributions to our subsidiaries in China, whether existing ones or newly established ones, must be approved by the PRC Ministry of Commerce or its local bureaus; | |
| • | loans by us to our subsidiaries in China, each of which is a foreign-invested enterprise, to finance their activities cannot exceed statutory limits and must be registered with the PRC State Administration of Foreign Exchange, or SAFE, or its local bureaus; | |
| • | loans by us to our VIEs and their respective subsidiaries, which are domestic PRC entities, must be approved by the National Development and Reform Commission and must also be registered with SAFE or its local bureaus. |
In addition, on August 29, 2008, SAFE promulgated Circular 142, a notice regulating the conversion by a foreign-invested company of its capital contribution in foreign currency into Renminbi. It requires that Renminbi converted from foreign currency-denominated capital of a foreign-invested enterprise may only be used for purposes within the business scope approved by the relevant government authority and may not be used to make equity investments in China, unless specifically provided otherwise. Moreover, the approved use of such Renminbi funds may not be changed without approval from SAFE. Renminbi funds converted from foreign exchange may not be used to repay loans in Renminbi if the proceeds of such loans have not yet been used. Any violation of Circular 142 may result in severe penalties, including substantial fines. We expect that if we convert the net proceeds from this offering into Renminbi pursuant to Circular 142, our use of Renminbi funds will be for purposes within the approved business scope of our PRC subsidiaries. However, we may not be able to use such Renminbi funds to make equity investments in the PRC through our PRC subsidiaries.
We expect that the PRC regulations of loans and direct investment by offshore holding companies to PRC entities may continue to limit our use of proceeds of this offering. There are no costs associated with registering loans or capital contributions with relevant PRC governmental authorities, other than nominal processing charges. Under PRC laws and regulations, the PRC governmental authorities are required to process such approvals or registrations or deny our application within a prescribed period which is usually less than 90 days. The actual time taken, however, may be longer due to administrative delay. We cannot assure you that we will be able to obtain these government registrations or approvals on a timely basis, if at all, with respect to our future plans to use the U.S. dollar proceeds we receive from this offering for our expansion and operations in China. If we fail to receive such registrations or approvals, our ability to use the proceeds of this offering and to capitalize our PRC operations may be negatively affected, which could materially and adversely affect our liquidity and ability to fund and expand our business.
PRC regulations relating to the establishment of offshore special purpose companies by PRC residents may subject our PRC resident beneficial owners to personal liability and limit our ability to acquire PRC companies or to inject capital into our PRC subsidiary, limit our PRC subsidiary’s ability to distribute profits to us, or otherwise materially and adversely affect us.
The State Administration of Foreign Exchange issued Circular 75, requiring PRC residents, including both legal persons and natural persons, to register with the relevant local branch of the State Administration of Foreign Exchange before establishing or controlling any company outside of China, referred to as an “offshore special purpose company,” for the purpose of raising funds from overseas to acquire assets of, or equity interest in, PRC companies. In addition, any PRC resident that is the beneficial owner of an offshore special purpose company is required to amend his or her registration with the local branch of the State Administration of Foreign Exchange, with respect to that offshore special purpose company in connection with any increase or decrease in its capital, transfer of shares, merger, division, equity investment or creation of any security interest over any assets located in China. Any failure to comply with the above registration requirements could result in PRC subsidiaries being prohibited from distributing their profits and proceeds from any reduction in capital, share transfer or liquidation to their offshore parent companies, offshore parent companies being restricted in their ability to contribute additional capital into their PRC subsidiaries, and other liabilities under PRC laws for evasion of foreign exchange restrictions.
29
Table of Contents
We believe that all of our shareholders who are PRC citizens or residents have completed their required registrations with SAFE, or are otherwise in the process of registering with SAFE. However, we may not at all times be fully aware or informed of the identities of all of our beneficial owners who are PRC citizens or residents, and we may not always be able to compel our beneficial owners to comply with Circular 75; nor can we ensure you that their registrations, if they choose to apply, will be successful. The failure or inability of our PRC resident beneficial owners to make any required registrations or comply with these requirements may subject such beneficial owners to fines and legal sanctions and may also limit our ability to contribute additional capital into or provide loans (including using the proceeds from this offering) to our China operations, limit our PRC subsidiary’s ability to pay dividends or otherwise distribute profits to us, or otherwise materially and adversely affect us.
Any requirement to obtain prior approval from the China Securities Regulatory Commission, or the CSRC, could delay this offering and a failure to obtain this approval, if required, could have a material adverse effect on our business, operating results, reputation and trading price of our ADSs.
On August 8, 2006, six PRC regulatory agencies, namely, the Ministry of Commerce, the State Assets Supervision and Administration Commission, the State Administration for Taxation, the State Administration for Industry and Commerce, the CSRC, and SAFE, jointly adopted the Regulations on Mergers and Acquisitions of Domestic Enterprises by Foreign Investors, or the M&A Rule, which became effective on September 8, 2006. The M&A Rule purports to require, among other things, offshore special purpose vehicles, or SPVs, formed for the purpose of acquiring PRC domestic companies and controlled by PRC companies or individuals, to obtain the approval of the CSRC prior to publicly listing their securities on an overseas stock exchange. While the application of the M&A Rule remains unclear, we believe, based on the advice of our PRC counsel, Tian Yuan Law Firm, that CSRC approval is not required in the context of this offering as we are not a special purpose vehicle formed for the purpose of acquiring domestic companies that are controlled by PRC individual shareholders, as we acquired contractual control of, rather than equity interest in, our domestic affiliated entities. However, we cannot assure you that the relevant PRC government agency, including the CSRC, would reach the same conclusion as our PRC counsel. If the CSRC or other PRC regulatory agency subsequently determines that we need to obtain the CSRC’s approval for this offering, we may face sanctions by the CSRC or other PRC regulatory agencies. In such event, these regulatory agencies may impose fines and penalties on our operations in the PRC, limit our operating privileges in the PRC, delay or restrict the repatriation of the proceeds from this offering into the PRC, or take other actions that could have a material adverse effect on our business, financial condition, results of operations, and prospects, as well as the trading price of our ADSs. The CSRC or other PRC regulatory agencies may also take actions requiring us to halt this offering before settlement and delivery of the ADSs offered by this prospectus.
The discontinuation of any of the preferential tax treatments currently available to us in China could adversely affect our overall results of operations.
Under the PRC Enterprise Income Tax Law, or the EIT Law, which became effective on January 1, 2008, the statutory enterprise income tax rate is 25%, except where a special preferential rate applies.
Our affiliated entity, Xueersi Education, was qualified as a “High and New Technology Enterprise,” under the EIT Law effective January 1, 2008 and therefore was qualified for a preferential tax rate of 15%. In addition, since Xueersi Education is located in a high and new technology industrial zone in Beijing and qualified as a High and New Technology Enterprise, it was entitled to a three-year exemption from the enterprise income tax from calendar year 2006 to 2008 and a further tax reduction to a rate of 7.5% from calendar year 2009 to 2011. Our wholly owned subsidiary, TAL Beijing, was qualified as a “Newly Established Software Enterprise” under the EIT Law and therefore entitled to a two-year exemption from the enterprise income tax from calendar year 2009 to 2010 and a further tax reduction to 50% of the applicable rate from calendar year 2011 to 2013. Our affiliated entities, Xueersi Network and Beijing Haidian District Xueersi Training School, were entitled to a one-year tax exemption in calendar year 2007 as newly established companies in that year.
30
Table of Contents
On April 21, 2010, the State Administration of Taxation issued Circular 157,Further Clarification on Implementation of Preferential EIT Rate during Transition Periods, or Circular 157. Circular 157 seeks to provide additional guidance on the interaction of certain preferential tax rates under the transitional rules of the EIT Law. Prior to Circular 157, we interpreted the law to mean that if a “high and new technology enterprise strongly supported by the state” or “High and New Technology Enterprise” was in a tax holiday period that provides for“2-year exemption plus3-year half rate” or“5-year exemption plus5-year half rate” or other tax exemptions and reductions, where it was entitled to a 50% reduction in the tax rate and was also entitled to a 15% rate of tax due to its High and New Technology Enterprise status under the EIT Law, then it was entitled to pay tax at the rate of 7.5%. Circular 157 appears to have the effect that such an entity is entitled to pay tax at the lower of 15% and 50% of the standard PRC tax rate, which is currently 25%. It is unclear whether Circular 157 would apply retrospectively but we understand that the State Administration of Taxation has recently taken the position that Circular 157 applies only to tax years commencing from January 1, 2010.
Based on the interpretation of Circular 157 from the relevant local tax authority, we believe that entities that are qualified for“3-year exemption plus3-year half rate” tax holiday as High and New Technology Enterprises and are registered in the Zhongguancun High and New Technology Industrial Zone of Beijing will continue to pay income tax at a rate of 7.5%. Since Xueersi Education enjoys“3-year exemption plus3-year half rate” and is a High and New Technology Enterprise registered in the Zhongguancun High and New Technology Industrial Zone of Beijing, we believe that Xueersi Education will continue to pay income tax at the rate of 7.5%. We cannot assure you, however, that the tax authorities will not in the future change their position on our preferential tax treatments. The discontinuation of our preferential tax treatments may materially increase our future tax liabilities.
Under the EIT Law, we may be classified as a “resident enterprise” of China. Such classification could result in unfavorable tax consequences to us and our non-PRC shareholders.
Under the EIT Law, an enterprise established outside of China with “de facto management body” within China is considered a “resident enterprise,” meaning that it can be treated in a manner similar to a Chinese enterprise for enterprise income tax purposes, although the dividends paid to one resident enterprise from another may qualify as “tax-exempt income.” The implementing rules of the EIT Law define de facto management as “substantial and overall management and control over the production and operations, personnel, accounting, and properties” of the enterprise. A circular issued by the State Administration of Taxation on April 22, 2009 provides that a foreign enterprise controlled by a PRC company or a PRC company group will be classified as a “resident enterprise” with its “de facto management body” located within China if all of the following requirements are satisfied: (i) the senior management and core management departments in charge of its daily operations function are mainly in the PRC; (ii) its financial and human resources decisions are subject to determination or approval by persons or bodies in the PRC; (iii) its major assets, accounting books, company seals, and minutes and files of its board and shareholders’ meetings are located or kept in the PRC; and (iv) at least half of the enterprise’s directors with voting right or senior management reside in the PRC.
We do not believe that either TAL Group or our Hong Kong subsidiary, Xueersi Hong Kong, meets all of the conditions above. Each of TAL Group and Xueersi Hong Kong is a company incorporated outside the PRC. As holding companies, these two entities’ key assets and records, including resolutions of its board of directors and resolutions of its shareholders, are located and maintained outside of the PRC. In addition, we are not aware of any offshore holding companies with a similar corporate structure as ours ever having been deemed to be PRC “resident enterprises” by the PRC tax authorities. Therefore, we believe that neither TAL Group nor Xueersi Hong Kong should be treated as a “resident enterprise” for PRC tax purposes. However, as the tax resident status of an enterprise is subject to determination by the PRC tax authorities, there are uncertainties and risks associated with this issue. If the PRC tax authorities determine that TAL Group and Xueersi Hong Kong are “resident enterprises” for PRC enterprise income tax purposes, a number of unfavorable PRC tax consequences could follow. First, we may be subject to enterprise income tax at a rate of 25% on our worldwide taxable income, as well as PRC enterprise income tax reporting obligations. Second,
31
Table of Contents
although under the EIT Law and its implementing rules, dividend income between qualified resident enterprises is a “tax-exempt income,” we cannot guarantee that dividends paid to TAL Group from our PRC subsidiaries through Xueersi Hong Kong would qualify as “tax-exempt income” and will not be subject to withholding tax, as the PRC foreign exchange control authorities, which enforce the withholding tax, have not yet issued guidance with respect to the processing of outbound remittances to entities that are treated as “resident enterprises” for PRC enterprise income tax purposes. Finally, the new “resident enterprise” classification could result in a situation in which a 10% withholding tax is imposed on dividends we pay to our non-PRC enterprise shareholders and with respect to gains derived by our non-PRC enterprise shareholders from transferring our shares or ADSs, if such income is considered PRC-sourced income by the relevant PRC authorities. This could have the effect of increasing our and our shareholders’ effective income tax rates and may require us to deduct withholding tax from any dividends we pay to our non-PRC shareholders. In addition to the uncertainties regarding how the new “resident enterprise” classification may apply, it is also possible that the rules may change in the future, possibly with retroactive effect.
Moreover, pursuant to the Arrangement between the PRC and Hong Kong Special Administrative Region on the Avoidance of Double Taxation and Prevention of Fiscal Evasion, dividends declared after January 1, 2008 and distributed to our Hong Kong subsidiary by our PRC subsidiaries are subject to withholding tax at a rate of 5%, provided that our Hong Kong subsidiary is deemed by the relevant PRC tax authorities to be a “non-resident enterprise” under the EIT Law and holds at least 25% of the equity interest of our PRC subsidiaries. The State Administration for Taxation promulgated the Notice on How to Understand and Determine the Beneficial Owners in Tax Agreement on October 27, 2009, or SAT Circular 601, which provides guidance for determining whether a resident of a jurisdiction with tax treaties with the PRC is the “beneficial owner” of an item of income under PRC tax treaties and tax arrangements. According to SAT Circular 601, a beneficial owner generally must engage in substantive business activities. An agent or conduit company will not be regarded as a beneficial owner and, therefore, will not qualify for treaty benefits. A conduit company normally refers to a company that is set up for the purpose of avoiding or reducing taxes or transferring or accumulating profits. Although we may use Xueersi Hong Kong as a platform to expand our business in the future, Xueersi Hong Kong currently does not engage in any substantive business activities and thus it is possible that Xueersi Hong Kong may not be regarded as a “beneficial owner” for the purposes of SAT Circular 601 and the dividends it receives from our PRC subsidiaries would be subject to withholding tax at a rate of 10%.
We face uncertainties with respect to application of the Circular on Strengthening the Administration of Enterprise Income Tax for Share Transfer of Non-PRC Resident Enterprises.
Pursuant to the Notice on Strengthening Administration of Enterprise Income Tax for Share Transfers by Non-PRC Resident Enterprises, or Circular 698, issued by the State Administration of Taxation on December 10, 2009, where a foreign investor transfers the equity interests of a PRC resident enterprise indirectly via disposition of the equity interests of an overseas holding company, or an “Indirect Transfer,” and such overseas holding company is located in a tax jurisdiction that (i) has an effective tax rate less than 12.5% or (ii) does not tax foreign income of its residents, the foreign investor shall report the Indirect Transfer to the competent tax authority. The PRC tax authority will examine the true nature of the Indirect Transfer, and if the tax authority considers that the foreign investor has adopted an “abusive arrangement” in order to avoid PRC tax, it may disregard the existence of the overseas holding company and re-characterize the Indirect Transfer and as a result, gains derived from such Indirect Transfer may be subject to PRC withholding tax at a rate of up to 10%. Circular 698 also provides that, where a non-PRC resident enterprise transfers its equity interests in a PRC resident enterprise to its related parties at a price lower than the fair market value, the competent tax authority has the power to make a reasonable adjustment to the taxable income of the transaction. Circular 698 is retroactively effective from January 1, 2008. The relevant PRC authority has not yet promulgated any formal provisions or formally declared or stated how to calculate the effective tax in a foreign jurisdiction and how a foreign investor shall report to the competent tax authority an Indirect Transfer. Since Circular 698 was newly promulgated, there are uncertainties as to its application. It is possible that we or our non-resident investors may become at risk of being taxed under Circular 698 and may be required to expend valuable resources to comply with Circular 698 or to establish that we or our non-resident investors
32
Table of Contents
should not be taxed under Circular 698, which may have an adverse effect on our financial condition and results of operations or such non-resident investors’ investment in us.
We face risks and uncertainties with respect to the licensing requirement for Internet audio-video programs.
On December 20, 2007, the State Administration of Radio, Film and Television, or SARFT, and the Ministry of Industry and Information Technology, or MII, issued theAdministrative Measures Regarding Internet Audio-Video Program Services, or the Internet Audio-Video Program Measures, which became effective on January 31, 2008. Among other things, the Internet Audio-Video Program Measures stipulate that no entities or individuals may provide Internet audio-video program services without a “License for Disseminating Audio-Video Programs through Information Network” issued by SARFT or its local bureaus or completing the relevant registration with SARFT or its local bureaus, and only entities wholly owned or controlled by the PRC government may engage in the production, editing, integration or consolidation, and transmission to the public through the Internet, of audio-video programs, or the provision of audio-video program uploading and transmission services. On February 3, 2008, SARFT and MII jointly held a press conference in response to inquiries related to the Internet Audio-Video Program Measures, during which SARFT and MII officials indicated that providers of audio-video program services established prior to the promulgation date of the Internet Audio-Video Program Measures that do not have any regulatory non-compliance records can re-register with the relevant government authorities to continue their current business operations. After the conference, the two authorities published a press release that confirmed the above guidelines. There are still significant uncertainties relating to the interpretation and implementation of the Internet Audio-Video Program Measures, in particular, the scope of “Internet Audio-Video Programs.”
Furthermore, on April 1, 2010, SARFT promulgated the Test Implementation of the Tentative Categories of Internet Audio-Visual Program Services, or the Categories, which clarified the scope of Internet audio-video programs services. According to the Categories, there are four categories of Internet audio-visual program services which are further divided into seventeensub-categories. The thirdsub-category to the second category covers the making and editing of certain specialized audio-video programs concerning, among other things, educational content, and broadcasting such content to the general public online.
Since we began offering online courses in 2010, revenues derived from audio-video program services that may be subject to the Audio-Video Program Measures were less than 1.5% of our net revenue. In the course of offering online tutoring services, we transmit our audio-video educational courses and programs through the Internet only to enrolled course participants, not to the general public. The limited scope of our audience distinguishes us from general online audio-video broadcasting companies, such as companies operating user-generated content websites. In addition, we do not provide audio-video program uploading and transmission services. As a result, we believe that we are not subject to the Internet Audio-Video Program Measures. However, there is no further official or publicly available interpretation of these definitions, especially the scope of “Internet audio-video program service.” If the governmental authorities determine that our provision of online tutoring services falls within the Internet Audio-Video Program Measures, we may not be able to obtain the License for Disseminating Audio-Video Programs through Information Network. If this occurs, we may become subject to significant penalties, fines, legal sanctions or an order to suspend our use of audio-video content.
Fluctuation in the value of the Renminbi may have a material adverse effect on your investment.
The value of the Renminbi against the U.S. dollar and other currencies is affected by, among other things, changes in China’s political and economic conditions and China’s foreign exchange policies. The conversion of the Renminbi into foreign currencies, including the U.S. dollar, has been based on exchange rates set by the People’s Bank of China. On July 21, 2005, the PRC government changed its decade-old policy of pegging the value of the Renminbi solely to the U.S. dollar. Under this revised policy, the Renminbi is permitted to fluctuate within a narrow and managed band against a basket of certain foreign currencies. Following the removal of the U.S. dollar peg, the Renminbi appreciated approximately 21.5% against the U.S. dollar over the following three years. Since July 2008, however, the Renminbi has traded within a narrow range against the
33
Table of Contents
U.S. dollar, remaining within 1% of its July 2008 high. As a consequence, the Renminbi has fluctuated significantly since July 2008 against other freely traded currencies, in tandem with the U.S. dollar. On June 20, 2010, the People’s Bank of China announced that the PRC government will further reform the Renminbi exchange rate regime and enhance the Renminbi exchange rate flexibility. It is difficult to predict how this new policy may impact the Renminbi exchange rate going forward.
Significant revaluation of the Renminbi may have a material adverse effect on your investment. For example, to the extent that we need to convert U.S. dollars we receive from this initial public offering into Renminbi for our operations, appreciation of the Renminbi against the U.S. dollar would have an adverse effect on the Renminbi amount we would receive from the conversion. Conversely, if we decide to convert our Renminbi into U.S. dollars for the purpose of making payments for dividends on our common shares or ADSs or for other business purposes, appreciation of the U.S. dollar against the Renminbi would have a negative effect on the U.S. dollar amount available to us.
Governmental control of currency conversion may affect the value of your investment.
The PRC government imposes controls on the convertibility of the Renminbi into foreign currencies and, in certain cases, the remittance of currency out of China. Under our current corporate structure, our income will be primarily derived from a share of the earnings from our PRC subsidiaries. Revenues of our PRC subsidiaries are all denominated in Renminbi. Shortages in the availability of foreign currency may restrict the ability of our PRC subsidiaries to remit sufficient foreign currency to pay dividends or other payments to us, or otherwise satisfy their foreign currency-denominated obligations. Under existing PRC foreign exchange regulations, payments of current account items, including profit distributions, interest payments and expenditures from trade-related transactions, can be made in foreign currencies without prior approval from SAFE by complying with certain procedural requirements. However, for any PRC company, dividends can be declared and paid only out of the retained earnings of that company under PRC law. Furthermore, approval from SAFE or its local branch is required where Renminbi is to be converted into foreign currency and remitted out of China to pay capital expenses, such as the repayment of loans denominated in foreign currencies. Specifically, under the existing exchange restrictions, without a prior approval of SAFE, cash generated from the operations of our subsidiaries in China may be used to pay dividends by our PRC subsidiaries to TAL Group through Xueersi Hong Kong and pay employees of our PRC subsidiaries who are located outside China in a currency other than the Renminbi. With a prior approval from SAFE, cash generated from the operations of our PRC subsidiaries and affiliated entities may be used to pay off debt in a currency other than the Renminbi owed by our subsidiaries and affiliated entities to entities outside China, and make other capital expenditures outside China in a currency other than the Renminbi. The PRC government may also at its discretion restrict access in the future to foreign currencies for current account transactions. If the foreign exchange control system prevents us from obtaining sufficient foreign currency to satisfy our currency demands, we may not be able to pay dividends in foreign currencies to our shareholders, including holders of our ADSs.
Risks Related to Our ADSs and This Offering
There has been no public market for our common shares or ADSs prior to this offering, and you may not be able to resell our ADSs at or above the price you paid, or at all.
Prior to this initial public offering, there has been no public market for our common shares or ADSs. Our ADSs have been approved for listing on the New York Stock Exchange, but our ADSs or common shares will not be listed on any exchange or quoted for trading on anyover-the-counter trading system. If an active trading market for our ADSs does not develop after this offering, the market price and liquidity of our ADSs will be materially and adversely affected.
The initial public offering price for our ADSs was determined by negotiations between us and the underwriters and may bear no relationship to the market price for our ADSs after this initial public offering.
34
Table of Contents
We cannot assure you that an active trading market for our ADSs will develop or that the market price of our ADSs will not decline below the initial public offering price.
The market price for our ADSs may be volatile.
The market price for our ADSs is likely to be highly volatile and subject to wide fluctuations in response to factors such as:
| • | actual or anticipated fluctuations in our operating results, | |
| • | changes in financial estimates by securities research analysts, | |
| • | changes in the economic performance or market valuation of other education companies, | |
| • | announcements by us or our competitors of material acquisitions, | |
| • | strategic partnerships, joint ventures or capital commitments, | |
| • | addition or departure of our executive officers and key personnel, | |
| • | intellectual property litigation, | |
| • | release or expiration oflock-up or other transfer restrictions on our outstanding Class B common shares or ADSs, and | |
| • | economic, regulatory or political conditions in China. |
In addition, the performance, and fluctuation in market prices, of other companies with business operations mainly located in China that have listed their securities in the United States may affect the volatility in the price and trading volume of our ADSs. Furthermore, the securities market has from time to time experienced significant price and volume fluctuations that are not related to the operating performance of particular companies. These market fluctuations may also have a material adverse effect on the market price of our ADSs.
Our dual-class voting structure will limit your ability to influence corporate matters and could discourage others from pursuing any change of control transactions that holders of our Class A common shares and ADSs may view as beneficial.
Our common shares are divided into Class A common shares and Class B common shares. Holders of Class A common shares are entitled to one vote per share, while holders of Class B common shares are entitled to ten votes per share. We will issue Class A common shares represented by our ADSs in this offering. All of our existing shareholders as of September 29, 2010, including our founders, hold our Class B common shares, and our outstanding preferred shares will be automatically converted into Class B common shares immediately prior to the completion of this offering. We intend to maintain the dual-class voting structure after the completion of this offering. Each Class B common share is convertible into one Class A common share at any time by the holder thereof. Class A common shares are not convertible into Class B common shares under any circumstances. Upon any transfer of Class B common shares by a holder thereof to any person or entity which is not an affiliate of such holder, such Class B common shares shall be automatically and immediately converted into the equal number of Class A common shares. In addition, if at any time Mr. Bangxin Zhang, Mr. Yundong Cao, Mr. Yachao Liu, Mr. Yunfeng Bai, Tiger Global Five China Holdings and KTB China Optimum Fund and their respective affiliates collectively own less than 5% of the total number of the issued and outstanding Class B common shares (taking into account all of the issued and outstanding preferred shares on an as-converted basis), each issued and outstanding Class B common share shall be automatically and immediately converted into one share of Class A common share, and we shall not issue any Class B common shares thereafter. Due to the disparate voting powers attached to these two classes, we anticipate that our existing shareholders will collectively own approximately 98.1% of the voting power of our outstanding shares immediately after this offering and will have considerable influence over matters requiring shareholder approval, including election of directors and significant corporate transactions, such as a merger or sale of our company or our assets. In particular, our founders and senior management, Mr. Bangxin
35
Table of Contents
Zhang, Mr. Yundong Cao, Mr. Yachao Liu and Mr. Yunfeng Bai and their respective affiliates, will beneficially own approximately 63.8% of our total outstanding shares, representing 74.6% of our total voting power immediately after this offering. This concentrated control will limit your ability to influence corporate matters and could discourage others from pursuing any potential merger, takeover or other change of control transactions that holders of Class A common shares and ADSs may view as beneficial.
Our corporate actions are substantially controlled by our officers, directors, principal shareholders and their affiliated entities.
After this offering, our executive officers, directors and their affiliated entities will beneficially own approximately 63.8% of our total outstanding shares, representing 74.6% of our total voting power. These shareholders, if they acted together, could exert substantial influence over matters requiring approval by our shareholders, including electing directors and approving mergers or other business combination transactions and they may not act in the best interests of other minority shareholders. This concentration of ownership may also discourage, delay or prevent a change in control of our company, which could deprive our shareholders of an opportunity to receive a premium for their shares as part of a sale of our company and might reduce the price of our ADSs. These actions may be taken even if they are opposed by our other shareholders, including those who purchase ADSs in this offering.
If securities or industry analysts publish negative reports about our business, the price and trading volume of our securities could decline.
The trading market for our securities depends, in part, on the research reports and ratings that securities or industry analysts or ratings agencies publish about us, our business and the K-12 after-school tutoring market in China in general. We do not have any control over these analysts or agencies. If one or more of the analysts or agencies who cover us downgrades us or our securities, the price of our securities may decline. If one or more of these analysts cease coverage of our company or fail to regularly publish reports on us, we could lose visibility in the financial markets, which could cause the price of our securities or trading volume to decline.
Because the initial public offering price is substantially higher than our net tangible book value per share, you will incur immediate and substantial dilution.
If you purchase ADSs in this offering, you will pay more for your ADSs than the amount paid by our existing shareholders for their common shares on a per ADS basis. As a result, you will experience immediate and substantial dilution of approximately $8.38 per ADS (assuming no exercise by the underwriters of their option to acquire additional ADSs), representing the difference between our net tangible book value per ADS as of August 31, 2010 after giving effect to the conversion of our Series A preferred shares into Class B shares and accrual of $30.0 million cash dividend and this offering at an initial public offering price of $10.00 per ADS. In addition, you may experience further dilution to the extent that our restricted shares are vested. See “Dilution” for a more complete description of how the value of your investment in our ADSs will be diluted upon completion of this offering.
Substantial future sales or the expectation of substantial sales of our ADSs in the public market could cause the price of our ADSs to decline.
Sales of our ADSs or Class A common shares in the public market after this offering, or the perception that these sales could occur, could cause the market price of our ADSs to decline. Upon completion of this offering, we will have Class A and Class B common shares outstanding, including Class A common shares represented by ADSs. All ADSs sold in this offering will be freely transferable without restriction or additional registration under the U.S. Securities Act of 1933, as amended, or the Securities Act. The remaining common shares outstanding after this offering will be available for sale upon the expiration of the180-daylock-up period beginning from the date of this prospectus and, in the case of the Class B common shares and Class A common shares that certain option holders will receive when they exercise their share options, subject to volume and other restrictions as applicable under Rule 144 and Rule 701 under the Securities Act. Any or
36
Table of Contents
all of these shares (other than those held by certain option holders) may be released prior to expiration of thelock-up period at the discretion of the underwriters. To the extent shares are released before the expiration of thelock-up period and these shares are sold into the market, the market price of our ADSs could decline.
In addition, several of our shareholders have the right to cause us to register the sale of their shares under the Securities Act upon the occurrence of certain circumstances. See “Description of Share Capital—Shareholders’ Agreement and Registration Rights.” Registration of these shares under the Securities Act would result in these shares becoming freely tradable without restriction under the Securities Act immediately upon the effectiveness of the registration of these shares. Sales of these registered shares in the public market could cause the price of our ADSs to decline.
Our post-offering articles of association contain anti-takeover provisions that could discourage a third party from acquiring us, which could limit our shareholders’ opportunity to sell their shares, including Class A common shares represented by our ADSs, at a premium.
Our articles of association that will become effective immediately upon the completion of this offering contain provisions that limit the ability of others to acquire control of our company or cause us to engage inchange-of-control transactions. These provisions could have the effect of depriving our shareholders of an opportunity to sell their shares at a premium over prevailing market prices by discouraging third parties from seeking to obtain control of our company in a tender offer or similar transaction. For example, our board of directors has the authority, without further action by our shareholders, to issue preferred shares. These preferred shares may have better voting rights than our Class A common shares, in the form of ADSs or otherwise, and could be issued quickly with terms calculated to delay or prevent a change in control of our company or make removal of management more difficult. If our board of directors decides to issue preferred shares, the price of our ADSs may fall and the voting rights of the holders of our common shares and ADSs may be diluted.
Certain actions require the approval of a supermajority of at least two-thirds of our board of directors which, among other things, would allow our non-independent directors to block a variety of actions or transactions, such as a merger or asset sale, even if all of our independent directors unanimously voted in favor of such action, thereby further depriving our shareholders of an opportunity to sell their shares at a premium. See “Description of Share Capital—Common Shares—Voting Rights.”
Holders of ADSs have fewer rights than shareholders and must act through the depositary to exercise those rights.
Holders of ADSs do not have the same rights of our shareholders and may only exercise the voting rights with respect to the underlying Class A common shares in accordance with the provisions of the deposit agreement. Under our post-offering memorandum and articles of association, the minimum notice period required to convene a general meeting is 10 days. When a general meeting is convened, you may not receive sufficient notice of a shareholders’ meeting to permit you to withdraw your common shares to allow you to cast your vote with respect to any specific matter. In addition, the depositary and its agents may not be able to send voting instructions to you or carry out your voting instructions in a timely manner. We will make all reasonable efforts to cause the depositary to extend voting rights to you in a timely manner, but we cannot assure you that you will receive the voting materials in time to ensure that you can instruct the depositary to vote your ADSs. Furthermore, the depositary and its agents will not be responsible for any failure to carry out any instructions to vote, for the manner in which any vote is cast or for the effect of any such vote. As a result, you may not be able to exercise your right to vote and you may lack recourse if your ADSs are not voted as you requested. In addition, in your capacity as an ADS holder, you will not be able to call a shareholders’ meeting.
37
Table of Contents
You may not receive distributions on our common shares or any value for them if such distribution is illegal or if any required government approval cannot be obtained in order to make such distribution available to you.
The depositary of our ADSs has agreed to pay to you the cash dividends or other distributions it or the custodian receives on common shares or other deposited securities underlying our ADSs, after deducting its fees and expenses. You will receive these distributions in proportion to the number of Class A common shares your ADSs represent. However, the depositary is not responsible if it decides that it is unlawful, inequitable or impractical to make a distribution available to any holders of ADSs. For example, it would be unlawful to make a distribution to a holder of ADSs if it consists of securities that require registration under the Securities Act but that are not properly registered or distributed under an applicable exemption from registration. The depositary may also determine that it is not feasible to distribute certain property through the mail. Additionally, the value of certain distributions may be less than the cost of mailing them. In these cases, the depositary may determine not to distribute such property. We have no obligation to register under U.S. securities laws any ADSs, common shares, rights or other securities received through such distributions. We also have no obligation to take any other action to permit the distribution of ADSs, common shares, rights or anything else to holders of ADSs. This means that you may not receive distributions we make on our common shares or any value for them if it is illegal or impractical for us to make them available to you. These restrictions may cause a material decline in the value of our ADSs.
You may be subject to limitations on transfers of your ADSs.
Your ADSs are transferable on the books of the depositary. However, the depositary may close its transfer books at any time or from time to time when it deems expedient in connection with the performance of its duties. In addition, the depositary may refuse to deliver, transfer or register transfers of ADSs generally when our books or the books of the depositary are closed, or at any time if we or the depositary deem it advisable to do so because of any requirement of law or of any government or governmental body, or under any provision of the deposit agreement, or for any other reason.
Your right to participate in any future rights offerings may be limited, which may cause dilution to your holdings.
We may from time to time distribute rights to our shareholders, including rights to acquire our securities. However, we cannot make rights available to you in the United States unless we register the rights and the securities to which the rights relate under the Securities Act or an exemption from the registration requirements is available. Also, under the deposit agreement, the depositary will not make rights available to you unless the distribution to ADS holders of both the rights and any related securities are either registered under the Securities Act, or exempted from registration under the Securities Act. We are under no obligation to file a registration statement with respect to any such rights or securities or to endeavor to cause such a registration statement to be declared effective. Moreover, we may not be able to establish an exemption from registration under the Securities Act. Accordingly, you may be unable to participate in our rights offerings and may experience dilution in your holdings.
We are a Cayman Islands company and, because judicial precedent regarding the rights of shareholders is more limited under Cayman Islands law than that under U.S. law, you may have less protection for your shareholder rights than you would under U.S. law.
Our corporate affairs are governed by our memorandum and articles of association, as amended and restated from time to time, the Cayman Islands Companies Law (as amended) and the common law of the Cayman Islands. The rights of shareholders to take action against the directors, actions by minority shareholders and the fiduciary responsibilities of our directors to us under Cayman Islands law are to a large extent governed by the common law of the Cayman Islands. The common law of the Cayman Islands is derived in part from comparatively limited judicial precedent in the Cayman Islands as well as that from English common law, which has persuasive, but not binding, authority on a court in the Cayman Islands. The rights of our shareholders and the fiduciary responsibilities of our directors under Cayman Islands law are not
38
Table of Contents
as clearly established as they would be under statutes or judicial precedent in some jurisdictions in the United States. In particular, the Cayman Islands has a less developed body of securities laws than the United States. In addition, some U.S. states, such as Delaware, have more fully developed and judicially interpreted bodies of corporate law than the Cayman Islands.
As a result of all of the above, public shareholders may have more difficulty in protecting their interests in the face of actions taken by management, members of the board of directors or controlling shareholders than they would as shareholders of a U.S. public company.
You may experience difficulties in effecting service of legal process, enforcing foreign judgments or bringing original actions in China against us, our management or the experts named in this prospectus.
We are a Cayman Islands company and substantially all of our assets are located outside of the United States. All of our current operations are conducted in the PRC. In addition, most of our directors and officers are nationals and residents of the PRC. As a result, it may be difficult for you to effect service of process within the United States or elsewhere outside China upon these persons. It may also be difficult for you to enforce in U.S. courts judgments obtained in U.S. courts based on the civil liability provisions of the U.S. federal securities laws against us and our officers and directors, most of whom are not residents in the United States and the substantial majority of whose assets are located outside of the United States. In addition, there is uncertainty as to whether the courts of the Cayman Islands or the PRC would recognize or enforce judgments of U.S. courts against us or such persons predicated upon the civil liability provisions of the securities laws of the United States or any state and it is uncertain whether such Cayman Islands or PRC courts would be competent to hear original actions brought in the Cayman Islands or the PRC against us or such persons predicated upon the securities laws of the United States or any state. In addition, since we are incorporated under the laws of the Cayman Islands and our corporate affairs are governed by the laws of the Cayman Islands, it is difficult for you to bring an action against us based upon PRC laws in the event that you believe that your rights as a shareholder have been infringed. See “Enforceability of Civil Liabilities.”
We have not determined any specific use for a portion of the net proceeds to us from this offering and we may use such portion of the net proceeds in ways with which you may not agree.
We have not allocated a portion of the net proceeds from this offering to any specific purpose. Rather, our management will have considerable discretion in the application of such portion of the net proceeds. See “Use of Proceeds.” You will not have the opportunity, as part of your investment decision, to assess whether such proceeds are being used appropriately. You must rely on the judgment of our management regarding the application of such proceeds we receive from this offering. Such proceeds may be used for corporate purposes that do not improve our profitability or increase our ADS price. Such proceeds we receive from this offering may also be placed in investments that do not produce income or that may lose value.
39
Table of Contents
SPECIAL NOTE REGARDING FORWARD-LOOKING STATEMENTS
This prospectus contains forward-looking statements that reflect our current expectations and views of future events. The forward looking statements are contained principally in the sections entitled “Summary,” “Risk Factors,” “Management’s Discussion and Analysis of Financial Condition and Results of Operations,” “Market Opportunity” and “Business.” You can identify some of these forward-looking statements by words or phrases such as “may,” “will,” “expect,” “anticipate,” “aim,” “estimate,” “intend,” “plan,” “believe,” “is/are likely to,” “potential,” “continue,” “seek,” “should,” “predict,” “anticipate” or negative versions of these words or other similar expressions, although not all forward-looking statement contain these words.
Forward-looking statements include, but are not limited to, statements relating to:
| • | our anticipated growth strategies; | |
| • | competition in the K-12 after-school tutoring market; | |
| • | our future business development, results of operations and financial condition; | |
| • | expected changes in our revenues and certain cost and expense items; | |
| • | our ability to increase student enrollments and course fees and expand course offerings; | |
| • | risks associated with the expansion of our geographic reach; | |
| • | the expected increase in spending on private education in China; and | |
| • | PRC laws, regulations and policies relating to private education and providers of after-school tutoring services. |
We have based these forward-looking statements largely on our current expectations and projections about future events and financial trends that we believe may affect our financial condition, results of operations, business strategy and financial needs. Although we believe that our expectations expressed in these forward-looking statements are reasonable, our expectations may later be found to be incorrect. Our actual results could be materially different from our expectations. Known and unknown risks, uncertainties and other factors, including those important risks and factors that could cause our actual results to be materially different from our expectations are generally set forth in “Summary—Our Challenges,” “Risk Factors,” “Management’s Discussion and Analysis of Financial Condition and Results of Operations,” “Business,” “Regulation” and other sections in this prospectus. You should read thoroughly this prospectus and the documents that we refer to with the understanding that our actual future results may be materially different from and worse than what we expect. We qualify all of our forward-looking statements with these cautionary statements. Other sections of this prospectus include additional factors which could adversely impact our business and financial performance.
This prospectus contains statistical data that we obtained from various government and private publications. Statistical data in these publications also include projections based on a number of assumptions. The market for K-12 after-school tutoring services in China may not grow at the rate projected by market data, or at all. The failure of this market to grow at the projected rate may have a material adverse effect on our business and the market price of our ADSs. Furthermore, if any one or more of the assumptions underlying the market data is later found to be incorrect, actual results may differ from the projections based on these assumptions. You should not place undue reliance on these forward-looking statements.
The forward-looking statements made in this prospectus relate only to events or information as of the date on which the statements are made in this prospectus. Except as required by law, we undertake no obligation to update or revise publicly any forward-looking statements, whether as a result of new information, future events or otherwise, after the date on which the statements are made or to reflect the occurrence of unanticipated events. You should read this prospectus and the documents that we refer to in this prospectus and have filed as exhibits to the registration statement, of which this prospectus is a part, completely and with the understanding that our actual future results may be materially different from what we expect.
40
Table of Contents
USE OF PROCEEDS
We estimate that we will receive net proceeds from this offering of approximately $110.9 million, or approximately $127.6 million if the underwriters exercise their option to purchase additional ADSs in full, after deducting underwriting discounts and commissions and the estimated offering expenses payable by us.
The primary purposes of this offering are to create a public market for our shares for the benefit of all shareholders, retain talented employees by providing them with equity incentives, and obtain additional capital. We plan to use the net proceeds from the offering as follows:
| • | approximately $30.0 million to expand our network of learning centers and service centers; | |
| • | approximately $15.0 million to build a national training center; | |
| • | $30.0 million to pay a declared dividend conditional upon the completion of this offering (see “Dividend Policy”); | |
| • | approximately $10.0 million to improve our existing facilities; and | |
| • | the balance for general corporate purposes, including strategic investments in and acquisitions of complementary businesses, although we have not identified any near-term investment or acquisition targets. |
The foregoing represents our current intentions based upon our present plans and business conditions to use and allocate the net proceeds of this offering. Our management, however, will have significant flexibility and discretion to apply the net proceeds of this offering. If an unforeseen event occurs or business conditions change, we may use the proceeds of this offering differently than as described in this prospectus. To the extent that a certain portion or all of the net proceeds we receive from this offering are not immediately applied for the above purposes, we plan to invest the net proceeds in short-term interest-bearing debt instruments or bank deposits.
In using the proceeds of this offering, as an offshore holding company, we are permitted, under the PRC laws and regulations, to provide funding to our PRC subsidiaries only through loans or capital contributions and to our PRC affiliated entities only through loans, subject to satisfaction of applicable government registration and approval requirements. There are no costs associated with registering loans or capital contributions with relevant PRC authorities, other than nominal processing charges. Under PRC laws and regulations, the PRC governmental authorities are required to process such approvals or registrations or deny our application within a prescribed period which is usually less than 90 days. The actual time taken, however, may be longer due to administrative delay. We cannot assure you that we will be able to obtain these government registrations or approvals on a timely basis, if at all. See “Risk Factors—Risks Related to Doing Business in China—PRC regulation of loans and direct investment by offshore holding companies to PRC entities may limit the use of the proceeds we receive from this offering for our expansion or operations.”
41
Table of Contents
DIVIDEND POLICY
On September 29, 2010, we declared a $30.0 million cash dividend payable to our shareholders of record as of that date, subject to the completion of this offering. However, we do not have any present plan to pay any other cash dividends on our common shares in the foreseeable future. We currently intend to retain most, if not all, of our available funds and any future earnings to operate and expand our business.
Our board of directors has complete discretion whether to declare dividends. Even if our board of directors decides to declare dividends, their form, frequency and amount will depend upon our future operations and earnings, capital requirements and surplus, general financial condition, contractual restrictions and other factors that the board of directors may deem relevant.
Holders of our ADSs will be entitled to receive dividends, if any, subject to the terms of the deposit agreement, to the same extent as the holders of our Class A common shares. Cash dividends will be paid to the depositary of our ADSs in U.S. dollars, which will distribute them to the holders of ADSs according to the terms of the deposit agreement. Other distributions, if any, will be paid by the depositary to the holders of ADSs in any means it deems legal, fair and practical. See “Description of American Depositary Shares.”
We are a holding company incorporated in the Cayman Islands. We may rely on dividends from our subsidiaries in China for our cash needs. To pay dividends to us, our subsidiaries in China shall comply with the current PRC regulations. See “Risk Factors—Risks Related to Doing Business in China—We may rely on dividends paid by our subsidiaries for our cash needs, and any limitation on the ability of our subsidiaries to make payments to us could limit our ability to pay dividends to holders of our ADSs and common shares.”
42
Table of Contents
CAPITALIZATION
The following table sets forth our capitalization as of August 31, 2010:
| • | on an actual basis; | |
| • | on a pro forma basis to reflect (i) the automatic conversion of all of our Series A preferred shares into 5,000,000 Class B common shares immediately upon the completion of this offering and (ii) the accrual of a $30.0 million cash dividend declared to our existing shareholders as of September 29, 2010 and payable upon the completion of this offering; and | |
| • | on a pro forma as adjusted basis to reflect (i) the pro forma adjustments above and (ii) the sale of 24,000,000 Class A common shares in the form of ADSs by us in this offering at $10.00 per ADS, after deducting the underwriting discounts and commissions and the estimated offering expenses payable by us. |
You should read this table together with our consolidated financial statements and the related notes included elsewhere in this prospectus and the information under “Management’s Discussion and Analysis of Financial Condition and Results of Operations.”
| As of August 31, 2010 | ||||||||||||
| Pro forma as | ||||||||||||
| Actual | Pro forma | adjusted | ||||||||||
| Dividend proposed | $ | — | $ | 30,000,000 | $ | — | ||||||
| Series A preferred shares ($0.001 par value, 5,000,000 shares authorized, issued and outstanding) | 9,000,000 | — | — | |||||||||
| Equity: | ||||||||||||
Class A common shares ($0.001 par value, 500,000,000 shares authorized and nil issued and outstanding, actual; 500,000,000 shares authorized, nil issued and outstanding, pro forma; 500,000,000 shares authorized, 24,000,000 shares issued and outstanding, pro forma as adjusted)(1) | — | — | 24,000 | |||||||||
Class B common shares ($0.001 par value, 495,000,000 shares authorized, 120,000,000 shares issued and outstanding, and 125,000,000 shares issued and outstanding on a pro forma basis)(1) | 120,000 | 125,000 | 125,000 | |||||||||
| Additional paid-in capital | 1,699,503 | (19,305,497 | ) | 91,559,364 | ||||||||
Retained earnings(2) | 30,173,018 | 30,173,018 | 30,173,018 | |||||||||
| Accumulated other comprehensive income | 288,226 | 288,226 | 288,226 | |||||||||
| Total equity | 32,280,747 | 11,280,747 | 122,169,608 | |||||||||
| Total | $ | 41,280,747 | $ | 41,280,747 | $ | 122,169,608 | ||||||
| Notes: | ||
| (1) | Effective September 29, 2010, our share capital was re-designated into Class A and Class B common shares under our third amended and restated memorandum and articles of association. | |
| (2) | Includes $4.9 million in statutory reserves that are not available for distribution pursuant to PRC laws. |
43
Table of Contents
DILUTION
If you invest in our ADSs, your interest will be diluted to the extent of the difference between the initial public offering price per ADS and our net tangible book value per ADS after this offering. Dilution results from the conversion of our Series A preferred shares and the fact that the initial public offering price per ADS is substantially in excess of the book value per common share attributable to the existing shareholders for our presently outstanding common shares.
Our net tangible book value as of August 31, 2010 was approximately $30.5 million, or $0.25 per common share and $0.51 per ADS as of that date. Net tangible book value represents the amount of our total consolidated tangible assets less the amount of our total consolidated liabilities and our Series A preferred convertible redeemable shares. Pro forma dilution is determined by subtracting net tangible book value per common share, after giving effect to the conversion of all outstanding Series A preferred shares into Class B common shares upon the completion of this offering, the accrual of a $30.0 million cash dividend declared to our then existing shareholders and payable upon the completion of this offering and the additional proceeds we will receive from this offering at $10.00 per ADS, and after deducting underwriting discounts and commissions and estimated offering expenses payable by us.
Without taking into account any other changes in net tangible book value after August 31, 2010, other than to give effect to (i) the conversion of all outstanding Series A preferred shares into Class B common shares upon the completion of this offering, (ii) our sale of the ADSs offered in this offering at the initial public offering price of $10.00 per ADS, after deduction of the underwriting discounts and commissions and estimated offering expenses payable by us and (iii) the payment of a $30.0 million cash dividend previously declared to our then existing shareholders and payable upon the closing of this offering, our pro forma net tangible book value as of August 31, 2010 would have been $120.4 million, or $0.81 per outstanding common share and $1.62 per ADS. This represents an immediate increase in net tangible book value of $0.73 per common share and $1.46 per ADS to the existing shareholders and an immediate dilution in net tangible book value of $4.19 per common share and $8.38 per ADS to investors purchasing ADSs in this offering. The following table illustrates such dilution:
| Per Common | ||||||||
| Share | Per ADS | |||||||
| Initial public offering price | $ | 5.00 | $ | 10.00 | ||||
| Net tangible book value per share as of August 31, 2010 | $ | 0.25 | $ | 0.51 | ||||
| Pro forma net tangible book value per share after giving effect to the conversion of our Series A preferred shares and accrual of $30.0 million cash dividend | $ | 0.08 | $ | 0.15 | ||||
| Pro forma net tangible book value per share after giving effect to the conversion of our Series A preferred shares and accrual of $30.0 million cash dividend and this offering | $ | 0.81 | $ | 1.62 | ||||
| Amount of dilution in net tangible book value per share to new investors in the offering | $ | 4.19 | $ | 8.38 | ||||
44
Table of Contents
The following table summarizes, on a pro forma basis as of August 31, 2010, the differences between existing shareholders, including holders of our Series A preferred shares that will be automatically converted into Class B common shares immediately prior to the completion of this offering, and the new investors with respect to the number of Class A common shares (in the form of ADSs or shares) purchased from us, the total consideration paid and the average price per Class A common share/ADS paid before deducting the underwriting discounts and commissions and estimated offering expenses. The total number of common shares does not include Class A common shares underlying the ADSs issuable upon the exercise of the over-allotment option granted to the underwriters.
| Average | ||||||||||||||||||||||||
| Price Per | Average | |||||||||||||||||||||||
| Common shares | Total | Common | Price Per | |||||||||||||||||||||
| Purchased | Consideration | Share | ADS | |||||||||||||||||||||
| Number | Percent | Amount | Percent | |||||||||||||||||||||
| Existing shareholders | 125,000,000 | 84 | % | $ | 9,899,641 | 7.6 | % | $ | 0.08 | $ | 0.16 | |||||||||||||
| New investors | 24,000,000 | 16 | % | $ | 120,000,000 | 92.4 | % | $ | 5.00 | $ | 10.00 | |||||||||||||
| Total | 149,000,000 | 100 | % | $ | 129,899,641 | 100 | % | |||||||||||||||||
The discussion and tables above also assume no vesting of any outstanding restricted shares. As of the date of this prospectus, there are 5,419,500 restricted shares granted to our directors, executive officers and employees that are outstanding and will be vested in accordance with vesting schedules ranging from one to four years. To the extent that any of these restricted shares are vested, there will be further dilution to new investors.
45
Table of Contents
EXCHANGE RATE INFORMATION
Substantially all of our operations are conducted in China and substantially all of our revenues and expenses are denominated in RMB. This prospectus contains translations of RMB amounts into U.S. dollars at specific rates solely for the convenience of the reader. Unless otherwise noted, all translations from RMB to U.S. dollars and from U.S. dollars to RMB in this prospectus were made at a rate of RMB6.8069 to $1.00, the exchange rate set forth in the Federal Reserve Statistical Release on August 31, 2010. We make no representation that any RMB or U.S. dollar amounts could have been, or could be, converted into U.S. dollars or RMB, as the case may be, at any particular rate, the rates stated herein, or at all. The PRC government imposes control over its foreign currency reserves in part through direct regulation of the conversion of RMB into foreign currencies and through restrictions on international trade. On October 15, 2010, the certified exchange rate was RMB6.6397 to $1.00.
The following table sets forth information concerning exchange rates between RMB and the U.S. dollar for the periods indicated. These rates are provided solely for your convenience and are not necessarily the exchange rates that we used in this prospectus or will use in the preparation of our periodic reports or any other information to be provided to you.
| Exchange Rate | ||||||||||||||||
Period | Period End | Average(1) | Low | High | ||||||||||||
| (RMB per $1.00) | ||||||||||||||||
| 2005 | 8.0702 | 8.1826 | 8.2765 | 8.0702 | ||||||||||||
| 2006 | 7.8041 | 7.9579 | 8.0702 | 7.8041 | ||||||||||||
| 2007 | 7.2946 | 7.5806 | 7.8127 | 7.2946 | ||||||||||||
| 2008 | 6.8225 | 6.9193 | 7.2946 | 6.7800 | ||||||||||||
| 2009 | 6.8259 | 6.8295 | 6.8470 | 6.8176 | ||||||||||||
| 2010 | ||||||||||||||||
| April | 6.8247 | 6.8256 | 6.8275 | 6.8229 | ||||||||||||
| May | 6.8305 | 6.8275 | 6.8310 | 6.8245 | ||||||||||||
| June | 6.7815 | 6.8184 | 6.8323 | 6.7815 | ||||||||||||
| July | 6.7735 | 6.7762 | 6.7807 | 6.7709 | ||||||||||||
| August | 6.8069 | 6.7873 | 6.8069 | 6.7670 | ||||||||||||
| September | 6.6905 | 6.7396 | 6.8102 | 6.6869 | ||||||||||||
| October (through October 15, 2010) | 6.6397 | 6.6749 | 6.6912 | 6.6397 | ||||||||||||
| Source: Federal Reserve Statistical Release | ||
| (1) | Annual averages were calculated by using the average of the exchange rates on the last day of each month during the relevant year. Monthly averages are calculated by using the average of the daily rates during the relevant month. |
46
Table of Contents
ENFORCEABILITY OF CIVIL LIABILITIES
We were incorporated in the Cayman Islands in order to enjoy certain benefits, such as political and economic stability, an effective judicial system, a favorable tax system, the absence of exchange control or currency restrictions, and the availability of professional and support services. However, certain disadvantages accompany incorporation in the Cayman Islands. These disadvantages include a less developed body of Cayman Islands securities laws that provide significantly less protection to investors as compared to the laws of the United States, and the potential lack of standing by Cayman Islands companies to sue before the federal courts of the United States.
Our organizational documents do not contain provisions requiring that disputes, including those arising under the securities laws of the United States, between us, our officers, directors and shareholders, be arbitrated.
Substantially all of our operations are conducted in China, and substantially all of our assets are located in China. A majority of our officers are nationals or residents of jurisdictions other than the United States and a substantial portion of their assets are located outside the United States. As a result, it may be difficult for a shareholder to effect service of process within the United States upon these persons, or to enforce against us or them judgments obtained in United States courts, including judgments predicated upon the civil liability provisions of the securities laws of the United States or any state in the United States.
We have appointed Law Debenture Corporate Services Inc., as our agent upon whom process may be served in any action brought against us under the securities laws of the United States.
Maples and Calder, our counsel as to Cayman Islands law, and Tian Yuan Law Firm, our counsel as to PRC law, have respectively advised us that there is uncertainty as to whether the courts of the Cayman Islands and China would:
| • | recognize or enforce judgments of United States courts obtained against us or our directors or officers predicated upon the civil liability provisions of the securities laws of the United States or any state in the United States; or | |
| • | entertain original actions brought in each respective jurisdiction against us or our directors or officers predicated upon the securities laws of the United States or any state in the United States. |
Maples and Calder has further advised us that a final and conclusive judgment in a federal or state court of the United States under which a sum of money is payable, other than a sum payable in respect of taxes, fines, penalties or similar charges, and which was neither obtained in a manner nor is of a kind enforcement of which is contrary to natural justice or the public policy of the Cayman Islands, may be subject to enforcement proceedings as a debt in the courts of the Cayman Islands under the common law without any re-examination of the merits of the underlying dispute. However, the Cayman Islands courts are unlikely to enforce a punitive judgment of a United States court predicated upon the liabilities provision of the federal securities laws in the United States without retrial on the merits if such judgment gives rise to obligations to make payments that may be regarded as fines, penalties or similar charges.
Tian Yuan Law Firm has further advised us that the recognition and enforcement of foreign judgments are provided for under the PRC Civil Procedures Law. PRC courts may recognize and enforce foreign judgments in accordance with the requirements of the PRC Civil Procedures Law based either on treaties between China and the country where the judgment is made or on principles of reciprocity between jurisdictions. China does not have any treaties or other form of reciprocity with the United States or the Cayman Islands that provide for the reciprocal recognition and enforcement of foreign judgments. In addition, according to the PRC Civil Procedures Law, courts in the PRC will not enforce a foreign judgment against us or our directors and officers if they decide that the judgment violates the basic principles of PRC law or national sovereignty, security or public interest. As a result, it is uncertain whether and on what basis a PRC court would enforce a judgment rendered by a court in the United States or the Cayman Islands.
47
Table of Contents
In addition, it will be difficult for U.S. shareholders to originate actions against us in China based upon Cayman Islands laws, U.S. law or PRC laws, because we are incorporated under the laws of the Cayman Islands and it is difficult for U.S. shareholders, by virtue only of holding our ADSs or common shares, to establish a connection to the PRC as required by the PRC Civil Procedures Law in order for a PRC court to have jurisdiction. U.S. shareholders may be able to originate actions against us in the Cayman Islands based upon Cayman Islands laws. However, we do not have any substantial assets other than certain corporate documents and records in the Cayman Islands and it may be difficult for a shareholder to enforce a judgment obtained in a Cayman Islands court in China, where all of our operations are conducted.
48
Table of Contents
OUR CORPORATE HISTORY AND STRUCTURE
Our Corporate History
Our founders, Mr. Bangxin Zhang and Mr. Yundong Cao, offered our first after-school mathematics tutoring class in August 2003 when they were still attending graduate schools in Peking University. Two other members of our senior management, Dr. Yachao Liu and Mr. Yunfeng Bai, joined us as teachers in 2003 and 2005, respectively, and have risen to senior management positions due to their outstanding performance. In 2005, our founders established Xueersi Education, a domestic company in China. In order to facilitate foreign investment in our company, we incorporated TAL Group to become our offshore holding company under the laws of the Cayman Islands on January 10, 2008. TAL Group established Xueersi Hong Kong in Hong Kong in March 2008 as our intermediary holding company. See “Management’s Discussion and Analysis of Financial Condition and Results of Operations—Taxation—PRC” for a discussion of tax implications of having Xueersi Hong Kong as our intermediary holding company. Xueersi Hong Kong subsequently established three wholly owned subsidiaries in China: TAL Beijing in May 2008, Huanqiu Zhikang in September 2009 and Yidu Huida in November 2009.
Although we have expanded our business operations primarily through organic growth, we made five small business acquisitions in selected new geographic markets in 2008 to take advantage of the targets’ existing student base and operating licenses. The five acquisitions were: (i) the purchase of assets and related business of a school in Tianjin in March 2008 for consideration of $0.2 million; (ii) the acquisition of a school in Jianli, Hubei Province in July 2008 for consideration of $0.2 million; (iii) the acquisition of a school in Qianjiang, Hubei Province in July 2008 for consideration of $0.2 million; (iv) the acquisition of a school in Wuhan, Hubei Province in July 2008 for consideration of $1.6 million; and (v) the acquisition of Shanghai Leihai and its 100% owned subsidiaries in Shanghai in August 2008 for total consideration of $1.0 million.
49
Table of Contents
The following diagram illustrates our current corporate structure:

| (1) | Each person is an ultimate beneficial owner and also a director or executive officer of TAL Group. |
Due to the PRC legal restrictions on foreign ownership and investment in the education business in China, we rely on a series of contractual arrangements among TAL Beijing, Xueersi Education, Xueersi Network and their respective shareholders, subsidiaries and schools to conduct most of our tutoring services in China, while our personalized premium services in Beijing are offered through our subsidiary, Huanqiu Zhikang. These contractual arrangements enable us to:
| • | exercise effective control over Xueersi Education, Xueersi Network and their respective subsidiaries; | |
| • | receive substantially all of the economic benefits of Xueersi Education, Xueersi Network and their respective subsidiaries in consideration for the services provided by us; and | |
| • | have an exclusive option to purchase all of the equity interests in Xueersi Education and Xueersi Network when and to the extent permitted under PRC law. |
We do not have equity interests in Xueersi Education and Xueersi Network; however, as a result of these contractual arrangements, we are the primary beneficiary of Xueersi Network and Xueersi Education and treat them as our variable interest entities under U.S. GAAP. Accordingly, we refer to Xueersi Education and Xueersi Network collectively as our VIEs. We refer to our VIEs and the VIEs’ direct and indirect subsidiaries
50
Table of Contents
and schools collectively as “affiliated entities.” Moreover, in the contractual arrangements, the shareholders of the VIEs, in exchange for giving up effective control over the VIEs, received pro rata equity interests in TAL Group, which serves to align their interests with ours in performing those contracts. For a more detailed discussion of the risk of potential conflicts of interest associated with our corporate structure, see “Risk Factors—Risks Related to Our Corporate Structure—The shareholders of Xueersi Education and Xueersi Network may have potential conflicts of interest with us, which may materially and adversely affect our business and financial condition.”
We have consolidated the financial results of our VIEs and their subsidiaries in our consolidated financial statements in accordance with U.S. GAAP. For the three fiscal years ended February 29, 2008 and February 28, 2009 and 2010, respectively, $8.9 million, $37.5 million and $68.9 million, or 100%, 100% and 99.0% of our total net revenues are attributable to our affiliated entities.
We currently offer our personalized premium tutoring services in Beijing through Huanqiu Zhikang, our wholly owned subsidiary, which is a foreign-invested company under PRC laws. Except for our personalized premium services in Beijing, none of our existing business is conducted directly by our subsidiaries. Yidu Huida was formed as part of our corporate strategic planning and has yet to conduct any significant business operations. Yidu Huida may in the future provide information technology support to our other subsidiaries and affiliated entities, which is within the business scope of Yidu Huida. For a description of the risks associated with our offering personalized premium tutoring services in Beijing through Huanqiu Zhikang, see “Risk Factors—Risks Related to Doing Business in China—If the relevant PRC regulatory authorities determine that personalized premium services must be operated through registered schools or non-foreign-invested PRC companies, our personalized premium services business may be exposed to increased risks associated with the contractual arrangements.”
The services provided or expected to be provided by TAL Beijing, Huanqiu Zhikang and Yidu Huida are within their respective business scopes as set forth in their business licenses. In particular, the business scope of TAL Beijing includes research, development and production of computer hardware and software, system integration, sale of self-produced goods, technological services, technology transfer, technology consulting and management consulting; the business scope of Huanqiu Zhikang includes education consulting, investment consulting, business consulting and management consulting; and the business scope of Yidu Huida includes (i) research, development and production of computer hardware and software, information technology and system integration, (ii) technology consulting and training, technology transfer and technological services, (iii) management consulting and (iv) sale of self-produced goods.
Contractual Arrangements with Our Consolidated Affiliated Entities
The following is a summary of the material provisions of the agreements between TAL Beijing, our wholly owned subsidiary, and our affiliated entities and the respective shareholders of Xueersi Education and Xueersi Network. For more complete information you should read these agreements in their entirety. Directions on how to obtain copies of these agreements are provided in this prospectus under “Additional Information.”
Agreements that Transfer Economic Benefits to Us
Exclusive Business Cooperation Agreement. Pursuant to the Exclusive Business Cooperation Agreement entered into by and among TAL Beijing, the shareholders of Xueersi Education and Xueersi Network and each of our affiliated entities entered into in June 2010, which supersedes all agreements among parties with respect to subject matters thereof, TAL Beijing has the exclusive right to provide each of our affiliated entities comprehensive technical and business support services. Such services include educational software and course materials research and development, employee training, technology development, transfer and consulting services, public relation services, market survey, research and consulting services, market development and planning services, human resource and internal information management, network development, upgrade and ordinary maintenance services, sales of proprietary products, and software and trademark licensing and other additional services as the parties may mutually agree from time to time. Without the prior written consent of
51
Table of Contents
TAL Beijing, none of the affiliated entities may accept services covered by the Exclusive Business Cooperation Agreement provided by any third party. TAL Beijing owns the exclusive intellectual property rights created as a result of the performance of this agreement. Our affiliated entities agree to pay annual service fees to TAL Beijing and adjust the service fee rates from time to time at TAL Beijing’s discretion. The agreement will not expire unless terminated pursuant by a mutual agreement of parties. The Exclusive Business Cooperation Agreement entitles TAL Beijing to charge our affiliated entities annual service fees that amount to substantially all of the net income of the affiliated entities. TAL Beijing recognized service fees in the total amount of RMB183.3 million ($26.9 million), representing 100% of the net income before the service fees of the affiliated entities, as of August 31, 2010 in consideration for services provided to our affiliated entities; of this amount, which have been eliminated upon consolidation, RMB127.2 million ($18.7 million) has been paid. The payment of the annual service fees is determined by TAL Beijing based on our cash flow management. Under our current payment schedule, the unpaid balance of service fees is expected to be paid within next 12 to 24 months.
Call Option Agreement. Pursuant to a call option agreement, dated February 12, 2009, by and among TAL Beijing, Xueersi Education, Xueersi Network and the respective shareholders of Xueersi Education and Xueersi Network, the respective shareholders of Xueersi Education and Xueersi Network unconditionally and irrevocably granted TAL Beijing or its designated third party an exclusive option to purchase from the shareholders part or all of the equity interests in Xueersi Education and Xueersi Network, as the case may be, for the minimum amount of consideration permitted by the applicable PRC laws and regulations under the circumstances where TAL Beijing or its designated third party is permitted under PRC laws and regulations to own all or part of the equity interests of Xueersi Education and Xueersi Network or where we otherwise deem it necessary or appropriate to exercise the option. TAL Beijing has sole discretion to decide when to exercise the option, and whether to exercise the option in part or in full. The key factor for us to decide whether to exercise the option is whether the current regulatory restrictions on foreign investment in the educational service business will be removed in the future, the likelihood of which we are not in a position to know or comment on.
Agreements that Provide Effective Control over Our Consolidated Affiliated Entities
Power of Attorney. Each of the shareholders of Xueersi Education and Xueersi Network have executed an irrevocable power of attorney appointing TAL Beijing, or any person designated by TAL Beijing as their attorney-in-fact to vote on their behalf on all matters of Xueersi Education and Xueersi Network requiring shareholder approval under PRC laws and regulations and the articles of association of each of Xueersi Education and Xueersi Network. The power of attorney remains effective as long as the relevant person remains a shareholder of Xueersi Education and Xueersi Network.
The articles of association of Xueersi Education and Xueersi Network state that the major rights of the shareholders in a shareholders’ meeting include the power to approve the operating strategy and investment plan, elect the members of board of directors and approve their compensation and review and approve the annual budget and earning distribution plan. Therefore, through the irrevocable power of attorney arrangement, TAL Beijing has the ability to exercise effective control over Xueersi Education and Xueersi Network through shareholder votes and, through such votes, to also control the composition of the board of directors. In addition, the senior management team of Xueersi Education and Xueersi Network is the same as that of TAL Beijing. As a result of these contractual rights, we have the power to direct the activities of the VIEs that most significantly impact their economic performance.
Equity Pledge Agreement. Pursuant to an equity pledge agreement, dated February 12, 2009, by and among TAL Beijing, Xueersi Education, Xueersi Network and the respective shareholders of Xueersi Education and Xueersi Network, the respective shareholders of Xueersi Education and Xueersi Network unconditionally and irrevocably pledged all of their equity interests in Xueersi Education and Xueersi Network to TAL Beijing to guarantee performance of the obligations of Xueersi Education and Xueersi Network and their respective subsidiaries and schools under the technology support and service agreements with TAL Beijing. The shareholders of Xueersi Education and Xueersi Network agree that, without the prior written
52
Table of Contents
consent of TAL Beijing, they will not transfer or dispose the pledged equity interests or create or allow any encumbrance on the pledged equity interests that would prejudice TAL Beijing’s interest.
In the opinion of Tian Yuan Law Firm, our PRC legal counsel:
| • | the ownership structures of our affiliated entities and wholly owned subsidiaries in China, both currently and after giving effect to this offering, are in compliance with existing PRC laws and regulations; and | |
| • | the contractual arrangements among our wholly owned subsidiaries in China, our affiliated entities, the shareholders of Xueersi Education and the shareholders of Xueersi Network are valid, binding and enforceable under, and will not result in any violation of, PRC laws or regulations currently in effect. |
We have been advised by our PRC legal counsel, however, that there are substantial uncertainties regarding the interpretation and application of current and future PRC laws and regulations. Accordingly, there can be no assurance that the PRC regulatory authorities will not in the future take a view that is contrary to the above opinion of our PRC legal counsel. We have been further advised by our PRC counsel that if the PRC government finds that the agreements that establish the structure for operating our PRC education business do not comply with PRC government restrictions on foreign investment in the education business, we could be subject to severe penalties, which could include:
| • | revoking the business and operating licenses of our PRC subsidiaries and affiliated entities; | |
| • | restricting or prohibiting related party transactions between our PRC subsidiaries and affiliated entities; | |
| • | imposing fines or other requirements with which we or our PRC subsidiaries and affiliated entities may find difficult or impossible to comply; | |
| • | requiring us or our PRC subsidiaries and affiliated entities to restructure the relevant ownership structure or operations; and | |
| • | restricting or prohibiting the use of any proceeds from our additional public offering to finance our business and operations in China. |
The imposition of any of these penalties could result in a material adverse effect on our ability to conduct our business. See “Risk Factors—Risks Related to Our Corporate Structure—If the PRC government determines that the agreements that establish the structure for operating our business in China are not in compliance with applicable PRC laws and regulations, we could be subject to severe penalties” and “Risk Factors—Risks Related to Doing Business in China—Uncertainties with respect to the PRC legal system could have a material adverse effect on us.”
PRC Regulation of Loans and Direct Investment by Offshore Holding Companies
In utilizing the proceeds we receive from this offering in the manner described in “Use of Proceeds,” as an offshore holding company with PRC subsidiaries, we may (i) make additional capital contributions to our PRC subsidiaries, (ii) establish new PRC subsidiaries and make capital contributions to these new PRC subsidiaries, (iii) make loans to our PRC subsidiaries or our affiliated entities, or (iv) acquire offshore entities with business operations in China in an offshore transaction. However, most of these uses are subject to PRC regulations and approvals. For example:
| • | capital contributions to our subsidiaries in China, whether existing ones or newly established ones, must be approved by the PRC Ministry of Commerce or its local bureaus; |
53
Table of Contents
| • | loans by us to our subsidiaries in China, each of which is a foreign-invested enterprise, to finance their activities cannot exceed statutory limits and must be registered with the PRC State Administration of Foreign Exchange, or SAFE, or its local bureaus; and | |
| • | loans by us to our affiliated entities, which are domestic PRC entities, must be approved by the relevant government authorities and must also be registered with SAFE or its local bureaus. |
In addition, on August 29, 2008, SAFE promulgated Circular 142, a notice regulating the conversion by a foreign-invested company of its capital contribution in foreign currency into Renminbi. It requires that Renminbi converted from foreign currency-denominated capital of a foreign-invested enterprise may only be used for purposes within the business scope approved by the relevant government authority and may not be used to make equity investments in China, unless specifically provided otherwise. Moreover, the approved use of such Renminbi funds may not be changed without approval from SAFE. Renminbi funds converted from foreign exchange may not be used to repay loans in Renminbi if the proceeds of such loans have not yet been used. Any violation of Circular 142 may result in severe penalties, including substantial fines. We expect that if we convert the net proceeds from this offering into Renminbi pursuant to Circular 142, our use of Renminbi funds will be for purposes within the business approved scope of our PRC subsidiaries. However, we may not be able to use such Renminbi funds to make equity investments in the PRC through our PRC subsidiaries.
We expect that the PRC regulation of loans and direct investment by offshore holding companies to PRC entities may continue to limit our use of proceeds of this offering. There are no costs associated with registering loans or capital contributions with relevant PRC governmental authorities, other than nominal processing charges. Under PRC laws and regulations, the PRC governmental authorities are required to process such approvals or registrations or deny our application within a prescribed period which is usually less than 90 days. The actual time taken, however, may be longer due to administrative delay. We cannot assure you that we will be able to obtain these government registrations or approvals on a timely basis, if at all, with respect to our future plans to use the U.S. dollar proceeds we receive from this offering for our operations and expansion in China. If we fail to receive such registrations or approvals, our ability to use the proceeds of this offering and to capitalize our PRC operations may be negatively affected, which could materially and adversely affect our liquidity and ability to fund and expand our business.
We expect that the PRC regulations of loans and direct investment by offshore holding companies to PRC entities may continue to limit our use of proceeds of this offering. We cannot assure you that we will be able to obtain these government registrations or approvals on a timely basis, if at all, with respect to our future plans to use the U.S. dollar proceeds we receive from this offering for our expansion and operations in China. If we fail to receive such registrations or approvals, our ability to use the proceeds of this offering and to capitalize our PRC operations may be negatively affected, which could materially and adversely affect our liquidity and ability to fund and expand our business.
54
Table of Contents
SELECTED CONSOLIDATED FINANCIAL DATA
You should read the following information concerning us in conjunction with our consolidated financial statements and related notes and “Management’s Discussion and Analysis of Financial Condition and Results of Operations” included elsewhere in this prospectus.
The following selected consolidated statements of operations data for our company for the three fiscal years ended February 29, 2008 and February 28, 2009 and 2010 and the selected consolidated balance sheet data as of February 28, 2009 and 2010 are derived from our audited consolidated financial statements included elsewhere in this prospectus. The consolidated balance sheet data as of February 29, 2008 are derived from our audited financial statements, which are not included in this prospectus. Our audited consolidated financial statements are prepared in accordance with U.S. GAAP and have been audited by Deloitte Touche Tohmatsu CPA Ltd., an independent registered public accounting firm. The selected consolidated statements of operations data for the six months ended August 31, 2009 and 2010 and the selected consolidated balance sheet data as of August 31, 2010 have been derived from our unaudited interim condensed consolidated financial statements included elsewhere in this prospectus. We have prepared the unaudited interim condensed consolidated financial information on the same basis as our audited consolidated financial statements. The unaudited financial information includes all adjustments, consisting only of normal and recurring adjustments, that we consider necessary for a fair presentation of our financial position and operating results for the periods presented. You should read the summary consolidated financial information in conjunction with our consolidated financial statements and related notes and “Management’s Discussion and Analysis of Financial Condition and Results of Operations” included elsewhere in this prospectus. Our historical results are not necessarily indicative of results to be expected in any future period.
We have not included financial information for the fiscal years ended February 28, 2006 and 2007, as such information is not available without unreasonable effort or expense.
| For the Year Ended February 29/28, | For the Six Months Ended August 31, | |||||||||||||||||||
| 2008 | 2009 | 2010 | 2009 | 2010 | ||||||||||||||||
| (in thousands of $, except for shares, per share and per ADS data) | ||||||||||||||||||||
Consolidated Statements of Operations Data: | ||||||||||||||||||||
| Net revenues | $ | 8,882 | $ | 37,476 | $ | 69,594 | $ | 32,983 | $ | 53,022 | ||||||||||
| Total cost of revenues | (4,367 | ) | (18,554 | ) | (37,649 | ) | (16,068 | ) | (26,255 | )(1) | ||||||||||
| Gross profit | 4,515 | 18,922 | 31,945 | 16,915 | 26,767 | |||||||||||||||
| Operating expenses | ||||||||||||||||||||
| Selling and marketing | (370 | ) | (2,353 | ) | (5,608 | ) | (1,958 | ) | (4,184 | )(2) | ||||||||||
| General and administrative | (2,478 | ) | (5,890 | ) | (10,872 | ) | (4,602 | ) | (7,808 | )(3) | ||||||||||
| Impairment losses on intangible assets and goodwill | — | (1,615 | ) | — | — | — | ||||||||||||||
| Total operating expenses | (2,848 | ) | (9,858 | ) | (16,480 | ) | (6,560 | ) | (11,992 | ) | ||||||||||
| Income from operations | 1,667 | 9,064 | 15,465 | 10,355 | 14,775 | |||||||||||||||
| Interest income, net | 11 | 77 | 283 | 103 | 162 | |||||||||||||||
| Other expenses | — | (210 | ) | (124 | ) | (119 | ) | (27 | ) | |||||||||||
Impairment loss onavailable-for-sale securities | — | (363 | ) | — | — | — | ||||||||||||||
55
Table of Contents
| For the Year Ended February 29/28, | For the Six Months Ended August 31, | |||||||||||||||||||
| 2008 | 2009 | 2010 | 2009 | 2010 | ||||||||||||||||
| (in thousands of $, except for shares, per share and per ADS data) | ||||||||||||||||||||
| Gain from sales of available-for-sale securities | — | — | — | — | 6 | |||||||||||||||
| Gain on extinguishment of liabilities | — | 731 | — | — | — | |||||||||||||||
| Income before income tax provision | 1,678 | 9,299 | 15,624 | 10,339 | 14,916 | |||||||||||||||
| Provision for income tax | (165 | ) | (2,018 | ) | (1,379 | ) | (912 | ) | (1,670 | ) | ||||||||||
| Net income | $ | 1,513 | $ | 7,281 | $ | 14,245 | $ | 9,427 | $ | 13,246 | ||||||||||
| Deemed dividends on Series A convertible redeemable preferred shares | — | (4,113 | ) | — | — | — | ||||||||||||||
| Net income attributable to common shareholders | $ | 1,513 | $ | 3,168 | $ | 14,245 | $ | 9,427 | $ | 13,246 | ||||||||||
| Net income per common share: | ||||||||||||||||||||
| Basic | $ | 0.01 | $ | 0.03 | $ | 0.11 | $ | 0.08 | $ | 0.11 | ||||||||||
| Diluted | $ | 0.01 | $ | 0.03 | $ | 0.11 | $ | 0.08 | $ | 0.11 | ||||||||||
| Net income per Series A convertible redeemable preferred share-basic | — | $ | 17.69 | $ | 0.11 | $ | 0.08 | $ | 0.11 | |||||||||||
Net income per ADS(5): | ||||||||||||||||||||
| Basic | $ | 0.03 | $ | 0.05 | $ | 0.23 | $ | 0.15 | $ | 0.22 | ||||||||||
| Diluted | $ | 0.03 | $ | 0.05 | $ | 0.23 | $ | 0.15 | $ | 0.22 | ||||||||||
| Weighted average shares used in calculating net income per common share | ||||||||||||||||||||
| Basic | 120,000,000 | 120,000,000 | 120,000,000 | 120,000,000 | 120,000,000 | |||||||||||||||
| Diluted | 120,000,000 | 120,000,000 | 125,000,000 | 125,000,000 | 125,193,360 | |||||||||||||||
Pro forma net income per common share(4) | ||||||||||||||||||||
| Basic | — | — | $ | 0.11 | — | $ | 0.10 | |||||||||||||
| Diluted | — | — | $ | 0.11 | — | $ | 0.10 | |||||||||||||
Pro forma net income per ADS(4)(5) | ||||||||||||||||||||
| Basic | — | — | $ | 0.22 | — | $ | 0.21 | |||||||||||||
| Diluted | — | — | $ | 0.22 | — | $ | 0.21 | |||||||||||||
Weighted average shares used in calculating pro forma net income per common share(4) | ||||||||||||||||||||
| Basic | — | — | 123,151,008 | — | 123,350,832 | |||||||||||||||
| Diluted | — | — | 128,151,008 | — | 128,350,832 | |||||||||||||||
| Notes: | ||
| (1) | Includes share-based compensation expenses of $110 thousand. | |
| (2) | Includes share-based compensation expenses of $163 thousand. | |
| (3) | Includes share-based compensation expenses of $647 thousand. | |
| (4) | Unaudited pro forma net income per common share is computed by dividing net income attributable to common shareholders by the sum of (i) the weighted average number of common shares outstanding and (ii) the number of common shares whose proceeds, calculated using the initial public offering price of $10.00 per ADS, or $5.00 per common share, would be necessary to pay the amount by which the conditional $30.0 million cash dividend exceeds our earnings for the fiscal year ended February 28, 2010. | |
| (5) | Each ADS represents two Class A common shares. |
56
Table of Contents
| As of February 29/28, | ||||||||||||||||||||
| 2008 | 2009 | 2010 | As of August 31, 2010 | |||||||||||||||||
| Actual | Actual | Actual | Actual | Pro Forma(1) | ||||||||||||||||
| (in thousands of $) | ||||||||||||||||||||
Selected Consolidated Balance Sheet Data | ||||||||||||||||||||
| Cash and cash equivalents | $ | 5,704 | $ | 29,693 | $ | 50,752 | $ | 81,495 | 81,495 | |||||||||||
| Total assets | 8,131 | 38,553 | 65,504 | 97,515 | 97,515 | |||||||||||||||
| Deferred revenue | 5,714 | 18,023 | 29,408 | 42,101 | 42,101 | |||||||||||||||
| Convertible loan | — | — | 500 | 500 | 500 | |||||||||||||||
| Total liabilities | 7,012 | 26,198 | 38,578 | 56,234 | 86,234 | |||||||||||||||
| Net assets | 1,119 | 12,355 | 26,926 | 41,281 | 11,281 | |||||||||||||||
| Series A convertible redeemable preferred shares | — | 9,000 | 9,000 | 9,000 | — | |||||||||||||||
| Total equity | 1,119 | 3,355 | 17,926 | 32,281 | 11,281 | |||||||||||||||
| Note: | ||
| (1) | Reflects the automatic conversion of all of our Series A preferred shares into 5,000,000 Class B common shares immediately prior to the completion of this offering and the accrual of a $30.0 million cash dividend declared to our shareholders of record as of the dividend declaration date and payable upon the completion of this offering. |
57
Table of Contents
MANAGEMENT’S DISCUSSION AND ANALYSIS OF
FINANCIAL CONDITION AND RESULTS OF OPERATIONS
FINANCIAL CONDITION AND RESULTS OF OPERATIONS
You should read the following discussion and analysis of our financial condition and results of operations in conjunction with the section entitled “Selected Consolidated Financial Data” and our consolidated financial statements and the related notes included elsewhere in this prospectus. This discussion contains forward-looking statements that involve risks and uncertainties. Our actual results and the timing of selected events could differ materially from those anticipated in these forward-looking statements as a result of various factors, including those set forth under “Risk Factors” and elsewhere in this prospectus.
Overview
We are the largest K-12 after-school tutoring service provider in China as measured by income from operations in 2009, according to iResearch. In terms of revenues in 2009, we are one of the largest K-12 after-school tutoring service providers in China, according to iResearch. We offer comprehensive tutoring services to K-12 students, covering core academic subjects, including mathematics, English, Chinese, physics, chemistry and biology. The K-12 after-school tutoring service market in China is highly fragmented. In 2009, we had a 0.26% market share in China and a 4.5% market share in Beijing, in each case as measured by revenues for the year according to iResearch.
We deliver our tutoring services through small classes, personalized premium services (i.e.,one-on-one tutoring) and online course offerings. Our extensive network consists of 109 learning centers and 87 service centers in Beijing, Shanghai Shenzhen, Guangzhou, Tianjin, and Wuhan, as well as our online platform. Our student enrollments increased from 67,996 in the fiscal year ended February 29, 2008 to 382,505 in the fiscal year ended February 28, 2010, representing a CAGR of 137.2%. Our student enrollment growth has been predominantly driven by new students.
We have experienced significant growth in our business in recent years. Our total net revenues increased from $8.9 million in the fiscal year ended February 29, 2008 to $69.6 million in the fiscal year ended February 28, 2010, representing a CAGR of 179.9%. Our net income increased from $1.5 million in the fiscal year ended February 29, 2008 to $14.2 million in the fiscal year ended February 28, 2010, representing a CAGR of 206.9%. Our total net revenues and net income was $53.0 million and $13.2 million, respectively, for the six months ended August 31, 2010.
Factors Affecting Our Results of Operations
We have benefited significantly from the overall economic growth, the increase in household disposable income, the rising household spending on private education and the intense competition for quality education in China. We anticipate that the demand for K-12 after-school tutoring services will continue to grow. According to iResearch, the K-12 after-school tutoring market in China grew from RMB123.8 billion in 2007 to RMB189.7 billion ($27.8 billion) in 2009, representing a CAGR of 23.8%, and is projected to grow to RMB447.2 billion ($65.5 billion) in 2014, representing a CAGR of 18.7% from 2009. However, any adverse changes in the economic conditions in China that adversely affect the K-12 after-school tutoring service market in China may harm our business and results of operations.
Our results of operations are also affected by the education system or policies relating to after-school tutoring service market in China. Due to the PRC legal restrictions on foreign ownership and investment in education business in China, we rely on a series of contractual arrangements among TAL Beijing, Xueersi Education, Xueersi Network and their respective shareholders, subsidiaries and schools to conduct most of our tutoring services in China, while our personalized premium services in Beijing are offered through Huanqiu Zhikang. We do not have equity interests in Xueersi Education and Xueersi Network; however, as a result of these contractual arrangements, we are the primary beneficiary of Xueersi Education and Xueersi Network and treat them as our variable interest entities under U.S. GAAP. In the opinion of Tian Yuan Law Firm, our PRC legal counsel, the ownership structures of our affiliated entities and wholly owned subsidiaries in China, both currently and after giving effect to this offering, are in compliance with existing PRC laws and regulations. We have been advised by our PRC legal counsel, however, that there are substantial uncertainties regarding the
58
Table of Contents
interpretation and application of current and future PRC laws and regulations. See “Risk Factors—Risks Related to Our Corporate Structure—If the PRC government determines that the agreements that establish the structure for operating our business in China are not in compliance with applicable PRC laws and regulations, we could be subject to severe penalties” and “Risk Factors—Risks Related to Doing Business in China—Uncertainties with respect to the PRC legal system could have a material adverse effect on us.”
While our business is influenced by factors affecting the private education industry in China generally and by conditions in each of the geographic markets covered by our service network, we believe that our results of operations are more directly affected by company-specific factors, including the number of student enrollments, the pricing of our tutoring services and the amount of our costs and expenses.
Number of Student Enrollments
Our revenue growth is primarily driven by the increase in the number of student enrollments, which is directly affected by the number of our learning centers, the number and varieties of our courses and service offerings, our annual retention rate, our ability to attract new students and the effectiveness of our cross-selling efforts.
We have, over the past three fiscal years, opened new learning centers to further penetrate our existing markets and enter new markets. The number of our learning centers grew from 30 in Beijing, Shanghai and Wuhan as of February 29, 2008, to 109 in Beijing, Shanghai, Shenzhen, Guangzhou, Tianjin and Wuhan to date. We plan to open additional learning centers in these six cities and explore opportunities to open learning centers in other targeted geographic markets in China in order to continue to attract new student enrollments.
In addition, we have significantly expanded our course offerings to cover new subjects and additional grade levels over the past three fiscal years. In Beijing, we grew from primarily offering tutoring classes in mathematics to becoming a comprehensive after-school tutoring service provider, covering all core subjects in China’s school curricula at each grade level of the K-12 system. We initially offered only small-class tutoring services, and then added personalized premium services in September 2007 and began offering online courses in January 2010. Our expansion of courses and service offerings allows us to better attract new students with different needs and provide us greater cross-selling opportunities with respect to our existing students.
To date, we have enjoyed a high annual retention rate of over 70%, as a result of our high quality services. A high annual retention rate coupled with our ability to cross-sell additional courses and service offerings to existing students has also contributed to our total student enrollment growth.
We expect our student enrollments will continue to grow and the tuition fees will remain relatively stable in the near term. We raised the hourly rates of our courses in the summer of 2010 and have no immediate plan for further increases. We believe that theK-12 after-school tutoring service market is not very sensitive to changes in economic conditions, and we therefore do not expect the current economic conditions to have any significant impact on our business.
Pricing
Our results of operations are also affected by the pricing for our tutoring services. We generally charge students based on the hourly rates of our courses and the total number of hours for all the courses taken by each student. We determine hourly rates for our courses primarily based on the demand for our courses, cost of our services, the geographic markets where the courses are offered, and the fees charged by our competitors for the same or similar courses. Due to our high quality services and the outstanding performance track record of our students, we have been able to price above the market rates and increase our hourly rates in fiscal years 2009 and 2011.
Costs and Expenses
Our ability to maintain and increase profitability also depends on our ability to effectively control our costs and expenses. A significant component of our cost of revenues is compensation to our teachers. We offer competitive remunerations to our teachers in order to attract and retain top teaching talent. Salaries and other
59
Table of Contents
compensation to our teachers accounted for approximately 25% of our net revenues in each of the two most recent fiscal years and 23% of our net revenues for the six months ended August 31, 2010. Another important component of our cost of revenues is rental expenses for our learning and service centers, which have remained stable at approximately 14% of our net revenues in each of the two most recent fiscal years. Our cost of revenues as a percentage of our total net revenues was 49.2%, 49.5% and 54.1% for fiscal years 2008, 2009 and 2010, respectively. This increase was largely a result of the rapid expansion of our facilities and network, including our additional investments in human resources, course materials and leasehold improvements in anticipation of further student enrollment growth. Our operating expenses include two key components, selling and marketing expenses and general and administrative expenses. From fiscal year 2008 to fiscal year 2010, our total operating expenses as a percentage of our total net revenues decrease from 32.1% to 23.7%. During the same period, our selling and marketing expenses as a percentage of our total net revenues increased from 4.2% to 8.1%, mainly due to the expansion of our sales and marketing personnel in anticipation of future student enrollment growth. This increase in selling and marketing expenses was offset by the significant decline of our general and administrative expenses as a percentage of our total net revenues from 27.9% in fiscal year 2008 to 15.6% in fiscal year 2010, primarily as a result of our increasing economies of scale and improved operating efficiency. For the six months ended August 31, 2010, our cost of revenues as a percentage of our total net revenues was 49.5%, and each of our total operating expenses, selling and marketing expenses and general and administrative expenses as a percentage of our total net revenues was 22.6%, 7.9% and 14.7%, respectively. Going forward, we expect that our total costs and expenses will increase due to the expansion of our services and operations and additional costs and expenses associated with becoming a public company; however, such increase is likely to be partially offset by our increasing economies of scale and improved operating efficiency.
Key Components of Results of Operations
Net Revenues
In the fiscal years ended February 29, 2008 and February 28, 2009 and 2010 and for the six months ended August 31, 2010, we generated total net revenues of $8.9 million, $37.5 million, $69.6 million and $53.0 million, respectively. We derive substantially all of our revenues from tutoring services, including small classes and personalized premium services. We also generate a small amount of revenues from selling educational materials to students at our learning centers and most recently, from our online course offerings. Revenues generated from our online course offerings contributed less than 1.5% of our total net revenues since we began offering online courses in 2010. Our revenues are presented net of business tax.
We generally collect course fees in advance, which we initially record as deferred revenues. We recognize course fees as revenues proportionately as the tutoring courses are delivered. We had deferred revenues in the amounts of $18.0 million, $29.4 million and $42.1 million as of February 28, 2009 and 2010 and August 31, 2010, respectively.
For small-class courses consisting of more than seven classes per course, we offer tuition refunds for any remaining unattended classes to students who decide to withdraw from a course, provided that the course is less than two-thirds completed at the time of withdrawal. For personalized premium services, a student can withdraw at any time and receive a refund for the undelivered classes. Refunds are recorded as deductions to deferred revenues. We have not experienced significant refunds in the past.
60
Table of Contents
Cost of Revenues and Operating Expenses
The following table sets forth, for the periods indicated, our cost of revenues and operating expenses, in absolute amounts and as percentages of the total net revenues:
| For the Year Ended February 29/28, | For the Six Months Ended August 31, | |||||||||||||||||||||||||||||||||||||||
| 2008 | 2009 | 2010 | 2009 | 2010 | ||||||||||||||||||||||||||||||||||||
| $ | % | $ | % | $ | % | $ | % | $ | % | |||||||||||||||||||||||||||||||
| (in thousands of $, except percentages) | ||||||||||||||||||||||||||||||||||||||||
| Net revenues | 8,882 | 100.0 | % | 37,476 | 100.0 | % | 69,594 | 100.0 | % | 32,983 | 100.0 | % | 53,022 | 100.0 | % | |||||||||||||||||||||||||
| Total cost of revenues | (4,367 | ) | (49.2 | ) | (18,554 | ) | (49.5 | ) | (37,649 | ) | (54.1 | ) | (16,068 | ) | (48.7 | ) | (26,255 | )(1) | (49.5 | ) | ||||||||||||||||||||
| Operating expenses: | ||||||||||||||||||||||||||||||||||||||||
| Selling and marketing | (370 | ) | (4.2 | ) | (2,353 | ) | (6.3 | ) | (5,608 | ) | (8.1 | ) | (1,958 | ) | (5.9 | ) | (4,184 | )(2) | (7.9 | ) | ||||||||||||||||||||
| General and administrative | (2,478 | ) | (27.9 | ) | (5,890 | ) | (15.7 | ) | (10,872 | ) | (15.6 | ) | (4,602 | ) | (14.0 | ) | (7,808 | )(3) | (14.7 | ) | ||||||||||||||||||||
| Impairment losses on intangible assets and goodwill | — | — | (1,615 | ) | (4.3 | ) | — | — | — | — | — | — | ||||||||||||||||||||||||||||
| Total operating expenses | (2,848 | ) | (32.1 | )% | (9,858 | ) | (26.3 | )% | (16,480 | ) | (23.7 | )% | (6,560 | ) | (19.9 | )% | (11,992 | ) | (22.6 | )% | ||||||||||||||||||||
| Notes: | ||
| (1) | Includes share-based compensation expenses of $110 thousand. | |
| (2) | Includes share-based compensation expenses of $163 thousand. | |
| (3) | Includes share-based compensation expenses of $647 thousand. |
Cost of Revenues
Our cost of revenues primarily consists of compensation to our teachers and rental payments for all of our learning centers and service centers, compensation to personnel providing educational service support, and to a lesser extent, depreciation and amortization of property and equipment used in the provision of educational services and costs of course materials. We expect our cost of revenues to increase as we further expand our network and operations by opening new learning centers and service centers and hiring additional teachers.
Operating Expenses
Our operating expenses consist primarily of selling and marketing expenses and general and administrative expenses.
Our selling and marketing expenses primarily consist of compensation and benefits to our personnel involved in sales and marketing, as well as expenses relating to our marketing and branding promotion activities. Our selling and marketing expenses also include expenses associated with the development and maintenance of our online platform, www.eduu.com, which is a key component of our marketing strategy to increase student loyalty and stickiness, and enhance our brand awareness. Asword-of-mouth referrals and our online communities have contributed significantly to student recruitment, we have not incurred significant advertising expenses in the past. In anticipation of future growth, we increased the number of personnel in our selling and marketing functions in fiscal years 2009 and 2010, resulting in an increase in selling and marketing expenses as a percentage of net revenues from 4.2% in the fiscal year ended February 29, 2008 to 8.1% in the fiscal year ended February 28, 2010. Our selling and marketing expenses as a percentage of net revenues was 7.9% for the six months ended August 31, 2010. We do not expect that our selling and marketing expenses will significantly increase as a percentage of net revenues in the near future.
Our general and administrative expenses primarily consist of compensation and benefits paid to our management and administrative personnel, costs of third-party professional services, rental and utilities expenses relating to office and administrative functions and, to a lesser extent, depreciation and amortization of property and equipment used in our administrative activities. Our general and administrative expenses as a percentage of our total net revenues decreased from 27.9% in fiscal year 2008, to 15.7% in fiscal year 2009 and 15.6% in fiscal year 2010, primarily as a result of our increasing economies of scale and improved operating efficiency. For the six months ended August 31, 2010, our general and administrative expenses as a
61
Table of Contents
percentage of our total net revenues was 14.7%. We expect that our general and administrative expenses will increase in the near term as we hire additional personnel and incur additional expenses in connection with the expansion of our business operations, with becoming a publicly traded company, enhancing our internal controls and providing share-based compensation to our employees.
Taxation
Cayman Islands
We are incorporated in the Cayman Islands. Under the current law of the Cayman Islands, we are not subject to income or capital gains tax. In addition, dividend payments are not subject to withholding tax in the Cayman Islands.
Hong Kong
Our wholly owned subsidiary in Hong Kong, Xueersi Hong Kong, is subject to Hong Kong profits tax on its activities conducted in Hong Kong. No provision for Hong Kong Profits tax has been made in the consolidated financial statements as Xueersi Hong Kong has no assessable income for the years ended February 28, 2009 and February 28, 2010.
PRC
Our subsidiaries in China are companies incorporated under PRC law and, as such, are subject to PRC enterprise income tax on their taxable income in accordance with the relevant PRC income tax laws.
Pursuant to the EIT Law, which became effective on January 1, 2008, a uniform 25% enterprise income tax rate is generally applicable to both foreign-invested enterprises and domestic enterprises, except where a special preferential rate applies.
Our affiliated entity, Xueersi Education, was qualified as a “High and New Technology Enterprise,” under the EIT Law effective January 1, 2008 and therefore was qualified for a preferential tax rate of 15%. In addition, since Xueersi Education is located in a high and new technology industrial zone in Beijing and qualified as a High and New Technology Enterprise, it was entitled to a three-year exemption from the enterprise income tax from calendar year 2006 to 2008 and a further tax reduction to a rate of 7.5% from calendar year 2009 to 2011. Our wholly owned subsidiary, TAL Beijing, was qualified as a “Newly Established Software Enterprise” under the EIT Law and therefore entitled to a two-year exemption from the enterprise income tax from calendar year 2009 to 2010 and a further tax reduction to 50% of the applicable rate from calendar year 2011 to 2013. Our affiliated entities, Xueersi Network and Beijing Haidian District Xueersi Training School, were entitled to a one-year tax exemption in calendar year 2007 as newly established companies in that year.
On April 21, 2010, the State Administration of Taxation issued Circular 157,Further Clarification on Implementation of Preferential EIT Rate during Transition Periods, or Circular 157. Circular 157 seeks to provide additional guidance on the interaction of certain preferential tax rates under the transitional rules of the EIT Law. Prior to Circular 157, we interpreted the law to mean that if a “high and new technology enterprise strongly supported by the state” or “High and New Technology Enterprise” was in a tax holiday period that provides for“2-year exemption plus3-year half rate” or“5-year exemption plus5-year half rate” or other tax exemptions and reductions, where it was entitled to a 50% reduction in the tax rate and was also entitled to a 15% rate of tax due to its High and New Technology Enterprise status under the EIT Law, then it was entitled to pay tax at the rate of 7.5%. Circular 157 appears to have the effect that such an entity is entitled to pay tax at the lower of 15% and 50% of the standard PRC tax rate, which is currently 25%. It is unclear whether Circular 157 would apply retrospectively but we understand that the State Administration of Taxation has recently taken the position that Circular 157 applies only to tax years commencing from January 1, 2010.
Based on the interpretation of Circular 157 from the relevant local tax authority, we believe that entities that are qualified for“3-year exemption plus3-year half rate” tax holiday as High and New Technology
62
Table of Contents
Enterprises and are registered in the Zhongguancun High and New Technology Industrial Zone of Beijing will continue to pay income tax at a rate of 7.5%. Since Xueersi Education enjoys“3-year exemption plus3-year half rate” and is a High and New Technology Enterprise registered in the Zhongguancun High and New Technology Industrial Zone of Beijing, we do not believe that Circular 157 has any effect on our tax position.
Preferential tax treatments granted to our affiliated entities in the PRC by local governmental authorities are subject to review and may be adjusted or revoked at any time. In addition, if the government regulations or authorities were to phase out preferential tax benefits currently granted to a “High and New Technology Enterprise,” Xueersi Education would be subject to the standard statutory tax rate, which currently is 25%. The discontinuation of any preferential tax treatments currently available to us, will cause our effective tax rate to increase, which could have a material adverse effect on our results of operations.
As a Cayman Islands holding company, substantially all of our income is derived from dividends we receive from our PRC operating subsidiaries through Xueersi Hong Kong. The EIT Law and its implementing rules provide that dividends paid by a PRC entity to a non-resident enterprise for income tax purposes is subject to PRC withholding tax at a rate of 10%, subject to reduction by an applicable tax treaty with the PRC. According to the Arrangement between Mainland China and the Hong Kong Special Administrative Region for the Avoidance of Double Taxation and Prevention of Fiscal Evasion, dividends paid to shareholders residing in Hong Kong are subject to a reduced 5% rate of tax withholding provided the Hong Kong residents’ equity interests in the mainland dividend issuer is above 25%. However, the State Administration for Taxation promulgated SAT Circular 601 on October 27, 2009, which provides guidance for determining whether a resident of a contracting state is the “beneficial owner” of an item of income under China’s tax treaties and tax arrangements. According to SAT Circular 601, a beneficial owner generally must engage in substantive business activities. An agent or conduit company will not be regarded as a beneficial owner and, therefore, will not qualify for treaty benefits. A conduit company normally refers to a company that is set up for the purpose of avoiding or reducing taxes or transferring or accumulating profits. Although we may use Xueersi Hong Kong as a platform to expand our business in the future, Xueersi Hong Kong currently does not engage in any substantive business activities and thus it is possible that Xueersi Hong Kong may not be regarded as a “beneficial owner” for the purposes of SAT Circular 601 and the dividends it receives from our PRC subsidiaries would be subject to withholding tax at a rate of 10%. In addition, Xueersi Hong Kong may be considered a PRC resident enterprise for enterprise income tax purposes if the relevant PRC tax authorities determine that Xueersi Hong Kong’s “de facto management bodies” are within the PRC, in which case dividends received by it from our PRC subsidiaries would be exempt from PRC withholding tax because such income is exempted under the EIT Law for a PRC resident enterprise recipient. As there remains uncertainties regarding the interpretation and implementation of the EIT Law and its implementation rules, it is uncertain whether, if we are deemed a PRC resident enterprise, any dividends to be distributed by us to our non-PRC shareholders and ADS holders would be subject to any PRC withholding tax. For a detailed discussion of PRC tax issues related to resident enterprise status, see “Risk Factors—Risks Related to Doing Business in China—Under the EIT Law, we may be classified as a “resident enterprise” of China. Such classification could result in unfavorable tax consequences to us and our non-PRC shareholders.”
Internal Control over Financial Reporting
In the course of preparing our consolidated financial statements, we and our independent registered public accounting firm identified a material weakness as defined in the U.S. Public Company Accounting Oversight Board Standard AU Section 325, Communicating Internal Control Related Matters Identified in an Audit, or AU325, in our internal control over financial reporting as of February 28, 2010. As defined in AU325, a “material weakness” is a deficiency, or a combination of deficiencies, in internal control over financial reporting, such that there is a reasonable possibility that a material misstatement of the company’s annual or interim financial statements will not be prevented or detected on a timely basis. The material weakness identified related to insufficient accounting personnel with appropriate U.S. GAAP knowledge. Following the
63
Table of Contents
identification of the material weakness, we hired a chief financial officer with publicly listed company and securities regulation experience in June 2010.
Neither we nor our independent registered public accounting firm undertook a comprehensive assessment of our internal control for purposes of identifying and reporting material weakness and other control deficiencies in our internal control over financial reporting as we and they will be required to do once we become a public company. It is possible that, had we performed a formal assessment of our internal control over financial reporting or had our independent registered public accounting firm performed an audit of our internal control over financial reporting, additional control deficiencies may have been identified.
We plan to take additional measures to improve our internal control over financial reporting in 2011 and 2012, including (1) hiring additional accounting personnel with extensive experience in U.S. GAAP and SEC reporting requirements and strong analytical skills; (2) providing regular training on an ongoing basis to our accounting personnel that cover a broad range of accounting and financial reporting topics; and (3) developing a more comprehensive manual with detailed step by step guidance on accounting policies and procedures and continuing to update the manual as needed. We are not able to estimate with reasonable certainty the costs that we will need to incur to implement these and other measures designed to improve our internal control over financial reporting. See “Risk Factors—Risks Related to Our Business—In the course of preparing our consolidated financial statements, a material weakness in our internal control over financial reporting was identified. If we fail to maintain an effective system of internal control over financial reporting, we may be unable to accurately report our financial results or prevent fraud, and investor confidence and the market price of our ADSs may be adversely affected.”
Acquisitions
Although we have expanded our business operations primarily through organic growth, we made five small business acquisitions in selected new geographic markets in 2008 to take advantage of the targets’ existing student base and operating licenses. The five acquisitions were: (i) the purchase of assets and related business of a school in Tianjin in March 2008 for consideration of $0.2 million; (ii) the acquisition of a school in Jianli, Hubei Province in July 2008 for consideration $0.2 million; (iii) the acquisition of a school in Qianjiang, Hubei Province in July 2008 for consideration $0.2 million; (iv) the acquisition of a school in Wuhan, Hubei Province in July 2008 for consideration $1.6 million; and (v) the acquisition of Shanghai Lehai and its 100% owned subsidiaries in Shanghai in August 2008 for total consideration of $1.0 million.
Critical Accounting Policies
We prepare our financial statements in accordance with U.S. GAAP, which requires us to make estimates and assumptions that affect our reporting of, among other things, assets and liabilities, contingent assets and liabilities and net revenues and expenses. We continually evaluate these estimates and assumptions based on the most recently available information, our own historical experiences and other factors that we believe to be relevant under the circumstances. Our management has discussed the development, selection and disclosure of these estimates with our board of directors. Since our financial reporting process inherently relies on the use of estimates and assumptions, actual results may differ from these estimates under different assumptions or conditions.
An accounting policy is considered to be critical if it requires an accounting estimate to be made based on assumptions about matters that are highly uncertain at the time the estimate is made, and if different estimates that could reasonably have been used, or changes in the accounting estimates that are reasonably likely to occur periodically, could materially impact the consolidated financial statements. We consider the policies discussed below to be critical to an understanding of our audited consolidated financial statements because they involve the greatest reliance on our management’s judgment. You should read the following descriptions of critical accounting policies, judgments and estimates in conjunction with our consolidated financial statements and other disclosures included with this prospectus.
64
Table of Contents
Revenue recognition
We derive substantially all of our revenues from tutoring services, including small classes, personalized premium services and online education services.
A student subscribes for a course containing a fixed number of classes. A typical course consists of 15 to 16 classes during each of the school semesters and 7 to 12 classes during each of the summer and winter breaks. Tuition revenue is generally collected in advance and is initially recorded as deferred revenue. Tuition revenue is then recognized proportionately as the tutoring classes are delivered.
For small-class courses consisting of more than seven classes per course, we offer refunds for any remaining classes to students who decide to withdraw from a course, provided the course is less than two-thirds completed at the time of withdrawal. After two-thirds of a course is delivered, no refund is allowed. For small-class courses with less than seven classes, no refund will be provided after the commencement of the courses. For personalized premium services, a student can withdraw at any time and receive a refund for the undelivered classes. We have not experienced significant refunds in the past.
We offer coupons to attract both existing and prospective students to enroll in our courses. The coupon has a fixed dollar amount and can only be redeemed against a future course. The coupon value, when utilized by an enrolling student, is accounted for as a reduction of revenue when the relevant revenue is recognized in the consolidated statements of operations.
We sell educational materials to students at our learning centers. Revenue is recognized when the educational content or other educational materials are delivered and collection of the receivables is reasonably assured.
We began to offer online courses to students in 2010. Students enroll in online courses through the use of prepaid study cards. The proceeds collected from the online courses are initially recorded as deferred revenues. Revenues are recognized on a straight line basis over the subscription period from the date when the students activate the courses to the date when the subscribed courses end. We provide refunds for courses that are not taken to students who decide to withdraw from the subscribed courses within the course offer period, which generally ranges from one month to six months.
Goodwill and Intangible Assets
Goodwill represents the cost of an acquired business in excess of the fair value of identifiable tangible and intangible net assets purchased. We generally seek the assistance of independent valuation firms in determining the fair value of the identifiable tangible and intangible net assets of the acquired business. We assign all the assets and liabilities of an acquired business, including goodwill, to reporting units.
There are several methods that can be used to determine the fair value of assets acquired and liabilities assumed. For intangible assets, we typically use the income method. This method starts with a forecast of all of the expected future net cash flows associated with a particular intangible asset. These cash flows are then adjusted to present value by applying an appropriate discount rate that reflects the risk factors associated with the cash flow streams. Some of the more significant estimates and assumptions inherent in the income method or other methods include the amount and timing of projected future cash flows; the discount rate selected to measure the risks inherent in the future cash flows; and the assessment of the asset’s economic life cycle and the competitive trends impacting the asset, including consideration of any technical, legal, regulatory or economic barriers to entry. Determining the useful life of an intangible asset also requires judgment as different types of intangible assets will have different useful lives and certain assets may even be considered to have indefinite useful lives.
Goodwill is tested for impairment at least once each year on the last day of February. Impairment is tested using a two-step process. The first step compares the fair value of each reporting unit to its carrying amount, including goodwill. If the fair value of each reporting unit exceeds its carrying amount, goodwill is not considered to be impaired and the second step will not be required. If the carrying amount of a reporting unit exceeds its fair value, the second step compares the implied fair value of goodwill to the carrying value of a reporting unit’s goodwill. The implied fair value of goodwill is determined in a manner similar to
65
Table of Contents
accounting for a business combination with the allocation of the assessed fair value determined in the first step to the assets and liabilities of the reporting unit. The excess of the fair value of the reporting unit over the amounts assigned to the assets and liabilities is the implied fair value of goodwill. An impairment loss is recognized for any excess in the carrying value of goodwill over the implied fair value of goodwill.
Estimating fair value is performed by utilizing various valuation techniques, with the primary technique being the discounted cash flow method.
We currently have 14 reporting units and only five reporting units carry assigned goodwill: Wuhan Jianghanqu Xiaoxinxing English Training School (“Wuhan School”), Hubei Qianjiang Xiaohafu English Training School (“Qianjiang School”), Hubei Jianli Hafu English Training School (“Jianli School”), Shanghai Lehai Science and Technology Information Co., Ltd. (“Shanghai Lehai”), and Xueersi Education.
We recorded an impairment of goodwill of approximately $1.2 million in the year ended February 28, 2009 in respect of Wuhan School and Qianjiang School because the post-acquisition performance of these reporting units was not in line with our expectations at the date of acquisition. We used the income approach as the primary approach in determining the impairment of goodwill on these reporting units as of February 28, 2009, and relied in part on a valuation report prepared by American Appraisal China Limited based on data we provided.
The projected cash flow estimate included, among other things, an analysis of projected revenue growth, gross margins, and long-term growth rates. The income approach involves applying appropriate discount rates, based on earnings forecasts, to estimated cash flows. The key assumptions of our cash flow forecasts we used in deriving the fair values of these two reporting units as of February 28, 2009 were consistent with the assumptions that we used in developing our business plan, which included:
| • | Net revenues of Wuhan School and Qianjiang School would grow at a CAGR of 10.4% and 9.4%, respectively, from 2009 to 2014 primarily through an increase in the number of students. The long-term growth rate of Wuhan School and Qianjiang School after 2014 was assumed to be 3% per year. | |
| • | Cost of revenues mainly consists of teacher salary and welfare, rent, and tutoring materials. Cost of revenues as a percentage of revenues of Wuhan School was expected to decrease from 91% in 2009 to 62% of sales in 2014 because staff cost and rental would not grow as fast as revenues. Cost of revenues as a percentage of revenues of Qianjiang School was expected to increase from 53% in 2009 to 60% of sales in 2014. | |
| • | Operating expenses as a percentage of revenues were expected to decrease from 2009 to 2014 as we anticipated that corporate overhead and administrative expense would not increase as fast as revenues during the period due to the improvement of operating efficiency. | |
| • | There would be no material changes in the existing political, legal, fiscal and economic conditions in China and in our ability to recruit and retain competent management, key personnel and technical staff to support our ongoing operations. | |
| • | There was no material deviation in industry trends and market conditions from economic forecasts. |
These assumptions are inherently uncertain and subjective. The discount rates reflect the risks the management perceived as being associated with achieving the forecasts and are based on the estimated cost of capital of our reporting units, which was derived by using the capital asset pricing model, after taking into account systemic risks and non-systematic risks. The capital asset pricing model is a model commonly used by market participants for determining the fair values of assets that adds an assumed risk premium rate of return to an assumed risk-free rate of return. Using this method, we determined the discount rates of 20% and 30% to be appropriate for determining the fair values of Wuhan School and Qianjiang School. We considered the selected discount rates to properly reflect the uncertainty associated with the key assumptions of projected cash flows of these two reporting units as of February 28, 2009.
We evaluate intangible assets with a finite useful life impairment whenever events or changes in circumstances indicate that their carrying amounts may not be recoverable. Recoverability of long-lived assets
66
Table of Contents
to be held and used is measured by a comparison of the carrying amount of an asset to the future undiscounted net cash flows expected to be generated by the asset. If these assets are considered to be impaired, the impairment to be recognized is measured by the amount by which the carrying value of the assets exceeds the fair value of the assets. Estimates of fair value result from a complex series of judgments about future events and uncertainties and rely heavily on estimates and assumptions at a point in time. The judgments made in determining an estimate of fair value can materially impact our results of operations. The valuations are based on information available as of the impairment review date and are based on expectations and assumptions that have been deemed reasonable by management. Any changes in key assumptions, including unanticipated events and circumstances, may affect the accuracy or validity of such estimates and could potentially result in an impairment charge.
In the year ended February 28, 2009, we tested for impairment of the intangible and other long-lived assets recognized primarily in respect of Wuhan School and Qianjiang School because, as noted above, the performance of these acquisitions was not in line with our expectations. As a result, we recognized an impairment loss on intangible assets of $0.4 million.
Other-Than-Temporary Impairment of Investment in Available for Sale Securities
We value available for sale securities at fair value and take the unrealized changes in fair value to Accumulated Other Comprehensive Income, a component of equity. However, when an investment has a fair value below its original costs we are required to determine whether that impairment isother-than-temporary and, if so, it is required to be recognized in earnings. Determination of whether an impairment isother-than-temporary involves management’s judgment as to the severity and duration of the decline in fair value. As at February 28, 2009, we had available for sale securities with the carrying value of $0.7 million and which then had a fair value of $0.3 million as at February 28, 2010. We determined that in the market conditions at that time there could be no assurance as to when and if the fair value would recover and consequently recognized an impairment loss in earnings of $0.4 million.
Income Taxes
As part of the process of preparing our consolidated financial statements, we are required to estimate our income taxes in each of the jurisdictions in which we operate. This process involves us estimating our actual current tax exposure together with assessing temporary differences resulting from differing treatment of items for tax and accounting purposes. These differences result in deferred tax assets and liabilities, which are included within our consolidated balance sheet. We must then assess the likelihood that our deferred tax assets will be recovered from future taxable income and, to the extent we believe that recovery is not likely, we must establish a valuation allowance. To the extent we establish a valuation allowance or increase this allowance in a certain period, we must include an expense within the tax provision in the statement of operations.
Significant management judgment is required in determining our provision for income taxes, our deferred tax assets and liabilities and any valuation allowance recorded against our net deferred tax assets. The valuation allowance is based on our estimates of taxable income by jurisdiction in which we operate and the period over which our deferred tax assets will be recoverable. In the event that actual results differ from these estimates or we adjust these estimates in future periods, we may need to establish an additional valuation allowance, which could materially impact our financial position and results of operations.
The impact of an uncertain income tax position on the income tax return is recognized at the largest amount that is more-likely-than-not to be sustained upon audit by the relevant tax authority. An uncertain income tax position will not be recognized if it has less than a 50% likelihood of being sustained. Interest and penalties on income taxes will be classified as a component of the provisions for income taxes. The Group has concluded that there are no significant uncertain tax positions requiring recognition in financial statements for the years ended February 29, 2008, February 28, 2009 and 2010. The Group did not incur any interest and penalties related to potential underpaid income tax expenses and also does not anticipate any significant increases or decreases in unrecognized tax benefits in the next 12 months. The Group has no material
67
Table of Contents
unrecognized tax benefits which would favorably affect the effective income tax rate in future periods. The years 2007 to 2009 remain subject to examination by the PRC tax authorities.
Our affiliated entity, Xueersi Education, was qualified as a “High and New Technology Enterprise,” under the EIT Law effective January 1, 2008 and therefore was qualified for a preferential tax rate of 15%. In addition, since Xueersi Education is located in a high and new technology industrial zone in Beijing and qualified as a High and New Technology Enterprise, it was entitled to a three-year exemption from the enterprise income tax from calendar year 2006 to 2008 and a further tax reduction to a rate of 7.5% from calendar year 2009 to 2011. Our wholly owned subsidiary, TAL Beijing, was qualified as a “Newly Established Software Enterprise” under the EIT Law and therefore entitled to a two-year exemption from the enterprise income tax from calendar year 2009 to 2010 and a further tax reduction to 50% of the applicable rate from calendar year 2011 to 2013. Our affiliated entities, Xueersi Network and Beijing Haidian District Xueersi Training School, were entitled to a one-year tax exemption in calendar year 2007 as newly established companies in that year.
On April 21, 2010, the State Administration of Taxation issued Circular 157,Further Clarification on Implementation of Preferential EIT Rate during Transition Periods, or Circular 157. Circular 157 seeks to provide additional guidance on the interaction of certain preferential tax rates under the transitional rules of the EIT Law. Prior to Circular 157, we interpreted the law to mean that if a “high and new technology enterprise strongly supported by the state” or “High and New Technology Enterprise” was in a tax holiday period that provides for“2-year exemption plus3-year half rate” or“5-year exemption plus5-year half rate” or other tax exemptions and reductions, where it was entitled to a 50% reduction in the tax rate and was also entitled to a 15% rate of tax due to its High and New Technology Enterprise status under the EIT Law, then it was entitled to pay tax at the rate of 7.5%. Circular 157 appears to have the effect that such an entity is entitled to pay tax at the lower of 15% and 50% of the standard PRC tax rate, which is currently 25%. It is unclear as to whether Circular 157 would apply retrospectively but we understand that the State Administration of Taxation has recently taken the position that Circular 157 applies only to tax years commencing from January 1, 2010.
Based on the interpretation of Circular 157 from the relevant local tax authority, we believe that entities that are qualified for“3-year exemption plus3-year half rate” tax holiday as High and New Technology Enterprises and are registered in the Zhongguancun High and New Technology Industrial Zone of Beijing will continue to pay income tax at a rate of 7.5%. Since Xueersi Education enjoys“3-year exemption plus3-year half rate” and is a High and New Technology Enterprise registered in the Zhongguancun High and New Technology Industrial Zone of Beijing, we do not believe that Circular 157 has any effect on our tax position.
Uncertainties exist with respect to how the EIT Law applies to our overall operations, and more specifically, with regard to our tax residency status. The EIT Law includes a provision specifying that legal entities organized outside of the PRC will be considered residents for PRC income tax purposes if their “de facto management bodies” are within the PRC. The Implementation Rules define the term “de facto management bodies” as “establishments that carry out substantial and overall management and control over the manufacturing and business operations, personnel, accounting, properties, etc. of an enterprise.” Despite the present uncertainties resulting from the limited PRC tax guidance on the issue, we do not believe that our legal entities organized outside of the PRC should be treated as residents under the EIT Law. Each of TAL Group and Xueersi Hong Kong is a company incorporated outside the PRC. As holding companies, these two entities’ key assets, which are essentially corporate documents and records, are located and maintained outside of the PRC. In addition, we are not aware of any offshore holding companies with a similar corporate structure as the Company’s ever having been deemed to be PRC “resident enterprises” by the PRC tax authorities. Therefore, we believe that neither TAL Group nor Xueersi Hong Kong should be treated as a “resident enterprise” for PRC tax purposes. However, as the tax resident status of an enterprise is subject to determination by the PRC tax authorities, there are uncertainties and risks associated with this issue. See “Risk Factors—Risks Related to Doing Business in China—Under the EIT Law, we may be classified as a “resident enterprise” of China. Such classification could result in unfavorable tax consequences to us and our non-PRC shareholders.”
68
Table of Contents
Fair Value of Our Common Shares and Share-Based Compensation
In June 2010, we adopted the 2010 share incentive plan. The plan permits the grant of options to purchase Class A common shares, restricted shares, restricted share units, dividend equivalent rights and other awards as deemed appropriate by the administrator under the plan. The maximum aggregate number of Class A common shares that may be issued pursuant to all awards under the plan is 18,750,000 Class A common shares. On July 26, 2010, we granted 5,419,500 restricted shares under this plan to some of our directors, executive officers and employees. These restricted shares will vest in accordance with the vesting schedule set out in the respective restricted share agreements with the grantees, which ranges from one to four years.
We recognize share-based compensation expenses based on the fair value of equity awards on the date of the grant, using a straight-line method over the requisite service periods of the awards, which are generally the vesting periods.
Prior to this offering, there have been no quoted market prices for our Class A common shares. We have therefore had to make an estimate of the fair value of our Class A common shares for the purposes of determining the fair value of our Class A common shares on the date of grant of share-based compensation awards to our employees.
The estimated fair value of our Class A common shares was $4.05 per share as of July 26, 2010.
Determining the fair value of our Class A common shares required us to make subjective judgments regarding our projected financial and operating results, our unique business risks, the liquidity of our Class A common shares and our operating history and prospects at the time the grants were made. The significant factors we considered include the following:
| • | our financial and operating results; | |
| • | the assumptions and basis of our financial projections; | |
| • | the nature of our business; | |
| • | the stage of development of our operations; | |
| • | our business plan; | |
| • | our business risks; | |
| • | the nature and prospects of the private education industry in China; | |
| • | the global economic outlook in general and the specific economic and competitive elements affecting our business, industry and market; and | |
| • | the market-derived investment returns of entities engaged in similar business. |
We principally used the market approach. We considered the estimated initial public offering price of $9.00 per ADS (or $4.50 per Class A common share), the midpoint of the range shown on the front cover page of our preliminary prospectus dated October 6, 2010 and applied discount for lack of marketability, or DLOM, to reflect the fact that there was no ready public market for our shares as we were a closely held private company. The DLOM of 10% applied for valuation of our Class A common shares as of July 26, 2010 was determined with the assistance of American Appraisal using the Black-Scholes option pricing model. Under the option-pricing method, the cost of the put option, which can hedge the price change before the privately held shares can be sold, was considered as a basis to determine DLOM.
In addition, we made other assumptions in assessing the fair value of our Class A common shares, including the following:
| • | that no material change will occur in the applicable future periods in the existing political, legal, fiscal or economic conditions and in the education industry in China; |
69
Table of Contents
| • | that no material change will occur in the current PRC law applicable to us and the applicable tax rates will remain unchanged; | |
| • | that exchange rates and interest rates in the applicable future periods will not differ materially from the current rates; | |
| • | that our future growth will not be constrained by lack of funding; | |
| • | that we have the ability to retain competent management and key personnel to support our ongoing operations; and | |
| • | that industry trends and market conditions for the education and related industries will not deviate significantly from current forecasts. |
We have considered the guidance prescribed by the AICPA Audit and Accounting Practice Aid in determining the fair value of our Class A common shares as of July 26, 2010. A detailed description of the valuation method used in the fair value of our Class A common shares as of July 26, 2010 is set out above. Paragraph 113 of the Practice Aid states that “the ultimate IPO price itself also is generally not likely to be a reasonable estimate of the fair value for pre-IPO equity transactions of the enterprise.” We therefore believe the ultimate initial public offering price itself is generally not likely to be a reasonable estimate of the fair value of our Class A common shares as of July 26, 2010.
Results of Operations
The following table sets forth a summary of our consolidated results of operations for the periods indicated, both in absolute amounts and as percentages of our net revenues. This information should be read together with our consolidated financial statements and related notes included elsewhere in this prospectus. The operating results in any period are not necessarily indicative of the results that may be expected for any future period.
| For the Year Ended February 29/28, | For the Six Months Ended August 31, | |||||||||||||||||||||||||||||||||||||||
| 2008 | 2009 | 2010 | 2009 | 2010 | ||||||||||||||||||||||||||||||||||||
| $ | % | $ | % | $ | % | $ | % | $ | % | |||||||||||||||||||||||||||||||
| (in thousands of $, except percentages) | ||||||||||||||||||||||||||||||||||||||||
| Net revenues | $ | 8,882 | 100.0 | % | $ | 37,476 | 100.0 | % | $ | 69,594 | 100.0 | % | $ | 32,983 | 100.0 | % | $ | 53,022 | 100.0 | % | ||||||||||||||||||||
| Cost of revenues | (4,367 | ) | (49.2 | ) | (18,554 | ) | (49.5 | ) | (37,649 | ) | (54.1 | ) | (16,068 | ) | (48.7 | ) | (26,255 | )(1) | (49.5 | ) | ||||||||||||||||||||
| Gross profit | 4,515 | 50.8 | 18,922 | 50.5 | 31,945 | 45.9 | 16,915 | 51.3 | 26,767 | 50.5 | ||||||||||||||||||||||||||||||
| Operating expenses | ||||||||||||||||||||||||||||||||||||||||
| Selling and marketing | (370 | ) | (4.2 | ) | (2,353 | ) | (6.3 | ) | (5,608 | ) | (8.1 | ) | (1,958 | ) | (5.9 | ) | (4,184 | )(2) | (7.9 | ) | ||||||||||||||||||||
| General and administrative | (2,478 | ) | (27.9 | ) | (5,890 | ) | (15.7 | ) | (10,872 | ) | (15.6 | ) | (4,602 | ) | (14.0 | ) | (7,808 | )(3) | (14.7 | ) | ||||||||||||||||||||
| Impairment losses on intangible assets and goodwill | — | — | (1,615 | ) | (4.3 | ) | — | — | — | — | — | — | ||||||||||||||||||||||||||||
| Total operating expenses | (2,848 | ) | (32.1 | ) | (9,858 | ) | (26.3 | ) | (16,480 | ) | (23.7 | ) | (6,560 | ) | (19.9 | ) | (11,992 | ) | (22.6 | ) | ||||||||||||||||||||
| Income from operations | 1,667 | 18.7 | 9,064 | 24.2 | 15,465 | 22.2 | 10,355 | 31.4 | 14,775 | 27.9 | ||||||||||||||||||||||||||||||
| Interest income, net | 11 | 0.1 | 77 | 0.2 | 283 | 0.4 | 103 | 0.3 | 162 | 0.3 | ||||||||||||||||||||||||||||||
| Other expenses | — | — | (210 | ) | (0.6 | ) | (124 | ) | (0.2 | ) | (119 | ) | (0.4 | ) | (27 | ) | (0.1 | ) | ||||||||||||||||||||||
Impairment loss onavailable-for-sale securities | — | — | (363 | ) | (1.0 | ) | — | — | — | — | — | — | ||||||||||||||||||||||||||||
| Gain from sales of available-for-sale securities | — | — | — | — | — | — | — | — | 6 | 0.0 | ||||||||||||||||||||||||||||||
| Gain on extinguishment of liabilities | — | — | 731 | 2.0 | — | — | — | — | — | — | ||||||||||||||||||||||||||||||
70
Table of Contents
| For the Year Ended February 29/28, | For the Six Months Ended August 31, | |||||||||||||||||||||||||||||||||||||||
| 2008 | 2009 | 2010 | 2009 | 2010 | ||||||||||||||||||||||||||||||||||||
| $ | % | $ | % | $ | % | $ | % | $ | % | |||||||||||||||||||||||||||||||
| (in thousands of $, except percentages) | ||||||||||||||||||||||||||||||||||||||||
| Income before income tax provision | 1,678 | 18.8 | 9,299 | 24.8 | 15,624 | 22.4 | 10,339 | 31.3 | 14,916 | 28.1 | ||||||||||||||||||||||||||||||
| Provision for income tax | (165 | ) | (1.8 | ) | (2,018 | ) | (5.4 | ) | (1,379 | ) | (1.9 | ) | (912 | ) | (2.7 | ) | (1,670 | ) | (3.1 | ) | ||||||||||||||||||||
| Net income | $ | 1,513 | 17.0 | % | $ | 7,281 | 19.4 | % | $ | 14,245 | 20.5 | % | $ | 9,427 | 28.6 | % | $ | 13,246 | 25.0 | % | ||||||||||||||||||||
| Notes: | ||
| (1) | Includes share-based compensation expenses of $110 thousand. | |
| (2) | Includes share-based compensation expenses of $163 thousand. | |
| (3) | Includes share-based compensation expenses of $647 thousand. |
Six Months Ended August 31, 2010 Compared to Six Months Ended August 31, 2009
Net Revenues
Our total net revenues increased by 60.8% from $33.0 million for the six months ended August 31, 2009 to $53.0 million for the six months ended August 31, 2010. This increase was primarily due to the additional student enrollments in our newly opened learning centers and increased student enrollments in our existing learning centers. The number of total student enrollments grew from 175,638 for the six months ended August 31, 2009 to 236,919 for the six months ended August 31, 2010, while the number of learning centers increased from 83 as of August 31, 2009 to 108 as of August 31, 2010.
Cost of Revenues
Our cost of revenues increased by 63.4% from $16.1 million for the six months ended August 31, 2009 to $26.3 million for the six months ended August 31, 2010. This increase was primarily due to an increase in our rental payments as we leased facilities for 108 learning centers and 86 service centers as of August 31, 2010, as compared to 83 learning centers and 65 service centers as of August 31, 2009. Also contributing to the increase of our cost of revenues included an increase in aggregate compensation paid to our full-time teachers as the number of full-time teachers increased from 631 as of August 31, 2009 to 1,067 as of August 31, 2010. This increased compensation to full-time teachers was partially offset by the decrease of the number of contract teachers from 2,587 as of August 31, 2009 to 1,455 as August 31, 2010. In addition, compensation paid to personnel providing educational service support increased as a result of the increase of such personnel from 730 as of August 31, 2009 to 912 as of August 31, 2010. The increase in our cost of revenues was also attributable to share-based compensation expenses and an increase in the cost of course materials, increased depreciation and amortization of property and equipment as a result of the expansion of our learning centers and service centers and our continued efforts to upgrade our classroom facilities and technology systems. The amount of share-based compensation expenses included in the cost of revenues for the six months ended August 31, 2010 was $110 thousand, compared to nil for the six months ended August 31, 2009.
Gross Profit
As a result of the foregoing, our gross profit increased by 58.2% from $16.9 million for the six months ended August 31, 2009 to $26.8 million for the six months ended August 31, 2010. Our gross profit margin was 50.5% for the six months ended August 31, 2010, as compared to 51.3% for the six months ended August 31, 2009.
Operating Expenses
Our operating expenses increased by 82.8% from $6.6 million for the six months ended August 31, 2009 to $12 million for the six months ended August 31, 2010. This increase resulted from increases in both our
71
Table of Contents
selling and marketing expenses and general and administrative expenses and, in particular, a $0.8 million share-based compensation charge.
Selling and Marketing Expenses. Our selling and marketing expenses increased by 113.7% from $2.0 million for the six months ended August 31, 2009 to $4.2 million for the six months ended August 31, 2010. This increase was primarily due to the related increase in compensation, office rental expenses and office expenses for an expanded sales and marketing force and, to a lesser extent, a share-based compensation charge of $163 thousand.
General and Administrative Expenses. Our general and administrative expenses increased by 69.7% from $4.6 million for the six months ended August 31, 2009 to $7.8 million for the six months ended August 31, 2010. This increase was primarily due to an increase of 117 employees for our corporate and administrative functions to support our expanded operations and, to a lesser extent, a share-based compensation charge of $647 thousand.
Interest Income, Net
We had net interest income of $0.2 million for the six months ended August 31, 2010, compared to $0.1 million for the six months ended August 31, 2009. Our interest income in both years consisted of interest earned on our cash and cash equivalents deposited in commercial banks, which, in the case of our net interest income for the six months ended August 31, 2010, was partially offset by the interest expenses incurred with respect to a convertible loan we borrowed in January 2010 and with respect to our acquisition payables.
Other Expenses, Net
We had other expenses of $27,000 for the six months ended August 31, 2010, compared to $0.1 million for the six months ended August 31, 2009. Our expenses in both periods were primarily attributable to our charitable donations to promote public education in rural areas.
Gain from Sales of Available-for-Sale Securities
We recognized a $6,000 gain from sales of available-for-sale securities for the six months ended August 31, 2010 related to disposal of certain available-for-sale securities in the open market, which we bought in December 2009.
Provision for Income Tax
Our provision for income tax increased by 83.1% from $0.9 million for the six months ended August 31, 2009 to $1.7 million for the six months ended August 31, 2010, primarily due to the increase in our taxable income and a higher effective income tax rate for the six months ended August 31, 2010. Our effective income rate was 11.2% in the six months ended August 31, 2010, compared to 8.8% in the six months ended August 31, 2009.
Net Income
As a result of the foregoing, our net income increased by 40.5% from $9.4 million for the six months ended August 31, 2009 to $13.2 million for the six months ended August 31, 2010.
Fiscal Year Ended February 28, 2010 Compared to Fiscal Year Ended February 28, 2009
Net Revenues
Our total net revenues increased by 85.7% from $37.5 million for the fiscal year ended February 28, 2009 to $69.6 million for the fiscal year ended February 28, 2010. This increase was primarily due to additional student enrollments in our newly opened learning centers and increased student enrollments in our existing learning centers in fiscal year 2010. The number of total student enrollments grew from 215,080 as of
72
Table of Contents
February 28, 2009 to 382,505 as of February 28, 2010, while the number of learning centers increased from 73 to 98 during the same period.
Cost of Revenues
Our cost of revenues increased by 102.9% from $18.6 million for the fiscal year ended February 28, 2009 to $37.6 million for the fiscal year ended February 28, 2010. This increase was primarily due to an increase in aggregate compensation paid to teachers as the number of our full-time teachers increased by 284 and the number of our contract teachers increased by 406 during the fiscal year ended February 28, 2010, and an increase in our rental payments as we leased facilities for 98 learning centers and 80 service centers as of February 28, 2010, as compared to 73 learning centers and 54 service centers as of February 28, 2009. The increase was also due to the compensation increase attributable to our hiring of 303 additional personnel providing educational service support and the increase in the cost of course materials for some of our English courses. The increase was also attributable to the increased depreciation and amortization of property and equipment, which is a result of the expansion of our learning centers and services and our continual efforts to upgrade our classroom facilities technology systems.
Gross Profit
As a result of the foregoing, our gross profit increased by 68.8% from $18.9 million for the fiscal year ended February 28, 2009 to $31.9 million for the fiscal year ended February 28, 2010. Our gross profit margin was 45.9% for the fiscal year ended February 28, 2010, which decreased from 50.5% for the previous fiscal year. The decrease in our gross profit margin in the fiscal year ended February 28, 2010 was primarily due to the investments we made during the period in anticipation of further growth in student enrollments. We generally need to hire and train educational service support personnel and incur leasehold improvement and other costs ahead of the expectedramp-up in student enrollments at our new or expanded learning centers.
Operating Expenses
Our operating expenses increased by 67.2% from $9.9 million in the fiscal year ended February 28, 2009 to $16.5 million in the fiscal year ended February 28, 2010. This increase resulted from increases in both our selling and marketing expenses and general and administrative expenses in the fiscal year ended February 28, 2010, partially offset by the elimination of impairment losses on intangible assets and goodwill.
Selling and Marketing Expenses. Our selling and marketing expenses increased by 138.3% from $2.4 million in the fiscal year ended February 28, 2009 to $5.6 million in the fiscal year ended February 28, 2010. This increase was primarily due to an increase in the number of our sales and marketing personnel by 213 to support our selling and marketing efforts, as well as the expenses incurred relating to an outdoor advertisement campaign to promote our personalized premium services.
General and Administrative Expenses. Our general and administrative expenses increased by 84.6% from $5.9 million in the fiscal year ended February 28, 2009 to $10.9 million in the fiscal year ended February 28, 2010. This increase was primarily due to an increase in the number of employees for our corporate and administrative functions by 177 to support our expanded operations, rental expenses for increased office space for general corporate and administrative related functions and, to a lesser degree, professional service fees accrued during fiscal year 2010.
Impairment Losses on Intangible Assets and Goodwill. We recognized nil impairment loss on goodwill in the fiscal year ended February 28, 2010. In the fiscal year ended February 28, 2009, we recognized impairment losses on intangible assets and goodwill of $1.6 million relating to our acquisitions of two schools in the period.
Interest Income, net
We had an interest income, net of $0.3 million for the fiscal year ended February 28, 2010, compared to $0.1 million for the fiscal year ended February 28, 2009. Our interest income, net in both years consisted of
73
Table of Contents
interest earned on our cash and cash equivalents deposited in commercial banks, partially offset by the interest expense incurred with respect to a convertible loan we borrowed in January 2010 and the interest expense of our acquisition payables.
Other Expenses
We had other expenses of $0.1 million for the fiscal year ended February 28, 2010, compared to $0.2 million for the fiscal year ended February 28, 2009. Our other expenses in fiscal year 2010 were primarily attributable to our charity donations to promote public education in rural areas. Our other expenses in fiscal year 2009 were primarily attributable to our charity donations to Sichuan earthquake relief funds.
Impairment Loss onAvailable-for-Sale Securities
We recognized a $0.4 million impairment loss onavailable-for-sale securities for the fiscal year ended February 28, 2009 due to a decline in the fair value other than temporary impairment of our investment in certainavailable-for-sale securities, as compared to nil for the fiscal year ended February 28, 2010.
Gain on Extinguishment of Liabilities
We recognized a $0.7 million gain on extinguishment of liabilities for the fiscal year ended February 28, 2009 as a result of a renegotiation of the acquisition payable relating to the Wuhan School from $1.6 million to $0.9 million. We had nil gain on extinguishment of liabilities for the fiscal year ended February 28, 2010.
Provision for Income Tax
Our provision for income tax decreased by 31.7% from $2.0 million in the fiscal year ended February 28, 2009 to $1.4 million in the fiscal year ended February 28, 2010, primarily due to our lower effective income tax rate of 8.8% in the fiscal year ended February 28, 2010, compared to 21.7% in the prior fiscal year. We had a lower effective income tax rate in the fiscal year 2010 because of the preferential tax treatments received by one of wholly owned subsidiaries and one of our consolidated affiliated entities in China during the period.
Net Income
As a result of the foregoing, our net income increased by 95.7% from $7.3 million for the fiscal year ended February 28, 2009 to $14.2 million for the fiscal year ended February 28, 2010.
Fiscal Year Ended February 28, 2009 Compared to Fiscal Year Ended February 29, 2008
Net Revenues
Our total net revenues increased by 321.9% from $8.9 million for the fiscal year ended February 29, 2008 to $37.5 million for the fiscal year ended February 28, 2009. This increase was primarily attributable to additional student enrollments at our new learning centers and increased student enrollments at our existing learning centers. The number of total student enrollments grew from 67,996 in the fiscal year ended February 29, 2008 to 215,080 in the fiscal year ended February 28, 2009, and the number of learning centers increased from 30 to 73 during the same period. The increase in net revenue was also attributable to the fact that we increased the hourly rates for our courses during the fiscal year ended February 28, 2009.
Cost of Revenues
Our cost of revenues increased by 324.9% from $4.4 million for the fiscal year ended February 29, 2008 to $18.6 million for the fiscal year ended February 28, 2009. This increase was primarily due to the increase in the aggregate compensation paid to teachers as the number of our full-time teachers increased by 287 and the number of our contract teachers increased by 482 during fiscal year 2009 and an increase in our rental expenses as we leased facilities for 73 learning centers and 54 service centers as of February 28, 2009, as compared to 30 learning centers and 26 service centers as of February 29, 2008.
74
Table of Contents
Gross Profit
As a result of the foregoing, our gross profit increased by 319.1% from $4.5 million for the fiscal year ended February 29, 2008 to $18.9 million for the fiscal year ended February 28, 2009. Our gross profit margin was 50.5% for the fiscal year ended February 28, 2009, which was slightly decreased from 50.8% for the previous fiscal year.
Operating Expenses
Our operating expenses increased by 246.1% from $2.8 million in the fiscal year ended February 29, 2008 to $9.9 million in the fiscal year ended February 28, 2009. This increase resulted from increases in all of our operating expense line items.
Selling and Marketing Expenses. Our selling and marketing expenses increased by 535.6% from $0.4 million in the fiscal year ended February 29, 2008 to $2.4 million in the fiscal year ended February 28, 2009. This increase was primarily due to an increase in the number of our sales and marketing personnel by 141 in connection with the expansion of our selling and marketing efforts.
General and Administrative Expenses. Our general and administrative expenses increased by 137.7% from $2.5 million in the fiscal year ended February 29, 2008 to $5.9 million in the fiscal year ended February 28, 2009. This increase was also due to an increase in the number of employees for our corporate and administrative functions by 196 to support our expanded operations in fiscal year 2009.
Impairment Losses on Intangible Assets and Goodwill. We recognized nil impairment loss on goodwill in the fiscal year ended February 29, 2008. In the fiscal year ended February 28, 2009, we recognized impairment losses on intangible assets and goodwill of $1.6 million relating to our acquisitions of two schools during that fiscal year.
Interest Income, net
We had interest income, net of $0.1 million for the fiscal year ended February 28, 2009, compared to $10,000 for the fiscal year ended February 29, 2008. Our interest income, net in the fiscal year ended February 28, 2009 consisted of interest earned on our cash and cash equivalents deposited in commercial banks, partially offset by the interest expense incurred for our payable for acquisition. Our interest income, net in the fiscal year ended February 29, 2008 consisted of interest earned on our cash and cash equivalents deposited in commercial banks.
Other Expenses
We had other expenses of $0.2 million for the fiscal year ended February 28, 2009, compared to nil for the fiscal year ended February 29, 2008. Our other expenses in fiscal year 2008 were primarily attributable to our charity donations to Sichuan earthquake relief funds.
Impairment Loss onAvailable-for-Sale Securities
We recognized a $0.4 million impairment loss onavailable-for-sale securities for the fiscal year ended February 28, 2009 due to a decline in the fair valueother-than-temporary impairment of our investment in certainavailable-for-sale securities of a mutual fund, as compared to nil for the fiscal year ended February 29, 2008.
Gain on Extinguishment of Liabilities
We recognized a $0.7 million gain on extinguishment of liabilities for the fiscal year ended February 28, 2009 as a result of renegotiation of the acquisition payable relating to the Wuhan School, which performed below expectation after the acquisition, from $1.6 million to $0.9 million. We had nil gain on extinguishment of liabilities for the fiscal year ended February 29, 2008.
75
Table of Contents
Provision for Income Tax
Our provision for income tax increased from $0.2 million in the fiscal year ended February 29, 2008 to $2.0 million in the fiscal year ended February 28, 2009, due to the higher income taxes incurred in the fiscal year 2009 as a result of our increasing taxable income for the period, as well as our higher effective income tax rate of 21.7% in the fiscal year ended February 28, 2009, compared to 9.8% in the fiscal year ended February 29, 2008.
Net Income
As a result of the above, our net income increased by 381.3% from $1.5 million for the fiscal year ended February 29, 2008 to $7.3 million for the fiscal year ended February 28, 2009.
76
Table of Contents
Our Selected Quarterly Results of Operations
The following table sets forth our unaudited consolidated selected quarterly results of operations for the eight fiscal quarters ended August 31, 2010. You should read the following table in conjunction with our audited financial statements and related notes included elsewhere in this prospectus. We have prepared the unaudited consolidated financial information on the same basis as our audited consolidated financial statements. The unaudited consolidated financial information includes all adjustments, consisting only of normal recurring adjustments, that we consider necessary for a fair presentation of our financial position and operating results for the quarters presented.
| For the Three Months Ended | ||||||||||||||||||||||||||||||||||||||||||||||||||||||||||||||||
| November 30, 2008 | February 28, 2009 | May 31, 2009 | August 31, 2009 | November 30, 2009 | February 28, 2010 | May 31, 2010 | August 31, 2010 | |||||||||||||||||||||||||||||||||||||||||||||||||||||||||
| % of Net | % of Net | % of Net | % of Net | % of Net | % of Net | % of Net | % of Net | |||||||||||||||||||||||||||||||||||||||||||||||||||||||||
| $ | Revenues | $ | Revenues | $ | Revenues | $ | Revenues | $ | Revenues | $ | Revenues | $ | Revenues | $ | Revenues | |||||||||||||||||||||||||||||||||||||||||||||||||
| (In thousands of $, except percentages) | ||||||||||||||||||||||||||||||||||||||||||||||||||||||||||||||||
Net revenues | 10,229 | 100.0 | % | 14,203 | 100.0 | % | 15,439 | 100.0 | % | 17,544 | 100.0 | % | 16,374 | 100.0 | % | 20,237 | 100.0 | % | 20,496 | 100.0 | % | 32,526 | 100.0 | % | ||||||||||||||||||||||||||||||||||||||||
| Cost of revenues | (5,200 | ) | (50.8 | )% | (7,057 | ) | (49.7 | )% | (7,215 | ) | (46.7 | )% | (8,853 | ) | (50.5 | )% | (9,133 | ) | (55.8 | )% | (12,448 | ) | (61.5 | )% | (12,062 | ) | (58.9 | )% | (14,193 | )(1) | (43.6 | )% | ||||||||||||||||||||||||||||||||
Gross profit | 5,029 | 49.2 | % | 7,146 | 50.3 | % | 8,224 | 53.3 | % | 8,691 | 49.5 | % | 7,241 | 44.2 | % | 7,789 | 38.5 | % | 8,434 | 41.1 | % | 18,333 | 56.4 | % | ||||||||||||||||||||||||||||||||||||||||
Operating expenses | ||||||||||||||||||||||||||||||||||||||||||||||||||||||||||||||||
| Selling and marketing expenses | (567 | ) | (5.6 | )% | (855 | ) | (6.0 | )% | (750 | ) | (4.9 | )% | (1,209 | ) | (6.9 | )% | (1,654 | ) | (10.1 | )% | (1,996 | ) | (9.9 | )% | (1,674 | ) | (8.1 | )% | (2,510 | )(2) | (7.7 | )% | ||||||||||||||||||||||||||||||||
| General and administrative expenses | (1,803 | ) | (17.6 | )% | (2,022 | ) | (14.2 | )% | (2,223 | ) | (14.4 | )% | (2,379 | ) | (13.5 | )% | (3,075 | ) | (18.8 | )% | (3,196 | ) | (15.8 | )% | (3,752 | ) | (18.3 | )% | (4,056 | )(3) | (12.5 | )% | ||||||||||||||||||||||||||||||||
| Impairment loss on intangible assets and goodwill | — | — | (1,615 | ) | (11.4 | )% | — | — | — | — | — | — | — | — | — | — | — | — | ||||||||||||||||||||||||||||||||||||||||||||||
Total operating expenses | (2,370 | ) | (23.2 | )% | (4,492 | ) | (31.6 | )% | (2,973 | ) | (19.3 | )% | (3,588 | ) | (20.4 | )% | (4,729 | ) | (28.9 | )% | (5,192 | ) | (25.7 | )% | (5,426 | ) | (26.4 | )% | (6,566 | ) | (20.2 | )% | ||||||||||||||||||||||||||||||||
Income from operations | 2,659 | 26.0 | % | 2,654 | 18.7 | % | 5,251 | 34.0 | % | 5,103 | 29.1 | % | 2,512 | 15.3 | % | 2,597 | 12.8 | % | 3,008 | 14.7 | % | 11,767 | 36.2 | % | ||||||||||||||||||||||||||||||||||||||||
| Interest income, net | 25 | 0.2 | % | 39 | 0.3 | % | 65 | 0.4 | % | 38 | 0.2 | % | 127 | 0.8 | % | 54 | 0.3 | % | 107 | 0.5 | % | 55 | 0.2 | % | ||||||||||||||||||||||||||||||||||||||||
| Other expenses | — | — | (25 | ) | (0.2 | )% | (80 | ) | (0.5 | )% | (38 | ) | (0.2 | )% | (6 | ) | (0.0 | )% | — | — | (33 | ) | (0.1 | )% | 6 | 0.0 | % | |||||||||||||||||||||||||||||||||||||
Impairment loss onavailable-for-sale securities | — | — | (363 | ) | (2.6 | )% | — | — | — | — | — | — | — | — | — | — | — | — | ||||||||||||||||||||||||||||||||||||||||||||||
Gain from sales ofavailable-for-sale securities | — | — | — | — | — | — | — | — | — | — | — | — | 6 | 0.0 | % | — | — | |||||||||||||||||||||||||||||||||||||||||||||||
Income before income tax provision | 2,684 | 26.2 | % | 2,305 | 16.2 | % | 5,236 | 33.9 | % | 5,103 | 29.1 | % | 2,633 | �� | 16.1 | % | 2,651 | 13.1 | % | 3,088 | 15.1 | % | 11,828 | 36.4 | % | |||||||||||||||||||||||||||||||||||||||
| Provision for income tax | (583 | ) | (5.7 | )% | (499 | ) | (3.5 | )% | (462 | ) | (3.0 | )% | (450 | ) | (2.6 | )% | (232 | ) | (1.4 | )% | (234 | ) | (1.2 | )% | (346 | ) | (1.7 | )% | (1,324 | ) | (4.1 | )% | ||||||||||||||||||||||||||||||||
Net income | $ | 2,101 | 20.5 | % | $ | 1,806 | 12.7 | % | $ | 4,774 | 30.9 | % | $ | 4,653 | 26.5 | % | $ | 2,401 | 14.7 | % | $ | 2,417 | 11.9 | % | $ | 2,742 | 13.4 | % | $ | 10,504 | 32.3 | % | ||||||||||||||||||||||||||||||||
Notes:
| (1) | Includes share-based compensation expenses of $110 thousand. | |
| (2) | Includes share-based compensation expenses of $163 thousand. | |
| (3) | Includes share-based compensation expenses of $647 thousand. |
77
Table of Contents
Our revenues and operating results typically fluctuate from quarter to quarter as a result of seasonal characteristics in our business. Our courses tend to have the largest enrollments in our second and fourth fiscal quarters each year, largely because many primary, middle, and high school students have a greater opportunity to enroll in our courses during their summer and winter vacations which take place in these two quarters. From our inception in 2003 through fiscal year 2009, this seasonality of our business was not apparent as each quarter had greater revenues than the prior quarter due to the exceptionally rapid growth we experienced in those years.
Our costs and expenses do not necessarily correspond directly to changes in our student enrollments and net revenues. We make expenditures on facility expansion and enhancement, hiring and training of teachers, student service and support, development of course materials, and marketing throughout the year. In particular, we generally make more significant expenditures on building new learning and service centers in the second half of our fiscal years in anticipation of future growth. In conjunction with this investment in our learning and service centers, we also generally incur greater teacher, sales and marketing, and general and administrative expenses in the second half than in the first half of each fiscal year to support our overall business expansion.
Our quarterly results of operations in the second quarter of fiscal year 2011 were affected by the allocation of share-based compensation expenses for restricted shares granted in that quarter under our 2010 share incentive plan and we will continue to incur share-based compensation expenses in future quarters. Also, we generally pay annual bonuses to our teachers and other employees before the Chinese New Year in our fourth fiscal quarter, which impacts costs and expenses in this quarter.
We expect our quarterly results to continue to be influenced by seasonal enrollment trends and our business expansion strategy. Our quarterly results of operations may also vary in the future as a result of potentially different student enrollment trends for new courses, programs and services we may offer and decisions we may make about the optimal timing for both center expansion and tuition increases over the course of the year.
Liquidity and Capital Resources
Cash Flows and Working Capital
Our principal sources of liquidity have been cash generated from operating activities and proceeds from the issuance and sale of Series A preferred shares. As of August 31, 2010, we had $81.5 million in cash and cash equivalents and we had no bank borrowings. Our cash and cash equivalents consist of cash on hand and bank deposits that are placed with banks and other financial institutions and which are either unrestricted as to withdrawal or use or have maturities of three months or less.
Although we consolidate the results of Xueersi Education and Xueersi Network and their respective subsidiaries and schools, our access to cash balances or future earnings of Xueersi Education and Xueersi Network and their respective subsidiaries and schools is only through our contractual arrangements with Xueersi Education and Xueersi Network and their respective shareholders, subsidiaries and schools. See “Our Corporate History and Structure—Contractual Arrangements with Our Consolidated Affiliated Entities.” For restrictions and limitations on liquidity and capital resources as a result of our corporate structure, see “—Holding Company Structure.”
We believe that our current cash and cash equivalents and anticipated cash flow from operations will be sufficient to meet our anticipated cash needs, including our cash needs for working capital and capital expenditures, for at least the next 12 months.
78
Table of Contents
The following table sets forth a summary of our cash flows for the periods indicated:
| For the Year Ended February 29/28, | For the Six Months Ended August 31, | |||||||||||||||||||
| 2008 | 2009 | 2010 | 2009 | 2010 | ||||||||||||||||
| (in thousands of $) | ||||||||||||||||||||
| Net cash provided by operating activities | $ | 6,324 | $ | 23,468 | $ | 27,175 | $ | 16,198 | $ | 30,955 | ||||||||||
| Net cash provided by (used in) investing activities | (1,470 | ) | (5,116 | ) | (5,250 | ) | (696 | ) | (214 | ) | ||||||||||
| Net cash provided by (used in) financing activities | 132 | 5,252 | (903 | ) | (1,622 | ) | (163 | ) | ||||||||||||
| Effect of foreign exchange rate changes | 315 | 385 | 37 | 26 | 165 | |||||||||||||||
| Net increase (decrease) in cash and cash equivalents | 5,301 | 23,989 | 21,059 | 13,906 | 30,743 | |||||||||||||||
| Cash and cash equivalents at the beginning of the period | 403 | 5,704 | 29,693 | 29,693 | 50,752 | |||||||||||||||
| Cash and cash equivalents at end of the period | 5,704 | 29,693 | 50,752 | 43,599 | 81,495 | |||||||||||||||
Operating Activities
Net cash provided by operating activities amounted to $31.0 million for the six months ended August 31, 2010, as compared to $16.2 million for the six months ended August 31, 2009.
Net cash provided by operating activities for the six months ended August 31, 2010 reflected net income of $13.2 million, adjusted by reconciliation items of $2.4 million, which included depreciation of property and equipment of $1.1 million, share-based compensation charge of $0.9 million and amortization of intangible assets of $0.4 million. Another major factor affecting operating cash flow for the six months ended August 31, 2010 included an increase in deferred revenues in the amount of $12.6 million due to the increased amount of course fees received during the period for courses that would continue into the second half of the year.
Net cash provided by operating activities for the six months ended August 31, 2009 reflected net income of $9.4 million, adjusted by a non-cash and non-operating charge of $0.7 million, which included depreciation of property and equipment of $0.4 million and amortization of intangible assets of $0.3 million. Additional major factors affecting operating cash flow for the six months ended August 31, 2009 included an increase in deferred revenues in the amount of $5.7 million due to the increased amount of course fees received during the period, an increase in accrued expenses and other current liabilities in the amount of $1.5 million in connection with accrued payroll and bonus and payable for business acquisitions.
Net cash provided by operating activities amounted to $27.2 million in the fiscal year ended February 28, 2010, as compared to $23.5 million in the fiscal year ended February 28, 2009 and $6.3 million in the fiscal year ended February 29, 2008.
Net cash provided by operating activities in the fiscal year ended February 28, 2010 reflected net income of $14.2 million, adjusted by a non-cash and non-operating charge of $2.1 million, which included depreciation of property and equipment of $1.3 million and amortization of intangible assets of $0.8 million. Additional major factors affecting operating cash flow in the fiscal year ended February 28, 2010 included an increase in deferred revenues in the amount of $11.3 million due to the increased amount of course fees received during the period, an increase in rental deposits in the amount of $1.2 million as a result of the additional premises we rented for our offices, learning centers and other services, an increase in accrued expenses and other current liabilities in the amount of $3.2 million in connection with accrued payroll and bonus and other taxes payables, and the decrease in our income tax payable in the amount of $2.1 million.
Net cash provided by operating activities in the fiscal year ended February 28, 2009 reflected net income of $7.3 million, adjusted by a non-cash and non-operating charge of $2.3 million, which primarily included impairment of intangible assets and goodwill of $1.6 million in connection with two acquisitions we made during the period, amortization of intangible assets in the amount of $0.6 million mainly in connection with acquisitions of domain names, gain on extinguishment of liabilities in the amount of $0.7 million attributable to a waiver of the same amount of acquisition payables as a result of renegotiations with the seller in one of our acquisitions. Additional major factors affecting operating cash flow in the fiscal year ended February 28,
79
Table of Contents
2009 included an increase in the amount of $12.0 million paid upfront by the students due to the increased amount of course fees received during the period, the increase in our income tax payable in the amount of $2.3 million and an increase in accrued expenses and other current liabilities in the amount of $1.8 million in connection with accrued payroll and bonus and payable for business acquisitions.
Net cash provided by operating activities in the fiscal year ended February 29, 2008 was primarily attributable to net income of $1.5 million, and an increase in deferred revenues in the amount of $3.7 million due to the increased amount of course fees received during the period.
Investing Activities
We lease all of our facilities. Our cash used in investing activities is primarily related to leasehold improvements, investments in equipment, technology and operating systems, investments in certainavailable-for-sale securities, intangible assets and acquisitions.
Net cash used in investing activities amounted to $0.2 million for the six months ended August 31, 2010, as compared to net cash used in investing activities in the amount of $0.7 million for the six months ended August 31, 2009.
Net cash used in investing activities for the six months ended August 31, 2010 primarily related to leasehold improvements and purchases of equipment in the amount of $1.7 million in connection with the expansion of our network of learning centers and service centers, partially offset by our sale of available-for-sale securities we bought in December 2009 for proceeds of $1.5 million.
Net cash used in investing activities for the six months ended August 31, 2009 primarily related to leasehold improvements and purchases of equipment in the amount of $0.7 million in connection with the expansion of our network of learning centers and service centers.
Net cash used in investing activities amounted to $5.3 million in the fiscal year ended February 28, 2010, as compared to $5.1 million and $1.5 million in the fiscal years ended February 29, 2008 and February 28, 2009, respectively.
Net cash used in investing activities in the fiscal year ended February 28, 2010 primarily related to (i) leasehold improvements and purchases of equipment in the amount of $3.8 million in connection with the expansion of our network of learning centers and service centers, and (ii) our investment in the securities of a mutual fund in the amount of $1.5 million.
Net cash used in investing activities in the fiscal year ended February 28, 2009 primarily related to (i) leasehold improvements and purchases of equipment in the amount of $2.1 million in connection with the expansion of our network of learning centers and service centers, (ii) our acquisitions in separate transactions from unrelated third-parties in the amount of $1.6 million, and (iii) our purchase of intangible assets in the amount of $1.4 million in connection with the purchase of several domain names from unrelated third-parities.
Net cash used in investing activities in the fiscal year ended February 29, 2008 mainly related to (i) our investment in certainavailable-for-sale securities in the amount of $0.7 million, (ii) leasehold improvements and purchases of equipment in the amount of $0.5 million in connection with the expansion of our network of learning centers and service centers, and (iii) our purchase of intangible assets in the amount of $0.3 million in connection with the purchase of several domain names from unrelated third parities.
Financing Activities
Our financing activities consisted of issuance and sale of Series A convertible redeemable preferred shares to investors, a convertible loan, capital contributions from our founding shareholders, distributions to shareholders and acquisitions.
Net cash used in financing activities for the six months ended August 31, 2010 amounted to $0.2 million, as compared to net cash used in financing activities in the amount of $1.6 million for the six months ended August 31, 2009. Net cash used in financing activities for the six months ended August 31, 2010 was
80
Table of Contents
primarily related to payment of certain deferred consideration in connection with our acquisition activities. Net cash used in financing activities for the six months ended August 31, 2009 was attributable to a distribution to our shareholders.
Net cash used in financing activities amounted to $0.9 million in the fiscal year ended February 28, 2010, as compared to net cash provided by financing activities in the amount of $5.3 million in the fiscal year ended February 28, 2009 and net cash provided by financing activities in the amount of $0.1 million in the fiscal year ended February 29, 2008. Net cash used in financing activities in the fiscal year ended February 28, 2010 was primarily attributable to the distribution payment by our consolidated affiliated entity in the amount of $1.4 million to its shareholders in connection with our corporate reorganization, our acquisition activities in the amount of $0.2 million, partially offset by the $0.5 million proceeds from a convertible loan and $0.2 million of capital contributions by our founding shareholders. Net cash provided by financing activities in the fiscal year ended February 28, 2009 was primarily attributable to the proceeds from our issuance and sale of Series A convertible redeemable preferred shares in the amount of $4.9 million and capital contributions by our founding shareholders in the amount of $0.4 million. Net cash used in financing activities in the fiscal year ended February 29, 2008 was primarily attributable to capital contributions by our founding shareholders in the amount of $0.1 million.
Capital Expenditures
Our capital expenditures are incurred primarily in connection with leasehold improvements, investments in computers, network equipment and software and business acquisitions. Our capital expenditures were $0.8 million, $5.1 million and $3.8 million in the fiscal years ended February 29, 2008 and February 28, 2009 and 2010. We expect to incur capital expenditures up to $10 million in the fiscal year ending February 28, 2011 in connection with our planned investments in facilities, equipment, technology and operating systems to meet the expected growth of our operations. We also expect to incur additional costs in connection with our becoming a public company, including costs to prepare for our first Sarbanes-Oxley Act of 2002 Section 404 compliance testing and additional compliance costs associated with being a public company. We are not able to estimate with reasonable certainty these additional expenses but expect that the additional costs will not exceed $2 million in the next two years. We intend to continue to utilize real estate leasing in order to allocate our capital resources cost-efficiently. We may make acquisitions of businesses and properties that complement our operations when suitable opportunities arise.
Contractual Obligations
The following table sets forth our contractual obligations as of February 28, 2010:
| Payment due by period | ||||||||||||||||||||
| Total | Less than 1 year | 1-3 years | 3-5 years | More than 5 years | ||||||||||||||||
| (in thousand $) | ||||||||||||||||||||
Operating lease obligations(1) | $ | 42,674 | 13,155 | 20,159 | 9,347 | 13 | ||||||||||||||
Acquisition payables(2) | 513 | 513 | — | — | — | |||||||||||||||
Convertible loan(3) | 500 | — | 500 | — | — | |||||||||||||||
| Notes: | ||
| (1) | Represents our non-cancelable leases for our offices, learning centers and service centers. | |
| (2) | Represents outstanding consideration payable in connection with our acquisitions of Tianjin Education, Jianli School, Qianjiang School and Wuhan School as of February 28, 2010. $240,198 in acquisition cash consideration payable for the acquisition of Tianjin Education and Wuhan School was outstanding as of August 31, 2010. | |
| (3) | Represents the principal amount due to a third party pursuant to a convertible loan. The convertible loan has a principal amount of $500,000, bears an annual interest rate of 15% and will mature on January 30, 2012. |
81
Table of Contents
Holding Company Structure
We are a holding company with no material operations of our own. We conduct our operations primarily through our three wholly owned subsidiaries and our affiliated entities in China. As a result, our ability to pay dividends depends upon dividends paid by our wholly owned subsidiaries. If our wholly owned subsidiaries or any newly formed subsidiaries incur debt on their own behalf in the future, the instruments governing their debt may restrict their ability to pay dividends to us. In addition, our wholly owned subsidiaries are permitted to pay dividends to us only out of their retained earnings, if any, as determined in accordance with PRC accounting standards and regulations. Under PRC law, each of our subsidiaries, VIEs and VIE’s subsidiaries in China is required to set aside at least 10% of its after-tax profits each year, if any, to fund a statutory reserve until such reserve reaches 50% of its registered capital. Although the statutory reserves can be used, among other ways, to increase the registered capital and eliminate future losses in excess of retained earnings of the respective companies, the reserve funds are not distributable as cash dividends except in the event of liquidation. As a result of these PRC laws and regulations, as of August 31, 2010, we had $4.9 million in statutory reserves, or 15.0% of total equity, that are not distributable as cash dividends. Our PRC subsidiaries have not historically paid any dividends to our offshore entities from their accumulated profits. However, we do not expect that the statutory reserve requirement will materially limit our ability to pay dividends to our shareholders or our plan to expand our business because we are only required to set aside an additional $2.9 million to satisfy the maximum requirement of statutory reserves for all of our PRC subsidiaries, VIEs and VIEs’ subsidiaries.
Off-Balance Sheet Commitments and Arrangements
We have not entered into any financial guarantees or other commitments to guarantee the payment obligations of any third parties. We have not entered into any derivative contracts that are indexed to our shares and classified as shareholders’ equity, or that are not reflected in our consolidated financial statements. Furthermore, we do not have any retained or contingent interest in assets transferred to an unconsolidated entity that serves as credit, liquidity or market risk support to such entity. We do not have any variable interest in any unconsolidated entity that provides financing, liquidity, market risk or credit support to us or engages in leasing, hedging or research and development services with us.
Quantitative and Qualitative Disclosure about Market Risk
Interest Rate Risk
Our exposure to interest rate risk primarily relates to the interest income generated by excess cash invested in liquid investments with original maturities of three months or less. We have not used any derivative financial instruments to manage our interest risk exposure. Interest-earning instruments carry a degree of interest rate risk. We have not been exposed, nor do we anticipate being exposed, to material risks due to changes in interest rates. However, our future interest income may be lower than expected due to changes in market interest rates.
Foreign Exchange Risk
The value of the Renminbi against the U.S. dollar and other currencies is affected by, among other things, changes in China’s political and economic conditions and China’s foreign exchange policies. The conversion of the Renminbi into foreign currencies, including the U.S. dollar, has been based on exchange rates set by the People’s Bank of China. On July 21, 2005, the PRC government changed its decade-old policy of pegging the value of the Renminbi solely to the U.S. dollar. Under this revised policy, the Renminbi is permitted to fluctuate within a narrow and managed band against a basket of certain foreign currencies. Following the removal of the U.S. dollar peg, the Renminbi appreciated approximately 21.5% against the U.S. dollar over the following three years. Since July 2008, however, the Renminbi has traded within a narrow range against the U.S. dollar, remaining within 1% of its July 2008 high. As a consequence, the Renminbi has fluctuated significantly since July 2008 against other freely traded currencies, in tandem with the U.S. dollar. On June 20, 2010, the People’s Bank of China announced that the PRC government will further reform the
82
Table of Contents
Renminbi exchange rate regime and enhance the Renminbi exchange rate flexibility. It is difficult to predict how this new policy may impact the Renminbi exchange rate going forward.
Substantially all of our earnings and cash assets are denominated in RMB and the net proceeds from this offering will be denominated in U.S. dollars, fluctuations in the exchange rate between the U.S. dollar and the RMB will affect the relative purchasing power of these proceeds and our balance sheet and earnings per share in U.S. dollars following this offering. In addition, appreciation or depreciation in the value of the RMB relative to the U.S. dollar would affect our financial results reported in U.S. dollar terms without giving effect to any underlying change in our business or results of operations. Fluctuations in the exchange rate will also affect the relative value of any dividend we issue after this offering that will be exchanged into U.S. dollars and earnings from, and the value of, any U.S. dollar-denominated investments we make in the future. We do not believe that we currently have any significant direct foreign exchange risk and have not hedged exposures denominated in foreign currencies or any other derivative financial instruments. Although in general, our exposure to foreign exchange risks should be limited, the value of your investment in our ADSs will be affected by the foreign exchange rate between U.S. dollars and RMB because the value of our business is effectively denominated in RMB, while the ADSs will be traded in U.S. dollars.
Moreover, to the extent that we need to convert U.S. dollars we receive from this offering into RMB for our operations, appreciation of the RMB against the U.S. dollar would have an adverse effect on the RMB amount we receive from the conversion. Assuming we had converted the U.S. dollar-denominated cash balance of $50.8 million as of February 28, 2010 into RMB at the exchange rate of $1.00 for RMB6.8259 as of February 28, 2010, this cash balance would have been RMB346.4 million. Assuming a 1.0% appreciation of the RMB against the U.S. dollar, this cash balance would have decreased to RMB343.0 million as of February 28, 2010. We have not used any forward contracts or currency borrowings to hedge our exposure to foreign currency exchange risk.
Inflation Risk
Inflation in China has not had a significant effect on our business. According to the National Bureau of Statistics of China, the change in the Consumer Price Index in China was 4.8%, 5.9% and (0.7%) in the calender year 2007, 2008 and 2009, respectively.
Recent Accounting Pronouncements
In June 2009, the FASB issued an authoritative pronouncement to amend the accounting rules for variable interest entities, or VIEs. The amendments effectively replace the quantitative-based risks-and-rewards calculation for determining which reporting entity, if any, has a controlling financial interest in a variable interest entity with an approach focused on identifying which reporting entity has (1) the power to direct the activities of a variable interest entity that most significantly affect the entity’s economic performance and (2) the obligation to absorb losses of, or the right to receive benefits from, the entity. Additionally, an enterprise is required to assess whether it has an implicit financial responsibility to ensure that a variable interest entity operates as designed when determining whether it has the power to direct the activities of the variable interest entity that most significantly impact the entity’s economic performance. The new guidance also requires additional disclosures about a reporting entity’s involvement with variable interest entities and about any significant changes in risk exposure as a result of that involvement.
The new guidance is effective at the start of a reporting entity’s first fiscal year beginning after November 15, 2009, and all interim and annual periods thereafter. The new VIE model requires that, upon adoption, a reporting entity should determine whether an entity is a VIE, and whether the reporting entity is the VIE’s primary beneficiary, as of the date that the reporting entity first became involved with the entity, unless an event requiring reconsideration of those initial conclusions occurred after that date. When making this determination, a reporting entity must assume that new guidance had been effective from the date of its first involvement with the entity. We adopted the new guidance on March 1, 2010.
We have had two VIEs, which we have consolidated under the authoritative literature prior to the amendment discussed above because we were the primary beneficiary of those entities. Because we, through
83
Table of Contents
our wholly owned subsidiary, have (1) the power to direct the activities of the two VIEs that most significantly affect their economic performance and (2) the right to receive benefits from the two VIES, we continue to consolidate the two VIEs upon the adoption of the new guidance which therefore, other than for additional disclosures, had no accounting impact.
In October 2009, the Financial Accounting Standards Board, or the FASB, issued an authoritative pronouncement regarding revenue arrangements with multiple deliverables. This pronouncement was issued in response to practice concerns related to the accounting for revenue arrangements with multiple deliverables under an existing pronouncement. Although the new pronouncement retains the criteria from an existing pronouncement for when delivered items in a multiple-deliverable arrangement should be considered separate units of accounting, it removes the previous separation criterion under existing pronouncements that objective and reliable evidence of the fair value of any undelivered items must exist for the delivered items to be considered a separate unit or separate units of accounting. The new pronouncement is effective for fiscal years beginning on or after June 15, 2010. Entities can elect to apply this pronouncement (1) prospectively to new or materially modified arrangements after the pronouncement’s effective date or (2) retrospectively for all periods presented. Early application is permitted; however, if the entity elects prospective application and early adopts this pronouncement after its first interim reporting period, it must also do the following in the period of adoption: (1) retrospectively apply this pronouncement as of the beginning of that fiscal year; and (2) disclose the effect of the retrospective adjustments on the prior interim periods’ revenue, income before taxes, net income, and earnings per share. We are in the process of evaluating the effect of adoption of this pronouncement.
In October 2009, the FASB issued an authoritative pronouncement regarding software revenue recognition. This new pronouncement amends an existing pronouncement to exclude from its scope all tangible products containing both software and non-software components that function together to deliver the product’s essential functionality. That is, the entire product (including the software deliverables and non-software deliverables) would be outside the scope of software revenue recognition and would be accounted for under other accounting literature. The new pronouncement includes factors that entities should consider when determining whether the software and non-software components function together to deliver the product’s essential functionality and are thus outside the revised scope of the authoritative literature that governs software revenue recognition. The pronouncement is effective for fiscal years beginning on or after June 15, 2010. Entities can elect to apply this pronouncement (1) prospectively to new or materially modified arrangements after the pronouncement’s effective date or (2) retrospectively for all periods presented. Early application is permitted; however, if the entity elects prospective application and early adopts this pronouncement after its first interim reporting period, it must also do the following in the period of adoption: (1) retrospectively apply this pronouncement as of the beginning of that fiscal year; and (2) disclose the effect of the retrospective adjustments on the prior interim periods’ revenue, income before taxes, net income, and earnings per share. We are in the process of evaluating the effect of adoption of this pronouncement.
In April 2010, the FASB issued an authoritative pronouncement on milestone method of revenue recognition. The scope of this pronouncement is limited to arrangements that include milestones relating to research or development deliverables. The pronouncement specifies guidance that must be met for a vendor to recognize consideration that is contingent upon achievement of a substantive milestone in its entirety in the period in which the milestone is achieved. The guidance applies to milestones in arrangements within the scope of this consensus regardless of whether the arrangement is determined to have single or multiple deliverables or units of accounting. The pronouncement will be effective for fiscal years, and interim periods within those years, beginning on or after June 15, 2010. Early application is permitted. Companies can apply this guidance prospectively to milestones achieved after adoption. However, retrospective application to all prior periods is also permitted. We are in the process of evaluating the effect of adoption of this pronouncement.
84
Table of Contents
MARKET OPPORTUNITY
We believe that theK-12 after-school tutoring market is the most attractive sector in China’s private education market given the large addressable market it serves, its rapid growth rate and its highly fragmented nature. According to iResearch, theK-12 after-school tutoring market in China grew from RMB123.8 billion in 2007 to RMB189.7 billion ($27.9 billion) in 2009, representing a CAGR of 23.8%, and is projected to grow to RMB447.2 billion ($65.7 billion) in 2014, representing a CAGR of 18.7% from 2009. Moreover, theK-12 after-school tutoring market in China is highly fragmented with no player holding over a 1% market share. This fragmented market presents opportunities for private tutoring service providers that offer high-quality services and have a strong track record, brand and reputation to attract and retain more students and increase market share.
China’s Education Market
China had one of the world’s fastest growing economies in the past decade, with its per capita disposable income of urban households increasing at a CAGR of 12.2% from RMB6,280 ($923) in 2000 to RMB15,781 ($2,318) in 2008. This has led to increased disposable income and higher levels of consumer spending in China.
China’s education market also grew rapidly around the same period between 2004 and 2008. The growth in education spending in China was primarily driven by rapid urbanization, a traditional and cultural emphasis on education, and wage premiums associated with better education.
According to China’s National Bureau of Statistics, urban population as a percentage of China’s total population increased from 36% in 2000 to 46% in 2008. Rising urbanization is a key growth driver in China’s education spending as most employment opportunities in urban areas require higher levels of education than in rural areas. In addition, urban employment opportunities on average offer higher compensation packages, which tend to translate into higher disposable income per capita and a greater propensity to invest in education compared with rural areas.
Chinese culture has always placed great emphasis on education. In dynastic China, people spent years studying in the hope of passing the government-administered civil service examinations and entering governmental services, which was deemed to be a key to success and stature in society. This culture continues to penetrate contemporary China, and it is commonly believed that superior education may provide one with the ability to promote his or her family’s fortune and social status. With the “one-child policy” being implemented in China since the 1980s and a rapid growth in household income in recent years, parents have become even more willing to invest heavily in their only child’s education, with the hope of securing a better future for their child.
As in other countries, better education tends to lead to financial success and more career opportunities in China. Graduates from key universities earned 46% more than vocational high school graduates on average and 23% more than those from other universities on average in 2009, according to iResearch. Moreover, college graduates generally enjoy significantly better job prospects than high school graduates.
Despite the strong growth, the education market in China remains under-invested compared with other developed countries. According to iResearch, the PRC government’s spending on education accounted for 3% of China’s GDP in 2008, compared with the United States (5%) and the United Kingdom (5.25%). This has created opportunities for private education service providers to grow and prosper by catering to the unmet educational demands of Chinese students and parents.
China’s K-12 After-School Tutoring Market
China’s K-12 Education System
In China, the education system begins prior to the first grade, followed by nine years of compulsory education in primary and middle schools. Students may then choose to attend high schools, which are three years in length, followed by college and postgraduate studies. Examination results are the most important
85
Table of Contents
criteria by which a student’s performance is assessed and a key factor in determining how far a student’s education can progress.
In order to be admitted to colleges in China, high school students are required to take the college entrance examinations, or the “Gaokao”. The Gaokao is the most critical set of examinations in a student’s education as the results determine whether a student will be able to attend a highly ranked college (or any at all), which in turn has a significant impact on the student’s future job prospects. As of December 31, 2008, only 114 of the 2,263 higher educational institutions in China were deemed “key universities” by the Ministry of Education. Among them, Peking University and Tsinghua University, which are regarded as the most prestigious universities in China, collectively recruit approximately 6,600 students each year, accounting for approximately 0.1% of the total number of students admitted by all universities each year in China. The average admission rate of the key universities in China is approximately 5%. Moreover, according to the Ministry of Education, the gross higher education enrollment rate, or the percentage of students that are enrolled in an undergraduate program of at least two years, was 23% among the Chinese population in the 18-to-22 age group in 2008. Low admission rates of universities in general, and of the top universities in particular, have resulted in fierce competition for quality undergraduate education in China.
To increase the probability of entering key universities, students compete in high school entrance examinations, or the “Zhongkao,” to enter the best high schools in the cities or provinces in which they reside. Prior to the Zhongkao, they also compete to enter the best middle schools through a competitive selection process known as “Xiao Sheng Chu,” which is typically based on the students’ academic performance in primary schools. The number of key middle schools and key high schools, which are designated by local education bureaus or local education commissions and, in a very limited number of cases, by the Ministry of Education, is very small relative to the total number of middle and high schools in China. In Beijing and Shanghai, which are endowed with the most educational resources among all municipalities in China, key schools accounted for only 15.7% and 17.7%, respectively, of the total number of middle schools and high schools in each city as of December 31, 2008. The key schools have better teaching quality and more educational resources, which generally result in better performance in college entrance examinations for their students. Therefore, in order to improve their chances of eventually gaining admission to key universities, many students start working very hard at a very young age in the hope of excelling in the Xiao Sheng Chu process and the Zhongkao, so as to be admitted to key middle schools and key high schools, respectively.
Moreover, among the K-12 school subjects, mathematics is usually given great emphasis by teachers and students, as it is a core subject at all levels in the K-12 system. Furthermore, math skills are considered very important in learning other core science subjects. Therefore, math ability is believed to be a highly significant contributor to a student’s overall performance and is greatly emphasized throughout the K-12 system.
In China, most public schools have between 50 and 60 students in each class. Students at the same grade level in each province typically follow the same curricula and pace of study regardless of their individual learning curves, interests, progress or needs. Given the pressure to excel on every entrance exam, the inadequate personalized support received within the public school system and the limited supply of quality schools at every education level, an increasing number of parents and students turn to private after-school tutoring services to complement the public school education curriculum.
We believe the intense competition in China’s K-12 education system is largely driven by the unbalanced supply and demand of quality education at all levels. On the one hand, students, facing intense competition, are under constant pressure throughout the K-12 system to achieve outstanding examination results. On the other hand, China’s public education is under-invested and unable to meet all educational demands. Such an imbalance in supply and demand thereby creates tremendous opportunities for the growth of private educational services, including the after-school tutoring market.
China’s K-12 After-School Tutoring Market
K-12 after-school tutoring targets students in kindergarten through high school for the primary purpose of helping students improve academic performance in their regular school courses across a range of subject areas and prepare for admission exams, including Xiao Sheng Chu, Zhongkao, and Gaokao. According to the
86
Table of Contents
Ministry of Education’s Statistics, there were approximately 180 million students studying in primary schools, middle schools and high schools by the end of 2008. The significant role K-12 education plays in a student’s future has driven the rapid growth of the K-12 after-school tutoring market, which is one of the largest and fastest growing segments in China’s private education market. According to iResearch, the K-12 after-school tutoring market in China grew from RMB123.8 billion in 2007 to RMB189.7 billion ($27.9 billion) in 2009, representing a CAGR of 23.8%, and is projected to grow to RMB447.2 billion ($65.7 billion) in 2014, representing a CAGR of 18.7% from 2009. The following graph sets forth total revenues of China’s K-12 after-school tutoring market for the periods indicated:
China K-12 After-School Tutoring Market:
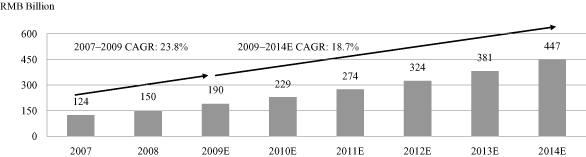
Source: iResearch
K-12 after-school tutoring is particularly common in many East Asian countries. For example, in South Korea, 89% of primary school students, 75% of middle school students, and 55% of high school students used some form of after-school tutoring services, according to iResearch. By comparison, according to iResearch, there were approximately 54 to 63 million K-12 students in China receiving after-school tutoring services in 2009, representing 30% to 35% of the total K-12 population, which lagged behind the penetration rate in South Korea and other East Asian countries. We believe this is primarily due to the evolution of China’s public education system and the fact that private education as an industry has a relatively short history in China. However, according to iResearch, the after-school tutoring service market penetration rate in Beijing, Shanghai, Guangzhou and Shenzhen is expected to reach approximately 70% in the next few years.
Word-of-mouth and the Internet are the two most important channels through which students and parents learn about and select K-12 after-school tutoring services in China. Word-of-mouth is traditionally regarded as one of the most reliable sources of recommendations for tutoring services. With the rapid growth of Internet use in China in recent years, new media has come to play an increasingly more significant role in spreading information regarding the after-school tutoring service market. According to iResearch, Internet is now the second most important factor afterword-of-mouth referrals in the selection of tutoring service providers. China has the world’s largest Internet population, according to China Internet Network Information Center. The current generation of K-12 students and their parents, especially those in the urban areas, are highly reliant on the Internet for educational information, as the Internet affords immediate access unconstrained by geographic location to a large reservoir of data and opinions.
iResearch projects the K-12 tutoring market to be especially attractive in the most developed cities in China such as Beijing and Shanghai, given the economic affluence and high spending on education in these cities. There were approximately 1.2 million K-12 students in each of Beijing and Shanghai in 2008. The disposable income per capita in Beijing and Shanghai in 2008 was RMB24,725 ($3,632) and RMB26,675 ($3,919), respectively, compared to the national average for urban households of RMB15,781 ($2,318). The relatively large number of key high schools and middle schools (101, as of December 31, 2008) in the two cities also promotes the overall quality of K-12 education. According to iResearch, the combined market size for Beijing and Shanghai is expected to reach RMB37.3 billion ($5.5 billion) in aggregate revenues by 2014.
87
Table of Contents
Unlike many other private education services, such as language certification training, which focuses on preparing students for one-time tests on specific subjects, K-12 after-school tutoring service providers have the opportunity to develop multi-year relationships with students and their parents over the entire span of their K-12 education. Moreover, given the critical influence K-12 education often has over a student’s future, the K-12 after-school tutoring market is less sensitive to economic cycles than some other segments of the private education market in China, such as post-secondary school or vocational training. According to iResearch, the K-12 after-school tutoring market in China grew by 26.4% during the economic downturn in 2009, exceeding the approximately 7% growth in China’s overall education market in the same year.
According to iResearch, there are four types of K-12 after-school tutoring services currently available in China:
| • | Large classes: in-class teaching with typically more than 30 students per class. This is the traditional format of after-school tutoring. However, it is experiencing a declining trend due to its lower effectiveness compared to the other formats of after-school tutoring. In 2009, this segment represented an estimated market size of RMB26.5 billion ($3.9 billion), according to iResearch. iResearch expects the market share of large classes to continue to decline over time. | |
| • | Small classes: in-class teaching with typically10-30 students per class. The smaller class size allows teachers to pay closer attention to individual students and better tailor the classes to their study needs. This class setting therefore has become the most popular format of after-school tutoring given its attractive balance between affordability and the amount of individual attention students are able to receive from their teachers. In 2009, this segment represented an estimated market size of RMB104.6 billion ($15.4 billion), according to iResearch. iResearch expects this segment to grow at a CAGR of 19.3% over the next five years. | |
| • | One-on-one personalized tutoring. This class format offers the most customized tutoring services based on a student’s specific situations and study needs and has grown in popularity in recent years driven by the increasing demand for highly tailored tutoring services as well as an increase in the number of high-income households in China. In 2009, theone-on-one personalized tutoring segment represented an estimated market size of RMB56.2 billion ($8.3 billion), according to iResearch. iResearch expects this segment to grow at a CAGR of 20.0% over the next five years. | |
| • | Online courses: pre-recorded or live class videos coupled with interactive teaching and testing materials offered through educational websites. Online courses are able to reach a broader base of students as they are unconstrained by geographic location barriers and accessible on-demand by potential students whose schedules or location do not allow them to attend courses in person. In 2009, the online course segment represented an estimated market size of RMB2.4 billion ($352.6 million), according to iResearch. iResearch expects this segment to grow at a CAGR of 40.2% over the next five years. |
88
Table of Contents
Among the four types of tutoring services, the small classes andone-on-one personalized tutoring services segments experienced high levels of growth in recent years and are expected to become the main formats of K-12 after-school tutoring services. The following graphs set forth the revenue breakdown by types of tutoring services for the periods indicated:
China K-12 After-School Tutoring Market By Format:
| 2009 (estimated) | 2014 (estimated) | |
 |  |
Source: iResearch
The K-12 after-school tutoring market in China is highly fragmented due to the large K-12 student population, the geographic dispersion of the student population and the relatively low entry barriers. iResearch estimates that there are currently over 100,000 companies or institutions providing after-school tutoring services in China, with no provider accounting for more than 1% of the total market. We believe that teaching quality, student performance and brand strength are key differentiators in this fragmented market.
89
Table of Contents
BUSINESS
Overview
We are the largest K-12 after-school tutoring service provider in China as measured by income from operations in 2009, according to iResearch. In terms of revenues in 2009, we are one of the largest K-12 after-school tutoring service providers in China, according to iResearch. We offer comprehensive tutoring services to K-12 students covering core academic subjects, including mathematics, English, Chinese, physics, chemistry and biology. We have successfully established “Xueersi” as a leading brand in China’s K-12 private education market closely associated with high teaching quality and academic excellence in China, as evidenced by our students’ outstanding academic performance, our over 70% annual retention rate, our ability to recruit most of our students throughword-of-mouth referrals as well as the numerous recognitions and awards we have received. The K-12 after-school tutoring service market in China is highly fragmented. In 2009, we had a 0.26% market share in China and a 4.5% market share in Beijing, in each case as measured by revenues for the year according to iResearch.
We deliver our tutoring services through small classes, personalized premium services (i.e.,one-on-one tutoring) and online course offerings. Our extensive network consists of 109 learning centers and 87 service centers in Beijing, Shanghai, Shenzhen, Guangzhou, Tianjin and Wuhan, as well as our online platform. Our student enrollments increased from 67,996 in the fiscal year ended February 29, 2008 to 382,505 in the fiscal year ended February 28, 2010, representing a compound annual growth rate, or CAGR, of 137.2%. Our student enrollment growth has been predominantly driven by new students.
We are committed to providing our students with high-quality services and an exceptional learning experience. Our commitment is reflected in our continual focus on recruiting, training and retaining teachers with strong academic credentials, relevant experience and a passion for education; our emphasis on developing, updating and improving our curricula and course materials; and our stress on standardizing operating procedures throughout our network. This in turn has led to a strong track record of outstanding student achievement. In 2010, 169 out of our 430 high school graduates were admitted to Peking University or Tsinghua University, the two most prestigious universities in China that collectively enroll only less than 0.1% of the high school graduates across the country. In the same year, approximately 5,700 of our students in Beijing and Shanghai were admitted to key high schools, representing approximately 77% enrollment rate in comparison to the regional average of approximately 30%; and more than 5,500 of our students in Beijing and Shanghai were admitted to key middle schools, representing approximately 81% enrollment rate in comparison to the regional average of 15-25%. In addition, our students have won a significant number of regional, national and international math competitions, including three gold medals in the International Mathematical Olympiad in 2008 and 2009.
Our online platform, www.eduu.com, hosts China’s largest and most active online education community for our existing and potential students and their parents, and is the largest Internet education portal in China, based on the average monthly page views and average monthly unique visitors in the first six months of 2010. It provides our existing and potential students access to learning resources beyond our physical network, increases student loyalty and stickiness, and enhances our brand awareness. In addition, our online platform enables us to continue to roll out and expand our online course offerings. As word-of-mouth referrals and our online communities have contributed significantly to student recruitment, we have not incurred significant advertising expenses in the past. Our online platform is protected by a combination of PRC laws and regulations that protect trademarks, copyrights, domain names, know-how and trade secrets, as well as confidentiality agreements. Revenues generated from our online course offerings have accounted for less than 1.5% of our total net revenues since we began offering online courses in 2010.
We have experienced significant growth in recent years. Our total net revenues increased from $8.9 million in the fiscal year ended February 29, 2008 to $69.6 million in the fiscal year ended February 28, 2010, representing a CAGR of 179.9%. Our net income increased from $1.5 million in the fiscal year ended February 29, 2008 to $14.2 million in the fiscal year ended February 28, 2010, representing a CAGR of
90
Table of Contents
206.9%. Our total net revenues for the six months ended August 31, 2010 were $53.0 million, and our net income for the same period was $13.2 million.
Due to PRC legal restrictions on foreign ownership and investment in the education business in China, we operate our after-school tutoring service business primarily through our variable interest entities and their subsidiaries and schools in China. We do not hold equity interests in our variable interest entities; however, through a series of contractual arrangements with these variable interest entities and their respective shareholders, we effectively control and are able to derive substantially all of the economic benefits from these variable interest entities.
Our Strengths
We always seek to leverage on our competitive strengths to grow our business in an efficient and cost-effective manner. We believe the following are our key competitive strengths that have contributed significantly to our success and differentiate us from our competitors:
Largest K-12 After-School Tutoring Service Provider in China
We are the largest K-12 after-school tutoring service provider in China as measured by income from operations in 2009, according to iResearch. In terms of revenues in 2009, we are one of the largest K-12 after-school tutoring service providers in China, according to iResearch. The after-school tutoring market we serve is one of the largest and fastest growing segments in China’s private education sector. The K-12 after-school tutoring service market in China is highly fragmented. In 2009, we had a 0.26% market share in China and a 4.5% market share in Beijing, in each case as measured by revenues for the year according to iResearch. We have 109 learning centers and 87 service centers in six major cities in China, namely, Beijing, Shanghai, Shenzhen, Guangzhou, Tianjin and Wuhan. We offer comprehensive tutoring services to K-12 students covering all core academic subjects through a variety of educational formats including small classes, personalized premium services and online courses. Our scale has enabled us to effectively leverage our brand, extensive existing network, proprietary curricula and course materials and high teaching quality to become a leading national player in a highly fragmented industry.
Being a market leader in China’s K-12 after-school tutoring service market enables us to more efficiently introduce and promote new service offerings and to more effectively attract and retain talented personnel by providing them with career development and advancement opportunities.
Strong Brand
We believe that our “Xueersi” brand is closely associated with high teaching quality and academic excellence. This strong brand has enabled us to recruit students primarily throughword-of-mouth referrals, and as a result, we have been able to keep our marketing costs low relative to our total revenues. It also contributed to our ability to develop a loyal student base, as evidenced by our over 70% annual retention rate and robust online community. Moreover, our strong brand allows us to attract high quality teachers and retain a pricing premium relative to our competitors. Furthermore, we are able to leverage our brand to expand into new markets and quickly establish a leading position in those markets.
We have received numerous awards such as, in 2009, theParents’ Most Trusted After-School Educational Institutionaward by Sina.com, theMost Influential After-School Education Brand in the last 60 Years Since 1949award by Sohu.com, theMost Innovative Chinese Education Groupaward by Beijing News and Media andChina’s Most Influential Education Brandaward by Tencent.com.
Outstanding Student Performance
We have established an impressive track record of outstanding student performance. In Beijing and Shanghai in 2010, approximately 5,700 of our students were admitted to key high schools, representing approximately 77% enrollment rate in comparison to the regional average of approximately 30%; and more than 5,500 of our students were admitted to key middle schools, representing approximately 81% enrollment
91
Table of Contents
rate in comparison to the regional average of 15-25%. Key schools are selected public schools in China with the highest admission standards and best allocated educational resources from the government. Moreover, in 2010, 169 out of our 430 high school graduates were admitted to Peking University and Tsinghua University, the two most prestigious universities in China that collectively enroll only less than 0.1% of high schools graduates across the country. In addition, our students have won a significant number of regional, national and international math competitions, including three gold medals in the International Mathematical Olympiad in 2008 and 2009.
High Teaching Quality, Strong Content Development and Efficient Education Management System
We believe our commitment to consistent high teaching quality and standards is a significant driving force behind our success. This commitment is reflected in our highly selective teacher hiring process, our emphasis on continued teacher training and rigorous evaluation, competitive performance-based compensation and opportunities for career advancement. We routinely recruit teachers from top tier universities in China. In the past three years, only approximately 5% of applicants to our teaching positions were hired by us. Each of our newly hired teachers is required to undergo months of training before teaching classes and must participate in our continued training programs and a regular and rigorous evaluation process. We believe that our performance-based compensation packages are among the highest in the K-12 tutoring market in China and have helped us retain our best teaching talent. Furthermore, we offer career advancement opportunities to our best teachers who are considered for management positions.
We have a dedicated team of over 217 full-time employees focusing on curriculum and course material development, updating and improvement. This team works closely with our education expert advisors to keep up with changing academic and examination requirements in China’s K-12 education system and solicits feedback from our teachers based on their classroom experience. Substantially all of our course materials are designed and developed in house and tailored to different focuses of our students at each grade level.
We modularize each distinct function of our operating procedures to optimize efficiency. In addition, we have established a highly standardized set of procedures across our system with respect to course and service offerings. We believe standardization allows us to achieve consistency in curricula delivered across our network, our branding and marketing as well as our operating guidelines.
Largest Online Education Platform in China
Our online platform, www.eduu.com, hosts China’s largest and most active online education community for our existing and potential students and their parents, and is the largest Internet education portal in China, based on the average monthly page views and the average monthly number of unique visitors in the first six months of 2010. In addition, it serves as a gateway to our online courses and seven other websites dedicated to specific topics, including college entrance examinations, high school entrance examinations, preschool & kindergarten education, personalized premium services, mathematics, English, and Chinese composition.
Our websites dedicated to specific topics provide an efficient platform for information exchange, resources sharing and social networking. On these websites, the large and growing online community of students and parents are able to receive the latest information on school admissions and examinations and access past exam questions and test analyses. In addition, they are able to share their experiences and views regarding our courses, public school education in general and various other topics that concern them. They can also obtain information on, and make purchases of, our classroom-based course offerings in these topic areas.
The online platform complements and extends our existing physical network to improve our students’ learning experience, increases student loyalty and stickiness, facilitates ongoing parent participation and enhances our brand awareness. Additionally, our online platform enables us to leverage our high quality content and teachers to expand our addressable target market, facilitates direct and constant communications with our prospective students and parents and effectively lowers our student acquisition costs.
92
Table of Contents
Innovative and Entrepreneurial Management Team with Passion for Education
We have an innovative and entrepreneurial management team with a passion for education. Our co-founders, Mr. Bangxin Zhang and Mr. Yundong Cao, started our first after-school tutoring class in 2003 when they were still attending graduate school at Peking University. Two additional members of our senior management team, Dr. Yachao Liu and Mr. Yunfeng Bai, joined us as teachers in 2003 and 2005, respectively, and have risen to their current management positions because of their commitment to our company and outstanding performance. Under the leadership of our senior management, we have successfully executed our growth strategies to focus exclusively on the K-12 after-school tutoring service market and have become the leader in this market in China. We take great pride in our entrepreneurial, motivated and student-oriented corporate culture.
Our Strategies
We intend to pursue the following key growth strategies to achieve our goal of maintaining and further strengthening our leading position in the after-school tutoring service market in China:
Further Penetrate Existing Markets
We intend to further penetrate our existing markets by leveraging our strong brand, economies of scale and content development and teaching prowess. We currently have learning centers in six of the most economically prosperous cities in China, but our share of the overall K-12 after-school tutoring market still remains relatively low. For example, in Beijing and Shanghai, where our largest operations are based, our students account for less than 3% of the K-12 student population. We plan to leverage our brand to significantly increase our market share in each of these markets through opening additional learning centers.
We also plan to grow revenues in our existing markets by offering more classes and subjects at various grade levels, expanding classes to additional grade levels in cities where we do not yet offer them at all grade levels, attracting our existing students to enroll in additional courses, attracting new students to enroll in our courses and service offerings.
Extend Geographic Network into Attractive New Markets
We intend to expand our geographic network into additional attractive markets in China. We have already identified several economically prosperous regions in China with high projected growth, which we expect to offer attractive returns on capital. We intend to rigorously analyze various competitive and demographic factors in those markets in order to align our course offerings with local needs while maintaining the efficiency of our operations through our centralized structure, standardized training, and content development processes.
Expand Personalized Premium Services
We believe there is strong growth potential in the personalized premium services market. Our personalized premium services offer customized curricula and education timelines to suit each student’s educational focus and requirements. We started personalized premium services in 2007 and have since grown rapidly to become a market leader in this market segment in Beijing. We operate 19 learning centers and 20 service centers in Beijing that are devoted to personalized premium services. We intend to further expand our personalized premium services in Beijing and replicate our successful model to other geographic markets, particularly those where we already have a successful track record operating small classes, while maintaining our high teaching quality.
Further Develop Online Course Offerings
We plan to further develop our online course offerings to extend our market reach and maximize the potential of our services. Online courses offer a cost-effective means for us to reach a broader target student base and realize greater cross-selling opportunities with our existing students, more fully utilize our existing
93
Table of Contents
education resources and generate attractive returns on capital. They enable us to leverage our proprietary curricula and course materials as well as high-quality teachers to target markets beyond our physical network. They also enable students to access our courses through the Internet at times and places most convenient for them and greatly facilitate interactions among students, teachers and parents. We began to officially offer online courses in 2010 and revenues generated from our online course offerings have accounted for less than 1.5% of our total net revenues. We intend to continue to invest in the expansion of our online education courses and improve our online platform.
Our Motto and Educational Philosophy
Our approach to education is based on our motto “Learning Changes Lives” and an educational philosophy reflected in four guiding principles:
| • | educate our students to become well-rounded people with integrity and high moral standards; | |
| • | motivate our students to set and achieve high long-term goals; | |
| • | nurture our students’ passion for learning; and | |
| • | foster a loving and caring character in our students. |
Our Tutoring Services
We deliver our tutoring services to our students through small class settings, personalized premium services (i.e.,one-on-one tutoring) and online course offerings.
Small classes
Since our inception, we have been offering courses in small class settings, which remain our main form of service offering in terms of number of student enrollments. 90 of our 109 learning centers and 67 of our 87 service centers nationwide are devoted to offering small classes. A typical small class course consists of 15 or 16 sessions during each spring and fall school semester and 7 to 12 sessions during each summer and winter break. Each session typically lasts three hours with course fees ranging from RMB50 to RMB55 per hour.
We typically enroll a maximum of 15 students in each small class at primary school levels, a maximum of 25 students in each small class at middle school levels, and a maximum of 30 students in each small class at high school levels. We keep the size of our classes small so that students can receive more individual attention from teachers than what they would typically experience in a large class setting and are able to learn in an interactive group environment. Moreover, small classes allow our teachers to maintain frequent interactions with students and parents before and after classes to discuss their questions, address their concerns and provide feedback on students’ progress.
We design curricula catering to our students’ different educational requirements and needs. Many of our classes for the same subject and grade level are offered at different levels of difficulty to better cater to the different needs of our students. For instance, we offer math tutoring in the form of basic classes, advanced classes, which are taught at a faster pace than basic classes, intensive classes, which are conducted at an even more accelerated pace, and specialized classes, which cater to the needs of advanced students and focus on specialized training for math competitions. We periodically assess our students’ progress, and based on the results of such assessment, reassign students to different classes on an as-needed basis such that each student’s situation and needs are taken into consideration.
To maximize transparency, improve learning experience and build trust with students and parents, we allow parents to audit most of the small classes their children attend, and for many of our classes, also offer unconditional refunds for any remaining unattended classes if notified by the student or parent within the first two-thirds of each course.
94
Table of Contents
Personalized Premium Services
We began to offer personalized premium services in August 2007 under our “Zhikang” brand. We operate 19 learning centers and 20 services centers in Beijing that are devoted to personalized premium services. The course fees for our personalized premium services range from RMB220 to RMB1,000 per hour.
Our personalized premium services provide fully customized curricula and course materials and flexible schedules to suit each student’s educational focus in aone-on-one student-teacher setting. We provide personalized premium services to cater to the specific requirements of our students, such as addressing weaknesses in particular subjects or topics, providing intensive examination or competition preparation and tailoring the pace of learning to accommodate above- or below-average learning curves.
Key features of our personalized premium services include:
Completely customized tutoring solution. Each prospective student of our personalized premium services must meet with our course consultant and undergo a range of diagnostic tests to assess the student’s strengths, weaknesses and potential. We then design and recommend a customized tutoring solution to the student in consultation with the student’s parents with respect to timing, cost and other considerations specific to the students’ circumstances. During the entire course of our personalized premium services for a student, we actively monitor the student’s progress and adjust the curriculum and learning pace for the student when necessary.
Tailor-made course materials. The course materials used in our personalized premium services are specifically selected by subject teachers from our comprehensive course material database for the benefits of each student. We leverage our strong curriculum and course material development capability to provide high quality course materials to our students.
One-on-one student-teacher setting, supported by a team of experienced teachers. Each student in our personalized premium service has access to our large pool of experienced teachers in every subject and at every grade level. A large majority of the teachers in ourone-on-one personalized premium services are full-time teachers to ensure better quality control. Teachers are chosen by students and their parents based on the specific interests and needs of each student. Each of our personalized premium tutoring sessions is conducted in aone-on-one student-teacher setting.
Personalized attention. We assign each student a coordinator, who routinely communicates with the student and the student’s parents to address their questions and concerns and to closely monitor the quality of our services. The coordinator normally communicates with students and parents within 24 hours of each session and solicits weekly and monthly feedback from students and parents. We also accommodate any request by students or parents to change teachers to the extent practicable.
We intend to further expand our personalized premium services in Beijing and replicate this model to our other geographic markets, particularly those where we already have a successful track record operating small classes.
Online Courses
We offer selected online courses in math, Chinese and English through one of our websites,www.eduu.cn, where we began to officially offer online courses in 2010. As of August 31, 2010, we had 22,009 accumulated student enrollments in our online courses and we delivered 10,237 recorded videos of online courses. The online course fees range from RMB50 to RMB55 per hour.
Online courses enable us to leverage our proprietary curricula and course materials and high quality teachers to target markets beyond the reach of our physical network. It also enables our students to access our courses through the Internet at times and places most convenient for them.
Key features of our online courses include:
High quality audio-video lectures. All of our online courses feature high quality audio-video lectures by experienced teachers. They are delivered through a multimedia web interface using streaming media and other
95
Table of Contents
technologies. The audio-video lectures are accompanied by high resolution animated slides to create a stimulating learning environment for our students.
Teachers with superior communication skills. We select lecturers for our online courses from among our top teachers. We seek to engage teachers who have a strong command of the respective subject areas and superior communication skills. In particular, we seek teachers capable of, and preferably experienced in, delivering effective instructions through the audio-video format. All teachers for online courses are required to undergo trial classes before recording their lectures.
Quality course-related support. Our online courses are supplemented by our proprietary course materials, online assignments, exercises, mock examinations and other forms of course-related support. We require students of our online courses to complete exercise questions as homework. Students can post questions online through our websites, which our instructors usually respond to within 24 hours after a question is submitted.
Comprehensive student supports. Each student’s performance is closely monitored by a class coordinator who communicates with the student and the student’s parents to follow up on the student’s progress, which we believe has contributed to the high completion rate of our online courses by our students.
We plan to further develop our online course offerings to extend our market reach and maximize the potential of our services. In particular, we intend to expand our course offerings to include more subjects and grade levels.
Student Services
We strive to provide a supportive learning environment to our students through our teachers, class coordinators, call centers and online platform.
Our teachers keep track of the students’ performance and progress and regularly communicate with the students and parents. Moreover, each of our students in the personalized premium services is assigned a class coordinator who is in close contact with the students and parents regarding scheduling and other logistical issues, receives feedback on teaching quality and arranges teacher replacements where necessary.
We have two call centers in Beijing and Shanghai, the main functions of which include receiving enquiries, accepting registrations and addressing other course-related issues. In addition, we regularly reach out to students of our online courses through the call centers to keep track of their progress. Our call center in Beijing has 90 operators and is open between 8 a.m. and 7 p.m. Our call center in Shanghai has 14 operators and is open between 9 a.m. and 8 p.m. The call centers facilitate our communications with existing and prospective students, our monitoring of completion of online courses and our efficient resolution of any concerns raised by our students or their parents.
In addition, the online platform, among other things, provides an efficient channel for the students and parents to submit study questions to our subject experts, which are generally answered within 24 hours.
Our Curricula and Course Materials
Curricula
Our curricula cover the core K-12 subjects, which include mathematics, English, Chinese, physics, chemistry and biology.
96
Table of Contents
We started our business in 2003 by offering tutoring classes in mathematics, which still remains one of our strongest subjects as evidenced by the outstanding performance of our students in mathematics examinations and competitions. We then gradually rolled out courses in other subjects over the past several years. In terms of grade levels, we initially focused on serving primary school students and over the time expanded our course offerings into higher grade levels. The following table provides a list of our current course offerings in Beijing:
| Primary School | Middle School | High School | ||||||||||||||||||||||||||||||||||||||||||||||||||
| K | 1 | 2 | 3 | 4 | 5 | 6 | 7 | 8 | 9 | 10 | 11 | 12 | ||||||||||||||||||||||||||||||||||||||||
| Mathematics | • | • | • | • | • | • | • | • | • | • | • | • | • | |||||||||||||||||||||||||||||||||||||||
| English | • | • | • | • | • | • | • | • | • | • | • | • | • | |||||||||||||||||||||||||||||||||||||||
| Chinese | • | • | • | • | • | • | • | • | • | • | • | • | • | |||||||||||||||||||||||||||||||||||||||
| Physics | – | – | – | – | – | – | – | – | • | • | • | • | • | |||||||||||||||||||||||||||||||||||||||
| Chemistry | – | – | – | – | – | – | – | – | – | • | • | • | • | |||||||||||||||||||||||||||||||||||||||
| Biology | – | – | – | – | – | – | – | – | – | – | • | • | • | |||||||||||||||||||||||||||||||||||||||
| • | : Currently offered. | |
| – | : Not offered at the corresponding grade level in public schools in China. |
Curriculum and Course Material Development
Substantially all of our education content is developed in-house. We have a dedicated team of over 217 full-time employees who are responsible for developing, updating and improving our curricula and course materials. The team is further divided based on subjects covered, with each subject team led by a director who has significant teaching experience in the subject. Our team works closely with our education advisors in different subject fields to keep up with changing academic and examination requirements in China’s K-12 education system and solicits feedback from our teachers based on their classroom experience.
The development process of our curricula and course materials typically starts with reviewing and referencing recent teaching materials and teachers’ training materials from leading public schools as well as any new examination requirements to analyze the latest market trends and needs. Our development team is able to identify subjects and concepts that are difficult for students and focuses on the most important and difficult concepts and skills in the curricula. To address different educational requirements and needs of our students at each grade level, we have also developed curricula and course materials tailored for classes of different difficulty levels based on that group of students’ learning curves as well as their strengths and weaknesses. At the end of each class cycle, we evaluate, update and improve course materials based upon usage rate, feedback from teachers, students and parents as well as student performance.
Most of our curricula and course materials are developed at our corporate level in Beijing and adopted by other locations with modifications to meet local requirements and demands. We are also in the process of modularizing course materials based on specific topics so that centrally developed content can be more easily adopted locally and make our services more scalable.
Our Teachers
As our teachers interact with our students on a daily basis, they are critical to maintaining the quality of our services and to promoting our brand and reputation. We have a team of dedicated and highly qualified teachers with a strong passion for education, whom we believe are essential to our success. We are committed to maintaining a consistent and high teaching quality. This commitment is reflected in our highly selective teacher hiring process, our emphasis on continued teacher training and rigorous evaluation, competitive performance-based compensation and opportunities for career advancement. We had 76, 363, 647 and 1,067 full-time teachers and 1,572, 2,054, 2,460 and 1,455 contract teachers as of February 29, 2008, February 28, 2009 and 2010 and August 31, 2010, respectively. We have experienced low attrition of our teachers. Our voluntary teacher attrition rate was 1.6% and 5.2% for the fiscal years ended February 28, 2009
97
Table of Contents
and 2010, respectively. During the fiscal year ended February 28, 2010, we increased the number of full-time teachers as a percentage of our total teaching staff as part of our ongoing strategy to optimize our teacher management system. As a result, some lower-performing contract teachers were assigned fewer classes than before, which led to a greater number of contract teachers discontinuing their employment with us and thus a higher voluntary attrition rate during the period than the previous fiscal year.
We routinely recruit teachers from top-tier universities in China. We also hire experienced teachers with a solid track record and strong reputation from other schools. Our hiring process is highly selective. In the past three years, only approximately 5% of applicants to our teaching positions were hired by us.
Each of our newly hired full-time teachers is required to undergo months of training before teaching classes and must continue to participate in periodic training programs that focus on education content, teaching skills and techniques as well as our corporate culture and values. In addition, our teachers are regularly evaluated for their classroom performance and teaching results. Our teachers’ retention, compensation and promotion are to a large extent based on the results of such evaluations. The evaluation process is highly rigorous and based mainly on four factors: annual retention rate, refund rate, class enrollment rate and student and parent satisfaction rate.
We offer our teachers competitive and performance-based compensation packages and provide them with prospects of career advancement within the company. Our best teachers may be promoted to become directors of our operations in geographic markets outside Beijing, invited to participate in our educational content development effort and even considered for senior management positions.
When we open a school in a new city, we typically select the school head from a pool of our top teachers in Beijing who have demonstrated management talent in an effort to maintain a uniform standard of teaching quality and consistent company culture as we expand. We require managers for new schools to participate in training sessions at our Beijing headquarters, which are designed to share best practices and disseminate policies, guidelines and standards to each of our locations. These school managers are then responsible for ongoing training of our full-time teachers at new locations.
Our Network
Our extensive network consists of 109 learning centers and 87 service centers in Beijing, Shanghai, Shenzhen, Guangzhou, Tianjin and Wuhan, two call centers in Beijing and Shanghai as well as our online platform. Our learning centers host teaching facilities and are physical locations where classes are being conducted. Our service centers offer consultation, course selection, registration and other services, most of which are also provided by our call centers.
The following table sets forth the number of learning centers and service centers in each of the six cities in our physical network.
| Number of | Number of | |||||||
City | Learning Centers | Service Centers | ||||||
| Beijing | 80 | 61 | ||||||
| Shanghai | 14 | 12 | ||||||
| Shenzhen | 2 | 2 | ||||||
| Guangzhou | 3 | 3 | ||||||
| Tianjin | 4 | 3 | ||||||
| Wuhan | 6 | 6 | ||||||
We intend to open new learning and service centers both in our existing and newly identified geographic markets to capitalize on growth opportunities. We have adopted a systematic approach for expansion of our learning centers or geographic markets. The decision on whether to open a new learning center is typically made at the corporate level and involves a well-established process requiring participation by different levels of management personnel within our organizational structure. In selecting the locations for new learning centers, we perform comprehensive studies of each location by gathering education statistics, demographic
98
Table of Contents
data, public transportation information and other data. Our process in identifying a new market involves additional steps and rigorous analyses, such as promoting our brand locally, recruiting teachers and other staff and commencing course offerings with an initial focus on certain core subjects.
As we add new centers, management has also taken steps to ensure that we do so in a consistent fashion, including center design and build-out, operating hours, cash collection procedures, and course materials distribution. Key data from each new school is recorded in our IT system, allowing our senior management at our headquarters to analyze the key metrics of the business and determine areas that require greater management attention. To establish proper controls as we expand, we also establish a local finance team in each new city with oversight from the finance team at our headquarters. The finance team at our headquarters regularly monitors and provides training to the finance team in each school to ensure that our key financial policies are implemented at the local level.
Moreover, our online platform, www.eduu.com, hosts China’s largest and most active online education community for our existing and potential students and their parents, and is the largest Internet education portal in China, based on the average monthly page views and average monthly unique visitors in the first six months of 2010. In addition, it serves as a gateway to our online courses and seven other websites dedicated to specific topics, including college entrance examinations, high school entrance examinations, preschool education, personalized premium services, mathematics, English and Chinese composition.
Marketing and Student Recruitment
We recruit our students primarily throughword-of-mouth referrals. Our excellent reputation and strong brand have also greatly facilitated our student recruitment. Moreover, we engage in a range of marketing activities to enhance our brand recognition among prospective students and their parents, generate interest in our service offerings and further stimulate referrals. In fiscal years ended February 29, 2008, February 28, 2009 and 2010 and for the six months ended August 31, 2010, our selling and marketing expenses were $0.4 million, $2.4 million, $5.6 million and $4.2 million, respectively, accounting for 4.2%, 6.3%, 8.1% and 7.9% of our total net revenues, respectively.
Referrals
We believe the single greatest contributor to our success in student recruitment has beenword-of-mouth referrals by our students and their parents who share their learning experiences at Xueersi with others. Our recruitment throughword-of-mouth referrals has enjoyed a strong network effect with the rapid growth in our student base, and benefits from our excellent reputation, strong brand and outstanding performance by our students.
Online Platform
Our online platform has contributed significantly to increasing student loyalty and stickiness and enhancing our brand awareness. It also facilitates direct and frequent communications with our prospective students and parents and effectively lowers our student recruitment costs.
Public Lectures, Seminars, Diagnostic Sessions and Media Interviews
We frequently offer free public lectures, seminars and diagnostic sessions to students and parents as a way of providing useful information to our prospective students and relevant experience for them to evaluate our offerings. In the fiscal year ended February 28, 2010, we offered more than 350 public lectures, seminars and diagnostic sessions and had more than 23,000 meetings with students and parents. In addition, our approach to high teaching quality and the track record of our outstanding student performance has captured the attention of many traditional and new media, which we believe further enhanced our reputation and brand.
99
Table of Contents
Advertisement and Others
We advertise through leading search engines in China and our cooperative relationships with other education websites targeting Chinese students. We also have advertising arrangements with well-known newspapers in Beijing and use other advertising channels such as outdoor advertising campaigns. In addition, we distribute marketing materials such as brochures, posters and flyers to current and prospective students and their parents in our learning centers, service centers and outside public school campuses. We also participate in various education services and products exhibitions and conventions.
Competition
The after-school tutoring service sector in China is rapidly evolving, highly fragmented and competitive. We face competition in each type of service we offer and each geographic market in which we operate. Our competitors at the national level include New Oriental Education & Technology Group Inc., Juren Education, Ambow Education Holding Ltd., Xueda Education Technology (Beijing) Co., Ltd. and ChinaEdu Corporation. We also face regional competition from various local players.
We believe the principal competitive factors in our business include the following:
| • | brand; | |
| • | student achievements; | |
| • | price/value; | |
| • | type and quality of tutoring services offered; and | |
| • | ability to effectively tailor service offerings to specific needs of students, parents and educators. |
We believe that we compete favorably with our competitors on the basis of the above factors. However, some of our competitors may have more resources than we do, and may be able to devote greater resources than we can to expand their business and market shares. See “Risk Factors—Risks Related to Our Business—We face significant competition, and if we fail to compete effectively, we may lose our market share and our profitability may be adversely affected.”
Intellectual Property
Our brands, trademarks, service marks, copyrights and other intellectual property rights distinguish and protect our course offerings and services from infringement, and contribute to our competitive advantages in the after-school tutoring service sector in China. Our intellectual property rights include the following:
| • | 3 trademark registrations for our brand and logo in China and Hong Kong; | |
| • | registrations of 13 domain names; | |
| • | copyrights to substantially all of the course content we developed in house, including all of our online courses; and | |
| • | copyright registration certificates for 20 software programs developed by us relating to different aspects of our operations. |
100
Table of Contents
In particular, we have several domain names that are highly valued unique assets of our online platform as each domain name incorporates the Chinese spelling of the theme of the corresponding website, and is therefore easy to remember. Listed below are nine domain names we have registered and the theme of the respective website under each domain name:
Website Domain Name | Main Purpose | |
| www.eduu.com | Our main webpage which is linked to the websites listed below | |
| www.eduu.cn | Online courses | |
| www.gaokao.com | College entrance examinations | |
| www.zhongkao.com | High school entrance examinations | |
| www.jiajiaoban.com | Personalized premium services | |
| www.aoshu.com | Mathematics for primary and middle schools; specialized training for competition mathematics | |
| www.yingyu.com | English language | |
| www.zuowen.com | Chinese composition | |
| www.youjiao.com | Preschool and kindergarten education |
To protect our brand and other intellectual property, we rely on a combination of trademark, copyright, domain names, know-how and trade secret laws as well as confidentiality agreements with our employees, contractors and others. We cannot be certain that our efforts to protect our intellectual property rights will be adequate or that third parties will not infringe or misappropriate these rights. See “Risk Factors—Risks Related to Our Business—If we fail to protect our intellectual property rights, our brand and business may suffer.”
Facilities
Our headquarters are located in Beijing, China and occupy approximately 95,087 square feet under a lease which expires in October 2012. We also lease all of our learning centers and service centers, which occupy an aggregate of approximately 971,398 square feet in six cities in China. For more detailed information about the locations of our learning centers and service centers, see “—Our Network.”
Employees
We had 395, 1,404, 2,342 and 2,827 full-time employees as of February 29, 2008, February 28, 2009 and 2010 and August 31, 2010, respectively. The following table sets forth the number of our employees by function as of August 31, 2010:
| Number of | ||||||||
Functional Area | Employees | % of Total | ||||||
| Teaching | 1,067 | 37.7 | % | |||||
| Customer service | 912 | 32.3 | % | |||||
| Sales and marketing | 149 | 5.3 | % | |||||
| Curriculum and course material development | 217 | 7.7 | % | |||||
| General and administrative | 325 | 11.5 | % | |||||
| Technology | 157 | 5.6 | % | |||||
Total | 2,827 | 100.0 | % | |||||
Of our total number of employees as of August 31, 2010, 2,390 were in Beijing, 267 were in Shanghai and 170 were in other locations in China.
From time to time, we also employ contract teachers, part-time employees and engage independent consultants to support our teaching and curriculum and course material development activities. We remunerate
101
Table of Contents
our employees with basic salaries as well as performance-based bonuses. We believe that our employee relations are good.
We plan to hire additional teachers and other employees as we expand. Our employee recruiting channels includeword-of-mouth referrals, on-campus recruiting, online recruiting and professional recruiters. We also partner with leading higher education institutions and employ other measures designed to bring us into contact with suitable candidates for employment.
Our full-time employees in China participate in a government mandated defined contribution plan pursuant to which certain pension benefits, medical care, unemployment insurance, housing funds and other welfare benefits are provided to the employees. Chinese labor regulations require that our PRC subsidiaries make contributions to the government for these benefits based on a fixed percentage of the employees’ salaries.
Insurance
We maintain various insurance policies to safeguard against risks and unexpected events. We have purchased limited liability insurance for our students and their parents covering our learning centers in Beijing, Shanghai and Tianjin. We do not maintain business interruption insurance, product liability insurance or key-man life insurance. We consider our insurance coverage to be in line with that of other private education providers of a similar size in China.
Legal Proceedings
We are not currently involved in any material litigation, arbitration or administrative proceedings that could have a material adverse effect on our financial condition or results of operations. From time to time, we may be subject to various claims and legal actions arising in the ordinary course of business.
102
Table of Contents
REGULATION
This section summarizes the principal PRC regulations relating to our businesses.
We operate our business in China under a legal regime consisting of the National People’s Congress, which is the country’s highest legislative body, the State Council, which is the highest authority of the executive branch of the PRC central government, and several ministries and agencies under its authority, including the Ministry of Education, the General Administration of Press and Publication, the Ministry of Information Industry, the State Administration for Industry and Commerce, the Ministry of Civil Affairs and their respective local offices.
Regulations on Private Education
The principal laws and regulations governing private education in China consist of the Education Law of the PRC, The Law for Promoting Private Education (2003) and The Implementation Rules for the Law for Promoting Private Education (2004), and the Regulations on Chinese-Foreign Cooperation in Operating Schools. Below is a summary of relevant provisions of these regulations.
Education Law of the PRC
On March 18, 1995, the National People’s Congress enacted the Education Law of the PRC. The Education Law sets forth provisions relating to the fundamental education systems of the PRC, including a school system of preschool education, primary education, secondary education (including middle and high schools) and higher education, a system of nine-year compulsory education and a system of education certificates. The Education Law stipulates that the government formulates plans for the development of education, and establishes and operates schools and other institutions of education. Under the Education Law, enterprises, social organizations and individuals are in principle encouraged to operate schools and other types of educational organizations in accordance with PRC laws and regulations. Meanwhile, no organization or individual may establish or operate a school or any other institution of education for profit-making purposes. However, private schools may be operated for “reasonable returns,” as described in more detail below.
The Law for Promoting Private Education (2003) and the Implementation Rules for the Law for Promoting Private Education (2004)
The Law for Promoting Private Education (2003) became effective on September 1, 2003. The Implementation Rules for the Law for Promoting Private Education (2004) became effective on April 1, 2004. Under these regulations, “private schools” are defined as schools established by non-governmental organizations or individuals using non-government funds. In addition, under the regulations, private schools providing certifications, pre-school education, self-study aid and other academic education are subject to approval by the education authorities, while private schools engaging in occupational qualification training and occupational skill training are subject to approval by the authorities in charge of labor and social welfare. A duly approved private school will be granted a private school operating permit, and shall be registered with the Ministry of Civil Affairs or its local bureaus as a privately run non-enterprise institution. In addition, schools and their learning centers must make filings with the Ministry of Education and the Ministry of Civil Affairs or their local bureaus. Among our ten affiliated schools, two are in the process of renewing their private school operating permits and each of the remaining eight schools has obtained and maintained the private school operating permits.
Under the above regulations, private schools have the same status as public schools, though private schools are prohibited from providing military, police, political and other kinds of education that are of a special nature. Government-run schools that provide compulsory education are not permitted to be converted into private schools. In addition, operation of a private school is highly regulated. For example, the types and amounts of fees charged by a private school providing certifications shall be approved by the pricing authority and be publicly disclosed. A private school that does not provide certifications shall file its pricing information with the pricing authority and publicly disclose such information. We do not offer any degree or certification course and thus we shall file our pricing information with the relevant pricing authorities in the
103
Table of Contents
school districts where we have operations. We disclose all our pricing information for all our services to public.
Private education is treated as a public welfare undertaking under the regulations. Nonetheless, investors of a private school may choose to require “reasonable returns” from the annual net balance of the school net of costs, donations received, government subsidies, if any, the reserved development fund and other expenses as required by the regulations. Private schools fall into three categories, including private schools established with donated funds, private schools that require reasonable returns and private schools that do not require reasonable returns.
The election to establish a private school requiring reasonable returns shall be provided in the articles of association of the school. The percentage of the school’s annual net balance that can be distributed as reasonable return shall be determined by the school’s board of directors, taking into consideration the following factors: (i) school fee types and collection criteria, (ii) the ratio of the school’s expenses in connection with educational activities and improvement of educational conditions to the total fees collected; and (iii) the admission standards and educational quality. The relevant information relating to the above factors shall be publicly disclosed before the school’s board may determine the percentage of the school’s annual net balance to be distributed as reasonable returns. Such information and the decision to distribute reasonable returns shall also be filed with the relevant government authorities within 15 days of the board decision. However, none of the current PRC laws and regulations provides any specific formula or guideline for determining “reasonable returns.” In addition, none of the current PRC laws and regulations sets forth clear requirements or restrictions on a private school’s ability to operate its education business as a school that requires reasonable returns or as a school that does not require reasonable returns.
At the end of each fiscal year, every private school is required to allocate a certain amount to its development fund for the construction or maintenance of school facilities or procurement or upgrade of educational equipment. In the case of a private school that requires reasonable returns, this amount shall be no less than 25% of the annual net balance of the school, while in the case of a private school that does not require reasonable returns, this amount shall be equal to no less than 25% of the annual increase in the net assets of the school, if any. Private schools that do not require reasonable returns shall be entitled to the same preferential tax treatment as public schools, while the preferential tax treatment policies applicable to private schools requiring reasonable returns shall be formulated by the finance authority, taxation authority and other authorities under the State Council. To date, however, no regulations have been promulgated by the relevant authorities in this regard. To date, among our ten affiliated schools, seven have elected not to require reasonable returns and the remaining three have elected to require reasonable returns. All of them have allocated certain amounts to their development funds in compliance with the aforesaid provisions.
Regulations on Chinese-Foreign Cooperation in Operating Schools
Chinese-foreign cooperation in operating schools or training courses is specifically governed by the Regulations on Chinese—Foreign Cooperation in Operating Schools, promulgated by the State Council in 2003 in accordance with the Education Law, the Occupational Education Law and the Law for Promoting Private Education, and the Implementing Rules for the Regulations on Chinese—Foreign Cooperation in Operating Schools, or the Implementing Rules, which were issued by the Ministry of Education in 2004.
The Regulations on Chinese—Foreign Cooperation in Operating Schools and its Implementing Rules encourage substantive cooperation between overseas educational organizations with relevant qualifications and experience in providing high-quality education and Chinese educational organizations to jointly operate various types of schools in the PRC. Cooperation in the areas of higher education and occupational education is especially encouraged. Chinese-foreign cooperative schools are not permitted, however, to engage in compulsory education or military, police, political and other kinds of education that are of a special nature in the PRC.
Permits for schools jointly operated by Chinese and foreign entities shall be obtained from the relevant education authorities or the authorities that regulate labor and social welfare in the PRC. We are not required
104
Table of Contents
to apply for such permits as all of our schools are operated by Xueersi Network, Xueersi Education or their respective subsidiaries, which are Chinese entities.
Regulations on Online and Distance Education
Pursuant to the Administrative Regulations on Educational Websites and Online and Distance Education Schools issued by the Ministry of Education in 2000, educational websites and online education schools may provide education services in relation to higher education, primary education, preschool education, education for teachers, occupational education, adult education, other education and public educational information services. “Educational websites” refer to organizations providing education or education-related information services to website visitors by means of a database or online education platform connected via the Internet or an educational television station through an Internet service provider, or ISP. “Online education schools” refer to education websites providing academic education services or training services that issue education certificates.
Setting up educational websites and online education schools is subject to approval from relevant education authorities, depending on the specific type of education provided. Any education website and online education school shall, upon receipt of the approval, indicate on its website such approval information as well as the approval date and file number.
According to the Administrative License Law promulgated by the Standing Committee of the National People’s Congress, or NPC, on August 27, 2003, which became effective on July 1, 2004, only laws promulgated by NPC and regulations and decisions promulgated by the State Council may eliminate the requirement for any administrative license. According to a regulation promulgated by the State Council on June 29, 2004, and later amended on January 29, 2009, operators of “online education schools” must obtain administrative licenses from the government, while no administrative license is required to operate “educational websites.” Accordingly, Xueersi Education and Xueersi Network, our affiliated entities engaging in online education-related services, are not required to obtain approval to operate “educational websites” from the Ministry of Education. In addition, Xueersi Education is not required to obtain a license to operate “online education schools”, as it does not directly offer government accredited degrees or certifications through its online education or training services.
Regulations on Publishing and Distribution of Publications
On December 25, 2001, the State Council promulgated the Administrative Regulations on Publication, or the Publication Regulations, which became effective on February 1, 2002. The Publication Regulations apply to publication activities, i.e., the publishing, printing, copying, importation or distribution of publications, including books, newspapers, periodicals, audio and video products and electronic publications, each of which requires approval from the relevant publication administrative authorities.
On April 13, 2005, the State Council announced a policy on private investments in China relating to cultural matters, which affects private investments in businesses that involve publishing. The policy authorizes the Ministry of Culture and several other central government authorities to adopt detailed rules to implement the policy. In July 2005, the Ministry of Culture, together with other central government authorities, issued a regulation that prohibits private and foreign investors from engaging in the publishing business. Our subsidiaries and affiliated entities are not permitted to engage in the publishing business under this regulation.
Subsequent to the implementation of the Publication Regulations, the General Administration of Press and Publication issued the Administrative Regulations on Publications Market, which became effective on September 1, 2003 and which was amended on June 16, 2004. According to the Administrative Regulations on Publications Market, any organization or individual engaged in general wholesale or retail distribution of publications shall obtain a Permit for Operating Publications Business. Distribution of publications in the PRC is regulated on different administrative levels. An entity engaged in general distribution of publications shall obtain such permit from the General Administration of Press and Publication and may conduct general distribution of the publications in the PRC. An entity engaged in wholesaling of publications shall obtain such permit from the provincial office of the General Administration of Press and Publication and may not engage
105
Table of Contents
in general distribution in the PRC. An entity engaged in retail distribution of publications shall obtain such permit from the local office of the Administration of Press and Publication and may not conduct general distribution or wholesaling of publications in the PRC.
In addition, pursuant to the Administrative Regulations on Publishing Audio-Video Products promulgated by the State Council on December 25, 2001, which became effective as of February 1, 2002, any entity engaged in the wholesale or retail distribution of audio-video products shall secure a Permit for Publishing Audio-Video Products from the relevant culture authorities.
During the term of the above-mentioned permits, the General Administration of Press and Publication or its local bureaus or other competent authorities may conduct annual or spot examinations or inspections to ascertain their compliance with applicable regulations and may require changes in or renewal of such permits.
Xueersi Education and Xueersi Network, our affiliated entities engaging in retailing teaching materials and audio-video products to our students, have obtained the relevant Permits for Operating Publications Business for retail services and the relevant permits for retailing audio-video products.
Regulations on Internet Information Services
Subsequent to the State Council’s promulgation of the Telecom Regulations and the Internet Information Services Administrative Measures on September 25, 2000, or the Internet Information Measures, the Ministry of Information Industry and other regulatory authorities formulated and implemented a number of Internet-related regulations, including but not limited to the Internet Electronic Bulletin Board Service Administrative Measures, or the BBS Measures.
The Internet Information Measures require that commercial Internet content providers, or ICP providers, obtain a license for Internet information services, or ICP license, from the appropriate telecommunications authorities in order to offer any commercial Internet information services in the PRC. ICP providers shall display their ICP license number in a conspicuous location on their home page. In addition, the Internet Information Measures also provide that ICP providers that operate in sensitive and strategic sectors, including news, publishing, education, health care, medicine and medical devices, must obtain additional approvals from the relevant authorities regulating those sectors as well. The BBS Measures provide that any ICP provider engaged in providing online bulletin board services, or BBS, is subject to a special approval and filing requirement with the relevant telecommunications industry authorities.
In July 2006, the Ministry of Information Industry, or MII, posted a notice on its website entitled “Notice on Strengthening Management of Foreign Investment in Operating Value-Added Telecom Services.” The notice prohibits PRC Internet content providers from leasing, transferring or selling their ICP licenses or providing facilities or other resources to any illegal foreign investors. The notice states that PRC Internet content providers should directly own the trademarks and domain names for websites operated by them, as well as servers and other infrastructure used to support these websites. The notice also states that PRC Internet content providers have until November 1, 2006 to evaluate their compliance with the notice and correct any non-compliance. A PRC Internet content provider’s failure to do so by November 1, 2006 may result in revocation of its ICP license.
Xueersi Education and Xueersi Network, engaging in providing Internet information services and providing online bulletin board services, have each obtained an ICP license from the Beijing bureau of MII, and Xueersi Network engaged in providing online BBS has obtained the approval for such services from the Beijing bureau of MII.
Regulations on Broadcasting Audio-Video Programs through The Internet or Other Information Network
The State Administration of Radio, Film and Television, or SARFT, promulgated the Rules for Administration of Broadcasting of Audio-Video Programs through the Internet and Other Information Networks, or the Broadcasting Rules, in 2004, which became effective on October 11, 2004. The Broadcasting Rules apply to the activities of broadcasting, integration, transmission, downloading of audio-video programs
106
Table of Contents
with computers, televisions or mobile phones as main terminals and through various types of information networks. Pursuant to the Broadcasting Rules, a Permit for Broadcasting Audio-Video Programs via Information Network is required for engaging in Internet broadcasting activities. On April 13, 2005, the State Council announced a policy on private investments in businesses in China that relate to cultural matters, which prohibits private investments in businesses relating to the dissemination of audio-video programs through information networks.
On December 20, 2007, SARFT and MII issued the Internet Audio-Video Program Measures, which became effective on January 31, 2008. Among other things, the Internet Audio-Video Program Measures stipulate that no entities or individuals may provide Internet audio-video program services without a License for Disseminating Audio-Video Programs through Information Network issued by SARFT or its local bureaus or completing the relevant registration with SARFT or its local bureaus and only entities wholly owned or controlled by the PRC government may engage in the production, editing, integration or consolidation, and transmission to the public through the Internet, of audio-video programs, and the provision of audio-video program uploading and transmission services. There are significant uncertainties relating to the interpretation and implementation of the Internet Audio-Video Program Measures, in particular, the scope of “Internet Audio-Video Programs.” However, on April 1, 2010, SARFT promulgated the Tentative Categories of Internet Audio-Visual Program Service, or the Categories, which clarified the scope of Internet Audio-Video Programs. According to the Categories, there are four categories of Internet audio-visual program service which in turn are divided into seventeensub-categories. The thirdsub-category of the second category covers the making and broadcasting of certain specialized audio-visual programs concerning art, culture, technology, entertainment, finance, sports, and education.
Our net revenues derived from audio-video program services that may be subject to the Audio-Video Program Measures were less than 1.5% of our total net revenues since we began offering online courses in 2010. In the course of offering online tutoring services, we transmit our audio-video educational courses and programs through the Internet only to enrolled course participants, not to the general public. The limited scope of our audience distinguishes us from general online audio-video broadcasting companies, such as companies operating user-generated content websites. In addition, we do not provide audio-video program uploading and transmission services. As a result, we believe that we are not subject to the Internet Audio-Video Program Measures. However, there is no further official or publicly available interpretation of these definitions, especially the scope of “Internet audio-video program service.” If the governmental authorities determine that our provision of online tutoring services falls within the Internet Audio-Video Program Measures, we may not be able to obtain the License for Disseminating Audio-Video Programs through Information Network. If this occurs, we may become subject to significant penalties, fines, legal sanctions or an order to suspend our use of audio-video content.
Regulations on Protection of the Right of Dissemination through Information Networks
On May 18, 2006, the State Council promulgated the Regulations on Protection of the Right of Dissemination through Information Networks, which became effective on July 1, 2006. The new regulations require that every organization or individual who disseminates a third party’s work, performance, audio or visual recording products to the public through information networks shall obtain permission from, and pay compensation to, the legitimate copyright owner of such products, unless otherwise provided under relevant laws and regulations. The legitimate copyright owner may take technical measures to protect his or her copyright and any organization or individual shall not intentionally jeopardize, destroy or otherwise assist others in jeopardizing such protective measures unless otherwise permitted under law. The new regulations also provide that permission from and compensation to the copyright owner is not required in the case of limited dissemination to teaching or research staff for the purpose of school instruction or scientific research only.
Xueersi Education, Xueersi Network and Haidian School are the operators of our website engaged in the dissemination of educational content through the Internet and have obtained permission from, and paid compensation to, the legitimate copyright owners of such third party content except when the dissemination is limited to teaching or research purposes only.
107
Table of Contents
Regulations on Copyright and Trademark Protection
China has adopted legislation governing intellectual property rights, including copyrights and trademarks. China is a signatory to major international conventions on intellectual property rights and is subject to the Agreement on Trade Related Aspects of Intellectual Property Rights as a result of its accession to the World Trade Organization in December 2001.
Copyright. The National People’s Congress amended the Copyright Law in 2001 to widen the scope of works and rights that are eligible for copyright protection. The amended Copyright Law extends copyright protection to Internet activities, products disseminated over the Internet and software products. In addition, there is a voluntary registration system administered by the China Copyright Protection Center.
To address copyright infringement related to content posted or transmitted over the Internet, the National Copyright Administration and MII jointly promulgated the Administrative Measures for Copyright Protection Related to the Internet on April 30, 2005. These measures became effective on May 30, 2005.
Trademark. The PRC Trademark Law, adopted in 1982 and revised in 2001, protects the proprietary rights to registered trademarks. The Trademark Office under the State Administration for Industry and Commerce handles trademark registrations and may grant a term of ten years for registered trademarks, which may be extended for another ten years upon request. Trademark license agreements must be filed with the Trademark Office for record. In addition, if a registered trademark is recognized as a well-known trademark, the protection of the proprietary right of the trademark holder may reach beyond the specific sector of the relevant products or services. We have registered two trademarks with the Trademark Office and one with the Trade Marks Registry, Intellectual Property Department of the Hong Kong government. We have filed applications for registration of 35 other trademarks and logos with the Trademark Office. We are in the process of registering additional marks and logos.
Domain names. On November 5, 2004, the MII amended the Measures for Administration of Domain Names for the Internet, or the Domain Name Measures. The Domain Name Measures regulate the registration of domain names. In February 2006, China Internet Network Information Center, or CNNIC, issued the Implementing Rules for Domain Name Registration and the Measures on Domain Name Dispute Resolution. We have registered many domain names with CNNIC.
Regulations on Foreign Exchange Registration of Overseas Investment by PRC Residents.
The Notice on Relevant Issues Concerning Foreign Exchange Administration for Domestic Residents to Engage in Overseas Financing and Round Trip Investment via Overseas Special Purpose Vehicles, or Circular 75, issued by the State Administration of Foreign Exchange and effective on November 1, 2005, regulates foreign exchange matters in relation to the use of SPVs, by PRC residents to seek offshore equity financing and conduct “round trip investment” in China. Under Circular 75, a “special purpose vehicle” refers to an offshore entity established or controlled, directly or indirectly, by PRC residents or PRC entities for the purpose of seeking offshore equity financing using assets or interests owned by such PRC residents or PRC entities in onshore companies, while “round trip investment” refers to the direct investment in China by PRC residents through SPVs, including, without limitation, establishing foreign-invested enterprises and using such foreign-invested enterprises to purchase or control onshore assets through contractual arrangements. Circular 75 requires that, before establishing or controlling an SPV, PRC residents and PRC entities are required to complete foreign exchange registration with the local bureaus of the State Administration of Foreign Exchange for their overseas investments.
Circular 75 applies retroactively. PRC residents who have established or acquired control of SPVs that have completed “round-trip investments” before the implementation of the Circular 75 shall register their ownership interests or control in such SPVs with the local bureaus of the State Administration of Foreign Exchange before March 31, 2006. An amendment to the registration is required if there is a material change in the SPV registered, such as increase or reduction of share capital or transfer of shares. Failure to comply with the registration procedures set forth in Circular 75 may result in restrictions on the foreign exchange activities of the relevant foreign-invested enterprises, including payment of dividends and other distributions, such as
108
Table of Contents
proceeds from any reduction in capital, share transfer or liquidation, to its offshore parent or affiliate, and the capital inflow from the offshore parent, and may also subject relevant PRC residents to penalties under PRC foreign exchange administration regulations.
We believe that all of our shareholders who are PRC citizens or residents have completed their required registrations with SAFE, or are otherwise in the process of registering with SAFE.
Regulations on Loans to and Direct Investment in the PRC Entities by Offshore Holding Companies
According to the Implementation Rules for the Provisional Regulations on Statistics and Supervision of Foreign Debt promulgated by SAFE on September 24, 1997 and the Interim Provisions on the Management of Foreign Debts, or the Provisions, promulgated by SAFE, the National Development and Reform Commission and the Ministry of Finance, which was effective from March 1, 2003, loans by foreign companies to their subsidiaries in China, which are foreign-invested enterprises, are considered foreign debt, and such loans must be registered with the local bureaus of SAFE. Under the Provisions, these foreign-invested enterprises must submit registration applications to the local bureaus of SAFE within 15 days following execution of foreign loan agreements, and the registration should be completed within 20 business days from the date of receipt of the application. In addition, the total amount of accumulated medium-term and long-term foreign debt and the balance of short-term debt borrowed by a foreign-invested enterprise is limited to the difference between the total investment and the registered capital of the foreign-invested enterprise. Total investment of a foreign-invested enterprise is the total amount of capital that can be used for the operation of the foreign-invested enterprise, as approved by the Ministry of Commerce or its local bureau, and may be increased or decreased upon approval by the Ministry of Commerce or its local bureau. Registered capital of a foreign-invested enterprise is the total amount of capital contributions to the foreign-invested enterprise by its foreign holding company or owners, as approved by the Ministry of Commerce or its local bureau and registered at the State Administration for Industry and Commerce or its local bureau.
According to applicable PRC regulations on foreign-invested enterprises, capital contributions from a foreign holding company to its PRC subsidiaries, which are considered foreign-invested enterprises, may only be made when approval by the Ministry of Commerce or its local bureau has been obtained. In approving such capital contributions, the Ministry of Commerce or its local bureau examines the business scope of each foreign invested enterprise under review to ensure it complies with the Foreign-Investment Industrial Guidance Catalog, which classifies industries in China into three categories, namely “encouraged foreign investment industries,” “restricted foreign investment industries” and “prohibited foreign investment industries.”
Each of our PRC subsidiaries is a foreign-invested enterprise, is not engaged in any prohibited or restricted businesses listed in the Foreign-Investment Industrial Guidance Catalog and has not incurred any foreign debt.
Regulations on Employee Share Incentive Awards Granted by Listed Companies
The Operating Procedures for Administration of PRC Individuals Participating in the Employee Share Ownership Plan of Offshore Listed Companies, or Circular 78, regulate the foreign exchange matters associated with employee stock ownership plans granted to PRC residents by companies whose shares are listed on overseas stock exchanges. PRC individuals who are granted share incentive awards by companies listed on overseas stock exchanges based on an employee stock ownership plan are required to register with SAFE or its local bureaus. Pursuant to Circular 78, PRC individuals participating in the employee stock ownership plans of the foreign-listed companies shall entrust their employers, including foreign-listed companies and their subsidiaries or branch offices, or engage PRC agents, to handle various foreign exchange matters associated with their employee stock ownership plans. The PRC agents or the employers shall, on behalf of the PRC individuals who have the right to exercise the employee share options, apply annually to SAFE or its local bureaus for a quota for conversionand/or payment of foreign currencies in connection with the PRC individuals’ exercise of the employee share options if necessary. The foreign exchange proceeds received by the PRC individuals from the sale of shares under the stock ownership plans granted by the
109
Table of Contents
foreign-listed companies must be remitted to bank accounts in China opened by their employers or PRC agents.
Further, a notice concerning individual income tax on earnings from employee share incentive awards, jointly issued by the Ministry of Finance and the State Administration of Taxation, provides that companies that implement employee stock ownership programs shall file the employee stock ownership plans and other relevant documents with the local tax authorities having jurisdiction over such companies before implementing such plans, and shall file share option exercise notices and other relevant documents with local tax authorities before exercise by their employees of any share options, and clarify whether the shares issuable under the employee share options referenced in the notice are shares of publicly listed companies.
Following the completion of this offering, we intend to file registration with the local SAFE bureau for our employees who are PRC nationals and have been granted shares or share options under our share incentive plan and follow other procedures set forth in Circular 78 and other applicable regulations. These registrations and filings are a matter of foreign exchange control and tax procedure and the grant of share incentive awards to employees is not subject to the government’s discretionary approval. We do not believe that compliance with PRC regulations on employee incentive plans will have any material adverse effect on the implementation of our share incentive plan.
M&A Regulations and Overseas Listings
On August 8, 2006, six PRC regulatory agencies, namely, the Ministry of Commerce, the State Assets Supervision and Administration Commission, the State Administration for Taxation, the State Administration for Industry and Commerce, the CSRC, and SAFE, jointly adopted the M&A Rule which became effective on September 8, 2006. This M&A Rule purports to require, among other things, offshore special purpose vehicles, or SPVs, formed for the purpose of acquiring PRC domestic companies and controlled by PRC companies or individuals, to obtain the approval of the CSRC prior to publicly listing their securities on an overseas stock exchange. While the application of the M&A Rule remains unclear, we believe, based on the advice of our PRC counsel, Tian Yuan Law Firm, that CSRC approval is not required in the context of this offering as we are not a special purpose vehicle formed for the purpose of acquiring domestic companies that are controlled by our PRC individual shareholders, as we acquired contractual control rather than equity interests in our domestic affiliated entities. However, we cannot assure you that the relevant PRC government agency, including the CSRC, would reach the same conclusion as our PRC counsel. If the CSRC or other PRC regulatory agency subsequently determines that we need to obtain the CSRC’s approval for this offering or if CSRC or any other PRC government authorities will promulgate any interpretation or implementing rules before our listing that would require CSRC or other governmental approvals for this offering, we may face sanctions by the CSRC or other PRC regulatory agencies. In such event, these regulatory agencies may impose fines and penalties on our operations in the PRC, limit our operating privileges in the PRC, delay or restrict the repatriation of the proceeds from this offering into the PRC, or take other actions that could have a material adverse effect on our business, financial condition, results of operations, and prospects, as well as the trading price of our ADSs. The CSRC or other PRC regulatory agencies may also take actions requiring us to halt this offering before settlement and delivery of the ADSs offered by this prospectus.
Regulations on Foreign Currency Exchange
Pursuant to applicable PRC regulations on foreign currency exchange, the Renminbi is freely convertible to foreign currencies for current account items only, such as trade-related receipts and payments, interest and dividends. Conversion of Renminbi to foreign exchange for capital account items, such as direct equity investments, loans and repatriation of investments, require the prior approval of SAFE or its local bureaus. Payments for transactions that take place within the PRC must be made in Renminbi. Domestic companies or individuals can repatriate payments received from abroad in foreign currencies or deposit those payments abroad subject to the requirement that such payments be repatriated within a certain period of time. Foreign-invested enterprises may retain foreign exchange in accounts with designated foreign exchange banks. Foreign exchange on the current account can be either retained or sold to financial institutions that have foreign exchange settlement or sales business without prior approval from the SAFE, subject to certain regulations.
110
Table of Contents
Foreign exchange on the capital account can be retained or sold to financial institutions that have foreign exchange settlement and sales business with prior approval of SAFE, unless otherwise provided.
In utilizing the proceeds we receive from this offering in the manner described in “Use of Proceeds,” as an offshore holding company with PRC subsidiaries, we may (i) make additional capital contributions to our PRC subsidiaries, (ii) establish new PRC subsidiaries and make capital contributions to these new PRC subsidiaries, (iii) make loans to our PRC subsidiaries or our affiliated entities, or (iv) acquire offshore entities with business operations in China in an offshore transaction. However, most of these uses are subject to PRC regulations and approvals. For example:
| • | capital contributions to our subsidiaries in China, whether existing ones or newly established ones, must be approved by the PRC Ministry of Commerce or its local bureaus; | |
| • | loans by us to our subsidiaries in China, each of which is a foreign-invested enterprise, to finance their activities cannot exceed statutory limits and must be registered with the PRC State Administration of Foreign Exchange, or SAFE, or its local bureaus; and | |
| • | loans by us to our affiliated entities, which are domestic PRC entities, must be approved by the National Development and Reform Commission and must also be registered with SAFE or its local bureaus. |
In addition, on August 29, 2008, SAFE promulgated Circular 142, a notice regulating the conversion by a foreign-invested company of its capital contribution in foreign currency into Renminbi. Circular 142 restricts the use of Renminbi funds converted from foreign exchange. It requires that Renminbi converted from foreign currency-denominated capital of a foreign-invested enterprise may only be used for purposes within the business scope approved by the relevant government authority and may not be used to make equity investments in PRC, unless specifically provided otherwise. Moreover, the approved use of such Renminbi funds may not be changed without approval from SAFE. Renminbi funds converted from foreign exchange may not be used to repay loans in Renminbi if the proceeds of such loans have not yet been used. Any violation of Circular 142 may result in severe penalties, including substantial fines. We expect that if we convert the offering proceeds into Renminbi pursuant to Circular 142, the use of Renminbi funds will be for purposes within the business scope of the PRC subsidiaries as approved by the local bureau of Administration for Industry and Commerce. However, we may not be able to use such Renminbi funds to make equity investments in the PRC through our PRC subsidiaries. While we may not transfer the proceeds from this offering through our wholly owned subsidiaries for the purpose of domestic acquisitions, we may use the proceeds to acquire offshore entities with business operations in China. We may also use our cash flow from operations to fund our acquisitions as necessary.
We expect that the PRC regulations of loans and direct investment by offshore holding companies to PRC entities may continue to limit our use of proceeds of this offering. There are no costs associated with registering loans or capital contributions with relevant PRC authorities, other than nominal processing charges. Under PRC laws and regulations, the PRC government authorities are required to process such approvals or registrations or deny our application within a maximum of 90 days. The actual time taken, however, may be longer due to administrative delay. We cannot assure you that we will be able to obtain these government registrations or approvals on a timely basis, if at all, with respect to our future plans to use the U.S. dollar proceeds we receive from this offering for our expansion and operations in China. If we fail to receive such registrations or approvals, our ability to use the proceeds of this offering and to capitalize our PRC operations may be negatively affected, which could materially and adversely affect our liquidity and ability to fund and expand our business.
Regulations on Dividend Distribution
Under applicable PRC laws and regulations, foreign-invested enterprises in China may pay dividends only out of their accumulated profits, if any, determined in accordance with PRC accounting standards and regulations. In addition, foreign-invested enterprises in China are required to allocate at least 10% of their accumulated profits each year, if any, to fund statutory reserves of up to 50% of the registered capital of the
111
Table of Contents
enterprise. Statutory reserves are not distributable as cash dividends. Each of wholly owned subsidiaries in China must comply with the foregoing regulations.
Under PRC law, each of our subsidiaries, VIEs and VIE’s subsidiaries in China are required to set aside at least 10% of its after-tax profits each year, if any, to fund a statutory reserve until such reserve reaches 50% of its registered capital. Although the statutory reserves can be used, among other ways, to increase the registered capital and eliminate future losses in excess of retained earnings of the respective companies, the reserve funds are not distributable as cash dividends except in the event of liquidation. As a result of these PRC laws and regulations, as of August 31, 2010, we had $4.9 million in statutory reserves, or 15.0% of total equity, that are not distributable as cash dividends. Our PRC subsidiaries have not historically paid any dividends to our offshore entities from their accumulated profits. However, we do not expect that the statutory reserve requirement will materially limit our ability to pay dividends to our shareholders or our plan to expand our business because we are to date only required to set aside an additional $2.9 million to satisfy the maximum requirement of statutory reserves for all of our PRC subsidiaries, VIEs and VIEs’ subsidiaries.
112
Table of Contents
MANAGEMENT
Directors and Executive Officers
The following table sets forth information regarding our directors and executive officers as of the date of this prospectus.
Directors and Executive Officers | Age | Position/Title | ||||
| Bangxin Zhang | 30 | Chairman of the Board of Directors and Chief Executive Officer | ||||
| Yundong Cao | 30 | Director and President | ||||
| Jane Jie Sun | 42 | Independent Director | ||||
| Wai Chau Lin | 45 | Independent Director | ||||
| Yachao Liu | 28 | Vice President | ||||
| Yunfeng Bai | 29 | Vice President | ||||
| Joseph Kauffman | 33 | Chief Financial Officer | ||||
Bangxin Zhangis one of our founders and has served as our chairman and chief executive officer since our inception. Mr. Zhang has been instrumental to the development and success of our business. Mr. Zhang provides vision, overall management, and strategic decision-making relating to marketing, investment planning, and corporate development. Mr. Zhang received his bachelor’s degree in Life Sciences from Sichuan University in 2001, was in the postgraduate program of the Life Science School of Peking University from 2002 to 2007, and received an EMBA degree from China Europe International Business School in 2009.
Yundong Caois one of our founders and has served as our director and president since our inception. Mr. Cao has been instrumental to the development and success of our business. Mr. Cao is also a vice chairman of the China Association of Private Education. Mr. Cao was named anInfluential Person in Chinese Educationby Beijing Evening News in 2010, and received anOutstanding Principals in After-school Basic Education Sectoraward from the China Association of Private Education in 2009. Mr. Cao received his bachelor’s degree in Biology from Yantai University in 2002, his master’s degree from Peking University in 2007 and his EMBA degree from Cheung Kong Graduate School of Business in 2010.
Jane Jie Sunhas served as our independent director since October 2010. Ms. Sun has extensive experience in SEC reporting, finance and accounting. She has served as the chief financial officer of Ctrip.com International, Ltd, a NASDAQ-listed company, since December 2005. Prior to joining Ctrip, Ms. Sun served as the head of the SEC and External Reporting Division of Applied Materials, Inc., where she worked from 1997 to 2005. Prior to joining Applied Materials, Inc., Ms. Sun worked with KPMG LLP in Silicon Valley, California for five years. Ms. Sun is a member of the American Institute of Certified Public Accountants and a member of the State of California Certified Public Accountants. Ms. Sun received her bachelor’s degree from the Business School of the University of Florida with High Honors. She also attended the undergraduate program at Beijing University Law School from 1987 to 1989.
Wai Chau Linhas served as our independent director since October 2010. Mr. Lin is a founder of Longtop Financial Technologies Limited, or Longtop, an NYSE-listed company, and has served as its director and chief executive officer since its inception in June 1996. He has over 21 years of experience in China’s IT industry. Prior to founding Longtop, Mr. Lin held various positions, including technology department manager, sales department manager, vice general manager and general manager, at Xiamen Xindeco Computer Company from 1985 to 1996. Mr. Lin has also won several industry awards, including Fujian Outstanding Young Entrepreneur Award, Xiamen Outstanding Young Entrepreneur Award and Fujian Software Talent Award. He served as the vice president of Xiamen Youth Chamber of Commerce and is currently a representative on the People’s Congress for the Siming District of Xiamen City. He was a visiting professor at the Software School of Xiamen University. Mr. Lin received his bachelor’s degree in Computer Science from Fudan University.
Yachao Liuhas served as our vice president since January 2008. In this capacity, he is in charge of our online course offerings. Dr. Liu was director of our middle school division between September 2005 and
113
Table of Contents
January 2008. Dr. Liu received his bachelor’s degree in Mechanics from Peking University in 2003 and Ph.D. from the Institute of Mechanics of the Chinese Academy of Science in 2008.
Yunfeng Baihas served as our vice president since June 2008. In this capacity, he oversees our personalized premium services. Mr. Bai founded our high school division in 2005 and was the director of our Beijing operations from June 2006 through May 2008. Mr. Bai received his bachelor’s degree in Engineering Automation from Beijing University of Aeronautics and Astronautics in 2003, attended the CEO class of Guanghua Management School of Peking University between 2008 and 2009 and is currently in the EMBA program of China Europe International Business School.
Joseph Kauffmanhas served as our Chief Financial Officer since June 2010. Prior to joining us, Mr. Kauffman headed M&A and international business development at New Oriental Education & Technology Group Inc., where he joined the senior management team before its initial public offering on the New York Stock Exchange in 2006. Between 1999 and 2004, Mr. Kauffman was a senior manager at TheCoca-Cola Company in China and held various operating, strategy and business development roles. Mr. Kauffman received his bachelor’s degree from Williams College in 1999 and an MBA degree from the Harvard Business School in 2006.
Board of Directors
Our board of directors consists of four directors. A director is not required to hold any shares in our company by way of qualification. A director may vote with respect to any contract or transaction in which he or she is materially interested provided the nature of the interest is disclosed prior to its consideration. Subject to our post-offering memorandum and articles of association, the directors may exercise all the powers of our company to borrow money, mortgage his or her undertaking, property and uncalled capital, and issue debentures or other securities whether outright or as security for any debt, liability or obligation of our company or of any third party. We intend to have a majority of independent directors serving on our board of directors within one year of this offering.
Committees of the Board of Directors
We have established three committees under the board of director, namely the audit committee, the compensation committee and the nominating and corporate governance committee. We have adopted a charter for each of the three committees. Each committee’s members and functions are described below.
Audit Committee. Our audit committee consists of Ms. Jane Jie Sun, Mr. Yundong Cao and Mr. Wai Chau Lin. Ms. Sun and Mr. Lin satisfy the “independence” requirements of Section 303A of the Corporate Governance Rules of the New York Stock Exchange andRule 10A-3 under the Exchange Act. In addition, Ms. Sun and Mr. Lin meet the “independence” standards underRule 10A-3 under the Exchange Act. Ms. Sun is the chair of our audit committee. The purpose of the audit committee is to assist our board of directors with its oversight responsibilities regarding: (i) the integrity of our financial statements, (ii) our compliance with legal and regulatory requirements, (iii) the independent auditor’s qualifications and independence and (iv) the performance of our internal audit function and independent auditor. The audit committee will be responsible for, among other things:
| • | appointing the independent auditors and pre-approving all auditing and non-auditing services permitted to be performed by the independent auditors; | |
| • | reviewing with the independent auditors any audit problems or difficulties and management’s response; | |
| • | discussing the annual audited financial statements with management and the independent auditors; | |
| • | reviewing the adequacy and effectiveness of our accounting and internal control policies and procedures and any steps taken to monitor and control major financial risk exposures; | |
| • | reviewing and approving all proposed related party transactions; |
114
Table of Contents
| • | meeting separately and periodically with management and the independent auditors; and | |
| • | monitoring compliance with our code of business conduct and ethics, including reviewing the adequacy and effectiveness of our procedures to ensure proper compliance. |
Compensation Committee. Our compensation committee consists of Mr. Bangxin Zhang, Mr. Wai Chau Lin and Ms. Jane Jie Sun. Mr. Lin and Ms. Sun satisfy the “independence” requirements of Section 303A of the Corporate Governance Rules of the New York Stock Exchange. Mr. Bangxin Zhang is the chair of our compensation committee. The compensation committee assists the board in reviewing and approving the compensation structure, including all forms of compensation, relating to our directors and executive officers. Our Chief Executive Officer may not be present at any committee meeting during which his compensation is deliberated. The compensation committee is responsible for, among other things:
| • | reviewing and approving, or recommending to the board for its approval, the compensation for our chief executive officer and other executive officers; | |
| • | reviewing and recommending to the board for determination with respect to the compensation of our non-employee directors; and | |
| • | reviewing periodically and approving any incentive compensation or equity plans, programs or similar arrangements. |
Nominating and Corporate Governance Committee. Our nominating and corporate governance committee consists of Mr. Bangxin Zhang, Mr. Wai Chau Lin and Ms. Jane Jie Sun. Mr. Lin and Ms. Sun satisfy the “independence” requirements of Section 303A of the Corporate Governance Rules of the New York Stock Exchange. Mr. Bangxin Zhang is the chair of our nominating and corporate governance committee. The nominating and corporate governance committee assists the board of directors in selecting individuals qualified to become our directors and in determining the composition of the board and its committees. The nominating and corporate governance committee is responsible for, among other things:
| • | selecting and recommending to the board nominees for election by the shareholders or appointment by the board; | |
| • | reviewing annually with the board the current composition of the board with regards to characteristics such as independence, knowledge, skills, experience and diversity; | |
| • | making recommendations on the frequency and structure of board meetings and monitoring the functioning of the committees of the board; and | |
| • | advising the board periodically with regards to significant developments in the law and practice of corporate governance as well as our compliance with applicable laws and regulations, and making recommendations to the board on all matters of corporate governance and on any remedial action to be taken. |
Duties of Directors
Under Cayman Islands law, our directors have a duty of loyalty to act honestly in good faith with a view to our best interests. Our directors also have a duty to exercise the skill they actually possess and such care and diligence that a reasonably prudent person would exercise in comparable circumstances. In fulfilling their duty of care to us, our directors must ensure compliance with our memorandum and articles of association. Our company has the right to seek damages if a duty owed by our directors is breached.
Terms of Directors and Officers
Our officers are elected by and serve at the discretion of the board of directors. Our directors are not subject to a term of office and hold office until such time as they are removed from office by special resolution or the unanimous written resolution of all shareholders. A director will be removed from office automatically if, among other things, the director (i) becomes bankrupt or makes any arrangement or composition with his creditors; or (ii) dies or is found by our company to be or becomes of unsound mind.
115
Table of Contents
Employment Agreements
We have entered into employment agreements with each of our executive officers. Under these agreements, each of our senior executive officers is employed for a specified time period. We may terminate employment for cause, at any time, without advance notice or remuneration, for certain acts of the executive officer, such as conviction or plea of guilty to a felony or any crime involving moral turpitude, negligent or dishonest acts to our detriment, or misconduct or a failure to perform agreed duties. In such case, the executive officer will not be entitled to receive payment of any severance benefits or other amounts by reason of the termination, and the executive officer’s right to all other benefits will terminate, except as required by any applicable law. We may also terminate an executive officer’s employment without cause upon one-month advance written notice. In such case of termination by us, we are required to provide compensation to the executive officer, including severance pay, as expressly required by the applicable law of the jurisdiction where the executive officer is based. The executive officer may terminate the employment at any time with a one-month advance written notice, if there is any significant change in the executive officer’s duties and responsibilities inconsistent in any material and adverse respect with his or her title and position or a material reduction in the executive officer’s annual salary before the next annual salary review, or if otherwise approved by the board of directors.
Each executive officer has agreed to hold, both during and after the termination or expiry of his or her employment agreement, in strict confidence and not to use, except as required in the performance of his or her duties in connection with the employment, any of our confidential information or trade secrets, any confidential information or trade secretes of our clients or prospective clients, or the confidential or proprietary information of any third party received by us and for which we have confidential obligations. The executive officers have also agreed to disclose in confidence to us all inventions, designs and trade secrets which they conceive, develop or reduce to practice and to assign all right, title and interest in them to us, and assist us in obtaining patents, copyrights and other legal rights for these inventions, designs and trade secrets.
In addition, each executive officer has agreed to be bound by non-competition and non-solicitation restrictions during the term of his or her employment and for one year following the last date of employment. Specifically, each executive officer has agreed not to (i) approach our clients, customers or contacts or other persons or entities introduced to the executive officer for the purpose of doing business with such persons or entities that will harm our business relationships with these persons or entities; (ii) assume employment with or provide services to any of our competitors, or engage, whether as principal, partner, licensor or otherwise, any of our competitors; or (iii) seek directly or indirectly, to solicit the services of any of our employees who is employed by us on or after the date of the executive officer’s termination, or in the year preceding such termination.
Compensation of Directors and Executive Officers
For the fiscal year ended February 28, 2010, the aggregate compensation we paid to our executive officers was approximately $0.5 million. Such amounts included the amounts we paid for pension, retirement or similar benefits for our executive officers in compliance with requirements under the PRC laws. No other pension, retirement or similar benefits has been set aside or accrued for our executive officers or directors. None of our non-executive directors has a service contract with us that provides for benefits upon termination of services. We do not pay our non-executive directors for their services on our board.
Share Incentive Plan
In June 2010, we adopted our 2010 Share Incentive Plan in order to attract and retain the best available personnel, provide additional incentives to employees, directors and consultants and promote the success of our business. The plans permit the grant of options to purchase our Class A common shares, share appreciation rights, restricted shares, restricted share units, dividend equivalent rights and other instruments as deemed appropriate by the administrator under the plans. The maximum aggregate number of Class A common shares that may be issued pursuant to all awards under our share incentive plan is 18,750,000 shares.
116
Table of Contents
As of the date of this prospectus, we have granted 5,419,500 restricted Class A common shares under this plan to our employees.
The following table summarizes, as of the date of this prospectus, the restricted shares granted under our share incentive plan to our directors and executive officers and to other individuals as a group.
| Number of | ||||||||
| Class A | Vesting | |||||||
| Restricted | Date of | Commencement | Vesting | |||||
| Name | Shares | Grant | Date | Schedule | ||||
| Yachao Liu | * | July 26, 2010 | July 26, 2010 | 4 years | ||||
| Yunfeng Bai | * | July 26, 2010 | July 26, 2010 | 4 years | ||||
| Joseph Kauffman | * | July 26, 2010 | July 26, 2010 | 4 years | ||||
| Directors and officers as a group | 2,125,000 | — | July 26, 2010 | 4 years | ||||
| Other individuals as a group | 3,294,500 | — | July 26, 2010 | 1 to 4 years | ||||
| Total | 5,419,500 | — | July 26, 2010 | — |
| * | Less than 1% of the outstanding common shares. |
The following paragraphs describe the principal terms of our share incentive plan:
Plan Administration. The plan will be administered by a committee of one or more directors to whom the board shall delegate the authority to grant or amend awards to participants other than any of the committee members. The committee will determine the provisions and terms and conditions of each award grant.
Awards and Award Agreement. Pursuant to our 2001 Share Incentive Plan, we may grant options, restricted shares or restricted share units to our directors, employees or consultants. Awards granted under our plan are evidenced by award agreements that set forth the terms, conditions and limitations for each award, which may include the term of an award, the provisions applicable in the event the participant’s employment or service terminates, and our authority to unilaterally or bilaterally amend, modify, suspend, cancel or rescind an award.
Option Exercise Price. The exercise price of an option shall be determined by the plan administrator and set forth in the award agreement and may be a fixed or variable price related to the fair market value of the shares, to the extent not prohibited by applicable laws. Subject to certain limits set forth in the plan, the exercise price may be amended or adjusted in the absolute discretion of the plan administrator, the determination of which shall be final, binding and conclusive. To the extent not prohibited by applicable laws or any exchange rule, a downward adjustment of the exercise prices of options shall be effective without the approval of the shareholders or the approval of the affected participants.
Eligibility. We may grant awards to our employees, directors and consultants or those of any of our related entities, which include our subsidiaries or any entities in which we hold a substantial ownership interest, as determined by our plan administrator. Awards other than incentive share options may be granted to our employees, directors and consultants. Incentive Share Options may be granted only to employees of our company or a parent or a subsidiary of our company.
Term of the Awards. The term of each award grant shall be determined by our plan administrator, provided that the term shall not exceed 10 years from the date of the grant.
Vesting Schedule. In general, the plan administrator determines, or the award agreement specifies, the vesting schedule. Restricted Share granted under our 2010 Share Incentive Plan have either a four-year, a two-year or a one-year vesting schedule. We have the right to repurchase the restricted shares until vested.
Transfer Restrictions. Except as otherwise provided by our plan administrator, an award may not be transferred or otherwise disposed of by a participant other than by will or the laws of descent and distribution. Our plan administrator by express provision in the award or an amendment may permit an
117
Table of Contents
award (other than an incentive share option) to be transferred to or exercised by certain persons related to the participant.
Corporate Transactions. Except as may provided otherwise in an individual award agreement or any other written agreement entered into by a participant and us, in the event of achange-of-control or other corporate transactions, our plan administrator may determine to provide for one or more of the following: (i) each award outstanding under the plan to terminate at a specific time in the future and give each participant the right to exercise the vested portion of the awards during a period of time as determined by our plan administrator; or (ii) termination of any award in exchange for an amount of cash equal to the amount that could have been attained upon the exercise of the award; or (iii) the replacement of such award with other rights or property selected by our plan administrator; or (iv) the assumption of or substitution of such award by our successor, parent or subsidiary, with appropriate adjustments; or (v) payment of an award in cash based on the value of shares on the date of the corporate transaction plus reasonable interest on the award.
Amendment and Termination of the Plan. With the approval of our board, our plan administrator may, at any time and from time to time, amend, modify or terminate the plan, provided, however, that no such amendment shall be made without the approval of the our shareholders to the extent such approval is required by applicable laws, or in the event that such amendment increases the number of shares available under our plan, permits our plan administrator to extend the term of our plan or the exercise period for an option beyond ten years from the date of grant, or results in a material increase in benefits or a change in eligibility requirements, unless we decides to follow home country practice.
118
Table of Contents
PRINCIPAL SHAREHOLDERS
The following table sets forth information with respect to the beneficial ownership of our common shares as of the date of this prospectus by:
| • | each of our directors and executive officers; and | |
| • | each person known to us to own beneficially more than 5% of our common shares. |
Beneficial ownership is determined in accordance with the rules and regulations of the SEC. In computing the number of shares beneficially owned by a person and the percentage ownership of that person, we have included shares that the person has the right to acquire within 60 days, including through the exercise of any option, warrant or other right or the conversion of any other security. These shares, however, are not included in the computation of the percentage ownership of any other person.
| Shares Beneficially | ||||||||||||||||||||
| Shares Beneficially | Owned after This Offering | |||||||||||||||||||
| Owned Prior to This Offering | % of Voting | |||||||||||||||||||
| Number | %(1) | Number | %(2) | Power(3) | ||||||||||||||||
Directors and Executive Officers: | ||||||||||||||||||||
Bangxin Zhang(4) | 59,550,000 | 47.6 | % | 59,550,000 | 40.0 | % | 46.7 | % | ||||||||||||
Yundong Cao(5) | 20,300,000 | 16.2 | % | 20,300,000 | 13.6 | % | 15.9 | % | ||||||||||||
| Jane Jie Sun | — | — | — | — | — | |||||||||||||||
| Wai Chau Lin | — | — | — | — | — | |||||||||||||||
Yachao Liu(6) | 8,812,500 | 7.1 | % | 8,812,500 | 5.9 | % | 6.9 | % | ||||||||||||
Yunfeng Bai(7) | 6,337,500 | 5.1 | % | 6,337,500 | 4.3 | % | 5.0 | % | ||||||||||||
| Joseph Kauffman | — | — | — | — | — | |||||||||||||||
| All directors and executive officers as a group | 95,000,000 | 76.0 | % | 95,000,000 | 63.8 | % | 74.6 | % | ||||||||||||
Principal Shareholders: | ||||||||||||||||||||
Bright Unison Limited(8) | 59,550,000 | 47.6 | % | 59,550,000 | 40.0 | % | 46.7 | % | ||||||||||||
Tiger Global Five China Holdings(9) | 21,875,000 | 17.5 | % | 23,475,000 | 15.8 | % | 17.3 | % | ||||||||||||
Central Glory Investments Limited(10) | 14,550,000 | 11.6 | % | 14,550,000 | 9.8 | % | 11.4 | % | ||||||||||||
KTB China Optimum Fund and affiliate fund(11) | 8,125,000 | 6.5 | % | 8,285,000 | 5.6 | % | 6.4 | % | ||||||||||||
Perfect Wisdom International Limited(12) | 8,812,500 | 7.1 | % | 8,812,500 | 5.9 | % | 6.9 | % | ||||||||||||
Excellent New Limited(13) | 6,337,500 | 5.1 | % | 6,337,500 | 4.3 | % | 5.0 | % | ||||||||||||
| (1) | For each person and group included in this column, percentage ownership is calculated by dividing the number of shares beneficially owned by such person or group by 125,000,000, being the sum of the total number of common shares outstanding as of the date of the prospectus and the number of common shares issuable upon conversion of all outstanding series A preferred shares at the conversion rate of one preferred share to one Class B common share. | |
| (2) | For each person and group included in this column, percentage ownership is calculated by dividing the number of shares beneficially owned by such person or group by 149,000,000, being the total number of common shares outstanding immediately after the closing of this offering, assuming that the underwriters do not exercise their over-allotment option. | |
| (3) | Percentage of total voting power represents voting power with respect to all of our Class A and Class B common shares, as a single class. Each holder of our Class B common shares is entitled to ten votes per Class B common share and each holder of Class A common shares is entitled to one vote per Class A common share held by our shareholders on all matters submitted to them for a vote. Our Class A common shares and Class B common shares vote together as a single class on all matters submitted to a vote of our shareholders, except as may otherwise be required by law. Our Class B common shares are convertible at any time by the holder into Class A common shares on a 1:1 basis. | |
| (4) | Consists of 59,550,000 Class B common shares held by Bright Unison Limited, a British Virgin Islands company. Bangxin Zhang is the sole shareholder and the sole director of Bright Unison Limited. Bangxin Zhang’s business address isc/o 18/F, Hesheng Building, 32 Zhongguancun Avenue, Haidian District, Beijing 100080, People’s Republic of China. | |
| (5) | Consists of (i) 14,550,000 Class B common shares held by Central Glory Investments Limited, a British Virgin Islands company, to which Yundong Cao is the sole shareholder and the sole director and (ii) 5,750,000 Class B common shares held by Passion Prance Limited, a British Virgin Islands company, to which Yundong Cao’s spouse is the sole shareholder and the sole director. Mr. Cao |
119
Table of Contents
| disclaims beneficiary ownership of the shares held by Passion Prance Limited. Yundong Cao’s business address isc/o 18/F, Hesheng Building, 32 Zhongguancun Avenue, Haidian District, Beijing 100080, People’s Republic of China. | ||
| (6) | Consists of 8,812,500 Class B common shares held by Perfect Wisdom International Limited, a British Virgin Islands company. Yachao Liu is the sole shareholder and the sole director of Perfect Wisdom International Limited. Yachao Liu’s business address isc/o 18/F, Hesheng Building, 32 Zhongguancun Avenue, Haidian District, Beijing 100080, People’s Republic of China. | |
| (7) | Consists of 6,337,500 Class B common shares held by Excellent New Limited, a British Virgin Islands company. Yunfeng Bai is the sole shareholder and the sole director of Excellent New Limited. Yunfeng Bai’s business address isc/o 18/F, Hesheng Building, 32 Zhongguancun Avenue, Haidian District, Beijing 100080, People’s Republic of China. | |
| (8) | Bright Unison Limited is a company incorporated in the British Virgin Islands. Bangxin Zhang is the sole shareholder and the sole director of Bright Unison Limited. Its registered office is at P.O. Box 957, Offshore Incorporations Centre, Road Town, Tortola, British Virgin Islands. | |
| (9) | Prior to this offering, shares held by Tiger Global Five China Holdings, a company organized under the laws of Mauritius, consist of 21,875,000 Class B common shares. In this offering, Tiger Global Management, LLC, an affiliate of Tiger Global Five China Holdings, will purchase 800,000 ADSs, representing 1,600,000 Class A common shares. Tiger Global Five China Holdings is a company organized under the laws of Mauritius and controlled by Tiger Global Five Parent Holdings, which is in turn controlled by Tiger Global Private Investment Partners V, L.P., or PIP V. PIP V is controlled by its general partner Tiger Global PIP Performance V, L.P., which is controlled by its general partner Tiger Global PIP Management V, Ltd., which is in turn controlled by Charles P. Coleman III. The registered office of Tiger Global Five China Holdings is Twenty Seven, Cybercity, Ebene, Mauritius. | |
| (10) | Central Glory Investments Limited is a company incorporated in the British Virgin Islands. Yundong Cao is the sole shareholder and the sole director of Central Glory Investments Limited. Its registered office is at P.O. Box 957, Offshore Incorporations Centre, Road Town, Tortola, British Virgin Islands. | |
| (11) | Prior to this offering, shares held by KTB China Optimum Fund consist of (i) 3,125,000 Class B common shares and (ii) 5,000,000 Class B common shares issuable upon the conversion of the Series A preferred shares held by KTB China Optimum Fund. In this offering, KTB China Optimum Fund will purchase 80,000 ADSs, representing 160,000 Class A common shares. KTB China Optimum Fund was formed in Korea, and its general partner is KTB Capital Co., Ltd. KTB Capital Co., Ltd., which is a wholly owned subsidiary of KTB Securities Co., Ltd., a listed company on Korea Stock Exchange, has the discretionary authority to vote and dispose of the shares held by KTB China Optimum Fund. KTB China Optimum Fund’s registered office is at KTB network building826-14 Yeoksam-dong Gangnam-gu, Seoul, Korea. | |
| (12) | Perfect Wisdom International Limited is a company incorporated in the British Virgin Islands. Yachao Liu is the sole shareholder and the sole director of Perfect Wisdom International Limited. Its registered office is at P.O. Box 957, Offshore Incorporations Centre, Road Town, Tortola, British Virgin Islands. | |
| (13) | Excellent New Limited is a company incorporated in the British Virgin Islands. Yunfeng Bai is the sole shareholder and the sole director of Excellent New Limited. Its registered office is at P.O. Box 957, Offshore Incorporations Centre, Road Town, Tortola, British Virgin Islands. |
As of the date of this prospectus, none of our outstanding common shares or Series A preferred shares are held of record by any persons in the United States. None of our shareholders has informed us that it is a broker-dealer or an affiliate of a broker-dealer. Our common shares are divided into Class A common shares and Class B common shares. Holders of Class A common shares are entitled to one vote per share, while holders of Class B common shares are entitled to ten votes per share. We will issue Class A common shares represented by our ADSs in this offering. All of our shareholders as of September 29, 2010 hold our Class B common shares upon the closing of this offering and may choose to convert their Class B common shares into the same number of Class A common shares at any time. See “Description of Share Capital—Common Shares” for a more detailed description of our Class A common shares and Class B common shares. We are not aware of any arrangement that may, at a subsequent date, result in a change of control of our company.
120
Table of Contents
RELATED PARTY TRANSACTIONS
Contractual Arrangements with Our Affiliated Entities and Their Shareholders
See “Our Corporate History and Structure—Contractual Arrangements with Our Consolidated Affiliated Entities.”
Private Placement
See “Description of Share Capital—History of Securities Issuances.”
Shareholders’ Agreement
See “Description of Share Capital—Shareholders’ Agreement and Registration Rights.”
Employment Agreement
See “Management—Employment Agreements.”
Stock Incentives
See “Management—Share Incentive Plan.”
121
Table of Contents
DESCRIPTION OF SHARE CAPITAL
We are a Cayman Islands company and our affairs are governed by our memorandum and articles of association and the Companies Law (as amended) of the Cayman Islands, which is referred to as the Companies Law below.
We have adopted the fourth amended and restated memorandum and articles of association. This new memorandum and articles of association will become effective upon completion of this offering and will replace the current memorandum and articles of association in its entirety. The following are summaries of material provisions of our post-offering memorandum and articles of association and the Companies Law insofar as they relate to the material terms of our common shares that we expect will become effective upon the closing of this offering.
Common Shares
General. Our common shares are divided into Class A common shares and Class B common shares. Holders of our Class A common shares and Class B common shares have the same rights except for voting and conversion rights. Our authorized share capital is $2,000,000 divided into 500,000,000 Class A common shares, with a par value of $0.001 each, 500,000,000 Class B common shares of $0.001 each and 1,000,000,000 undesignated shares with a par value of $0.001 each. Certificates representing the common shares are issued in registered form. Our shareholders who are nonresidents of the Cayman Islands may freely hold and vote their shares.
Dividends. The holders of our common shares are entitled to such dividends as may be declared by our board of directors subject to the Companies Law.
Conversion. Each Class B common share is convertible into one Class A common share at any time by the holder thereof. Class A common shares are not convertible into Class B common shares under any circumstances. Upon any transfer of Class B common shares by a holder thereof to any person or entity which is not an affiliate of such holder (as defined in our articles of association), such Class B common shares shall be automatically and immediately converted into an equal number of Class A common shares. In addition, if at any time Mr. Bangxin Zhang, Mr. Yundong Cao, Mr. Yachao Liu, Mr. Yunfeng Bai, Tiger Global Five China Holdings and KTB China Optimum Fund and their respective affiliates collectively own less than 5% of the total number of the issued and outstanding Class B common shares (taking into account all of the issued and outstanding preferred shares on an as-converted basis), each issued and outstanding Class B common share shall be automatically and immediately converted into one share of Class A common share, and we shall not issue any Class B common shares thereafter.
Voting Rights. In respect of matters requiring shareholders’ vote, each Class A common share is entitled to one vote, and each Class B common share is entitled to ten votes. Shareholders may attend any shareholders’ meeting and vote in person or by proxy, and in the case of a corporation or other non-natural person, by its duly authorized representative or proxy; we currently do not allow shareholders to vote electronically. Voting at any shareholders’ meeting is by show of hands unless a poll is demanded. A poll may be demanded by the chairman of our board of directors or one or more shareholders holding at least 10% of the paid up voting share capital, present in person or by proxy.
A quorum required for a meeting of shareholders consists of at least two shareholders present in person or by proxy or, if a corporation or other non-natural person, by its duly authorized representative, who holds no less than 10% of our voting share capital. Shareholders’ meetings are held annually and may be convened by our board of directors on its own initiative or upon a request to the directors by shareholders holding in aggregate at least one-third of our voting share capital. Advance notice of at least 10 days is required for the convening of our annual general meeting and other shareholders’ meetings.
An ordinary resolution to be passed by the shareholders requires a simple majority of votes cast in a general meeting, while a special resolution requires no less than two-thirds of the votes cast. A special resolution is required for important matters such as a change of name. Our shareholders may effect certain changes by ordinary resolution, including increase the amount of our authorized share capital, consolidate and
122
Table of Contents
divide all or any of our share capital into shares of larger amount than our existing shares, and cancel any shares.
Transfer of Shares. Subject to the restrictions of our memorandum and articles of association, as applicable, any of our shareholders may transfer all or any of his or her common shares by an instrument of transfer in the usual or common form or any other form approved by our board.
Our board of directors may, in its sole discretion, decline to register any transfer of any common share which is not fully paid up or on which we have a lien. Our directors may also decline to register any transfer of any share unless (a) the instrument of transfer is lodged with us, accompanied by the certificate for the shares to which it relates and such other evidence as our board of directors may reasonably require to show the right of the transferor to make the transfer; (b) the instrument of transfer is in respect of only one class of shares; (c) the instrument of transfer is properly stamped, if required; (d) in the case of a transfer to joint holders, the number of joint holders to whom the share is to be transferred does not exceed four; (e) the shares conceded are free of any lien in favor of us; or (f) a fee of such maximum sum as the New York Stock Exchange may determine to be payable, or such lesser sum as our board of directors may from time to time require, is paid to us in respect thereof.
If our directors refuse to register a transfer they shall, within two months after the date on which the instrument of transfer was lodged, send to each of the transferor and the transferee notice of such refusal. The registration of transfers may, on 14 days’ notice being given by advertisement in such one or more newspapers or by electronic means, be suspended and the register closed at such times and for such periods as our board of directors may from time to time determine, provided, however, that the registration of transfers shall not be suspended nor the register closed for more than 30 days in any year.
Liquidation. On a return of capital on winding up or otherwise (other than on conversion, redemption or purchase of shares), assets available for distribution among the holders of common shares shall be distributed among the holders of the common shares on a pro rata basis. If our assets available for distribution are insufficient to repay all of thepaid-up capital, the assets will be distributed so that the losses are borne by our shareholders proportionately.
Calls on Shares and Forfeiture of Shares. Our board of directors may from time to time make calls upon shareholders for any amounts unpaid on their shares in a notice served to such shareholders at least 14 days prior to the specified time of payment. The shares that have been called upon and remain unpaid on the specified time are subject to forfeiture.
Redemption of Shares. Subject to the provisions of the Companies Law, we may issue shares on terms that are subject to redemption, at our option or at the option of the holders, on such terms and in such manner as may be determined by special resolution.
Variations of Rights of Shares. All or any of the special rights attached to any class of shares may, subject to the provisions of the Companies Law, be varied either with the written consent of the holders of a majority of the issued shares of that class or with the sanction of a special resolution passed at a general meeting of the holders of the shares of that class. The rights conferred upon the holders of the shares of any class shall not, unless otherwise expressly provided by the terms of issue of the shares of that class, be deemed to be varied by the creation or issue of further shares ranking in priority to or pari passu with such previously existing shares.
Inspection of Books and Records. Holders of our common shares will have no general right under Cayman Islands law to inspect or obtain copies of our list of shareholders or our corporate records. However, we will provide our shareholders with annual audited financial statements. See “Additional Information.”
123
Table of Contents
Anti-Takeover Provisions. Some provisions of our post-offering memorandum and articles of association may discourage, delay or prevent a change of control of our company or management that shareholders may consider favorable, including provisions that:
| • | authorize our board of directors to issue preference shares in one or more series and to designate the price, rights, preferences, privileges and restrictions of such preference shares without any further vote or action by our shareholders; and | |
| • | limit the ability of shareholders to requisition and convene general meetings of shareholders. |
However, under Cayman Islands law, our directors may only exercise the rights and powers granted to them under our memorandum and articles of association for a proper purpose and for what they believe in good faith to be in the best interests of our company.
History of Securities Issuances
The following is a summary of our securities issuances since the inception of TAL Group:
Common Shares
In January 2008, in connection with our corporate restructuring and the incorporation of our offshore holding company, we issued 565 common shares to Bangxin Zhang, 260 common shares to Yundong Cao, 100 common shares to Yachao Liu and 75 common shares to Yunfeng Bai, the beneficial owners of Xueersi Education and Xueersi Network, based on their respective interests in these two companies, immediately prior to the restructuring.
In January 2009, we issued 67,799,435 common shares to Bangxin Zhang, 31,199,740 common shares to Yundong Cao, 11,999,900 common shares to Yachao Liu and 8,999,925 common shares to Yunfeng Bai based on their respective interests in our offshore holding company, immediately prior to this issuance. In May 2009, Bangxin Zhang, Yundong Cao, Yachao Liu and Yunfeng Bai transferred all the common shares they held to their respective personal holding companies incorporated in the British Virgin Islands.
Preferred Shares
In February 2009, we issued an aggregate of 5,000,000 preferred shares to KTB/UCI China Ventures II Limited in a private placement at $1.00 per share for an aggregate purchase price of $5 million. In August 2010, KTB/UCI China Ventures II Limited transferred 5,000,000 preferred shares to its affiliate KTB China Optimum Fund. We refer to KTB/UCI China Ventures II and KTB China Optimum Fund collectively as “KTB.” Holders of our preferred shares are entitled to vote on an “as converted” basis together with the holders of common shares. Each preferred share will automatically convert into one common share upon completion of this offering.
Share Transfer to Tiger and KTB
In August 2009, Bangxin Zhang, Yundong Cao, Yachao Liu and Yunfeng Bai, or the Pre-IPO Individual Beneficial Owners, entered into an agreement to collectively sell an aggregate of 21,875,000 common shares for an aggregate price of $35 million to Tiger Global Five China Holdings, and an aggregate of 3,125,000 common shares for an aggregate price of $5 million to KTB China Optimum Fund.
Options
In connection with the sale of common shares to Tiger by the Pre-IPO Individual Beneficial Owners in August 2009, we and the Pre-IPO Individual Beneficial Owners granted an option to Tiger to acquire additional securities prior to our IPO at a fair market value to enable Tiger to increase its equity in our company to 25% on a fully diluted basis. If Tiger purchases additional shares from the Pre-IPO Individual Beneficial Owners, KTB has the right to purchase its pro rata portion of the shares offered by the Pre-IPO Individual Beneficial Owners calculated based on our shareholder agreement. Neither Tiger nor KTB will exercise their options to acquire our additional securities in connection with this offering offering.
124
Table of Contents
For options to be granted to certain of our directors, officers, employees and consultants under our share incentive plan, see “Management—Share Incentive Plan.”
Each of the aforementioned issuances was exempt from registration under the Securities Act in reliance on Regulation S under the Securities Act regarding sales by an issuer made outside the U.S. No underwriters were involved in the securities issuances described above.
Shareholders’ Agreement and Registration Rights
In connection with the issuance and sale of our Series A preferred shares, we and our major shareholders entered into a shareholders’ agreement, dated February 12, 2009, which was amended and restated on August 12, 2009 in connection with the sale by our then shareholders to Tiger and KTB China Optimum Fund.
Under the shareholders’ agreement, KTB and Tiger were granted certain rights, including customary veto rights, tag-along rights, preemptive rights, rights of first refusal and co-sale, registration rights and the right to elect one director each. The holder of our Series A preferred shares was granted conversion rights and liquidation rights with respect to the Series A preferred shares. Except for the registration rights, all of the rights of KTB and Tiger under the shareholders’ agreement will terminate upon the completion of this offering.
Under the terms of the agreement, from the date that is six months after the effective date of the registration statement for this offering, holders of at least 30% of the aggregate shares initially purchased by KTB and Tiger, together on an as-converted basis (collectively, the “Initial Holders”), may require us to effect the registration other than onForm F-3 (or a comparable form) for a public offering of their registrable securities with anticipated gross proceeds of at least $5 million in the aggregate.
Moreover, the Initial Holders may require us to effect the registration onForm F-3 for their registrable securities provided thatForm F-3 (or a comparable form) is available for such offering and that the aggregate price to the public net of any underwriters’ discounts or commissions is not less than $0.5 million. We are only obliged to effect up to two demand registrations other than onForm F-3 and up to two demand registrations onForm F-3 (if available) during any twelve-month period. We have the right to defer filing for a period of no more than 90 days if our board of directors in good faith determines that filing of such registration will be materially detrimental to us and our shareholders, but we cannot utilize this right more than once in any twelve-month period or register any securities of our company for our own account or for the account of any other shareholder during such90-day period. In the case where the number of registrable securities included in an underwritten public offering is to be reduced, the securities other than registrable shares must be reduced before any registrable securities may be reduced.
The Initial Holders also have “piggyback” registration rights, pursuant to which they may require us to register all or any part of the registrable securities then held by such holders when we file any registration statements for purposes of effecting a public offering of our securities (including a registration statement we file for shareholders other than the Initial Holders). In the case where the number of registrable securities included in an underwritten public offering is to be reduced, the securities other than registrable shares must be reduced before any registrable securities may be reduced. However, in no event shall the amount of securities included in such registration be reduced below 30% of the total shares requested to be included in the offering.
The registration rights shall terminate after (a) the fifth anniversary following the completion of this offering, or (b) with respect to any shareholder, such earlier time after the offering at which such holder (i) can sell all shares held by it in compliance with Rule 144(b)(1)(i) or (ii) under the the Securities Act, holds 1% or less of our outstanding common shares and all registrable securities held by such holder can be sold in any90-day period without registration under Rule 144 under the Securities Act.
Differences in Corporate Law
The Companies Law is modeled after companies legislation of the United Kingdom but does not follow recent United Kingdom statutory enactments. In addition, the Companies Law differs from laws applicable to
125
Table of Contents
United States corporations and their shareholders. Set forth below is a summary of the significant differences between the provisions of the Companies Law applicable to us and the laws applicable to companies incorporated in the United States and their shareholders.
Mergers and Similar Arrangements. The Companies Law permits mergers and consolidations between Cayman Islands companies and between Cayman Islands companies and non-Cayman Islands companies. For these purposes, (a) “merger” means the merging of two or more constituent companies and the vesting of their undertaking, property and liabilities in one of such companies as the surviving company, and (b) a “consolidation” means the combination of two or more constituent companies into a consolidated company and the vesting of the undertaking, property and liabilities of such companies to the consolidated company. In order to effect such a merger or consolidation, the directors of each constituent company must approve a written plan of merger or consolidation, which must then be authorized by either (a) a special resolution of the shareholders of each constituent company voting together as one class if the shares to be issued to each shareholder in the consolidated or surviving company will have the same rights and economic value as the shares held in the relevant constituent company, or (b) a shareholder resolution of each constituent company passed by a majority in number representing 75% in value of the shareholders voting together as one class. The plan must be filed with the Registrar of Companies together with a declaration as to the solvency of the consolidated or surviving company, a list of the assets and liabilities of each constituent company and an undertaking that a copy of the certificate of merger or consolidation will be given to the members and creditors of each constituent company and published in the Cayman Islands Gazette. Dissenting shareholders have the right to be paid the fair value of their shares (which, if not agreed between the parties, will be determined by the Cayman Islands court) if they follow the required procedures, subject to certain exceptions. Court approval is not required for a merger or consolidation which is effected in compliance with these statutory procedures.
In addition, there are statutory provisions that facilitate the reconstruction and amalgamation of companies, provided that the arrangement is approved by a majority in number of each class of shareholders and creditors with whom the arrangement is to be made, and who must in addition represent three-fourths in value of each such class of shareholders or creditors, as the case may be, that are present and voting either in person or by proxy at a meeting, or meetings, convened for that purpose. The convening of the meetings and subsequently the arrangement must be sanctioned by the Grand Court of the Cayman Islands. While a dissenting shareholder has the right to express to the court the view that the transaction ought not to be approved, the court can be expected to approve the arrangement if it determines that:
| • | the statutory provisions as to majority vote have been met; | |
| • | the shareholders have been fairly represented at the meeting in question; | |
| • | the arrangement is such that a businessman would reasonably approve; and | |
| • | the arrangement is not one that would more properly be sanctioned under some other provision of the Companies Law. |
When a take-over offer is made and accepted by holders of 90.0% of the shares affected within four months, the offeror may, within a two-month period, require the holders of the remaining shares to transfer such shares on the terms of the offer. An objection can be made to the Grand Court of the Cayman Islands but this is unlikely to succeed unless there is evidence of fraud, bad faith or collusion.
If the arrangement and reconstruction is thus approved, the dissenting shareholder would have no rights comparable to appraisal rights, which would otherwise ordinarily be available to dissenting shareholders of United States corporations, providing rights to receive payment in cash for the judicially determined value of the shares.
Shareholders’ Suits. In principle, we will normally be the proper plaintiff and a derivative action may not be brought by a minority shareholder. However, based on English authority, which would in all likelihood be
126
Table of Contents
of persuasive authority in the Cayman Islands, exceptions to the foregoing principle apply in circumstances in which:
| • | a company is acting or proposing to act illegally or ultra vires; | |
| • | the act complained of, although not ultra vires, could be effected duly if authorized by more than a simple majority vote which has not been obtained; and | |
| • | those who control the company are perpetrating a “fraud on the minority.” |
Transactions with Directors. Under the Delaware General Corporation Law, or the DGCL, transactions with directors must be approved by disinterested directors or by the shareholders, or otherwise proven to be fair to the company as of the time it is approved. Such transaction will be void or voidable, unless (i) the material facts of any interested directors’ interests are disclosed or are known to the board of directors and the transaction is approved by the affirmative votes of a majority of the disinterested directors, even though the disinterested directors be less than a quorum; (ii) the material facts of any interested directors’ interests are disclosed or are known to the shareholders entitled to vote thereon, and the transaction is specifically approved in good faith by vote of the shareholders; or (iii) the transaction is fair to the company as of the time it is approved.
Cayman Islands laws do not restrict transactions with directors, requiring only that directors exercise a duty of care and owe a fiduciary duty to the companies for which they serve. Under our post-offering memorandum and articles of association, subject to any separate requirement for audit committee approval under the New York Stock Exchange rules or unless disqualified by the chairman of the relevant board meeting, so long as a director discloses the nature of his interest in any contract or arrangement which he is interested in, such a director may vote in respect of any contract or proposed contract or arrangement in which such director is interested and may be counted in the quorum at such a meeting.
Directors’ Fiduciary Duties. Under Delaware corporate law, a director of a Delaware corporation has a fiduciary duty to the corporation and its shareholders. This duty has two components: the duty of care and the duty of loyalty. The duty of care generally requires that a director act in good faith, with the care that an ordinarily prudent person would exercise under similar circumstances. Under this duty, a director must inform himself of all material information reasonably available regarding a significant transaction. The duty of loyalty requires that a director act in a manner he reasonably believes to be in the best interests of the corporation. He must not use his corporate position for personal gain or advantage. This duty prohibits self-dealing by a director and mandates that the best interest of the corporation and its shareholders take precedence over any interest possessed by a director, officer or controlling shareholder and not shared by the shareholders generally. In general, but subject to certain exceptions, actions of a director are presumed to have been made on an informed basis, in good faith and in the honest belief that the action taken was in the best interests of the corporation. However, this presumption may be rebutted by evidence of a breach of one of the fiduciary duties.
Under Cayman Islands law, a director of a Cayman Islands company is in the position of a fiduciary with respect to the company, and therefore it is considered that he or she owes the following duties to the company: a duty to act bona fide in the best interests of the company; a duty not to make a profit out of his or her position as director (unless the company permits him or her to do so); and a duty not to put himself or herself in a position where the interests of the company conflict with his or her personal interests or his or her duty to a third party. A director of a Cayman Islands company owes to the company a duty to act with skill and care. It was previously considered that a director need not exhibit in the performance of his or her duties a greater degree of skill than may reasonably be expected from a person of his or her knowledge and experience. However, there are indications that the courts are moving towards an objective standard with regard to the required skill and care.
Under our post-offering memorandum and articles of association, directors who are in any way, whether directly or indirectly, interested in a contract or proposed contract with our company shall declare the nature of their interest at a meeting of the board of directors. Following such declaration, a director may vote in respect of any contract or proposed contract notwithstanding his interest.
127
Table of Contents
Majority Independent Board. A domestic U.S. company listed on the New York Stock Exchange must comply with the requirement that a majority of the board of directors must be comprised of independent directors as defined under Section 303A of the Corporate Governance Rules of the New York Stock Exchange. As a Cayman Islands corporation, we are allowed to follow home country practices in lieu of certain corporate governance requirements under the New York Stock Exchange rules where there is no similar requirement under the laws of the Cayman Islands. However, we have no present intention to rely on home country practice with respect to our corporate governance matters, and we intend to comply with the New York Stock Exchange rules after the completion of this offering.
Shareholder Action by Written Consent. Under the DGCL, a corporation may eliminate the right of shareholders to act by written consent by inclusion of such a restriction in its certificate of incorporation. Cayman Islands law and our post-offering articles of association provide that shareholders may approve corporate matters by way of a unanimous written resolution signed by or on behalf of each shareholder who would have been entitled to vote on such matter at a general meeting without a meeting being held.
Shareholder Proposals and Meeting of Shareholders. The DGCL does not provide shareholders an express right to put any proposal before the annual meeting of shareholders, but in keeping with common law, Delaware corporations generally afford shareholders an opportunity to make proposals and nominations provided that they comply with the notice provisions in the certificate of incorporation or bylaws. A special meeting may be called by the board of directors or any other person authorized to do so in the certificate of incorporation or bylaws, but shareholders may be precluded from calling special meetings.
Cayman Islands law provides shareholders with only limited rights to requisition a general meeting, and does not provide shareholders with any right to put any proposal before a general meeting. However, these rights may be provided in a company’s articles of association. Our post-offering memorandum and articles of association allow our shareholders holding not less than one-third of ourpaid-up voting share capital to requisition a special meeting of the shareholders, in which case the directors are obliged to call such meeting and to put the resolutions so requisitioned to a vote at such meeting; however, our articles do not provide our shareholders with any right to put any proposals before annual general meetings or extraordinary general meetings not called by such shareholders.
As a Cayman Islands exempted company, we are not obliged by the Companies Law of the Cayman Islands to call shareholders’ annual general meetings. Our post-offering memorandum and articles of association provide that we may (but are not obliged to) in each year hold a general meeting as our annual general meeting in which case we shall specify the meeting as such in the notices calling it, and the annual general meeting shall be held at such time and place as may be determined by our directors. We, however, will hold an annual shareholders’ meeting during each fiscal year, as required by the rules of the New York Stock Exchange.
Cumulative Voting. Under the DGCL, cumulative voting for elections of directors is not permitted unless the corporation’s certificate of incorporation specifically provides for it. Cumulative voting potentially facilitates the representation of minority shareholders on a board of directors since it permits the minority shareholder to cast all the votes to which the shareholder is entitled on a single director, which increases the shareholder’s voting power with respect to electing such director.
There are no prohibitions in relation to cumulative voting under the laws of the Cayman Islands, but our post-offering articles of association do not provide for cumulative voting. As a result, our shareholders are not afforded any less protections or rights on this issue than shareholders of a Delaware corporation.
Removal of Directors. Under the DGCL, a director of a corporation with a classified board may be removed only for cause with the approval of a majority of the outstanding shares entitled to vote, unless the certificate of incorporation provides otherwise. Under our post-offering articles of association, directors can be removed by a special resolution of shareholders.
Transactions with Interested Shareholders. The DGCL contains a business combination statute applicable to Delaware public corporations whereby, unless the corporation has specifically elected not to be governed by such statute by an amendment to its certificate of incorporation or bylaws that is approved by its shareholders,
128
Table of Contents
it is prohibited from engaging in certain business combinations with an “interested shareholder” for three years following the date that such person becomes an interested shareholder. An interested shareholder generally is a person or a group who or which owns 15% or more of the corporation’s outstanding voting stock or who or which is an affiliate or associate of the corporation and owned 15% or more of the corporation’s outstanding voting stock within the past three years. This has the effect of limiting the ability of a potential acquirer to make a two-tiered bid for the target in which all shareholders would not be treated equally. The statute does not apply if, among others, prior to the date on which such shareholder becomes an interested shareholder, the board of directors approves either the business combination or the transaction which resulted in the person becoming an interested shareholder. This encourages any potential acquirer of a Delaware public corporation to negotiate the terms of any acquisition transaction with the target’s board of directors.
Cayman Islands law has no comparable statute. As a result, we cannot avail ourselves of the types of protections afforded by the Delaware business combination statute. However, although Cayman Islands law does not regulate transactions between a company and its significant shareholders, it does provide that such transactions must be entered into bona fide in the best interests of the company and not with the effect of perpetuating a fraud on the minority shareholders.
Amendment of Governing Documents. Under the DGCL, a corporation’s certificate of incorporation may be amended only if adopted and declared advisable by the board of directors and approved by a majority of the outstanding shares entitled to vote, and the bylaws may be amended with the approval of a majority of the outstanding shares entitled to vote and may, if so provided in the certificate of incorporation, also be amended by the board of directors. As permitted by Cayman Islands law, our post-offering memorandum and articles of association may be amended with a special resolution.
Rights of Non-resident or Foreign Shareholders. There are no limitations imposed by our post-offering memorandum and articles of association on the rights of non-resident or foreign shareholders to hold or exercise voting rights on our shares. In addition, there are no provisions in our post-offering memorandum and articles of association governing the ownership threshold above which shareholder ownership must be disclosed.
Indemnification. Cayman Islands law does not limit the extent to which a company’s articles of association may provide for indemnification of officers and directors, except to the extent any such provision may be held by the Cayman Islands courts to be contrary to public policy, such as to provide indemnification against civil fraud or the consequences of committing a crime.
Under our post-offering memorandum and articles of association, we may indemnify our directors, officers, employees and agents against expenses, judgments, fines and amounts paid in settlement actually and reasonably incurred by such persons in connection with actions, suits or proceedings to which they are party or are threatened to be made a party by reason of their acting as our directors, officers, employees or agents, except through their own dishonesty, willful default or fraud. To be entitled to indemnification, these persons must have acted in good faith and in the best interest and not contrary to the interest of our company, and must not have acted in a manner willfully or grossly negligent and, with respect to any criminal action, they must have had no reasonable cause to believe their conduct was unlawful. Our post-offering memorandum and articles of association may also provide for indemnification of such person in the case of a suit initiated by our company or in the right of our company.
We intend to enter into indemnification agreements with our directors and executive officers to indemnify them to the fullest extent permitted by applicable law and our articles of association, from and against all costs, charges, expenses, liabilities and losses incurred in connection with any litigation, suit or proceeding to which such director is or is threatened to be made a party, witness or other participant.
Insofar as indemnification for liabilities arising under the Securities Act may be permitted to directors, officers or persons controlling us under the foregoing provisions, we have been advised that in the opinion of the Securities and Exchange Commission, such indemnification is against public policy as expressed in the Securities Act and therefore is unenforceable.
129
Table of Contents
DESCRIPTION OF AMERICAN DEPOSITARY SHARES
American Depositary Receipts
JPMorgan Chase Bank, N.A., as depositary will issue the ADSs which you will be entitled to receive in this offering. Each ADS will represent an ownership interest in two Class A common shares which we will deposit with the custodian, as agent of the depositary, under the deposit agreement among ourselves, the depositary and yourself as an ADR holder. In the future, each ADS will also represent any securities, cash or other property deposited with the depositary but which they have not distributed directly to you. Unless specifically requested by you, all ADSs will be issued on the books of our depositary in book-entry form and periodic statements will be mailed to you which reflect your ownership interest in such ADSs. In our description, references to American depositary receipts or ADRs shall include the statements you will receive which reflect your ownership of ADSs.
The depositary’s office is located at 1 Chase Manhattan Plaza, Floor 58, New York, NY, 10005-1401.
You may hold ADSs either directly or indirectly through your broker or other financial institution. If you hold ADSs directly, by having an ADS registered in your name on the books of the depositary, you are an ADR holder. This description assumes you hold your ADSs directly. If you hold the ADSs through your broker or financial institution nominee, you must rely on the procedures of such broker or financial institution to assert the rights of an ADR holder described in this section. You should consult with your broker or financial institution to find out what those procedures are.
As an ADR holder, we will not treat you as a shareholder of ours and you will not have any shareholder rights. Cayman Island law governs shareholder rights. Because the depositary or its nominee will be the shareholder of record for the shares represented by all outstanding ADSs, shareholder rights rest with such record holder. Your rights are those of an ADR holder. Such rights derive from the terms of the deposit agreement to be entered into among us, the depositary and all registered holders from time to time of ADSs issued under the deposit agreement. The obligations of the depositary and its agents are also set out in the deposit agreement. Because the depositary or its nominee will actually be the registered owner of the Class A common shares, you must rely on it to exercise the rights of a shareholder on your behalf. The deposit agreement and the ADSs are governed by New York law.
The following is a summary of the material terms of the deposit agreement. Because it is a summary, it does not contain all the information that may be important to you. For more complete information, you should read the entire deposit agreement and the form of ADR which contains the terms of your ADSs. You can read a copy of the deposit agreement which is filed as an exhibit to the registration statement of which this prospectus forms a part. You may also obtain a copy of the deposit agreement at the SEC’s Public Reference Room which is located at 100 F Street, NE, Washington, DC 20549. You may obtain information on the operation of the Public Reference Room by calling the SEC at1-800-732-0330. You may also find the registration statement and the attached deposit agreement on the SEC’s website athttp://www.sec.gov.
Share Dividends and Other Distributions
How will I receive dividends and other distributions on the shares underlying my ADSs?
We may make various types of distributions with respect to our securities. The depositary has agreed that, to the extent practicable, it will pay to you the cash dividends or other distributions it or the custodian receives on shares, after converting any cash received into U.S. dollars and, in all cases, making any necessary deductions provided for in the deposit agreement. You will receive these distributions in proportion to the number of underlying securities that your ADSs represent.
Except as stated below, the depositary will deliver such distributions to ADR holders in proportion to their interests in the following manner:
| • | Cash. The depositary will distribute any U.S. dollars available to it resulting from a cash dividend or other cash distribution or the net proceeds of sales of any other distribution or portion thereof (to the |
130
Table of Contents
| extent applicable), on an averaged or other practicable basis, subject to (i) appropriate adjustments for taxes withheld, (ii) such distribution being impermissible or impracticable with respect to certain registered ADR holders, and (iii) deduction of the depositary’s expenses in (1) converting any foreign currency to U.S. dollars to the extent that it determines that such conversion may be made on a reasonable basis, (2) transferring foreign currency or U.S. dollars to the United States by such means as the depositary may determine to the extent that it determines that such transfer may be made on a reasonable basis, (3) obtaining any approval or license of any governmental authority required for such conversion or transfer, which is obtainable at a reasonable cost and within a reasonable time and (4) making any sale by public or private means in any commercially reasonable manner. If exchange rates fluctuate during a time when the depositary cannot convert a foreign currency, you may lose some or all of the value of the distribution. |
| • | Shares. In the case of a distribution in shares, the depositary will issue additional ADRs to evidence the number of ADSs representing such shares. Only whole ADSs will be issued. Any shares which would result in fractional ADSs will be sold and the net proceeds will be distributed in the same manner as cash to the ADR holders entitled thereto. | |
| • | Rights to receive additional shares. In the case of a distribution of rights to subscribe for additional shares or other rights, if we provide evidence satisfactory to the depositary that it may lawfully distribute such rights, the depositary will distribute warrants or other instruments in the discretion of the depositary representing such rights. However, if we do not furnish such evidence, the depositary may: |
| • | sell such rights if practicable and distribute the net proceeds in the same manner as cash to the ADR holders entitled thereto; or | |
| • | if it is not practicable to sell such rights, do nothing and allow such rights to lapse, in which case ADR holders will receive nothing. |
We have no obligation to file a registration statement under the Securities Act in order to make any rights available to ADR holders.
| • | Other Distributions. In the case of a distribution of securities or property other than those described above, the depositary may either (i) distribute such securities or property in any manner it deems equitable and practicable or (ii) to the extent the depositary deems distribution of such securities or property not to be equitable and practicable, sell such securities or property and distribute any net proceeds in the same way it distributes cash. |
If the depositary determines that any distribution described above is not practicable with respect to any specific registered ADR holder, the depositary may choose any method of distribution that it deems practicable for such ADR holder, including the distribution of foreign currency, securities or property, or it may retain such items, without paying interest on or investing them, on behalf of the ADR holder as deposited securities, in which case the ADSs will also represent the retained items.
Any U.S. dollars will be distributed by checks drawn on a bank in the United States for whole dollars and cents. Fractional cents will be withheld without liability and dealt with by the depositary in accordance with its then current practices.
The depositary is not responsible if it decides that it is unlawful or impractical to make a distribution available to any ADR holders.
There can be no assurance that the depositary will be able to convert any currency at a specified exchange rate or sell any property, rights, shares or other securities at a specified price, nor that any of such transactions can be completed within a specified time period.
131
Table of Contents
Deposit, Withdrawal and Cancellation
How does the depositary issue ADSs?
The depositary will issue ADSs if you or your broker deposit shares or evidence of rights to receive shares with the custodian and pay the fees and expenses owing to the depositary in connection with such issuance. In the case of the ADSs to be issued under this prospectus, we will arrange with the underwriters named herein to deposit such shares.
Shares deposited in the future with the custodian must be accompanied by certain delivery documentation, including instruments showing that such shares have been properly transferred or endorsed to the person on whose behalf the deposit is being made.
The custodian will hold all deposited shares (including those being deposited by or on our behalf in connection with the offering to which this prospectus relates) for the account of the depositary. ADR holders thus have no direct ownership interest in the shares and only have such rights as are contained in the deposit agreement. The custodian will also hold any additional securities, property and cash received on or in substitution for the deposited shares. The deposited shares and any such additional items are referred to as “deposited securities”.
Upon each deposit of shares, receipt of related delivery documentation and compliance with the other provisions of the deposit agreement, including the payment of the fees and charges of the depositary and any taxes or other fees or charges owing, the depositary will issue an ADR or ADRs in the name or upon the order of the person entitled thereto evidencing the number of ADSs to which such person is entitled. All of the ADSs issued will, unless specifically requested to the contrary, be part of the depositary’s direct registration system, and a registered holder will receive periodic statements from the depositary which will show the number of ADSs registered in such holder’s name. An ADR holder can request that the ADSs not be held through the depositary’s direct registration system and that a certificated ADR be issued.
How do ADR holders cancel an ADS and obtain deposited securities?
When you turn in your ADR certificate at the depositary’s office, or when you provide proper instructions and documentation in the case of direct registration ADSs, the depositary will, upon payment of certain applicable fees, charges and taxes, deliver the underlying shares to you or upon your written order. In the case of certificated ADSs, delivery will be made at the custodian’s office. At your risk, expense and request, the depositary may deliver deposited securities at such other place as you may request.
The depositary may only restrict the withdrawal of deposited securities in connection with:
| • | temporary delays caused by closing our transfer books or those of the depositary or the deposit of shares in connection with voting at a shareholders’ meeting, or the payment of dividends; | |
| • | the payment of fees, taxes and similar charges; or | |
| • | compliance with any U.S. or foreign laws or governmental regulations relating to the ADRs or to the withdrawal of deposited securities. |
This right of withdrawal may not be limited by any other provision of the deposit agreement.
Record Dates
The depositary may, after consultation with us if practicable, fix record dates for the determination of the registered ADR holders who will be entitled (or obligated, as the case may be):
| • | to receive any distribution on or in respect of shares, | |
| • | to give instructions for the exercise of voting rights at a meeting of holders of shares, |
132
Table of Contents
| • | to pay the fee assessed by the depositary for administration of the ADR program and for any expenses as provided for in the ADR, or | |
| • | to receive any notice or to act in respect of other matters, |
all subject to the provisions of the deposit agreement.
Voting Rights
How do I vote?
If you are an ADR holder and the depositary asks you to provide it with voting instructions, you may instruct the depositary how to exercise the voting rights for the shares which underlie your ADSs. As soon as practicable after receiving notice of any meeting or solicitation of consents or proxies from us, the depositary will distribute to the registered ADR holders a notice stating such information as is contained in the voting materials received by the depositary and describing how you may instruct the depositary to exercise the voting rights for the shares which underlie your ADSs, including instructions for giving a discretionary proxy to a person designated by us. For instructions to be valid, the depositary must receive them in the manner and on or before the date specified. The depositary will try, as far as is practical, subject to the provisions of and governing the underlying shares, to vote or to have its agents vote the shares as you instruct. The depositary will only vote or attempt to vote as you instruct. The depositary will not itself exercise any voting discretion. Furthermore, neither the depositary nor its agents are responsible for any failure to carry out any voting instructions, for the manner in which any vote is cast or for the effect of any vote. We allow the depositary as a shareholder on record to attend any shareholders’ meeting and vote by its duly authorized representative or by proxy; however, we currently do not allow shareholders to vote electronically.
There is no guarantee that you will receive voting materials in time to instruct the depositary to vote and it is possible that you, or persons who hold their ADSs through brokers, dealers or other third parties, will not have the opportunity to exercise a right to vote.
The shares represented by the ADSs may only be voted through the depositary. ADR holders will not be able to attend and vote at meetings of shareholders other than through the depositary itself. To the extent an ADR holder wishes to attend and vote at any such meeting, such ADR holder would be required to cancel such ADR holder’s ADSs and become a shareholder of the company prior to the record date established by us for such meeting. For information on how a shareholder of the company is able to vote, please see “Description of Share Capital — Common Shares.”
In order to give you a reasonable opportunity to instruct the depositary as to the exercise of voting rights relating to deposited securities, if we request the depositary to act, we will give the depositary notice of any such meeting and details concerning the matters to be voted upon at least 30 days in advance of the meeting date.
Reports and Other Communications
Will ADR holders be able to view our reports?
The depositary will make available for inspection by ADR holders at the offices of the depositary and the custodian the deposit agreement, the provisions of or governing deposited securities, and any written communications from us which are both received by the custodian or its nominee as a holder of deposited securities and made generally available to the holders of deposited securities.
Additionally, if we make any written communications generally available to holders of our shares, and we furnish copies thereof (or English translations or summaries) to the depositary, it will distribute the same to registered ADR holders.
133
Table of Contents
Fees and Expenses
What fees and expenses will I be responsible for paying?
The depositary may charge each person to whom ADSs are issued, including, without limitation, issuances against deposits of shares, issuances in respect of share distributions, rights and other distributions, issuances pursuant to a stock dividend or stock split declared by us or issuances pursuant to a merger, exchange of securities or any other transaction or event affecting the ADSs or deposited securities, and each person surrendering ADSs for withdrawal of deposited securities or whose ADRs are cancelled or reduced for any other reason, $5.00 for each 100 ADSs (or any portion thereof) issued, delivered, reduced, cancelled or surrendered, as the case may be. The depositary may sell (by public or private sale) sufficient securities and property received in respect of a share distribution, rightsand/or other distribution prior to such deposit to pay such charge.
The following additional charges shall be incurred by the ADR holders, by any party depositing or withdrawing shares or by any party surrendering ADSs or to whom ADSs are issued (including, without limitation, issuance pursuant to a stock dividend or stock split declared by us or an exchange of stock regarding the ADRs or the deposited securities or a distribution of ADSs), whichever is applicable:
| • | a fee of $1.50 per ADR or ADRs for transfers of certificated or direct registration ADRs; | |
| • | a fee of up to $0.05 per ADS for any cash distribution made pursuant to the deposit agreement; | |
| • | a fee of up to $0.05 per ADS per calendar year (or portion thereof) for services performed by the depositary in administering the ADRs (which fee may be charged on a periodic basis during each calendar year and shall be assessed against holders of ADRs as of the record date or record dates set by the depositary during each calendar year and shall be payable in the manner described in the next succeeding provision); | |
| • | reimbursement of such fees, charges and expenses as are incurred by the depositaryand/or any of the depositary’s agents (including, without limitation, the custodian and expenses incurred on behalf of holders in connection with compliance with foreign exchange control regulations or any law or regulation relating to foreign investment) in connection with the servicing of the shares, the delivery of deposited securities or otherwise in connection with the depositary’s or its custodian’s compliance with applicable law, rule or regulation (which charge shall be assessed on a proportionate basis against holders as of the record date or dates set by the depositary and shall be payable at the sole discretion of the depositary by billing such holders or by deducting such charge from one or more cash dividends or other cash distributions); | |
| • | a fee for the distribution of securities (or the sale of securities in connection with a distribution), such fee being in an amount equal to the fee for the execution and delivery of ADSs which would have been charged as a result of the deposit of such securities (treating all such securities as if they were shares) but which securities or the net cash proceeds from the sale thereof are instead distributed by the depositary to those holders entitled thereto; | |
| • | stock transfer or other taxes and other governmental charges; | |
| • | cable, telex and facsimile transmission and delivery charges incurred at your request in connection with the deposit or delivery of shares; | |
| • | transfer or registration fees for the registration of transfer of deposited securities on any applicable register in connection with the deposit or withdrawal of deposited securities; and | |
| • | expenses of the depositary in connection with the conversion of foreign currency into U.S. dollars. |
We will pay all other charges and expenses of the depositary and any agent of the depositary (except the custodian) pursuant to agreements from time to time between us and the depositary. The charges described above may be amended from time to time by agreement between us and the depositary.
134
Table of Contents
Our depositary has agreed to reimburse us for certain expenses we incur that are related to establishment and maintenance of the ADR program, including investor relations expenses and exchange application and listing fees. Neither the depositary nor we can determine the exact amount to be made available to us because (i) the number of ADSs that will be issued and outstanding, (ii) the level of fees to be charged to holders of ADSs and (iii) our reimbursable expenses related to the ADR program are not known at this time. The depositary collects its fees for issuance and cancellation of ADSs directly from investors depositing shares or surrendering ADSs for the purpose of withdrawal or from intermediaries acting for them. The depositary collects fees for making distributions to investors by deducting those fees from the amounts distributed or by selling a portion of distributable property to pay the fees. The depositary may collect its annual fee for depositary services by deduction from cash distributions, or by directly billing investors, or by charging the book-entry system accounts of participants acting for them. The depositary may generally refuse to provide services to any holder until the fees and expenses owing by such holder for those services or otherwise are paid.
Payment of Taxes
ADR holders must pay any tax or other governmental charge payable by the custodian or the depositary on any ADS or ADR, deposited security or distribution. If an ADR holder owes any tax or other governmental charge, the depositary may (i) deduct the amount thereof from any cash distributions, or (ii) sell deposited securities (by public or private sale) and deduct the amount owing from the net proceeds of such sale. In either case the ADR holder remains liable for any shortfall. Additionally, if any tax or governmental charge is unpaid, the depositary may also refuse to effect any registration, registration of transfer,split-up or combination of deposited securities or withdrawal of deposited securities until such payment is made. If any tax or governmental charge is required to be withheld on any cash distribution, the depositary may deduct the amount required to be withheld from any cash distribution or, in the case of a non-cash distribution, sell the distributed property or securities (by public or private sale) to pay such taxes and distribute any remaining net proceeds to the ADR holders entitled thereto.
By holding an ADR or an interest therein, you will be agreeing to indemnify us, the depositary, its custodian and any of our or their respective directors, employees, agents and affiliates against, and hold each of them harmless from, any claims by any governmental authority with respect to taxes, additions to tax, penalties or interest arising out of any refund of taxes, reduced rate of withholding at source or other tax benefit obtained.
Reclassifications, Recapitalizations and Mergers
If we take certain actions that affect the deposited securities, including (i) any change in par value,split-up, consolidation, cancellation or other reclassification of deposited securities or (ii) any distributions not made to holders of ADRs or (iii) any recapitalization, reorganization, merger, consolidation, liquidation, receivership, bankruptcy or sale of all or substantially all of our assets, then the depositary may choose to:
(1) amend the form of ADR;
(2) distribute additional or amended ADRs;
(3) distribute cash, securities or other property it has received in connection with such actions;
(4) sell any securities or property received and distribute the proceeds as cash; or
(5) none of the above.
If the depositary does not choose any of the above options, any of the cash, securities or other property it receives will constitute part of the deposited securities and each ADS will then represent a proportionate interest in such property.
135
Table of Contents
Amendment and Termination
How may the deposit agreement be amended?
We may agree with the depositary to amend the deposit agreement and the ADSs without your consent for any reason. ADR holders must be given at least 30 days notice of any amendment that imposes or increases any fees or charges (other than stock transfer or other taxes and other governmental charges, transfer or registration fees, cable, telex or facsimile transmission costs, delivery costs or other such expenses), or otherwise prejudices any substantial existing right of ADR holders. Such notice need not describe in detail the specific amendments effectuated thereby, but must give ADR holders a means to access the text of such amendment. We will file such amendment with the Securities and Exchange Commission through its electronic filing system, which provides ADR holders with free access to the text of any such amendment and we will bear any expenses that may be incurred for such filing. If an ADR holder continues to hold an ADR or ADRs after being so notified, such ADR holder is deemed to agree to such amendment and to be bound by the deposit agreement as so amended. Notwithstanding the foregoing, if any governmental body or regulatory body should adopt new laws, rules or regulations which would require amendment or supplement of the deposit agreement or the form of ADR to ensure compliance therewith, we and the depositary may amend or supplement the deposit agreement and the ADR at any time in accordance with such changed laws, rules or regulations, which amendment or supplement may take effect before a notice is given or within any other period of time as required for compliance. No amendment, however, will impair your right to surrender your ADSs and receive the underlying securities, except in order to comply with mandatory provisions of applicable law.
How may the deposit agreement be terminated?
The depositary may, and shall at our written direction, terminate the deposit agreement and the ADRs by mailing notice of such termination to the registered holders of ADRs at least 30 days prior to the date fixed in such notice for such termination; provided, however, if the depositary shall have (i) resigned as depositary under the deposit agreement, notice of such termination by the depositary shall not be provided to registered holders unless a successor depositary shall not be operating under the deposit agreement within 45 days of the date of such resignation, and (ii) been removed as depositary under the deposit agreement, notice of such termination by the depositary shall not be provided to registered holders of ADRs unless a successor depositary shall not be operating under the deposit agreement on the 90th day after our notice of removal was first provided to the depositary. After termination, the depositary’s only responsibility will be (i) to deliver deposited securities to ADR holders who surrender their ADRs, and (ii) to hold or sell distributions received on deposited securities. As soon as practicable after the expiration of six months from the termination date, the depositary will sell the deposited securities which remain and hold the net proceeds of such sales (as long as it may lawfully do so), without liability for interest, in trust for the ADR holders who have not yet surrendered their ADRs. After making such sale, the depositary shall have no obligations except to account for such proceeds and other cash.
Limitations on Obligations and Liability to ADR holders
Limits on our obligations and the obligations of the depositary; limits on liability to ADR holders and holders of ADSs
Prior to the issue, registration, registration of transfer,split-up, combination, or cancellation of any ADRs, or the delivery of any distribution in respect thereof, and from time to time, we or the depositary or its custodian may require:
| • | payment with respect thereto of (i) any stock transfer or other tax or other governmental charge, (ii) any stock transfer or registration fees in effect for the registration of transfers of shares upon any applicable register and (iii) any applicable fees and expenses described in the deposit agreement; | |
| • | the production of proof satisfactory to it of (i) the identity of any signatory and genuineness of any signature and (ii) such other information, including without limitation, information as to citizenship, |
136
Table of Contents
| residence, exchange control approval, beneficial ownership of any securities, compliance with applicable law, regulations, provisions of or governing deposited securities and terms of the deposit agreement and the ADRs, as it may deem necessary or proper; and |
| • | compliance with such regulations as the depositary may establish consistent with the deposit agreement. |
The issuance of ADRs, the acceptance of deposits of shares, the registration, registration of transfer,split-up or combination of ADRs or the withdrawal of shares, may be suspended, generally or in particular instances, when the ADRs register or any register for deposited securities is closed or when any such action is deemed advisable by the depositary; provided that the ability to withdrawal shares may only be limited under the following circumstances: (i) temporary delays caused by closing transfer books of the depositary or our transfer books or the deposit of shares in connection with voting at a shareholders’ meeting, or the payment of dividends, (ii) the payment of fees, taxes, and similar charges, and (iii) compliance with any laws or governmental regulations relating to ADRs or to the withdrawal of deposited securities.
The deposit agreement expressly limits the obligations and liability of the depositary, ourselves and our respective agents. Neither we nor the depositary nor any such agent will be liable if:
| • | any present or future law, rule, regulation, fiat, order or decree of the United States, the Cayman Islands, the People’s Republic of China (for this section only, including the Hong Kong Special Administrative Region) or any other country, or of any governmental or regulatory authority or securities exchange or market or automated quotation system, the provisions of or governing any deposited securities, any present or future provision of our charter, any act of God, war, terrorism or other circumstance beyond our, the depositary’s or our respective agents’ control shall prevent, delay or subject to any civil or criminal penalty, any act which the deposit agreement or the ADRs provide shall be done or performed by us, the depositary or our respective agents (including, without limitation, voting); | |
| • | it exercises or fails to exercise discretion under the deposit agreement or the ADR; | |
| • | it performs its obligations under the deposit agreement and ADRs without gross negligence or bad faith; | |
| • | it takes any action or refrains from taking any action in reliance upon the advice of or information from legal counsel, accountants, any person presenting shares for deposit, any registered holder of ADRs, or any other person believed by it to be competent to give such advice or information; or | |
| • | it relies upon any written notice, request, direction or other document believed by it to be genuine and to have been signed or presented by the proper party or parties. |
Neither the depositary nor its agents have any obligation to appear in, prosecute or defend any action, suit or other proceeding in respect of any deposited securities or the ADRs. We and our agents shall only be obligated to appear in, prosecute or defend any action, suit or other proceeding in respect of any deposited securities or the ADRs, which in our opinion may involve us in expense or liability, if indemnity satisfactory to us against all expense (including fees and disbursements of counsel) and liability is furnished as often as may be required. The depositary and its agents may fully respond to any and all demands or requests for information maintained by or on its behalf in connection with the deposit agreement, any registered holder or holders of ADRs, any ADRs or otherwise related to the deposit agreement or ADRs to the extent such information is requested or required by or pursuant to any lawful authority, including without limitation laws, rules, regulations, administrative or judicial process, banking, securities or other regulators. The depositary shall not be liable for the acts or omissions made by any securities depository, clearing agency or settlement system in connection with or arising out of book-entry settlement of deposited securities or otherwise. Furthermore, the depositary shall not be responsible for, and shall incur no liability in connection with or arising from, the insolvency of any custodian that is not a branch or affiliate of JPMorgan Chase Bank, N.A.
Additionally, none of us, the depositary or the custodian shall be liable for the failure by any registered holder of ADRs or beneficial owner therein to obtain the benefits of credits on the basis ofnon-U.S. tax paid
137
Table of Contents
against such holder’s or beneficial owner’s income tax liability. Neither we nor the depositary shall incur any liability for any tax consequences that may be incurred by holders or beneficial owners on account of their ownership of ADRs or ADSs.
Neither the depositary nor its agents will be responsible for any failure to carry out any instructions to vote any of the deposited securities, for the manner in which any such vote is cast or for the effect of any such vote. Neither the depositary nor any of its agents shall be liable to registered holders of ADRs or beneficial owners of interests in ADSs for any indirect, special, punitive or consequential damages (including, without limitation, lost profits) of any form incurred by any person or entity, whether or not foreseeable and regardless of the type of action in which such a claim may be brought.
The depositary may own and deal in any class of our securities and in ADSs.
Disclosure of Interest in ADSs
To the extent that the provisions of or governing any deposited securities may require disclosure of or impose limits on beneficial or other ownership of deposited securities, other shares and other securities and may provide for blocking transfer, voting or other rights to enforce such disclosure or limits, you agree to comply with all such disclosure requirements and ownership limitations and to comply with any reasonable instructions we may provide in respect thereof. We reserve the right to instruct you to deliver your ADSs for cancellation and withdrawal of the deposited securities so as to permit us to deal with you directly as a holder of shares and, by holding an ADS or an interest therein, you will be agreeing to comply with such instructions.
Books of Depositary
The depositary or its agent will maintain a register for the registration, registration of transfer, combination andsplit-up of ADRs, which register shall include the depositary’s direct registration system. Registered holders of ADRs may inspect such records at the depositary’s office at all reasonable times, but solely for the purpose of communicating with other holders in the interest of the business of our company or a matter relating to the deposit agreement. Such register may be closed from time to time, when deemed expedient by the depositary.
The depositary will maintain facilities for the delivery and receipt of ADRs.
Pre-release of ADSs
In its capacity as depositary, the depositary shall not lend shares or ADSs; provided, however, that the depositary may (i) issue ADSs prior to the receipt of shares and (ii) deliver shares prior to the receipt of ADSs for withdrawal of deposited securities, including ADSs which were issued under (i) above but for which shares may not have been received (each such transaction a “pre-release”). The depositary may receive ADSs in lieu of shares under (i) above (which ADSs will promptly be canceled by the depositary upon receipt by the depositary) and receive shares in lieu of ADSs under (ii) above. Each such pre-release will be subject to a written agreement whereby the person or entity (the “applicant”) to whom ADSs or shares are to be delivered (a) represents that at the time of the pre-release the applicant or its customer owns the shares or ADSs that are to be delivered by the applicant under such pre-release, (b) agrees to indicate the depositary as owner of such shares or ADSs in its records and to hold such shares or ADSs in trust for the depositary until such shares or ADSs are delivered to the depositary or the custodian, (c) unconditionally guarantees to deliver to the depositary or the custodian, as applicable, such shares or ADSs, and (d) agrees to any additional restrictions or requirements that the depositary deems appropriate. Each such pre-release will be at all times fully collateralized with cash, U.S. government securities or such other collateral as the depositary deems appropriate, terminable by the depositary on not more than five (5) business days’ notice and subject to such further indemnities and credit regulations as the depositary deems appropriate. The depositary will normally limit the number of ADSs and shares involved in such pre-release at any one time to thirty percent (30%) of the ADSs outstanding (without giving effect to ADSs outstanding under (i) above), provided, however, that the depositary reserves the right to change or disregard such limit from time to time as it deems appropriate. The
138
Table of Contents
depositary may also set limits with respect to the number of ADSs and shares involved in pre-release with any one person on acase-by-case basis as it deems appropriate. The depositary may retain for its own account any compensation received by it in conjunction with the foregoing. Collateral provided pursuant to (b) above, but not the earnings thereon, shall be held for the benefit of the registered holders of ADRs (other than the applicant).
Appointment
In the deposit agreement, each registered holder of ADRs and each person holding an interest in ADSs, upon acceptance of any ADSs (or any interest therein) issued in accordance with the terms and conditions of the deposit agreement will be deemed for all purposes to:
| • | be a party to and bound by the terms of the deposit agreement and the applicable ADR or ADRs, and | |
| • | appoint the depositary its attorney-in-fact, with full power to delegate, to act on its behalf and to take any and all actions contemplated in the deposit agreement and the applicable ADR or ADRs, to adopt any and all procedures necessary to comply with applicable laws and to take such action as the depositary in its sole discretion may deem necessary or appropriate to carry out the purposes of the deposit agreement and the applicable ADR and ADRs, the taking of such actions to be the conclusive determinant of the necessity and appropriateness thereof. |
Governing Law
The deposit agreement and the ADRs shall be governed by and construed in accordance with the laws of the State of New York. In the deposit agreement, we have submitted to the jurisdiction of the courts of the State of New York and appointed an agent for service of process on our behalf.
139
Table of Contents
SHARES ELIGIBLE FOR FUTURE SALE
Upon completion of this offering, we will have outstanding 12,000,000 ADSs, representing approximately 16.1% of our common shares in issue. All of the ADSs sold in this offering will be freely transferable by persons other than our “affiliates” without restriction or further registration under the Securities Act. Sales of substantial amounts of our ADSs in the public market could adversely affect prevailing market prices of our ADSs. Prior to this offering, there has been no public market for our common shares or the ADSs, and although our ADSs have been approved for listing on the New York Stock Exchange, we cannot assure you that a regular trading market will develop in the ADSs. We do not expect that a trading market will develop for our common shares not represented by the ADSs.
Lock-Up Agreements
We have agreed that we will not offer, sell, contract to sell, pledge or otherwise dispose of, directly or indirectly, or file with the SEC a registration statement under the Securities Act relating to, any ADSs or shares of common shares, or publicly disclose the intention to make any offer, sale, pledge, disposition or filing, without the prior written consent of the representatives for a period of 180 days after the date of this prospectus, except issuances pursuant to the exercise of employee stock options outstanding on the date hereof or pursuant to our dividend reinvestment plan.
Our officers, directors and existing shareholders have agreed that they will not offer, sell, contract to sell, pledge or otherwise dispose of, directly or indirectly, any ADSs or shares of common shares or securities convertible into or exchangeable or exercisable for any ADSs or shares of common shares, enter into a transaction that would have the same effect, or enter into any swap, hedge or other arrangement that transfers, in whole or in part, any of the economic consequences of ownership of our ADSs, whether any of these transactions are to be settled by delivery of our ADSs or other securities, in cash or otherwise, or publicly disclose the intention to make any offer, sale, pledge or disposition, or to enter into any transaction, swap, hedge or other arrangement, without, in each case, the prior written consent of the representatives for a period of 180 days after the date of this prospectus. After the expiration of the180-day period, the common shares or ADSs held by our directors, executive officers or existing shareholders may be sold subject to the restrictions under Rule 144 under the Securities Act or by means of registered public offerings.
The180-daylock-up period is subject to adjustment under certain circumstances. If in the event that either (1) during the last 17 days of the“lock-up” period, we release earnings results or material news or a material event relating to us occurs or (2) prior to the expiration of the“lock-up” period, we announce that we will release earnings results during the16-day period beginning on the last day of the“lock-up” period, then in either case the expiration of the“lock-up” will be extended until the expiration of the18-day period beginning on the date of the release of the earnings results or the occurrence of the material news or event, as applicable, unless the representatives waive, in writing, such an extension.
The restrictions described in the preceding paragraphs will be automatically extended under certain circumstances. See “Underwriting.”
Other than this offering, we are not aware of any plans by any significant shareholders to dispose of significant numbers of our ADSs or common shares. However, one or more existing shareholders or owners of securities convertible or exchangeable into or exercisable for our ADSs or common shares may dispose of significant numbers of our ADSs or common shares. We cannot predict what effect, if any, future sales of our ADSs or common shares, or the availability of ADSs or common shares for future sale, will have on the trading price of our ADSs from time to time. Sales of substantial amounts of our ADSs or common shares in the public market, or the perception that these sales could occur, could adversely affect the trading price of our ADSs.
Rule 144
All of our common shares outstanding prior to this offering are “restricted securities” as that term is defined in Rule 144 under the Securities Act and may be sold publicly in the United States only if they are
140
Table of Contents
subject to an effective registration statement under the Securities Act or pursuant to an exemption from the registration requirement such as those provided by Rule 144 and Rule 701 promulgated under the Securities Act. In general, under Rule 144 as currently in effect, beginning 90 days after the date of this prospectus, a person (or persons whose shares are aggregated) who at the time of a sale is not, and has not been during the three months preceding the sale, an affiliate of us and has beneficially owned our restricted securities for at least six months will be entitled to sell the restricted securities without registration under the Securities Act, subject only to the availability of current public information about us, and will be entitled to sell restricted securities beneficially owned for at least one year without restriction. Persons who are our affiliates and have beneficially owned our restricted securities for at least six months may sell within any three-month period a number of restricted securities that does not exceed the greater of the following:
| • | 1% of the number of our common shares then outstanding, in the form of ADSs or otherwise, which will equal approximately 1.49 million shares immediately after this offering, assuming the underwriters do not exercise their over-allotment option; and | |
| • | the average weekly trading volume of our ADSs on the New York Stock Exchange during the four calendar weeks preceding the date on which notice of the sale is filed with the SEC. |
Sales by our affiliates under Rule 144 are also subject to certain requirements relating to manner of sale, notice and the availability of current public information about us.
Rule 701
In general, under Rule 701 under the Securities Act as currently in effect, each of our employees, consultants or advisors who purchases our common shares from us in connection with a compensatory stock plan or other written agreement executed prior to the completion of this offering is eligible to resell such common shares in reliance on Rule 144 under the Securities Act, but without compliance with some of the restrictions, including the holding period, contained in Rule 144 under the Securities Act. However, the Rule 701 shares would remain subject tolock-up arrangements and would only become eligible for sale when thelock-up period expires.
Registration Rights
Upon completion of this offering, certain holders of our common shares or their transferees will be entitled to request that we register their shares under the Securities Act, following the expiration of thelock-up agreements described above. See “Description of Share Capital—Shareholders’ Agreement and Registration Rights.”
141
Table of Contents
TAXATION
The following summary of the material Cayman Islands, People’s Republic of China and United States federal income tax consequences of an investment in our ADSs or common shares is based upon laws and relevant interpretations thereof in effect as of the date of this registration statement, all of which are subject to change. This summary does not deal with all possible tax consequences relating to an investment in our ADSs or common shares, such as the tax consequences under state, local and other tax laws. To the extent that the discussion relates to matters of Cayman Islands tax law, it is the opinion of Maples and Calder, our special Cayman Islands counsel; to the extent it relates to PRC tax law, it is the opinion of Tian Yuan Law Firm, our special PRC counsel; and to the extent that it sets forth specific legal conclusions under United States federal income tax law, except as otherwise provided, it represents the opinion of Skadden, Arps, Slate, Meagher & Flom LLP, our special United States counsel.
Cayman Islands Taxation
The Cayman Islands currently levies no taxes on individuals or corporations based upon profits, income, gains or appreciation and there is no taxation in the nature of inheritance tax or estate duty. There are no other taxes likely to be material to us levied by the Government of the Cayman Islands except for stamp duties which may be applicable on instruments executed in, or brought within the jurisdiction of the Cayman Islands. The Cayman Islands is not party to any double tax treaties. There are no exchange control regulations or currency restrictions in the Cayman Islands.
People’s Republic of China Taxation
PRC EIT Law
Under the PRC EIT Law, an enterprise established outside of China with “de facto management body” within China is considered a “resident enterprise,” meaning that it can be treated in a manner similar to a Chinese enterprise for enterprise income tax purposes, although the dividends paid to one resident enterprise from another may qualify as “tax-exempt income.” The implementing rules of the EIT Law define de facto management as “substantial and overall management and control over the production and operations, personnel, accounting, and properties” of the enterprise. A circular issued by the State Administration of Taxation on April 22, 2009 provides that a foreign enterprise controlled by a PRC company or a PRC company group will be classified as a “resident enterprise” with its “de facto management body” located within China if the following requirements are satisfied: (i) the senior management and core management departments in charge of its daily operations function are mainly in the PRC; (ii) its financial and human resources decisions are subject to determination or approval by persons or bodies in the PRC; (iii) its major assets, accounting books, company seals, and minutes and files of its board and shareholders’ meetings are located or kept in the PRC; and (iv) at least half of the enterprise’s directors with voting right or senior management reside in the PRC.
Based on the advice of our PRC counsel, Tian Yuan Law Firm, we do not believe that either TAL Group or Xueersi Hong Kong meets all of the conditions above. Each of TAL Group and Xueersi Hong Kong is a company incorporated outside the PRC. As holding companies, these two entities’ key assets and records, including resolutions of its board of directors and resolutions of its shareholders, are located and maintained outside of the PRC. In addition, we are not aware of any offshore holding companies with a similar corporate structure as ours ever having been deemed to be PRC “resident enterprises” by the PRC tax authorities. Therefore, based on our PRC counsel’s advice, we believe that neither TAL Group nor Xueersi Hong Kong should be treated as a “resident enterprise” for PRC tax purposes. However, as the tax resident status of an enterprise is subject to determination by the PRC tax authorities, there are uncertainties and risks associated with this issue. If the PRC tax authorities determine that TAL Group and Xueersi Hong Kong are “resident enterprises,” a number of unfavorable PRC tax consequences could follow. First, we may be subject to enterprise income tax at a rate of 25% on our worldwide taxable income. Second, although under the EIT Law and its implementing rules, dividend income between qualified resident enterprises is a “tax-exempt income,” we cannot guarantee that dividends paid to TAL Group from our PRC subsidiaries through Xueersi Hong
142
Table of Contents
Kong would qualify as “tax-exempt income” and will not be subject to withholding tax, as the PRC foreign exchange control authorities, which enforce the withholding tax, have not yet issued guidance with respect to the processing of outbound remittances to entities that are treated as “resident enterprises” for PRC enterprise income tax purposes. Finally, the new “resident enterprise” classification could result in a situation in which a 10% withholding tax is imposed on dividends we pay to our non-PRC enterprise shareholders and with respect to gains derived by our non-PRC enterprise shareholders from transferring our shares or ADSs, if such income is considered PRC-sourced income by the relevant PRC authorities. This could have the effect of increasing our and our shareholders’ effective income tax rates and may require us to deduct withholding tax from any dividends we pay to our non-PRC shareholders.
In addition to the uncertainty in how the new “resident enterprise” classification could apply, it is also possible that the rules may change in the future, possibly with retroactive effect. We are actively monitoring the possibility of “resident enterprise” treatment for the 2011 tax year and are evaluating appropriate organizational changes to avoid this treatment, to the extent possible.
Circular on Strengthening the Administration of Enterprise Income Tax for Share Transfer by Non-PRC Resident Enterprises
Pursuant to the Notice on Strengthening Administration of Enterprise Income Tax for Share Transfers by Non-PRC Resident Enterprises, or Circular 698, issued by the State Administration of Taxation on December 10, 2009, where a foreign investor transfers the equity interests of a PRC resident enterprise indirectly via disposing of the equity interests of an overseas holding company, or an “Indirect Transfer,” and such overseas holding company is located in a tax jurisdiction that: (i) has an effective tax rate less than 12.5% or (ii) does not tax foreign income of its residents, the foreign investor shall report this Indirect Transfer to the competent tax authority. The PRC tax authority will examine the true nature of the Indirect Transfer, and if the tax authority considers that the foreign investor has adopted an “abusive arrangement” in order to avoid PRC tax, it may disregard the existence of the overseas holding company and re-characterize the Indirect Transfer and as a result, gains derived from such Indirect Transfer may be subject to PRC withholding tax at a rate of up to 10%. Circular 698 also provides that, where a non-PRC resident enterprise transfers its equity interests in a PRC resident enterprise to its related parties at a price lower than the fair market value, the competent tax authority has the power to make a reasonable adjustment to the taxable income of the transaction. Circular 698 is retroactively effective from January 1, 2008. The relevant PRC authority has not yet promulgated any formal provisions or formally declared or stated how to calculate the effective tax in a foreign jurisdiction and how a foreign investor shall report to the competent tax authority this Indirect Transfer. Since Circular 698 was newly promulgated, there are uncertainties as to its application. It is possible that we or our non-resident investors may become at risk of being taxed under Circular 698 and may be required to expend valuable resources to comply with Circular 698 or to establish that we or our non-resident investors should not be taxed under Circular 698, which may have an adverse effect on our financial condition and results of operations or such non-resident investor’s investment in us.
Material United States Federal Income Tax Considerations
The following is a summary of the material United States federal income tax consequences of the purchase, ownership and disposition of our ADSs or common shares by a U.S. Holder described below that will hold our ADSs or common shares as “capital assets” (generally, property held for investment) under the United States Internal Revenue Code of 1986, as amended (the “U.S. Tax Code”). This summary is based upon existing United States federal income tax law, which is subject to differing interpretations or change, possibly with retroactive effect. This summary does not discuss all aspects of United States federal income taxation that may be important to particular investors in light of their individual investment circumstances, including investors subject to special tax rules (for example, financial institutions, insurance companies, broker-dealers, traders in securities that electmark-to-market treatment, partnerships and their partners, pension plans, regulated investment companies, real estate investment trusts, cooperatives, and tax-exempt organizations (including private foundations)), holders who are not U.S. Holders, holders who own (directly, indirectly, or constructively) 10% or more of our voting stock, investors that will hold their ADSs or common
143
Table of Contents
shares as part of a straddle, hedge, conversion, constructive sale, or other integrated transaction for United States federal income tax purposes, U.S. expatriates, persons liable for alternative minimum tax, or investors that have a functional currency other than the United States dollar, all of whom may be subject to tax rules that differ significantly from those summarized below. In addition, this summary does not discuss anynon-United States, state, or local, or estate or gift tax considerations. Each U.S. Holder is urged to consult its tax advisor regarding the United States federal, state, local, andnon-United States income and other tax considerations of an investment in our ADSs or common shares.
General
For purposes of this summary, a “U.S. Holder” is a beneficial owner of our ADSs or common shares that is, for United States federal income tax purposes, (i) an individual who is a citizen or resident of the United States, (ii) a corporation (or other entity treated as a corporation for United States federal income tax purposes) created in, or organized under the law of, the United States or any state thereof or the District of Columbia, (iii) an estate the income of which is includible in gross income for United States federal income tax purposes regardless of its source, or (iv) a trust (A) the administration of which is subject to the primary supervision of a United States court and which has one or more United States persons who have the authority to control all substantial decisions of the trust or (B) that has otherwise elected to be treated as a United States person under the U.S. Tax Code.
If a partnership (including any entity treated as a partnership for United States federal income tax purposes) is a beneficial owner of our ADSs or common shares, the tax treatment of a partner in the partnership will generally depend upon the status of the partner and the activities of the partnership. Partners of a partnership holding our ADSs or common shares are urged to consult their tax advisors regarding an investment in our ADSs or common shares.
Based in part on the parties complying with the deposit agreement, for United States federal income tax purposes, a U.S. Holder of ADSs will be treated as the beneficial owner of the underlying shares represented by the ADSs. U.S. Holders should be aware, however, that the U.S. Treasury has expressed concerns that parties to whom ADSs are pre-released before shares are delivered to the depositary, or intermediaries in the chain of ownership between holders of ADSs and the issuer of the security underlying the ADSs, may be taking actions that are inconsistent with the claiming of foreign tax credits by holders of ADSs. These actions would also be inconsistent with the claiming of the reduced rate of tax, described below, applicable to dividends received by certain non-corporate holders. Accordingly, the creditability of any PRC taxes, and the availability of the reduced tax rate for dividends received by certain non-corporate U.S. Holders, each described below, could be affected by actions taken by such parties or intermediaries.
PFIC Considerations
Anon-United States corporation, such as our company, will be classified as a PFIC, for United States federal income tax purposes for any taxable year, if either (i) at least 75% of its gross income for such year consists of certain types of “passive” income or (ii) at least 50% of the value of its assets (determined on the basis of a quarterly average) during such year is attributable to assets that produce or are held for the production of passive income. For this purposes, passive income means any income which would be foreign personal holding company income under the U.S. Tax Code, including, without limitation, dividends, interest, royalties, rent, annuities, net gains from the sale or exchange of property producing such income, net gains from commodity transactions, net foreign currency gains and income from notional principal contracts. For this purpose, cash is categorized as a passive asset and the company’s unbooked intangibles are taken into account for determining the value of its assets. We will be treated as owning a proportionate share of the assets and earning a proportionate share of the income of any other corporation in which we own, directly or indirectly, more than 25% (by value) of the stock.
Although the law in this regard is unclear, we treat Xueersi Education, Xueersi Network and their respective subsidiaries as being owned by us for United States federal income tax purposes, not only because we control their management decisions but also because we are entitled to substantially all of the economic
144
Table of Contents
benefits associated with these entities, and, as a result, we consolidate these entities’ results of operations in our consolidated, U.S. GAAP financial statements. If it were determined, however, that we are not the owner of Xueersi Education, Xueersi Network and their respective subsidiaries for United States federal income tax purposes, we would likely be treated as a PFIC for our taxable year ending on February 28, 2011 and any subsequent taxable year.
Accordingly, assuming that we are the owner of Xueersi Education, Xueersi Network and their respective subsidiaries for United States federal income tax purposes, we believe that we primarily operate an active after-school tutoring business in China and do not expect to be a PFIC for the current taxable year. Our expectation is based on assumptions as to our projections of the value of our ADSs and outstanding common shares during the year and our use of the proceeds from this offering the initial public offering of our ADSs and of the other cash that we will hold and generate in the ordinary course of our business throughout the current taxable year. Despite our expectation, there can be no assurance that we will not be a PFIC for the current taxable yearand/or later taxable years, as PFIC status is retested each year and depends on the actual facts in such year. We could be a PFIC, for example, if we do not spend sufficient amounts of the proceeds from this offering, if our market capitalization at any time in the future is lower than projected, or if our business and assets evolve in ways that are different from what we currently anticipate. In addition, though we generally believe that our assets and the income derived from our assets do not generally constitute passive assets and income under the PFIC rules, there is no assurance that the U.S. Internal Revenue Service will agree with us. As they are inherently factual matters that cannot be determined until the close of any applicable taxable year, our special U.S. counsel expresses no opinion with respect to our expectations contained in this paragraph.
Furthermore, because there are uncertainties in the application of the relevant rules, it is possible that the Internal Revenue Service may successfully challenge our classification of certain income and assets as non-passive or our valuation of our tangible and intangible assets, each of which may result in our company becoming classified as a PFIC for the current or subsequent taxable years. Because PFIC status is a fact-intensive, we will make a separate determination for each taxable year as to whether we are a PFIC (after the close of each taxable year) on the basis of the composition of our assets and income and the value of our tangible and intangible assets. In connection with filing an annual report with the U.S. Securities and Exchange Commission, we expect to disclose to our shareholders whether or not we or our subsidiaries were and expect to be a PFIC for the relevant year. Accordingly, no assurance can be given that we are not or will not become classified as a PFIC. If we are classified as a PFIC for any year during which a U.S. Holder held our ADSs or common shares, we generally would continue to be treated as a PFIC for all succeeding years during which such U.S. Holder held our ADSs or common shares.
The discussion below under “Dividends” and “Sale or Other Disposition of ADSs or Common Shares” assumes that we will not be classified as a PFIC for United States federal income tax purposes. The U.S. federal income tax rules that apply if we are classified as a PFIC for the current taxable year or any subsequent taxable year are generally discussed below under “PFIC Rules.”
Dividends
Subject to the PFIC rules discussed below, any cash distributions (including the amount of any PRC tax withheld) paid on our ADSs or common shares out of our current or accumulated earnings and profits, as determined under United States federal income tax principles, will generally be includible in the gross income of a U.S. Holder as dividend income on the day actually or constructively received by the U.S. Holder, in the case of common shares, or by the Depositary, in the case of ADSs. Because we do not intend to determine our earnings and profits on the basis of United States federal income tax principles, any distribution paid will generally be treated as a “dividend” for United States federal income tax purposes. Subject to the discussion above regarding concerns expressed by the U.S. Treasury, for taxable years beginning before January 1, 2011, a non-corporate recipient of dividend income generally will be subject to tax on dividend income from a “qualified foreign corporation” at a reduced United States federal tax rate rather than the marginal tax rates generally applicable to ordinary income provided that certain holding period requirements are met—generally, 61 days of ownership without risk of loss reduction during the 121 day period beginning 60 days before the
145
Table of Contents
ex-dividend date. U.S. Holders should consult their tax advisors regarding the availability of the reduced tax rate on dividends in their particular circumstances. Dividends received on our ADSs or common shares will not be eligible for the dividends received deduction allowed to corporations under the U.S. Tax Code.
Anon-United States corporation (other than a corporation that is classified as a PFIC for the taxable year in which the dividend is paid or the preceding taxable year) generally will be considered to be a qualified foreign corporation (i) if it is eligible for the benefits of a comprehensive tax treaty with the United States which the Secretary of Treasury of the United States determines is satisfactory for purposes of this provision and which includes an exchange of information program, or (ii) with respect to any dividend it pays on stock (or ADSs in respect of such stock) which is readily tradable on an established securities market in the United States. The U.S. Treasury Department has determined that the Agreement Between the Government of the United States of America and the Government of the People’s Republic of China for the Avoidance of Double Taxation and the Prevention of Tax Evasion with respect to Taxes on Income (“Treaty”) meets the requirements described above. As our ADSs have been approved for listing on the New York Stock Exchange, we believe that we will be a qualified foreign corporation for United States federal income tax purposes because the ADSs would be readily tradable on the New York Stock Exchange, which is an established securities market in the United States. In addition, in the event that we are deemed to be a resident enterprise under the EIT Law, as discussed above under “Taxation — People’s Republic of China Taxation,” we believe that we would qualify for the benefits under the Treaty and that we are not currently and are not likely to become in the near future, a PFIC. However, the eligibility requirements for foreign corporations are technical and uncertain and therefore, each U.S. Holder is urged to consult its tax advisor regarding the impact of these provisions and the availability of the preferential rate in their particular circumstances.
Dividends generally will be treated as income from foreign sources for United States foreign tax credit purposes and generally will constitute passive category income. In the event that we are deemed to be a PRC “resident enterprise” under the EIT Law, a U.S. Holder may be subject to PRC withholding taxes on dividends paid, if any, on our ADSs or common shares. See “Taxation — People’s Republic of China Taxation.” Depending on the U.S. Holder’s individual facts and circumstances, the U.S. Holder may be eligible to claim a foreign tax credit in respect of any foreign withholding taxes imposed on dividends received on our ADSs or common shares. A U.S. Holder who does not elect to claim a foreign tax credit for foreign tax withheld is permitted instead to claim a deduction, for United States federal income tax purposes, in respect of such withholdings, but only for a year in which such holder elects to do so for all creditable foreign income taxes. The rules governing the foreign tax credit are complex and their outcome depends in large part on the taxpayer’s individual facts and circumstances. Each U.S. Holder is urged to consult its tax advisors regarding the availability of the foreign tax credit under their particular circumstances.
Sale or Other Disposition of ADSs or Common Shares
Subject to the PFIC rules discussed below, a U.S. Holder will generally recognize capital gain or loss upon the sale or other disposition of ADSs or common shares in an amount equal to the difference between the amount realized upon the disposition and the U.S. Holder’s adjusted tax basis in such ADSs or common shares. Any capital gain or loss will be long-term if the ADSs or common shares have been held for more than one year and will generally be United States source gain or loss for United States foreign tax credit purposes. In the event that we are deemed to be a “resident enterprise” under the EIT Law and gain from the disposition of the ADSs or common shares is subject to tax in the PRC, such gain may be treated as PRC source gain for foreign tax credit purposes under the Treaty. If such gain is not treated as PRC source gain, however, a U.S. Holder generally will not be able to obtain a United States foreign tax credit for any PRC tax withheld or imposed unless such U.S. Holder has other foreign source income in the appropriate category for the applicable tax year. Net long-term capital gains of non-corporate U.S. Holders currently are eligible for reduced rates of taxation. The deductibility of a capital loss may be subject to limitations. Each U.S. Holder is urged to consult its tax advisors regarding the tax consequences if a foreign tax is imposed on a disposition of our ADSs or common shares, including the availability of the foreign tax credit under their particular circumstances.
146
Table of Contents
PFIC Rules
If we are classified as a PFIC for any taxable year during which a U.S. Holder holds our ADSs or common shares, unless the U.S. Holder makes amark-to-market election (as described below), the U.S. Holder will generally be subject to special tax rules that have a penalizing effect, regardless of whether we remain a PFIC, on (i) any excess distribution that we make to the U.S. Holder (which generally means any distribution paid during a taxable year to a U.S. Holder that is greater than 125% of the average annual distributions paid in the three preceding taxable years or, if shorter, the U.S. Holder’s holding period for the ADSs or common shares), and (ii) any gain realized on the sale or other disposition, including, under certain circumstances, a pledge, of ADSs or common shares. Under the PFIC rules the:
| • | excess distributionand/or gain will be allocated ratably over the U.S. Holder’s holding period for the ADSs or common shares; | |
| • | amount allocated to the current taxable year and any taxable years in the U.S. Holder’s holding period prior to the first taxable year in which we are classified as a PFIC, or pre-PFIC year, will be taxable as ordinary income; | |
| • | amount allocated to each prior taxable year, other than the current taxable year or a pre-PFIC year, will be subject to tax at the highest tax rate in effect applicable to the U.S. Holder for that year; and | |
| • | interest charge generally applicable to underpayments of tax will be imposed on the tax attributable to each prior taxable year, other than the current taxable year or a pre-PFIC year. |
If we are a PFIC for any taxable year during which a U.S. Holder holds our ADSs or common shares and any of ournon-United States subsidiaries is also a PFIC (i.e., a lower-tier PFIC), such U.S. Holder would be treated as owning a proportionate amount (by value) of the shares of the lower-tier PFIC and would be subject to the rules described above on certain distributions by a lower-tier PFIC and a disposition of shares of a lower-tier PFIC even though such U.S. Holder would not receive the proceeds of those distributions or dispositions. Each U.S. Holder is urged to consult its tax advisors regarding the application of the PFIC rules to any of our subsidiaries.
As an alternative to the foregoing rules, a U.S. Holder of “marketable stock” in a PFIC may make amark-to-market election with respect to our ADSs, but not our common shares, provided that the ADSs are, as expected, listed on the New York Stock Exchange and that the ADSs are regularly traded. We anticipate that our ADSs should qualify as being regularly traded, but no assurances may be given in this regard. If a U.S. Holder makes this election, the U.S. Holder will generally (i) include as ordinary income for each taxable year that we are a PFIC the excess, if any, of the fair market value of ADSs held at the end of the taxable year over the adjusted tax basis of such ADSs and (ii) deduct as an ordinary loss the excess, if any, of the adjusted tax basis of the ADSs over the fair market value of such ADSs held at the end of the taxable year, but only to the extent of the net amount previously included in income as a result of themark-to-market election. The U.S. Holder’s adjusted tax basis in the ADSs would be adjusted to reflect any income or loss resulting from themark-to-market election. If a U.S. Holder makes amark-to-market election in respect of a corporation classified as a PFIC and such corporation ceases to be classified as a PFIC, the U.S. Holder will not be required to take into account themark-to-market gain or loss described above during any period that such corporation is not classified as a PFIC. If a U.S. Holder makes amark-to-market election, any gain such U.S. Holder recognizes upon the sale or other disposition of our ADSs in a year when we are a PFIC will be treated as ordinary income and any loss will be treated as ordinary loss, but only to the extent of the net amount previously included in income as a result of themark-to-market election.
Because amark-to-market election cannot be made for any lower-tier PFICs that we may own, a U.S. Holder may continue to be subject to the PFIC rules with respect to such U.S. Holder’s indirect interest in any investments held by us that are treated as an equity interest in a PFIC for United States federal income tax purposes.
147
Table of Contents
We do not intend to provide information necessary for U.S. Holders to make qualified electing fund elections, which, if available, would result in tax treatment different from (and generally less adverse than) the general tax treatment for PFICs described above.
If a U.S. Holder owns our ADSs or common shares during any taxable year that we are a PFIC, the holder must file such reports as are required by the U.S. Treasury. In the case of a U.S. Holder who has held ADSs or common shares during any taxable year in respect of which we were classified as a PFIC and continues to hold such ADSs or common shares (or any portion thereof) and has not previously determined to make amark-to-market election, and who later considers making amark-to-market election, special tax rules may apply relating to purging the PFIC taint of such ADSs or common shares. Each U.S. Holder is urged to consult its tax advisor concerning the United States federal income tax consequences of purchasing, holding, and disposing ADSs or common shares if we are or become classified as a PFIC, including the possibility of making amark-to-market election and the unavailability of the QEF election.
Information Reporting and Backup Withholding
Pursuant to the Hiring Incentives to Restore Employment Act enacted on March 18, 2010, in taxable years beginning after the date of enactment, an individual U.S. Holder and certain entities may be required to submit to the Internal Revenue Service certain information with respect to his or her beneficial ownership of the ADSs or common shares, if such ADSs or common shares are not held on his or her behalf by a U.S. financial institution. This new law also imposes penalties if an individual U.S. Holder is required to submit such information to the Internal Revenue Service and fails to do so.
In addition, dividend payments with respect to the ADSs or common shares and proceeds from the sale, exchange or redemption of the ADSs or common shares may be subject to information reporting to the Internal Revenue Service and United States backup withholding. Backup withholding will not apply, however, to a U.S. Holder who furnishes a correct taxpayer identification number and makes any other required certification, or who is otherwise exempt from backup withholding. We will make, or cause to be made, all withholdings to the extent required by applicable law. Each U.S. Holder is urged to consult its tax advisors regarding the application of the United States information reporting and backup withholding rules. Backup withholding is not an additional tax. Amounts withheld as backup withholding may be credited against a U.S. Holder’s United States federal income tax liability, and a U.S. Holder generally may obtain a refund of any excess amounts withheld under the backup withholding rules by filing the appropriate claim for refund with the Internal Revenue Service in a timely manner and furnishing any required information.
148
Table of Contents
UNDERWRITING
Under the terms and subject to the conditions contained in an underwriting agreement dated the date of this prospectus, the underwriters named below, for whom Credit Suisse Securities (USA) LLC and Morgan Stanley & Co. International plc are acting as representatives, have severally agreed to purchase, and we have agreed to sell to them, the number of ADSs indicated in the table below:
Underwriters | Number of ADSs | |||
| Credit Suisse Securities (USA) LLC | 5,100,000 | |||
| Morgan Stanley & Co. International plc | 5,100,000 | |||
| Piper Jaffray & Co. | 900,000 | |||
| Oppenheimer & Co. Inc. | 900,000 | |||
| Total | 12,000,000 | |||
The underwriters are offering the ADSs subject to their acceptance of the ADSs from us and subject to prior sale. The underwriting agreement provides that the obligations of the several underwriters to pay for and accept delivery of the ADSs offered by this prospectus are subject to the approval of certain legal matters by their counsel and to certain other conditions. The underwriters are obligated, severally and not jointly, to take and pay for all of the ADSs offered by this prospectus if any such ADSs are taken. However, the underwriters are not required to take or pay for the ADSs covered by the underwriters’ over-allotment option described below. The underwriting agreement also provides that if an underwriter defaults, the purchase commitments of non-defaulting underwriters may be increased or the offering may be terminated.
The underwriters initially propose to offer part of the ADSs directly to the public at the public offering price listed on the cover page of this prospectus and part of the ADSs to certain dealers at a price that represents a concession not in excess of $0.42 per ADS under the public offering price. After the initial offering of the ADSs, the offering price and other selling terms may from time to time be varied by the representatives of the underwriters.
We have granted to the underwriters an option, exercisable for 30 days from the date of this prospectus, to purchase up to an aggregate of 1,800,000 additional ADSs at the public offering price listed on the cover page of this prospectus, less underwriting discounts and commissions. The underwriters may exercise this option solely for the purpose of covering over-allotments, if any, made in connection with the offering of the ADSs offered by this prospectus. To the extent the option is exercised, each underwriter will become obligated, subject to certain conditions, to purchase additional ADSs approximately proportionate to each underwriter’s initial amount reflected in the table above.
If the underwriters’ option is exercised in full, the total price to the public of all the ADSs sold would be $138.0 million, the total underwriting discounts and commissions would be approximately $9.7 million, the net proceeds to us would be approximately $127.6 million (after deducting the estimated offering expenses payable by us).
The following table shows the per ADS and total underwriting discounts and commissions to be paid by us in connection with this offering. These amounts are shown assuming both no exercise and full exercise of the underwriters’ over-allotment option.
| Per ADS | Total | |||||||||||||||
| No | Full | No | Full | |||||||||||||
Underwriting Discounts and Commissions To Be Paid by | Exercise | Exercise | Exercise | Exercise | ||||||||||||
| TAL Education Group | $ | 0.70 | $ | 0.70 | $ | 8,400,000 | $ | 9,660,000 | ||||||||
The expenses of this offering, not including underwriting discounts and commissions, are estimated to be approximately $2.2 million and certain amount of such expenses will be paid or reimbursed by the underwriters.
The underwriters have informed us that they do not intend sales to discretionary accounts to exceed five percent of the total number of ADSs offered by them.
149
Table of Contents
Some of the underwriters are expected to make offers and sales both inside and outside the United States through their respective selling agents. Any offers or sales in the United States will be conducted by broker-dealers registered with the SEC. We have been advised by the underwriters that Credit Suisse Securities (USA) LLC expects to make offers and sales outside the United States through its affiliate, Credit Suisse (Hong Kong) Limited, and that Morgan Stanley & Co. International plc expects to make offers and sales in the United States through its registered broker-dealer affiliate in the United States, Morgan Stanley & Co. Incorporated.
Our ADSs have been approved for listing on the New York Stock Exchange under the symbol “XRS.”
We have agreed that, without the prior written consent of the representatives on behalf of the underwriters, we will not, for a period of 180 days after the date of this prospectus:
| • | offer, pledge, sell, contract to sell, sell any option or contract to purchase, purchase any option or contract to sell, grant any option, right or warrant to purchase, lend or otherwise transfer or dispose of, directly or indirectly, any common shares or ADSs or any securities convertible into or exercisable or exchangeable for such common shares or ADSs or enter into a transaction which would have the same effect, or enter into any swap, hedge or other arrangement that transfers to another, in whole or in part, any of the economic consequences of ownership of the common shares or ADSs, whether any such transaction described above is to be settled by delivery of common shares or ADSs or such other securities, in cash or otherwise; | |
| • | file any registration statement with the SEC relating to the offering of any common shares or ADSs or any securities convertible into or exercisable or exchangeable for such common shares or ADSs; or | |
| • | publicly disclose the intention to make any such offer, pledge, sale or disposition, or enter into any such transaction, swap, hedge or other arrangement, or file any such registration statement. |
The restrictions described in the preceding paragraph do not apply to:
| • | the sale of common shares or ADSs to the underwriters; | |
| • | the issuance of common shares or the grant of options to purchase common shares under our share incentive plan; and | |
| • | the issuance by us of common shares upon the exercise of an option or a warrant or the conversion of a security outstanding on the date of this prospectus of which the underwriters have been advised in writing or which is otherwise described in this prospectus. |
Each of our directors, executive officers and all of our existing shareholders have agreed that, without the prior written consent of the representatives on behalf of the underwriters, he, she or it will not, for a period of 180 days after the date of this prospectus:
| • | offer, pledge, sell, contract to sell, sell any option or contract to purchase, purchase any option or contract to sell, grant any option, right or warrant to purchase, lend or otherwise transfer or dispose of, directly or indirectly, any common shares or ADSs or any securities convertible into or exercisable or exchangeable for such common shares or ADSs or enter into a transaction which would have the same effect, or enter into any swap, hedge or other arrangement that transfers to another, in whole or in part, any of the economic consequences of ownership of the common shares or ADSs, whether any such transaction described above is to be settled by delivery of common shares or ADSs or such other securities, in cash or otherwise; or | |
| • | publicly disclose the intention to make any such offer, pledge, sale or disposition, or enter into any such transaction, swap, hedge or other arrangement. |
The restrictions described in the preceding paragraph do not apply to transactions relating to common shares, ADSs or other securities acquired in open market transactions after the closing of this offering. In addition, the restrictions do not apply to transfers of common shares or ADSs to immediate family members of
150
Table of Contents
such persons, or trusts for the sole benefit of or entities wholly owned by such persons or their immediate family members, so long as the transferee agrees in writing to be bound by such restrictions and such transfers do not involve a disposition for value.
In addition, each of our directors, executive officers and all of our existing shareholders have agreed that, without the prior written consent of the representatives on behalf of the underwriters, he, she or it will not, for a period of 180 days after the date of this prospectus, make any demand for, or exercise any right with respect to, the registration of any common shares or ADSs or any securities convertible into or exercisable or exchangeable for common shares or ADSs.
The180-day restricted period described in the preceding paragraphs will be extended if:
| • | during the last 17 days of the180-day restricted period we issue an earnings release or material news or a material event relating to our company occurs; or | |
| • | prior to the expiration of the180-day restricted period, we announce that we will release earnings results during the16-day period beginning on the last day of the180-day period. |
In each of the above cases, the restrictions described in the preceding paragraph will continue to apply until the expiration of the18-day period beginning on the issuance of the earnings release or the occurrence of the material news or material event.
In order to facilitate the offering of ADSs, the underwriters may engage in transactions that stabilize, maintain or otherwise affect the price of the ADSs. Specifically, the underwriters may sell more ADSs than they are obligated to purchase under the underwriting agreement, creating a short position in our ADSs for their own account. A short sale is “covered” if the short position is no greater than the number of ADSs available for purchase by the underwriters under the over-allotment option. The underwriters can close out a covered short sale by exercising the over-allotment option or purchasing ADSs in the open market. In determining the source of ADSs to close out a covered short sale, the underwriters will consider, among other things, the open market price of ADSs compared to the price available under the over-allotment option. The underwriters may also sell ADSs in excess of the over-allotment option, creating a naked short position. The underwriters must close out any naked short position by purchasing ADSs in the open market. A naked short position is more likely to be created if the underwriters are concerned that there may be downward pressure on the price of our ADSs in the open market after pricing that could adversely affect investors who purchase in the offering. As an additional means of facilitating the offering, the underwriters may bid for, and purchase, our ADSs in the open market to stabilize the price of our ADSs. The underwriting syndicate may also reclaim selling concessions allowed to an underwriter or a dealer for distributing the ADSs in the offering, if the syndicate repurchases previously distributed ADSs to cover a syndicate short position or to stabilize the price of the ADSs. These activities may raise or maintain the market price of the ADSs above independent market levels. The underwriters are not required to engage in these activities, and may end any of these activities at any time.
From time to time, certain of the underwriters may provide investment banking and other services to us, our affiliates and employees, for which they will receive customary fees and commissions.
We have agreed to indemnify the underwriters against certain liabilities, including liabilities under the Securities Act, or contribute to payments that an indemnified person may be required to make in respect of any of these liabilities.
At our request, the underwriters have reserved for sale, at the initial public offering price, up to 5% of the total number of ADSs being offered in this prospectus (assuming no exercise of the over-allotment option) for our directors, officers, employees, business associates and related persons. Any sale to these persons will be made by Piper Jaffray & Co. through a directed share program. We do not know if these persons will choose to purchase all or any portion of these reserved ADSs, but any purchases they make will reduce the number of ADSs available for sale to the general public. Any reserved ADSs which are not so purchased will be offered by the underwriters to the general public on the same basis as the ADSs being offered in this prospectus.
151
Table of Contents
Tiger Global Management, LLC, an affiliate of our existing shareholder Tiger Global Five China Holdings, and KTB China Optimum Fund, our another existing shareholder, have subscribed for, and were allocated by the underwriters, 800,000 ADSs and 80,000 ADSs, respectively, in this offering at the initial public offering price and on the same terms as the other ADSs being offered in this offering. As a result, Tiger Global Five China Holdings and KTB China Optimum Fund will beneficially own 15.8% and 5.6%, respectively, of our total outstanding shares immediately upon the completion of this offering.
Credit Suisse Securities (USA) LLC’s address is Eleven Madison Avenue, New York, New York10010-3629. Morgan Stanley & Co. International plc’s address is 25 Cabot Square, Canary Wharf, London E14 4QA, United Kingdom. Piper Jaffray & Co.’s address is 800 Nicollet Mall, Suite 800, Minneapolis, Minnesota 55402. Oppenheimer & Co. Inc.’s address is 300 Madison Avenue, New York, New York 10017.
Pricing of the Offering
Prior to this offering, there has been no public market for our common shares or ADSs. The initial public offering price is determined by negotiations between us and the representatives of the underwriters. Among the factors considered in determining the initial public offering price are the future prospects of our company and our industry in general, our sales, earnings and certain other financial and operating information in recent periods, and the price-earnings ratios, price-sales ratios, market prices of securities and certain financial and operating information of companies engaged in activities similar to those of our company. The estimated initial public offering price range set forth on the cover of this preliminary prospectus is subject to change as a result of market conditions and other factors.
Electronic Offer, Sale and Distribution of ADSs
In connection with this offering, certain of the underwriters or securities dealers may distribute prospectuses by electronic means, such ase-mail. In addition, Credit Suisse Securities (USA) LLC and Morgan Stanley & Co. International plc may be facilitating Internet distribution for this offering to certain of their Internet subscription customers. An electronic prospectus may be available on the Internet websites maintained by Credit Suisse Securities (USA) LLC and Morgan Stanley & Co. International plc. Other than the prospectus in electronic format, the information on the websites of Credit Suisse Securities (USA) LLC and Morgan Stanley & Co. International plc is not part of this prospectus.
Selling Restrictions
The ADSs are offered for sale in those jurisdictions in the United States, Europe, Asia and elsewhere where it is lawful to make such offers.
No action has been taken in any jurisdiction (except in the United States) that would permit a public offering of the ADSs, or the possession, circulation or distribution of this prospectus or any other material relating to us or the ADSs in any jurisdiction where action for that purpose is required. Accordingly, the ADSs may not be offered or sold, directly or indirectly, and neither this prospectus nor any other offering material relating to the ADSs may be distributed or published, in or from any jurisdiction except under circumstances that will result in compliance with the applicable laws and regulations thereof.
European Economic Area.In relation to each member state of the European Economic Area which has implemented the Prospectus Directive, which we refer to as a Relevant Member State, with effect from and including the date on which the Prospectus Directive is implemented in that Relevant Member State, which we refer to as the Relevant Implementation Date, no offer of ADSs has been made and or will be made to the public in that Relevant Member State prior to the publication of a prospectus in relation to the ADSs which has been approved by the competent authority in that Relevant Member State or, where appropriate, approved in another Relevant Member State and notified to the competent authority in that Relevant Member State, all in accordance with the Prospectus Directive, except that, with effect from and including the Relevant Implementation Date, an offer of ADSs may be made to the public in that Relevant Member State at any time: (a) to legal entities which are authorized or regulated to operate in the financial markets or, if not so authorized or regulated, whose corporate purpose is solely to invest in securities; (b) to any legal entity which
152
Table of Contents
has two or more of (i) an average of at least 250 employees during the last financial year; (ii) a total balance sheet of more than €43,000,000 and (iii) an annual net turnover of more than €50,000,000, as shown in its last annual or consolidated accounts; or (c) in any other circumstances which do not require the publication by us of a prospectus pursuant to Article 3 of the Prospectus Directive. For the purposes of this provision, the expression an “offer of ADSs to the public” in relation to any ADSs in any Relevant Member State means the communication in any form and by any means of sufficient information on the terms of the offer and the ADSs to be offered so as to enable an investor to decide to purchase or subscribe the ADSs, as the same may be varied in that Relevant Member State by any measure implementing the Prospectus Directive in that Relevant Member State and the expression “Prospectus Directive” means Directive 2003/71/ EC and includes any relevant implementing measure in each Relevant Member State.
United Kingdom.No offer of ADSs has been made or will be made to the public in the United Kingdom within the meaning of Section 102B of the Financial Services and Markets Act 2000, as amended, or FSMA, except to legal entities which are authorized or regulated to operate in the financial markets or, if not so authorized or regulated, whose corporate purpose is solely to invest in securities or otherwise in circumstances which do not require the publication by us of a prospectus pursuant to the Prospectus Rules of the Financial Services Authority, or FSA. The underwriters: (i) have only communicated or caused to be communicated and will only communicate or cause to be communicated an invitation or inducement to engage in investment activity (within the meaning of Section 21 of FSMA) to persons who have professional experience in matters relating to investments falling within Article 19(5) of the Financial Services and Markets Act 2000 (Financial Promotion) Order 2005 or in circumstances in which Section 21 of FSMA does not apply to us; and (ii) have complied with, and will comply with all applicable provisions of FSMA with respect to anything done by them in relation to the ADSs in, from or otherwise involving the United Kingdom.
Japan.The ADSs have not been and will not be registered under the Financial Instruments and Exchange Law of Japan, and ADSs will not be offered or sold, directly or indirectly, in Japan or to, or for the benefit of, any resident of Japan (which term as used herein means any person resident in Japan, including any corporation or other entity organized under the laws of Japan), or to others for re-offering or resale, directly or indirectly, in Japan or to a resident of Japan, except pursuant to any exemption from the registration requirements of, and otherwise in compliance with, the Financial Instruments and Exchange Law and any other applicable laws, regulations and ministerial guidelines of Japan.
Hong Kong.The ADSs may not be offered or sold by means of any document other than (i) in circumstances which do not constitute an offer to the public within the meaning of the Companies Ordinance (Cap.32, Laws of Hong Kong), or (ii) to “professional investors” within the meaning of the Securities and Futures Ordinance (Cap.571, Laws of Hong Kong) and any rules made thereunder, or (iii) in other circumstances which do not result in the document being a “prospectus” within the meaning of the Companies Ordinance (Cap.32, Laws of Hong Kong), and no advertisement, invitation or document relating to the ADSs may be issued or may be in the possession of any person for the purpose of issue (in each case whether in Hong Kong or elsewhere), which is directed at, or the contents of which are likely to be accessed or read by, the public in Hong Kong (except if permitted to do so under the laws of Hong Kong) other than with respect to ADSs which are or are intended to be disposed of only to persons outside Hong Kong or only to “professional investors” within the meaning of the Securities and Futures Ordinance (Cap.571, Laws of Hong Kong) and any rules made thereunder.
Singapore.This prospectus has not been registered as a prospectus with the Monetary Authority of Singapore. Accordingly, this prospectus and any other document or material in connection with the offer or sale, or invitation for subscription or purchase, of our ADSs may not be circulated or distributed, nor may our ADSs be offered or sold, or be made the subject of an invitation for subscription or purchase, whether directly or indirectly, to persons in Singapore other than (i) to an institutional investor under Section 274 of the Securities and Futures Act, Chapter 289 of Singapore, or SFA, (ii) to a relevant person or any person pursuant to Section 275(1A), and in accordance with the conditions specified in Section 275 of the SFA, or (iii) otherwise pursuant to, and in accordance with the conditions of, any other applicable provision of the SFA, in each case subject to compliance with conditions set forth in the SFA.
153
Table of Contents
Where our ADSs are subscribed or purchased under Section 275 by a relevant person which is: (a) a corporation (which is not an accredited investor as defined in Section 4A of the SFA) the sole business of which is to hold investments and the entire share capital of which is owned by one or more individuals, each of whom is an accredited investor; or (b) a trust (where the trustee is not an accredited investor) whose sole purpose is to hold investments and each beneficiary of the trust is an individual who is an accredited investor; shares, debentures and units of shares and debentures of that corporation or the beneficiaries’ rights and interest (howsoever described) in that trust shall not be transferred within six months after that corporation or that trust has acquired the ADSs under Section 275 of the SFA, except: (1) to an institutional investor (for corporations under Section 274 of the SFA) or to a relevant person defined in Section 275(2) of the SFA, or to any person pursuant to an offer that is made on terms that such shares, debentures and units of shares and debentures of that corporation or such rights and interest in that trust are acquired at a consideration of not less than S$200,000 (or its equivalent in a foreign currency) for each transaction, whether such amount is to be paid for in cash or by exchange of securities or other assets, and further for corporations, in accordance with the conditions, specified in Section 275 of the SFA; (2) where no consideration is or will be given for the transfer; or (3) where the transfer is by operation of law.
People’s Republic of China.Each underwriter will be deemed to have represented and agreed that it has not circulated or distributed, and will not circulate or distribute, this prospectus in the PRC and it has not offered or sold, and will not offer or sell, to any person for re-offering or resale, directly or indirectly, any ADSs to any resident of the PRC, except pursuant to applicable laws and regulations of the PRC. For the purpose of this paragraph, the PRC does not include Taiwan, Hong Kong and Macau.
Cayman Islands.This prospectus does not constitute a public offer of the ADSs or common shares, whether by way of sale or subscription, in the Cayman Islands. Each underwriter has represented and agreed that it has not offered or sold, and will not offer or sell, directly or indirectly, any ADSs or common shares in the Cayman Islands.
154
Table of Contents
EXPENSES RELATED TO THIS OFFERING
Set forth below is an itemization of the total expenses, excluding underwriting discounts and commissions, that are expected to be incurred in connection with the offer and sale of the ADSs by us. Except for the SEC registration fee, the New York Stock Exchange listing fee and the Financial Industry Regulatory Authority, Inc. filing fee, all amounts are estimates.
| Securities and Exchange Commission registration fee | $ | 9,839 | ||
| New York Stock Exchange listing fee | 125,000 | |||
| Financial Industry Regulatory Authority, Inc. filing fee | 14,300 | |||
| Printing and engraving expenses | 250,000 | |||
| Accounting fees and expenses | 400,000 | |||
| Legal fees and expenses | 1,200,000 | |||
| Miscellaneous | 180,000 | |||
| Total | $ | 2,179,139 | ||
155
Table of Contents
LEGAL MATTERS
We are being represented by Skadden, Arps, Slate, Meagher & Flom LLP with respect to certain legal matters as to United States federal securities and New York State law. The underwriters are being represented by Shearman & Sterling LLP with respect to certain legal matters as to United States federal securities and New York State law. The validity of the common shares represented by the ADSs offered in this offering will be passed upon for us by Maples and Calder. Certain legal matters as to PRC law will be passed upon for us by Tian Yuan Law Firm and for the underwriters by Haiwen & Partners. Skadden, Arps, Slate, Meagher & Flom LLP may rely upon Maples and Calder with respect to matters governed by Cayman Islands law and Tian Yuan Law Firm with respect to matters governed by PRC law. Shearman & Sterling LLP may rely upon Haiwen & Partners with respect to matters governed by PRC law.
156
Table of Contents
EXPERTS
The consolidated financial statements and the related financial statement schedule as of February 28, 2009 and 2010, and for each of the three years ended February 28, 2010, included in this prospectus have been audited by Deloitte Touche Tohmatsu CPA Ltd., an independent registered public accounting firm, as stated in their report appearing herein. Such financial statements and financial statement schedule have been so included in reliance upon the report of such firm given upon their authority as experts in accounting and auditing.
The offices of Deloitte Touche Tohmatsu CPA Ltd. are located at 8/F, Deloitte Tower, The Towers, Oriental Plaza, 1 East Chang An Avenue, Beijing 100738, the People’s Republic of China.
157
Table of Contents
ADDITIONAL INFORMATION
We have filed with the SEC a registration statement onForm F-1, including relevant exhibits and securities under the Securities Act with respect to underlying common shares represented by the ADSs, to be sold in this offering. We have also filed with the SEC a related registration statement on F-6 to register the ADSs. This prospectus, which constitutes a part of the registration statement, does not contain all of the information contained in the registration statement. You should read the registration statement onForm F-1 and its exhibits and schedules for further information with respect to us and our ADSs.
We are subject to periodic reporting and other informational requirements of the Exchange Act as applicable to foreign private issuers. Accordingly, we will be required to file reports, including annual reports onForm 20-F, and other information with the SEC. For the fiscal year ending February 28, 2011, our annual report onForm 20-F will be due within six months following the end of that year. For the fiscal years ending on or after December 15, 2011, we will be required to file our annual report onForm 20-F within 120 days after the end of each fiscal year. All information filed with the SEC can be obtained over the Internet at the SEC’s website atwww.sec.govor inspected and copied at the public reference facilities maintained by the SEC at 100 F Street, N.E., Washington, D.C. 20549. You can request copies of these documents, upon payment of a duplicating fee, by writing to the SEC. Please call the SEC at1-800-SEC-0330 or visit the SEC website for further information on the operation of the public reference rooms.
As a foreign private issuer, we are exempt from the rules of the Exchange Act prescribing the furnishing and content of proxy statements to shareholders, and our executive officers, directors and principal shareholders are exempt from the reporting and short-swing profit recovery provisions contained in Section 16 of the Exchange Act. In addition, we will not be required under the Exchange Act to file periodic reports and financial statements with the SEC as frequently or as promptly as U.S. companies whose securities are registered under the Exchange Act. However, we intend to furnish the depositary with our annual reports, which will include a review of operations and annual audited consolidated financial statements prepared in conformity with U.S. GAAP, and all notices of shareholders’ meeting and other reports and communications that are made generally available to our shareholders. The depositary will make such notices, reports and communications available to holders of ADSs and, upon our written request, will mail to all record holders of ADSs the information contained in any notice of a shareholders’ meeting received by the depositary from us.
158
TAL Education Group
Contents | Page(s) | |||
| F-2 | ||||
| F-3 | ||||
| F-4 | ||||
| F-5 | ||||
| F-6–F-7 | ||||
| F-8–F-36 | ||||
| F-37–F-40 | ||||
| F-41 | ||||
| F-42 | ||||
| F-43 | ||||
| F-44 | ||||
| F-45-F-58 | ||||
F-1
Table of Contents
Report of Independent Registered Public Accounting Firm
To the Board of Directors and Shareholders of TAL Education Group
We have audited the accompanying consolidated balance sheets of TAL Education Group (the “Company”), its subsidiaries, its variable interest entities (the “VIEs”) and the VIEs’ subsidiaries (collectively, the “Group”) as of February 28, 2009 and 2010, and the related consolidated statements of operations, changes in equity and comprehensive income, and cash flows for each of the three years ended February 29, 2008, February 28, 2009 and 2010, and the related financial statement schedule included in Schedule I. These financial statements and the related financial statement schedule are the responsibility of the Company’s management. Our responsibility is to express an opinion on these financial statements and financial statement schedule based on our audits.
We conducted our audits in accordance with the standards of the Public Company Accounting Oversight Board (United States). Those standards require that we plan and perform the audit to obtain reasonable assurance about whether the consolidated financial statements are free of material misstatement. The Group is not required to have, nor were we engaged to perform, an audit of its internal control over financial reporting. Our audits include consideration of internal control over financial reporting as a basis for designing audit procedures that are appropriate in the circumstances, but not for the purpose of expressing an opinion on the effectiveness of the Group’s internal control over financial reporting. Accordingly, we express no such opinion. An audit also includes examining, on a test basis, evidence supporting the amounts and disclosures in the financial statements, assessing the accounting principles used and significant estimates made by management, as well as evaluating the overall financial statement presentation. We believe that our audits provide a reasonable basis for our opinion.
In our opinion, such consolidated financial statements present fairly, in all material respects, the financial position of the Group as of February 28, 2009 and 2010, and the results of its operations and its cash flows for each of the three years ended February 29, 2008, February 28, 2009 and 2010, in conformity with accounting principles generally accepted in the United States of America. Also, in our opinion, the related financial statement schedule, when considered in relation to such consolidated financial statements taken as a whole, presents fairly in all material respects, the information set forth therein.
/s/ Deloitte Touche Tohmatsu CPA Ltd.
Beijing, the People’s Republic of China
July 1, 2010, except for Note 24, as to which the date is September 29, 2010
F-2
Table of Contents
TAL Education Group
(In U.S. dollars, except share and share related data)
| As of | As of | |||||||||||
| February 28, | February 28, | |||||||||||
| 2009 | 2010 | |||||||||||
Assets | ||||||||||||
Current assets | ||||||||||||
| Cash and cash equivalents | $ | 29,692,901 | $ | 50,752,481 | ||||||||
Available-for-sale securities | 340,418 | 1,918,156 | ||||||||||
| Amounts due from related parties | 92,112 | — | ||||||||||
| Inventory | 1,063 | 121,819 | ||||||||||
| Deferred tax assets-current | 481,129 | 831,297 | ||||||||||
| Prepaid expenses and other current assets | 1,414,923 | 2,280,941 | ||||||||||
Total current assets | 32,022,546 | 55,904,694 | ||||||||||
| Property and equipment, net | 2,471,337 | 4,991,490 | ||||||||||
| Deferred tax assets-non-current | 131,289 | 283,968 | ||||||||||
| Rental deposit | 939,207 | 2,170,548 | ||||||||||
| Intangible assets, net | 2,226,343 | 1,389,160 | ||||||||||
| Goodwill | 762,272 | 763,802 | ||||||||||
Total assets | $ | 38,552,994 | $ | 65,503,662 | ||||||||
| Liabilities, Convertible Redeemable Preferred Shares and Equity | ||||||||||||
Current liabilities | ||||||||||||
| Accounts payable (including accounts payable of the consolidated VIEs without recourse to TAL Education Group of nil and 915,408 as of February 28, 2009, and February 28, 2010, respectively) | $ | — | $ | 987,742 | ||||||||
| Deferred revenue (including deferred revenue of the consolidated VIEs without recourse to TAL Education Group of 18,022,550 and 24,631,648 as of February 28, 2009, and February 28, 2010, respectively) | 18,022,550 | 29,407,994 | ||||||||||
| Amounts due to related parties (including amounts due to related parties of the consolidated VIEs without recourse to TAL Education Group of 101,043 and 108,204 as of February 28, 2009 and February 28, 2010, respectively) | 101,043 | 108,204 | ||||||||||
| Distribution payable to shareholders (including distribution payable to shareholders of the consolidated VIEs without recourse to TAL Education Group of 1,462,095 and nil as of February 28, 2009 and February 28, 2010, respectively) | 1,462,095 | — | ||||||||||
| Accrued expenses and other current liabilities (including accrued expenses and other current liabilities without recourse to TAL Education Group of 3,601,117 and 6,588,552 as of February 28, 2009 and February 28, 2010, respectively) | 3,609,797 | 6,817,816 | ||||||||||
| Income tax payable (including income tax payable of the consolidated VIEs without recourse to TAL Education Group of 2,636,095 and 2,653,324 as of February 28, 2009, and February 28, 2010, respectively) | 2,636,095 | 580,225 | ||||||||||
Total current liabilities | 25,831,580 | 37,901,981 | ||||||||||
| Convertible loan | — | 500,000 | ||||||||||
| Deferred tax liabilities-non-current | 203,776 | 175,610 | ||||||||||
| Acquisition payable-non-current (including acquisition payable -non-current of the consolidated VIEs without recourse to TAL Education Group of 162,293 and nil as of February 28, 2009 and February 28, 2010, respectively) | 162,293 | — | ||||||||||
Total liabilities | 26,197,649 | 38,577,591 | ||||||||||
Commitments and contingencies (Note 16) | ||||||||||||
| Series A convertible redeemable preferred shares ($0.001 par value, 5,000,000 shares and 5,000,000 shares authorized, issued and outstanding as of February 28, 2009 and February 28, 2010, respectively, liquidation value $5,000,000) | 9,000,000 | 9,000,000 | ||||||||||
Equity | ||||||||||||
| TAL Education Group Shareholders’ Equity | ||||||||||||
| Class A common shares ($0.001 par value, 500,000,000 shares authorized, nil issued and outstanding as of February 28, 2009 and February 28, 2010) | — | — | ||||||||||
| Class B common shares ($0.001 par value, 495,000,000 shares authorized as of February 28, 2009 and February 28, 2010; 120,000,000 shares and 120,000,000 shares issued and outstanding as of February 28, 2009 and February 28, 2010, respectively) | 120,000 | 120,000 | ||||||||||
| Class B common shares subscription receivable | (120,000 | ) | (120,000 | ) | ||||||||
| Additional paid-in capital | 559,898 | 779,641 | ||||||||||
| Statutory reserve | 2,660,818 | 4,857,443 | ||||||||||
| Retained earnings | 21,400 | 12,069,734 | ||||||||||
| Accumulated other comprehensive income | 113,229 | 219,253 | ||||||||||
Total TAL Education Group’s Equity | 3,355,345 | 17,926,071 | ||||||||||
Total liabilities, convertible redeemable preferred shares and equity | $ | 38,552,994 | $ | 65,503,662 | ||||||||
The accompanying notes are an integral part of these consolidated financial statements.
F-3
Table of Contents
TAL Education Group
(In U.S. dollars, except share and share related data)
| For the year | For the year | For the year | ||||||||||
| ended | ended | ended | ||||||||||
| February 29, | February 28, | February 28, | ||||||||||
| 2008 | 2009 | 2010 | ||||||||||
Net revenues | $ | 8,882,191 | $ | 37,475,583 | $ | 69,593,523 | ||||||
| Cost of revenues | (4,367,086 | ) | (18,554,255 | ) | (37,648,875 | ) | ||||||
| Gross profit | 4,515,105 | 18,921,328 | 31,944,648 | |||||||||
Operating expenses | ||||||||||||
| Selling and marketing | (370,185 | ) | (2,353,011 | ) | (5,608,116 | ) | ||||||
| General and administrative | (2,478,092 | ) | (5,889,370 | ) | (10,871,866 | ) | ||||||
| Impairment loss on intangible assets and goodwill | — | (1,615,455 | ) | — | ||||||||
| Total operating expenses | (2,848,277 | ) | (9,857,836 | ) | (16,479,982 | ) | ||||||
| Income from operations | 1,666,828 | 9,063,492 | 15,464,666 | |||||||||
| Interest income | 10,485 | 119,922 | 323,861 | |||||||||
| Interest expense | — | (42,967 | ) | (40,643 | ) | |||||||
| Other expenses | — | (209,949 | ) | (124,400 | ) | |||||||
Impairment loss onavailable-for-sale securities | — | (362,668 | ) | — | ||||||||
| Gain on extinguishment of liabilities | — | 731,092 | — | |||||||||
| Income before income tax provision | 1,677,313 | 9,298,922 | 15,623,484 | |||||||||
| Provision for income tax | (164,741 | ) | (2,018,253 | ) | (1,378,525 | ) | ||||||
Net income | 1,512,572 | 7,280,669 | 14,244,959 | |||||||||
| Net income attributable to TAL Education Group | 1,512,572 | 7,280,669 | 14,244,959 | |||||||||
| Deemed dividends on Series A convertible redeemable preferred shares—accretion of redemption premium | — | (4,113,035 | ) | — | ||||||||
| Net income attributable to common shareholders of TAL Education Group | 1,512,572 | 3,167,634 | 14,244,959 | |||||||||
| Net income per common share | ||||||||||||
| Basic | $ | 0.01 | $ | 0.03 | $ | 0.11 | ||||||
| Diluted | $ | 0.01 | $ | 0.03 | $ | 0.11 | ||||||
| Net income per Series A convertible redeemable preferred share-Basic | $ | — | $ | 17.69 | $ | 0.11 | ||||||
| Weighted average shares used in calculating net income per common share | ||||||||||||
| Basic | 120,000,000 | 120,000,000 | 120,000,000 | |||||||||
| Diluted | 120,000,000 | 120,000,000 | 125,000,000 | |||||||||
| Weighted average shares used in calculating net income per Series A convertible redeemable preferred share-basic | — | 232,877 | 5,000,000 | |||||||||
| Pro forma net income per common share (unaudited) (Note 23) | ||||||||||||
| Basic | — | — | $ | 0.11 | ||||||||
| Diluted | — | — | $ | 0.11 | ||||||||
| Weighted average shares used in calculating pro forma net income per common share (unaudited) (Note 23) | ||||||||||||
| Basic | — | — | 123,151,008 | |||||||||
| Diluted | — | — | 128,151,008 | |||||||||
The accompanying notes are an integral part of these consolidated financial statements.
F-4
Table of Contents
TAL Education Group
Consolidated Statements of Changes in Equity and Comprehensive Income
(In U.S. dollars, except share and share related data)
Consolidated Statements of Changes in Equity and Comprehensive Income
(In U.S. dollars, except share and share related data)
| Total TAL | ||||||||||||||||||||||||||||||||||||
| Class B common | Accumulated | Education | ||||||||||||||||||||||||||||||||||
| shares | Additional | other | Group | |||||||||||||||||||||||||||||||||
| Class B common shares | subscription | paid-in | Statutory | (Accumulated deficit)/ | comprehensive | shareholders’ | Comprehensive | |||||||||||||||||||||||||||||
| Shares | Amount | receivable | capital | reserve | retained earnings | income (loss) | equity | income | ||||||||||||||||||||||||||||
Balance as of March 1, 2007 | 1,000 | $ | 1 | $ | (1 | ) | $ | 62,580 | $ | — | $ | (555,968 | ) | $ | — | $ | (493,388 | ) | $ | — | ||||||||||||||||
| Capital contribution | — | — | — | 131,810 | — | — | — | 131,810 | — | |||||||||||||||||||||||||||
| Net income | — | — | — | — | — | 1,512,572 | — | 1,512,572 | 1,512,572 | |||||||||||||||||||||||||||
| Provision for statutory reserve | — | — | — | — | 494,040 | (494,040 | ) | — | — | — | ||||||||||||||||||||||||||
| Foreign currency translation adjustment | — | — | — | — | — | — | 42,102 | 42,102 | 42,102 | |||||||||||||||||||||||||||
Net unrealized (losses) onavailable-for-sale securities, net of tax effect of $24,296 | — | — | — | — | — | — | (49,327 | ) | (49,327 | ) | (49,327 | ) | ||||||||||||||||||||||||
Balance as of February 29, 2008 | 1,000 | 1 | (1 | ) | 194,390 | 494,040 | 462,564 | (7,225 | ) | 1,143,769 | $ | 1,505,347 | ||||||||||||||||||||||||
| Capital contribution | — | — | — | 365,508 | — | — | — | 365,508 | — | |||||||||||||||||||||||||||
| Net income | — | — | — | — | — | 7,280,669 | — | 7,280,669 | 7,280,669 | |||||||||||||||||||||||||||
| Issuance of Class B common shares | 119,999,000 | 119,999 | (119,999 | ) | — | — | — | — | — | — | ||||||||||||||||||||||||||
| Provision for statutory reserve | — | — | — | — | 2,166,778 | (2,166,778 | ) | — | — | — | ||||||||||||||||||||||||||
| Distribution to shareholders | — | — | — | — | — | (1,442,020 | ) | — | (1,442,020 | ) | — | |||||||||||||||||||||||||
| Accretion for Series A convertible redeemable preferred shares redemption premium | — | — | — | — | — | (4,113,035 | ) | — | (4,113,035 | ) | — | |||||||||||||||||||||||||
| Foreign currency translation adjustment | — | — | — | — | — | — | 71,127 | 71,127 | 71,127 | |||||||||||||||||||||||||||
Net unrealized (losses) onavailable-for-sale securities, net of tax effect of $72,261 | — | — | — | — | — | — | (216,784 | ) | (216,784 | ) | (216,784 | ) | ||||||||||||||||||||||||
Transfer to the statements of operations ofother-than-temporary impairment, net of tax effect of ($96,557) | — | — | — | — | — | — | 266,111 | 266,111 | 266,111 | |||||||||||||||||||||||||||
Balance as of February 28, 2009 | 120,000,000 | 120,000 | (120,000 | ) | 559,898 | 2,660,818 | 21,400 | 113,229 | 3,355,345 | $ | 7,401,123 | |||||||||||||||||||||||||
| Capital contribution | — | — | — | 219,743 | — | — | — | 219,743 | — | |||||||||||||||||||||||||||
| Net income | — | — | — | — | — | 14,244,959 | — | 14,244,959 | 14,244,959 | |||||||||||||||||||||||||||
| Provision for statutory reserve | — | — | — | — | 2,196,625 | (2,196,625 | ) | — | — | — | ||||||||||||||||||||||||||
| Foreign currency translation adjustment | — | — | — | — | — | — | 21,493 | 21,493 | 21,493 | |||||||||||||||||||||||||||
Net unrealized gains onavailable-for-sale securities, net of tax effect of ($28,177) | — | — | — | — | — | — | 84,531 | 84,531 | 84,531 | |||||||||||||||||||||||||||
Balance as of February 28, 2010 | 120,000,000 | $ | 120,000 | $ | (120,000 | ) | $ | 779,641 | $ | 4,857,443 | $ | 12,069,734 | $ | 219,253 | $ | 17,926,071 | $ | 14,350,983 | ||||||||||||||||||
The accompanying notes are an integral part of these consolidated financial statements.
F-5
Table of Contents
TAL Education Group
(In U.S. dollars, except share and share related data)
| For the year | For the year | For the year | ||||||||||
| ended | ended | ended | ||||||||||
| February 29, | February 28, | February 28, | ||||||||||
| 2008 | 2009 | 2010 | ||||||||||
Cash flows from operating activities | ||||||||||||
| Net income | $ | 1,512,572 | $ | 7,280,669 | $ | 14,244,959 | ||||||
| Adjustments to reconcile net income to net cash provided by operating activities | ||||||||||||
| Depreciation of property and equipment | 46,416 | 452,009 | 1,272,074 | |||||||||
| Amortization of intangible assets | 114,536 | 565,300 | 841,193 | |||||||||
| Impairment loss on intangible assets and goodwill | — | 1,615,455 | — | |||||||||
Impairment loss onavailable-for-sale securities | — | 362,668 | — | |||||||||
| Gain on extinguishment of liabilities | — | (731,092 | ) | — | ||||||||
| Changes in operating assets and liabilities | ||||||||||||
| Amounts due from related parties | (41,914 | ) | (91,458 | ) | 92,247 | |||||||
| Inventory | (4,270 | ) | 3,603 | (120,688 | ) | |||||||
| Prepaid expenses and other current assets | 425,014 | (802,788 | ) | (862,708 | ) | |||||||
| Deferred income taxes | (139,879 | ) | (602,485 | ) | (557,895 | ) | ||||||
| Rental deposit | (235,756 | ) | (635,096 | ) | (1,228,785 | ) | ||||||
| Accounts payable | — | — | 987,204 | |||||||||
| Deferred revenue | 3,701,239 | 11,995,607 | 11,343,086 | |||||||||
| Amounts due to related parties | — | (36,135 | ) | 6,954 | ||||||||
| Accrued expenses and other current liabilities | 644,389 | 1,805,910 | 3,217,670 | |||||||||
| Income tax payable | 302,689 | 2,285,218 | (2,060,038 | ) | ||||||||
| Net cash provided by operating activities | 6,325,036 | 23,467,385 | 27,175,273 | |||||||||
Cash flows from investing activities | ||||||||||||
| Purchase of property and equipment | (532,814 | ) | (2,142,362 | ) | (3,785,897 | ) | ||||||
| Purchase of intangible assets | (277,022 | ) | (1,422,679 | ) | — | |||||||
Purchase ofavailable-for-sale securities | (660,519 | ) | — | (1,464,231 | ) | |||||||
| Acquisitions of subsidiaries, net of cash acquired of $186,336 | — | (1,551,362 | ) | — | ||||||||
| Net cash used in investing activities | (1,470,355 | ) | (5,116,403 | ) | (5,250,128 | ) | ||||||
The accompanying notes are an integral part of these consolidated financial statements.
F-6
Table of Contents
TAL Education Group
Consolidated Statements of Cash Flows
(In U.S. dollars, except share and share related data)
| For the year | For the year | For the year | ||||||||||
| ended | ended | ended | ||||||||||
| February 29, | February 28, | February 28, | ||||||||||
| 2008 | 2009 | 2010 | ||||||||||
Cash flows from financing activities | ||||||||||||
| Proceeds from issuance of Series A convertible redeemable preferred shares, net of issuance cost of $113,035 | — | 4,886,965 | — | |||||||||
| Capital contributed from shareholders | 131,810 | 365,508 | 219,743 | |||||||||
| Payment of deferred consideration | — | — | (180,345 | ) | ||||||||
| Distribution to shareholders | — | — | (1,442,020 | ) | ||||||||
| Convertible loan | — | — | 500,000 | |||||||||
| Net cash provided by (used in) financing activities | 131,810 | 5,252,473 | (902,622 | ) | ||||||||
| Effect of exchange rate changes | 315,097 | 384,961 | 37,057 | |||||||||
| Net increase in cash and cash equivalents | 5,301,588 | 23,988,416 | 21,059,580 | |||||||||
| Cash and cash equivalents at the beginning of year | 402,897 | 5,704,485 | 29,692,901 | |||||||||
| Cash and cash equivalents at the end of year | 5,704,485 | 29,692,901 | 50,752,481 | |||||||||
Supplement disclosure of cash flow information: | ||||||||||||
| Income tax paid | $ | 1,931 | $ | 335,439 | $ | 3,997,584 | ||||||
The accompanying notes are an integral part of these consolidated financial statements.
F-7
Table of Contents
| 1. | Organization and Principal Activities |
TAL Education Group (the “Company” or “TAL”) was incorporated in the Cayman Islands on January 10, 2008 to be the holding company for a group of companies engaged in provision of high quality after-school tutoring programs for primary and secondary school students in the People’s Republic of China (the “PRC”). At the time of its incorporation and through the date of the reorganization as described below, the ownership interest of the Company was held by Bangxin Zhang, Yundong Cao, Yachao Liu and Yunfeng Bai (collectively , “the founding shareholders”).
The Company, its subsidiaries, its consolidated Variable Interest Entities (“VIEs”) and VIEs’ subsidiaries are collectively referred to as the “Group”.
As of February 28, 2010, details of the Group’s subsidiaries, its VIEs and VIEs’ subsidiaries are as follows:
| Place of | ||||||||||
| Later of date of | incorporation | Percentage of | ||||||||
| incorporation | (or establishment) | economic | ||||||||
Name | or acquisition | /operation | ownership | Principal activities | ||||||
Subsidiaries: | ||||||||||
| Xueersi International Education Group Limited (“Xueersi Hong Kong”) | March 11, 2008 | Hong Kong | 100 | % | Holding company | |||||
| TAL Education Technology (Beijing) Co., Ltd. (“TAL Beijing”) | May 8, 2008 | Beijing | 100 | % | Software sales, and consulting service | |||||
| Beijing Huanqiu Zhikang Shidai Education Consulting Co., Ltd. (“Huanqiu Zhikang”) | September 17, 2009 | Beijing | 100 | % | Education and management consulting service | |||||
| Beijing Yidu Huida Education Technology Co., Ltd. (“Yidu Huida”) | November 11, 2009 | Beijing | 100 | % | Software sales and consulting service | |||||
Variable interest entities: | ||||||||||
| Beijing Xueersi Education Technology Co., Ltd. (“Xueersi Education”) | December 31, 2005 | Beijing | 100 | % | Sales of educational materials and products | |||||
| Beijing Xueersi Network Technology Co., Ltd. (“Xueersi Network”) | August 23, 2007 | Beijing | 100 | % | On-line education | |||||
VIEs’ subsidiaries: | ||||||||||
| Beijing Haidian District Xueersi Training School (“Haidian Xueersi”) | July 3, 2006 | Beijing | 100 | % | After-school tutoring for primary and secondary school students | |||||
| Beijing Dongcheng District Xueersi Training School (“Dongcheng Xueersi”) | March 21, 2008 | Beijing | 100 | % | After-school tutoring for primary and secondary school students | |||||
| Beijing Zhikang Culture Distribution Co., Ltd. (“Zhikang”) | June 30, 2008 | Beijing | 100 | % | After- school tutoring for primary and secondary school students | |||||
| Hubei Jianli Hafu English Training School (“Jianli School”) | July 1, 2008 | Hubei | 100 | % | Language education | |||||
| Hubei Qianjiang Xiaohafu English Training School (“Qianjiang School”) | July 1, 2008 | Hubei | 100 | % | Language education | |||||
| Wuhan Jianghanqu Xiaoxinxing English Training School (“Wuhan School”) | July 1, 2008 | Hubei | 100 | % | Language education | |||||
| Shanghai Lehai Science and Technology Information Co., Ltd. (“Shanghai Lehai”) | August 1, 2008 | Shanghai | 100 | % | Technology development and consulting service | |||||
| Shanghai Changning District Xueersi-Lejiale School (“Changning School”) | August 1, 2008 | Shanghai | 100 | % | After-school tutoring for primary and secondary school students | |||||
| Shanghai Minhang District Lejiale School (“Minhang School”) | August 1, 2008 | Shanghai | 100 | % | Language education | |||||
| Beijing Xicheng District Xueersi Training School (“Xicheng Xueersi”) | April 2, 2009 | Beijing | 100 | % | After-school tutoring for primary and secondary school students | |||||
F-8
Table of Contents
TAL Education Group
Notes to Consolidated Financial Statements
For the Years Ended February 29, 2008, February 28, 2009
and February 28, 2010
(In U.S. dollars, except share and share related data)
Notes to Consolidated Financial Statements
For the Years Ended February 29, 2008, February 28, 2009
and February 28, 2010
(In U.S. dollars, except share and share related data)
| Place of | ||||||||||
| Later of date of | incorporation | Percentage of | ||||||||
| incorporation | (or establishment) | economic | ||||||||
Name | or acquisition | /operation | ownership | Principal activities | ||||||
| Shanghai Xueersi Education Information Consulting Co., Ltd. (“Shanghai Education”) | July 2, 2009 | Shanghai | 100 | % | Educational information consulting and educational software development | |||||
| Tianjin Xueersi Education Information Consulting Co., Ltd. (“Tianjin Education”) | August 14, 2009 | Tianjin | 100 | % | Educational information consulting service | |||||
| Guangzhou Xueersi Education Technology Co., Ltd. (“Guangzhou Education”) | August 16, 2009 | Guangzhou | 100 | % | Educational technology research and development | |||||
| Shenzhen Xueersi Education Technology Co., Ltd. (“Shenzhen Education”) | December 22, 2009 | Shenzhen | 100 | % | Teaching software research and development | |||||
History of the Group
The Group began its operations in the PRC in 2003 through Beijing Aosai Culture Distribution Co., Ltd. (“Beijing Aosai”). Beijing Aosai was incorporated by the founding shareholders in August 2003 and liquidated in January 2008 after its business was transferred to Xueersi Education.
Xueersi Education was incorporated in the PRC in 2005 by the founding shareholders with the same ownership percentage as the Company. Xueersi Education was established to provide high quality after-school tutoring and other related services to primary and secondary school students, including mathematics and English.
Haidian Xueersi, Xueersi Network and Zhikang were established by the founding shareholders in 2006, 2007 and 2008, respectively. In November 2008, Xueersi Network acquired Haidian Xueersi and Zhikang.
The reorganization
PRC laws and regulations currently require any foreign entity that invests in the education business in China to be an educational institution with relevant experience in providing education services outside China. As a Cayman Islands company, the Company is deemed a foreign legal person under the PRC laws.
To comply with the PRC laws and regulations, the Group provides substantially all of its services in the PRC through its VIEs, Xueersi Education and Xueersi Network, and their subsidiaries. To provide the Company the ability to receive the majority of the expected residual returns of the VIEs and their subsidiaries, the Company’s wholly owned subsidiary, TAL Beijing entered into a series of contractual arrangements with Xueersi Education and Xueersi Network on February 12, 2009.
| • | Agreements that transfer economic benefits to TAL Beijing |
Series of technology support and service agreements: Pursuant to a series of technology support and service agreements, TAL Beijing retains exclusive right to provide to the VIEs the technology support and consulting services included but not limited to the system technology support service, website development service, human resource and information management service, exclusive management consulting service, and curriculum research and development service. TAL Beijing owns the intellectual property rights developed in the performance of these agreements. As consideration for these services, TAL Beijing is entitled to charge the VIEs annual service fees and adjust the service fee rates from time to time at its discretion.
Call option agreement: Pursuant to the call option agreement, the shareholders of VIEs unconditionally and irrevocably granted TAL Beijing or its designated third party an exclusive option to purchase from VIEs’ shareholders, to the extent permitted under PRC law, part of or all the equity interests in the VIEs, as the case
F-9
Table of Contents
TAL Education Group
Notes to Consolidated Financial Statements
For the Years Ended February 29, 2008, February 28, 2009
and February 28, 2010
(In U.S. dollars, except share and share related data)
Notes to Consolidated Financial Statements
For the Years Ended February 29, 2008, February 28, 2009
and February 28, 2010
(In U.S. dollars, except share and share related data)
may be, for the minimum amount of consideration permitted by the applicable law without any other conditions. TAL Beijing has sole discretion to decide when to exercise the option, whether in part or in full.
| • | Agreements that provide TAL Beijing effective control over the VIEs |
Power of attorney: The shareholders of the VIEs have executed an irrevocable power of attorney appointing TAL Beijing, or any person designated by TAL Beijing as their attorney-in-fact to vote on their behalf on all matters of the VIEs requiring shareholder approval under PRC laws and regulations and the articles of association of the VIEs. The power of attorney remains effective during the periods of their shareholding.
The articles of associations of Xueersi Education and Xueersi Network state that the major rights of the shareholders in shareholders’ meeting include the power to approve the operating strategy and investment plan, elect the members of board of directors and approve their compensation and review and approve annual budget and earning distribution plan. Therefore, through the irrevocable power of attorney arrangement TAL Beijing has the ability to exercise effective control over Xueersi Education and Xueersi Network through shareholder votes and through such votes to also control the composition of the board of directors. In addition, the senior management team of Xueersi Education and Xueersi Network is the same as that of TAL Beijing. As a result of these contractual rights, the Company has the power to direct the activities of the VIEs that most significantly impact their economic performance.
Equity pledge agreement: Pursuant to the equity pledge agreement, the shareholders of the VIEs unconditionally and irrevocably pledged all of their equity interests, including the right to receive declared dividends and the voting rights, in the VIEs to TAL Beijing to guarantee VIEs’ performance of their obligations under the technology support and service agreements. The shareholders of the VIEs agree that, without prior written consent of TAL Beijing, they will not transfer or dispose the pledged equity interests or create or allow any encumbrance on the pledged equity interests that would prejudice TAL Beijing’s interest.
Through the above contractual arrangements, TAL Beijing has the rights to receive substantially all of the VIEs’ expected residual returns and holds variable interests in the VIEs.
Since the Company and the VIEs prior to entering into the above contractual arrangements were under the common control, the conclusion of the contractual arrangements is a reorganization of entities under common control and has been accounted for in a manner akin to a pooling as if the Company had been in existence throughout the period of the VIEs’ existence and it was the primary beneficiary of the VIEs from their inception.
The following financial statement balances and amounts of the Company’s VIEs were included in the accompanying consolidated financial statements:
| As of | As of | |||||||
| February 28, | February 28, | |||||||
| 2009 | 2010 | |||||||
| Total current assets | $ | 27,027,498 | $ | 45,171,584 | ||||
| Total non-current assets | 6,452,080 | 8,792,445 | ||||||
| Total assets | 33,479,578 | 53,964,029 | ||||||
| Total current liabilities | 25,822,900 | 34,897,136 | ||||||
| Total non-current liabilities | 366,069 | 175,610 | ||||||
| Total liabilities | $ | 26,188,969 | $ | 35,072,746 | ||||
F-10
Table of Contents
TAL Education Group
Notes to Consolidated Financial Statements
For the Years Ended February 29, 2008, February 28, 2009
and February 28, 2010
(In U.S. dollars, except share and share related data)
Notes to Consolidated Financial Statements
For the Years Ended February 29, 2008, February 28, 2009
and February 28, 2010
(In U.S. dollars, except share and share related data)
| For the year ended | For the year ended | For the year ended | ||||||||||
| February 29, | February 28, | February 28, | ||||||||||
| 2008 | 2009 | 2010 | ||||||||||
| Net revenues | $ | 8,882,191 | $ | 37,475,583 | $ | 68,884,665 | ||||||
| Net income | $ | 1,512,572 | $ | 7,312,960 | $ | 14,260,357 | ||||||
| For the year ended | For the year ended | For the year ended | ||||||||||
| February 29, | February 28, | February 28, | ||||||||||
| 2008 | 2009 | 2010 | ||||||||||
| Net cash provided by operating activities | $ | 6,325,036 | $ | 24,956,771 | $ | 21,611,823 | ||||||
| Net cash used in investing activities | $ | (1,470,355 | ) | $ | (5,066,464 | ) | $ | (5,250,128 | ) | |||
| Net cash provided by/ (used in) financing activities | $ | 131,810 | $ | 365,508 | $ | (1,402,622 | ) | |||||
There are no consolidated VIE assets that are collateral for the VIE’s obligations and can only be used to settle the VIE’s obligations.
| 2. | Significant Accounting Policies |
Basis of presentation
The consolidated financial statements of the Group have been prepared in accordance with the accounting principles generally accepted in the United States of America (“US GAAP”).
Basis of consolidation
The consolidated financial statements include the financial statements of the Company, its wholly owned subsidiaries and its VIEs and their subsidiaries. All inter-company transactions and balances have been eliminated upon consolidation.
Use of estimates
The preparation of financial statements in conformity with US GAAP requires management to make estimates and assumptions that affect reported amounts of assets, liabilities, revenue and expenses, and the disclosure of contingent assets and liabilities. Actual results could differ from those estimates. Significant accounting estimates reflected in the Group’s consolidated financial statements include valuation allowance for deferred tax assets, the useful lives of property and equipment and intangible assets, impairment of available-for-sale securities, intangible assets, long-lived assets and goodwill.
Cash and cash equivalents
Cash and cash equivalents consist of cash on hand,7-days-notice bank deposits and principal-secured floating rate financial instruments which are unrestricted as to withdrawal or use, and which have original maturities of three months or less when purchased.
Available-for-sale securities
Available-for-sale securities are carried at their fair value. Unrealized gains and losses excluded from the changes in fair value are included in accumulated other comprehensive income.
F-11
Table of Contents
TAL Education Group
Notes to Consolidated Financial Statements
For the Years Ended February 29, 2008, February 28, 2009
and February 28, 2010
(In U.S. dollars, except share and share related data)
Notes to Consolidated Financial Statements
For the Years Ended February 29, 2008, February 28, 2009
and February 28, 2010
(In U.S. dollars, except share and share related data)
The Group reviews its available-for-sale securities for other-than-temporary impairment in accordance with authoritative guidance based on the specific identification method. The Group considers available quantitative and qualitative evidence in evaluating the potential impairment of its available-for-sale securities. If the cost of an investment exceeds the investment’s fair value, the Group considers, among other factors, general market conditions, expected future performance of the investees, the duration and the extent to which the fair value of the investment is less than the cost, and the Group’s intent and ability to hold the investment. Other-than-temporary impairments below costs are recognized as a loss in the consolidated statements of operations.
Property and equipment, net
Property and equipment are stated at cost less accumulated depreciation and amortization. Depreciation and amortization are calculated on a straight-line basis over the following estimated useful lives:
| Computer, network equipment and software | 3 years | |
| Vehicles | 4-5 years | |
| Office equipment and furniture | 3-5 years | |
| Leasehold improvement | Shorter of the lease term or estimated useful lives |
Acquired intangible assets, net
Acquired intangible assets other than goodwill consist of domain names, partnership agreement, trade name, student base, non-compete agreement, and educational license, and are carried at cost, less accumulated amortization and impairment. Amortization of acquired intangible assets, except student base, is calculated on a straight-line basis over the shorter of the contractual terms or the expected useful lives of the acquired assets. Student base is amortized using the estimated attrition pattern and graduation rates of the acquired schools. The amortization periods by major intangible asset classes are as follows:
| Trade name | 10.0 years | |
| Student base | 3.5 years | |
| Partnership agreement | 2.6-3.5 years | |
| Domain names | 3.0 years | |
| Non-compete agreement | 2.0-3.0 years | |
| Educational license | 0.9-2.0 years |
Impairment of long-lived assets
The Group reviews its long-lived assets for impairment whenever events or changes in circumstances indicate that the carrying amount of an asset may no longer be recoverable. When these events occur, the Group measures impairment by comparing the carrying value of the long-lived assets to the estimated undiscounted future cash flows expected to result from the use of the assets and their eventual disposition. If the sum of the expected undiscounted cash flow is less than the carrying amount of the assets, the Group would recognize an impairment loss based on the fair value of the assets.
Impairment of goodwill
Goodwill is not amortized but tested for impairment on an annual basis and between annual tests in certain circumstances. Goodwill impairment is tested using a two-step approach. The first step compares the
F-12
Table of Contents
TAL Education Group
Notes to Consolidated Financial Statements
For the Years Ended February 29, 2008, February 28, 2009
and February 28, 2010
(In U.S. dollars, except share and share related data)
Notes to Consolidated Financial Statements
For the Years Ended February 29, 2008, February 28, 2009
and February 28, 2010
(In U.S. dollars, except share and share related data)
fair value of a reporting unit to its carrying amount, including goodwill. If the fair value of the reporting unit is greater than its carrying amount, goodwill is not considered impaired and the second step is not required. If the fair value of the reporting unit is less than its carrying amount, the second step of the impairment test measures the amount of the impairment loss, if any, by comparing the implied fair value of goodwill to its carrying amount. If the carrying amount of goodwill exceeds its implied fair value, an impairment loss is recognized equal to that excess. The implied fair value of goodwill is calculated in the same manner that goodwill is calculated in a business combination, whereby the fair value of the reporting unit is allocated to all of the assets and liabilities of that unit, with the excess purchase price over the amounts assigned to assets and liabilities representing the implied fair value of goodwill. The Group determines each individual school as a reporting unit and performs its annual goodwill impairment test on the last day of each fiscal year.
Revenue recognition
Revenue is recognized when earned and is reported net of business tax.
The primary sources of the Group’s revenues are as follows:
(a) Educational programs and services
The educational programs and services primarily consist of after-school group tutoring and after-schoolone-on-one tutoring. Tuition revenue is generally collected in advance and is initially recorded as deferred revenue. Tuition revenue is recognized proportionately as the tutoring sessions are delivered.
For small-class courses consisting of more than seven classes per course, the Group offers refunds for any remaining classes to students who decide to withdraw from a course, provided the course is less than two-thirds completed at the time of withdrawal. After two-thirds of a course is delivered, no refund is allowed. For small-class courses with less than seven classes, no refund will be provided after the commencement of the courses. For personalized premium services, a student can withdraw at any time and receive a refund for the undelivered classes. The refund is recorded as a reduction of deferred revenue and has no impact on the recognized revenue. The Group has not experienced significant refunds in the past.
The Group sends out coupons to attract both existing and prospective students to enroll in its courses. The coupon has fixed dollar amounts and can only be used against future courses. The coupon is accounted for as a reduction of revenue when the relevant revenue is recognized in the consolidated statements of operations.
(b) Educational materials and others
The Group sells educational materials to students at the Group’s training centers. Revenue is recognized after a service contract is signed, the price is fixed or determinable, educational materials are delivered and collection of the receivables is reasonably assured.
Value added tax
TAL Beijing is subject to value added tax, VAT, for the inter-company sales of self-developed software in accordance with the PRC tax laws. For small scale VAT payer, the VAT rate is 3% of the gross sales and for general VAT payer, the VAT rate is 17% of the gross sales. TAL Beijing is deemed as general VAT payer since October 2009. As the entity sells self-developed software, it is eligible for VAT refund at the rate of 14% from the calendar year 2010.
F-13
Table of Contents
TAL Education Group
Notes to Consolidated Financial Statements
For the Years Ended February 29, 2008, February 28, 2009
and February 28, 2010
(In U.S. dollars, except share and share related data)
Notes to Consolidated Financial Statements
For the Years Ended February 29, 2008, February 28, 2009
and February 28, 2010
(In U.S. dollars, except share and share related data)
For the calendar year 2009, TAL Beijing filed its VAT return at the rate of 3%. For the calendar year 2010, it files its VAT return at a rate of 17% and enjoys a 14% VAT refund.
Operating leases
Leases where substantially all the rewards and risks of the ownership of the assets remain with the leasing companies are accounted for as operating leases. Payments made for the operating leases are charged to the consolidated statements of operations on a straight-line basis over the lease term and have been included in the operating expenses in the consolidated statements of operations.
Advertising costs
The Group expenses advertising costs as incurred. Total advertising costs incurred were $58,520, $119,081, and $487,333 for the years ended February 29, 2008, February 28, 2009 and 2010, respectively, and have been included in selling and marketing expenses in the consolidated statements of operations.
Foreign currency translation
The functional and reporting currency of the Company is the United States dollar. The functional currency of the Company’s PRC subsidiaries, VIEs and VIEs’ subsidiaries in the PRC is Renminbi (“RMB”).
Monetary assets and liabilities denominated in currencies other than the applicable functional currencies are translated into the functional currencies at the prevailing rates of exchange at the balance sheet date. Nonmonetary assets and liabilities are remeasured into the applicable functional currencies at historical exchange rates. Transactions in currencies other than the applicable functional currencies during the year are converted into the functional currencies at the applicable rates of exchange prevailing at the transaction dates. Transaction gains and losses are recognized in the consolidated statements of operations.
For translating the results of the PRC subsidiaries into the functional currency of the Company, assets and liabilities are translated from each subsidiary’s functional currency to the reporting currency at the exchange rate on the balance sheet date. Equity amounts are translated at historical exchange rates, and revenues, expenses, gains and losses are translated using the average rate for the period. Translation adjustments are reported as cumulative translation adjustments and are shown as a separate component of other comprehensive income in the consolidated statements of changes in equity and comprehensive income.
Income taxes
Deferred income taxes are recognized for temporary differences between the tax basis of assets and liabilities and their reported amounts in the financial statements, net of operating loss carry forwards and credits, by applying enacted statutory tax rates applicable to future years. Deferred tax assets are reduced by a valuation allowance when, in the opinion of management, it is more likely than not that some portion or all of the deferred tax assets will not be realized. Current income taxes are provided for in accordance with the laws and regulations applicable to the Group as enacted by the relevant tax authorities. The components of the deferred tax assets and liabilities are individually classified as current and non-current based on the characteristics of the underlying assets and liabilities.
The impact of an uncertain income tax position on the income tax return is recognized at the largest amount that is more-likely-than-not to be sustained upon audit by the relevant tax authorities. An uncertain income tax position will not be recognized if it has less than a 50% likelihood of being sustained. Interest and penalties on income taxes will be classified as a component of the provisions for income taxes.
F-14
Table of Contents
TAL Education Group
Notes to Consolidated Financial Statements
For the Years Ended February 29, 2008, February 28, 2009
and February 28, 2010
(In U.S. dollars, except share and share related data)
Notes to Consolidated Financial Statements
For the Years Ended February 29, 2008, February 28, 2009
and February 28, 2010
(In U.S. dollars, except share and share related data)
Comprehensive income
Comprehensive income includes net income, unrealized gain (loss) on available-for-sale securities, and foreign currency translation adjustments. Comprehensive income is reported in the consolidated statements of changes in equity and comprehensive income.
Concentration of credit risk
Financial instruments that potentially expose the Company to significant concentration of credit risk consist primarily of cash and cash equivalents. As of February 28, 2010, substantially all of the Group’s cash and cash equivalents were managed by financial institutions with high-credit ratings and quality.
Fair value of financial instruments
The Group’s financial instruments consist primarily of cash and cash equivalents, available-for-sale securities, amounts due from related parties, accounts payables, amounts due to related parties and convertible loan. The fair value of cash and cash equivalents, amounts due from related parties, accounts payables, and amounts due to related parties approximate their carrying amounts reported in the consolidated balance sheets due to the short-term maturity of these instruments. All highly liquid debt instruments purchased with original maturity of three months or less at the date of acquisition are included in cash and cash equivalents, which are reported at fair value.
Net income per share
Basic net income per share is computed by dividing net income attributable to common shareholders of the Company by the weighted average number of common shares outstanding during the year using the two-class method. Under the two-class method, net income is allocated on a pro rata basis to each class of common shares and other participating securities based on their participating rights.
The holders of Series A convertible redeemable preferred shares are entitled to share dividends on a pro rata basis, as if their shares had been converted into Class B common shares. Accordingly, the Company has used the two-class method in computing net income per share.
Fair value
Fair value is the price that would be received from selling an asset or paid to transfer a liability in an orderly transaction between market participants at the measurement date. When determining the fair value measurements for assets and liabilities required or permitted to be recorded at fair value, the Group considers the principal or most advantageous market in which it would transact and it considers assumptions that market participants would use when pricing the asset or liability.
Authoritative literature provides a fair value hierarchy, which prioritizes the inputs to valuation techniques used to measure fair value into three broad levels. The level in the hierarchy within which the fair value measurement in its entirety falls is based upon the lowest level of input that is significant to the fair value measurement as follows:
Level 1
Level 1 applies to assets or liabilities for which there are quoted prices in active markets for identical assets or liabilities.
F-15
Table of Contents
TAL Education Group
Notes to Consolidated Financial Statements
For the Years Ended February 29, 2008, February 28, 2009
and February 28, 2010
(In U.S. dollars, except share and share related data)
Notes to Consolidated Financial Statements
For the Years Ended February 29, 2008, February 28, 2009
and February 28, 2010
(In U.S. dollars, except share and share related data)
Level 2
Level 2 applies to assets or liabilities for which there are inputs other than quoted prices included within Level 1 that are observable for the assets or liabilities such as quoted prices for similar assets or liabilities in active markets; quoted prices for identical assets or liabilities in markets with insufficient volume or infrequent transactions (less active markets); or model-derived valuations in which significant inputs are observable or can be derived principally from, or corroborated by, observable market data.
Level 3
Level 3 applies to assets or liabilities for which there are unobservable inputs to the valuation methodology that are significant to the measurement of the fair value of the assets or liabilities.
Beneficial conversion feature
For convertible instruments, a beneficial conversion feature is recognized when the conversion price is less than the fair value of the common stock into which the instrument is converted. For convertible instruments that have a stated redemption date (such as debt and mandatorily redeemable preferred stock), the discount resulting from recording a beneficial conversion option is accreted from the date of issuance to the stated redemption date of the convertible instrument, regardless of when the earliest conversion date occurs.
In circumstances in which the instrument is converted prior to amortization of the full amount of the discount, the remaining unamortized discount at the date of conversion is immediately recognized as interest expense or as a dividend, as appropriate.
Recently issued accounting standards
In June 2009, the FASB issued an authoritative pronouncement to amend the accounting rules for variable interest entities (VIEs). The amendments effectively replace the quantitative-basedrisks-and-rewards calculation for determining which reporting entity, if any, has a controlling financial interest in a variable interest entity with an approach focused on identifying which reporting entity has (1) the power to direct the activities of a variable interest entity that most significantly affect the entity’s economic performance and (2) the obligation to absorb losses of, or the right to receive benefits from, the entity. Additionally, an enterprise is required to assess whether it has an implicit financial responsibility to ensure that a variable interest entity operates as designed when determining whether it has the power to direct the activities of the variable interest entity that most significantly impact the entity’s economic performance. The new guidance also requires additional disclosures about a reporting entity’s involvement with variable interest entities and about any significant changes in risk exposure as a result of that involvement.
The new guidance is effective at the start of a reporting entity’s first fiscal year beginning after November 15, 2009, and all interim and annual periods thereafter. The new VIE model requires that, upon adoption, a reporting entity should determine whether an entity is a VIE, and whether the reporting entity is the VIE’s primary beneficiary, as of the date that the reporting entity first became involved with the entity, unless an event requiring reconsideration of those initial conclusions occurred after that date. When making this determination, a reporting entity must assume that new guidance had been effective from the date of its first involvement with the entity. The Group adopted the new guidance on March 1, 2010.
The Company has had two VIEs, which it has consolidated under the authoritative literature prior to the amendment discussed above because it was the primary beneficiary of those entities. Because the Company, through its wholly owned subsidiary, has (1) the power to direct the activities of the two VIEs that most
F-16
Table of Contents
TAL Education Group
Notes to Consolidated Financial Statements
For the Years Ended February 29, 2008, February 28, 2009
and February 28, 2010
(In U.S. dollars, except share and share related data)
Notes to Consolidated Financial Statements
For the Years Ended February 29, 2008, February 28, 2009
and February 28, 2010
(In U.S. dollars, except share and share related data)
significantly affect the entity’s economic performance and (2) the right to receive benefits from the two VIES, it will continue to consolidate the two VIEs upon the adoption of the new guidance which therefore, other than for additional disclosures including those for prior periods, had no accounting impact.
In October 2009, the Financial Accounting Standards Board (“FASB”) issued an authoritative pronouncement regarding revenue arrangements with multiple deliverables. This pronouncement was issued in response to practice concerns related to the accounting for revenue arrangements with multiple deliverables under an existing pronouncement. Although the new pronouncement retains the criteria from an existing pronouncement for when delivered items in a multiple-deliverable arrangement should be considered separate units of accounting, it removes the previous separation criterion under existing pronouncements that objective and reliable evidence of the fair value of any undelivered items must exist for the delivered items to be considered a separate unit or separate units of accounting. The new pronouncement is effective for fiscal years beginning on or after June 15, 2010. Entities can elect to apply this pronouncement (1) prospectively to new or materially modified arrangements after the pronouncement’s effective date or (2) retrospectively for all periods presented. Early application is permitted; however, if the entity elects prospective application and early adopts this pronouncement after its first interim reporting period, it must also do the following in the period of adoption: (1) retrospectively apply this pronouncement as of the beginning of that fiscal year; and (2) disclose the effect of the retrospective adjustments on the prior interim periods’ revenue, income before taxes, net income, and earnings per share. The Group is in the process of evaluating the effect of adoption of this pronouncement.
In October 2009, the FASB issued an authoritative pronouncement regarding software revenue recognition. This new pronouncement amends an existing pronouncement to exclude from its scope all tangible products containing both software and non-software components that function together to deliver the product’s essential functionality. That is, the entire product (including the software deliverables and non-software deliverables) would be outside the scope of software revenue recognition and would be accounted for under other accounting literature. The new pronouncement includes factors that entities should consider when determining whether the software and non-software components function together to deliver the product’s essential functionality and are thus outside the revised scope of the authoritative literature that governs software revenue recognition. The pronouncement is effective for fiscal years beginning on or after June 15, 2010. Entities can elect to apply this pronouncement (1) prospectively to new or materially modified arrangements after the pronouncement’s effective date or (2) retrospectively for all periods presented. Early application is permitted; however, if the entity elects prospective application and early adopts this pronouncement after its first interim reporting period, it must also do the following in the period of adoption: (1) retrospectively apply this pronouncement as of the beginning of that fiscal year; and (2) disclose the effect of the retrospective adjustments on the prior interim periods’ revenue, income before taxes, net income, and earnings per share. The Group is in the process of evaluating the effect of adoption of this pronouncement.
In April 2010, the FASB issued an authoritative pronouncement on milestone method of revenue recognition. The scope of this pronouncement is limited to arrangements that include milestones relating to research or development deliverables. The pronouncement specifies guidance that must be met for a vendor to recognize consideration that is contingent upon achievement of a substantive milestone in its entirety in the period in which the milestone is achieved. The guidance applies to milestones in arrangements within the scope of this consensus regardless of whether the arrangement is determined to have single or multiple deliverables or units of accounting. The pronouncement will be effective for fiscal years, and interim periods within those years, beginning on or after June 15, 2010. Early application is permitted. Companies can apply this guidance prospectively to milestones achieved after adoption. However, retrospective application to all
F-17
Table of Contents
TAL Education Group
Notes to Consolidated Financial Statements
For the Years Ended February 29, 2008, February 28, 2009
and February 28, 2010
(In U.S. dollars, except share and share related data)
Notes to Consolidated Financial Statements
For the Years Ended February 29, 2008, February 28, 2009
and February 28, 2010
(In U.S. dollars, except share and share related data)
prior periods is also permitted. The Group is in the process of evaluating the effect of adoption of this pronouncement.
In April 2010, the FASB issued an authoritative pronouncement on effect of denominating the exercise price of a share-based payment award in the currency of the market in which the underlying equity securities trades and that currency is different from (1) entity’s functional currency, (2) functional currency of the foreign operation for which the employee provides services, and (3) payroll currency of the employee. The guidance clarifies that an employee share-based payment award with an exercise price denominated in the currency of a market in which a substantial portion of the entity’s equity securities trades should be considered an equity award assuming all other criteria for equity classification are met. The pronouncement will be effective for interim and annual periods beginning on or after December 15, 2010, and will be applied prospectively. Affected entities will be required to record a cumulativecatch-up adjustment for all awards outstanding as of the beginning of the annual period in which the guidance is adopted. The Group is in the process of evaluating the effect of adoption of this pronouncement.
| 3. | Acquisitions |
In the year ended February 28, 2009, the Group made five business acquisitions. Each acquisition has been recorded using the purchase method of accounting, and accordingly, the acquired assets and liabilities were recorded at their fair value at the date of purchase. The results of these acquired entities’ operations have been included in the consolidated financial statements since the date of purchase.
Acquisition in Wuhan
On July 1, 2008, Xueersi Network acquired 100% equity interest in Wuhan School. Pursuant to the original acquisition agreement, $918,260 would be paid by cash (of which $712,745 was paid by February 28, 2010), while $393,540 would be settled by cash or the Class B common shares of the Company on the closing of a qualified IPO at the discretion of the target, provided such qualified IPO occurred within two years. Absent an IPO in the specified period, $393,540 would be increased to $787,080 and be settled in cash.
Since the completion of a qualified IPO is beyond the Company’s control, the Company accounted for $787,080 as a liability incurred upon the acquisition.
F-18
Table of Contents
TAL Education Group
Notes to Consolidated Financial Statements
For the Years Ended February 29, 2008, February 28, 2009
and February 28, 2010
(In U.S. dollars, except share and share related data)
Notes to Consolidated Financial Statements
For the Years Ended February 29, 2008, February 28, 2009
and February 28, 2010
(In U.S. dollars, except share and share related data)
The purchase price of Wuhan School was allocated as follows:
| Amortization | ||||||||||||
| period | ||||||||||||
| Cash and cash equivalents | $ | 12,504 | ||||||||||
| Property and equipment | 3,189 | |||||||||||
| Intangible assets acquired: | ||||||||||||
| Student base | 177,822 | 3.50 years | ||||||||||
| Partnership agreement | 97,656 | 3.50 years | ||||||||||
| Non-compete agreement | 2,915 | 2.00 years | ||||||||||
| Education license | 2,915 | 1.50 years | ||||||||||
| Goodwill | 1,338,753 | |||||||||||
| Deferred tax liabilities | (70,327 | ) | ||||||||||
| Payable for business acquisition-current | 550,956 | |||||||||||
| Payable for business acquisition-non-current | 367,304 | |||||||||||
| Obligation absent of IPO | 787,080 | |||||||||||
| Total acquisition obligation | 1,705,340 | |||||||||||
Less | ||||||||||||
| Discount to present value at date of acquisition | (139,913 | ) | ||||||||||
| Total purchase consideration | $ | 1,565,427 | ||||||||||
The purchase price allocation described above was based on a valuation analysis provided by American Appraisal China Limited, a third party valuation firm. The valuation analysis utilizes and considers generally accepted valuation methodologies such as the income, market and cost approach. The Company has incorporated certain assumptions, which include projected cash flows. The company renegotiated the above acquisition agreement (See Note 4).
Acquisition in Shanghai
On August 1, 2008, Xueersi Network acquired 100% equity interest in Shanghai Lehai and its two 100% owned subsidiaries, Minhang School and Changning School. According to the acquisition agreements, $1,027,577, or 50% of the total consideration is contingent upon the two original shareholders’ continuing employment with Shanghai Lehai for at least three years after the acquisition. As the contingent consideration arrangement would be automatically forfeited if any of these two original shareholders terminateshis/her employment with Shanghai Lehai, the amount has been accounted for as employment compensation for post-combination services of the original shareholders. As of February 28, 2010, the purchase price was paid in full.
F-19
Table of Contents
TAL Education Group
Notes to Consolidated Financial Statements
For the Years Ended February 29, 2008, February 28, 2009
and February 28, 2010
(In U.S. dollars, except share and share related data)
Notes to Consolidated Financial Statements
For the Years Ended February 29, 2008, February 28, 2009
and February 28, 2010
(In U.S. dollars, except share and share related data)
The purchase price of Shanghai Lehai was allocated as follows:
| Amortization | ||||||||
| period | ||||||||
| Cash and cash equivalents | $ | 173,832 | ||||||
| Prepaid expense and other current assets | 102,010 | |||||||
| Property and equipment | 157,523 | |||||||
| Accrued expense and other current liabilities | (344,380 | ) | ||||||
| Income tax payable | (1,585 | ) | ||||||
| Intangible assets acquired: | ||||||||
| Partnership agreement | 330,865 | 3.50 years | ||||||
| Trade name | 262,360 | 10.00 years | ||||||
| Student base | 164,704 | 3.50 years | ||||||
| Non-compete agreement | 16,033 | 3.00 years | ||||||
| Education license | 3,207 | 1.67 years | ||||||
| Goodwill | 357,300 | |||||||
| Deferred tax liabilities | (194,292 | ) | ||||||
| Total consideration | $ | 1,027,577 | ||||||
The purchase price allocation described above was based on a valuation analysis provided by American Appraisal China Limited, a third party valuation firm. The valuation analysis utilizes and considers generally accepted valuation methodologies such as the income, market and cost approach. The Company has incorporated certain assumptions, which include projected cash flows.
The Group also made other acquisitions during the fiscal year ended February 28, 2009 in Tianjin, Qianjiang, and Jianli, for a total consideration of $605,754.
The results of operations for the 100% equity interest of all these acquired entities have been included in the Group’s consolidated financial statements from their respective acquisition date. The acquired goodwill is not deductible for tax purposes.
F-20
Table of Contents
TAL Education Group
Notes to Consolidated Financial Statements
For the Years Ended February 29, 2008, February 28, 2009
and February 28, 2010
(In U.S. dollars, except share and share related data)
Notes to Consolidated Financial Statements
For the Years Ended February 29, 2008, February 28, 2009
and February 28, 2010
(In U.S. dollars, except share and share related data)
Pro forma
The following summary of unaudited pro forma results of operations of five acquired businesses for the years ended February 29, 2008 and February 28, 2009 was presented with the assumption that all the five acquisitions described above during the year ended February 28, 2009 occurred as of March 1, 2007 and 2008, respectively. These pro forma results have been prepared for comparative purposes only and do not purport to be indicative of the results of operations which would have resulted had the significant acquisitions occurred as of March 1, 2007 and 2008, nor are they indicative of future operating results.
| For the years ended | ||||||||
| February 29, | February 28, | |||||||
| 2008 | 2009 | |||||||
| (unaudited) | (unaudited) | |||||||
| Net revenues | $ | 9,517,600 | $ | 37,876,116 | ||||
| Net income attributable to TAL Education Group | $ | 1,546,449 | $ | 6,598,516 | ||||
| Net income per common share | ||||||||
| Basic | $ | 0.01 | $ | 0.02 | ||||
| Diluted | $ | 0.01 | $ | 0.02 | ||||
| Net income per Series A | ||||||||
| convertible redeemable preferred share—Basic | — | $ | 17.68 | |||||
| 4. | Extinguishment of Liabilities |
In January 2009, the performance of Wuhan School was not in line with expectations at the time of the purchase. Since the Company had not yet fully paid the acquisition obligation, Xueersi Network renegotiated with the original shareholders of Wuhan School to adjust the remaining payments.
The acquisition payable at that time was $1,605,625 and was reduced to $874,533 and will be settled in cash. As a result, Xueersi Network’s acquisition payables of $731,092 were waived. This amount was treated as a gain on extinguishment of liabilities for the year ended February 28, 2009.
| 5. | Available-for-Sale Securities |
In August 2007 and December 2009, the Group bought two securities in mutual funds named Wan Jia He Xie Financing Fund and Guo Du No. 1 An Xin Shou Yi, respectively. The securities were classified asavailable-for-sale securities and reported at fair value.
F-21
Table of Contents
TAL Education Group
Notes to Consolidated Financial Statements
For the Years Ended February 29, 2008, February 28, 2009
and February 28, 2010
(In U.S. dollars, except share and share related data)
Notes to Consolidated Financial Statements
For the Years Ended February 29, 2008, February 28, 2009
and February 28, 2010
(In U.S. dollars, except share and share related data)
Theavailable-for-sale securities measured and recorded at fair value on a recurring basis were as follows:
| Balance as of March 1, 2007 | $ | — | ||
| Purchase | 660,519 | |||
| Foreign exchange difference | 42,567 | |||
Changes in fair value(1) | (73,623 | ) | ||
| Balance as of February 29, 2008 | 629,463 | |||
Changes in fair value(1) | (289,045 | ) | ||
| Balances as of February 28, 2009 | 340,418 | |||
| Purchase | 1,464,231 | |||
| Changes in fair value | 112,708 | |||
| Foreign exchange difference | 799 | |||
| Balance as of February 28, 2010 | $ | 1,918,156 | ||
| (1) | The Group determined the decline to be other-than temporary due to the continuing challenging global financial markets, poor performance of the equity markets, as well as the duration and the extent to which the fair value of the securities had continued to be less than the cost and therefore booked an impairment loss in the income statement of $266,111, net of tax effect of $96,557. |
The Group values the mutual funds using quoted price in active market to determine the fair value ofavailable-for-sale securities (Level 1 valuation). The following provides additional information concerning the Group’savailable-for-sale securities:
| As of February 28, 2009 | As of February 28, 2010 | |||||||||||||||||||||||||||||||
| Gross | Gross | Gross | Gross | |||||||||||||||||||||||||||||
| unrealized | unrealized | unrealized | unrealized | |||||||||||||||||||||||||||||
| Cost | gains | (losses) | Fair value | Cost | gains | (losses) | Fair value | |||||||||||||||||||||||||
| Mutual fund | $ | 340,418 | $ | — | $ | — | $ | 340,418 | $ | 1,805,448 | $ | 120,678 | $ | (7,970 | ) | $ | 1,918,156 | |||||||||||||||
| 6. | Prepaid Expenses and Other Current Assets |
Prepaid expenses and other current assets consisted of the following:
| As of | As of | |||||||
| February 28, | February 28, | |||||||
| 2009 | 2010 | |||||||
| Prepaid rent | $ | 797,674 | $ | 1,344,238 | ||||
| Prepayments to suppliers | 391,049 | 305,782 | ||||||
| Staff advances | 165,257 | 450,705 | ||||||
| Others | 60,943 | 180,216 | ||||||
| $ | 1,414,923 | $ | 2,280,941 | |||||
F-22
Table of Contents
TAL Education Group
Notes to Consolidated Financial Statements
For the Years Ended February 29, 2008, February 28, 2009
and February 28, 2010
(In U.S. dollars, except share and share related data)
Notes to Consolidated Financial Statements
For the Years Ended February 29, 2008, February 28, 2009
and February 28, 2010
(In U.S. dollars, except share and share related data)
| 7. | Property and Equipment, Net |
Property and equipment, net, consisted of the following:
| As of | As of | |||||||
| February 28, | February 28, | |||||||
| 2009 | 2010 | |||||||
| Leasehold improvement | $ | 1,280,185 | $ | 3,399,250 | ||||
| Computer, network equipment and software | 869,600 | 2,293,808 | ||||||
| Vehicles | 458,412 | 624,296 | ||||||
| Office equipment and furniture | 377,318 | 462,112 | ||||||
| Less: accumulated depreciation and amortization | (514,178 | ) | (1,787,976 | ) | ||||
| $ | 2,471,337 | $ | 4,991,490 | |||||
For the years ended February 29, 2008, February 28, 2009 and 2010, depreciation expenses were $46,416, $452,009, and $1,272,074, respectively.
| 8. | Intangible Assets, Net |
Intangible assets, net, consisted of the following:
| As of | As of | |||||||
| February 28, | February 28, | |||||||
| 2009 | 2010 | |||||||
| Domain names | $ | 1,846,858 | $ | 1,846,858 | ||||
| Partnership agreement | 425,576 | 425,576 | ||||||
| Student base | 348,566 | 348,566 | ||||||
| Trade name | 262,360 | 262,360 | ||||||
| Non-compete agreement | 19,200 | 19,200 | ||||||
| Education license | 9,902 | 9,902 | ||||||
| Less: accumulated amortization | (696,148 | ) | (1,537,341 | ) | ||||
| Add: foreign exchange difference | 10,029 | 14,039 | ||||||
| $ | 2,226,343 | $ | 1,389,160 | |||||
Domain names were acquired from third parties. The rest of intangible assets were recorded as a result of the acquisitions of the five businesses in the year ended February 28, 2009 (see Note 3).
The Group recorded amortization expense of $114,536, $565,300, and $841,193 for the years ended February 29, 2008, February 28, 2009, and 2010, respectively.
Estimated amortization expenses of the existing intangible assets for the next five years are $717,070, $502,879, $26,371, $26,371 and $26,371, respectively.
F-23
Table of Contents
TAL Education Group
Notes to Consolidated Financial Statements
For the Years Ended February 29, 2008, February 28, 2009
and February 28, 2010
(In U.S. dollars, except share and share related data)
Notes to Consolidated Financial Statements
For the Years Ended February 29, 2008, February 28, 2009
and February 28, 2010
(In U.S. dollars, except share and share related data)
| 9. | Accrued Expenses and Other Current Liabilities |
Accrued expenses and other current liabilities consisted of the following:
| As of | As of | |||||||
| February 28, | February 28, | |||||||
| 2009 | 2010 | |||||||
| Accrued payroll and bonus | $ | 2,303,069 | $ | 3,893,895 | ||||
| Social insurance payable | 38,791 | 453,081 | ||||||
| Payable for business acquisitions | 533,035 | 513,062 | ||||||
| Other taxes payable | 634,397 | 1,343,425 | ||||||
| Others | 100,505 | 614,353 | ||||||
| Total | $ | 3,609,797 | $ | 6,817,816 | ||||
| Payable for the acquisition of a school in Tianjin | $ | 76,760 | ||||||
| Payable for the acquisition of Jianli School | 137,257 | |||||||
| Payable for the acquisition of Qianjiang School | 137,257 | |||||||
| Payable for the acquisition of Wuhan School | 161,788 | |||||||
| Payable for business acquisitions | $ | 513,062 | ||||||
| 10. | Convertible Loan |
On January 30, 2010, a third party agreed to provide the Company a $500,000 convertible loan, which bears an annual interest rate of 15% and will mature on January 30, 2012. The interest is payable annually. Subject to mutual agreement, the date of maturity may be extended to January 30, 2015.
The loan is convertible at the option of the holder, at any time, into such number of Class B common shares of the Company as determined by dividing $500,000 by the conversion price. The conversion price was initially set at $50 per share and then subject to adjustments for dilution, including but not limited to issuance of additional Class B common shares and share split.
As of the balance sheet date, the conversion option of the convertible loan does not meet the criteria for an embedded derivative. If the conversion option survives an IPO, it would be required to be bifurcated and accounted for separately as a derivative.
As of February 28, 2010, the fair value of the convertible loan approximated its carrying amount since the effective interest rate did not fluctuate significantly during its one month outstanding period.
| 11. | Income Taxes |
Cayman Islands
The Company is a tax-exempted company incorporated in the Cayman Islands.
Hong Kong
Xueersi Hong Kong was established in Hong Kong in March 2008. Xueersi Hong Kong is subject to Hong Kong Profits Tax on its activities conducted in Hong Kong. It was subject to Hong Kong profit tax at
F-24
Table of Contents
TAL Education Group
Notes to Consolidated Financial Statements
For the Years Ended February 29, 2008, February 28, 2009
and February 28, 2010
(In U.S. dollars, except share and share related data)
Notes to Consolidated Financial Statements
For the Years Ended February 29, 2008, February 28, 2009
and February 28, 2010
(In U.S. dollars, except share and share related data)
16.5%. No provision for Hong Kong Profits tax has been made in the consolidated financial statements as it has no assessable income for the years ended February 28, 2009, and 2010.
PRC
The subsidiaries incorporated in the PRC were generally subject to a corporate income tax rate of 33% prior to January 1, 2008 except for those subsidiaries that enjoyed tax holidays or preferential tax treatment. Xueersi Network and Haidian Xueersi were entitled to a one year tax exemption in calendar year 2007 as they were newly established companies in calendar year 2007.
Effective from January 1, 2008, a new Enterprise Income Tax Law, or (“the New EIT Law”), combined the previous income tax laws for foreign invested and domestic invested enterprises in the PRC by the adoption a unified tax rate of 25% for most enterprises with the following exceptions.
Certain qualified high and new technology enterprises that meet the definition of “high and new technology enterprise strongly supported by the state” (“HNTE”) could benefit from a preferential tax rate of 15%. Xueersi Education qualified as a HNTE under the New EIT Law effective from January 1, 2008 and therefore for a preferential tax rate of 15%. In addition, since the entity is located in a high technology zone in Beijing and qualified as a high-tech company, it was entitled to a three-year exemption from the enterprise income tax from calendar year 2006 to 2008 and a further tax reduction to a rate of 7.5% from calendar year 2009 to 2011.
Accordingly, in calculating deferred tax assets and liabilities, the Group assumed Xueersi Education will continue to renew the new HNTE status at the conclusion of the initial three-year period. If Xueersi Education failed to obtain such renewals after 2010, then the deferred tax assets as of February 28, 2010 would increase by $29,259.
TAL Beijing was qualified as “Newly Established Software Enterprise” and therefore it was entitled to a two-year exemption from EIT from calendar year 2009 to 2010 and a further reduction to 12.5% from calendar year 2011 to 2013.
Provision (credit) for income tax consisted of the following:
| For the year ended | For the year ended | For the year ended | ||||||||||
| February 29, | February 28, | February 28, | ||||||||||
| 2008 | 2009 | 2010 | ||||||||||
| Current — | ||||||||||||
| PRC income tax expenses | $ | 304,620 | $ | 2,620,738 | $ | 1,936,420 | ||||||
| Deferred — | ||||||||||||
| PRC income tax expenses | (139,879 | ) | (602,485 | ) | (557,895 | ) | ||||||
| Total | $ | 164,741 | $ | 2,018,253 | $ | 1,378,525 | ||||||
F-25
Table of Contents
TAL Education Group
Notes to Consolidated Financial Statements
For the Years Ended February 29, 2008, February 28, 2009
and February 28, 2010
(In U.S. dollars, except share and share related data)
Notes to Consolidated Financial Statements
For the Years Ended February 29, 2008, February 28, 2009
and February 28, 2010
(In U.S. dollars, except share and share related data)
Deferred income taxes reflect the net tax effects of temporary differences between the carrying amount of assets and liabilities for financial reporting purposes and the amounts used for income tax purposes. Significant components of the Group’s deferred tax assets and liabilities were as follows:
| As of | As of | |||||||
| February 28, | February 28, | |||||||
| 2009 | 2010 | |||||||
| Current deferred tax assets: | ||||||||
| Undistributed payroll | $ | 510,275 | $ | 903,939 | ||||
| Less: valuation allowance | (29,146 | ) | (72,642 | ) | ||||
| Current deferred tax assets, net | 481,129 | 831,297 | ||||||
| Non-current deferred tax assets: | ||||||||
| Property and equipment | 35,434 | 134,915 | ||||||
| Intangible assets | 70,558 | 163,003 | ||||||
| Tax losses carry-forward deferred tax assets | 137,639 | 303,909 | ||||||
| Less: valuation allowance | (112,342 | ) | (317,859 | ) | ||||
| Non-current deferred tax assets, net | 131,289 | 283,968 | ||||||
| Non-current deferred tax liabilities: | ||||||||
| Intangible assets | 203,776 | 147,433 | ||||||
Unrealized gain onavailable-for-sale securities | — | 28,177 | ||||||
| Non-current deferred tax liabilities | $ | 203,776 | $ | 175,610 | ||||
As of February 28, 2010, tax loss carry-forward amounted to $1,251,685 and would expire by the end of calendar year 2015. The Group operates its business through its subsidiaries, its VIEs and their subsidiaries. The Group does not file combined or consolidated tax returns, therefore, losses from individual subsidiaries or the VIEs and their subsidiaries may not be used to offset other subsidiaries’ or VIEs’ earnings within the Group. Valuation allowance is considered on each individual subsidiary and VIE basis. A valuation allowance of $390,501 had been established as of February 28, 2010, in respect of certain deferred tax assets as it is considered more likely than not that the relevant deferred tax assets will not be realized in the foreseeable future.
Under US GAAP, a deferred tax liability should be recorded for taxable temporary differences attributable to the excess of financial reporting amounts over tax basis amounts, including those differences attributable to a more than 50% interest in a domestic subsidiary. However, recognition is not required in situations where the tax law provides a means by which the reported amount of that investment can be recovered tax-free and the enterprise expects that it will ultimately use that means. The Company has not recorded any such deferred tax liability attributable to the undistributed earnings of its financial interest in VIEs because it believes such excess earnings can be distributed in a manner that would not be subject to income tax.
The impact of an uncertain income tax position on the income tax return is recognized at the largest amount that is more-likely-than-not to be sustained upon audit by the relevant tax authority. An uncertain income tax position will not be recognized if it has less than a 50% likelihood of being sustained. Interest and penalties on income taxes will be classified as a component of the provisions for income taxes. The Group has concluded that there are no significant uncertain tax positions requiring recognition in financial statements for
F-26
Table of Contents
TAL Education Group
Notes to Consolidated Financial Statements
For the Years Ended February 29, 2008, February 28, 2009
and February 28, 2010
(In U.S. dollars, except share and share related data)
Notes to Consolidated Financial Statements
For the Years Ended February 29, 2008, February 28, 2009
and February 28, 2010
(In U.S. dollars, except share and share related data)
the years ended February 29, 2008, February 28, 2009 and 2010. The Group did not incur any interest and penalties related to potential underpaid income tax expenses and also does not anticipate any significant increases or decreases in unrecognized tax benefits in the next 12 months. The Group has no material unrecognized tax benefits which would favorably affect the effective income tax rate in future periods. The years 2007 to 2009 remain subject to examination by the PRC tax authorities.
Reconciliation between the provision for income taxes computed by applying the PRC EIT rates of 33% in calendar year 2007, and 25% in calendar year 2008 and 2009 to income before income taxes and the actual provision for income tax was as follows:
| For the year ended | For the year ended | For the year ended | ||||||||||
| February 29, | February 28, | February 28, | ||||||||||
| 2008 | 2009 | 2010 | ||||||||||
| Net income before provision for income tax | $ | 1,677,313 | $ | 9,298,922 | $ | 15,623,484 | ||||||
| PRC statutory tax rate | 33 | % (1) | 25 | % | 25 | % | ||||||
| Income tax at statutory tax rate | 553,513 | 2,324,731 | 3,905,871 | |||||||||
| Expenses not deductible for tax purposes: | ||||||||||||
| Salaries and employees’ benefits | 64,410 | 214,023 | — | |||||||||
| Other expenses not deductable | 23,593 | 257,357 | 289,945 | |||||||||
| Effect of income tax exemptions | (476,775 | ) | (923,868 | ) | (3,070,154 | ) | ||||||
| Effect of income tax rate difference in other jurisdictions | — | 5,527 | 3,850 | |||||||||
| Change in valuation allowance | — | 140,483 | 249,013 | |||||||||
| Provision for income tax | $ | 164,741 | $ | 2,018,253 | $ | 1,378,525 | ||||||
| (1) | PRC statutory tax rate was 33% for the period between March 1, 2007 and December 31, 2007 and 25% for the period between January 1, 2008 and February 29, 2008. |
If Xueersi Education, Xueersi Network and Haidian Xueersi were not in a tax holiday period for the years ended February 29, 2008, February 28, 2009 and 2010, the provision for income tax and earnings per share amounts would be as follows:
| For the year ended | For the year ended | For the year ended | ||||||||||
| February 29, | February 28, | February 28, | ||||||||||
| 2008 | 2009 | 2010 | ||||||||||
| Provision for income tax | $ | 476,775 | $ | 923,868 | $ | 3,070,154 | ||||||
| Net income per common share-basic | $ | 0.01 | $ | 0.02 | $ | 0.09 | ||||||
| Net income per Series A preferred share-basic | $ | — | $ | 17.68 | $ | 0.09 | ||||||
| Net income per common share-diluted | $ | 0.01 | $ | 0.02 | $ | 0.09 | ||||||
New EIT Law includes a provision specifying that legal entities organized outside of the PRC will be considered residents for Chinese Income tax purposes if the place of effective management or control is within the PRC. The implementation rules to the New EIT Law provide that non-resident legal entities will be considered PRC residents if substantial and overall management and control over the manufacturing and business operations, personnel, accounting, properties, etc, occurs within the PRC. Despite the present
F-27
Table of Contents
TAL Education Group
Notes to Consolidated Financial Statements
For the Years Ended February 29, 2008, February 28, 2009
and February 28, 2010
(In U.S. dollars, except share and share related data)
Notes to Consolidated Financial Statements
For the Years Ended February 29, 2008, February 28, 2009
and February 28, 2010
(In U.S. dollars, except share and share related data)
uncertainties resulting from the limited PRC tax guidance on the issue, the Group does not believe that the legal entities organized outside of the PRC within the Group should be treated as residents for EIT law purposes. If the PRC tax authorities subsequently determine that the Company and its subsidiaries registered outside the PRC should be deemed a resident enterprise, the Company and its subsidiaries registered outside the PRC will be subject to the PRC income tax at a rate of 25%.
If the Company were to be non-resident for PRC tax purpose, dividends paid to it out of profits earned after January 1, 2008 would be subject to a withholding tax. In the case of dividends paid by PRC subsidiaries, the withholding tax would be 10%.
Aggregate undistributed earnings of the Company’s subsidiaries located in the PRC that are available for distribution to the Company of approximately $4,311,088 and $18,202,179 as of February 28, 2009 and 2010, respectively, are considered to be indefinitely reinvested and accordingly, no provision has been made for the Chinese dividend withholding taxes that would be payable upon the distribution of those amounts to the Company. The Chinese tax authorities have also clarified that distributions made out of pre January 1, 2008 retained earnings will not be subject to the withholding tax.
| 12. | Impairment Loss on Intangible Assets and Goodwill |
Impairment loss on intangible assets
For the year ended February 28, 2009, the performance of Qianjiang School, Jianli School and Wuhan School was not in line with expectations. As a result, partnership agreement, student base, non-compete agreement and education license generated from the acquisitions of these three schools with a total carrying amount of $591,747 were written down to their fair value of $232,376.
Impairment loss on intangible assets for the years ended February 29, 2008, February 28, 2009 and 2010 was $nil, $359,371 and $nil, respectively.
Impairment loss on goodwill
Changes in the carrying amount of goodwill for the years ended February 28, 2009 and 2010 consisted of the following:
| As of February 28, | ||||||||
| 2009 | 2010 | |||||||
Goodwill | ||||||||
| Beginning balance | $ | — | $ | 762,272 | ||||
| Goodwill recognized in business acquisition | 2,021,450 | — | ||||||
| Impairment | (1,256,084 | ) | — | |||||
| Foreign exchange difference due to translation | (3,094 | ) | 1,530 | |||||
| Ending balance | $ | 762,272 | $ | 763,802 | ||||
Accumulated goodwill impairment | ||||||||
| Beginning balance | $ | — | $ | (1,256,084 | ) | |||
| Impairment | (1,256,084 | ) | — | |||||
| Ending balance | $ | (1,256,084 | ) | $ | (1,256,084 | ) | ||
F-28
Table of Contents
TAL Education Group
Notes to Consolidated Financial Statements
For the Years Ended February 29, 2008, February 28, 2009
and February 28, 2010
(In U.S. dollars, except share and share related data)
Notes to Consolidated Financial Statements
For the Years Ended February 29, 2008, February 28, 2009
and February 28, 2010
(In U.S. dollars, except share and share related data)
As the performance of Wuhan School was not in line with expectations at the time of the purchase, the Group determined this to be a triggering event to perform the goodwill impairment test before the annual impairment test. On January 31, 2009, the Group recognized an impairment loss of $1,187,830 for the goodwill arising from the acquisition of Wuhan School.
The Group recognized a $68,254 impairment loss for the goodwill arising from the acquisition of Qianjiang School for the year ended February 28, 2009.
The Group incurred $nil, $1,256,084 and $nil impairment loss on goodwill for the years ended February 29, 2008, February 28, 2009 and 2010, respectively.
| 13. | Convertible Redeemable Preferred Shares |
In February 2009, the Company issued 5,000,000 Series A convertible redeemable preferred shares to an investor at an issuance price of $1 per share for total cash proceeds of $5,000,000 before issuance cost of $113,035.
The rights, preferences, privileges and restriction granted to and imposed on the Series A convertible redeemable preferred shares are as follows.
Conversion
Each Series A convertible redeemable preferred share may, at the option of the holders, be converted at any time into one fully-paid and non-assessable Class B common share of the Company, or is automatically converted into one fully-paid and non-assessable Class B common share upon the closing of a qualified IPO. The Conversion Price for the Series A convertible redeemable preferred shares (“Conversion Price”) shall initially equal the original issue price and shall be adjusted from time to time for share splits and combinations, Class B common share dividends and distributions, other dividends; reorganizations, mergers, consolidations, reclassifications, exchanges, substitutions and sales of shares below the Conversion Price.
The share purchase agreement of the Series A convertible redeemable preferred shares has a down-round provision which requires the conversion price of Series A convertible redeemable preferred shares to be subject to adjustment by the Company of equity or any instrument or securities convertible into equity at a purchase price less than the then-effective conversion price. This provision may potentially cause the conversion price to be lower than the fair value of the common stock at the commitment date, which may result a contingent beneficial conversion feature.
The Company has determined that there was no embedded beneficial conversion feature attributable to the Series A convertible redeemable preferred shares because the initial effective conversion price was higher than the fair value of the Class B common shares at the commitment date.
Dividend participation rights
The holders of Series A convertible redeemable preferred shares are entitled to receive dividends ratably according to the number of Class B common shares that each preferred share may be converted into. Dividends shall be non-cumulative.
Liquidation preference
Before any distribution or payment shall be made to the holders of any common shares, the holder of Series A convertible redeemable preferred shares shall be entitled to receive an amount equal to 100% of the
F-29
Table of Contents
TAL Education Group
Notes to Consolidated Financial Statements
For the Years Ended February 29, 2008, February 28, 2009
and February 28, 2010
(In U.S. dollars, except share and share related data)
Notes to Consolidated Financial Statements
For the Years Ended February 29, 2008, February 28, 2009
and February 28, 2010
(In U.S. dollars, except share and share related data)
original issue price (adjusted for any share splits, share dividends, combinations, recapitalizations and similar transactions), plus any accrued but unpaid dividends with respect thereto (as adjusted for any share splits, share dividends, combinations, recapitalizations and similar transactions) per Series A convertible redeemable preferred share then held by such holder. All arrears or accruals of dividends due to the holders of Series A convertible redeemable preferred share is in priority to the holders of all other shares.
After distribution or payment in full of the amount distributable or payable on the Series A convertible redeemable preferred shares, the remaining assets of the Company available for distribution to shareholders shall be distributed ratably among the holders of outstanding common shares and holders of Series A convertible redeemable preferred shares on an as-converted basis.
Voting rights
The holder of Series A convertible redeemable preferred shares has the voting rights determined based on the equivalent number of the Company’s Class B common shares into which their preferred shares are converted.
Redemption
The Company is obligated to redeem all the Series A convertible redeemable preferred shares after December 31, 2011, or at any time when there is a material breach of any of the Company warranties at a price equaled 180% of the original issue price. The Group recognized changes in the redemption value $4,113,035 as deemed dividend upon issuance in the year ended February 28, 2009.
| 14. | Common Shares |
On January 10, 2008, the Company issued 1,000 Class B common shares at par value of $0.001.
As a result of the reorganization relating to the incorporation of the Company, the outstanding Class B common shares have been deemed to be 1,000 shares for the year ended February 29, 2008. The accompanying consolidated financial statements have been prepared as if the current share structure had been in existence throughout the periods presented.
On February 12, 2009, the Company issued 119,999,000 additional Class B common shares proportionally to the existing founding shareholders at par value. This issuance is considered as an issuance with nominal consideration and has been therefore treated in a manner akin to a stock split and the computations of basic and diluted net income per share were adjusted retroactively for all periods presented.
F-30
Table of Contents
TAL Education Group
Notes to Consolidated Financial Statements
For the Years Ended February 29, 2008, February 28, 2009
and February 28, 2010
(In U.S. dollars, except share and share related data)
Notes to Consolidated Financial Statements
For the Years Ended February 29, 2008, February 28, 2009
and February 28, 2010
(In U.S. dollars, except share and share related data)
| 15. | Net Income per Share |
| For the year ended | For the year ended | For the year ended | ||||||||||
| February 29, | February 28, | February 28, | ||||||||||
| 2008 | 2009 | 2010 | ||||||||||
| Net income attributable to TAL Education Group | $ | 1,512,572 | $ | 7,280,669 | $ | 14,244,959 | ||||||
| Deemed dividend on Series A convertible redeemable preferred shares-accretion of redemption premium | — | 4,113,035 | — | |||||||||
| Undistributed net income to TAL Education Group shareholders | 1,512,572 | 3,167,634 | 14,244,959 | |||||||||
| Numerator used in basic and diluted net income per share: | ||||||||||||
| Net income attributable to TAL Education Group shareholders allocated for computing net income per common share-basic | 1,512,572 | 3,161,499 | (i)(ii) | 13,675,161 | (i) | |||||||
| Net income attributable to TAL Education Group shareholders allocated for computing net income per Series A convertible redeemable preferred shares-basic | — | 4,119,170 | (i)(iii) | 569,798 | (i) | |||||||
| Net income attributable to TAL Education Group shareholders allocated for computing net income per common share-diluted | 1,512,572 | 3,161,499 | 14,244,959 | |||||||||
| Shares (denominator): | ||||||||||||
| Weighted average shares outstanding used in computing net income per common share—basic | 120,000,000 | 120,000,000 | 120,000,000 | |||||||||
| Weighted average shares outstanding used in computing net income per Series A convertible redeemable preferred shares—basic | — | 232,877 | 5,000,000 | |||||||||
| Weighted average shares outstanding used in computing net income per common share—diluted | 120,000,000 | 120,000,000 | 125,000,000 | |||||||||
| Net income per common share attributable to TAL Education Group shareholders-basic | $ | 0.01 | $ | 0.03 | $ | 0.11 | ||||||
| Net income per Series A convertible redeemable preferred share-basic | $ | — | $ | 17.69 | $ | 0.11 | ||||||
| Net income per common share attributable to TAL Education Group shareholders-basic-diluted | $ | 0.01 | $ | 0.03 | $ | 0.11 | ||||||
| (i) | In 2009 and 2010, undistributed net income was allocated between common shares and preferred shares on pro rata basis on the dividend participating rights. Since each Series A convertible redeemable preferred share has the same participating right as each common share, the allocation was based on the |
F-31
Table of Contents
TAL Education Group
Notes to Consolidated Financial Statements
For the Years Ended February 29, 2008, February 28, 2009
and February 28, 2010
(In U.S. dollars, except share and share related data)
Notes to Consolidated Financial Statements
For the Years Ended February 29, 2008, February 28, 2009
and February 28, 2010
(In U.S. dollars, except share and share related data)
| weighted average numbers of common shares and Series A convertible redeemable preferred shares. The net income allocated for computing net income per preferred share-basic also contains the deemed dividend for accretion of the redemption premium. | ||
| (ii) | For the year ended February 28, 2009, $3,167,634 of undistributed net income was allocated between the weighted average numbers of 120,000,000 common shares and 232,877 Series A convertible redeemable preferred shares. Therefore, undistributed net income allocated for common shares was $3,161,499 and $6,135 for Series A convertible redeemable preferred shares. |
| (iii) | For the year ended February 28, 2009, net income allocated for computing net income per Series A convertible redeemable preferred shares-basic was $4,119,170 of which $6,135 was undistributed net income allocated between the weighted average numbers of common shares and Series A convertible redeemable preferred shares and $4,113,035 was deemed dividend on Series A convertible redeemable preferred shares. |
| 16. | Commitments and Contingencies |
Lease commitment
The Group leases certain office premises under non-cancellable leases, the term of which are ten years or less and are renewable upon negotiation. Rental expenses under operating leases for the years ended February 29, 2008, February 28, 2009 and 2010 were $1,176,223, $4,858,363 and $9,862,702, respectively.
Future minimum payments under non-cancellable operating leases as of February 28, 2010 were as follows:
| Fiscal year ending | ||||
| February 2011 | $ | 13,154,964 | ||
| February 2012 | 12,113,895 | |||
| February 2013 | 8,044,734 | |||
| February 2014 | 6,134,223 | |||
| February 2015 and after | 3,226,231 | |||
| Total | $ | 42,674,047 | ||
| 17. | Segment Information |
Segment information
The Group is mainly engaged in after-school tutoring in the PRC. The Group’s chief operating decision maker (“CODM”) has been identified as the Chief Executive Officer who reviews financial information of separate operating segments based on US GAAP amounts when making decisions about allocating resources and assessing performance of the Group. The business is now organized and monitored on the basis of geographic locations. The CODM now reviews results analyzed by service line and geographic location. This analysis is only presented at the revenue level with no allocation of direct or indirect costs. Consequently, the Group has determined that it has only one operating segment.
Geographic information
The Group primary operates in the PRC and all of the Group’s long-lived assets are located in the PRC.
F-32
Table of Contents
TAL Education Group
Notes to Consolidated Financial Statements
For the Years Ended February 29, 2008, February 28, 2009
and February 28, 2010
(In U.S. dollars, except share and share related data)
Notes to Consolidated Financial Statements
For the Years Ended February 29, 2008, February 28, 2009
and February 28, 2010
(In U.S. dollars, except share and share related data)
Major customers
For the years ended February 29, 2008, February 28, 2009 and 2010, there was no customer who accounted for 10% or more of the Group’s revenues.
Components of revenues are presented in the following table:
| For the year ended | For the year ended | For the year ended | ||||||||||
| February 29, | February 28, | February 28, | ||||||||||
| 2008 | 2009 | 2010 | ||||||||||
| Revenues: | ||||||||||||
| Educational programs and services | $ | 8,882,191 | $ | 37,152,739 | $ | 69,138,216 | ||||||
| Educational materials and others | — | 322,844 | 455,307 | |||||||||
| Total revenues | $ | 8,882,191 | $ | 37,475,583 | $ | 69,593,523 | ||||||
| 18. | Mainland China Contribution Plan |
Full time employees of the Group in the PRC participate in a government-mandated defined contribution plan pursuant to which certain pension benefits, medical care, unemployment insurance, employee housing fund and other welfare benefits are provided to employees. The PRC labor regulations require the Group to accrue for these benefits based on certain percentages of the employees’ salaries. Total contributions for such employee benefits were $49,633, $668,433, and $1,819,178 for the years ended February 29, 2008, February 28, 2009 and 2010, respectively.
| 19. | Statutory Reserves and Restricted Net Assets |
As stipulated by the relevant PRC laws and regulations applicable to the Group’s entities in the PRC, the Group is required to make appropriations from net income as determined in accordance with the PRC GAAP to non-distributable reserves, which include a statutory surplus reserve and a statutory welfare reserve. The PRC laws and regulations require that annual appropriations of 10% of after-tax income should be set aside prior to payments of dividends as reserve fund, and in private school sector, the PRC laws and regulations require that annual appropriations of 25% of after-tax income should be set aside prior to payments of dividend as development fund. The appropriations to statutory surplus reserve are required until the balance reaches 50% of the PRC entity registered capital.
The statutory reserve may be applied against prior year losses, if any, and may be used for general business expansion and production or increase in registered capital of the entities. For the years ended February 28, 2009 and 2010, the Group made apportions of $728,067 and $1,616,067 to the statutory surplus reserve fund, respectively, and $1,438,711 and $580,558 to the development fund, respectively.
As a result of these PRC laws and regulations and the requirement that distributions by PRC entities can only be paid out of distributable profits computed in accordance with PRC GAAP, the PRC entities are restricted from transferring a portion of their net assets to the Group. Amounts restricted include paid-in capital and the statutory reserves of the Company’s PRC subsidiaries and VIEs. As of February 28, 2009 and 2010, paid-in capital of such entities was $5,459,898 and $5,929,641, respectively, and statutory reserves were $2,660,818 and $4,857,443, respectively. The total of restricted net assets was therefore $8,120,716 and $10,787,084, respectively. As a result of the above restrictions, parent-only financials are presented on financial statement Schedule I, which begins on page F-37.
F-33
Table of Contents
TAL Education Group
Notes to Consolidated Financial Statements
For the Years Ended February 29, 2008, February 28, 2009
and February 28, 2010
(In U.S. dollars, except share and share related data)
Notes to Consolidated Financial Statements
For the Years Ended February 29, 2008, February 28, 2009
and February 28, 2010
(In U.S. dollars, except share and share related data)
| 20. | Related Party Transactions |
The Group had the following balances with related parties as of February 28, 2009 and 2010, respectively:
| (a) | Amounts due from the founding shareholders-non-trading |
| As of | As of | |||||||
| February 28, | February 28, | |||||||
| 2009 | 2010 | |||||||
| Founding shareholders | $ | 92,112 | (i) | $ | — | |||
| i. | The amounts represent cash advances to the founding shareholders for business expansion. |
| (b) | Amount due to the founding shareholders-non-trading |
| As of | As of | |||||||
| February 28, | February 28, | |||||||
| 2009 | 2010 | |||||||
| Founding shareholders | $ | 101,043 | (ii) | $ | 108,204 | (ii) | ||
| ii. | The amount represents rental deposits and acquisition consideration paid by the founding shareholder on behalf of the Group. |
Amounts due from (to) shareholders are non-interest bearing and unsecured with no fixed repayment terms. There was no right to offset the amounts due to and due from the same shareholders.
| 21. | Capital Contribution |
The founding shareholders contributed $131,810, $365,508 and $219,743 capital to establish new entities (see Note 1) during the years ended February 29, 2008, February 28, 2009 and 2010, respectively.
| 22. | Distribution to Shareholders |
In November 2008, Xueersi Network declared $1,442,020 (RMB10,000,000) cash distribution to its founding shareholders, prior to a series of contractual arrangements entered into on February 12, 2009 (see Note 1). As of February 28, 2009, the amount was $1,462,095 due to the change in the foreign exchange rate. The amount was paid in full in April 2009. No further distribution was declared afterwards.
| 23. | Pro Forma Information (Unaudited) |
Unaudited pro forma net income per common share is computed by dividing net income attributable to common shareholders by the sum of (i) the weighted average number of common shares outstanding for the year ended February 28, 2010 and (ii) the number of common shares whose proceeds, calculated using the initial public offering price of $10.00 per ADS, or $5.00 per common share, would be necessary to pay the amount by which the conditional $30.0 million cash dividend exceeds the Company’s earnings for the fiscal year ended February 28, 2010, assuming these shares have been outstanding since March 1, 2009 because this distribution to the Company’s then existing shareholders is to be paid out of the proceeds of this initial public offering.
F-34
Table of Contents
TAL Education Group
Notes to Consolidated Financial Statements
For the Years Ended February 29, 2008, February 28, 2009
and February 28, 2010
(In U.S. dollars, except share and share related data)
Notes to Consolidated Financial Statements
For the Years Ended February 29, 2008, February 28, 2009
and February 28, 2010
(In U.S. dollars, except share and share related data)
| 24. | Subsequent Events |
The Company has evaluated all events subsequent to the balance sheet date of February 28, 2010 through September 29, 2010, the date when the consolidated financial statements were available to be issued.
On April 21, 2010, the State Administration of Taxation issued Circular 157 Further Clarification on Implementation of Preferential EIT Rate during Transition Periods (“Circular 157”). Circular 157 seeks to provide additional guidance on the interaction of certain preferential tax rates under the transitional rules of the New EIT Law. Prior to Circular 157, we interpreted the law to mean that if an HNTE entity was in a tax holiday period, including“2-year exemption plus3-year half rate”,“5-year exemption plus5-year half rate” and other tax exemptions and reductions, where it was entitled to a 50% reduction in the tax rate and was also entitled to a 15% rate of tax due to HNTE status under the New EIT Law, then it was entitled to pay tax at the rate of 7.5%. Circular 157 appears to have the effect that such an entity is entitled to pay tax at either the lower of 15% or 50% of the standard PRC tax rate (i.e. currently 25%). Circular 157 was unclear as to whether its effect is retrospective but Xueersi Education understands that the State Administration of Taxation has recently taken the position that the Circular applies only to tax years commencing from January 1, 2010.
Based on the interpretation of Circular 157 from the relevant local tax district, Xueersi Education believes that entities that qualify for“3-year exemption plus3-year half rate” tax holiday as HNTEs and which are registered in the Zhongguancun High and New Technology industrial Zones of Beijing, will continue to pay tax at the rate of 7.5%. Since Xueersi Education enjoys“3-year exemption plus3-year half rate” and is a HNTE status registered in the Zhongguancun High and New Technology industrial Zones of Beijing, Xueersi Education does not believe that Circular 157 has any effect on its tax position.
New established entity
In March 2010, Xueersi Education established a wholly owned subsidiary, Beijing Haidian Lejiale Training School (“Haidian Lejiale”). The principle activities of Haidian Lejiale are to provide after-school tutoring for primary and secondary school students and language education and training in Beijing.
Class B common share subscription receivable
The Class B common shares subscription receivable was fully paid by the founding shareholders in June 2010.
2010 Share Incentive Plan
In June 2010, the Company adopted the 2010 Share Incentive Plan. The plans permit the grant of options to purchase the Class A common shares, share appreciation rights, restricted shares, restricted share units, dividend equivalent rights and other instruments as deemed appropriate by the administrator under the plans. The maximum aggregate number of Class A common shares that may be issued pursuant to all awards under the stock incentive plan is 18,750,000 shares.
On July 26, 2010, the Group granted 5,419,500 nonvested shares under this share incentive plan to directors, executive officers and employees. The estimated fair value of the Class A common share on the grant date was $4.05 per share. The nonvested shares will vest in accordance with the vesting schedule set out in the award agreement, which is (1) 100% of 945,100 nonvested shares at the first anniversary of the date of grant, or (2) 1/2 of 831,400 nonvested shares on each of the anniversaries since the date of grant, or (3) 1/4 of 3,643,000 nonvested shares on each of the anniversaries since the date of grant.
F-35
Table of Contents
TAL Education Group
Notes to Consolidated Financial Statements
For the Years Ended February 29, 2008, February 28, 2009
and February 28, 2010
(In U.S. dollars, except share and share related data)
Notes to Consolidated Financial Statements
For the Years Ended February 29, 2008, February 28, 2009
and February 28, 2010
(In U.S. dollars, except share and share related data)
Declaration of Dividend
On September 29, 2010, the Group declared a $30.0 million cash dividend to the Group’s then existing shareholders conditional upon the completion of the initial public offering.
Amendment to Memorandum and Articles of Association
On September 29, 2010, the Company adopted the Third Amended and Restated Memorandum and Articles of Association (M&AA). The share capital of the Company is US$1,000,000.00 divided into (i) 500,000,000 Class A common shares of par value US$0.001 each, (ii) 495,000,000 of Class B common shares of par value US$0.001 each, and (iii) 5,000,000 Series A preferred shares of par value US$0.001 each. All issued and outstanding common shares of the Company as of September 29, 2010 are re-designated as Class B common shares. The outstanding preferred shares will be automatically converted into Class B common shares immediately prior to the closing of the initial public offering.
Holders of Class A common shares and Class B common shares have the same rights except for voting and conversion rights. Each Class A common share is entitled to one vote and each Class B common share is entitled to ten votes. Each Class B common share is convertible into one Class A common share at any time by the holder thereof. Class A common shares are not convertible into Class B common shares under any circumstances. Upon any transfer of Class B common shares by a holder thereof to any person or entity which is not an affiliate of such holder, such Class B common shares shall be automatically and immediately converted into an equal number of Class A common shares.
Upon adoption of the amended and restated M&AA, all shares and per share information presented in the accompanying consolidated financial statements have been revised on a retroactive basis to reflect the re-designation of outstanding common shares as Class B common shares as if the amended and restated M&AA had been in place throughout the periods presented.
F-36
Table of Contents
TAL Education Group
Additional Information—Financial Statement Schedule I
Condensed Financial Information of Parent Company Balance Sheets
(In US$, except share and share related data)
Additional Information—Financial Statement Schedule I
Condensed Financial Information of Parent Company Balance Sheets
(In US$, except share and share related data)
| As of | As of | |||||||
| February 28, | February 28, | |||||||
| 2009 | 2010 | |||||||
Assets | ||||||||
Current assets | ||||||||
| Cash and cash equivalents | $ | 5,000,000 | $ | 500,000 | ||||
Total current assets | 5,000,000 | 500,000 | ||||||
| Amounts due from subsidiaries, VIEs and VIEs’ subsidiaries | — | 5,000,000 | ||||||
| Investments in subsidiaries, VIEs and VIEs’ subsidiaries | 7,490,488 | 22,076,253 | ||||||
Total assets | $ | 12,490,488 | $ | 27,576,253 | ||||
| Liabilities, Convertible Redeemable Preferred Shares and Equity | ||||||||
Current liabilities | ||||||||
| Amounts due to subsidiaries, VIEs and VIEs’ subsidiaries | $ | 126,463 | $ | 135,233 | ||||
| Accrued expenses and other current liabilities | 8,680 | 14,949 | ||||||
Total current liabilities | 135,143 | 150,182 | ||||||
| Convertible loan | — | 500,000 | ||||||
Total liabilities | 135,143 | 650,182 | ||||||
| Series A convertible redeemable preferred shares ($0.001 par value, 5,000,000 shares and 5,000,000 shares authorized, issued and outstanding as of February 28, 2009 and February 28, 2010, respectively, liquidation value $5,000,000) | 9,000,000 | 9,000,000 | ||||||
Equity | ||||||||
| Class A common shares ($0.001 par value, 500,000,000 shares authorized, nil issued and outstanding as of February 28, 2009 and February 28, 2010) | — | — | ||||||
| Class B common shares ($0.001 par value, 495,000,000 shares authorized as of February 28, 2009 and February 28, 2010; 120,000,000 shares and 120,000,000 shares issued and outstanding as of February 28, 2009 and February 28, 2010, respectively) | 120,000 | 120,000 | ||||||
| Class B common shares subscription receivable | (120,000 | ) | (120,000 | ) | ||||
| Retained earnings | 2,682,218 | 16,927,177 | ||||||
| Additional paid-in capital | 559,898 | 779,641 | ||||||
| Accumulated other comprehensive income | 113,229 | 219,253 | ||||||
Total equity | 3,355,345 | 17,926,071 | ||||||
Total liabilities, convertible redeemable preferred shares and equity | $ | 12,490,488 | $ | 27,576,253 | ||||
F-37
Table of Contents
TAL Education Group
Additional Information—Financial Statement Schedule I
Condensed Financial Information of Parent Company Statements of Operations
(In US$, except share and share related data)
Additional Information—Financial Statement Schedule I
Condensed Financial Information of Parent Company Statements of Operations
(In US$, except share and share related data)
| For the year ended | For the year ended | For the year ended | ||||||||||
| February 29, | February 28, | February 28, | ||||||||||
| 2008 | 2009 | 2010 | ||||||||||
| Total operating expenses | $ | — | $ | (22,126 | ) | $ | (8,834 | ) | ||||
| Operating loss | — | (22,126 | ) | (8,834 | ) | |||||||
| Interest income | — | 18 | 43 | |||||||||
| Interest expense | — | — | (6,248 | ) | ||||||||
| Equity in earnings of subsidiaries, VIEs and VIEs’ subsidiaries | 1,512,572 | 7,302,777 | 14,259,998 | |||||||||
| Net income | $ | 1,512,572 | $ | 7,280,669 | $ | 14,244,959 | ||||||
F-38
Table of Contents
TAL Education Group
Additional Information—Financial Statement Schedule I
Consolidated Statements of Changes in Equity and Comprehensive Income
(In U.S. dollars, except share and share related data)
Additional Information—Financial Statement Schedule I
Consolidated Statements of Changes in Equity and Comprehensive Income
(In U.S. dollars, except share and share related data)
| Class B | (Accumulated | Accumulated | ||||||||||||||||||||||||||||||
| Class B | common share | Additional | deficit) | other | ||||||||||||||||||||||||||||
| common shares | subscription | paid-in | Retained | comprehensive | Total | Comprehensive | ||||||||||||||||||||||||||
| Shares | Amount | receivable | capital | earnings | Income (loss) | equity | income | |||||||||||||||||||||||||
Balance as of March 1, 2007 | 1,000 | $ | 1 | $ | (1 | ) | $ | 62,580 | $ | (555,968 | ) | $ | — | $ | (493,388 | ) | $ | — | ||||||||||||||
| Capital contribution | — | — | — | 131,810 | — | — | 131,810 | — | ||||||||||||||||||||||||
| Net income | — | — | — | 1,512,572 | — | 1,512,572 | 1,512,572 | |||||||||||||||||||||||||
| Foreign currency translation adjustment | — | — | �� | — | — | — | 42,102 | 42,102 | 42,102 | |||||||||||||||||||||||
Net unrealized (losses) onavailable-for-sale securities, net of tax effect of $24,296 | — | — | — | — | — | (49,327 | ) | (49,327 | ) | (49,327 | ) | |||||||||||||||||||||
Balance as of February 29, 2008 | 1,000 | 1 | (1 | ) | 194,390 | 956,604 | (7,225 | ) | 1,143,769 | $ | 1,505,347 | |||||||||||||||||||||
| Capital contribution | — | — | — | 365,508 | — | — | 365,508 | — | ||||||||||||||||||||||||
| Net income | — | — | — | — | 7,280,669 | — | 7,280,669 | 7,280,669 | ||||||||||||||||||||||||
| Issuance of Class B common shares | 119,999,000 | 119,999 | (119,999 | ) | — | — | — | — | — | |||||||||||||||||||||||
| Distribution to shareholders | — | — | — | — | (1,442,020 | ) | — | (1,442,020 | ) | — | ||||||||||||||||||||||
| Accretion for Series A convertible redeemable preferred shares redemption premium | — | — | — | — | (4,113,035 | ) | — | (4,113,035 | ) | — | ||||||||||||||||||||||
| Foreign currency translation adjustment | — | — | — | — | — | 71,127 | 71,127 | 71,127 | ||||||||||||||||||||||||
Net unrealized (losses) onavailable-for-sale securities, net of tax effect of $72,261 | — | — | — | — | — | (216,784 | ) | (216,784 | ) | (216,784 | ) | |||||||||||||||||||||
Transfer to the statements of operation ofother-than-temporary-impairment, net of tax effect of ($96,557) | — | — | — | — | — | 266,111 | 266,111 | 266,111 | ||||||||||||||||||||||||
Balance as of February 28, 2009 | 120,000,000 | 120,000 | (120,000 | ) | 559,898 | 2,682,218 | 113,229 | 3,355,345 | $ | 7,401,123 | ||||||||||||||||||||||
| Capital contribution | — | — | — | 219,743 | — | — | 219,743 | — | ||||||||||||||||||||||||
| Net income | — | — | — | — | 14,244,959 | — | 14,244,959 | 14,244,959 | ||||||||||||||||||||||||
| Foreign currency translation adjustment | — | — | — | — | — | 21,493 | 21,493 | 21,493 | ||||||||||||||||||||||||
Net unrealized gains onavailable-for-sale securities, net of tax effect of ($28,177) | — | — | — | — | — | 84,531 | 84,531 | 84,531 | ||||||||||||||||||||||||
Balance as of February 28, 2010 | 120,000,000 | $ | 120,000 | $ | (120,000 | ) | $ | 779,641 | $ | 16,927,177 | $ | 219,253 | $ | 17,926,071 | $ | 14,350,983 | ||||||||||||||||
F-39
Table of Contents
TAL Education Group
Additional Information—Financial Statement Schedule I
Condensed Financial Information of Parent Company Cash Flow Statements
(In US$, except share and share related data)
Additional Information—Financial Statement Schedule I
Condensed Financial Information of Parent Company Cash Flow Statements
(In US$, except share and share related data)
| For the year ended | For the year ended | For the year ended | ||||||||||
| February 29, | February 28, | February 28, | ||||||||||
| 2008 | 2009 | 2010 | ||||||||||
Cash flows from operating activities | ||||||||||||
| Net income | $ | 1,512,572 | $ | 7,280,669 | $ | 14,244,959 | ||||||
| Equity in subsidiaries, VIEs and VIEs’ subsidiaries | (1,512,572 | ) | (7,302,777 | ) | (14,259,998 | ) | ||||||
| Changes in operating assets and liabilities | ||||||||||||
| Amounts due to subsidiaries, VIEs and VIEs’ subsidiaries | — | 126,463 | 8,770 | |||||||||
| Accrued expenses and other current liabilities | — | 8,680 | 6,269 | |||||||||
| Net cash provided (used in) by operating activities | — | 113,035 | — | |||||||||
Cash flows from financing activities | ||||||||||||
| Proceeds from issuance of Series A convertible redeemable preferred shares, net of issuance cost of $113,035 | — | 4,886,965 | — | |||||||||
| Convertible loan | — | — | 500,000 | |||||||||
| Loan provided to subsidiaries, VIEs and VIEs’ subsidiaries | — | — | (5,000,000 | ) | ||||||||
| Net cash provided by (used in) financing activities | — | 4,886,965 | (4,500,000 | ) | ||||||||
| Net increase in cash and cash equivalents | — | 5,000,000 | (4,500,000 | ) | ||||||||
| Cash and cash equivalents at beginning of year | — | — | 5,000,000 | |||||||||
| Cash and cash equivalents at end of year | $ | — | $ | 5,000,000 | $ | 500,000 | ||||||
Basis of presentation
The condensed financial information of the parent company, TAL Education Group, has been prepared using the same accounting policies as set out in the Group’s consolidated financial statements except that the parent company used the equity method to account for investments in its subsidiaries and variable interest entities.
The Company records its investment in its subsidiaries and variable interest entities under the equity method of accounting. Such investment is presented on the balance sheets as “Investment in subsidiaries, VIEs and VIEs’ subsidiaries” and share of their earnings as “Equity in subsidiaries, VIEs and VIEs’ subsidiaries” on the statements of operations. As a result of PRC laws and regulations and the requirement that distributions by PRC entities can only be paid out of distributable profits computed in accordance with PRC GAAP, the PRC entities are restricted from transferring a portion of their net assets to the Group. Amounts restricted include paid-in capital and the statutory reserves of the Company’s PRC subsidiaries and VIEs. As of February 28, 2009 and 2010, paid-in capital of such entities was $5,459,898 and $5,929,641, respectively, and statutory reserves were $2,660,818 and $4,857,443, respectively. The total amount of restricted net assets was therefore $8,120,716 and $10,787,084, respectively. As a result of the above restrictions, parent-only financials are presented herein.
Certain information and footnote disclosure normally included in financial statements prepared in accordance with US GAAP have been condensed or omitted.
Convertible loan
On January 30, 2010, a third party agreed to provide the Company a $500,000 convertible loan, which bears an annual interest rate of 15% and will mature on January 30, 2012. The interest is payable annually. Subject to mutual agreement, the date of maturity may be extended to January 30, 2015.
F-40
Table of Contents
TAL EDUCATION GROUP
Unaudited Condensed Consolidated Balance Sheets
(In U.S. dollars, except share and share related data)
(In U.S. dollars, except share and share related data)
| As of | As of | As of | ||||||||||
| February 28, | August 31, | August 31, | ||||||||||
| 2010 | 2010 | 2010 | ||||||||||
| Pro forma | ||||||||||||
| (unaudited) | ||||||||||||
| (Note 2) | ||||||||||||
Assets | ||||||||||||
Current assets | ||||||||||||
| Cash and cash equivalents | $ | 50,752,481 | $ | 81,494,598 | $ | 81,494,598 | ||||||
Available-for-sale securities | 1,918,156 | 448,277 | 448,277 | |||||||||
| Inventory | 121,819 | 252,268 | 252,268 | |||||||||
| Deferred costs in connection with initial public offering | — | 437,152 | 437,152 | |||||||||
| Deferred tax assets-current | 831,297 | 1,226,469 | 1,226,469 | |||||||||
| Prepaid expenses and other current assets | 2,280,941 | 3,838,203 | 3,838,203 | |||||||||
Total current assets | 55,904,694 | 87,696,967 | 87,696,967 | |||||||||
| Property and equipment, net | 4,991,490 | 5,550,290 | 5,550,290 | |||||||||
| Deferred tax assets-non-current | 283,968 | 167,989 | 167,989 | |||||||||
| Rental deposit | 2,170,548 | 2,308,268 | 2,308,268 | |||||||||
| Intangible assets, net | 1,389,160 | 1,025,325 | 1,025,325 | |||||||||
| Goodwill | 763,802 | 765,923 | 765,923 | |||||||||
Total assets | $ | 65,503,662 | $ | 97,514,762 | $ | 97,514,762 | ||||||
| Liabilities, Convertible Redeemable Preferred Shares and Equity | ||||||||||||
Current liabilities | ||||||||||||
| Accounts payable (including accounts payable of the consolidated VIEs without recourse to TAL Education Group of 915,408 and 485,115 as of February 28, 2010, and August 31, 2010, respectively) | $ | 987,742 | $ | 712,710 | $ | 712,710 | ||||||
| Deferred revenue (including deferred revenue of the consolidated VIEs without recourse to TAL Education Group of 24,631,648 and 31,858,213 as of February 28, 2010 and August 31, 2010, respectively) | 29,407,994 | 42,100,775 | 42,100,775 | |||||||||
| Amounts due to related parties (including amounts due to related parties of the consolidated VIEs without recourse to TAL Education Group of 108,204 and 100,571 as of February 28, 2010 and August 31, 2010, respectively) | 108,204 | 100,571 | 100,571 | |||||||||
| Accrued expenses and other current liabilities (including accrued expenses and other current liabilities without recourse to TAL Education Group of 6,588,552 and 7,652,977 as of February 28, 2010 and August 31, 2010, respectively) | 6,817,816 | 9,618,867 | 9,618,867 | |||||||||
| Income tax payable (including income tax payable of the consolidated VIEs without recourse to TAL Education | ||||||||||||
| Group of 2,653,324 and 2,841,863 as of February 28, 2010, and August 31, 2010, respectively) | 580,225 | 3,054,408 | 3,054,408 | |||||||||
| Dividend proposed | — | — | 30,000,000 | |||||||||
Total current liabilities | 37,901,981 | 55,587,331 | 85,587,331 | |||||||||
| Convertible loan | 500,000 | 500,000 | 500,000 | |||||||||
| Deferred tax liabilities-non-current | 175,610 | 146,684 | 146,684 | |||||||||
Total liabilities | 38,577,591 | 56,234,015 | 86,234,015 | |||||||||
Commitments and contingencies (Note 12) | ||||||||||||
| Series A convertible redeemable preferred shares ($0.001 par value, 5,000,000 shares and 5,000,000 shares authorized, issued and outstanding as of February 28, 2010 and August 31, 2010, respectively, liquidation value $5,000,000) | 9,000,000 | 9,000,000 | — | |||||||||
Equity | ||||||||||||
| TAL Education Group Shareholders’ Equity | ||||||||||||
| Class A common shares ($0.001 par value, 500,000,000 shares authorized, nil issued and outstanding as of February 28, 2010 and August 31, 2010) | — | — | — | |||||||||
| Class B common shares ($0.001 par value, 495,000,000 shares authorized as of February 28, 2010 and August 31, 2010; 120,000,000 shares and 120,000,000 shares issued and outstanding as of February 28, 2010 and August 31, 2010, respectively) | 120,000 | 120,000 | 125,000 | |||||||||
| Class B common shares subscription receivable | (120,000 | ) | — | — | ||||||||
| Additional paid-in capital | 779,641 | 1,699,503 | (19,305,497 | ) | ||||||||
| Statutory reserve | 4,857,443 | 4,857,443 | 4,857,443 | |||||||||
| Retained earnings | 12,069,734 | 25,315,575 | 25,315,575 | |||||||||
| Accumulated other comprehensive income | 219,253 | 288,226 | 288,226 | |||||||||
Total TAL Education Group’s Equity | 17,926,071 | 32,280,747 | 11,280,747 | |||||||||
Total liabilities, convertible redeemable preferred shares and equity | $ | 65,503,662 | $ | 97,514,762 | $ | 97,514,762 | ||||||
The accompanying notes are an integral part of these unaudited condensed consolidated financial statements.
F-41
Table of Contents
TAL Education Group
(In U.S. dollars, except share and share related data)
| Six-Month | Six-Month | |||||||
| Period Ended | Period Ended | |||||||
| August 31, | August 31, | |||||||
| 2009 | 2010 | |||||||
| Net revenues | $ | 32,983,005 | $ | 53,022,037 | ||||
| Cost of revenues (included share-based compensation nil and 109,413 for the periods ended August 31, 2009 and 2010, respectively) | 16,067,926 | 26,254,975 | ||||||
| Gross profit | 16,915,079 | 26,767,062 | ||||||
| Operating expenses | ||||||||
| Selling and marketing (included share-based compensation nil and 162,998 for the periods ended August 31, 2009 and 2010, respectively) | 1,958,295 | 4,183,992 | ||||||
| General and administrative (included share-based compensation nil and 647,451 for the periods ended August 31, 2009 and 2010, respectively) | 4,601,514 | 7,807,640 | ||||||
| Total operating expenses | 6,559,809 | 11,991,632 | ||||||
| Income from operations | 10,355,270 | 14,775,430 | ||||||
| Interest income | 102,839 | 205,340 | ||||||
| Interest expense | — | (43,452 | ) | |||||
| Other expenses, net | (118,730 | ) | (27,373 | ) | ||||
Gain from sales ofavailable-for-sale securities | — | 6,429 | ||||||
| Income before income tax provision | 10,339,379 | 14,916,374 | ||||||
| Provision for income tax | 912,268 | 1,670,533 | ||||||
| Net income | 9,427,111 | 13,245,841 | ||||||
| Net income attributable to TAL Education Group | 9,427,111 | 13,245,841 | ||||||
| Net income attributable to common shareholders of TAL Education Group | 9,427,111 | 13,245,841 | ||||||
| Net income per common share | ||||||||
| Basic | $ | 0.08 | $ | 0.11 | ||||
| Diluted | $ | 0.08 | $ | 0.11 | ||||
| Net income per Series A convertible redeemable preferred share-Basic | $ | 0.08 | $ | 0.11 | ||||
| Weighted average shares used in calculating net income per common share | ||||||||
| Basic | 120,000,000 | 120,000,000 | ||||||
| Diluted | 125,000,000 | 125,193,360 | ||||||
| Weighted average shares used in calculating net income per Series A convertible redeemable preferred share-basic | 5,000,000 | 5,000,000 | ||||||
| Pro forma net income per common share (Note 2) | ||||||||
| Basic | — | $ | 0.10 | |||||
| Diluted | — | $ | 0.10 | |||||
| Weighted average shares used in calculating pro forma net income per common share (Note 2) | ||||||||
| Basic | — | 123,350,832 | ||||||
| Diluted | — | 128,350,832 | ||||||
The accompanying notes are an integral part of these unaudited condensed consolidated financial statements.
F-42
Table of Contents
TAL Education Group
(In U.S. dollars, except share and share related data)
| Class B | Total TAL | |||||||||||||||||||||||||||||||||||
| common | Accumulated | Education | ||||||||||||||||||||||||||||||||||
| Class B | shares | Additional | other | Group | ||||||||||||||||||||||||||||||||
| common shares | subscription | paid-in | Statutory | Retained | comprehensive | shareholders’ | Comprehensive | |||||||||||||||||||||||||||||
| Shares | Amount | receivable | capital | reserve | earnings | income | equity | income | ||||||||||||||||||||||||||||
Balance as of February 28, 2009 | 120,000,000 | $ | 120,000 | $ | (120,000 | ) | $ | 559,898 | $ | 2,660,818 | $ | 21,400 | $ | 113,229 | $ | 3,355,345 | $ | — | ||||||||||||||||||
| Net income | — | — | — | — | — | 9,427,111 | — | 9,427,111 | 9,427,111 | |||||||||||||||||||||||||||
| Foreign currency translation adjustment | — | — | — | — | — | — | 19,702 | 19,702 | 19,702 | |||||||||||||||||||||||||||
Net unrealized gains onavailable-for-sale securities, net of tax effect of $(18,528) | — | — | — | — | — | — | 41,739 | 41,739 | 41,739 | |||||||||||||||||||||||||||
Balance as of August 31, 2009 | 120,000,000 | $ | 120,000 | $ | (120,000 | ) | $ | 559,898 | $ | 2,660,818 | $ | 9,448,511 | $ | 174,670 | $ | 12,843,897 | $ | 9,488,552 | ||||||||||||||||||
Balance as of February 28, 2010 | 120,000,000 | $ | 120,000 | $ | (120,000 | ) | $ | 779,641 | $ | 4,857,443 | $ | 12,069,734 | $ | 219,253 | $ | 17,926,071 | $ | — | ||||||||||||||||||
| Subscription received | — | — | 120,000 | — | — | — | — | 120,000 | — | |||||||||||||||||||||||||||
| Net income | — | — | — | — | — | 13,245,841 | — | 13,245,841 | 13,245,841 | |||||||||||||||||||||||||||
| Share-based compensation | — | — | — | 919,862 | — | — | — | 919,862 | — | |||||||||||||||||||||||||||
| Foreign currency translation-adjustment | — | — | — | — | — | — | 72,615 | 72,615 | 72,615 | |||||||||||||||||||||||||||
Transfer to statements of operations of realized losses onavailable-for-sale securities, net of tax effect of $(1,997) | — | — | — | — | — | — | 5,973 | 5,973 | 5,973 | |||||||||||||||||||||||||||
Net unrealized (losses) onavailable-for-sale securities, net of tax effect of $3,204 | — | — | — | — | — | — | (9,615 | ) | (9,615 | ) | (9,615 | ) | ||||||||||||||||||||||||
Balance as of August 31, 2010 | 120,000,000 | $ | 120,000 | $ | — | $ | 1,699,503 | $ | 4,857,443 | $ | 25,315,575 | $ | 288,226 | $ | 32,280,747 | $ | 13,314,814 | |||||||||||||||||||
The accompanying notes are an integral part of these unaudited condensed consolidated financial statements.
F-43
Table of Contents
TAL Education Group
Unaudited Condensed Consolidated Statements Of Cash Flows
(In U.S. dollars, except share and share related data)
(In U.S. dollars, except share and share related data)
| Six-Month | Six-Month | |||||||
| Periods Ended | Periods Ended | |||||||
| August 31, | August 31, | |||||||
| 2009 | 2010 | |||||||
Cash flows from operating activities | ||||||||
| Net income | $ | 9,427,111 | $ | 13,245,841 | ||||
| Adjustments to reconcile net income to net cash provided by operating activities | ||||||||
| Depreciation of property and equipment | 438,369 | 1,140,156 | ||||||
| Amortization of intangible assets | 335,783 | 367,471 | ||||||
| Share-based compensation | — | 919,862 | ||||||
| Changes in operating assets and liabilities | ||||||||
| Amounts due from related parties | 92,223 | — | ||||||
| Inventory | (48,578 | ) | (130,501 | ) | ||||
| Prepaid expenses and other current assets | (705,149 | ) | (1,690,015 | ) | ||||
| Deferred costs in connection with initial public offering | — | (274,942 | ) | |||||
| Deferred income taxes | (369,207 | ) | (308,730 | ) | ||||
| Rental deposit | (393,576 | ) | (157,500 | ) | ||||
| Accounts payable | 84,417 | (258,742 | ) | |||||
| Deferred revenue | 5,672,499 | 12,577,482 | ||||||
| Amounts due to related parties | 283,209 | (7,948 | ) | |||||
| Accrued expenses and other current liabilities | 1,480,818 | 3,054,910 | ||||||
| Income tax payable | (99,657 | ) | 2,477,391 | |||||
| Net cash provided by operating activities | 16,198,262 | 30,954,735 | ||||||
Cash flows from investing activities | ||||||||
| Purchase of property and equipment | (695,551 | ) | (1,684,984 | ) | ||||
| Sales of available-for-sale securities | — | 1,470,660 | ||||||
| Net cash (used in) investing activities | (695,551 | ) | (214,324 | ) | ||||
Cash flows from financing activities | ||||||||
| Payment of deferred consideration | (180,345 | ) | (283,180 | ) | ||||
| Distribution to shareholders | (1,442,020 | ) | — | |||||
| Subscription received | — | 120,000 | ||||||
| Net cash (used in) financing activities | (1,622,365 | ) | (163,180 | ) | ||||
| Effect of exchange rate changes | 25,399 | 164,886 | ||||||
| Net increase in cash and cash equivalents | 13,905,745 | 30,742,117 | ||||||
| Cash and cash equivalents at the beginning of period | 29,692,901 | 50,752,481 | ||||||
| Cash and cash equivalents at the end of period | 43,598,646 | 81,494,598 | ||||||
| Supplement disclosure of cash flow information | ||||||||
| Income tax paid | 1,381,236 | 1,369,739 | ||||||
The accompanying notes are an integral part of these unaudited condensed consolidated financial statements.
F-44
Table of Contents
TAL Education Group
Consolidated Financial Statements
For the Six-Month Periods Ended August 31, 2009 and 2010
(In U.S. Dollars, Except Share and Share Related Data)
1. Basis of Preparation
The accompanying unaudited condensed consolidated financial statements include the financial information of TAL Education Group (the “Company” or “TAL”), its subsidiaries , its Variable Interest Entities (“VIEs”) and VIEs’ subsidiaries (collectively, the “Group”). All significant intercompany balances and transactions have been eliminated in consolidation. The unaudited condensed consolidated financial statements have been prepared in accordance with the rules and regulations of the Security and Exchange Commission and U.S. generally accepted accounting standards for interim financial reporting. The results of operations for the six-month periods ended August 31, 2009 and 2010 are not necessarily indicative of the results for the full years. The Group believes that the disclosures are adequate to make the information presented not misleading.
The accompanying unaudited condensed consolidated financial statements should be read in conjunction with the financial statements, accounting policies and financial notes thereto included in the Group’s audited consolidated financial statements for each of the three years ended February 29, 2008 and February 28, 2009 and 2010. In opinion of the management, the accompanying unaudited condensed consolidated financial statements reflect all adjustments (consisting only of normal recurring adjustments), which are necessary for a fair representation of financial results for the interim periods presented.
The financial information as of February 28, 2010 presented in the unaudited condensed financial statements is derived from our audited consolidated financial statements for the year ended February 28, 2010.
The accompanying unaudited condensed consolidated financial statements have been prepared using the same accounting policies as used in the preparation of our consolidated financial statements for each of the three years ended February 29, 2008 and February 28, 2009 and 2010, except for the additional accounting policy adopted with respect to a new revenue stream and share-based compensation as follows.
Revenue recognition
Online education services
The online education services provided by the Group to its customers include audio-video course content.
Customers enroll for online courses through the use of prepaid study cards. The proceeds collected from the online course education are initially recorded as deferred revenue. Revenues are recognized on a straight line basis over the subscription period from the date in which the students activate the courses to the date in which the subscribed courses end. Refund is provided to the students who decide to withdraw from the subscribed courses within the course offer period, which generally ranges from one month to six months, and a proportional refund is based on the percentage of untaken courses to the total courses offered.
Share-based compensation
Share-based payment transactions with employees are measured based on the grant date fair value of the equity instrument issued and recognized as compensation expense net of a forfeiture rate on a straight-line basis, over the requisite service period, with a corresponding impact reflected in additional paid-in capital.
The estimate of forfeiture rate will be adjusted over the requisite service period to the extent that actual forfeiture rate differs, or is expected to differ, from such estimates. Changes in estimated forfeiture rate will be recognized through a cumulativecatch-up adjustment in the period of change.
F-45
Table of Contents
TAL Education Group
Notes to the Unaudited Condensed
Consolidated Financial Statements
For the Six-Month Periods Ended August 31, 2009 and 2010
(In U.S. Dollars, Except Share and Share Related Data)
The VIE arrangements
The following financial statement balances and amounts of the Company’s VIEs were included in the accompanying unaudited condensed consolidated financial statements:
| As of | As of | |||||||
| February 28, | August 31, | |||||||
| 2010 | 2010 | |||||||
| Total current assets | $ | 45,171,584 | $ | 55,158,850 | ||||
| Total non-current assets | 8,792,445 | 8,366,390 | ||||||
| Total assets | 53,964,029 | 63,525,240 | ||||||
| Total current liabilities | 34,897,136 | 42,938,739 | ||||||
| Total non-current liabilities | 175,610 | 146,684 | ||||||
| Total liabilities | $ | 35,072,746 | $ | 43,085,423 | ||||
| Six-Month | Six-Month | |||||||
| Periods Ended | Periods Ended | |||||||
| August 31, | August 31, | |||||||
| 2009 | 2010 | |||||||
| Net revenues | $ | 32,983,005 | $ | 46,589,727 | ||||
| Net income | $ | 10,385,657 | $ | 14,324,095 | ||||
| Six-Month | Six-Month | |||||||
| Periods Ended | Periods Ended | |||||||
| August 31, | August 31, | |||||||
| 2009 | 2010 | |||||||
| Net cash provided by operating activities | $ | 16,902,677 | $ | 9,329,391 | ||||
| Net cash (used in)/ provided by investing activities | $ | (1,137,634 | ) | $ | 635,540 | |||
| Net cash (used in) financing activities | $ | (1,622,365 | ) | $ | (283,180 | ) | ||
There are no consolidated VIE assets that are collateral for the VIE’s obligations and can only be used to settle the VIE’s obligations.
In June 2009, the FASB issued an authoritative pronouncement to amend the accounting rules for variable interest entities (VIEs). The amendments effectively replace the quantitative-basedrisks-and-rewards calculation for determining which reporting entity, if any, has a controlling financial interest in a variable interest entity with an approach focused on identifying which reporting entity has (1) the power to direct the activities of a variable interest entity that most significantly affect the entity’s economic performance and (2) the obligation to absorb losses of, or the right to receive benefits from, the entity. Additionally, an enterprise is required to assess whether it has an implicit financial responsibility to ensure that a variable interest entity operates as designed when determining whether it has the power to direct the activities of the variable interest entity that most significantly impact the entity’s economic performance. The new guidance also requires additional disclosures about a reporting entity’s involvement with variable interest entities and about any significant changes in risk exposure as a result of that involvement.
The new guidance is effective at the start of a reporting entity’s first fiscal year beginning after November 15, 2009, and all interim and annual periods thereafter. The new VIE model requires that, upon adoption, a reporting entity should determine whether an entity is a VIE, and whether the reporting entity is the VIE’s primary beneficiary, as of the date that the reporting entity first became involved with the entity,
F-46
Table of Contents
TAL Education Group
Notes to the Unaudited Condensed
Consolidated Financial Statements
For the Six-Month Periods Ended August 31, 2009 and 2010
(In U.S. Dollars, Except Share and Share Related Data)
unless an event requiring reconsideration of those initial conclusions occurred after that date. When making this determination, a reporting entity must assume that new guidance had been effective from the date of its first involvement with the entity. The Group adopted the new guidance on March 1, 2010.
The Company has had two VIEs, which it has consolidated under the authoritative literature prior to the amendment discussed above because it was the primary beneficiary of those entities. Because the Company, through its wholly owned subsidiary, has (1) the power to direct the activities of the two VIEs that most significantly affect the entity’s economic performance and (2) the right to receive benefits from the two VIES, it continues to consolidate the two VIEs upon the adoption of the new guidance which therefore, other than for additional disclosures, including those for prior periods, had no accounting impact.
| 2. | Unaudited Pro Forma Information |
The unaudited pro forma balance sheet information as of August 31, 2010 assumes the conversion of the Series A convertible redeemable preferred shares outstanding into Class B common shares using a conversion ratio of 1:1 as of that date and the accrual of a $30 million cash dividend declared on September 29, 2010 to the Company’s then existing shareholders payable upon the completion of the initial public offering, had occurred as of August 31, 2010.
Unaudited pro forma net income per common share is computed by dividing net income attributable to common shareholders by the sum of (i) the weighted average number of common shares outstanding for the six months ended August 31, 2010 and (ii) the number of common shares whose proceeds, calculated using the initial public offering price of $10.00 per ADS, or $5.00 per common share, would be necessary to pay the amount by which the conditional $30.0 million cash dividend exceeds the Company’s earnings for the fiscal year ended February 28, 2010, assuming these shares have been outstanding since March 1, 2009 because this distribution to the Company’s then existing shareholders is to be paid out of the proceeds of this initial public offering.
3. Recently Issued Accounting Standards
Not yet adopted
In October 2009, the FASB issued an authoritative pronouncement regarding the revenue arrangements with multiple deliverables. Although the new pronouncement retains the criteria from existing authoritative literature for when delivered items in a multiple-deliverable arrangement should be considered separate units of accounting, it removes the previous separation criterion that objective and reliable evidence of the fair value of any undelivered items must exist for the delivered items to be considered separate units of accounting. The new pronouncement is effective for fiscal years beginning on or after June 15, 2010. Entities can elect to apply this pronouncement (1) prospectively to new or materially modified arrangements after the pronouncement’s effective date or (2) retrospectively for all periods presented. Early application is permitted; however, if the entity elects prospective application and early adopts this pronouncement after its first interim reporting period, it must also do the following in the period of adoption: (1) retrospectively apply this pronouncement as of the beginning of that fiscal year and (2) disclose the effect of the retrospective adjustments on the prior interim periods’ revenue, income before taxes, net income, and earnings per share. The Group is in the process of evaluating the effect of adoption of this pronouncement.
In October 2009, the FASB issued an authoritative pronouncement regarding software revenue recognition. This new pronouncement amends existing pronouncement to exclude from their scope all tangible products containing both software and non software components that function together to deliver the product’s
F-47
Table of Contents
TAL Education Group
Notes to the Unaudited Condensed
Consolidated Financial Statements
For the Six-Month Periods Ended August 31, 2009 and 2010
(In U.S. Dollars, Except Share and Share Related Data)
essential functionality. That is, the entire product (including the software deliverables and non software deliverables) would be outside the scope of software revenue recognition and would be accounted for under other accounting literature. The new pronouncement include factors that entities should consider when determining whether the software and non software components function together to deliver the product’s essential functionality and are thus outside the revised scope of the authoritative literature that governs software revenue recognition. The pronouncement is effective for fiscal years beginning on or after June 15, 2010. Entities can elect to apply this pronouncement (1) prospectively to new or materially modified arrangements after the pronouncement’s effective date or (2) retrospectively for all periods presented. Early application is permitted; however, if the entity elects prospective application and early adopts this pronouncement after its first interim reporting period, it must also do the following in the period of adoption: (1) retrospectively apply this pronouncement as of the beginning of that fiscal year and (2) disclose the effect of the retrospective adjustments on the prior interim periods’ revenue, income before taxes, net income, and earnings per share. The Group is in the process of evaluating the effect of adoption of this pronouncement.
In January 2010, the FASB issued authoritative guidance to improve disclosures about fair value measurements. This guidance amends previous guidance on fair value measurements to add new requirements for disclosures about transfers into and out of Levels 1 and 2 and separate disclosures about purchases, sales, issuances, and settlements relating to Level 3 measurement on a gross basis rather than as a net basis as currently required. This guidance also clarifies existing fair value disclosures about the level of disaggregation and about inputs and valuation techniques used to measure fair value. This guidance is effective for annual and interim periods beginning after December 15, 2009, except for the requirement to provide the level 3 activities of purchases, sales, issuances, and settlements on a gross basis, which will be effective for annual and interim periods beginning after December 15, 2010. Early application is permitted and in the period of initial adoption, entities are not required to provide the amended disclosures for any previous periods presented for comparative purposes. The Group does not expect the adoption of this pronouncement will have a significant effect on its consolidated financial position or results of operations.
In April 2010, the FASB issued an authoritative pronouncement regarding the milestone method of revenue recognition. The scope of this pronouncement is limited to arrangements that include milestones relating to research or development deliverables. The pronouncement specific guidance that must be met for a vendor to recognize consideration that is contingent upon achievement of a substantive milestone in its entirety in the period in which the milestone is achieved. The guidance applies to milestones in arrangements within the scope of this pronouncement regardless of whether the arrangement is determined to have single or multiple deliverables or units of accounting. The pronouncement will be effective for fiscal years, and interim periods within those years, beginning on or after June 15, 2010. Early application is permitted. Companies can apply this guidance prospectively to milestones achieved after adoption. However, retrospective application to all prior periods is also permitted. The Group is in the process of evaluating the effect of adoption of this pronouncement.
In April 2010, FASB issued an authoritative pronouncement regarding the effect of denominating the exercise price of a share-based payment award in the currency of the market in which the underlying equity securities trades and that currency is different from (1) entity’s functional currency, (2) functional currency of the foreign operation for which the employee provides services, and (3) payroll currency of the employee. The guidance clarifies that an employee share-based payment award with an exercise price denominated in the currency of a market in which a substantial portion of the entity’s equity securities trades should be considered an equity award assuming all other criteria for equity classification are met. The pronouncement will be effective for interim and annual periods beginning on or after December 15, 2010, and will be applied prospectively. Affected entities will be required to record a cumulativecatch-up adjustment for all awards
F-48
Table of Contents
TAL Education Group
Notes to the Unaudited Condensed
Consolidated Financial Statements
For the Six-Month Periods Ended August 31, 2009 and 2010
(In U.S. Dollars, Except Share and Share Related Data)
outstanding as of the beginning of the annual period in which the guidance is adopted. The Group is in the process of evaluating the effect of adoption of this pronouncement.
In July 2010, the FASB issued an authoritative pronouncement on disclosure about the credit quality of financing receivables and the allowance for credit losses. The objective of this guidance is to provide financial statement users with greater transparency about an entity’s allowance for credit losses and the credit quality of its financing receivables. The guidance requires an entity to provide disclosures on a disaggregated basis on two defined levels: (1) portfolio segment; and (2) class of financing receivable. The guidance includes additional disclosure requirements about financing receivables, including: (1) Credit quality indicators of financing receivables at the end of the reporting period by class of financing receivables; (2) The aging of past due financing receivables at the end of the reporting period by class of financing receivables; and (3) The nature and extent of troubled debt restructurings that occurred during the period by class of financing receivables and their effect on the allowance for credit losses. For public entities, the disclosures as of the end of a reporting period are effective for interim and annual reporting periods ending on or after December 15, 2010. The disclosures about activity that occurs during a reporting period are effective for interim and annual reporting periods beginning on or after December 15, 2010. The Group is in the process of evaluating the effect of adoption of this pronouncement.
4. Available-For-Sale Securities
In August 2007 and December 2009, the Group bought two securities in mutual funds named Wan Jia He Xie Financing Fund and Guo Du No. 1 An Xin Shou Yi, respectively. The securities were classified as available-for-sale securities and reported at fair value. In March 2010, the Group sold the security named Guo Du No. 1 An Xin Shou Yi that had a carrying value of $1,456,261 for proceeds of $1,470,660 and transferred the previously unrecognized loss of $5,973 (net of tax of $1,997) from the accumulated other comprehensive income to the statements of operations.
The available-for-sale securities measured and recorded at fair value on a recurring basis were as follows:
| Balance as of March 1, 2010 | 1,918,156 | |||
| Disposed | (1,456,261 | ) | ||
| Changes in fair value | (12,819 | ) | ||
| Foreign exchange difference | (799 | ) | ||
| Balance as of August 31, 2010 | $ | 448,277 | ||
The Group values the mutual funds using quoted price in active market to determine the fair value of available-for-sale securities (Level 1 valuation). The following provides additional information concerning the Group’s available-for-sale securities:
| As of February 28, 2010 | As of August 31, 2010 | |||||||||||||||||||||||||||||||
| Gross | Gross | Gross | Gross | |||||||||||||||||||||||||||||
| unrealized | unrealized | unrealized | unrealized | |||||||||||||||||||||||||||||
| Cost | gains | (losses) | Fair value | Cost | gains | (losses) | Fair value | |||||||||||||||||||||||||
| Mutual fund | $ | 1,805,448 | $ | 120,678 | $ | (7,970 | ) | $ | 1,918,156 | $ | 340,418 | $ | 107,859 | — | $ | 448,277 | ||||||||||||||||
F-49
Table of Contents
TAL Education Group
Notes to the Unaudited Condensed
Consolidated Financial Statements
For the Six-Month Periods Ended August 31, 2009 and 2010
(In U.S. Dollars, Except Share and Share Related Data)
5. Prepaid Expenses and Other Current Assets
Prepaid expenses and other current assets consisted of the following:
| As of | As of | |||||||
| February 28, | August 31, | |||||||
| 2010 | 2010 | |||||||
| Prepaid rent | $ | 1,344,238 | $ | 2,262,829 | ||||
| Prepayments to suppliers | 305,782 | 247,566 | ||||||
| Staff advances | 450,705 | 197,781 | ||||||
| VAT refund receivable | — | 603,146 | ||||||
| Others | 180,216 | 526,881 | ||||||
| $ | 2,280,941 | $ | 3,838,203 | |||||
6. Property and Equipment, Net
Property and equipment, net, consisted of the following:
| As of | As of | |||||||
| February 28, | August 31, | |||||||
| 2010 | 2010 | |||||||
| Leasehold improvement | $ | 3,399,250 | $ | 3,931,921 | ||||
| Computer, network equipment and software | 2,293,808 | 3,252,549 | ||||||
| Vehicles | 624,296 | 757,688 | ||||||
| Office equipment and furniture | 462,112 | 541,560 | ||||||
| Less: accumulated depreciation and amortization | (1,787,976 | ) | (2,933,428 | ) | ||||
| $ | 4,991,490 | $ | 5,550,290 | |||||
The Group recognized depreciation expenses of $438,369 and $1,140,156 for the six-month periods ended August 31, 2009 and 2010, respectively.
F-50
Table of Contents
TAL Education Group
Notes to the Unaudited Condensed
Consolidated Financial Statements
For the Six-Month Periods Ended August 31, 2009 and 2010
(In U.S. Dollars, Except Share and Share Related Data)
7. Intangible Assets, Net
Intangible assets, net, consisted of the following:
| As of | As of | |||||||
| February 28, | August 31, | |||||||
| 2010 | 2010 | |||||||
| Domain names | $ | 1,846,858 | $ | 1,846,858 | ||||
| Partnership agreement | 425,576 | 425,576 | ||||||
| Student base | 348,566 | 348,566 | ||||||
| Trade name | 262,360 | 262,360 | ||||||
| Non-compete agreement | 19,200 | 19,200 | ||||||
| Education license | 9,902 | 9,902 | ||||||
| Less: accumulated amortization | (1,537,341 | ) | (1,904,812 | ) | ||||
| Add: foreign exchange difference | 14,039 | 17,675 | ||||||
| $ | 1,389,160 | $ | 1,025,325 | |||||
Domain names were acquired from third parties. The rest of intangible assets were recorded as a result of the acquisitions of the five businesses in the year ended February 28, 2009.
The Group recorded amortization expense of $335,783 and $367,471 for the six-month periods ended August 31, 2009 and 2010, respectively.
Estimated amortization expenses of the existing intangible assets are $351,138, $505,663, $26,493, $26,493 and $117,011 for the six-month periods ending February 28, 2011 and for the fiscal year 2012, 2013, 2014 and 2015 and thereafter, respectively.
| 8. | Accrued Expenses and Other Current Liabilities |
Accrued expenses and other current liabilities consisted of the following:
| As of | As of | |||||||
| February 28, | August 31, | |||||||
| 2010 | 2010 | |||||||
| Accrued payroll and bonus | $ | 3,893,895 | $ | 5,509,769 | ||||
| Social insurance payable | 453,081 | 705,402 | ||||||
| Payable for business acquisitions | 513,062 | 240,198 | ||||||
| Other taxes payable | 1,343,425 | 2,250,961 | ||||||
| Others | 614,353 | 912,537 | ||||||
| Total | $ | 6,817,816 | $ | 9,618,867 | ||||
| Payable for the acquisition of a school in Tianjin | $ | 76,760 | $ | 77,128 | ||||
| Payable for the acquisition of Jianli School | 137,257 | — | ||||||
| Payable for the acquisition of Qianjiang School | 137,257 | — | ||||||
| Payable for the acquisition of Wuhan School | 161,788 | 163,070 | ||||||
| Payable for business acquisitions | $ | 513,062 | $ | 240,198 | ||||
F-51
Table of Contents
TAL Education Group
Notes to the Unaudited Condensed
Consolidated Financial Statements
For the Six-Month Periods Ended August 31, 2009 and 2010
(In U.S. Dollars, Except Share and Share Related Data)
| 9. | Income Taxes |
Cayman Islands
The Company is a tax-exempted company incorporated in the Cayman Islands.
Hong Kong
Xueersi Hong Kong was established in Hong Kong in March 2008. Xueersi Hong Kong is subject to Hong Kong Profits Tax on its activities conducted in Hong Kong. It was subject to Hong Kong profit tax at 16.5%. No provision for Hong Kong Profits tax has been made in the unaudited condensed consolidated financial statements as it has no assessable income for the period from its establishment to August 31, 2010.
PRC
The subsidiaries incorporated in the PRC were generally subject to a corporate income tax rate of 33% prior to January 1, 2008 except for those subsidiaries that enjoyed tax holidays or preferential tax treatment. Xueersi Network and Haidian Xueersi were entitled to a one year tax exemption in calendar year 2007 as they were newly established companies in calendar year 2007.
Effective from January 1, 2008, a new Enterprise Income Tax Law, or (“the New EIT Law”), combined the previous income tax laws for foreign invested and domestic invested enterprises in the PRC by the adoption a unified tax rate of 25% for most enterprises with the following exceptions.
Certain qualified high and new technology enterprises that meet the definition of “high and new technology enterprise strongly supported by the state” (“HNTE”) could benefit from a preferential tax rate of 15%. Xueersi Education qualified as a HNTE under the New EIT Law effective from January 1, 2008 and therefore for a preferential tax rate of 15%. In addition, since the entity is located in a high technology zone in Beijing and qualified as a high-tech company, it was entitled to a three-year exemption from EIT from calendar year 2006 to 2008 and a further tax reduction to a rate of 7.5% from calendar year 2009 to 2011.
On April 21, 2010, the State Administration of Taxation issued Circular 157 Further Clarification on Implementation of Preferential EIT Rate during Transition Periods (“Circular 157”). Circular 157 seeks to provide additional guidance on the interaction of certain preferential tax rates under the transitional rules of the New EIT Law. Prior to Circular 157, the Group interpreted the law to mean that if an HNTE entity was in a tax holiday period, including“2-year exemption plus3-year half rate”,“5-year exemption plus5-year half rate” and other tax exemptions and reductions, where it was entitled to a 50% reduction in the tax rate and was also entitled to a 15% rate of tax due to HNTE status under the New EIT Law, then it was entitled to pay tax at the rate of 7.5%. Circular 157 appears to have the effect that such an entity is entitled to pay tax at either the lower of 15% or 50% of the standard PRC tax rate (i.e. currently 25%). Circular 157 was unclear as to whether its effect is retrospective but Xueersi Education understands that the State Administration of Taxation has recently taken the position that the Circular applies only to tax years commencing from January 1, 2010.
Based on the interpretation of Circular 157 from the relevant local tax district, Xueersi Education believes that entities that qualify for“3-year exemption plus3-year half rate” tax holiday as HNTEs and which are registered in the Zhongguancun High and New Technology industrial Zones of Beijing, will continue to pay tax at the rate of 7.5%. Since Xueersi Education enjoys“3-year exemption plus3-year half rate” and is a HNTE status registered in the Zhongguancun High and New Technology industrial Zones of Beijing, Xueersi Education does not believe that Circular 157 has any effect on its tax position.
F-52
Table of Contents
TAL Education Group
Notes to the Unaudited Condensed
Consolidated Financial Statements
For the Six-Month Periods Ended August 31, 2009 and 2010
(In U.S. Dollars, Except Share and Share Related Data)
In calculating deferred tax assets and liabilities, the Group assumed Xueersi Education will continue to renew the new HNTE status at the conclusion of the initial three-year period. If Xueersi Education failed to obtain such renewals, then the deferred tax assets as of August 31, 2010 would increase by $23,165.
TAL Beijing was qualified as “Newly Established Software Enterprise” and therefore it was entitled to a two-year exemption from EIT from calendar year 2009 to 2010 and a further tax reduction to a rate of 12.5% from calendar year 2011 to 2013.
Provision (credit) for income tax consisted of the following:
| Six-Month | Six-Month | |||||||
| Periods ended | Periods ended | |||||||
| August 31, | August 31, | |||||||
| 2009 | 2010 | |||||||
| Current — PRC income tax expenses | $ | 1,281,475 | $ | 1,973,863 | ||||
| Deferred — PRC income tax benefits | (369,207 | ) | (303,330 | ) | ||||
| Total | $ | 912,268 | $ | 1,670,533 | ||||
Deferred income taxes reflect the net tax effects of temporary differences between the carrying amount of assets and liabilities for financial reporting purposes and the amounts used for income tax purposes. Significant components of the Group’s deferred tax assets and liabilities were as follows:
| As of | As of | |||||||
| February 28, | August 31, | |||||||
| 2010 | 2010 | |||||||
| Current deferred tax assets: | ||||||||
| Undistributed payroll | $ | 903,939 | $ | 1,299,540 | ||||
| Less: valuation allowance | (72,642 | ) | (73,071 | ) | ||||
| Current deferred tax assets, net | 831,297 | 1,226,469 | ||||||
| Non-current deferred tax assets: | ||||||||
| Property and equipment | 134,915 | 196,579 | ||||||
| Intangible assets | 163,003 | 162,914 | ||||||
| Tax losses carry-forward deferred tax assets | 303,909 | 587,294 | ||||||
| Less: valuation allowance | (317,859 | ) | (778,798 | ) | ||||
| Non-current deferred tax assets, net | 283,968 | 167,989 | ||||||
| Non-current deferred tax liabilities: | ||||||||
| Intangible assets | 147,433 | 120,127 | ||||||
| Unrealized gain on available-for-sale securities | 28,177 | 26,557 | ||||||
| Non-current deferred tax liabilities | $ | 175,610 | $ | 146,684 | ||||
As of August 31, 2010, tax loss carry-forward amounted to $2,429,825 and would expire through the calendar year 2016. The Group operates its business through its subsidiaries, its VIEs and their subsidiaries. The Group does not file combined or consolidated tax returns, therefore, losses from individual subsidiaries or the VIEs and their subsidiaries may not be used to offset other subsidiaries’ or VIEs’ earnings within the
F-53
Table of Contents
TAL Education Group
Notes to the Unaudited Condensed
Consolidated Financial Statements
For the Six-Month Periods Ended August 31, 2009 and 2010
(In U.S. Dollars, Except Share and Share Related Data)
Group. Valuation allowance is considered on each individual subsidiary and VIE basis. A valuation allowance of $851,869 had been established as of August 31, 2010, in respect of certain deferred tax assets as it is considered more likely than not that the relevant deferred tax assets will not be realized in the foreseeable future.
Under US GAAP, a deferred tax liability should be recorded for taxable temporary differences attributable to the excess of financial reporting amounts over tax basis amounts, including those differences attributable to a more than 50% interest in a domestic subsidiary. However, recognition is not required in situations where the tax law provides a means by which the reported amount of that investment can be recovered tax-free and the enterprise expects that it will ultimately use that means. The Company has not recorded any such deferred tax liability attributable to the undistributed earnings of its financial interest in VIEs because it believes such excess earnings can be distributed in a manner that would not be subject to income tax.
The Group has concluded that there are no significant uncertain tax positions requiring recognition in financial statements. The Group has made its assessment of the level of tax authority for each tax position (including the potential application of interest and penalties) based on the technical merits, and has measured the unrecognized tax benefits associated with the tax positions. The Group has no material unrecognized tax benefits which would favourably affect the effective income tax rate in future periods. The Group classifies interestand/or penalties related to income tax matters in income tax expense. As of August 31, 2010, there was no interest and penalties related to uncertain tax positions. The Group does not anticipate any significant increases or decreases in unrecognized tax benefits in the next 12 months.
New EIT Law includes a provision specifying that legal entities organized outside of the PRC will be considered residents for Chinese Income tax purposes if the place of effective management or control is within the PRC. The implementation rules to the New EIT Law provide that non-resident legal entities will be considered PRC residents if substantial and overall management and control over the manufacturing and business operations, personnel, accounting, properties, etc, occurs within the PRC. Despite the present uncertainties resulting from the limited PRC tax guidance on the issue, the Group does not believe that the legal entities organized outside of the PRC within the Group should be treated as residents for EIT law purposes. If the PRC tax authorities subsequently determine that the Company and its subsidiaries registered outside the PRC should be deemed a resident enterprise, the Company and its subsidiaries registered outside the PRC will be subject to the PRC income tax at a rate of 25%.
If the Company were to be non-resident for PRC tax purpose, dividends paid to it out of profits earned after January 1, 2008 would be subject to a withholding tax. In the case of dividends paid by PRC subsidiaries, the withholding tax would be 10%.
Aggregate undistributed earnings of the Company’s subsidiaries located in the PRC that are available for distribution to the Company of approximately $32,694,990 as of August 31, 2010, are considered to be indefinitely reinvested and accordingly, no provision has been made for the Chinese dividend withholding taxes that would be payable upon the distribution of those amounts to the Company. The Chinese tax authorities have also clarified that distributions made out of pre January 1, 2008 retained earnings will not be subject to the withholding tax.
F-54
Table of Contents
TAL Education Group
Notes to the Unaudited Condensed
Consolidated Financial Statements
For the Six-Month Periods Ended August 31, 2009 and 2010
(In U.S. Dollars, Except Share and Share Related Data)
| 10. | Goodwill |
Changes in the carrying amount of goodwill for the year ended February 28, 2010 and six-month periods ended August 31, 2010 consisted of the following:
| As of | As of | |||||||
| February 28, | August 31, | |||||||
| 2010 | 2010 | |||||||
Goodwill | ||||||||
| Beginning balance | $ | 762,272 | $ | 763,802 | ||||
| Foreign exchange difference due to translation | 1,530 | 2,121 | ||||||
| Ending balance | $ | 763,802 | $ | 765,923 | ||||
No impairment charges have been recorded for the six-month periods ended August 31, 2010.
| 11. | Net Income Per Share |
| Six-Month | Six-Month | |||||||
| Periods ended | Periods ended | |||||||
| August 31, | August 31, | |||||||
| 2009 | 2010 | |||||||
| Net income attributable to TAL Education Group | $ | 9,427,111 | $ | 13,245,841 | ||||
| Undistributed net income to TAL Education Group shareholders | 9,427,111 | 13,245,841 | ||||||
| Numerator used in basic and diluted net income per share: | ||||||||
| Net income attributable to TAL Education Group shareholders allocated for computing net income per common share-basic | 9,050,027 | (i) | 12,716,007 | (i) | ||||
| Net income attributable to TAL Education Group shareholders allocated for computing net income per Series A convertible redeemable preferred shares-basic | 377,084 | (i) | 529,834 | (i) | ||||
| Net income attributable to TAL Education Group shareholders allocated for computing net income per common share-diluted | 9,427,111 | 13,245,841 | ||||||
| Shares (denominator): | ||||||||
| Weighted average shares outstanding used in computing net income per common share — basic | 120,000,000 | 120,000,000 | ||||||
| Weighted average shares outstanding used in computing net income per Series A convertible redeemable preferred shares — basic | 5,000,000 | 5,000,000 | ||||||
| Dilutive effect of nonvested share awards | — | 193,360 | (ii) | |||||
| Weighted average shares outstanding used in computing net income per common share — diluted | 125,000,000 | 125,193,360 | ||||||
| Net income per common share attributable to TAL Education Group shareholders-basic | $ | 0.08 | $ | 0.11 | ||||
| Net income per Series A convertible redeemable preferred share-basic | $ | 0.08 | $ | 0.11 | ||||
| Net income per common share attributable to TAL Education Group shareholders-diluted | $ | 0.08 | $ | 0.11 | ||||
| (i) | Undistributed net income was allocated between common shares and preferred shares prorated on the dividend participation rights. Since each Series A convertible redeemable preferred share has the same participating right as each common share, the allocation was based on the numbers of common shares and Series A convertible redeemable preferred shares. | |
| (ii) | The Group has nonvested shares outstanding which could diluted basic net income per share in the future. |
F-55
Table of Contents
TAL Education Group
Notes to the Unaudited Condensed
Consolidated Financial Statements
For the Six-Month Periods Ended August 31, 2009 and 2010
(In U.S. Dollars, Except Share and Share Related Data)
| 12. | Commitments and Contingencies |
Lease commitment
The Group leases certain office premises under non-cancellable leases, the term of which are ten years or less and are renewable upon negotiation. Rental expenses under operating leases for the six-month periods ended August 31, 2009 and 2010 were $3,881,347 and $7,168,452, respectively.
Future minimum payments under non-cancellable operating leases as of August 31, 2010 were as follows:
| Six-month periods ending February 28, 2011 | $ | 7,590,469 | ||
| Fiscal years ending | ||||
| February 2012 | 13,602,220 | |||
| February 2013 | 9,882,230 | |||
| February 2014 | 7,128,243 | |||
| February 2015 and after | 4,071,011 | |||
| Total | $ | 42,274,173 | ||
| 13. | Segment Information |
Segment information
The Group is mainly engaged in after-school tutoring in the PRC. The Group’s chief operating decision maker (“CODM”) has been identified as the Chief Executive Officer who reviews financial information of separate operating segments based on US GAAP amounts when making decisions about allocating resources and assessing performance of the Group. The business is now organized and monitored on the basis of geographic locations. The CODM now reviews results analyzed by service line and geographic location. This analysis is only presented at the revenue level with no allocation of direct or indirect costs. Consequently, the Group has determined that it has only one operating segment.
Geographic information
The Group primary operates in the PRC and all of the Group’s long-lived assets are located in the PRC.
Major customers
For the six-month periods ended August 31, 2009 and 2010, there was no customer who accounted for 10% or more of the Group’s revenues.
Components of revenues are presented in the following table:
| Six-Month | Six-Month | |||||||
| Periods Ended | Periods Ended | |||||||
| August 31, | August 31, | |||||||
| 2009 | 2010 | |||||||
| Revenues: | ||||||||
| Educational programs and services | $ | 32,829,477 | $ | 52,859,699 | ||||
| Educational materials and others | 153,528 | 162,338 | ||||||
| Total revenues | $ | 32,983,005 | $ | 53,022,037 | ||||
F-56
Table of Contents
TAL Education Group
Notes to the Unaudited Condensed
Consolidated Financial Statements
For the Six-Month Periods Ended August 31, 2009 and 2010
(In U.S. Dollars, Except Share and Share Related Data)
| 14. | Mainland China Contribution Plan |
Full time employees of the Group in the PRC participate in a government-mandated defined contribution plan pursuant to which certain pension benefits, medical care, unemployment insurance, employee housing fund and other welfare benefits are provided to employees. The PRC labor regulations require the Group to accrue for these benefits based on certain percentages of the employees’ salaries. Total contributions for such employee benefits were $545,309 and $1,615,374 for the six-month periods ended August 31, 2009 and 2010, respectively.
| 15. | Related Party Transactions |
The Group had the following balances with related parties as of February 28, 2010 and August 31, 2010, respectively:
(a) Amount due to the founding shareholders-non-trading
| As of | As of | |||||||
| February 28, | August 31, | |||||||
| 2010 | 2010 | |||||||
| Founding shareholders | $ | 108,204 | (i) | $ | 100,571 | (i) | ||
| i. | The amount represents rental deposits and acquisition consideration paid by the founding shareholder on behalf of the Group. |
Amounts due to shareholders are non-interest bearing and unsecured with no fixed repayment terms. There was no right to offset the amounts due to and due from the same shareholders.
| 16. | Share-Based Compensation |
Nonvested shares
2010 Share Incentive Plan
In June 2010, the Company adopted the 2010 Share Incentive Plan. The plan permits the grant of options to purchase the Class A common shares, share appreciation rights, restricted shares, restricted share units, dividend equivalent rights and other instruments as deemed appropriate by the administrator under the plan. The maximum aggregate number of Class A common shares that may be issued pursuant to all awards under the stock incentive plan is 18,750,000 shares.
On July 26, 2010, the Group granted 5,419,500 nonvested shares under this share incentive plan to directors, executive officers and employees. The estimated fair value of the Class A common share on the grant date was $4.05 per share. The nonvested shares will vest in accordance with the vesting schedule set out in the award agreement, which is (1) 100% of 945,100 nonvested shares at the first anniversary of the date of grant, or (2) 1/2 of 831,400 nonvested shares on each of the anniversaries since the date of grant, or (3) 1/4 of 3,643,000 nonvested shares on each of the anniversaries since the date of grant.
F-57
Table of Contents
TAL Education Group
Notes to the Unaudited Condensed
Consolidated Financial Statements
For the Six-Month Periods Ended August 31, 2009 and 2010
(In U.S. Dollars, Except Share and Share Related Data)
The total compensation expense is recognized on a straight-line basis over the respective vesting periods. The Group recorded a related compensation expense of $919,862 for the six months ended August 31, 2010.
| Number of | ||||
| nonvested | ||||
| shares | ||||
| Outstanding as of March 1, 2010 | — | |||
| Granted | 5,419,500 | |||
| Forfeited | — | |||
| Vested | — | |||
| Outstanding as of August 31, 2010 | 5,419,500 | |||
As of August 31, 2010, the unrecognized compensation expense related to the nonvested share awards amounted to $18,296,424, which will be recognized over their respective requisite service periods up to 4 years.
| 17. | Subsequent Events |
The Group has evaluated events subsequent to the balance sheet date of August 31, 2010 through September 29, 2010, the date the unaudited condensed consolidated financial statements were available to be issued.
On September 29, 2010, the Company adopted the Third Amended and Restated Memorandum and Articles of Association (M&AA). The share capital of the Company is US$1,000,000.00 divided into (i) 500,000,000 Class A common shares of par value US$0.001 each, (ii) 495,000,000 of Class B common shares of par value US$0.001 each, and (iii) 5,000,000 Series A preferred shares of par value US$0.001 each. All issued and outstanding common shares of the Company as of September 28, 2010 are re-designated as Class B common shares. The outstanding preferred shares will be automatically converted into Class B common shares immediately prior to the closing of the initial public offering.
Holders of Class A common shares and Class B common shares have the same rights except for voting and conversion rights. Each Class A common share is entitled to one vote and each Class B common share is entitled to ten votes. Each Class B common share is convertible into one Class A common share at any time by the holder thereof. Class A common shares are not convertible into Class B common shares under any circumstances. Upon any transfer of Class B common shares by a holder thereof to any person or entity which is not an affiliate of such holder, such Class B common shares shall be automatically and immediately converted into an equal number of Class A common shares.
Upon adoption of the amended and restated M&AA, all shares and per share information presented in the accompanying consolidated financial statements have been revised on a retroactive basis to reflect the re-designation of outstanding common shares as Class B common shares as if the amended and restated M&AA had been in place throughout the periods presented.
On September 29, 2010, the Group declared a $30.0 million cash dividend to the Group’s then existing shareholders conditional upon the completion of the initial public offering.
F-58
Table of Contents

Table of Contents
TAL EDUCATION GROUP
12,000,000 American Depositary Shares
Representing
24,000,000 Class A Common Shares
| Credit Suisse | Morgan Stanley |
| Piper Jaffray | Oppenheimer & Co. |