Exhibit 99.1


Fourth Quarter 2013 Results
| | | | |
| Table of Contents | | | | |
| |
Earnings Release | | | 1-2 | |
| |
Consolidated Statements of Operations and Comprehensive Income | | | 3 | |
| |
Reconciliations of Net Income to EBITDA, Adjusted EBITDA, FFO, Normalized FFO and AFFO | | | 4 | |
| |
Consolidated Balance Sheets | | | 5 | |
| |
Consolidated Statements of Cash Flows | | | 6-7 | |
| |
Portfolio Summary | | | 8-10 | |
| |
Investment Activity | | | 11 | |
| |
Debt Summary and Capitalization | | | 12 | |
| |
Common Share and OP Unit Weighted Average Amounts Outstanding | | | 13 | |
| |
2014 Guidance | | | 14 | |
| |
Definitions and Footnotes | | | 15-16 | |
Note: This earnings release and supplemental information contains certain non-GAAP financial measures that we believe are helpful in understanding our business, as further discussed herein. These financial measures, which include Funds From Operations, Normalized Funds From Operations, AFFO, Funds From Operations per share, Normalized Funds From Operations per share and AFFO per share, should not be considered as an alternative to net income, earnings per share or any other GAAP measurement of performance or as an alternative to cash flows from operating, investing or financing activities. Furthermore, these non-GAAP financial measures are not intended to be a measure of cash flow or liquidity. Information included in this supplemental package is unaudited.
AVIV REIT REPORTS FOURTH QUARTER 2013 RESULTS
2014 AFFO PER SHARE EXPECTED TO INCREASE 13%
CHICAGO, IL – February 20, 2014 – Aviv REIT, Inc. (NYSE: AVIV) today reported results for the fourth quarter and year ended December 31, 2013. All per share results are reported on a fully diluted basis.
Highlights
| | • | | $250 million of 6% Senior Notes due 2021 issued in October 2013 |
| | • | | $159 million of acquisitions closed during the fourth quarter, at an initial cash yield of 9.8% |
| | • | | $6 million invested for property reinvestment and new construction during the fourth quarter |
| | • | | $56 million of acquisitions closed during the first quarter to date, at an initial cash yield of 9.4% |
| | • | | AFFO of $20.9 million, or $0.41 per diluted share |
| | • | | Adjusted EBITDA of $33.5 million |
“We are pleased with our performance for our first year as a public company, completing $239 million of investments and delivering earnings results consistent with our expectations,” said Craig M. Bernfield, Chairman and Chief Executive Officer of Aviv. “With $56 million of acquisitions already completed year-to-date, we look forward to having an active and successful 2014.”
Fourth Quarter 2013 Results
AFFO for the quarter ended December 31, 2013 was $20.9 million, or $0.41 per diluted share, compared to $21.8 million, or $0.43 per diluted share, for the quarter ended September 30, 2013. The primary difference is due to the additional interest expense from the Company’s October 2013 unsecured notes offering, which was used to pre-fund the fourth quarter acquisitions.
Adjusted EBITDA for the quarter ended December 31, 2013 was $33.5 million, compared to $32.4 million for the quarter ended September 30, 2013. Net income for the quarter ended December 31, 2013 was $11.0 million, or $0.22 per diluted share, compared to $10.1 million, or $0.20 per diluted share, for the quarter ended September 30, 2013.
Full Year 2013 Results
AFFO for the year ended December 31, 2013 was $79.5 million, or $1.69 per diluted share. Adjusted EBITDA for the year ended December 31, 2013 was $128.8 million, compared to $110.2 million for the corresponding period in 2012. Net income for the year ended December 31, 2013 was $23.1 million, or $0.49 per diluted share, compared to $8.6 million, or $0.26 per share, for the year ended December 31, 2012.
Balance Sheet and Liquidity
In October 2013, the Company issued $250 million of 6% Senior Notes due 2021. $135 million of the proceeds were used to entirely pay down the Company’s line of credit, with the remaining proceeds available for general corporate purposes, including for acquisitions and other investments. As of December 31, 2013, the Company had $51 million of cash and $380 million available on its $400 million line of credit. As of December 31, 2013, net debt to Adjusted EBITDA was 4.7x.
1
Dividends
On November 26, 2013, the Company’s Board of Directors declared a dividend for the fourth quarter of $0.36 per share. The dividend was paid in cash on January 17, 2014 to stockholders of record on January 3, 2014.
Full Year 2014 AFFO Guidance
The Company has established an AFFO guidance range of $1.89 to $1.93 per share for the full year 2014 without regard to any additional acquisitions, dispositions or capital transactions. The assumptions underlying guidance can be found on page 14 of this press release. The $0.22 per share, or 13%, increase between the Company’s full year 2013 AFFO of $1.69 and the expected mid-point of the Company’s guidance range for full year 2014 is primarily due to:
| | • | | a positive impact of approximately $0.53 per share from the full-year impact of acquisitions completed in 2013, the impact of acquisitions completed in 2014 to date and annual escalators on the Company’s triple-net leases; |
| | • | | a negative impact of approximately $0.14 per share from additional interest expense from higher total debt outstanding used to fund the Company’s investment activity; and |
| | • | | a negative impact of approximately $0.17 per share from the full-year impact of shares issued for the Company’s initial public offering in March 2013. |
Conference Call and Webcast Information
A conference call to discuss the fourth quarter 2013 earnings will take place today at 1:00 p.m. central time / 2:00 p.m. eastern time. The dial-in number for the conference call is (877) 941-8609 (U.S.) or (480) 629-9645 (International). The conference call can also be accessed via webcast atwww.avivreit.com under the Investor Relations tab. A replay of the call will be available through March 20, 2014 on the Company’s website or by calling (800) 406-7325, access code 4663686.
About Aviv
Aviv REIT, Inc., based in Chicago, is a real estate investment trust that specializes in owning post-acute and long-term care skilled nursing facilities and other healthcare properties. Aviv is one of the largest owners of SNFs in the United States and has been in the business for over 30 years. As of today, the Company owns 286 properties that are triple-net leased to 39 operators in 29 states.
For more information about the Company, please visit our website atwww.avivreit.com or contact:
David J. Smith, Managing Director, Investor Relations & Capital Markets at 312-855-0930.
Forward-Looking Statements
This press release may include forward-looking statements. Forward-looking statements can be identified by the use of words such as “may,” “should,” “expects,” “plans,” “anticipates,” “believes,” “estimates,” “predicts,” “intends,” “continue” or similar terminology. These forward-looking statements are made based on our current expectations and beliefs concerning future events affecting us and are subject to uncertainties and factors relating to our operations and business environment, all of which are difficult to predict and many of which are beyond our control, that could cause our actual results to differ materially from those matters expressed in or implied by these forward-looking statements. These uncertainties include, but are not limited to, uncertainties relating to the operations of our tenants, including those relating to reimbursement by government and other third-party payors, compliance with regulatory requirements and occupancy levels, regulatory, reimbursement and other changes in the healthcare industry, the performance and reputation of our tenants, our ability to successfully engage in strategic acquisitions and investments, the effect of general market, economic and political conditions, the obligations associated with being a public company, our level of indebtedness, the availability and cost of capital, changes in tax laws and regulations affecting REITs and our ability to maintain our status as a REIT. Important factors that could cause actual results to differ materially from our expectations include those disclosed under “Risk Factors” and elsewhere in filings made by Aviv REIT, Inc. and Aviv Healthcare Properties Limited Partnership with the Securities and Exchange Commission.
2
Aviv REIT, Inc.
Consolidated Statements of Operations and Comprehensive Income
(unaudited, in thousands except share and per share data)
| | | | | | | | | | | | | | | | |
| | | Three Months Ended December 31, | | | Year Ended December 31, | |
| | | 2013 | | | 2012 | | | 2013 | | | 2012 | |
Revenues | | | | | | | | | | | | | | | | |
Rental income | | $ | 37,307 | | | $ | 31,526 | | | $ | 136,513 | | | $ | 121,210 | |
Interest on secured loans and financing lease | | | 1,128 | | | | 1,090 | | | | 4,400 | | | | 4,633 | |
Interest and other income | | | 26 | | | | 2 | | | | 154 | | | | 1,129 | |
| | | | | | | | | | | | | | | | |
Total revenues | | | 38,461 | | | | 32,618 | | | | 141,067 | | | | 126,972 | |
Expenses | | | | | | | | | | | | | | | | |
Interest expense incurred | | | 11,186 | | | | 12,371 | | | | 40,785 | | | | 47,440 | |
Amortization of deferred financing costs | | | 943 | | | | 918 | | | | 3,459 | | | | 3,543 | |
Depreciation and amortization | | | 8,826 | | | | 7,221 | | | | 33,226 | | | | 26,892 | |
General and administrative | | | 5,736 | | | | 4,891 | | | | 26,886 | | | | 15,955 | |
Transaction costs | | | 1,208 | | | | 3,410 | | | | 3,114 | | | | 7,259 | |
Loss on impairment of assets | | | 500 | | | | 4,971 | | | | 500 | | | | 11,117 | |
Reserve for uncollectible secured loans and other receivables | | | 12 | | | | 1,511 | | | | 68 | | | | 10,331 | |
Gain on sale of assets, net | | | (990 | ) | | | — | | | | (1,016 | ) | | | — | |
Loss on extinguishment of debt | | | — | | | | 28 | | | | 10,974 | | | | 28 | |
Other expenses | | | — | | | | 100 | | | | — | | | | 400 | |
| | | | | | | | | | | | | | | | |
Total expenses | | | 27,422 | | | | 35,421 | | | | 117,996 | | | | 122,965 | |
| | | | | | | | | | | | | | | | |
Income from continuing operations | | | 11,039 | | | | (2,803 | ) | | | 23,071 | | | | 4,007 | |
Discontinued operations | | | — | | | | — | | | | — | | | | 4,586 | |
| | | | | | | | | | | | | | | | |
Net income | | | 11,039 | | | | (2,803 | ) | | | 23,071 | | | | 8,593 | |
Net income allocable to noncontrolling interests | | | (4,269 | ) | | | 996 | | | | (6,010 | ) | | | (3,455 | ) |
| | | | | | | | | | | | | | | | |
Net income allocable to stockholders | | $ | 6,770 | | | $ | (1,807 | ) | | $ | 17,061 | | | $ | 5,138 | |
| | | | | | | | | | | | | | | | |
Net income | | $ | 11,039 | | | $ | (2,803 | ) | | $ | 23,071 | | | $ | 8,593 | |
Unrealized loss on derivative instruments | | | — | | | | — | | | | — | | | | (476 | ) |
| | | | | | | | | | | | | | | | |
Total comprehensive income | | $ | 11,039 | | | $ | (2,803 | ) | | $ | 23,071 | | | $ | 8,117 | |
| | | | | | | | | | | | | | | | |
Net income allocable to stockholders | | $ | 6,770 | | | $ | (1,807 | ) | | $ | 17,061 | | | $ | 5,138 | |
Unrealized loss on derivative instruments, net of noncontrolling interest portion of $0, $0, $0 and $192, respectively | | | — | | | | — | | | | — | | | | (284 | ) |
| | | | | | | | | | | | | | | | |
Total comprehensive income allocable to stockholders | | $ | 6,770 | | | $ | (1,807 | ) | | $ | 17,061 | | | $ | 4,854 | |
| | | | | | | | | | | | | | | | |
Earnings per common share: | | | | | | | | | | | | | | | | |
Basic: | | | | | | | | | | | | | | | | |
Income from continuing operations allocable to stockholders | | $ | 0.22 | | | $ | (0.08 | ) | | $ | 0.51 | | | $ | 0.12 | |
Discontinued operations, net of noncontrolling interests | | | — | | | | — | | | | — | | | | 0.14 | |
| | | | | | | | | | | | | | | | |
Net income allocable to stockholders | | $ | 0.22 | | | $ | (0.08 | ) | | $ | 0.51 | | | $ | 0.26 | |
| | | | | | | | | | | | | | | | |
Diluted: | | | | | | | | | | | | | | | | |
Income from continuing operations allocable to stockholders | | $ | 0.22 | | | $ | (0.08 | ) | | $ | 0.49 | | | $ | 0.12 | |
Discontinued operations, net of noncontrolling interests | | | — | | | | — | | | | — | | | | 0.14 | |
| | | | | | | | | | | | | | | | |
Net income allocable to stockholders | | $ | 0.22 | | | $ | (0.08 | ) | | $ | 0.49 | | | $ | 0.26 | |
| | | | | | | | | | | | | | | | |
Weighted average shares used in computing earnings per common share: | | | | | | | | | | | | | | | | |
Basic | | | 37,534,676 | | | | 21,653,813 | | | | 33,700,834 | | | | 20,006,538 | |
Diluted | | | 50,950,662 | | | | 21,782,964 | | | | 44,324,214 | | | | 20,135,689 | |
Dividends declared per common share | | $ | 0.36 | | | $ | 0.32 | | | $ | 1.40 | | | $ | 1.25 | |
3
Aviv REIT, Inc.
Reconciliations of Net Income to EBITDA and Adjusted EBITDA1
(unaudited, in thousands)
| | | | | | | | | | | | | | | | |
| | | Three Months Ended December 31, | | | Year Ended December 31, | |
| | | 2013 | | | 2012 | | | 2013 | | | 2012 | |
Net income | | $ | 11,039 | | | $ | (2,803 | ) | | $ | 23,071 | | | $ | 8,593 | |
Interest expense, net | | | 11,186 | | | | 12,371 | | | | 40,784 | | | | 47,436 | |
Amortization of deferred financing costs | | | 943 | | | | 918 | | | | 3,459 | | | | 3,543 | |
Depreciation and amortization | | | 8,826 | | | | 7,221 | | | | 33,226 | | | | 26,892 | |
| | | | | | | | | | | | | | | | |
EBITDA | | | 31,994 | | | | 17,707 | | | | 100,540 | | | | 86,464 | |
Loss on impairment | | | 500 | | | | 4,971 | | | | 500 | | | | 11,117 | |
Gain on sale of assets, net | | | (990 | ) | | | — | | | | (1,016 | ) | | | (4,425 | ) |
Transaction costs | | | 1,208 | | | | 3,410 | | | | 3,114 | | | | 7,259 | |
Write-off of straight-line rents | | | — | | | | 985 | | | | 2,887 | | | | 1,552 | |
Non-cash stock-based compensation | | | 823 | | | | 460 | | | | 11,752 | | | | 1,689 | |
Loss on extinguishment of debt | | | — | | | | 28 | | | | 10,974 | | | | 28 | |
Reserve for uncollectible loan receivables | | | — | | | | 223 | | | | 11 | | | | 6,531 | |
| | | | | | | | | | | | | | | | |
Adjusted EBITDA | | $ | 33,535 | | | $ | 27,784 | | | $ | 128,762 | | | $ | 110,215 | |
| | | | | | | | | | | | | | | | |
| (1) | See definitions and footnotes on pages 15 and 16 |
Aviv REIT, Inc.
Reconciliations of Net Income to FFO, Normalized FFO and AFFO1
(unaudited, in thousands except share and per share data)
| | | | | | | | | | | | | | | | |
| | | Three Months Ended December 31, | | | Year Ended December 31, | |
| | | 2013 | | | 2012 | | | 2013 | | | 2012 | |
Net income | | $ | 11,039 | | | $ | (2,803 | ) | | $ | 23,071 | | | $ | 8,593 | |
Adjusted for: | | | | | | | | | | | | | | | | |
Depreciation and amortization | | | 8,826 | | | | 7,221 | | | | 33,226 | | | | 26,892 | |
Loss on impairment | | | 500 | | | | 4,971 | | | | 500 | | | | 11,117 | |
Gain on sale of assets, net | | | (990 | ) | | | — | | | | (1,016 | ) | | | (4,425 | ) |
| | | | | | | | | | | | | | | | |
FFO | | | 19,375 | | | | 9,389 | | | | 55,781 | | | | 42,177 | |
Loss on extinguishment of debt | | | — | | | | 28 | | | | 10,974 | | | | 28 | |
Reserve for uncollectible loan receivables | | | — | | | | 223 | | | | 11 | | | | 6,531 | |
Severance cost | | | 276 | | | | — | | | | 276 | | | | — | |
Transaction costs | | | 1,208 | | | | 3,410 | | | | 3,114 | | | | 7,259 | |
| | | | | | | | | | | | | | | | |
Normalized FFO | | | 20,859 | | | | 13,050 | | | | 70,156 | | | | 55,995 | |
Amortization of deferred financing costs | | | 943 | | | | 918 | | | | 3,459 | | | | 3,543 | |
Non-cash stock-based compensation | | | 823 | | | | 460 | | | | 11,752 | | | | 1,689 | |
Straight-line rental income, net | | | (1,480 | ) | | | (1,734 | ) | | | (4,478 | ) | | | (7,656 | ) |
Rental income from intangible amortization, net | | | (272 | ) | | | (337 | ) | | | (1,369 | ) | | | (1,486 | ) |
| | | | | | | | | | | | | | | | |
AFFO | | $ | 20,873 | | | $ | 12,357 | | | $ | 79,520 | | | $ | 52,085 | |
| | | | | | | | | | | | | | | | |
Weighted average common shares and units outstanding, basic | | | 49,210 | | | | | | | | 45,573 | | | | | |
| | | | | | | | | | | | | | | | |
Weighted average common shares and units outstanding, diluted | | | 50,951 | | | | | | | | 47,104 | | | | | |
| | | | | | | | | | | | | | | | |
AFFO per share and unit, basic | | $ | 0.42 | | | | | | | $ | 1.74 | | | | | |
| | | | | | | | | | | | | | | | |
AFFO per share and unit, diluted | | $ | 0.41 | | | | | | | $ | 1.69 | | | | | |
| | | | | | | | | | | | | | | | |
| (1) | See definitions and footnotes on pages 15 and 16 |
4
Aviv REIT, Inc.
Consolidated Balance Sheets
(unaudited, in thousands except share data)
| | | | | | | | |
| | | December 31, | | | December 31, | |
| | | 2013 | | | 2012 | |
Assets | | | | | | | | |
Income producing property | | | | | | | | |
Land | | $ | 138,150 | | | $ | 119,132 | |
Buildings and improvements | | | 1,138,173 | | | | 968,075 | |
Assets under direct financing leases | | | 11,175 | | | | 11,049 | |
| | | | | | | | |
| | | 1,287,498 | | | | 1,098,256 | |
Less accumulated depreciation | | | (147,302 | ) | | | (119,371 | ) |
Construction in progress and land held for development | | | 23,292 | | | | 4,576 | |
| | | | | | | | |
Net real estate | | | 1,163,488 | | | | 983,461 | |
Cash and cash equivalents | | | 50,764 | | | | 17,876 | |
Straight-line rent receivable, net | | | 40,580 | | | | 36,102 | |
Tenant receivables, net | | | 1,647 | | | | 3,484 | |
Deferred finance costs, net | | | 16,643 | | | | 14,651 | |
Secured loan receivables, net | | | 41,686 | | | | 32,639 | |
Other assets | | | 15,625 | | | | 11,316 | |
| | | | | | | | |
Total assets | | $ | 1,330,433 | | | $ | 1,099,529 | |
| | | | | | | | |
Liabilities and equity | | | | | | | | |
Secured loan | | $ | 13,654 | | | $ | 213,679 | |
Unsecured notes payable | | | 652,752 | | | | 403,180 | |
Line of credit | | | 20,000 | | | | 88,294 | |
Accrued interest payable | | | 15,284 | | | | 13,265 | |
Dividends & distributions payable | | | 17,694 | | | | 13,687 | |
Accounts payable and accrued expenses | | | 10,555 | | | | 10,943 | |
Tenant security and escrow deposits | | | 21,586 | | | | 18,278 | |
Other liabilities | | | 10,463 | | | | 17,700 | |
| | | | | | | | |
Total liabilities | | | 761,988 | | | | 779,026 | |
Equity: | | | | | | | | |
Stockholders’ equity | | | | | | | | |
Common stock (par value $0.01; 37,593,910 and 21,653,813 shares issued and outstanding, respectively) | | | 376 | | | | 217 | |
Additional paid-in-capital | | | 523,658 | | | | 375,030 | |
Accumulated deficit | | | (89,742 | ) | | | (46,527 | ) |
Accumulated other comprehensive loss | | | — | | | | (2,152 | ) |
| | | | | | | | |
Total stockholders’ equity | | | 434,292 | | | | 326,568 | |
Noncontrolling interests—operating partnership | | | 134,153 | | | | (6,065 | ) |
| | | | | | | | |
Total equity | | | 568,445 | | | | 320,503 | |
| | | | | | | | |
Total liabilities and equity | | $ | 1,330,433 | | | $ | 1,099,529 | |
| | | | | | | | |
5
Aviv REIT, Inc.
Consolidated Statements of Cash Flows
(unaudited, in thousands)
| | | | | | | | |
| | | Year Ended December 31, | |
| | | 2013 | | | 2012 | |
Operating activities | | | | | | | | |
Net income | | $ | 23,071 | | | $ | 8,593 | |
Adjustments to reconcile net income to net cash provided by operating activities: | | | | | | | | |
Depreciation and amortization | | | 33,226 | | | | 26,935 | |
Amortization of deferred financing costs | | | 3,459 | | | | 3,543 | |
Accretion of debt premium | | | (507 | ) | | | (414 | ) |
Straight-line rental income, net | | | (4,478 | ) | | | (7,656 | ) |
Rental income from intangible amortization, net | | | (1,369 | ) | | | (1,486 | ) |
Non-cash stock-based compensation | | | 11,752 | | | | 1,689 | |
Gain on sale of assets, net | | | (1,016 | ) | | | (4,425 | ) |
Non-cash loss on extinguishment of debt | | | 5,161 | | | | 42 | |
Loss on impairment | | | 500 | | | | 11,117 | |
Reserve for uncollectible loans and other receivables | | | 68 | | | | 10,331 | |
Accretion of earn-out provision for previously | | | — | | | | 400 | |
acquired real estate investments | | | | | | | | |
Changes in assets and liabilities: | | | | | | | | |
Tenant receivables | | | (3,511 | ) | | | (4,572 | ) |
Other assets | | | (5,229 | ) | | | (5,873 | ) |
Accounts payable and accrued expenses | | | 3,949 | | | | 5,021 | |
Tenant security deposits and other liabilities | | | 2,277 | | | | 1,230 | |
| | | | | | | | |
Net cash provided by operating activities | | | 67,353 | | | | 44,475 | |
Investing activities | | | | | | | | |
Purchase of real estate | | | (197,388 | ) | | | (172,773 | ) |
Proceeds from sales of real estate | | | 15,549 | | | | 31,933 | |
Capital improvements | | | (12,003 | ) | | | (13,558 | ) |
Development projects | | | (18,738 | ) | | | (28,067 | ) |
Secured loan receivables received from others | | | 4,086 | | | | 14,632 | |
Secured loan receivables funded to others | | | (10,407 | ) | | | (16,857 | ) |
| | | | | | | | |
Net cash used in investing activities | | | (218,901 | ) | | | (184,690 | ) |
6
Aviv REIT, Inc.
Consolidated Statements of Cash Flows
(unaudited, in thousands)
| | | | | | | | |
| | | Year Ended December 31, | |
| | | 2013 | | | 2012 | |
Financing activities | | | | | | | | |
Borrowings of debt | | $ | 470,000 | | | $ | 267,761 | |
Repayment of debt | | | (488,241 | ) | | | (174,127 | ) |
Payment of financing costs | | | (10,448 | ) | | | (5,143 | ) |
Capital contributions | | | 575 | | | | 109,000 | |
Deferred contribution | | | — | | | | (35,000 | ) |
Initial public offering proceeds | | | 303,600 | | | | — | |
Cost of raising capital | | | (25,829 | ) | | | — | |
Cash distributions to partners | | | (16,314 | ) | | | (16,484 | ) |
Cash dividends to stockholders | | | (48,907 | ) | | | (28,778 | ) |
| | | | | | | | |
Net cash provided by financing activities | | | 184,436 | | | | 117,229 | |
| | | | | | | | |
Net increase (decrease) in cash and cash equivalents | | | 32,888 | | | | (22,986 | ) |
Cash and cash equivalents: | | | | | | | | |
Beginning of year | | | 17,876 | | | | 40,862 | |
| | | | | | | | |
End of year | | $ | 50,764 | | | $ | 17,876 | |
| | | | | | | | |
Supplemental cash flow information | | | | | | | | |
Cash paid for interest | | $ | 40,008 | | | $ | 46,711 | |
Supplemental disclosure of noncash activity | | | | | | | | |
Accrued dividends payable to stockholders | | $ | 13,551 | | | $ | 9,888 | |
Accrued distributions payable to partners | | $ | 4,143 | | | $ | 3,799 | |
Write-off of straight-line rent receivable, net | | $ | 2,887 | | | $ | 1,552 | |
Write-off of in-place lease intangibles, net | | $ | — | | | $ | 19 | |
Write-off of deferred financing costs, net | | $ | 5,161 | | | $ | 42 | |
Assumed debt | | $ | — | | | $ | 11,460 | |
7
Aviv REIT, Inc.
Portfolio Summary1
Portfolio Composition
| | | | | | | | | | | | | | | | | | | | | | | | |
Property Type | | Property
Count | | | Number
of Beds | | | Square
Feet | | | Investment
(GBV) | | | Annualized
Cash
Rent | | | % of
Total Rent | |
Skilled Nursing | | | 236 | | | | 20,754 | | | | 7,950 | | | $ | 1,102,231 | | | $ | 127,870 | | | | 85.7 | % |
Senior Housing | | | 26 | | | | 1,761 | | | | 1,024 | | | | 147,280 | | | | 15,813 | | | | 10.6 | % |
Other Healthcare Properties | | | 20 | | | | 221 | | | | 143 | | | | 65,008 | | | | 5,488 | | | | 3.7 | % |
| | | | | | | | | | | | | | | | | | | | | | | | |
Total | | | 282 | | | | 22,736 | | | | 9,117 | | | $ | 1,314,519 | | | $ | 149,171 | | | | 100.0 | % |
| | | | | | | | | | | | | | | | | | | | | | | | |
Portfolio Performance
| | | | | | | | | | | | | | | | | | | | | | | | | | | | |
Core Portfolio | | EBITDARM
Coverage | | | EBITDAR
Coverage | | | Occupancy | | | Facility Revenue Mix | | | EBITDAR
Margin | |
| | | | | Private Pay | | | Medicare | | | Medicaid | | |
Skilled Nursing | | | 1.9x | | | | 1.5x | | | | 79.2 | % | | | 19.5 | % | | | 24.3 | % | | | 56.3 | % | | | 14.6 | % |
Senior Housing | | | 1.6x | | | | 1.4x | | | | 77.0 | % | | | 81.4 | % | | | 4.9 | % | | | 13.8 | % | | | 29.8 | % |
Other Healthcare Properties | | | 9.8x | | | | 8.7x | | | | 86.0 | % | | | 100.0 | % | | | 0.0 | % | | | 0.0 | % | | | 30.4 | % |
| | | | | | | | | | | | | | | | | | | | | | | | | | | | |
Total | | | 2.0x | | | | 1.6x | | | | 79.2 | % | | | 24.7 | % | | | 22.7 | % | | | 52.7 | % | | | 15.7 | % |
| | | | | | | | | | | | | | | | | | | | | | | | | | | | |
State Diversification
| | | | | | | | | | | | | | | | |
State | | Properties | | | Investment
(GBV) | | | Annualized Rent | |
| | | | Rent | | | % | |
Texas | | | 62 | | | $ | 218,913 | | | $ | 26,032 | | | | 17.5 | % |
Ohio | | | 27 | | | | 191,381 | | | | 20,868 | | | | 14.0 | % |
California | | | 36 | | | | 167,033 | | | | 19,162 | | | | 12.8 | % |
Connecticut | | | 6 | | | | 92,725 | | | | 9,428 | | | | 6.3 | % |
Pennsylvania | | | 10 | | | | 79,599 | | | | 8,265 | | | | 5.5 | % |
Missouri | | | 15 | | | | 76,164 | | | | 7,229 | | | | 4.8 | % |
Arkansas | | | 11 | | | | 54,722 | | | | 5,818 | | | | 3.9 | % |
Illinois | | | 11 | | | | 38,864 | | | | 5,359 | | | | 3.6 | % |
New Mexico | | | 9 | | | | 29,586 | | | | 5,075 | | | | 3.4 | % |
Washington | | | 10 | | | | 57,785 | | | | 4,621 | | | | 3.1 | % |
Other 19 States | | | 85 | | | | 307,748 | | | | 37,314 | | | | 25.0 | % |
| | | | | | | | | | | | | | | | |
| | | 282 | | | $ | 1,314,519 | | | $ | 149,171 | | | | 100.0 | % |
| | | | | | | | | | | | | | | | |
Operator Diversification
| | | | | | | | | | | | | | | | | | | | | | | | |
Operator (Location) | | Properties | | | Investment
(GBV) | | | Annualized Rent | | | States | |
| | Aviv | | | Total | | | | Rent | | | % | | |
Daybreak (Denton, TX) | | | 52 | | | | 69 | | | $ | 170,256 | | | $ | 20,909 | | | | 14.0 | % | | | 2 | |
Saber (Bedford Heights, OH) | | | 30 | | | | 72 | | | | 185,761 | | | | 20,130 | | | | 13.5 | % | | | 6 | |
EmpRes (Vancouver, WA) | | | 17 | | | | 45 | | | | 111,862 | | | | 12,480 | | | | 8.4 | % | | | 6 | |
Preferred Care (Plano, TX) | | | 17 | | | | 111 | | | | 69,007 | | | | 10,537 | | | | 7.1 | % | | | 12 | |
Maplewood (Westport, CT) | | | 7 | | | | 7 | | | | 102,940 | | | | 10,228 | | | | 6.9 | % | | | 2 | |
Sun Mar (Brea, CA) | | | 13 | | | | 25 | | | | 71,075 | | | | 8,980 | | | | 6.0 | % | | | 1 | |
Fundamental (Sparks, MD) | | | 12 | | | | 104 | | | | 78,438 | | | | 7,314 | | | | 4.9 | % | | | 9 | |
Diversicare (Brentwood, TN) | | | 6 | | | | 47 | | | | 54,952 | | | | 5,637 | | | | 3.8 | % | | | 9 | |
Deseret (Bountiful, UT) | | | 18 | | | | 29 | | | | 39,077 | | | | 4,936 | | | | 3.3 | % | | | 5 | |
Genesis (Kennett Square, PA) | | | 10 | | | | 412 | | | | 16,253 | | | | 4,400 | | | | 2.9 | % | | | 28 | |
Other 28 Operators | | | 100 | | | | 402 | | | | 414,898 | | | | 43,621 | | | | 29.2 | % | | | | |
| | | | | | | | | | | | | | | | | | | | | | | | |
| | | 282 | | | | 1,323 | | | $ | 1,314,519 | | | $ | 149,171 | | | | 100.0 | % | | | | |
| | | | | | | | | | | | | | | | | | | | | | | | |
| (1) | Dollars and square feet in thousands. Data as of December 31, 2013. Coverage, occupancy, margin and revenue mix information is provided on a trailing twelve month basis through September 30, 2013. Annualized cash rent for leases in place as of December 31, 2013 and includes income from a deferred financing lease. |
Totals may not add due to rounding.
8
Aviv REIT, Inc.
Portfolio Summary
State Occupancy1
| | | | | | | | | | | | |
State | | Aviv
Occupancy | | | State
Average | | | Variance | |
Texas | | | 74.6 | % | | | 71.9 | % | | | 2.7 | % |
Ohio | | | 83.0 | % | | | 84.3 | % | | | (1.3 | %) |
California | | | 90.9 | % | | | 85.0 | % | | | 5.9 | % |
Connecticut | | | 98.8 | % | | | NA | | | | NA | |
Pennsylvania | | | 85.0 | % | | | 90.4 | % | | | (5.4 | %) |
Missouri | | | 72.6 | % | | | 71.7 | % | | | 0.9 | % |
Arkansas | | | 70.8 | % | | | 72.4 | % | | | (1.6 | %) |
Illinois | | | 72.8 | % | | | 77.7 | % | | | (4.9 | %) |
New Mexico | | | 81.1 | % | | | 83.7 | % | | | (2.6 | %) |
Washington | | | 85.9 | % | | | 79.9 | % | | | 6.0 | % |
Lease Maturity Schedule2
| | | | | | | | |
Year | | Number of
Properties | | | % of
Total Rent | |
2014 | | | 1 | | | | 0.2 | % |
2015 | | | 8 | | | | 2.2 | % |
2016 | | | 6 | | | | 2.2 | % |
2017 | | | 16 | | | | 3.8 | % |
2018 | | | 28 | | | | 11.8 | % |
Thereafter | | | 222 | | | | 79.8 | % |
| | | | | | | | |
Total | | | 281 | | | | 100.0 | % |
| | | | | | | | |
| (1) | Occupancy information as of September 30, 2013. State occupancy represents nursing facility occupancies per American Health Care Association. Aviv only has assisted living properties in Connecticut. |
| (2) | Lease expiration schedule as of December 31, 2013 and excludes one property without a lease in place at December 31, 2013. |
9
Aviv REIT, Inc.
Portfolio Summary
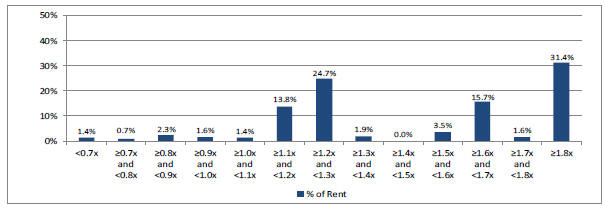
Information for the trailing twelve month period ended September 30, 2013
EBITDARM Coverage Distribution
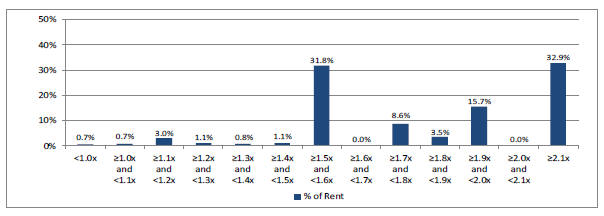
EBITDAR Coverage Distribution
10
Aviv REIT, Inc.
Investment Activity as of December 31, 2013
(in thousands)
2013 Property Reinvestment and New Construction
| | | | | | | | | | | | |
Period | | Property
Reinvestment | | | New
Construction | | | Total | |
Fourth quarter | | $ | 2,094 | | | $ | 4,358 | | | $ | 6,452 | |
Third quarter | | | 1,993 | | | | 3,882 | | | | 5,875 | |
Second quarter | | | 3,011 | | | | 8,674 | | | | 11,685 | |
First quarter | | | 4,905 | | | | 1,824 | | | | 6,729 | |
| | | | | | | | | | | | |
| | | | | | | | | | $ | 30,741 | |
| | | | | | | | | | | | |
New Construction Projects
| | | | | | | | | | | | | | | | | | | | | | | | | | | | | | | | |
Operator—Location | | Property
Type | | | Beds | | | Opening
Date | | | Acquisition
Costs | | | Spend Through
12/31/2013 | | | Remaining
Costs to
be Spent | | | Total
Expected
Cost | | | Expected
Yield | |
Daybreak—Eagle Lake, TX | | | SNF | | | | 80 | | | | Q1 2014 | | | $ | 101 | | | $ | 4,223 | | | $ | 1,476 | | | $ | 5,800 | | | | 11.0 | % |
Saber—Chatham, PA | | | SNF | | | | 120 | | | | Q2 2014 | | | | 2,200 | | | | 9,666 | | | | 334 | | | | 12,200 | | | | 11.0 | % |
Maplewood—Bethel, CT | | | ALF | | | | 80 | | | | Q1 2015 | | | | 2,400 | | | | 5,264 | | | | 11,236 | | | | 18,900 | | | | 9.5 | % |
| | | | | | | | | | | | | | | | | | | | | | | | | | | | | | | | |
Total | | | | | | | | | | | | | | $ | 4,701 | | | $ | 19,153 | | | $ | 13,046 | | | $ | 36,900 | | | | | |
| | | | | | | | | | | | | | | | | | | | | | | | | | | | | | | | |
2013 Acquisitions
| | | | | | | | | | | | | | | | |
Period | | Property Type | | Location | | Beds | | | Amount | | | Initial
Cash Yield | |
Fourth quarter | | SNF, ALF, LTAC, Hospital | | 8 states | | | 2,646 | | | $ | 159,312 | | | | 9.8 | % |
Third quarter | | SNF | | 2 states | | | 203 | | | | 12,450 | | | | 10.7 | % |
Second quarter | | SNF, MOB, TBI | | 6 states | | | 437 | | | | 25,626 | | | | 10.4 | % |
First quarter | | N/A | | N/A | | | 0 | | | | 0 | | | | 0.0 | % |
| | | | | | | | | | | | | | | | |
Total | | | | | | | 3,286 | | | $ | 197,388 | | | | 10.0 | % |
| | | | | | | | | | | | | | | | |
11
Aviv REIT, Inc.
Debt Summary and Capitalization as of December 31, 2013
Debt Maturities
| | | | | | | | | | | | | | | | |
Year | | Senior Unsecured
Notes | | | Revolving
Credit Facility | | | Mortgage
Debt | | | Total
Debt | |
2014 | | $ | — | | | $ | — | | | $ | 157 | | | $ | 157 | |
2015 | | | — | | | | — | | | | 165 | | | | 165 | |
2016 | | | — | | | | 20,000 | | | | 174 | | | | 20,174 | |
2017 | | | — | | | | — | | | | 183 | | | | 183 | |
2018 | | | — | | | | — | | | | 192 | | | | 192 | |
Thereafter | | | 650,000 | | | | — | | | | 10,367 | | | | 660,367 | |
| | | | | | | | | | | | | | | | |
Subtotal | | $ | 650,000 | | | $ | 20,000 | | | $ | 11,238 | | | $ | 681,238 | |
(Discounts) and premiums, net | | | 2,752 | | | | — | | | | 2,416 | | | | 5,168 | |
| | | | | | | | | | | | | | | | |
Total debt | | $ | 652,752 | | | $ | 20,000 | | | $ | 13,654 | | | $ | 686,406 | |
| | | | | | | | | | | | | | | | |
Weighted average interest rate | | | | | | | | | | | | | | | 6.9 | % |
| | | | | | | | | | | | | | | | |
Weighted average maturity in years | | | | | | | | | | | | | | | 6.5 | |
| | | | | | | | | | | | | | | | |
Fixed and Floating Rate Debt
| | | | | | | | |
| | | Amount | | | % of Total | |
Fixed rate debt | | | | | | | | |
Senior unsecured notes | | $ | 650,000 | | | | 95.4 | % |
Mortgage debt | | | 11,238 | | | | 1.6 | % |
| | | | | | | | |
Total fixed rate debt | | $ | 661,238 | | | | 97.1 | % |
Floating rate debt | | | | | | | | |
Revolver | | $ | 20,000 | | | | 2.9 | % |
| | | | | | | | |
Total debt | | $ | 681,238 | | | | 100.0 | % |
| | | | | | | | |
Covenants for Senior Unsecured Notes1
| | | | | | |
Covenant | | Requirement | | Q4 2013 | |
Total debt / total assets | | No greater than 60% | | | 46 | % |
Secured debt / total assets | | No greater than 40% | | | 2 | % |
Interest coverage | | No less than 2.00x | | | 3.16x | |
Unencumbered assets / unsecured debt | | No less than 150% | | | 185 | % |
Total Market Capitalization
| | | | | | | | | | | | |
| | | Shares/units
Outstanding | | | Price | | | Value | |
Common stock and OP units | | | 49,257 | | | $ | 23.70 | | | $ | 1,167,401 | |
Total debt | | | | | | | | | | | 686,406 | |
| | | | | | | | | | | | |
Total market capitalization | | | | | | | | | | $ | 1,853,807 | |
| | | | | | | | | | | | |
Dollars and shares/units in thousands
| (1) | Covenants are calculated in accordance with the indenture governing the senior unsecured notes. |
12
Aviv REIT, Inc.
Common Share and OP Unit
Weighted Average Amounts Outstanding
| | | | | | | | |
| | | Q4 2013 | | | 2013 | |
Weighted Average Amounts Outstanding for EPS Purposes: | | | | | | | | |
Common shares—basic | | | 37,534,676 | | | | 33,700,834 | |
Effect of dilutive securities: | | | | | | | | |
OP units | | | 11,675,517 | | | | 9,091,974 | |
Stock options | | | 1,696,755 | | | | 1,518,838 | |
Restricted stock units | | | 43,714 | | | | 12,568 | |
| | | | | | | | |
Total common shares—diluted | | | 50,950,662 | | | | 44,324,214 | |
| | | | | | | | |
| Weighted Average Amounts Outstanding for FFO, | | | | | | | | |
| Normalized FFO and AFFO Purposes: | | | | | | | | |
Common shares—basic | | | 37,534,676 | | | | 33,700,834 | |
OP units | | | 11,675,517 | | | | 11,872,154 | |
| | | | | | | | |
Total common shares and OP units | | | 49,210,193 | | | | 45,572,988 | |
Effect of dilutive securities: | | | | | | | | |
Stock options | | | 1,696,755 | | | | 1,518,838 | |
Restricted stock units | | | 43,714 | | | | 12,568 | |
| | | | | | | | |
Total common shares and units—diluted | | | 50,950,662 | | | | 47,104,394 | |
| | | | | | | | |
| Period Ending Amounts Outstanding: | | | | | | | | |
Common shares (includes restricted stock) | | | 37,641,160 | | | | | |
OP units | | | 11,616,283 | | | | | |
| | | | | | | | |
Total common shares and units | | | 49,257,443 | | | | | |
| | | | | | | | |
13
Aviv REIT, Inc.
2014 Guidance
The following table illustrates the Company’s AFFO per share guidance for the year ending December 31, 2014.
| | |
| | | Expected 2014
per share |
Per diluted common share: | | |
Net income | | $1.08 -$ 1.12 |
Depreciation and amortization | | 0.72 |
| | |
FFO | | $1.80 -$ 1.84 |
Transaction costs | | 0.02 |
| | |
Normalized FFO | | $1.82 -$ 1.86 |
Amortization of deferred financing costs | | 0.07 |
Non-cash stock-based compensation | | 0.10 |
Straight-line rental income, net | | (0.09) |
Rental income from intangible amortization, net | | (0.01) |
| | |
AFFO | | $1.89 -$ 1.93 |
| | |
Weighted average common shares and units - diluted | | 51.1 million |
The Company’s AFFO guidance for 2014 excludes any additional acquisitions, dispositions and capital transactions.
14
Aviv REIT, Inc.
Definitions and Footnotes for Pages 4, 8, 9, 10 and 14
EBITDARM Coverage: Represents EBITDARM, which the Company defines as earnings before interest, taxes, depreciation, amortization, rent expense and management fees allocated by the operator to one of its affiliates, of our operators for the applicable period, divided by the rent paid to the Company by its operators during each period.
EBITDAR Coverage: Represents EBITDAR, which the Company defines as earnings before interest, taxes, depreciation, amortization and rent expense, of its operators for the applicable period, divided by the rent paid to Aviv by its operators during such period. Assumes a management fee of 4%.
EBITDAR Margin: Represents the operator’s EBITDAR for the applicable period divided by the operator’s total revenue for the applicable period.
Enterprise Value: Represents equity market capitalization plus net debt. Equity market capitalization is calculated as the number of shares of common stock and units multiplied by the closing price of the Company’s common stock on the last day of the period presented. Net debt represents total debt less cash and cash equivalents.
Portfolio Occupancy:Represents the average daily number of beds at the Company’s properties that are occupied during the applicable period divided by the total number of beds at the Company’s properties that are available for use during the period.
Property Type: ALF = assisted living facility; LTACH = long-term acute care hospital; MOB = medical office building; TBI = traumatic brain injury facility; SNF = skilled nursing facility
State Average Occupancy: Represents the Nursing Facility State Occupancy Rate as reported by American Health Care Association (AHCA). AHCA occupancy data is calculated by dividing the sum of all facility patients in the state occupying certified beds by the sum of all the certified beds in the state reported at the time of the survey corresponding to the period presented. Aviv occupancy represents the state occupancy for the entire portfolio.
Yield: Represents annualized contractual or projected income to be received in cash divided by investment amount.
Portfolio metrics and other statistics are not derived from Aviv’s financial statements but are operating statistics that the Company derives from reports that it receives from its operators pursuant to Aviv’s triple-net leases. As a result, the Company’s portfolio metrics typically lag its own financial statements by approximately one quarter. In order to determine Aviv’s portfolio metrics for the period presented, the metrics are stated only with respect to properties owned by the Company and operated by the same operator for the portion of the period Aviv owned the properties and excludes assets held for sale, closed properties, properties under construction and, with certain exceptions for shorter periods, properties within 24 months of completion of construction. Accordingly, EBITDARM coverage, EBITDAR coverage, EBITDAR margin, portfolio occupancy and quality mix for the twelve months ended September 30, 2013 included 240 core properties of the 263 properties in the Company’s portfolio as of September 30, 2013.
When Aviv refers to the “total rent” of its portfolio, the Company is referring to the total monthly rent due under all of its triple-net leases as of the date specified, calculated based on the first full month following the specified date. Aviv calculates “annualized rent” for properties during a period by utilizing the amount of rent under contract as of the last day of the period and assume that amount of rent was received in respect of such property throughout the entire period.
Non-GAAP Financial Measures
We use financial measures in this release that are derived on the basis of methodologies other than in accordance with GAAP. We derive these measures as follows:
| | • | | The National Association of Real Estate Investment Trusts, or NAREIT, defines FFO as net income (computed in accordance with GAAP), excluding gains and losses from sales of property (net) and impairments of depreciated real estate, plus real estate depreciation and amortization (excluding amortization of deferred financing costs) and after adjustments for unconsolidated partnerships and joint ventures. Applying the NAREIT definition to our financial statements results in FFO representing net income before depreciation and amortization, impairment of assets, and gain (loss) on sale of assets. |
| | • | | Normalized FFO represents FFO before loss on extinguishment of debt, reserves for uncollectible loan receivables, transaction costs, severance costs and change in fair value of derivatives. |
| | • | | AFFO represents Normalized FFO before amortization of deferred financing costs, non-cash stock-based compensation, straight-line rental income (net) and rental income from intangible amortization (net). |
| | • | | EBITDA represents net income before interest expense (net), amortization of deferred financing costs and depreciation and amortization. |
| | • | | Adjusted EBITDA represents EBITDA before impairment of assets, gain (loss) on sale of assets, transaction costs, write-off of straight-line rents, non-cash stock-based compensation, loss on extinguishment of debt, reserves for uncollectible loan receivables and change in fair value of derivatives. |
15
Aviv REIT, Inc.
Definitions and Footnotes for Pages 4, 8, 9, 10 and 14
Our management uses FFO, Normalized FFO, AFFO, EBITDA and Adjusted EBITDA as important supplemental measures of our operating performance and liquidity. FFO is intended to exclude GAAP historical cost depreciation and amortization of real estate and related assets, which assumes that the value of real estate assets diminishes ratably over time. Historically, however, real estate values have risen or fallen with market conditions. The term FFO was designed by the real estate industry to address this issue and as an indicator of our ability to incur and service debt. Because FFO, Normalized FFO and AFFO exclude depreciation and amortization unique to real estate, impairment, gains and losses from property dispositions and extraordinary items and because EBITDA and Adjusted EBITDA exclude certain non-cash charges and adjustments and amounts spent on interest and taxes, they provide our management with performance measures that, when compared year over year or with other real estate investment trusts, or REITs, reflect the impact to operations from trends in occupancy rates, rental rates, operating costs, development activities and, with respect to FFO, Normalized FFO and AFFO, interest costs, in each case providing perspective not immediately apparent from net income. In addition, we believe that FFO, Normalized FFO, AFFO, EBITDA and Adjusted EBITDA are frequently used by securities analysts, investors and other interested parties in the evaluation of REITs.
We offer these measures to assist the users of our financial statements in assessing our financial performance and liquidity under GAAP, but these measures are non-GAAP measures and should not be considered measures of liquidity, alternatives to net income or indicators of any other performance measure determined in accordance with GAAP, nor are they indicative of funds available to fund our cash needs, including our ability to make payments on our indebtedness. In addition, our calculations of these measures are not necessarily comparable to similar measures as calculated by other companies that do not use the same definition or implementation guidelines or interpret the standards differently from us. Investors should not rely on these measures as a substitute for any GAAP measure, including net income, cash flows provided by operating activities or revenues.
16