UNITED STATES
SECURITIES AND EXCHANGE COMMISSION
FORM 10-K
(Mark One) |
| | |
| | x | ANNUAL REPORT PURSUANT TO SECTION 13 OR 15(d) OF THE SECURITIES EXCHANGE ACT OF 1934 |
For the fiscal year ended December 31, 2015
Or |
| | |
| | ¨ | TRANSITION REPORT PURSUANT TO SECTION 13 OR 15(d) OF THE SECURITIES EXCHANGE ACT OF 1934 |
For the Transition Period from ______ to _______.
Commission file number 001-36443
K2M GROUP HOLDINGS, INC.
(Exact name of Registrant as specified in its charter) |
| | |
| Delaware | | 27-2977810 |
(State or other jurisdiction of incorporation or organization) | | (I.R.S. Employer Identification No.) |
| 751 Miller Drive SE, Leesburg, Virginia | | 20175 |
| (Address of principal executive offices) | | (Zip Code) |
(703) 777-3155
Registrant’s telephone number, including area code:
Securities registered pursuant to Section 12(b) of the Act: |
| | |
| Title of each class | | Name of each exchange on which registered |
| Common Stock, $0.001 par value per share | | The NASDAQ Global Select Market |
Securities registered pursuant to Section 12(g) of the Act:
None
Indicate by check mark if the registrant is a well-known seasoned issuer, as defined in Rule 405 of the Securities Act of 1933, as amended. Yes o No ý
Indicate by check mark if the registrant is not required to file reports pursuant to Section 13 or Section 15(d) of the Act. Yes o No ý
Indicate by check mark whether the registrant (1) has filed all reports required to be filed by Section 13 or 15(d) of the Securities Exchange Act during the preceding 12 months (or for such shorter period that the registrant was required to file such reports), and (2) has been subject to such filing requirements for the past 90 days. Yes ý No o
Indicate by check mark whether the registrant has submitted electronically and posted on its corporate Web site, if any, every Interactive Data File required to be submitted and posted pursuant to Rule 405 of Regulation S-T during the preceding 12 months (or for such shorter period that the registrant was required to submit and post such files). Yes ý No o
Indicate by check mark if disclosure of delinquent filers pursuant to Item 405 of Regulation S-K is not contained herein, and will not be contained, to the best of registrant’s knowledge, in definitive proxy or information statements incorporated by reference in Part III of this Form 10-K or any amendment to this Form 10-K. ý
Indicate by check mark whether the registrant is a large accelerated filer, an accelerated filer, a non-accelerated filer, or a smaller reporting company. See the definitions of “large accelerated filer,” “accelerated filer” and “smaller reporting company” in Rule 12b-2 of the Exchange Act. (Check one):
|
| | | | | | | | | | | |
| Large accelerated filer | ¨ | | | Accelerated filer | x | | Non-accelerated filer | o | | Smaller reporting company | o |
| | | | | | (Do not check if a smaller reporting company) | |
Indicate by check mark whether the registrant is a shell company (as defined in Rule 12b-2 of the Exchange Act). Yes o No ý
The aggregate market value of the voting and non-voting common equity held by non-affiliates on June 30, 2015, the last business day of the Registrant’s most recently completed second fiscal quarter (based on the closing sale price of $24.02 of the Registrant’s common stock, as reported by the NASDAQ Stock Exchange on such date) was approximately $468 million.
The number of shares the Registrant's common stock outstanding on February 26, 2016 was 41,337,692.
DOCUMENTS INCORPORATED BY REFERENCE
Information included in our definitive proxy statement for our 2016 annual meeting of stockholders scheduled to be held on June 14, 2016 is incorporated by reference in Items 10, 11, 12, 13 and 14 of Part III of this report.
K2M GROUP HOLDINGS, INC.
FORM 10-K
FOR THE PERIOD ENDED DECEMBER 31, 2015
TABLE OF CONTENTS
|
| | | |
| PART I | |
| ITEM 1. | | | |
| ITEM 1A. | | | |
| ITEM 1B. | | | |
| ITEM 2. | | | |
| ITEM 3. | | | |
| ITEM 4. | | | |
| | | | |
| PART II | |
| ITEM 5. | | | |
| ITEM 6. | | | |
| ITEM 7. | | | |
| | | | |
| | | | |
| | | | |
| | | | |
| | | | |
| ITEM 7A. | | | |
| ITEM 8. | | | |
| ITEM 9. | | | |
| ITEM 9A. | | | |
| ITEM 9B. | | | |
| | | | |
| PART III |
| ITEM 10. | | | |
| ITEM 11. | | | |
| ITEM 12. | | | |
| ITEM 13. | | | |
| ITEM 14. | | | |
| | |
| PART IV |
| ITEM 15. | | | |
| | | |
| |
| | |
PART 1
In this Annual Report on Form 10-K, unless the context otherwise requires, references to “K2M Group Holdings, Inc.” “KTWO,” “we,” “our,” “us” and the “Company” refer to K2M Group Holdings, Inc. together with its subsidiaries.
FORWARD-LOOKING STATEMENTS
This filing contains “forward-looking statements” within the meaning of Section 27A of the Securities Act and Section 21E of the Securities Exchange Act of 1934, as amended, or the Exchange Act, that reflect our current views with respect to, among other things, our operations and financial performance. Forward-looking statements include all statements that are not historical facts. In some cases, you can identify these forward-looking statements by the use of words such as “outlook,” “believes,” “expects,” “potential,” “continues,” “may,” “will,” “should,” “could,” “seeks,” “predicts,” “intends,” “plans,” “estimates,” “anticipates” or the negative version of these words or other comparable words. Such forward-looking statements are subject to various risks and uncertainties. Accordingly, there are or will be important factors that could cause actual outcomes or results to differ materially from those indicated in these statements. We believe these factors include but are not limited to those described under Item 1A - Risk Factors and the following risks, uncertainties and factors:
| |
| • | our inability to achieve or sustain profitability in the future |
• our inability to demonstrate to spine surgeons the merits of our products;
| |
| • | our inability to compete effectively; |
| |
| • | collaboration and consolidation in hospital purchasing; |
| |
| • | inadequate coverage and reimbursement for our products from third-party payors; |
| |
| • | lack of long-term clinical data supporting safety and efficacy of our products; |
| |
| • | dependence on a limited number of third-party suppliers; |
| |
| • | our inability to maintain and expand our sales organization; |
| |
| • | proliferation of physician-owned distributorships (“PODs”) in the industry; |
| |
| • | decline in the sale of certain key products; |
| |
| • | our inability to enhance new product offerings through research and development; |
| |
| • | our inability to manage expected growth; |
| |
| • | costs associated with high levels of inventory; |
| |
| • | impairment of our goodwill and intangible assets; |
| |
| • | disruptions in our main facility or information technology systems; |
| |
| • | inability to strengthen our brand; |
| |
| • | fluctuations in insurance cost and availability; |
| |
| • | our inability to prepare, transition to and occupy our new corporate headquarters and operations facilities; |
| |
| • | our inability to comply with extensive governmental regulation; |
| |
| • | our inability to maintain or obtain regulatory approvals and clearances; |
| |
| • | recalls or serious safety issues with our products; |
| |
| • | enforcement actions by regulatory agencies for improper marketing or promotion; |
| |
| • | misuse or off-label use of our products; |
| |
| • | delays or failures in clinical trials and results of clinical trials; |
| |
| • | legal restrictions on our procurement, use, processing, manufacturing or distribution of allograft bone tissue; |
| |
| • | negative publicity concerning methods of tissue recovery and screening of donor tissue; |
| |
| • | costs and liabilities relating to environmental laws and regulations; |
| |
| • | our failure or the failure of our agents to comply with fraud and abuse laws; |
| |
| • | U.S. legislative or Food and Drug Administration (“FDA”) regulatory reforms; |
| |
| • | adverse effects of medical device tax provisions; |
| |
| • | our inability to generate significant sales; |
| |
| • | uncertainty in future capital needs; |
| |
| • | availability of borrowings under our credit facility; |
| |
| • | inability to protect our intellectual property rights; |
| |
| • | patent litigation and product liability lawsuits; |
| |
| • | damages relating to trade secrets or non-competition or non-solicitation agreements; |
| |
| • | risks associated with operating internationally; |
| |
| • | fluctuations in foreign currency exchange rates; and |
| |
| • | inability to comply with the Federal Corrupt Practices Act (“FCPA”) and similar laws. |
These factors should not be construed as exhaustive and should be read in conjunction with the other cautionary statements that are included in this filing.
We operate in a very competitive and challenging environment. New risks and uncertainties emerge from time to time, and it is not possible for us to predict all risks and uncertainties that could have an impact on the forward-looking statements contained in this Form 10-K. We cannot assure you that the results, events and circumstances reflected in the forward-looking statements will be achieved or occur, and actual results, events or circumstances could differ materially from those described in the forward-looking statements.
The forward-looking statements made in this Annual Report on Form 10-K relate only to events as of the date on which the statements are made. We undertake no obligation to publicly update or review any forward-looking statement, whether as a result of new information, future developments or otherwise, except as required by law. We may not actually achieve the plans, intentions or expectations disclosed in our forward-looking statements and you should not place undue reliance on our forward-looking statements. Our forward-looking statements do not reflect the potential impact of any future acquisitions, mergers, dispositions, joint ventures, investments or other strategic transactions we may make.
The Company makes available free of charge on its website or provides a link on its website to the Company's Annual Report on Form 10-K, Quarterly Reports on Form 10-Q and Current Reports on Form 8-K, and any amendments to those reports filed or furnished pursuant to Section 13(a) or 15(d) of the Securities Exchange Act of 1934, as soon as reasonably practicable after
those reports are electronically filed with, or furnished to, the SEC. To access these filings, go to the Company’s website, then click on “Financials and Filings-SEC Filings” under the “Investor Relations” heading.
We use our website (www.k2m.com), our corporate Facebook page (www.facebook.com/K2MInc) and our corporate Twitter account (@K2MInc) as channels of distribution of company information. The information we post through these channels may be deemed material. Accordingly, investors should monitor these channels, in addition to following our press releases, SEC filings and public conference calls and webcasts. In addition, you may automatically receive e-mail alerts and other information about K2M when you enroll your e-mail address by visiting the “Email Alerts” section of our website at http://investors.k2m.com/alerts.cfm. The contents of our website and social media channels are not, however, a part of this report.
TRADEMARKS AND SERVICE MARKS
ALEUTIAN, Basecamp, BLUE RIDGE, CAPRI, CASCADIA, CASPIAN, CAYMAN, CHESAPEAKE, Deformity Cricket, DENALI, EVEREST, Lamellar Titanium Technology, MESA, NILE, PYRENEES, Quicket, Rail 4D Technology, RAVINE, RHINE, SANTORINI, SERENGETI, TERRA NOVA, and tifix (licensed by D. Wolter) and other trademarks, trade names and service marks of K2M appearing in this Annual Report on Form 10-K are the property of K2M and our affiliates.
Solely for convenience, the trademarks, service marks and trade names may be referred to in this filing without the ® and TM symbols, but such references are not intended to indicate, in any way, that we will not assert, to the fullest extent under applicable law, our rights to these trademarks, service marks and trade names. All other trademarks, service marks and trade names appearing in this filing are the property of their respective owners.
ITEM 1. BUSINESS
Overview
We are a global medical device company focused on designing, developing and commercializing innovative and proprietary complex spine and minimally invasive spine technologies and techniques. Our complex spine products are used by spine surgeons to treat some of the most difficult and challenging spinal pathologies, such as deformity (primarily scoliosis), trauma and tumor. We believe these procedures typically receive a higher rate of positive insurance coverage and often generate more revenue per procedure as compared to traditional degenerative spine surgery procedures. We have applied our product development expertise in innovating complex spine technologies and techniques to the design, development and commercialization of an expanding number of proprietary minimally invasive surgery (MIS) products. These proprietary MIS products are designed to allow for less invasive access to the spine and faster patient recovery times as compared to traditional open access surgical approaches. We have also leveraged these core competencies in the design, development and commercialization of an increasing number of products for patients suffering from degenerative spinal conditions.
Our products consist of implants, disposables and instruments which are marketed and sold primarily to hospitals for use by spine surgeons. As of December 31, 2015, our product portfolio contains 71 product lines that are used in complex spine surgeries, MIS and degenerative surgeries, enabling us to favorably compete in the $10.5 billion global spinal surgery market. We believe many of our products offer simplified surgical techniques and promote improved clinical outcomes for patients, although their quality, safety and efficacy are not yet supported by long-term clinical data.
Our focus on our core competences of complex spine and MIS is highlighted by the fact that, for the year ended December 31, 2015, 56.0% of our revenue in the United States was derived from the use of our products in complex spine and MIS surgeries. We believe this represents a greater proportion of total revenue devoted to these markets as compared to our competitors. We further believe the proportion of our international revenue derived from complex spine and MIS is even higher than in the United States.
Some of our key proprietary technologies include the following:
| |
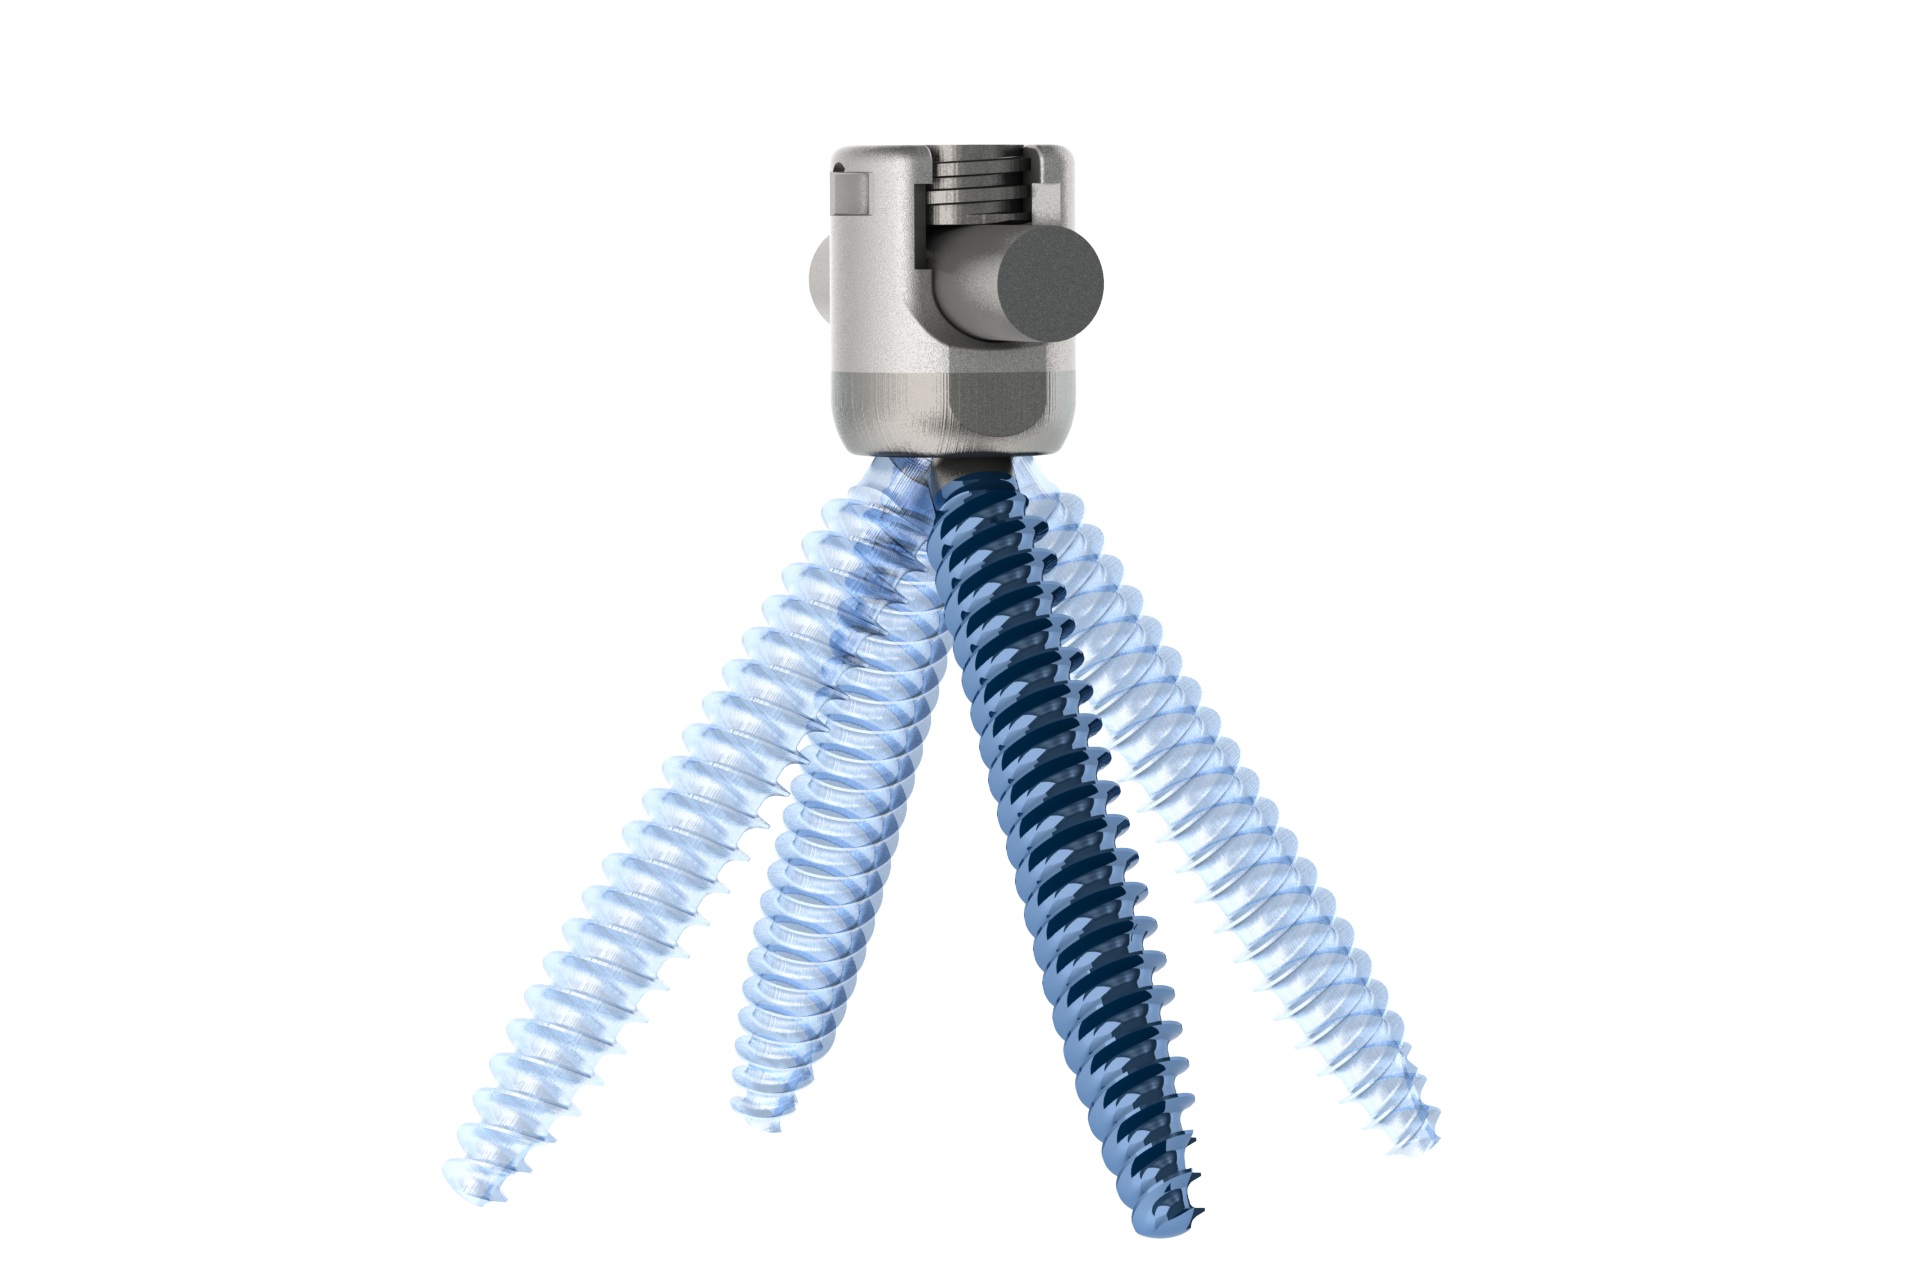
| • | MESA: a low-profile spinal screw technology, which accounted for approximately 29%, 31% and 35% of our revenue for the years ended December 31, 2015, 2014 and 2013, respectively, and is used primarily during deformity correction, featuring our proprietary locking mechanism that eliminates the need for a secondary locking feature and reduces rotational force on the spine during implantation, which has been used to treat more than 45,000 patients; |
| |
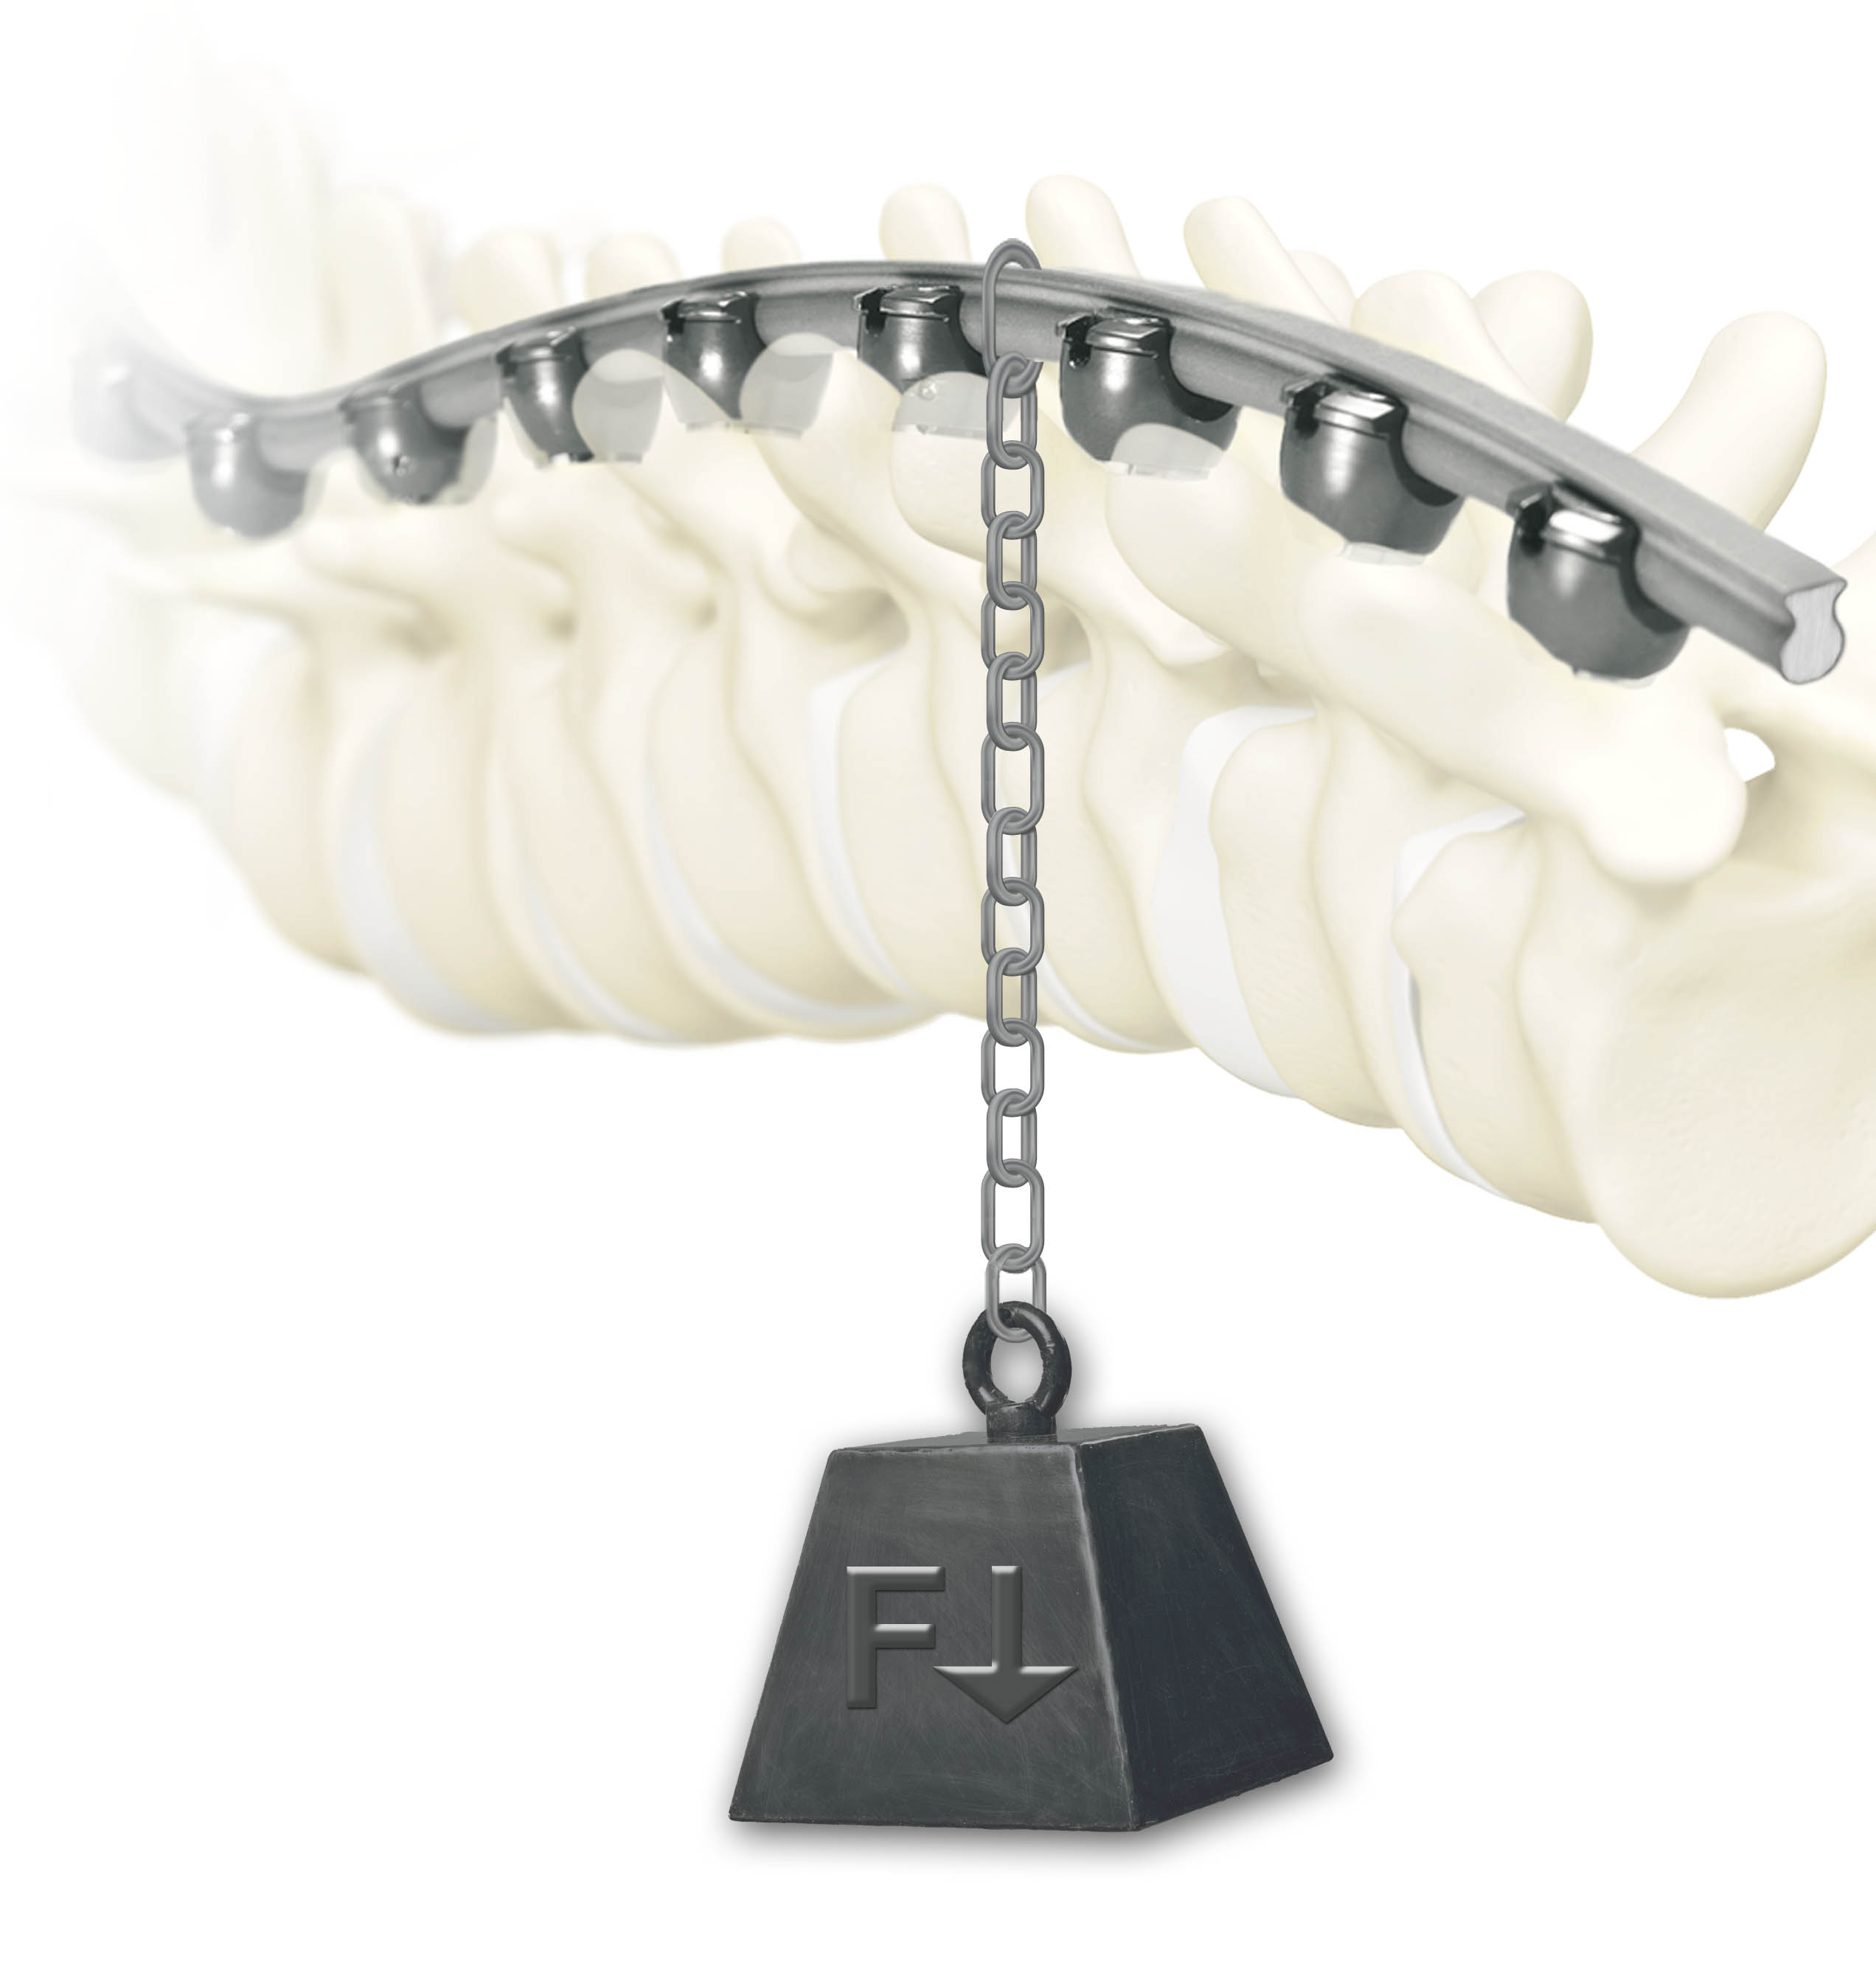
| • | Rail 4D: an innovative “beam-like” implant, used with our proprietary MESA spinal screws, that aids in the restoration of spinal balance or sagittal alignment while providing enhanced rigidity and significantly greater strength as compared to existing titanium and cobalt chrome rod offerings; |
| |
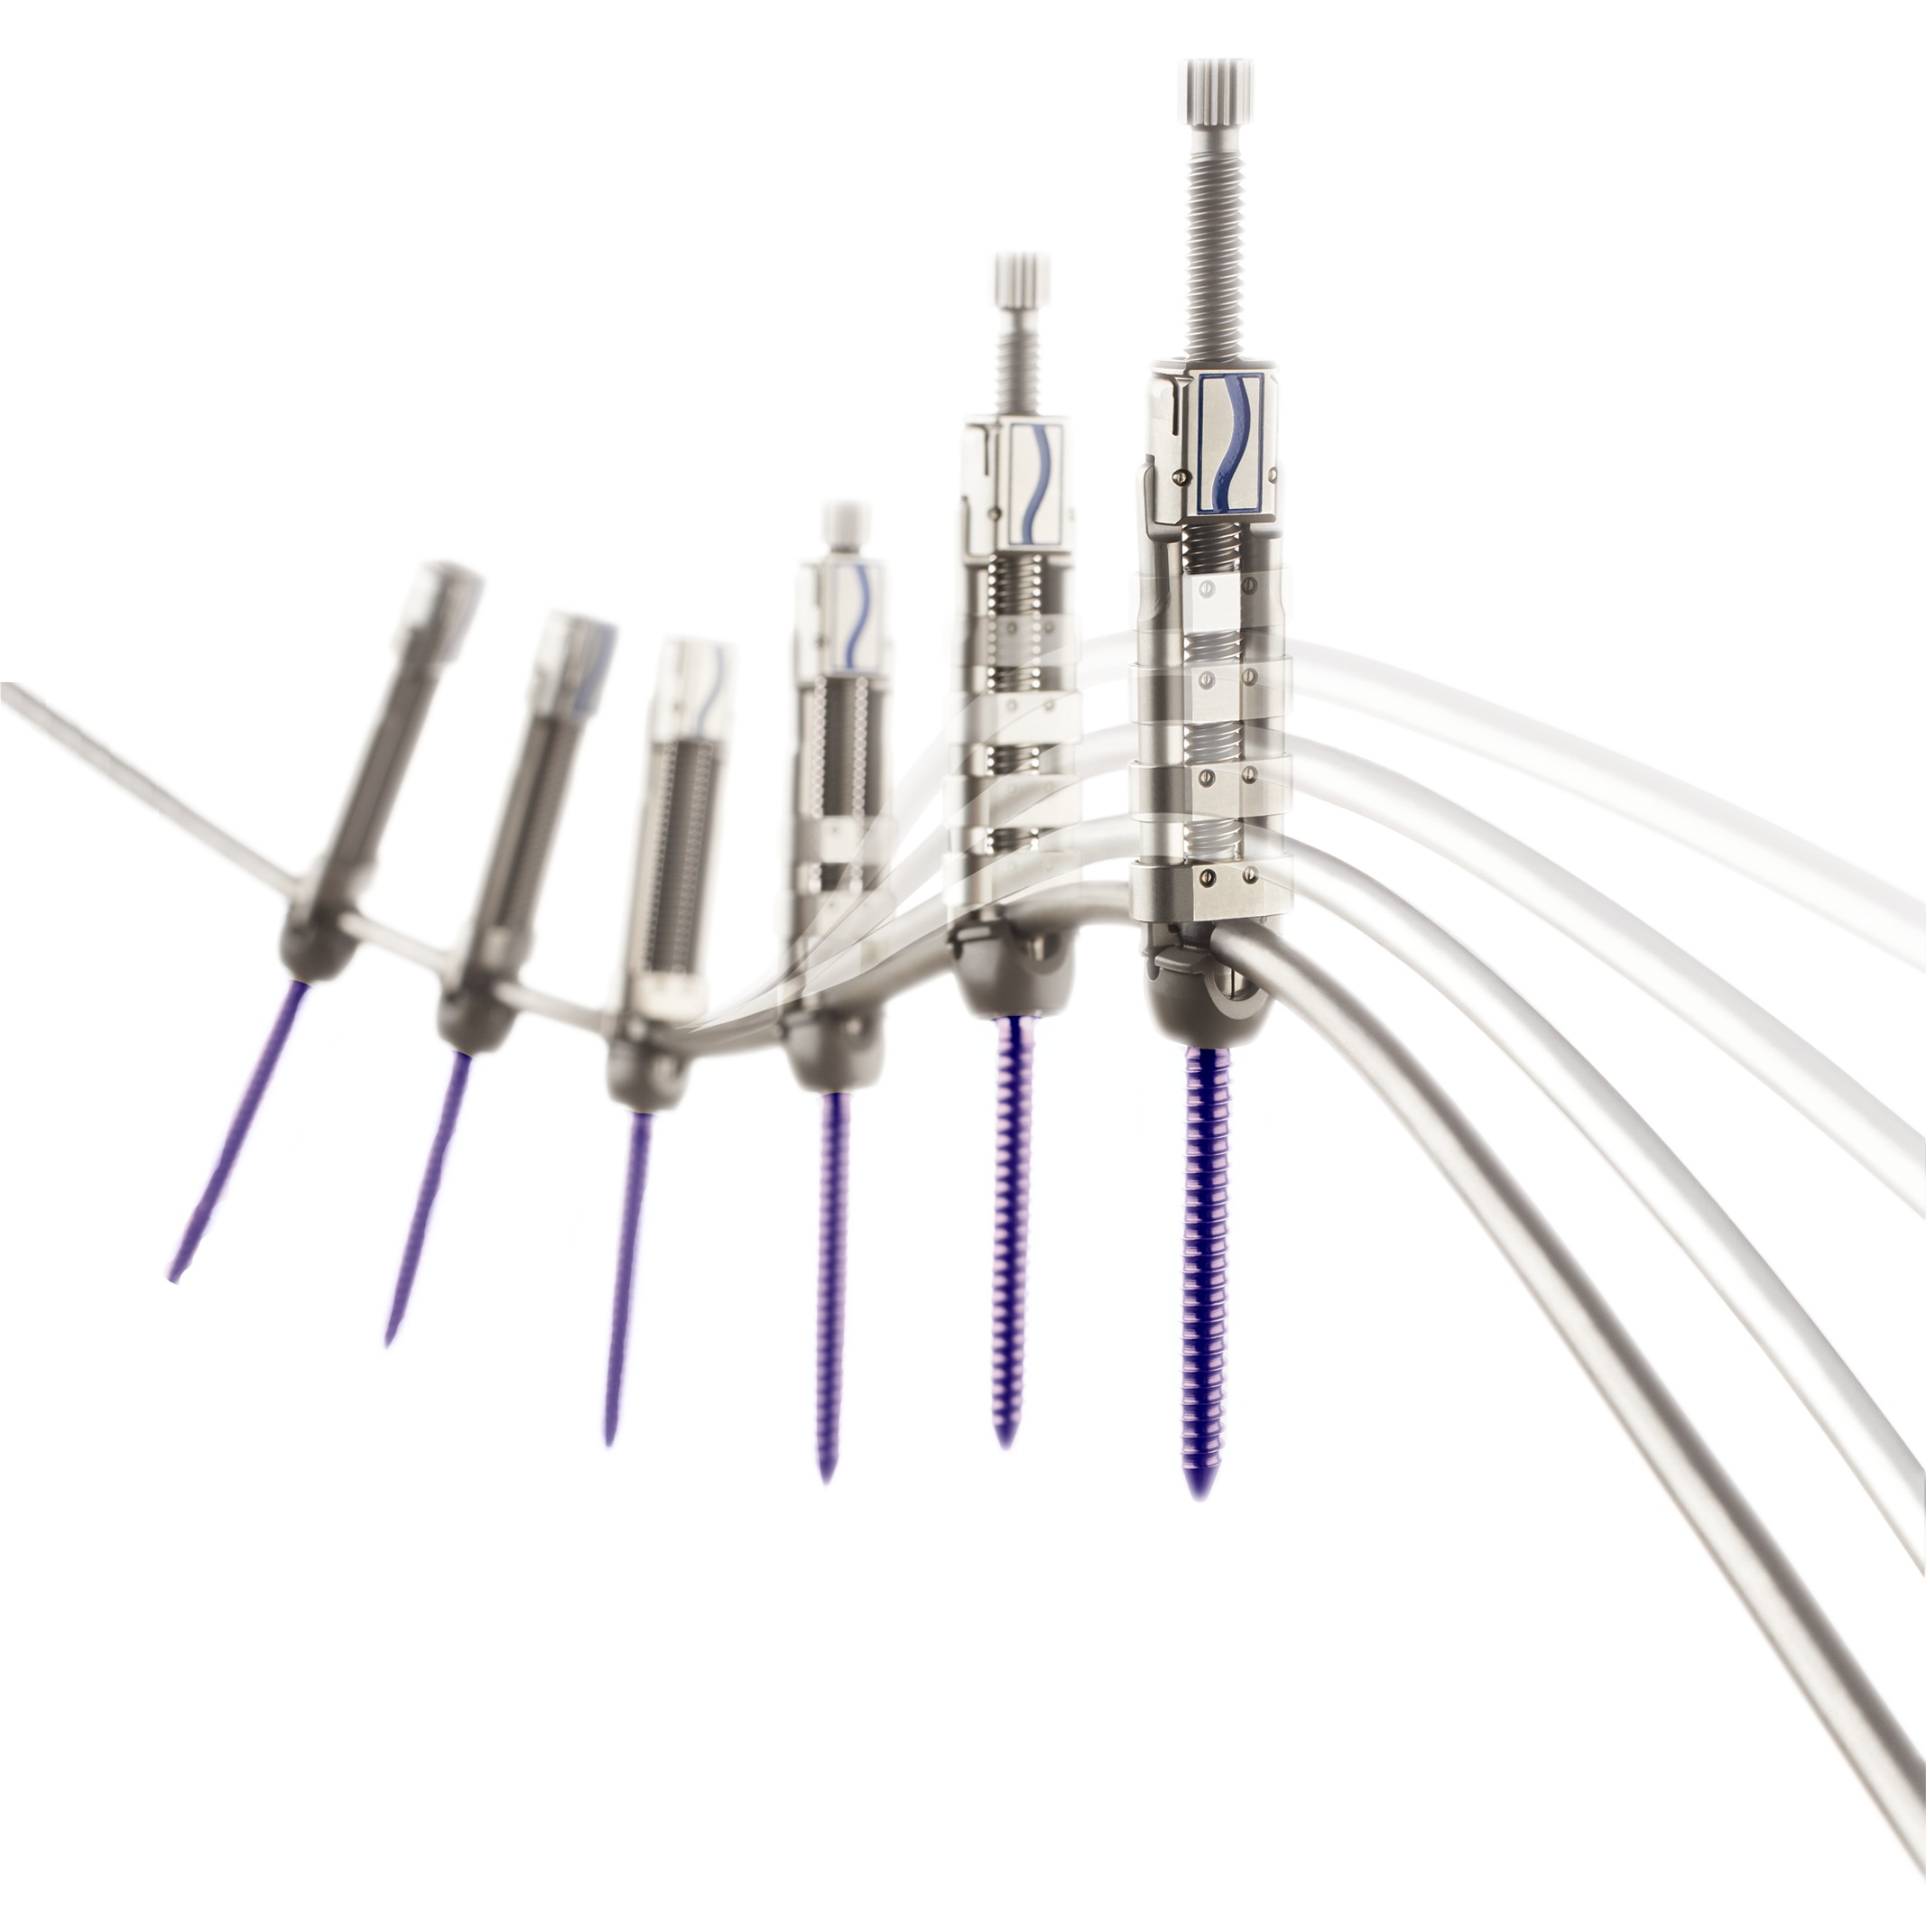
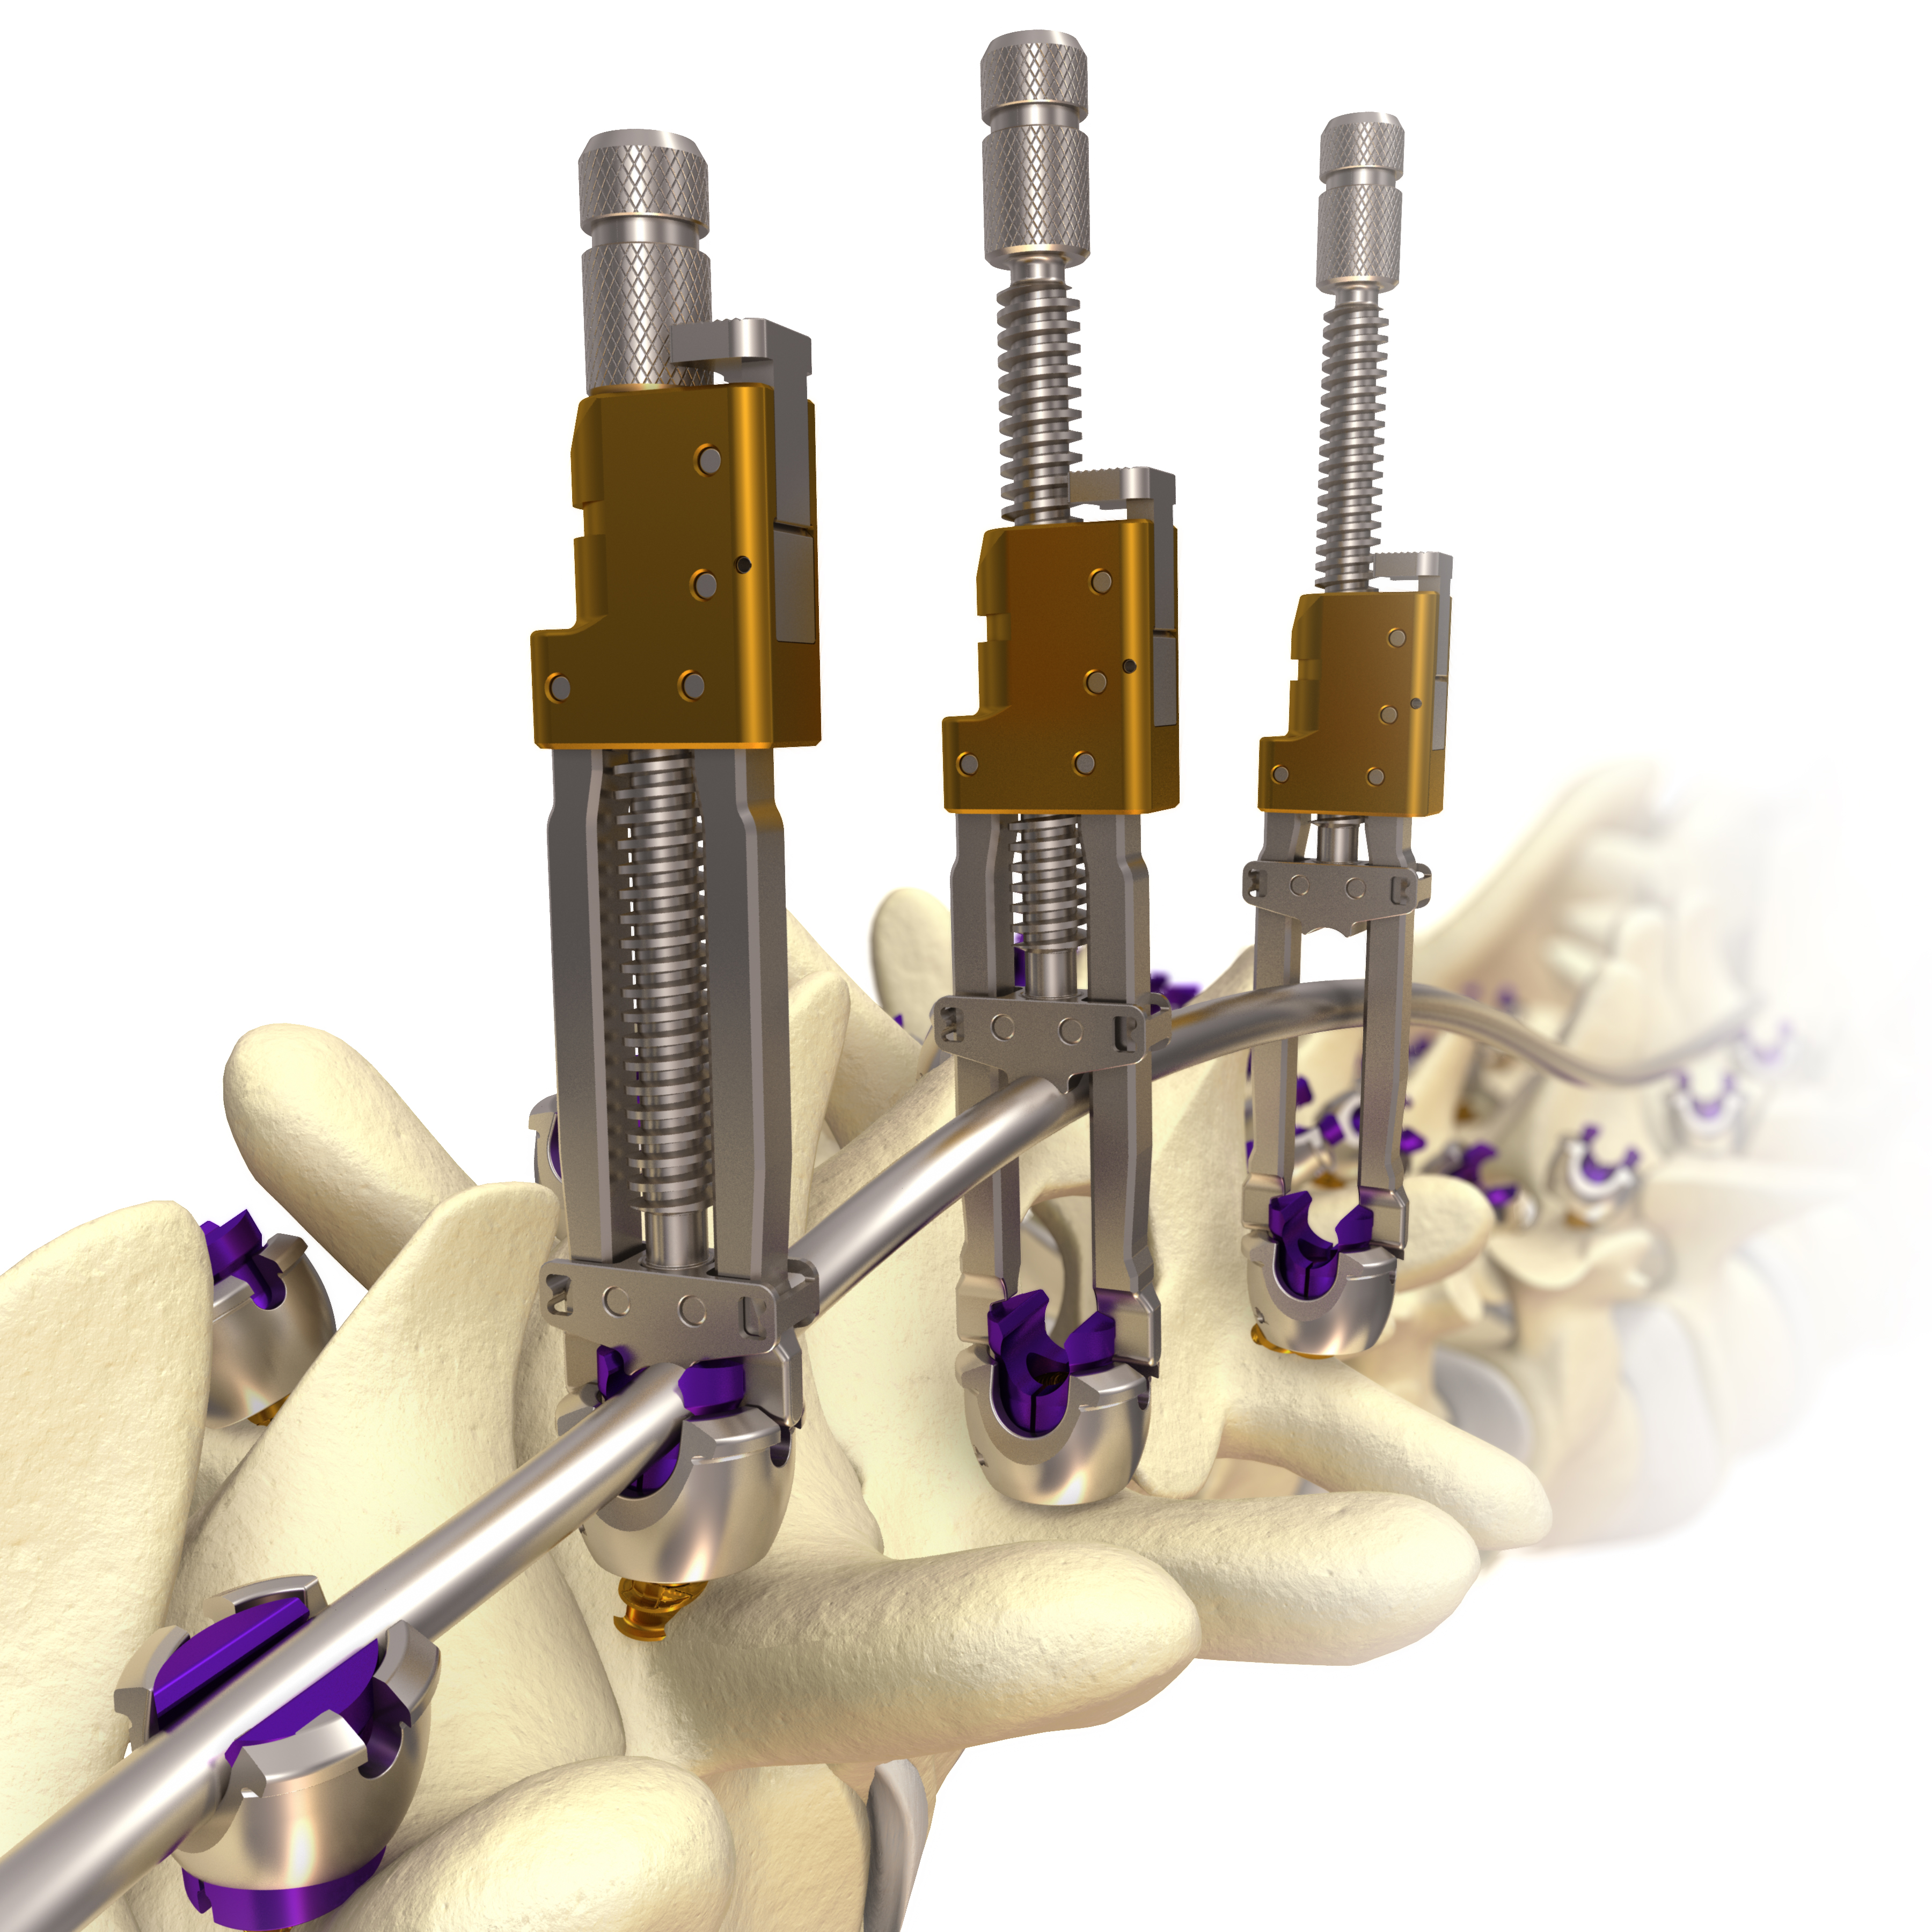
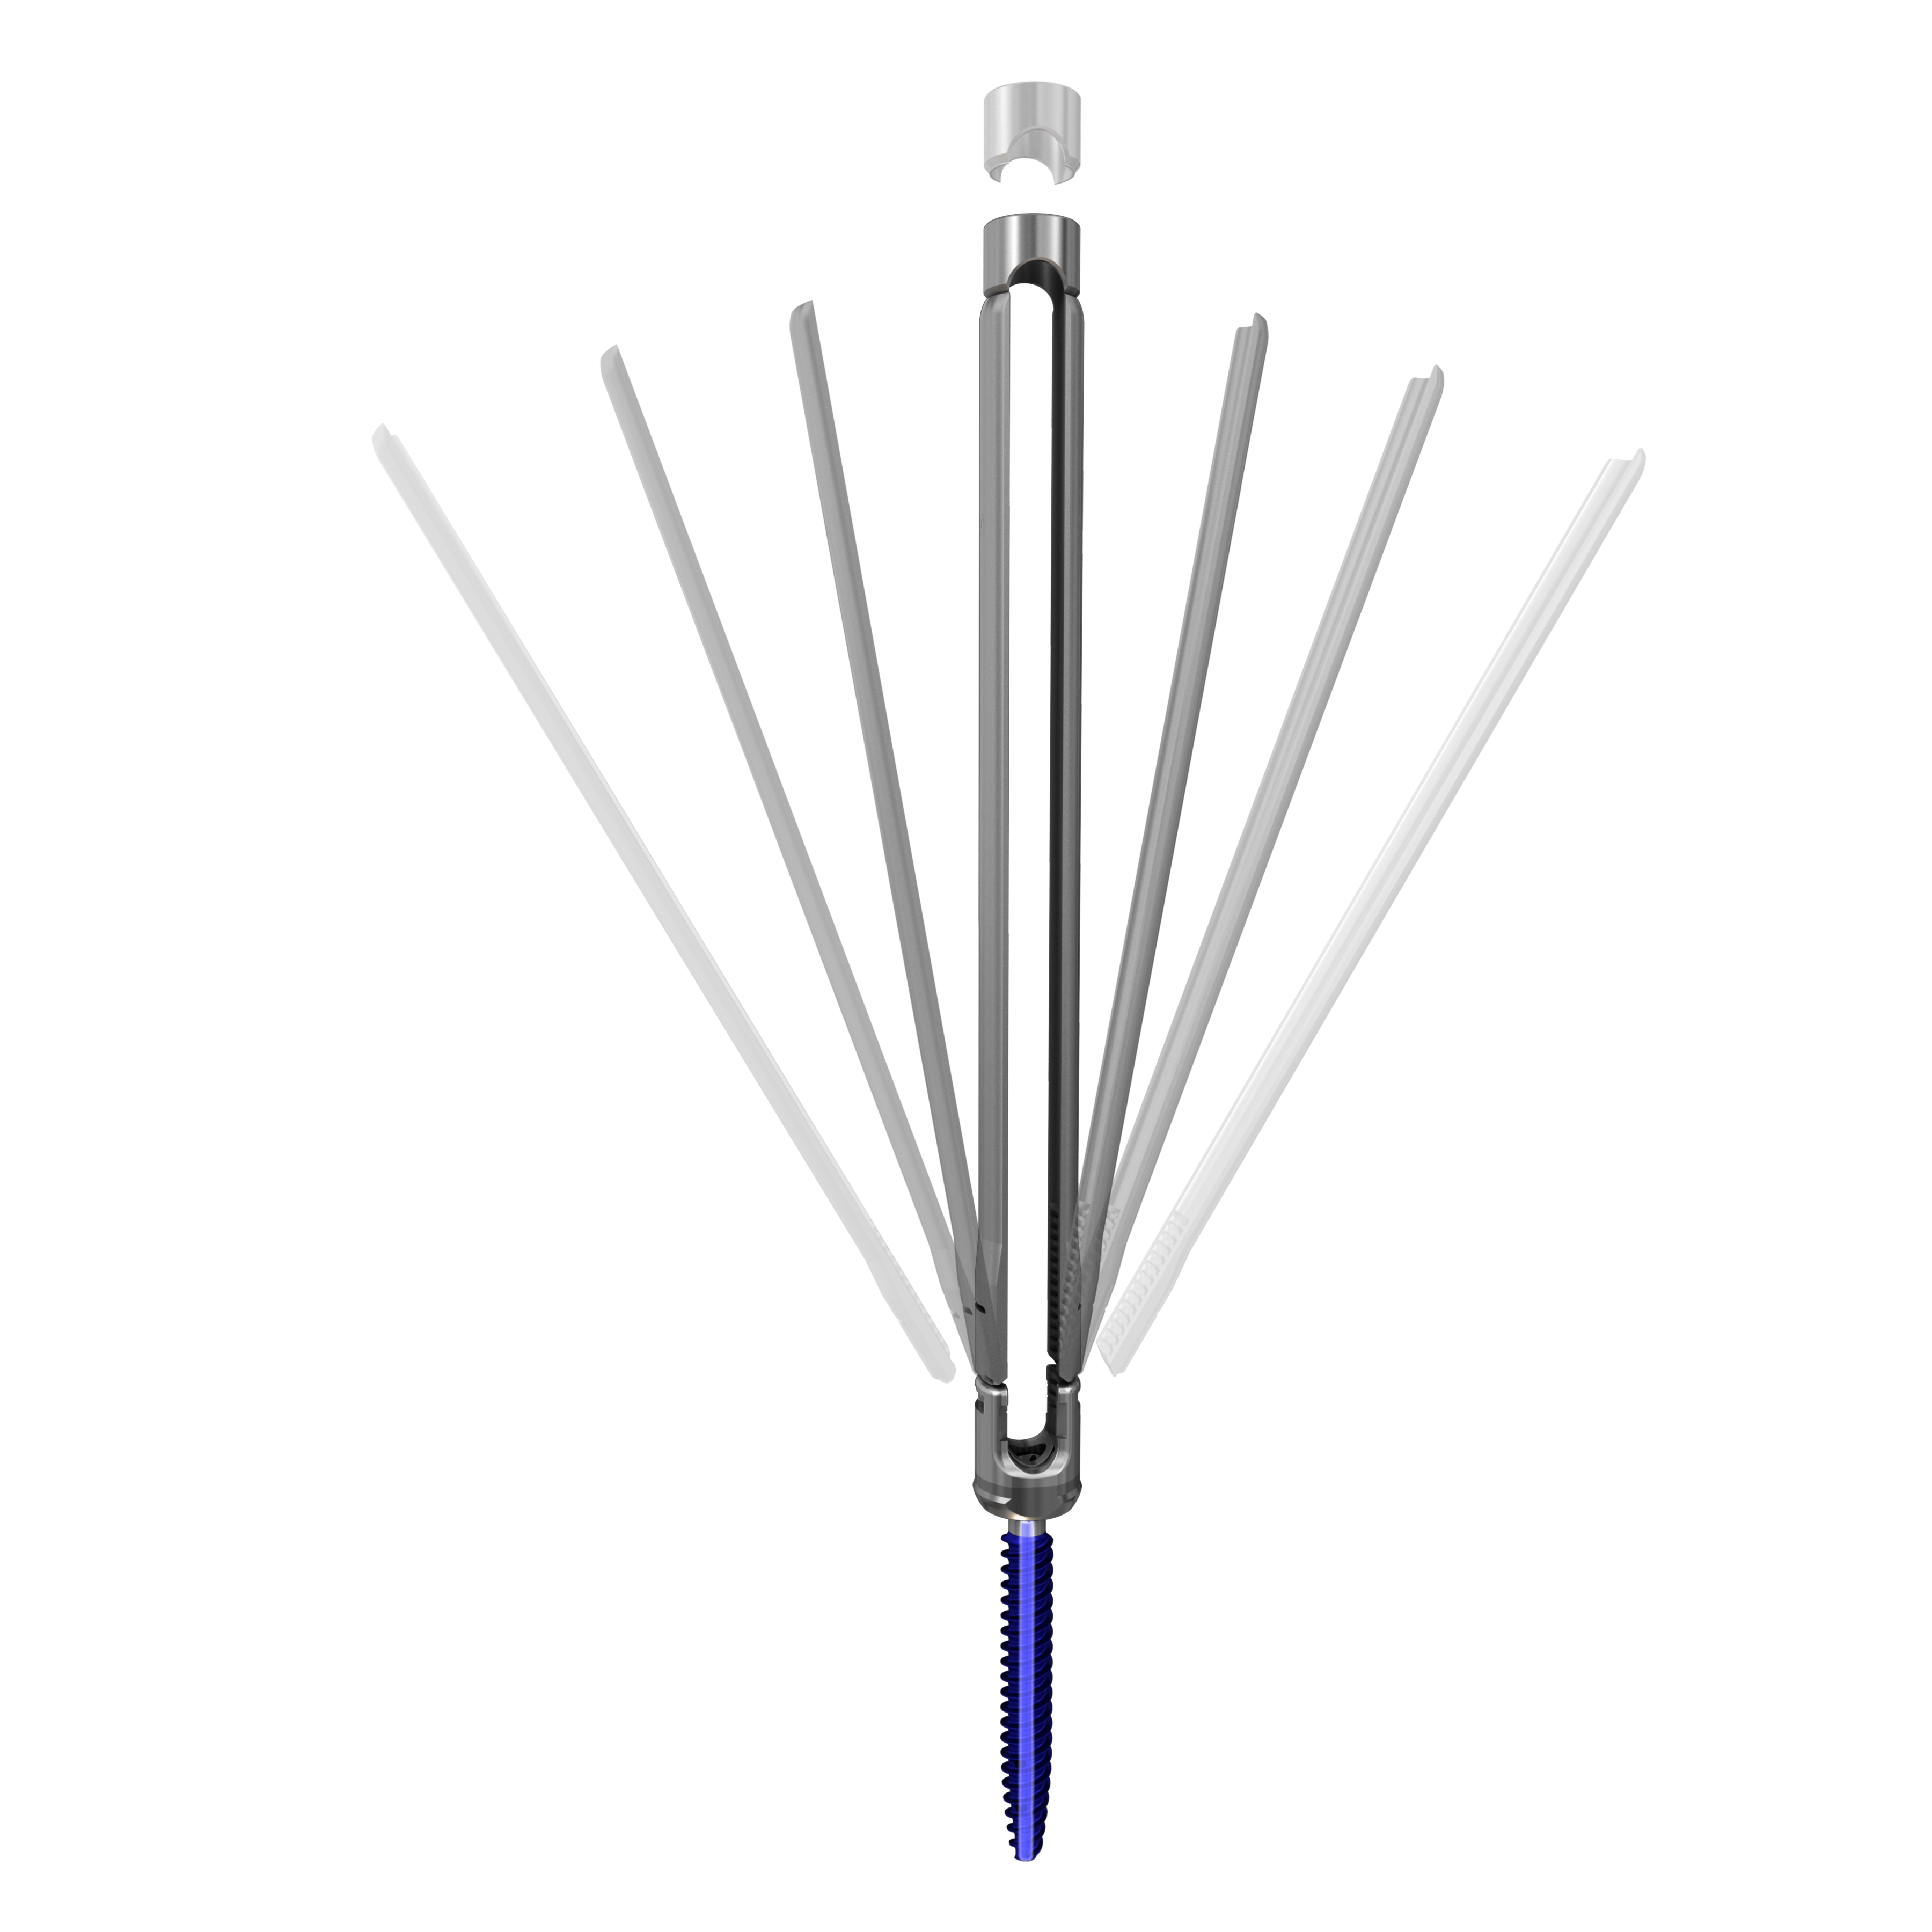
| • | Quicket Deformity: Next generation spinal correction rod reduction instrumentation, used with our proprietary MESA spinal screws, that provides surgeons with an innovative approach to more easily capture, manipulate and align a deformed spine as compared to traditional deformity correction instrumentation; |
| |
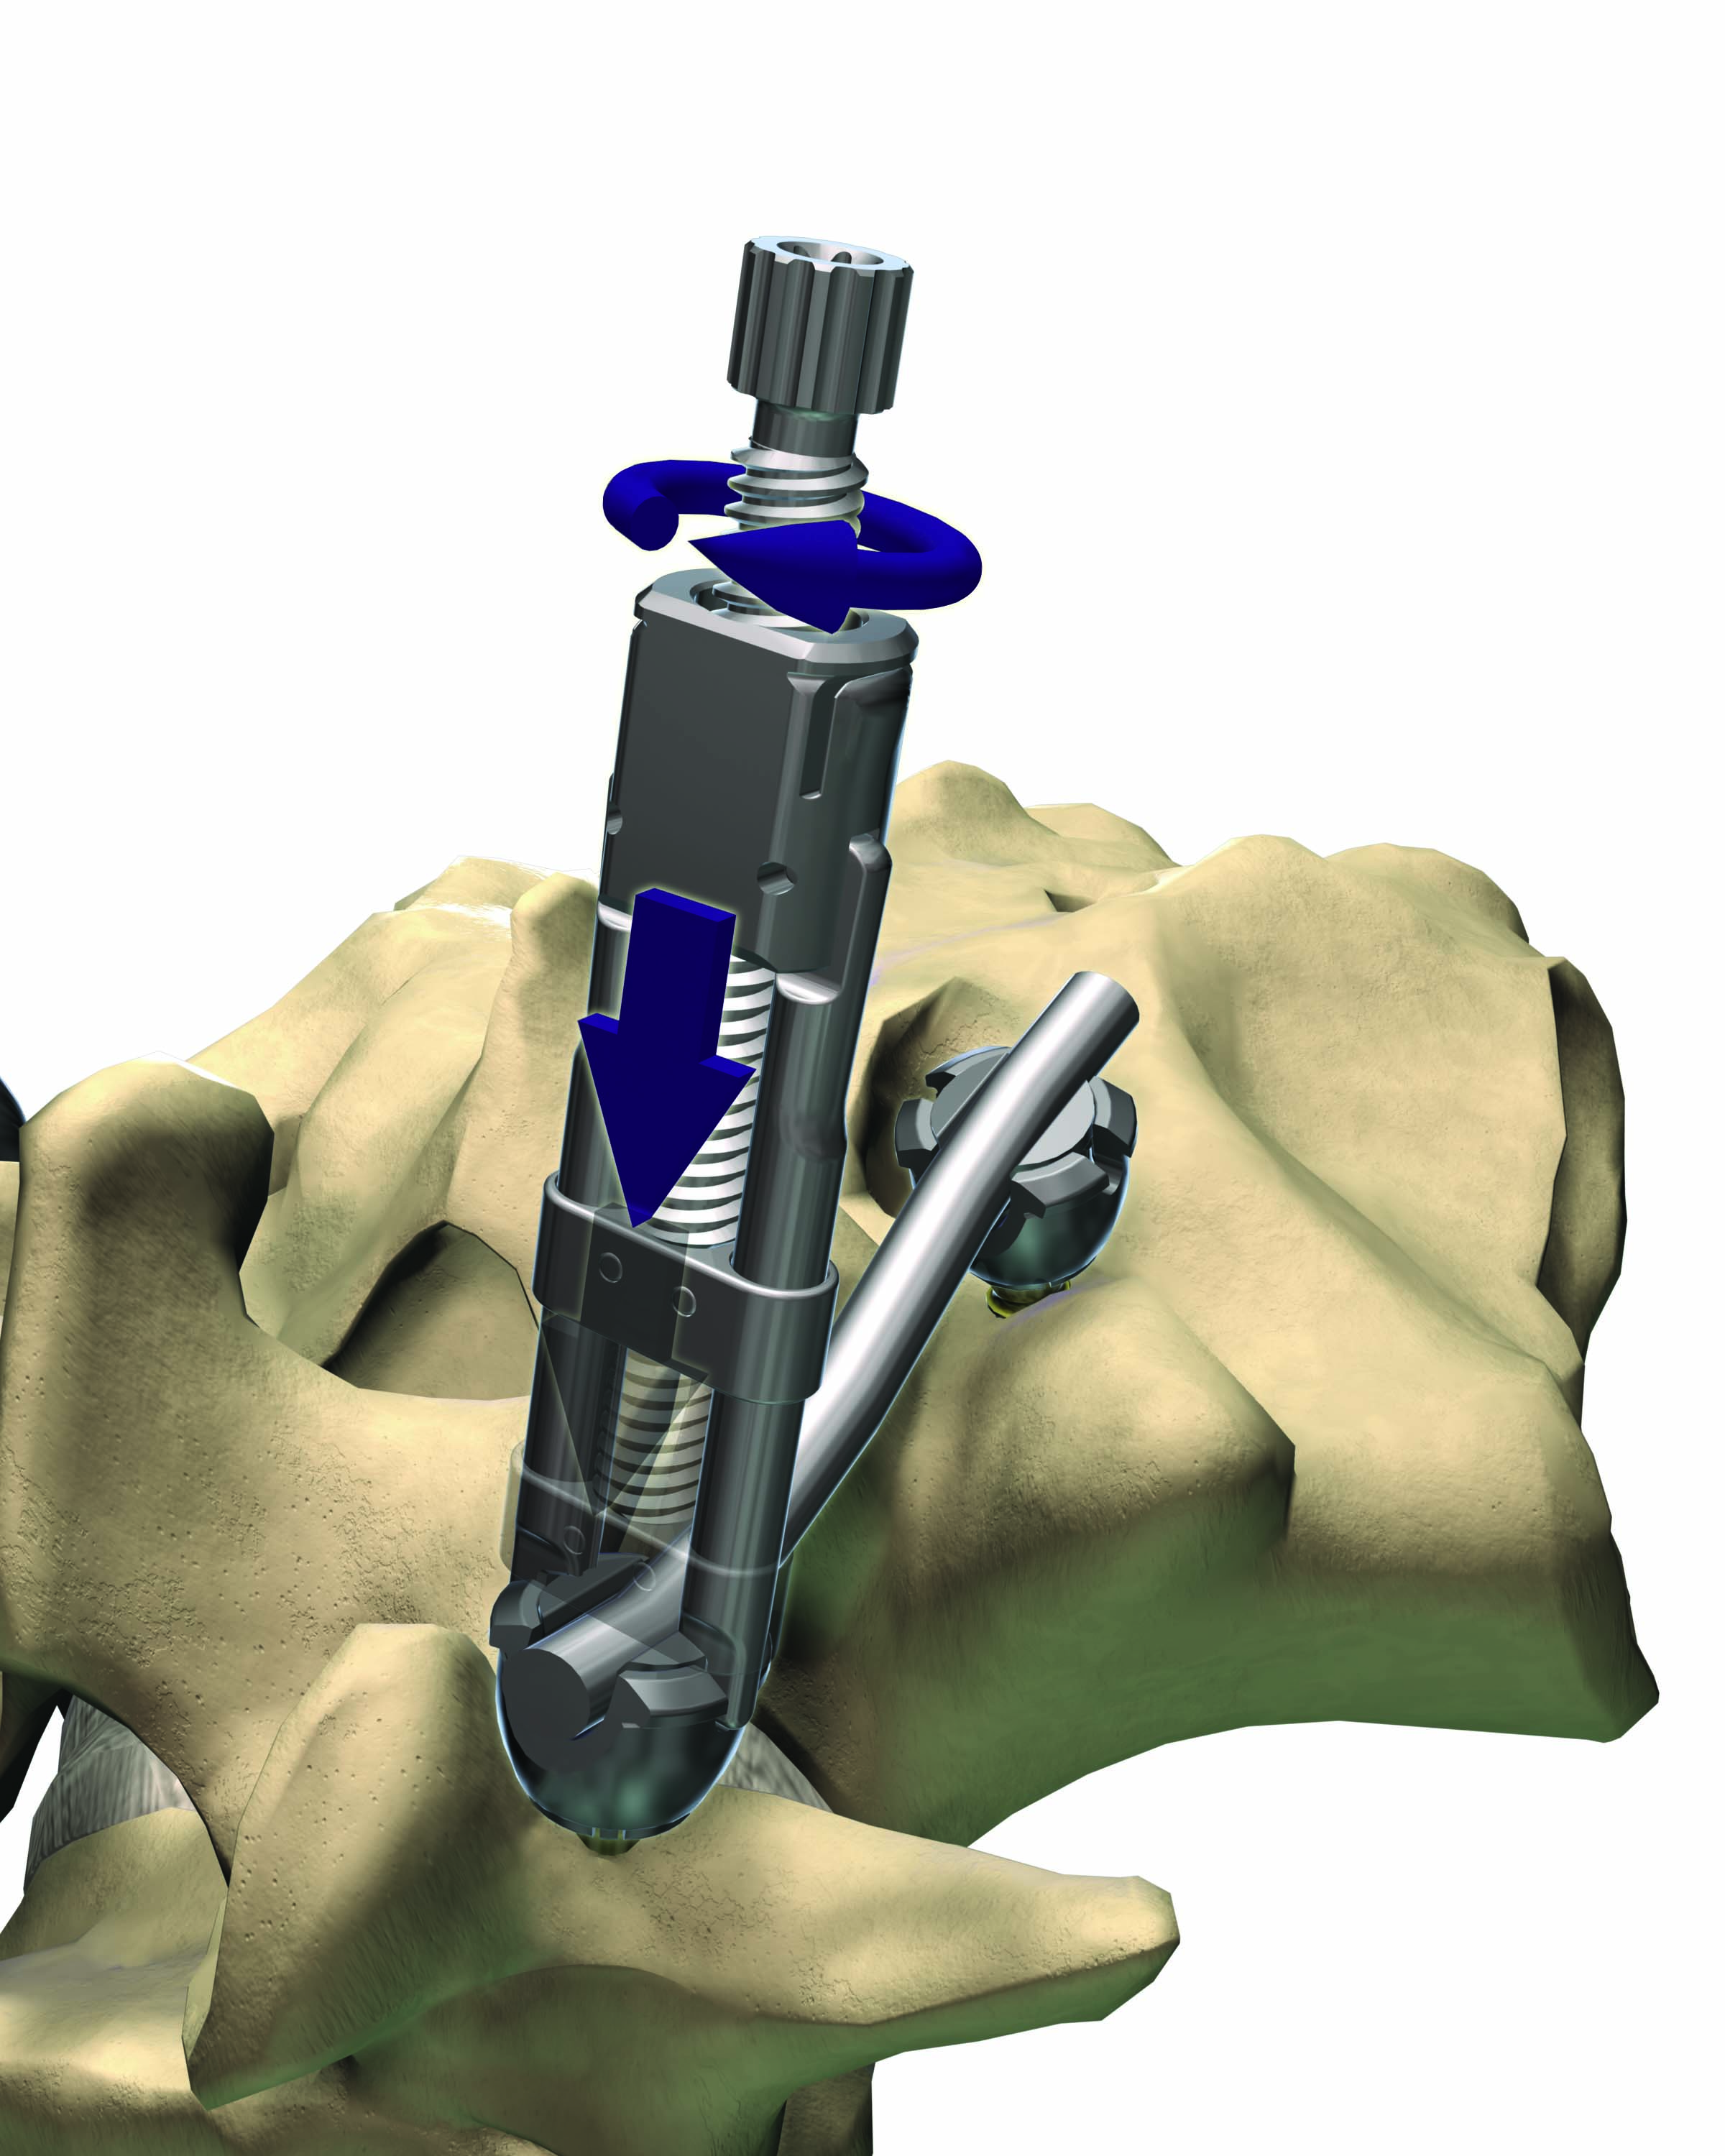
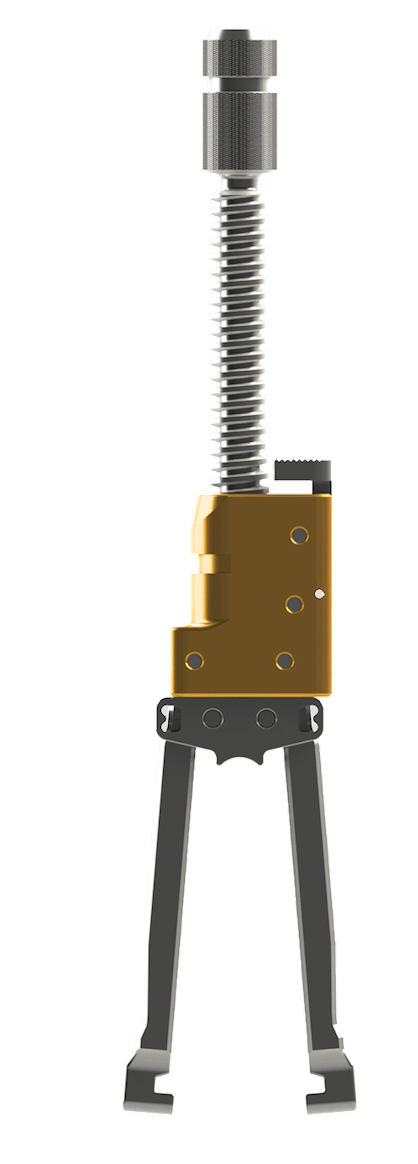
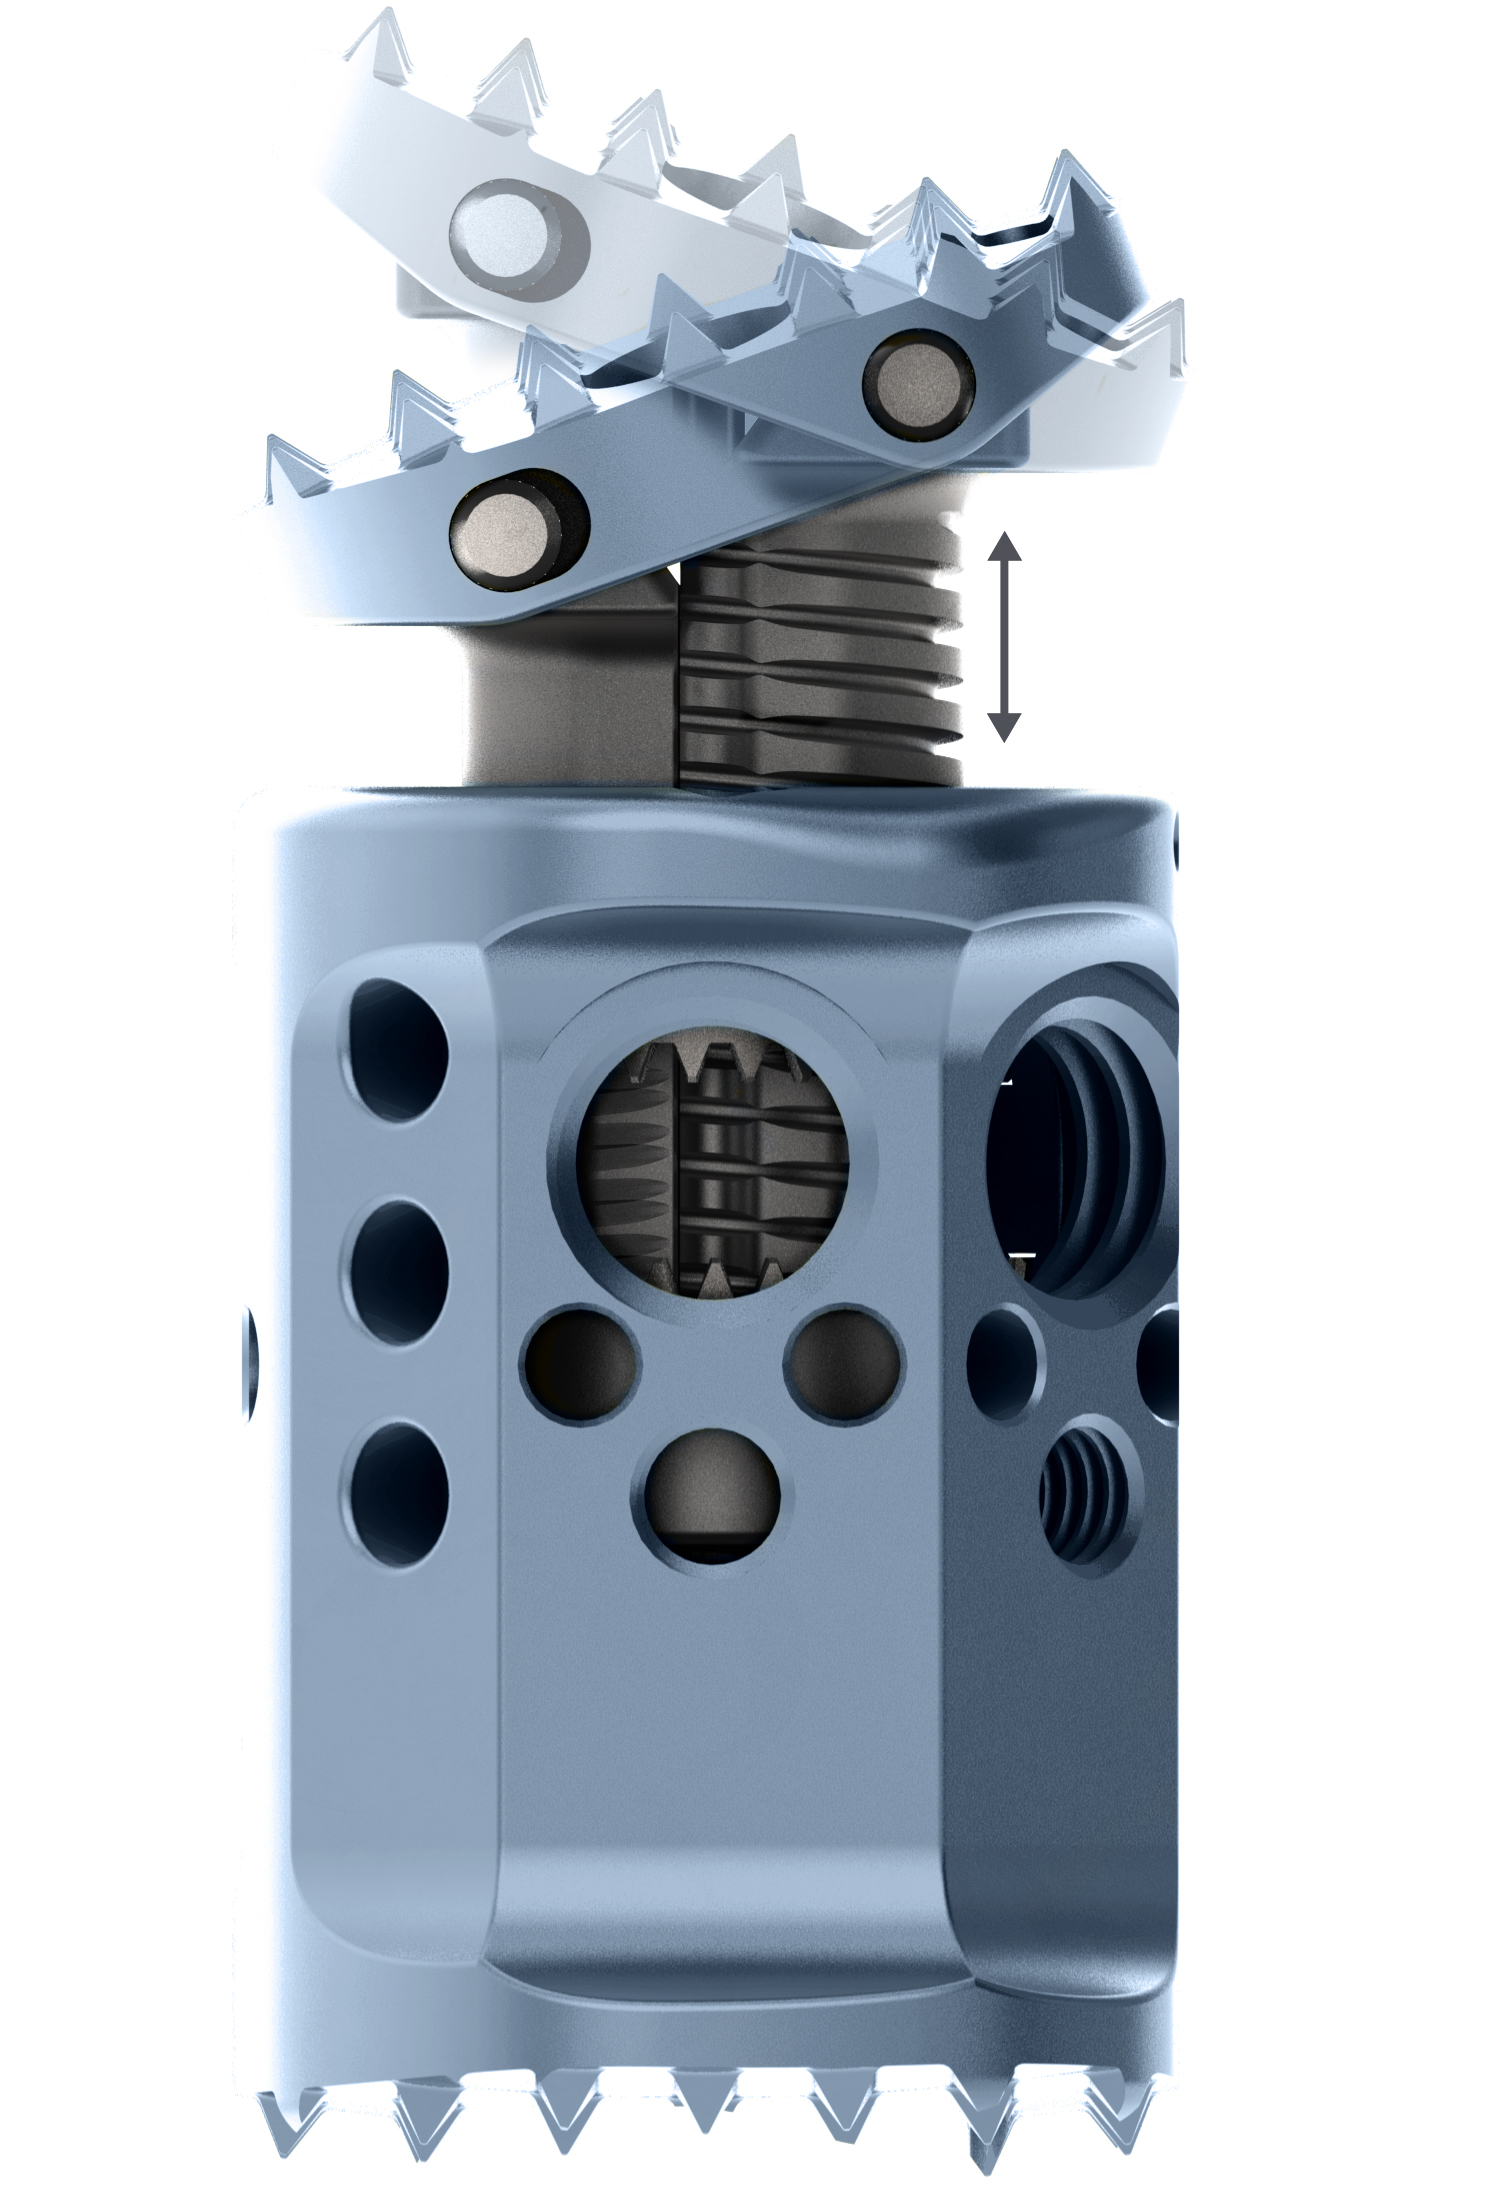
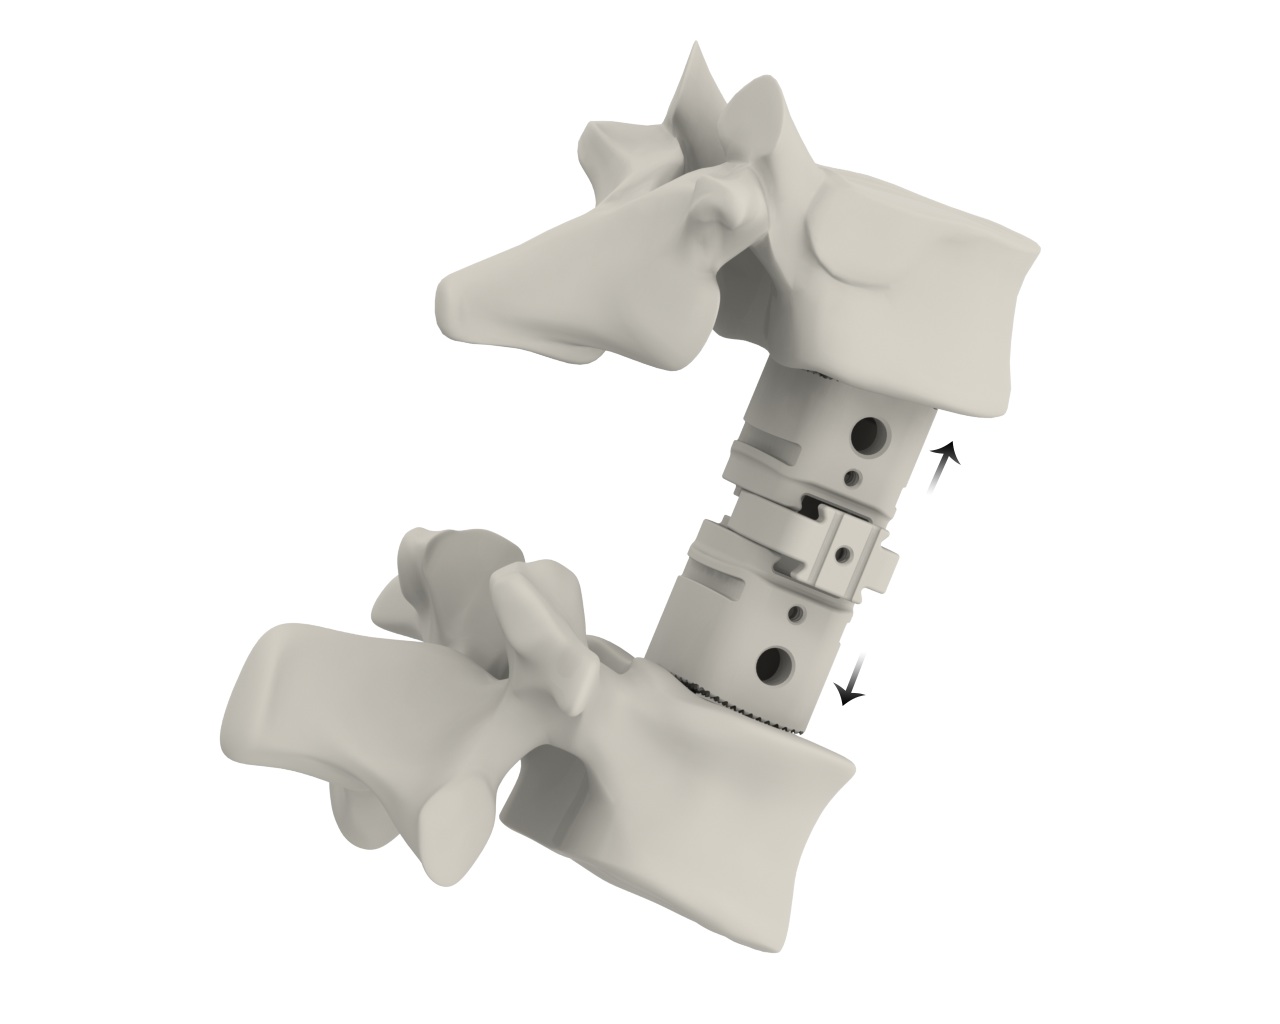
| • | CAPRI: a corpectomy cage system which provides an innovative solution for stabilization of the spine in cases of vertebral body resections resulting from trauma or tumor. Offered in various configurations, this versatile system allows for in-situ height expansion and endplate angulation; |
| |
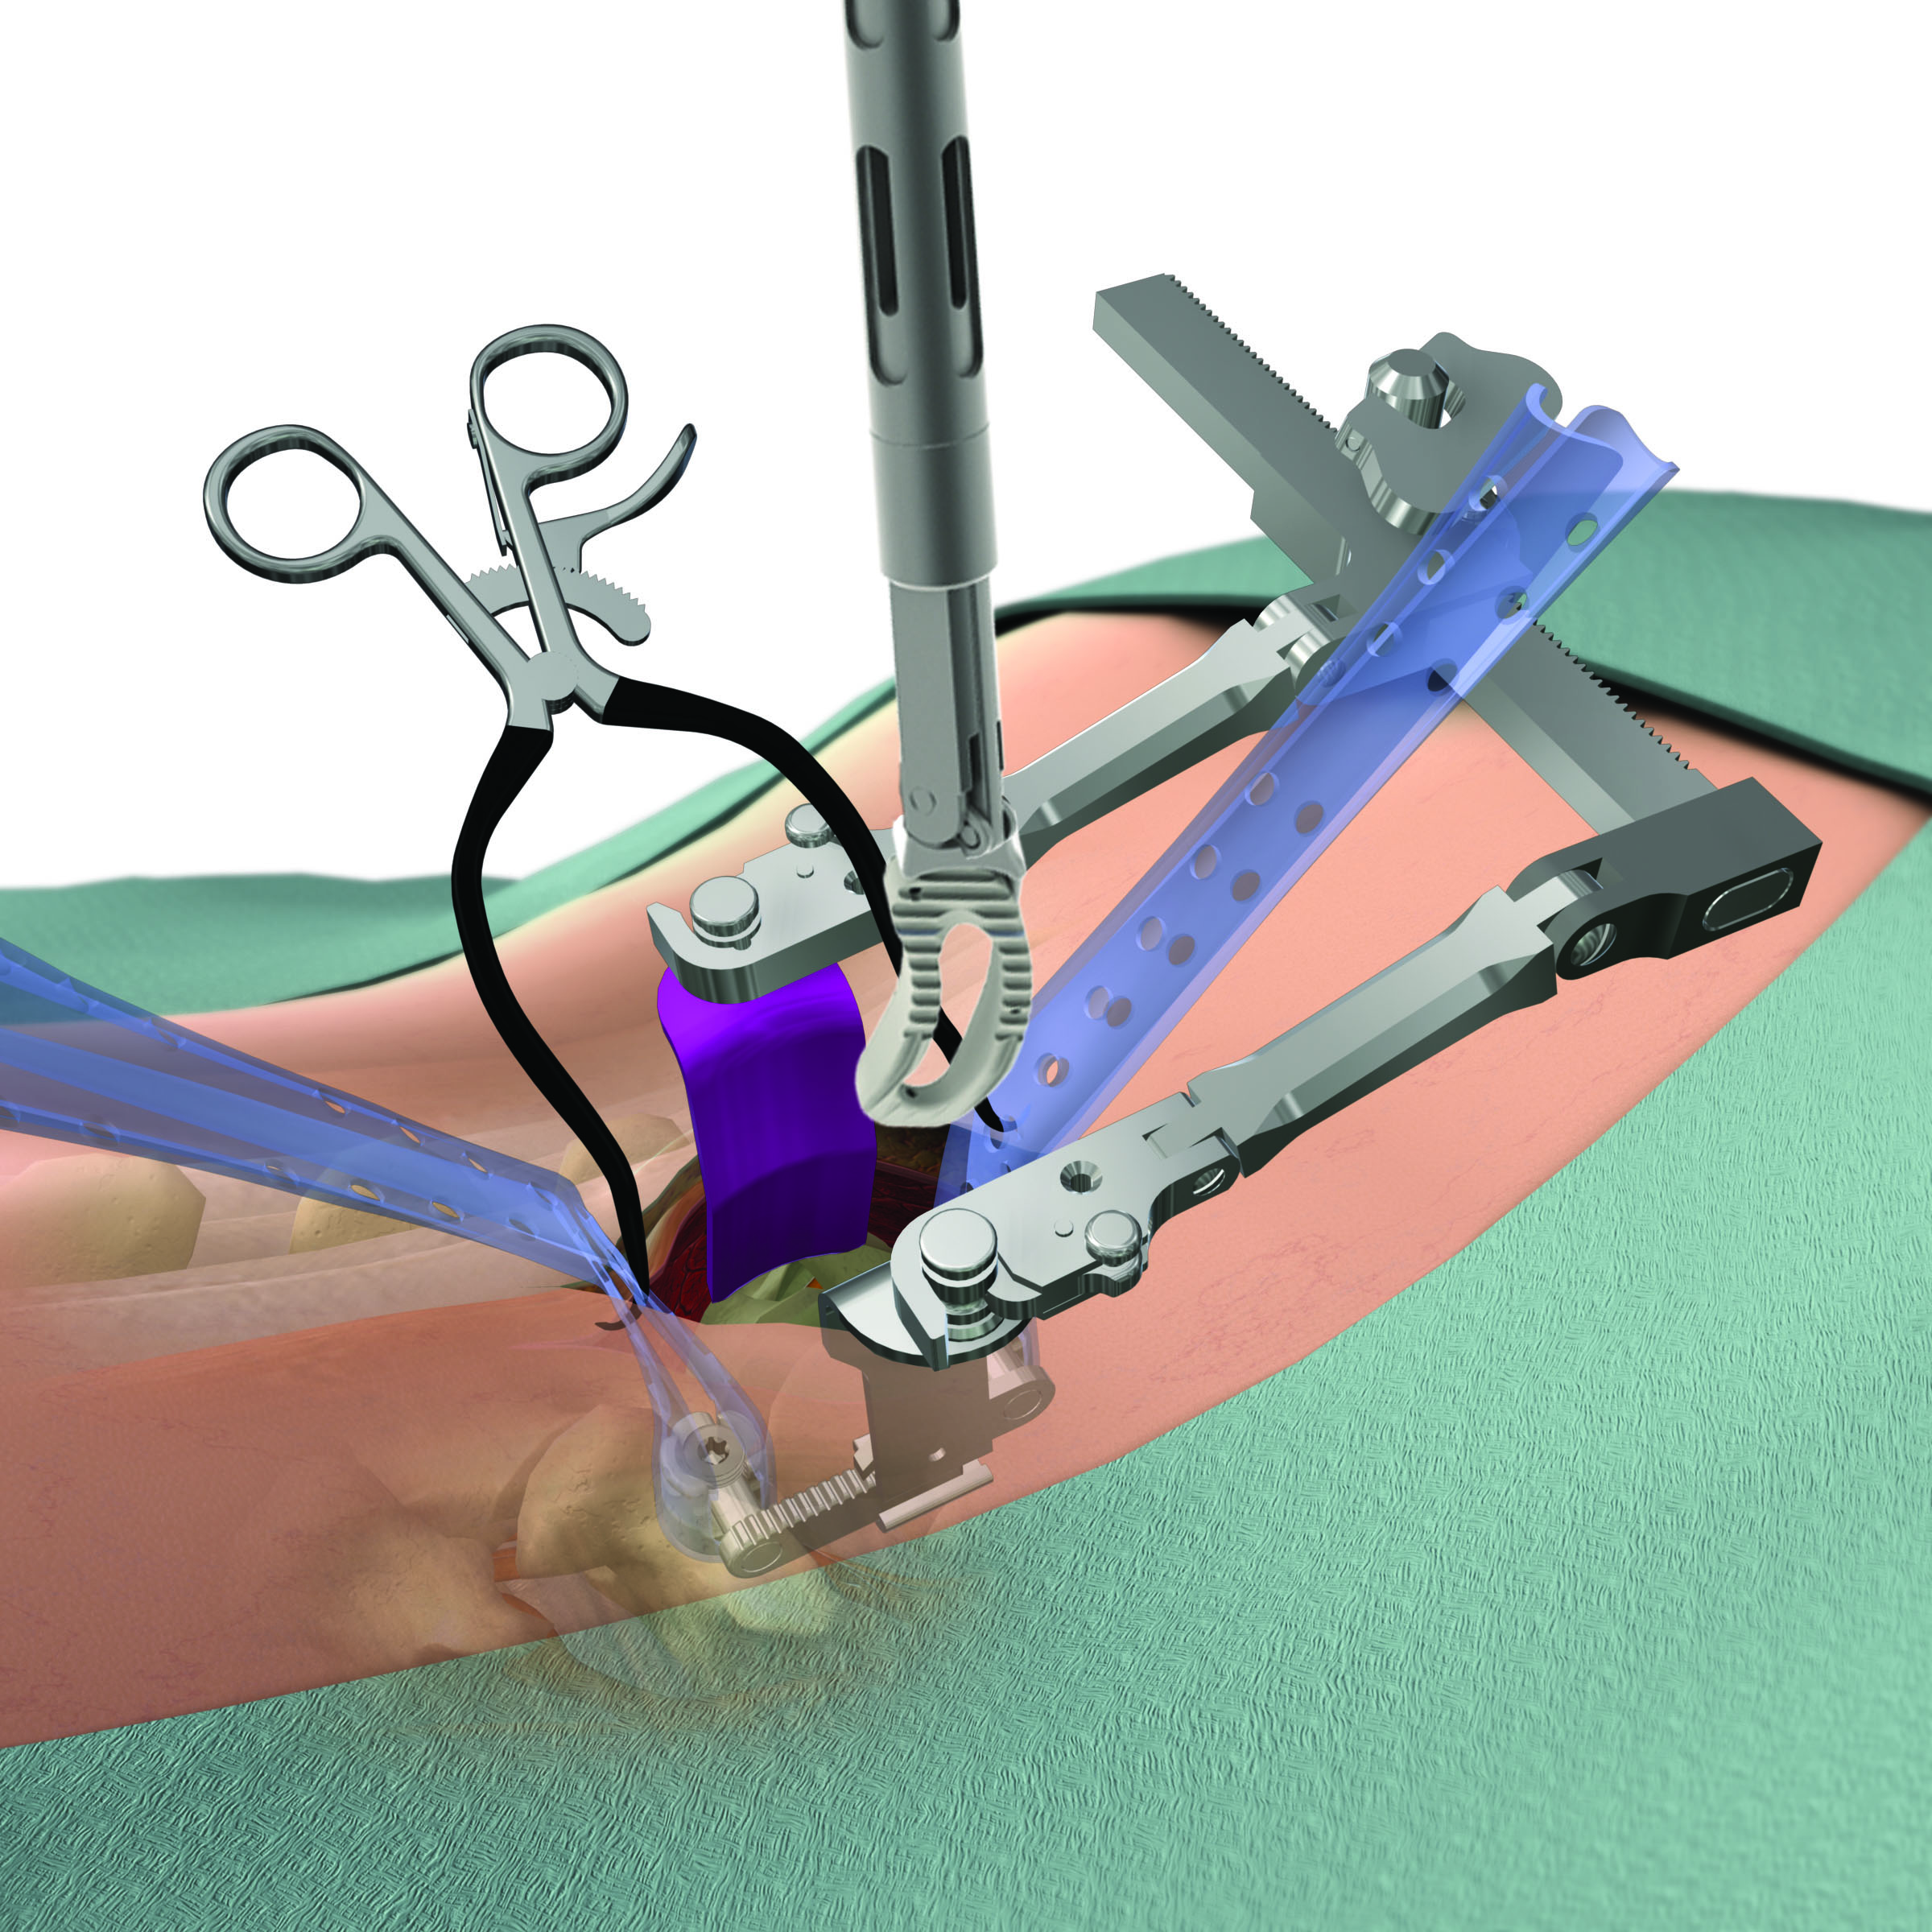
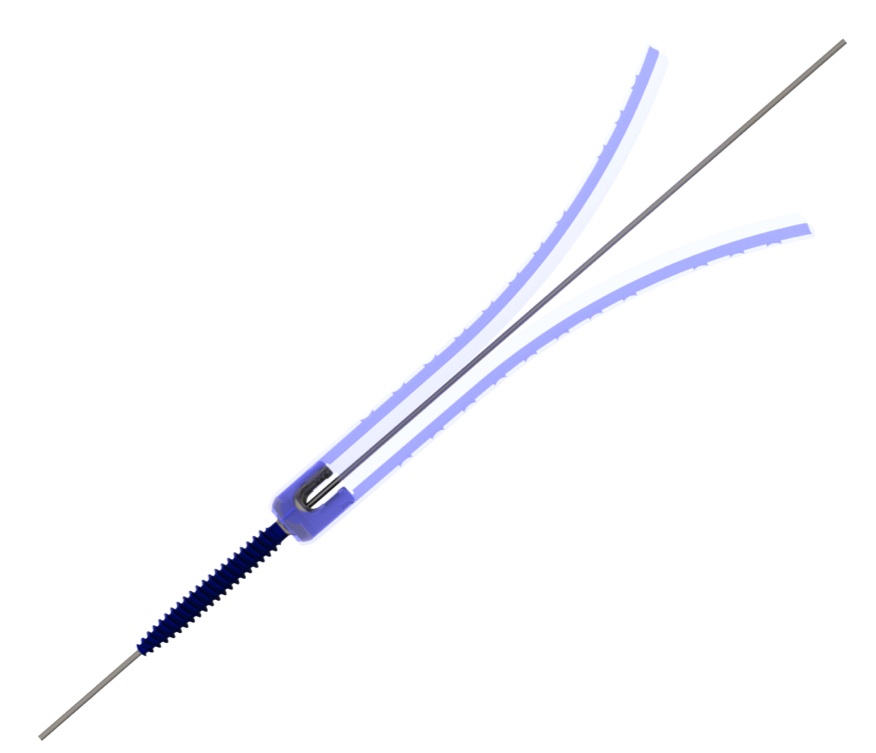
| • | SERENGETI: minimally invasive retractor systems featuring one-step placement of screws and retractors, thereby reducing the number of surgical steps, while allowing for direct visualization and improved access to the spine; |
| |
| • | RAVINE: minimally invasive retractor systems that represent an innovative design departure from standard tubular retractors, facilitating retractor placement, positioning and fixation to the patient’s anatomy to allow for endplate to endplate visualization and multi-level alignment through a lateral access approach; |
| |
| • | EVEREST: a spinal screw technology that we believe, based on internal testing, provides for improved insertion speed, industry-leading pull-out strength and the versatility to accommodate a variety of titanium and cobalt chrome rods of two different diameters; |
| |
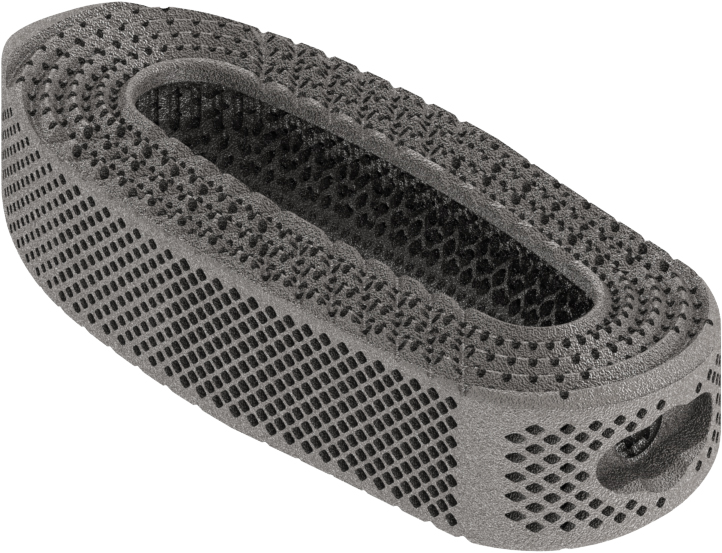
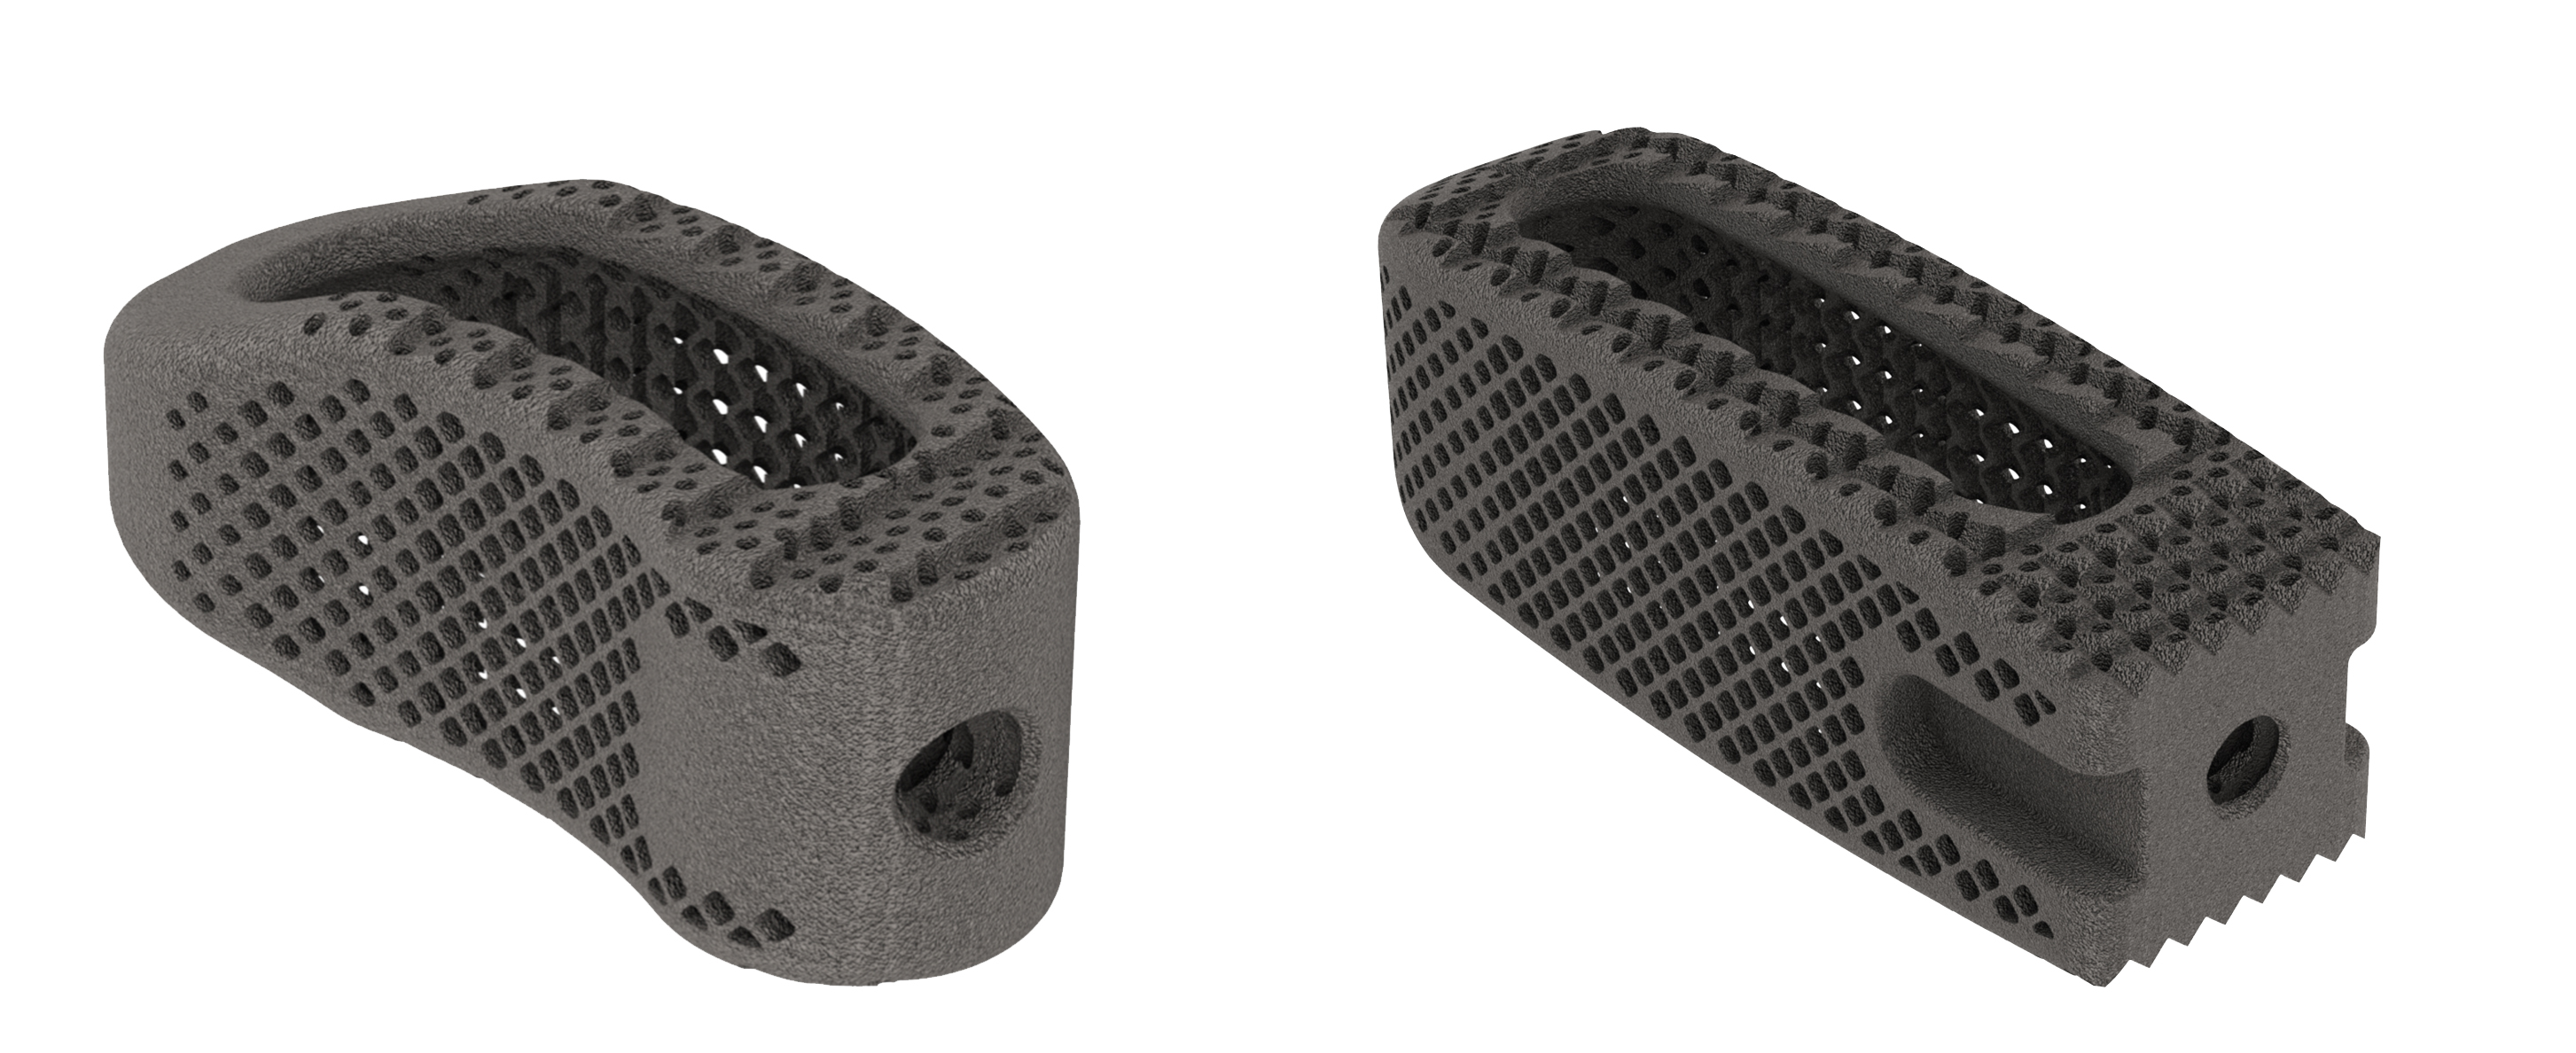
| • | CASCADIA: a titanium 3D printed implant technology based on our Lamellar Titanium Technology, which exploits the material properties of titanium in conjunction with a product design that incorporates an approximately 70% porosity to mitigate the device's radiographic signature; and |
| |
| • | tifix: a locking technology integrated into a number of our interbody and plate implants providing surgeons with the flexibility to insert screws at various angles and lock them to an implant with a one-step locking mechanism that eliminates the need for a secondary locking feature. |
We have grown our revenue to $216.0 million in 2015 from $100.5 million in 2010, representing a five-year CAGR of 17% between 2010 and 2015. For 2015, 2014 and 2013 our net loss was $39.2 million, $59.6 million and $37.9 million and our Adjusted EBITDA was $(0.1) million, $(8.8) million and $(5.3) million, respectively. For information about how we calculate Adjusted EBITDA, see Non-GAAP Financial Measures below. We expect to continue to incur additional losses as we invest in the global expansion of our business. As of December 31, 2015, our accumulated deficit was $169.4 million.
We have developed and maintain an expanding portfolio of intellectual property, which included 298 issued patents globally and 228 pending patent applications globally as of December 31, 2015. In addition to our current product offerings, we continue to invest in the research and development necessary to design, develop and commercialize new surgical solutions for unmet clinical needs. Our highly efficient product development process utilizes an integrated design team approach that involves collaboration among select teams of leading surgeons in their respective specialties, our product management team, our engineers and our clinical and regulatory personnel. We believe that utilizing these integrated design teams enables us to develop innovative and differentiated technologies and techniques that meet the needs of the market and allow surgeons and hospitals to better serve their patients. As of December 31, 2015, our product portfolio contains 71 product lines, which include our MESA, EVEREST and CASCADIA technologies, demonstrating our ability to leverage our product development process to rapidly innovate new products.
We currently market or sell our products in the United States and 36 other countries. In 2015, international sales represented approximately 28.1% of our revenue. We have made significant investments in building a global hybrid sales organization consisting of direct sales employees, independent sales agencies and distributor partners. As of December 31, 2015, our U.S. sales force consisted of 124 direct sales employees and 85 independent sales agencies and our international distribution network consisted of 39 direct sales employees, 10 independent sales agencies and 26 independent distributorships. We expect to continue to invest in the expansion of our global hybrid sales organization. We believe the continuing expansion of our global sales force will provide us with significant opportunities for future growth as we increase our penetration of existing geographic markets and enter new ones. We do not sell our products through or
participate in PODs.
Corporate History
K2M, Inc. was incorporated in 2004 and began working with leading spine surgeons for the purpose of designing, developing and commercializing innovative and proprietary complex spine technologies and techniques. Between 2005 and 2010, we continued to develop our product portfolio while expanding our business, including the investment of venture capital raised from Ferrer Freeman & Company, LLC, or FFC. On August 12, 2010, K2M Group Holdings, Inc., an entity then controlled by Welsh, Carson, Andersen & Stowe, acquired K2M, Inc. Welsh, Carson, Anderson & Stowe XI, L.P. and certain of its affiliated funds are referred to herein as “WCAS,” and WCAS, together with the other owners of K2M Group Holdings, Inc. prior to our May 2014 initial public offering, are collectively referred to as our “pre-IPO owners.” Since 2010, we have continued to invest in our business by expanding our global distribution network, including through the investment of additional capital raised from our pre-IPO owners, our initial public offering in May 2014, and subsequent public offerings in February 2015 and July 2015.
Industry Background
Overview of Spine Anatomy
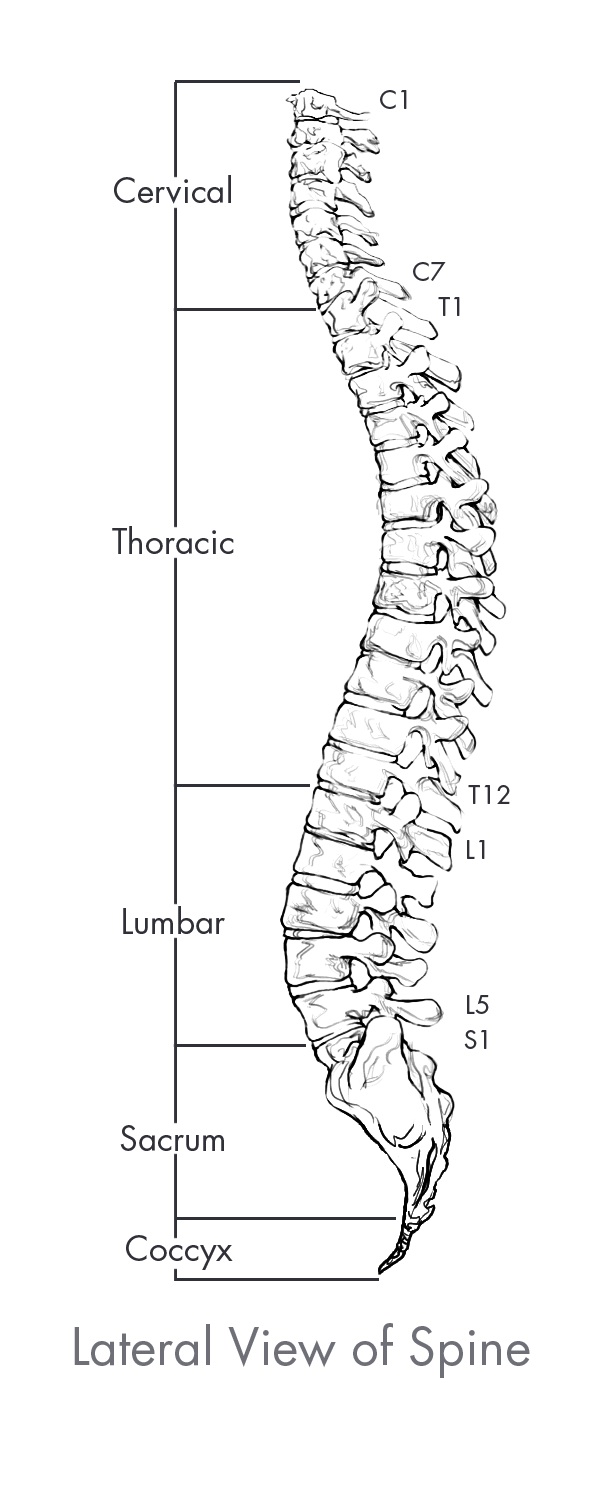
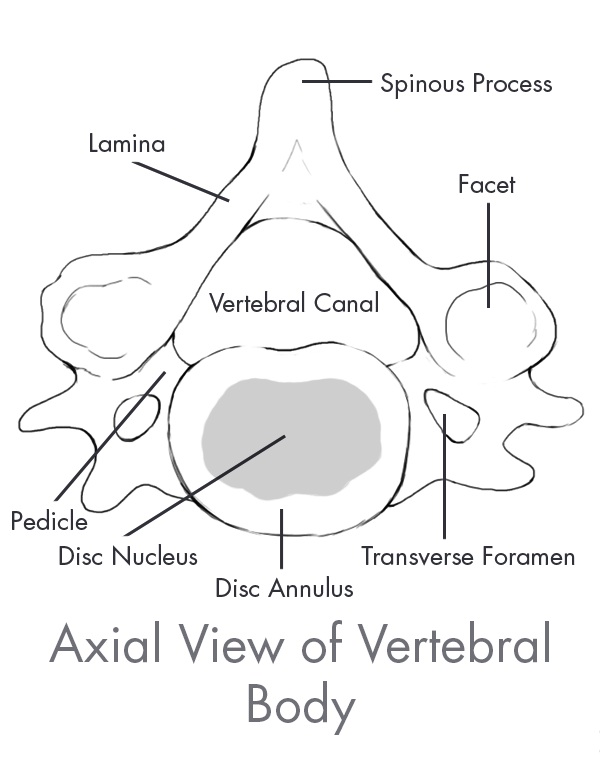
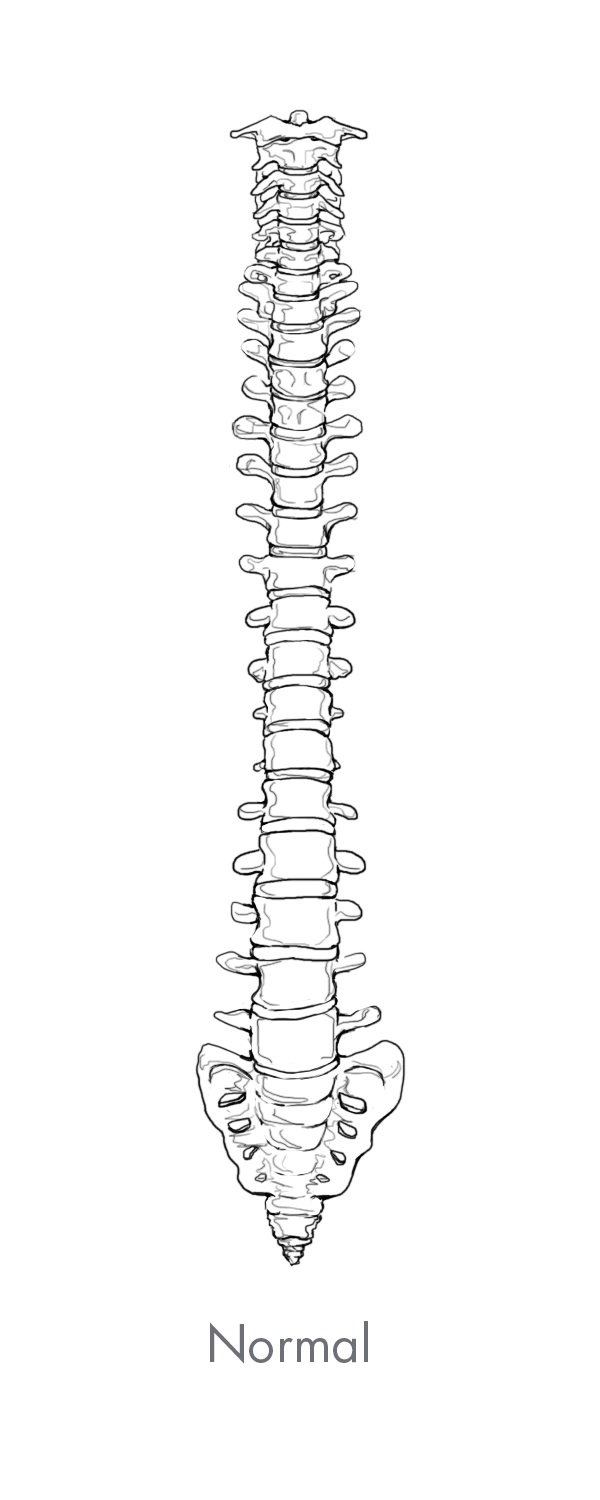
The spine is the central core of the human skeleton and provides structural support, alignment and flexibility to the body. It consists of 24 interlocking bones, called vertebrae, which are stacked on top of one another. The spine is comprised of five regions, of which there are three primary regions: cervical, thoracic and lumbar. There are seven vertebrae in the cervical, or neck, region of the spine, 12 vertebrae in the thoracic, or central, region of the spine, and five vertebrae in the lumbar, or lower back which is the primary load-bearing region of the spine. The bottom of the spine, comprised of the sacrum and the coccyx, consists of naturally fused vertebrae connected to the hip bones to provide support for the spine. A healthy spine has a natural curvature when viewed from the side and is straight when viewed from the front or back. The cervical and lumbar regions contain forward convex curves referred to as lordosis while the thoracic region contains a backward concave curve referred to as kyphosis. Between each pair of vertebrae is an intervertebral disc that acts as a shock absorber during movement. Vertebrae are paired as motion segments, or levels, and are connected to each other by facet joints in the rear region of the spine that provide flexibility and enable the spine to bend and twist. The back, or posterior, part of each vertebra is comprised of a bony arch called the lamina and the spinous process. Soft tissues, including ligaments, tendons and muscles are attached to these structures, which provide stability to the spinal column and facilitate movement of the spine. The largest load bearing bony structure, which is in the front, or anterior, and middle part of each vertebra, is referred to as the vertebral body. These collective spinal elements serve as a protective cage for the spinal cord, which runs through the center of the spine, or spinal canal, carrying nerves that exit through openings between the vertebrae, or foramen, which run from every area of the body to the brain, delivering sensation and control to the entire body.
Overview of Spine Disorders
Complex spine pathologies and back pain related to spine disorders affect more than 31 million people in the United States and are a leading driver of healthcare costs globally. Spine disorders range in severity from mild discomfort and numbness, to curvatures of the spine, extreme pain and paralysis. Spine disorders can be categorized as either complex, which consists of deformity (primarily scoliosis), trauma and tumor, or degenerative.
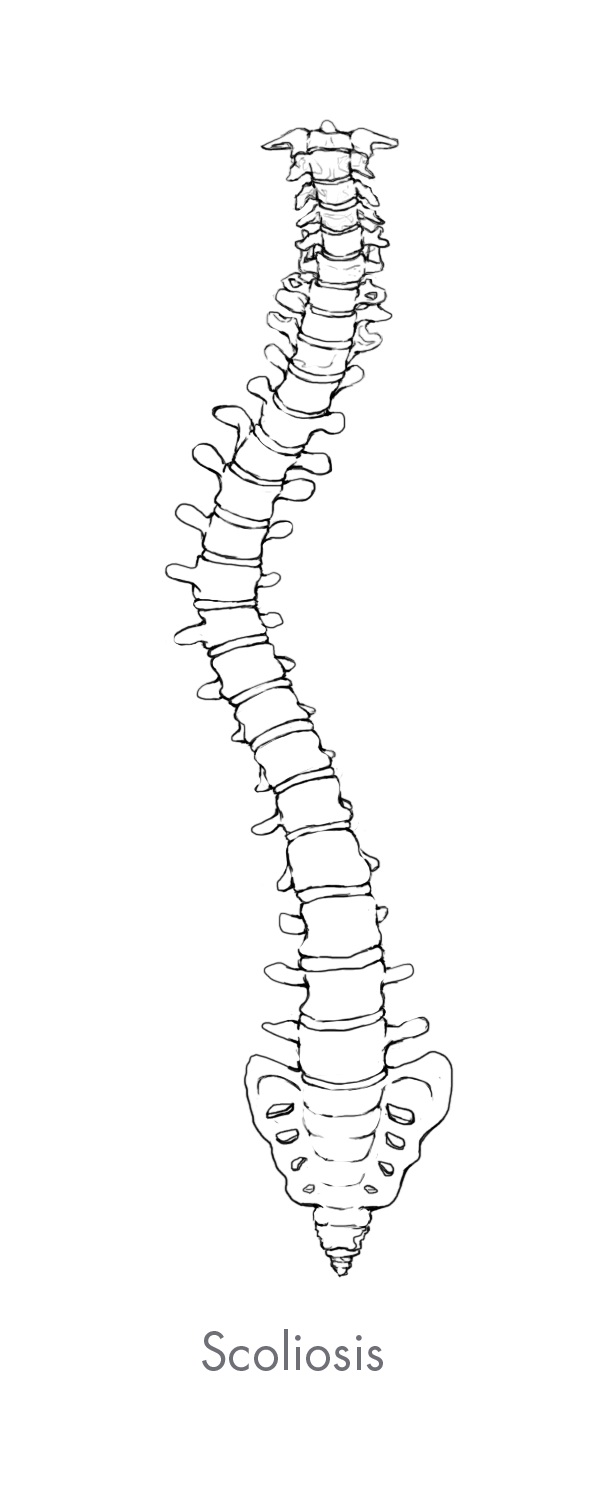
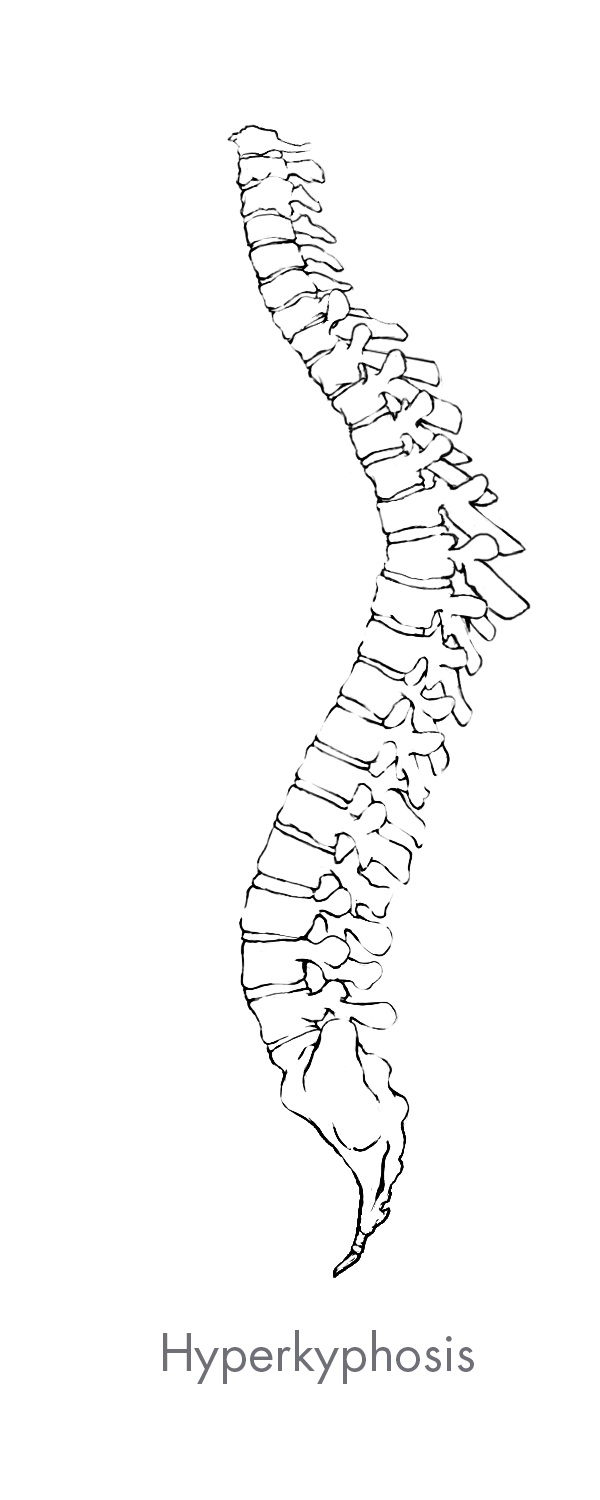
Spine deformity is any variation in the natural curvature of the spine. The most common form of spine deformity is scoliosis which is either a lateral, or side-to-side curvature of the spine, or an extreme rotation of the vertebral body. Other common types of deformity include hyperlordosis which is an over-extension of the normal convex curvature of the cervical and lumbar spine, and hyperkyphosis which is an over-flexion of the normal concave curvature of the thoracic spine.
Spine deformity can be further grouped into the following four categories which are known to have different spine characteristics:
| |
| • | Pediatric infantile scoliosis, presents in children under 10 years of age as a result of conditions present at birth or congenital conditions; |
| |
| • | Adolescent scoliosis, presents in patients between the ages of 10 and 18 as a result of congenital conditions, neuromuscular conditions such as cerebral palsy or muscular dystrophy, or other unknown previously existing conditions; |
| |
| • | Adult scoliosis, presents in patients between the ages of 19 and 64 as a result of scoliosis, which typically starts after the age of 40 due to arthritis or other conditions of aging, or as a result of scoliosis that started when the patient was younger; and |
| |
| • | Aging spine, presents in patients 65 years of age or older as a result of a pre-existing deformity that has progressed or the onset of severe degenerative spine disorders. |
Spine trauma is often the result of impact from a fall, car accident or other external forces. Spine traumas include fractures, dislocations, soft tissue damage and other musculoskeletal and nervous system injuries.
Spine tumors are relatively rare. Benign tumors are typically removed surgically while malignant tumors are more difficult to treat and often originate in other areas of the body such as the lungs, thyroid or kidneys.
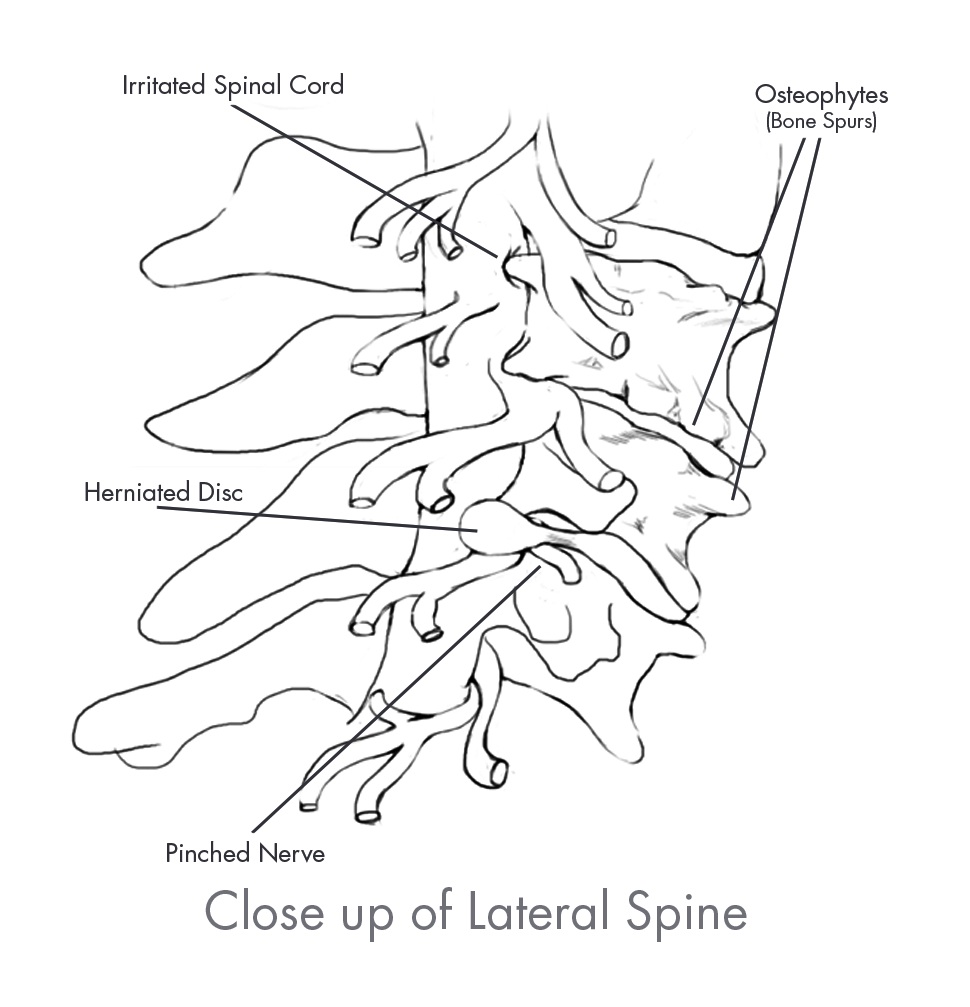
Degenerative spine disorders are typically the result of repetitive stresses experienced during the normal aging process and are the most common type of spine disorders. Degenerative spine disorders occur when the intervertebral disc at a motion segment weakens and loses its normal height, thereby compressing the spinal nerves. Compression of the spinal nerves often leads to pain and/or loss of feeling in the arms, back and legs.
Treatment Alternatives for Degenerative Spine Disorders
Treatment for degenerative spine disorders usually begins with conservative therapies including observation to determine if the spine disorder is progressing, lifestyle changes such as exercise and weight loss, anti-inflammatory and pain medication and physical therapy. If and when conservative therapies fail to provide adequate quality of life improvements, patients may ultimately require spine surgery.
The goals of spine surgery are to reduce patient pain and restore structural support and alignment while maintaining natural flexibility within the spine, if possible. Surgical options for degenerative spine disorders vary greatly depending on each patient’s unique pathology and include procedures that either (1) do not use spinal implants or (2) use spinal implants.
Decompression procedures are typically performed earlier in the continuum of care and may or may not include the use of spinal implants. These procedures include discectomies and laminectomies, which involve the removal of part of a damaged disc or lamina in order to relieve pressure on the spinal nerves. Decompression procedures may occasionally result in spinal instability due to the removal of these spinal elements and as a result require the utilization of spinal implants.
In the case of advanced degenerative spine disorders, treatment often turns to procedures that involve the use of spinal implants, the most common of which is a fusion procedure. The goal of fusion is to permanently decompress the spinal nerves exiting the spine by restoring the natural height of the disc and eliminating motion at the affected level. A fusion procedure involves the surgical removal of bone and/or diseased or damaged disc material that is believed to be the source of the pain and insertion of spinal implants to the spine to stabilize the affected vertebrae. Spinal implants used in fusion procedures include interbody devices that replace the disc space between the vertebrae, as well as spinal implants such as Rails, stabilization rods, screws, plates and biomaterials that provide stability and promote fusion between the vertebrae. Treatments for degenerative spine disorders may also include motion preservation technologies such as cervical and lumbar disc replacement, dynamic stabilization, annular closure, nucleus replacement and facet arthroplasty devices. In some instances, degenerative spine disorders may progress to complex spine disorders, depending on the severity and advancement of the pathology or structural deformity.
Treatment Alternatives for Complex Spine Disorders
Treatments for complex spine disorders, such as deformity, address patients with severe curves in their spine seeking to prevent curve progression and obtain curve correction. The treatment pathway for deformity cases may begin with bracing or casting which are designed to slow or correct the progression of the adverse curvature of the spine. Bracing and casting are typically used as the first course of treatment in young children who are still growing. If a child’s curve has shown progression despite bracing or casting, surgery is often considered. Surgical treatment for deformity conditions in young patients that have not stopped growing, such as pediatric infantile scoliosis, typically seek to correct the deformity while avoiding long fusions of the spine. These procedures include the use of spinal implants, such as pedicle screws and expandable rods that are periodically lengthened, to control the spine deformity while still allowing for the spine to grow until the child reaches an appropriate size or age for a more permanent solution, such as spinal fusion. When these patients mature and reach spinal maturity, spinal fusions are typically considered.
Treatment of more intricate complex spine disorders, such as traumas and tumors, may require the use of one or several procedural alternatives, such as (1) decompression, (2) fusion or (3) corpectomy techniques, where the vertebral body may be completely removed and replaced by a vertebral body replacement device.
The indications for surgical treatment of complex spine disorders such as deformity are determined by anatomical angle measurements that are established and well defined among hospitals, physicians and third-party payors. Conversely, fusion procedures for degenerative conditions are typically indicated when the source of the patient’s pain originates from the vertebral level in question and a diagnostic confirmation of degenerative disc disease is made. Current techniques to identify the source of a patient’s degenerative back pain are imprecise and it may be difficult to locate the source of pain. Third-party payors typically require a confirmed diagnosis of degenerative disc disease in order to reimburse for surgical procedures. We believe complex spine procedures typically receive a higher rate of positive insurance coverage and often generate more revenue per case, as compared to degenerative procedures.
MIS Treatment Alternatives for Complex and Degenerative Spine Disorders
Traditional approaches for complex spine and degenerative spine surgery require large incisions in order to provide surgeons with access to, and visibility of, the spine and surrounding areas. Consequently, traditional surgical procedures are considered highly invasive and are often associated with several limitations including significant blood loss, extensive soft tissue disruption, long operative times, extended hospital stays and lengthy patient recovery times.
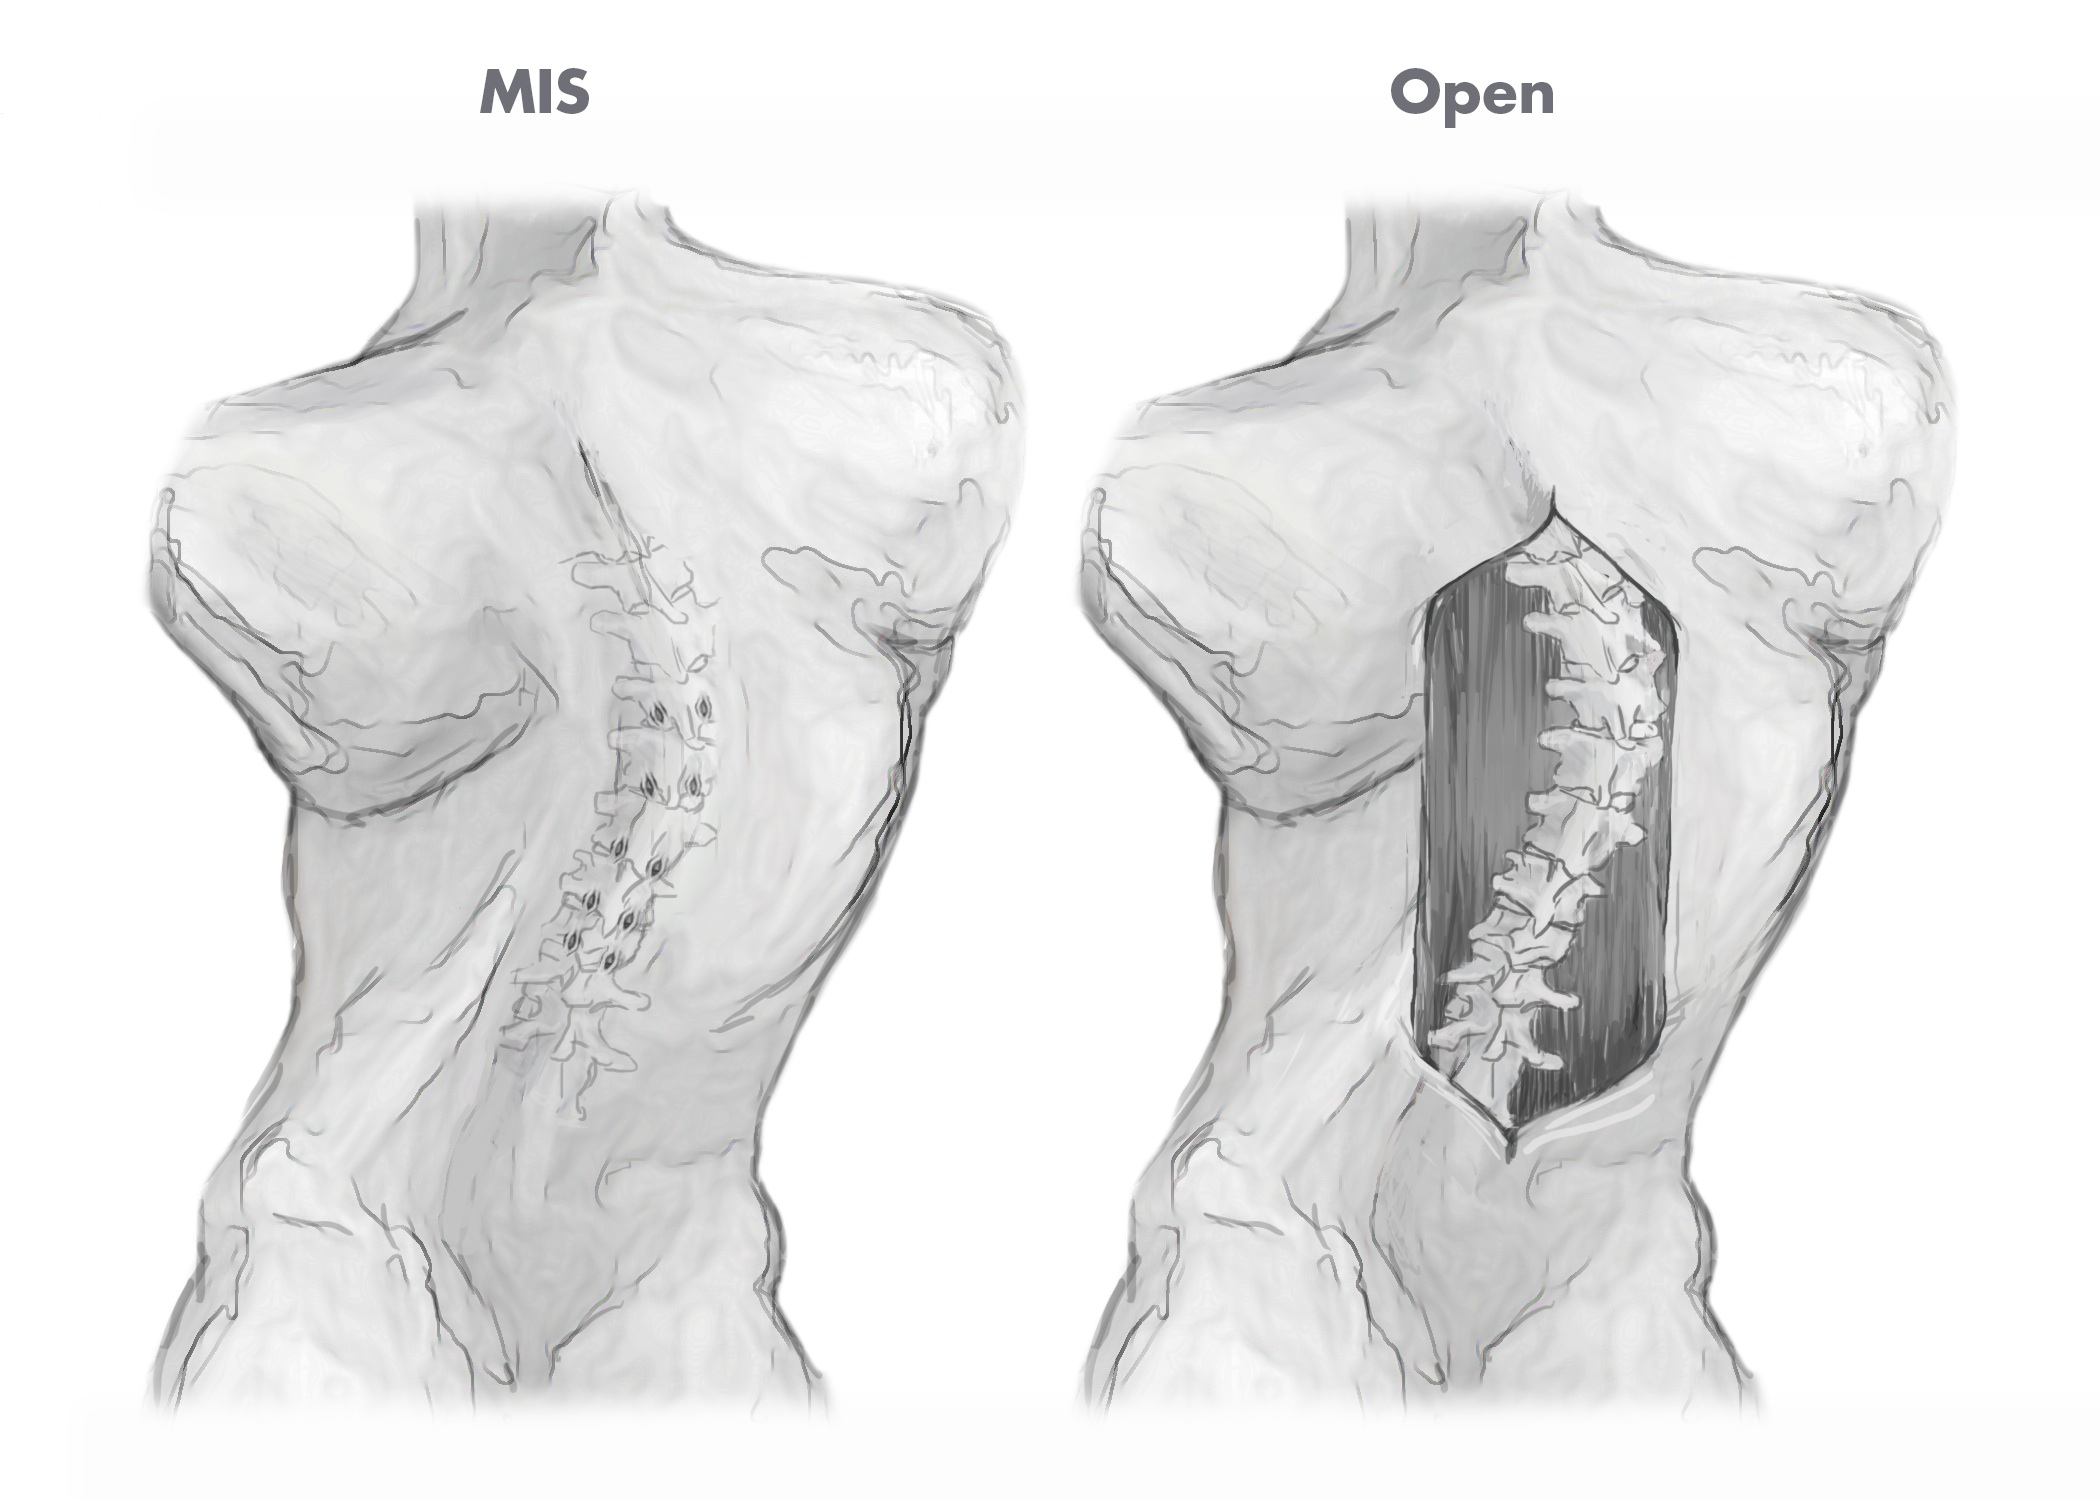
Over time, there has been significant increase in surgeon and patient interest for less invasive surgical techniques for treating both complex and degenerative spine disorders. MIS techniques are designed to allow for less invasive access to the spine and, as a consequence, faster patient recovery times as compared to traditional open access surgical techniques. The figures below illustrate the different incision sizes in a multi-level deformity case utilizing both traditional open and MIS surgical techniques.
Biomaterials Treatment Alternatives for Complex and Degenerative Spine Disorders
Biomaterial treatments are typically derived from human bone or synthetic sources and come in a variety of forms. These biomaterials are used by spine surgeons during the surgical treatment of certain complex spine and degenerative pathologies to augment spinal implants and to promote fusion by accelerating, augmenting or substituting for the normal regenerative capacity of bone.
Market Opportunity
According to iData, the global spine surgery market was estimated at approximately $10.5 billion in 2014:
|
| | | | | | | | | | | | | | | | | | | |
| | 2014 Estimated Global Spine Market Size (dollars in millions) |
| | United States | | Europe | | Asia/ Pacific | | Latin America | | Total |
| Complex Spine | $ | 1,044 |
| | $ | 198 |
| | $ | 268 |
| | $ | 75 |
| | $ | 1,585 |
|
| MIS (Degenerative) | 1,189 |
| | 61 |
| | 93 |
| | 28 |
| | 1,371 |
|
| Degenerative Spine | 4,284 |
| | 912 |
| | 998 |
| | 309 |
| | 6,503 |
|
| Spine Implants and Instrumentation | $ | 6,517 |
| | $ | 1,171 |
| | $ | 1,359 |
| | $ | 412 |
| | $ | 9,459 |
|
Biomaterials (1) | 759 |
| | 90 |
| | 170 |
| | * |
| | 1,019 |
|
| Total | $ | 7,276 |
| | $ | 1,261 |
| | $ | 1,529 |
| | $ | 412 |
| | $ | 10,478 |
|
(1) We report revenue related to the sale of biomaterials as part of our complex spine, MIS and degenerative spine revenue categories.
Source:iData Research, Inc.
| |
| * | Not included in market sizing estimates |
Overviews of the global spine markets in which we compete, and their associated growth drivers, are as follows:
Complex Spine
The approximately $1.6 billion global complex spine market includes technologies used to treat cases of spine deformity, trauma and tumor, including those treated through a minimally invasive approach. While many advancements in the treatment of complex spine disorders have been made, considerable challenges and limitations associated with performing complex spine surgery remain. For example, many of the spinal implants and instruments currently used to perform complex spine surgeries are not designed to sufficiently address the variable and unpredictable nature of complex spine surgeries caused by the different sizes, shapes, densities and growth characteristics of each individual spine. It is not always possible for spine surgeons to anticipate which of these variables will be present in any given spine surgery, which may result in suboptimal patient outcomes and longer procedure times if they do not have the proper spinal implants and instruments readily available during the procedure. Further, many existing complex spine surgery implants, instruments and surgical approaches are not designed to concurrently access multiple levels of the spine through a MIS approach.
We believe the global complex spine market has been underserved and underdeveloped by major spine market competitors, which generally focus on the larger degenerative spine market. As a result, we believe the complex spine patient population has and will continue to benefit from innovative technologies and techniques that enable simplified surgical procedures, MIS approaches and surgical treatment earlier in the continuum of care.
MIS
The approximately $1.4 billion global MIS market includes technologies used in treating degenerative spine disorders through minimally invasive approaches to the spine.
These technologies and techniques include MIS pedicle screws that are affixed to the spine through either percutaneous, or puncture-like, incisions or retractors that provide direct visualization of the spine with a smaller incision than traditional open procedures. The MIS market also includes minimally invasive interbody devices, including posterior, transforaminal and lateral lumbar interbody fusion (“LLIF”) devices. LLIF devices are inserted from the side and are associated with less disruption to the soft tissues of the back. We believe the vast majority of surgeons and patients, when given the option, will utilize MIS procedures rather than traditional open procedures due to the advantages of MIS approaches, which often include less soft tissue disruption, reduced frequency of surgical morbidity, faster operating times, reduced scarring and, as a consequence of these advantages, shorter patient recovery times. Finally, we believe the overall improvement to the standard of care resulting from the introduction of new MIS products will increase global demand for MIS technologies and techniques.
Degenerative Spine
The approximately $6.5 billion global degenerative spine market includes technologies and techniques used to treat degenerative spine disorders. These technologies and techniques include products such as cervical, thoracic and lumbar spinal fusion devices, interbody devices, motion preservation technologies and vertebral compression fracture devices. We believe that several factors will continue to influence the growth in the global degenerative spine market, including aging patient demographics, increased life expectancies, the desire for maintaining and/or improving lifestyles and demand from patients and surgeons for innovative technologies and techniques that enable simplified surgical procedures, faster procedure times and improved clinical outcomes.
Our Competitive Strengths
Our executive management team is highly experienced in the spinal surgery industry. We believe this experience and the following competitive strengths have been instrumental to our success and continue to enable us to grow our revenue and market share.
| |
| • | Focus in Complex Spine and MIS. Our strategic focus and core competencies are the design, development and commercialization of innovative complex spine and MIS technologies and techniques. In addition to our innovative product portfolio, our dedication to the complex spine and MIS markets is evidenced by our strong relationships with key opinion leaders and spine societies focused on the complex spine and MIS markets, such as the Scoliosis Research Society and the Pediatric Orthopedic Society of North America. Furthermore, we dedicate significant global resources to educating spine surgeons on the safe and effective use of our complex spine and MIS technologies. |
| |
| • | Comprehensive Portfolio of Innovative Proprietary Technologies. We continue to expand our comprehensive portfolio of products that address a broad array of spinal pathologies, anatomies and surgical approaches in the complex spine and MIS markets. We believe the benefits of our product offerings in |
these two markets include simplified surgical techniques, less invasive access to implant sites, enhanced capabilities to manipulate and correct the spinal column, lower-profile spinal implant technology and improved clinical outcomes as compared to traditional alternatives such as open surgical techniques utilizing higher profile screws and other implants that provide more limited manipulation of the spine and often require the use of more components, including additional locking parts and set screws. Our strength in complex spine and MIS provides us with an opportunity to cross-sell our broad portfolio of product offerings in the degenerative market. To protect our innovative technologies and techniques, we maintain and continue to grow our intellectual property portfolio.
| |
| • | Highly Efficient Product Development Process. Responding quickly and efficiently to the needs of patients, surgeons and hospitals is central to our culture and critical to our success. Our integrated teams of surgeon advisors, product managers, engineers and clinical and regulatory personnel conceptualize, design and develop potential new products through an iterative process that allows for rapid product development, which has enabled us to commercialize products since our inception. We believe that our entrepreneurial culture and integrated approach allows us to (1) quickly assess the market, (2) address evolving patient, surgeon and hospital needs, (3) evaluate new treatment options and (4) accelerate the development of a potential product from concept to commercialization. In 2016, we expect to continue our track record of innovation and introduce an additional five to eight new product lines or line extensions. |
| |
| • | Broad Global Distribution Network. Our global distribution network continues to expand and included 163 direct sales employees and contractual relationships with 95 independent sales agencies and 26 distributor partners as of December 31, 2015. In addition, we continue to broaden our operational capabilities by investing in implants and surgical instrument inventories and maintaining sales offices in strategic markets worldwide, such as the United Kingdom, Italy and Germany. We believe that our significant global distribution footprint provides us with the opportunity to effectively introduce new products in the markets in which we have a sales presence. |
| |
| • | Demonstrated Track Record of Innovation and Execution. Our management team has achieved the following milestones: |
| |
| • | Designed and commercialized 71 product lines as of December 31, 2015; |
| |
| • | Established a global distribution network with a sales presence in 37 countries, including the United States; |
| |
| • | Implemented and maintained a comprehensive compliance program, including educational and training components; |
| |
| • | Developed an efficient clinical and regulatory function; and |
| |
| • | Grew revenue at a compounded annual growth rate of 17% from 2010 to 2015. |
We believe our management has the vision, experience and network of relationships to continue our successful growth.
Our Strategies
For 2016, our primary goals are (i) to drive sustainable growth in revenue and our customer base by servicing the needs of patients, surgeons and hospitals through product innovation and differentiation in the complex spine and MIS markets and continuing to leverage these core competencies in the degenerative spinal surgery market; and, (ii) through a combination of revenue growth and leverage and efficiencies to our sales and operations platforms, reduce our net loss for 2016 and begin to achieve profitability in 2017.
To achieve these goals, we intend to:
| |
| • | Capitalize on Our Highly Efficient Product Development Process to Innovate New Technologies and Techniques. We have a proven history of developing and commercializing new technologies in our core competencies of complex spine and MIS, as well as degenerative spine. We plan to continue developing innovative new products. Our product pipeline includes a number of new product or line extensions of |
which we expect to introduce five to eight to market during 2016. We believe that the strengthening of our product offering will allow us to continue to attract highly qualified sales professionals, strengthen our relationship with existing customers, acquire new customers and, ultimately, compete more effectively in the global spine market.
| |
| • | Leverage Our Investments in Infrastructure to Further Penetrate the Global Spine Market. We plan to leverage our product development process, robust intellectual property portfolio, key opinion leader expertise, compliance infrastructure, comprehensive training and education programs, investments in inventory and global sales and marketing infrastructure to effectively distribute our products and continue our expansion in the approximately $10.5 billion global spine surgery market. |
| |
| • | Expand Our Global Distribution Footprint. We will continue to make significant investments in our global distribution network to increase our penetration in existing markets or expand our geographic presence into new markets. We believe there remains significant opportunity for us to expand our global presence. In 2016, we plan to hire additional direct sales employees on an opportunistic basis, while continuing to develop relationships with independent sales agencies and distributor partners in select markets. We also plan to continue our investments in inventory and specialized training to improve the productivity and efficiency of our sales force. |
| |
| • | Selectively Pursue Opportunities to Enhance Our Product Offerings. We expect to selectively pursue opportunities to license or acquire complementary products and technologies to strengthen our market position. For example, we intend to pursue strategic alliances to develop next generation technologies and techniques for the treatment of complex spine pathologies through MIS approaches. We may also engage in strategic transactions such as acquisitions or joint ventures that allow us to increase our product and service offerings. For instance, in 2015 we acquired a portfolio of complex spine and degenerative intellectual property from K-Spine, Inc. which consisted of 19 issued and 45 pending U.S. and international patents primarily focused on new concepts to develop motion preserving implant and techniques for scoliosis and deformity pathologies. |
Our Products
The tables below group our core products with the primary market in which they are typically used and provide a summary of each technology’s features and market introduction date. Revenue from products that incorporate MESA represented 29%, 31% and 35% of our total revenue for the years ended December 31, 2015, 2014 and 2013, respectively and revenue from products that incorporate EVEREST represented 21%, 16% and 12% of our total revenue for the years ended December 31, 2015, 2014 and 2013, respectively.
Complex Spine
We define complex spine as procedures involving the placement of eight or more pedicle screws or procedures that utilize products specific to the correction of deformity, trauma or tumor conditions such as specialized fixation devices, construct extenders or connectors and corpectomy cages. Many of our products designed for use in complex spine procedures incorporate our proprietary MESA and EVEREST technologies.
|
| | | |
| Selected Products | Image | Description | Market Introduction |
MESA Deformity Spinal System | | A low-profile spinal screw technology, used during deformity correction, featuring our proprietary locking mechanism that eliminates the need for a secondary locking feature and reduces rotational force on the spine during implantation, coupled with instrumentation to address complex spine conditions. | 2006 |
| | | | |
|
| | | |
| Selected Products | Image | Description | Market Introduction |
| MESA 2 Deformity Spinal System | | Our next-generation MESA technology poised to address the most difficult correction maneuvers for complex spinal pathologies, featuring top-loading, low-profile, screws and Zero-Torque Technology. The streamlined instrumentation is designed for efficiency and speed.
| 2015 |
| | | | |
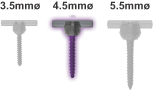
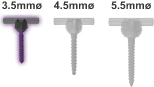
| EVEREST Deformity Spinal System | | Top-loading pedicle screw system featuring
a variety of screw types and the ability
to accommodate titanium and cobalt chrome rods
of two different diameters. The instrumentation is designed to address the most difficult correction maneuvers for complex spinal pathologies.
| 2015 |
| | | | |
NILE Alternative Fixation | | Alternative non-pedicle based fixation technology featuring low-profile, robust implants coupled with intuitive and light ergonomic instruments, to provide solution for the most complex deformity cases. | 2015 |
| | | | |
| MESA Rail Deformity Spinal System | | An innovative “beam-like” design, used with our proprietary MESA spinal systems, that aids in the restoration of spinal balance or sagittal alignment while providing enhanced rigidity and significantly greater strength as compared to existing titanium and cobalt chrome rod offerings. | 2011 |
| | | | |
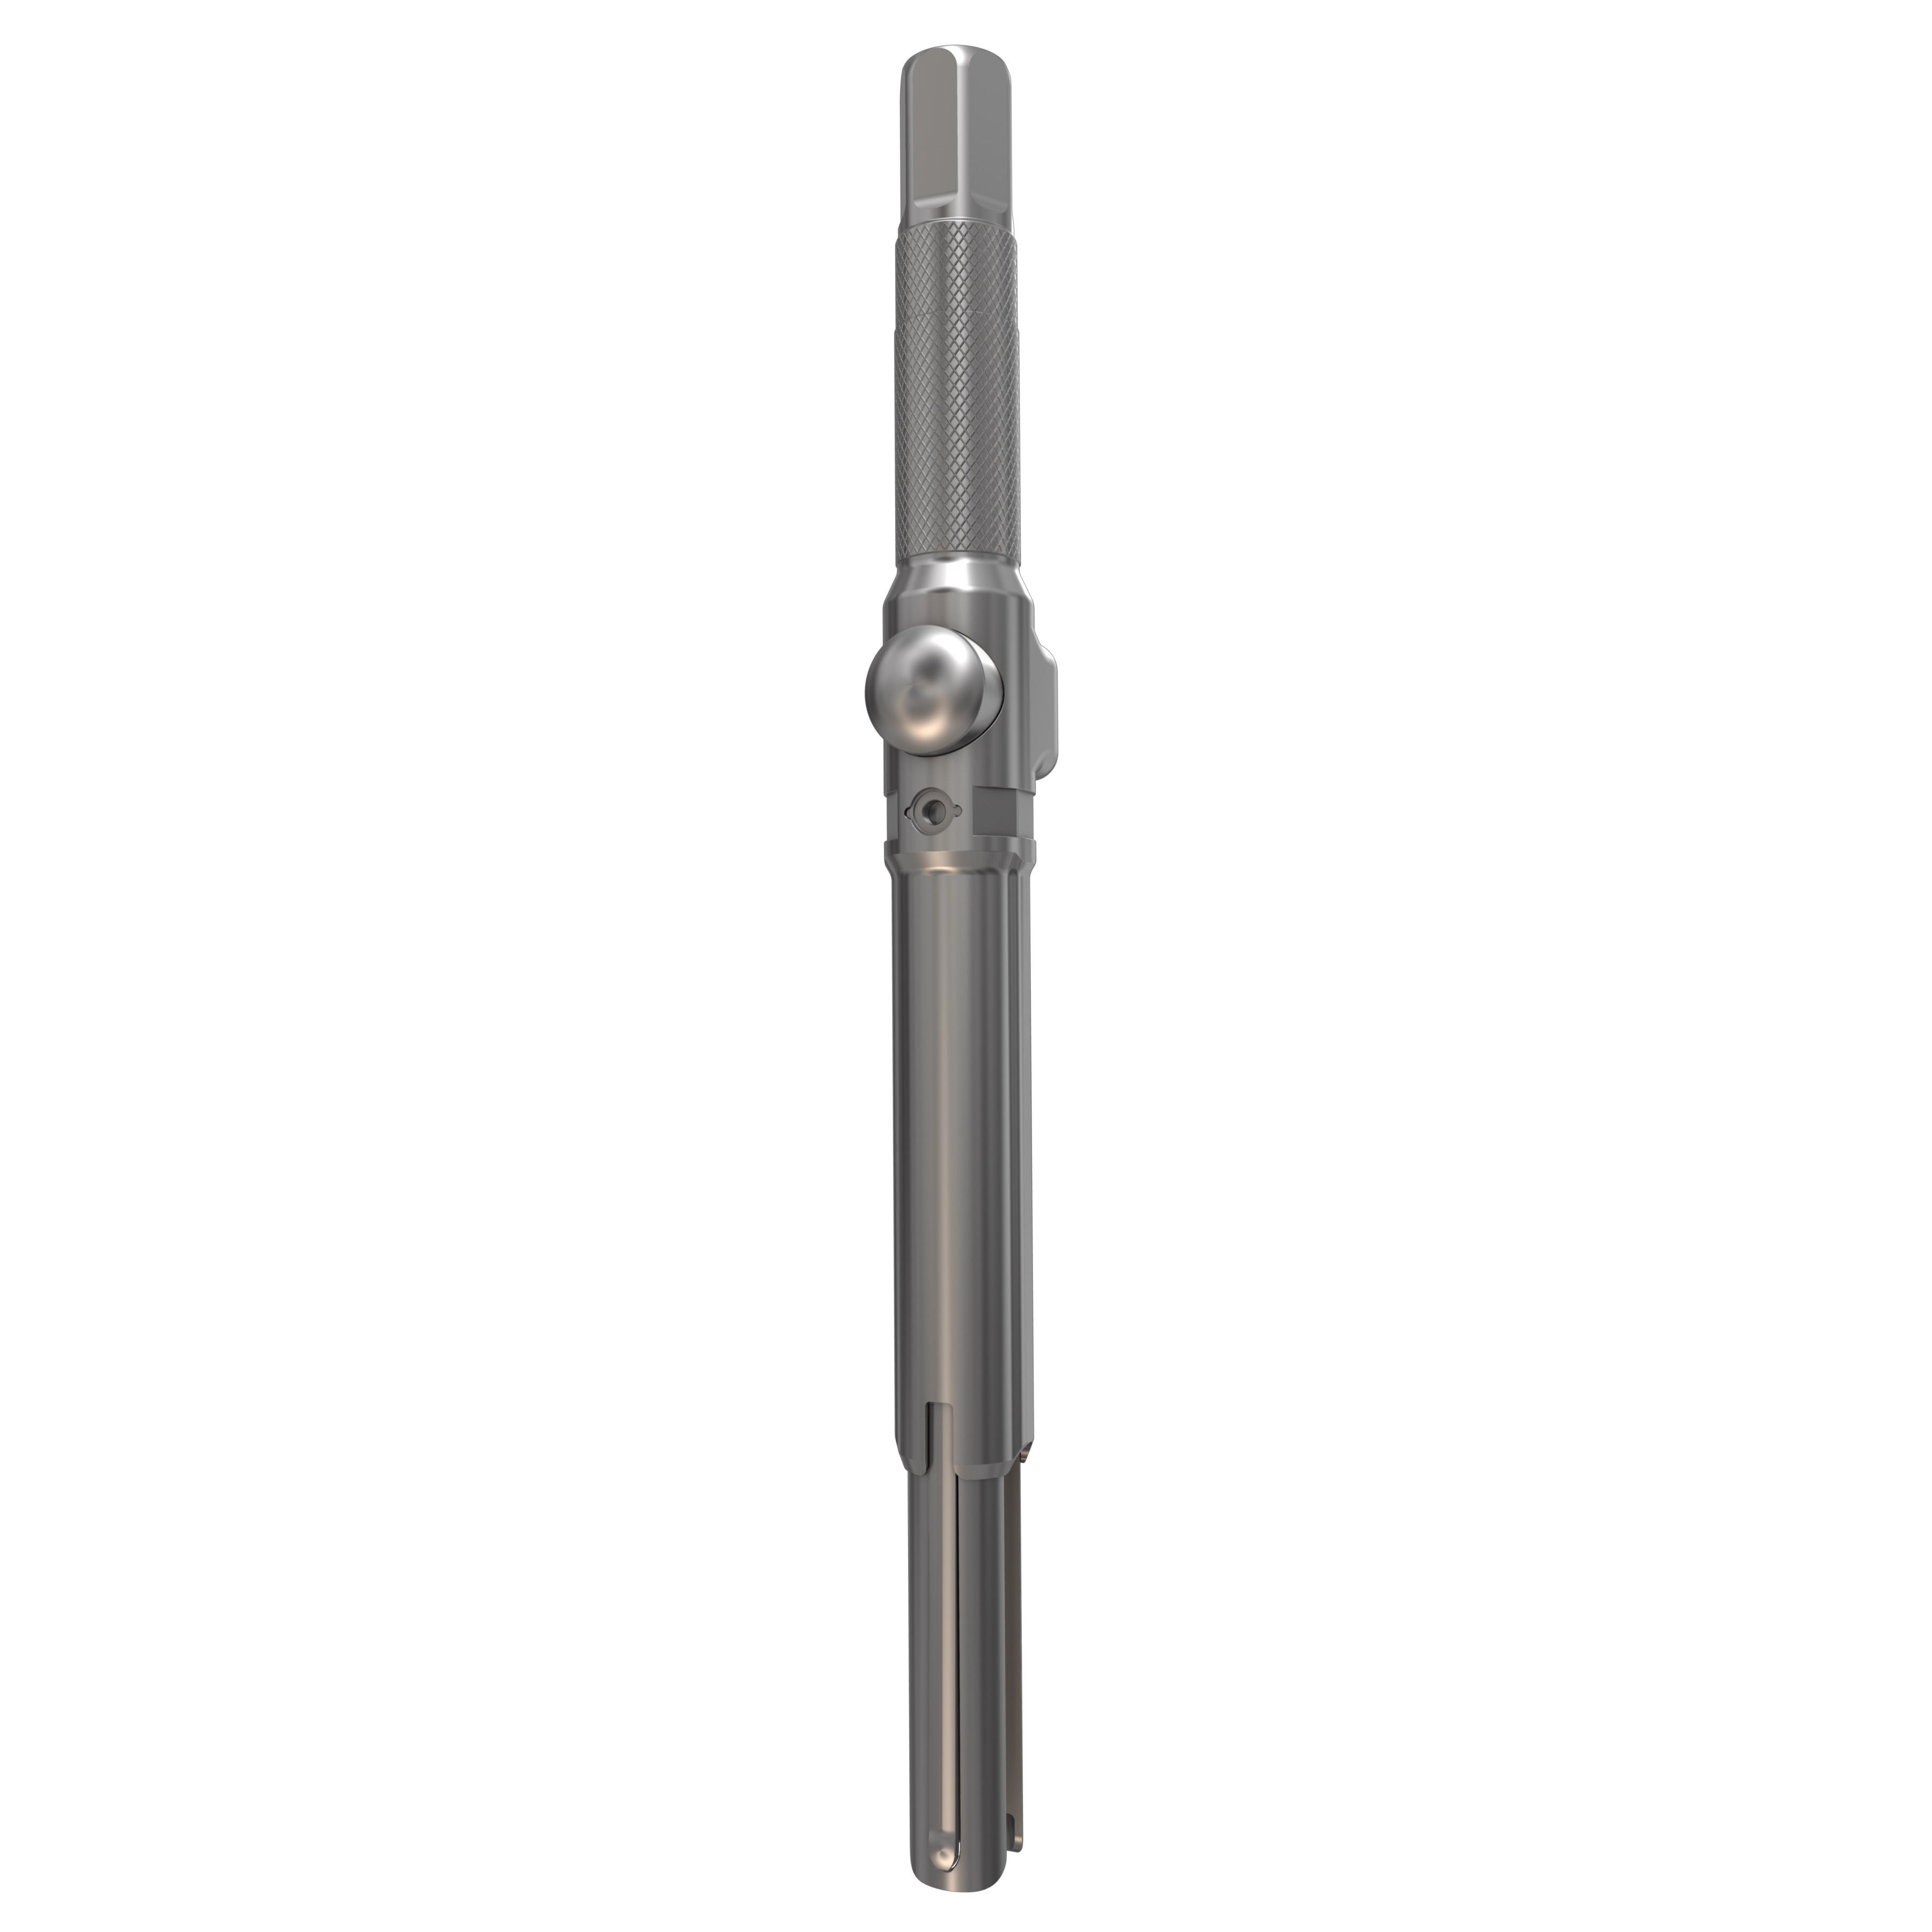
Cricket Deformity | | Spinal correction instrumentation, used with our proprietary MESA spinal screws, that provides surgeons with an innovative approach to more easily capture, manipulate and align a deformed spine as compared to traditional deformity correction instrumentation, such as threaded rod reducers or rod forks. | 2008 |
| | | | |
| Quicket Deformity | | Next generation spinal correction rod reduction instrumentation, used with our proprietary MESA spinal screws, that provides surgeons with an innovative approach to more easily capture, manipulate and align a deformed spine as compared to traditional deformity correction instrumentation.
| 2015 |
| | | | |
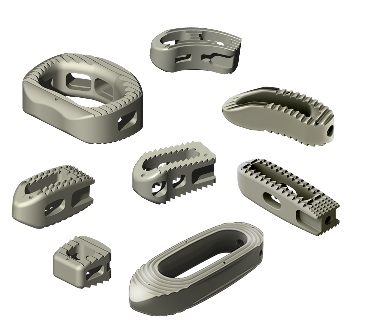
CAPRI Corpectomy Cage System | | A corpectomy cage system which provides an innovative solution for stabilization of the spine in cases of vertebral body resections resulting from trauma or tumor. Offered in various configurations, this versatile system allows for in-situ height expansion and endplate angulation. | 2015 |
| | | | |
| DENALI Deformity Spinal System | | A top loading spinal screw technology featuring off-axis screw height adjustments for ease of implant insertion. | 2006 |
|
| | | |
| Selected Products | Image | Description | Market Introduction |
| MESA Small Stature Spinal System | | A low-profile spinal screw technology, used primarily during deformity correction, featuring our proprietary locking mechanism that eliminates the need for a secondary locking feature and reduces rotational force on the spine during implantation, coupled with instrumentation to address complex spine conditions in smaller stature patients. | 2012 |
| | | | |
MESA Rail Small Stature Spinal System | | An innovative “beam-like” implant, used with our proprietary MESA spinal screws, that aids in the restoration and maintenance of spinal alignment or sagittal balance in smaller stature patients, while providing enhanced rigidity and strength as compared to existing titanium and cobalt chrome rod offerings. | 2012 |
| | | | |
MESA Mini Spinal System | | A low-profile spinal screw technology, used during deformity correction, featuring our proprietary locking mechanism that eliminates the need for a secondary locking feature and reduces rotational force on the spine during implantation, coupled with instrumentation to address complex spine conditions in the upper regions of the spine. | 2008 |
| | | | |
| SERENGETI Complex Spine Minimally Invasive Retractor System | | A minimally invasive retractor system featuring one- step placement of screws and retractors, thereby reducing the number of surgical steps, while allowing for direct visualization, improved access to the spine and specialized instrumentation to facilitate multi-level corrections of complex spine pathologies. | 2011 |
| | | | |
RAVINE Complex Spine Lateral Access System | | A minimally invasive retractor system that represents an innovative design departure from standard tubular retractors, facilitating retractor placement, positioning and fixation to the patient’s anatomy to allow for endplate to endplate visualization and multi-level alignment through a lateral access approach for large construct resection procedures. | 2013 |
| | | | |
| SANTORINI Corpectomy Cage System | | An expandable vertebral body replacement device made of biocompatible polymer (polyether ether ketone, or PEEK) for radiographic visibility that allows for intra-operative height adjustment. | 2012 |
Minimally Invasive Surgery
We define MIS technologies and techniques as spinal implants and instruments used to facilitate and treat spinal pathologies through minimally invasive approaches to the spine. These include patented technologies for a lateral approach, oblique approach and posterior access to the patient's spinal anatomy.
|
| | | |
| Selected Products | Image | Description | Market Introduction |
| SERENGETI Minimally Invasive Retractor System | | A minimally invasive retractor system featuring one-step placement of screws and retractors, thereby reducing the number of surgical steps, while allowing for direct visualization and improved access to the spine. | 2006 |
| | | | |
RAVINE Lateral Access System | | A minimally invasive retractor system that represents an innovative design departure from standard tubular retractors, facilitating retractor placement, positioning and fixation to the patient’s anatomy to allow for endplate to endplate visualization and multi-level alignment through a lateral access approach. | 2010 |
| �� | | | |
CASCADIA Lateral Interbody System
| | A 3D-printed titanium interbody device utilizing our innovative Lamellar Titanium Technology to allow the potential for both bony ongrowth and ingrowth while maintaining a high degree of radiolucency and an overall stiffness similar to PEEK. The system is designed to work in conjunction with the RAVINE Lateral Access System.
| 2015 |
| | | | |
ALEUTIAN Lateral Interbody System | | An intervertebral implant made of biocompatible polymer (PEEK) for radiographic visibility, designed to be inserted with RAVINE refractor systems to provide spinal column support through lateral MIS access. | 2010 |
| | | | |
| TERRA NOVA Minimally Invasive Access System | | A distractor blade system designed to be used in conjunction with the SERENGETI retractor systems to provide the ability to simultaneously retract tissue while distracting the intervertebral disc space to allow for decompression and access for implant insertion. | 2007 |
|
| | | |
EVEREST Minimally Invasive Spinal System | | Cannulated top-loading polyaxial pedicle screw system featuring the ability to accommodate titanium and cobalt chrome rods of two different diameters. The innovative dual-lead thread pattern allows for faster insertion and demonstrates increased pullout strength. The mixed metal tulip minimizes head splay and improves mechanical performance. | 2014 |
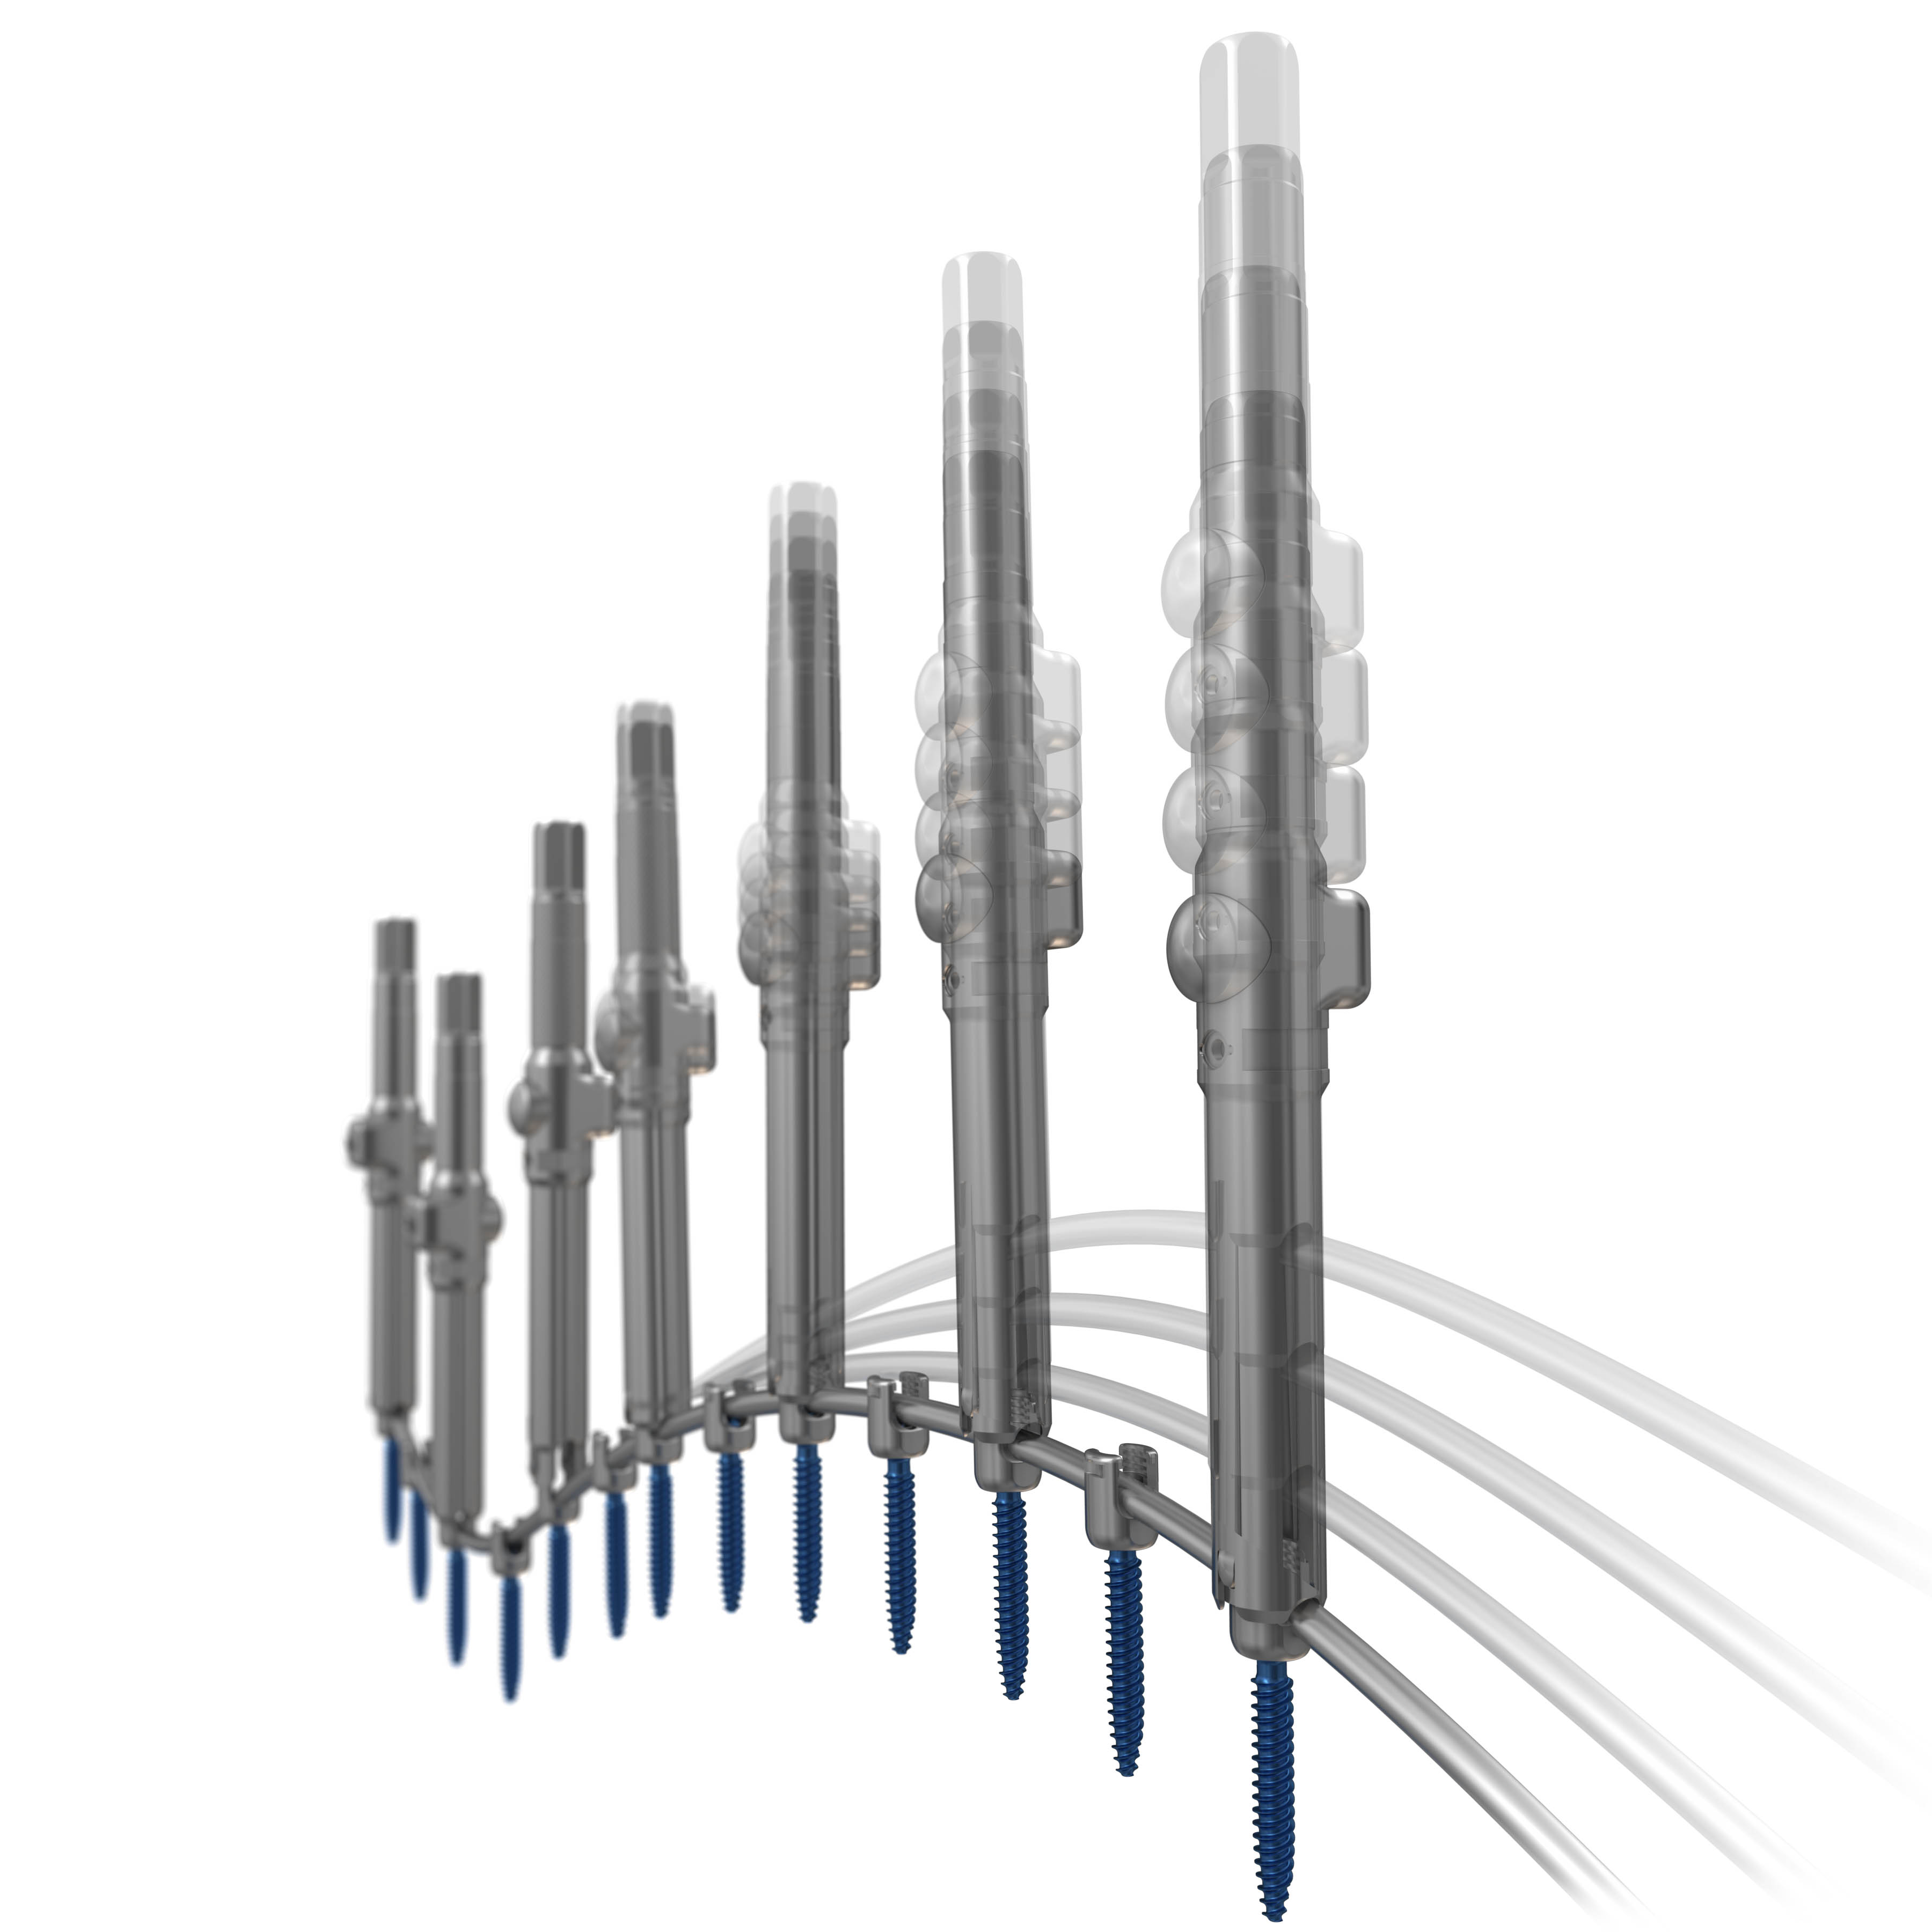
| | | | |
EVEREST Minimally Invasive XT Spinal System | | Cannulated top-loading polyaxial pedicle screw featuring rigid closed top break-off extension tabs for MI rod passage. Inner threads provide 25 mm of reduction while streamlined instrumentation provides a simple two step extension tab removal technique. The innovative dual-lead thread pattern allows for faster insertion and demonstrates increased pullout strength.
| 2016 |
Degenerative Spine
Our degenerative spine technologies are used to treat degenerative spine disorders and include products such as cervical, thoracic and lumbar spinal fusion devices and interbody devices. Many of our products designed for use in degenerative spine procedures incorporate our proprietary EVEREST technology.
|
| | | |
| Selected Products | Image | Description | Market Introduction |
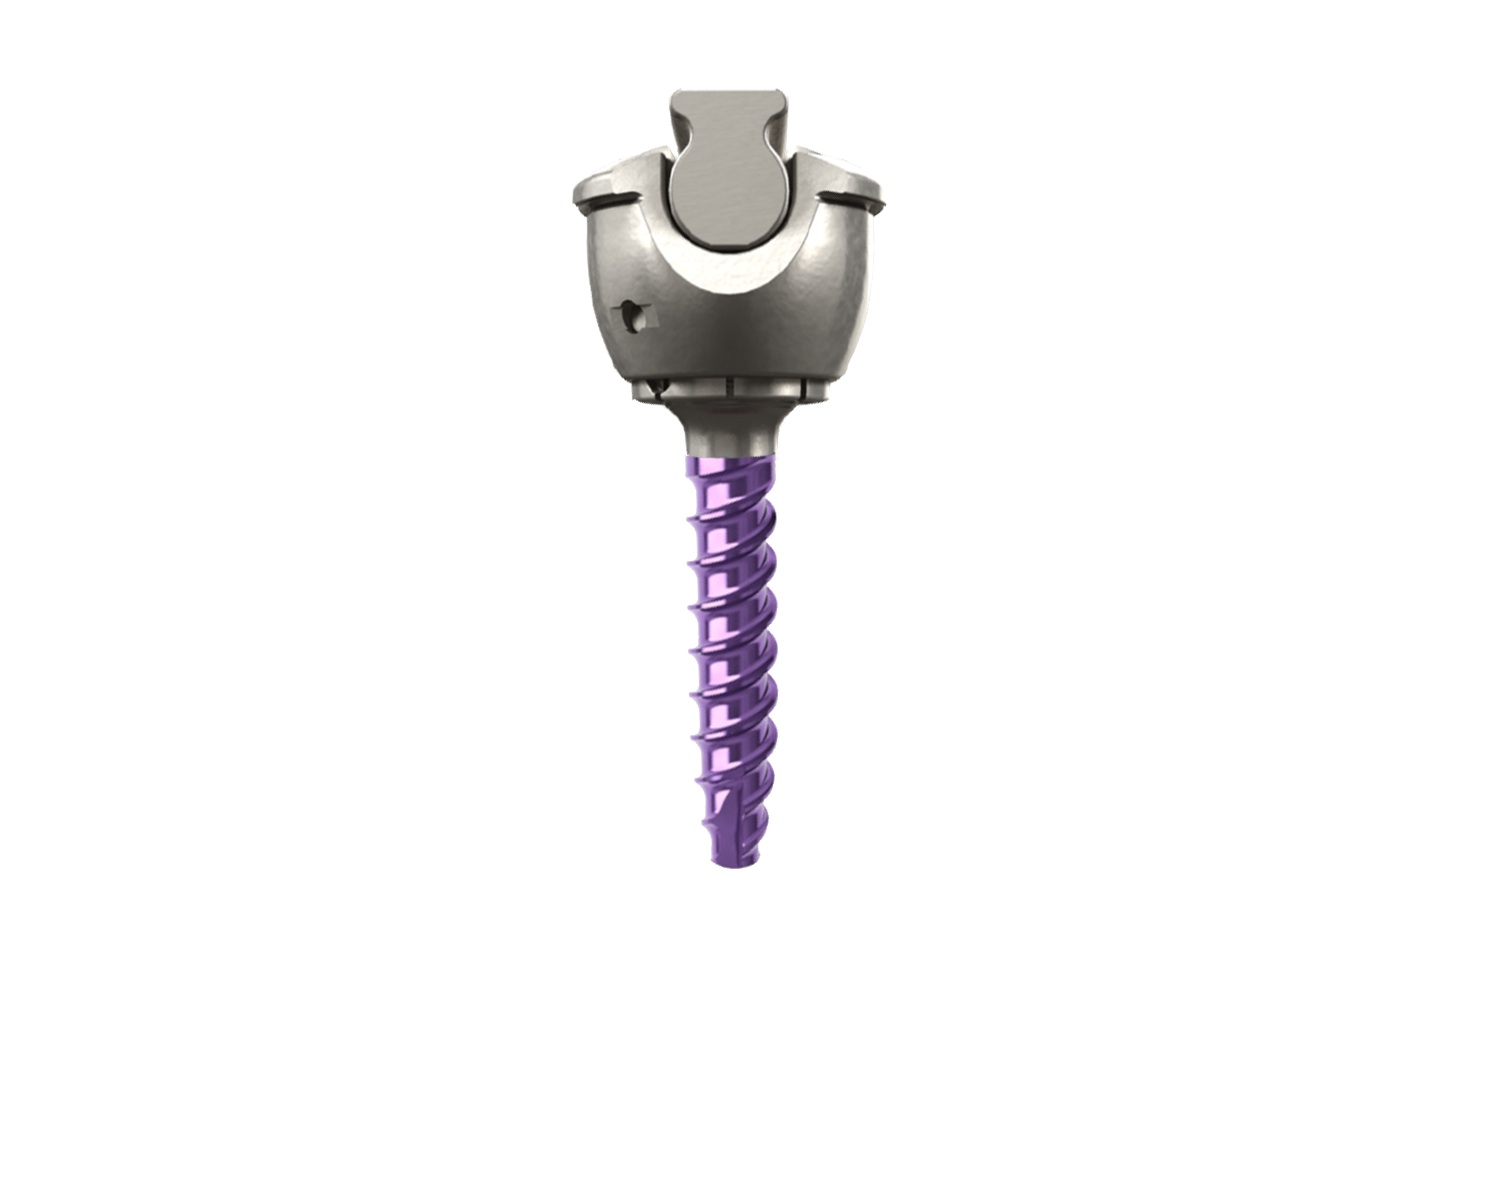
| EVEREST Degenerative Spinal System | | A spinal screw technology that we believe, based on internal testing, provides for improved insertion speed, industry-leading pull-out strength and the versatility to accommodate a variety of titanium and cobalt chrome rods of two different diameters. | 2011 |
| Selected Products | Image | Description | Market Introduction |
BaseCamp Rod Reduction Technology | | Versatile rod reduction technology which allows for controlled symmetrical and asymmetrical reduction of the vertebral body for spondylolithesis. | 2014 |
| | | | |
| CASCADIA AN and TL Interbody Systems | | 3D-printed titanium interbody devices in AN and TL configurations utilizing our innovative Lamellar Titanium Technology to allow the potential for both bony ongrowth and ingrowth while maintaining a high degree of radiolucency and an overall stiffness similar to PEEK. | 2015 |
| | | | |
| ALEUTIAN Interbody Systems | | Full range of anatomically designed intervertebral implants made of biocompatible polymer (PEEK) for radiographic visibility and use in multiple spinal applications | 2005 |
| | | | |
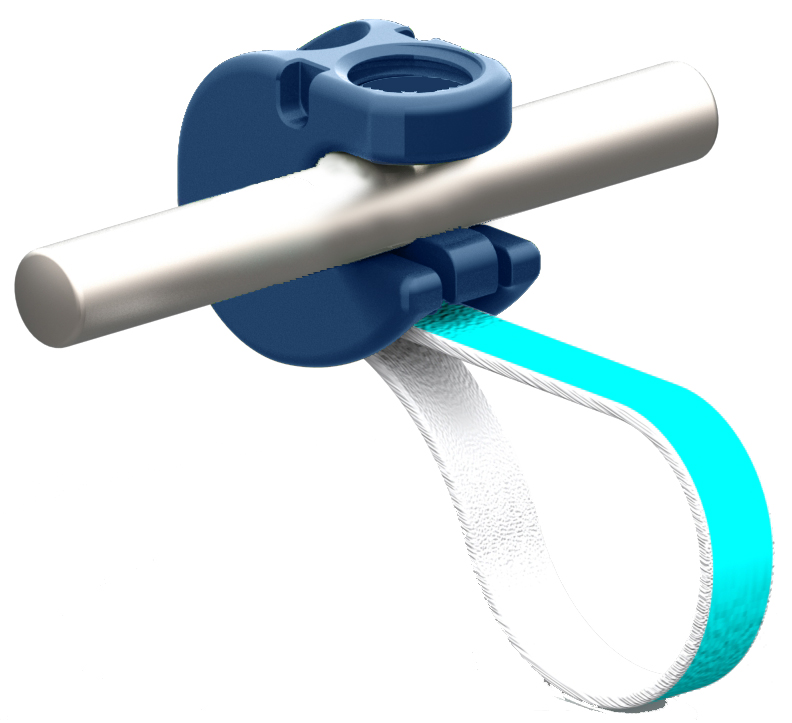
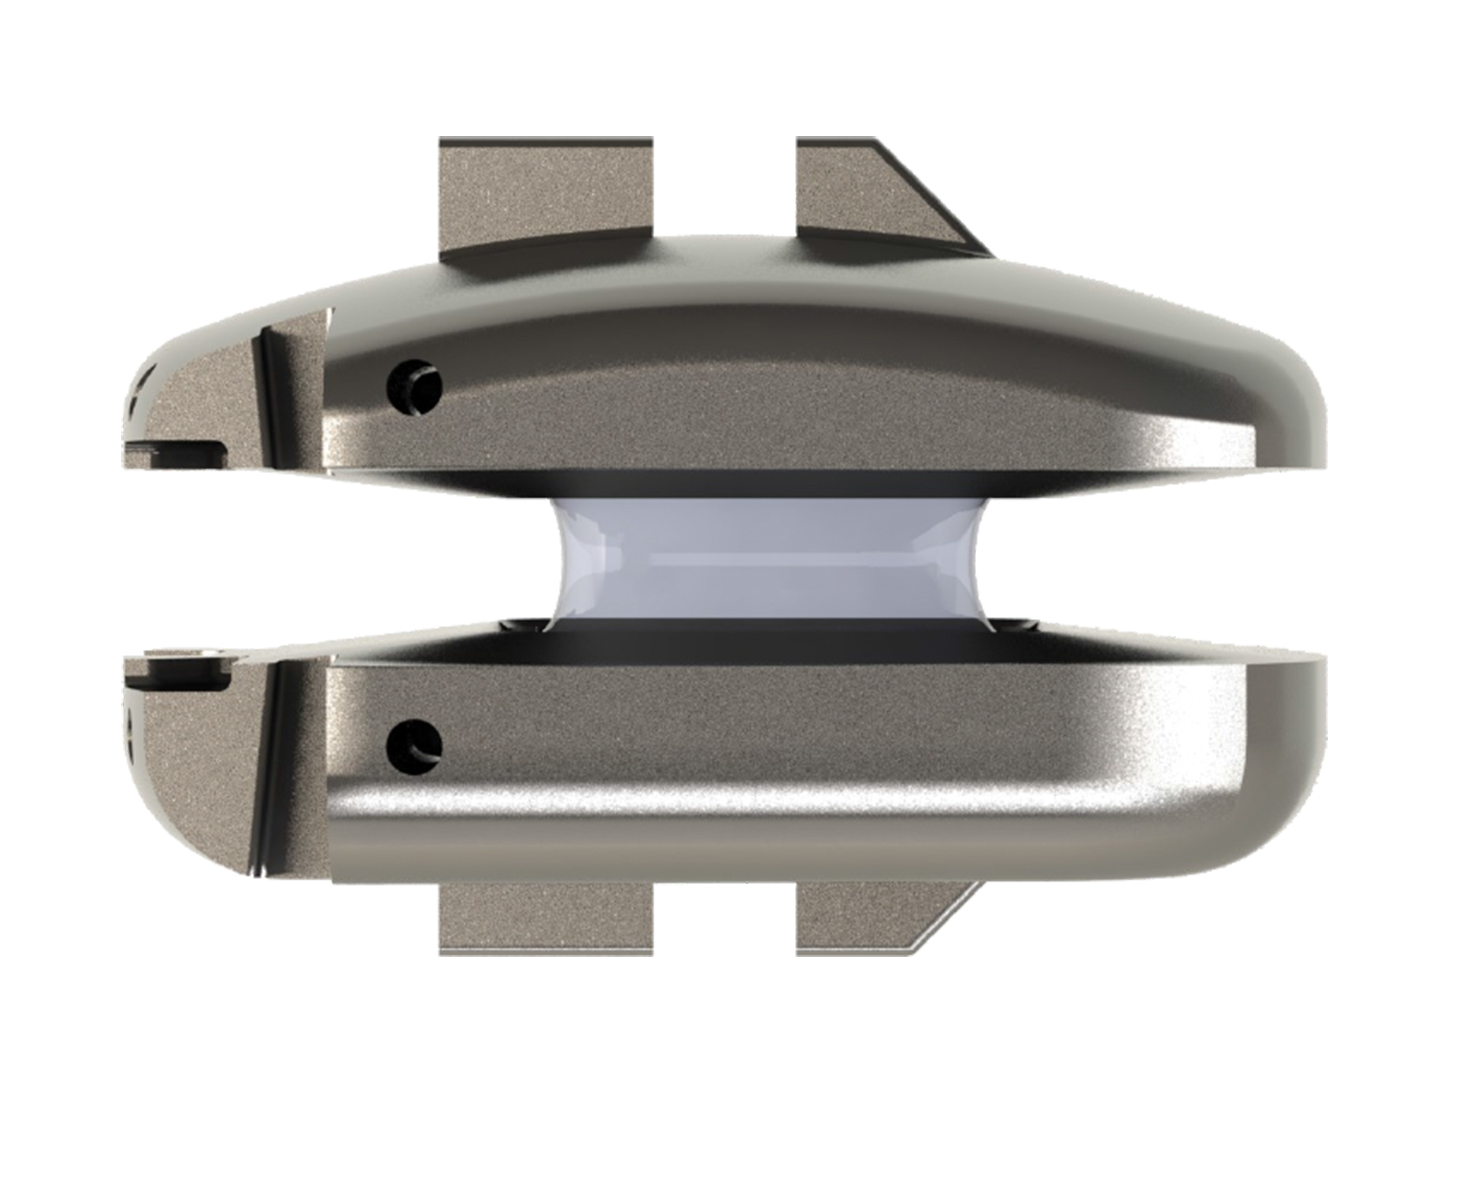
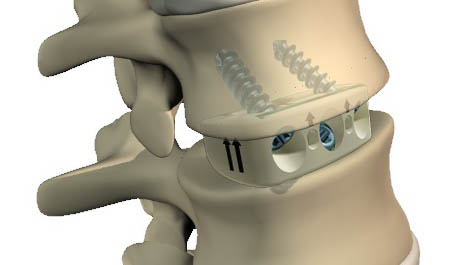
RHINE Cervical Disc System
| | Cervical disc system featuring a one-piece compressible polymer core design with dome-shaped, plasma-coated endplates and a central-split keel, with proprietary molding technology incorporated to minimize wear between the polymer core and metal titanium alloy endplates.
| 2016 |
| | | | |
| CHESAPEAKE Interbody Systems | |
Multi-screw intervertebral implants providing surgeons with the flexibility to insert screws at various angles and lock them to an implant with our tifix one-step locking mechanism to stabilize the spine while reducing the need for supplemental fixation. | 2010 |
| | | | |
|
| | | |
| Selected Products | Image | Description | Market Introduction |
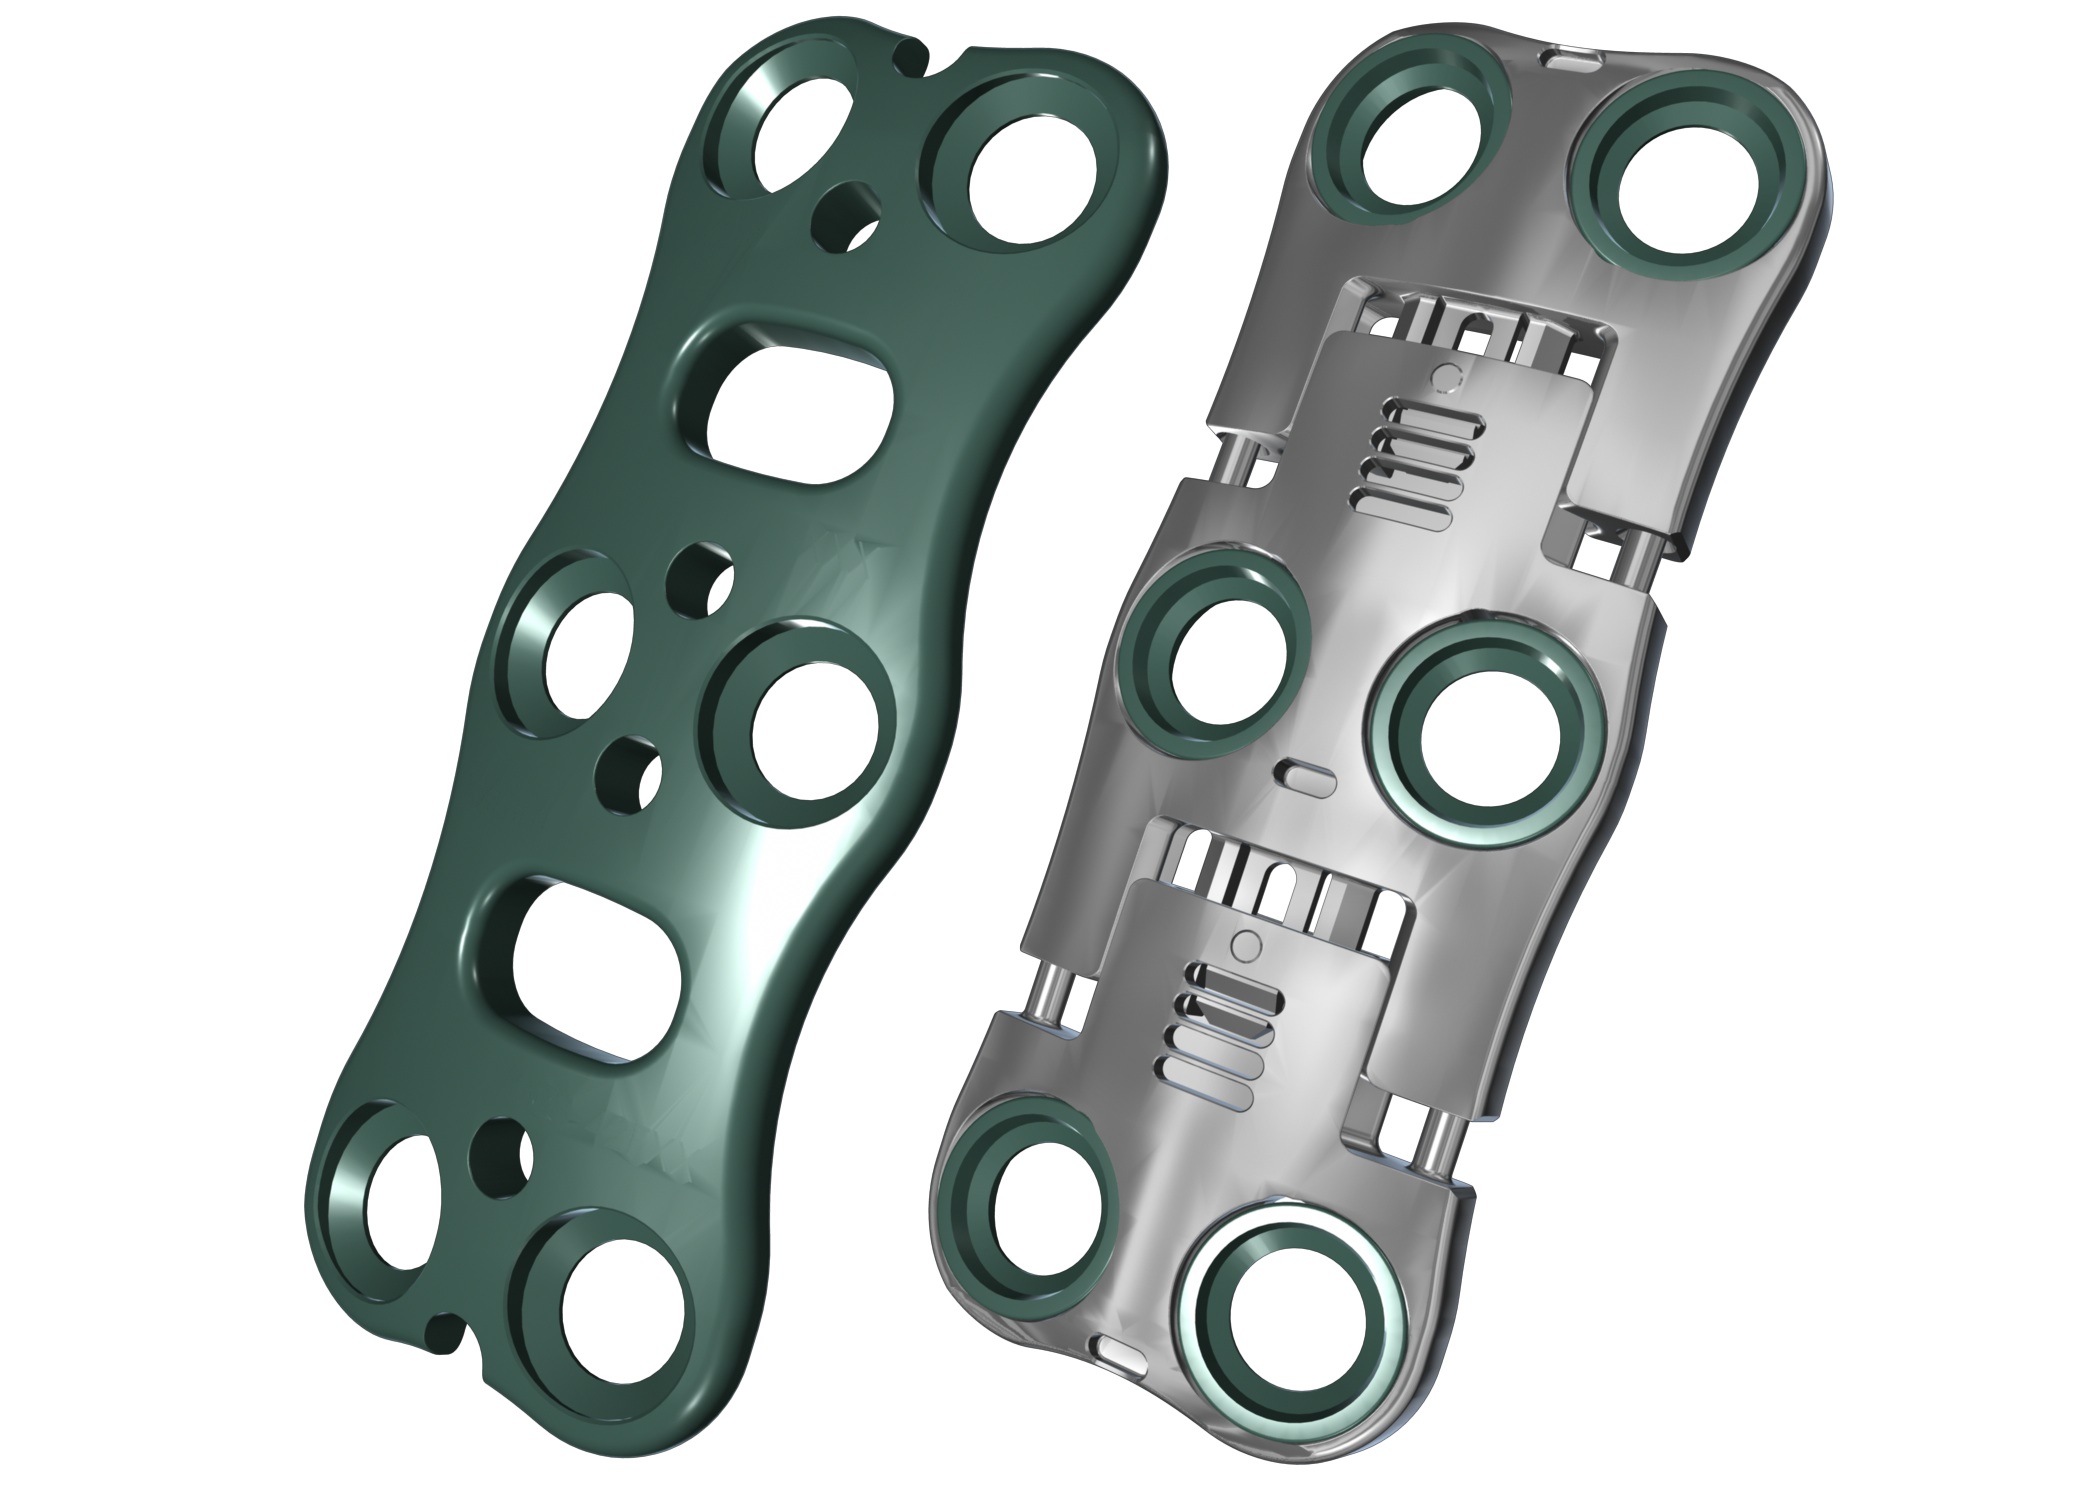
| PYRENEES Cervical Plate Systems | | Low-profile plates for treating the cervical spine that provide surgeons with the flexibility to insert screws at various angles and lock them to an implant with our tifix one-step locking mechanism. | 2005 |
| | | | |
| BLUE RIDGE Hybrid Cervical Plate System | | A plate technology for treating the cervical spine providing surgeons with the flexibility to create constrained, semi-constrained or hybrid screw constructs. | 2011 |
Product Pipeline
In addition to our comprehensive commercialized product portfolio, we plan to continue developing innovative new technologies and techniques to enhance our robust product pipeline. Our next generation product development efforts will remain focused on the complex spine and MIS markets.
In the complex spine market, we are continuing the rollout of several products, including our next-generation MESA 2 Deformity Spinal System, our NILE Alternative Fixation System, our EVEREST Deformity Spinal System and our CAPRI Corpectomy Cage System. Our product development efforts include an offering to provide a mechanical solution to treat patients suffering from proximal junctional kyphosis, or PJK, one of the most challenging post-surgical complications found in approximately 30% of deformity procedures. Our PJK product development effort is being led by a number of global key opinion leaders in complex spine surgery.
In the MIS market, we received 510(k) clearance in September 2015 and performed the first U.S. and abroad, surgical cases for our EVEREST Minimally Invasive (MI) XT Spinal System, intended for treating patients with degenerative disc disease and spondylolisthesis through a minimally invasive approach. We expect to fully launch EVEREST MI XT in 2016.
In addition to our product development efforts in complex spine and MIS, we also innovate products to address the degenerative spine market with new technologies. We recently received a CE Marking for the RHINE Cervical Disc System, our new cervical artificial disc that includes a proprietary polymeric core that provides motion and loading characteristics identified to us by spine surgeons interested in motion preservation. We expect to introduce RHINE in Europe in 2016. We will also continue to expand our CASCADIA family of interbody systems, featuring our innovative Lamellar Titanium Technology that incorporates a porous structure along with rough surfaces to allow for bony integration throughout the implant. Overall, we expect to introduce five to eight new product or product line extensions during 2016.
Research and Product Development
We have made significant investments in our product development capabilities to enhance our product lines, and believe that ongoing research and development efforts are essential to our success. Our product design teams consist of surgeon advisors, product managers, engineers and clinical and regulatory personnel who work closely together in an integrated product development process to design, enhance and validate our technologies and techniques.
These product design teams conceptualize technologies and then build and test prototypes utilizing in-house and third- party prototyping and testing facilities. As part of the development process, spine surgeons evaluate the implantation of the product in our cadaveric laboratory to ensure it meets the needs of both surgeons and patients. Prototypes are then quickly refined or redesigned as necessary based on the results of the product testing, allowing us to perform rapid iterations of the design-prototype-test development cycle.
Our regulatory and clinical affairs personnel allow us to anticipate and resolve any potential issues at early stages in the development cycle. Our regulatory and clinical affairs personnel are able to submit regulatory filings shortly after the final development testing has been completed and are committed to timely and responsive communication with regulatory agencies. We have demonstrated an ability to gain rapid regulatory approvals of our technologies.
Our research and development expense was $19.9 million, $16.3 million and $12.4 million for the years ended December 31, 2015, 2014 and 2013, respectively.
Global Spine Community Involvement, Education and Training
We devote significant resources towards global surgeon education on the proper use of our technologies and techniques. This education includes approved patient indications, contra-indications and overviews of the features and clinical benefits of our products. For example, we support local, regional, national and global educational courses, intensive hands-on cadaveric training and product-based programs that include didactic sessions coupled with hands-on-lab segments to allow surgeons to learn and experience new technologies.
We believe that our success has been, and will continue to be driven by, the quality of our products and reputation within the spine surgeon community. We collaborate with spine surgeons in various aspects of our strategy and product development. These spine surgeons are compensated pursuant to written agreements with us. These written agreements generally provide for compensation on an hourly-basis for time spent on our projects and may entitle such surgeons to royalties. We also work with surgeons and other healthcare professionals in the area of clinical research in order to gain a better understanding of the safety and efficacy of our products and support the necessary requirements for product clearances and registrations internationally.
As an active member of the global spine community, we support and maintain a presence in trade and industry organizations, including the Scoliosis Research Society and the Pediatric Orthopedic Society of North America, as well as other local, regional, national and international spine societies. At these meetings, we demonstrate the clinical benefits of our products to surgeons and generate awareness among these societies as to the clinical benefits of our innovative technologies and techniques.
We provide charitable support to the medical community and the community in general. We also provide financial and product support to international medical missions in underdeveloped countries around the world and to local community charitable causes.
Sales and Marketing
We promote, market and sell our products through a global hybrid sales organization comprised of direct sales employees, including complex spine and MIS product specialists, independent agencies and distributor partners. Our hybrid U.S. sales organization consists of 124 direct sales employees and 85 independent sales agencies. Each direct sales employee and independent sales agency is assigned a defined territory.
In 2015, international sales represented approximately 28.1% of our revenue. Our international sales organization includes over 39 direct sales employees, primarily located in the United Kingdom and Germany. In addition, we directly manage 10 independent agencies in Italy and Canada and sell to 26 distributors in certain other international markets. Combined, these international distribution efforts permit us to market and sell our products in 36 countries. To support our international sales force, we deploy a number of international market managers, who leverage product fluency and local market expertise to broaden and deepen our relationships with our independent agency and distributor partners as well as to provide a direct line of communication to our surgeon customers. Our hybrid global sales organization provides us with broad geographic coverage in regions where our products are sold, including North, Central and South America, Europe, Middle East, South Africa and Asia/Pacific. We continually evaluate new market opportunities and expect to expand our international market presence.
The contractual relationships with our independent sales agencies and distributor partners generally have terms of one to five years, with automatic renewal unless otherwise terminated. Our independent sales agents are compensated based on a commission structure while our distributor partners purchase and take title to our products and resell them to their customers. These contractual arrangements may generally be terminated by us for failure to meet certain sales quotas or minimum purchase requirements or upon breach of the agreement by the counterparty. The nature of these contractual relationships vary, with certain contracts that are exclusive, some of which have limited exceptions to the exclusivity provisions, and others that are nonexclusive.
We support the efforts of both our direct sales employees and independent agency partners through the deployment of product specialists with expertise in complex spine and MIS. These specialists provide technical expertise relating to our products and engage surgeons and hospitals directly to assist them in better understanding product capabilities, value
propositions and market trends.
We have also implemented certification programs designed to ensure a sophisticated proficiency within our global sales organization in the effective promotion, marketing and selling of our complex spine and MIS products, respectively. These certification programs include in-depth training on our products and promote a detailed proficiency in and understanding of the anatomical issues, clinical pathologies and diagnosis challenges associated with complex spine surgery and MIS technologies and techniques. We make decisions on whether to be direct or utilize independent agencies or distributor partners on a market-by-market basis using a number of parameters, including the availability of sales talent with the necessary level of spinal expertise, the reputation of the sales talent with surgeons and hospitals, the results of our compliance diligence and the overall potential of the market.
We continually evaluate and refine the performance of our global sales organization using a number of tools, including metric-driven scorecards and reviews of performance relative to budgets. Our direct sales force is compensated through a combination of base salaries, individual and company-based performance bonuses, commissions and stock-based compensation. Our independent agencies are compensated with commissions and individual-based performance bonuses. Our compensation programs are designed to balance rewarding performance, incentivizing the desired sales behaviors to align with our corporate strategy and maximizing sales force retention.
Suppliers and Raw Materials
We have a strong base of over 50 third-party suppliers located primarily in the United States, with a small number located in the European Economic Area (“EEA”), that manufacture our products. We work with these suppliers in support of our supply chain strategy, which involves minimizing our capital investment, controlling costs and shortening cycle times. We believe this allows us to compete with larger volume manufacturers of spine surgery products. We work closely with our suppliers to ensure our inventory needs are met while maintaining high quality and reliability.
We select our suppliers carefully. Our internal Quality Assurance and Supply Chain groups conduct on-site audits of our suppliers. As suppliers meet our internal quality control standards they are added to our approved supplier list. We regularly audit our suppliers to ensure they meet FDA, International Organization for Standardization (“ISO”) and other country-specific requirements as necessary. In addition, suppliers of our biomaterials products are certified by the American Association of Tissue Banks. Our Quality Assurance and Supply Chain groups conduct annual audits to ensure continued compliance with our standards; our suppliers provide a certificate of compliance with every shipment of inventory that we receive in conformance with our quality control standards. Our Quality Control group also performs incoming inspection of our products, in-process inspections and packaging and labeling inspections onsite at our headquarters facility.
We generally do not have long-term supply contracts with our suppliers and they are not required to provide us with any guaranteed minimum production levels. In most cases, we maintain redundant manufacturing capabilities for each of our products to ensure our inventory needs are met. We do, however, have single or limited source contracts with certain suppliers, who provide our biomaterials and materials for select interbody products.
We believe our supplier relationships will be able to support our potential capacity needs for the foreseeable future. To date, we have not experienced any significant difficulty locating and obtaining the suppliers or materials necessary to fulfill our production requirements.
Intellectual Property
Our success depends upon our ability to protect our intellectual property. We proactively protect our innovations by filing
U.S. and foreign patent applications, and our growing intellectual property portfolio reflects significant investment. We have also acquired intellectual property rights via the strategic purchase and license of patents from third parties to complement our internally-developed intellectual property holdings. We utilize specialist intellectual property lawyers to oversee our intellectual property assets. As of December 31, 2015, we owned 175 issued U.S. patents, 123 issued foreign patents, 127 pending U.S. patent applications and 101 pending foreign patent applications. As of December 31, 2015, we also had 28 U.S. trademark registrations, 83 foreign trademark registrations, seven pending U.S. applications to register trademarks and seven foreign applications to register trademark registrations.
We license certain technologies used in our MESA products from Spinal LLC pursuant to an exclusive license agreement, which provides us with an exclusive license to the MESA technology and related patents and patent applications to treat diseases of or injuries to the spine until the expiration of all patents licensed pursuant to the agreement, which is expected
to be in February 2024 for the material patents currently licensed under this agreement. Under this license agreement, we are required to make royalty payments equal to 6.0% of the net sales of our products that incorporate the MESA technology, subject to an annual minimum royalty payment of $0.4 million.
In addition, we license our tifix one-step locking technology from Dr. Dietmar Wolter pursuant to a license agreement, which provides us with an exclusive license to use such technology in the field of spinal surgery in the United States and a non-exclusive license to use such technology internationally until the expiration of all patents licensed pursuant to the agreement, which is expected to be in December 2019. Under the terms of this license agreement, we are required to make payments equal to 9.0% of net sales of products that incorporate tifix technology.
In 2011, we acquired certain proprietary spinal disc implant technologies that were developed and used in our recently commercialized RHINE™ Cervical Disc System, pursuant to an asset purchase agreement, which could require additional payments up to approximately $13.4 million if certain milestones are met, including milestones related to U.S. regulatory applications and approvals as of December 31, 2015. In addition, milestone payments of $0.5 million, $2.0 million and $4.0 million are due upon the achievement of net sales from products incorporating such proprietary technologies of $10.0 million, $25.0 million and $50.0 million, respectively. We will also be required to make royalty payments equal to 7.0% of net sales from patented products, up to an aggregate amount of $20.0 million.
In 2010, we acquired all rights to certain technologies used in our EVEREST pedicle screw system from Dr. John Carbone, pursuant to an asset purchase agreement, which requires us to make payments to Dr. Carbone equal to 3.5% of the net sales from EVEREST pedicle screws and 1.5% of the net sales from any of our other products that incorporate certain elements of our EVEREST screw technology until the expiration of the last to expire U.S. patent related to such technologies, which is expected to be in August 2031, or, if no U.S. patent issues, for 10 years from product launch, (except that we will have no obligation to make such payments on any sales of products made after February 23, 2031).
In 2007, we acquired all rights to certain technologies used in our SERENGETI retractor system from Dr. Josef Gorek, which requires us to make royalty payments equal to 3.0% of net sales from products that incorporate the SERENGETI retractor technology, subject to a minimum annual royalty of the greater of (1) $25 for each retractor sold or used in surgery or (2) $178,375. If we market a non-disposable reusable product incorporating the SERENGETI retractor technology, we will pay to Dr. Gorek a royalty of $25 for each use of such reusable product to place a screw implant in surgery, with a minimum royalty of $100 per surgery in which such reusable product is used. We are required to make such royalty payments on the net sales of any such product until the expiration of the last to expire U.S. patent used in the SERENGETI retractor, which is expected to be in May 2029. In the event we fail to pay the minimum royalties, and do not cure such non-payment after receiving notice of such non-payment, Dr. Gorek would have the right to have one partner other than us for the assigned intellectual property.
In 2004, we acquired all rights to certain technologies used in our DENALI pedicle screw system from Fastenetix LLC and certain other persons, pursuant to an assignment agreement, which requires us to make payments to the assignors equal to 6.0% of net sales of products that incorporate our DENALI screw technology that are covered by an issued patent or described in a patent application assigned to us under this agreement until the expiration of the last to expire patent related to such technologies, which is expected to be in February 2017, and 2.0% to 3.0% of such net sales thereafter. We are also obligated to make payments to the assignors on a product-by-product basis equal to 4.0% of net sales of products that incorporate our DENALI screw technology and that are covered by intellectual property assigned to us under this agreement other than patents and patent applications until either the expiration of the last to expire issued patent relating to such intellectual property or the abandonment of all patent applications relating to such intellectual property, and 2.0% to 3.0% of such net sales thereafter. The Fastenetix parties may have the right to re-purchase the contributed intellectual property in the event we cease operations (other than due to a sale or merger) or we enter into bankruptcy, insolvency or similar proceedings.
We also rely upon trade secrets and know-how to develop and maintain our competitive position. We protect our proprietary rights in trade secrets and know-how through a variety of methods, including confidentiality agreements and proprietary information agreements with suppliers, employees, consultants, and others who may have access to our proprietary information.
Although we believe our patents are valuable, we also believe that our knowledge and experience and our trade secret information with respect to development and manufacturing processes, materials and product design have been equally important in maintaining our proprietary product lines. As a condition of employment, we generally require employees to execute a confidentiality agreement relating to proprietary information and assignment of patents and other intellectual property to us.
Seasonality
Our revenue is typically higher in the late Spring and Summer and in the fourth quarter of our fiscal year, driven by higher sales of our complex spine products, which is influenced by the higher incidence of adolescent surgeries during these periods to coincide with the beginning of summer vacation and holiday periods, In addition, due to seasonal changes in mortality rates, some scarce tissues used in our biomaterials products may be, at times, in particularly short supply.
Competition
Our currently marketed products are, and any future products we commercialize will be, subject to intense competition. We believe that the principal competitive factors in our markets are:
| |
| • | the quality of outcomes for medical conditions affecting the spine; |
| |
| • | acceptance by spine surgeons; |
| |
| • | ease of use and reliability; |
| |
| • | technical leadership and superiority; |
| |
| • | effective marketing and distribution; |
| |
| • | product price and qualification for coverage and reimbursement. |
We also compete in the marketplace to recruit and retain qualified scientific, management and sales personnel, as well as in acquiring technologies and technology licenses complementary to our products or advantageous to our business.
We are aware of several companies that compete or are developing technologies in our current and future product areas. As a result, we expect competition to remain intense. We believe that our principal competitors include Medtronic Spine and Biologics, DePuy Synthes, Stryker, Globus Medical and NuVasive, which together represent a significant portion of the spine market. We also compete with smaller spine market participants such as Alphatec Spine, LDR Holding Corporation, Orthofix and Zimmer Biomet, who generally have a smaller market share than the principal competitors listed above.
Our ability to compete successfully will depend on our ability to develop proprietary products that reach the market in a timely manner, receive adequate coverage and reimbursement, are cost effective and are safe and effective.
Government Regulation
Our products are medical devices and tissues and therefore subject to extensive regulation by the FDA under the authority of the Federal Food, Drug and Cosmetics Act (“FDCA”) and the regulations promulgated thereunder, as well as by other domestic and international regulatory bodies. These regulations govern the following activities that we and our suppliers, licensors and partners perform and will continue to perform:
| |
| • | product design and development; |
| |
| • | premarket clearance or approval; |
| |
| • | advertising and promotion; |
| |
| • | product marketing, sales and distribution; |
| |
| • | postmarket surveillance; and |
| |
| • | postmarket adverse event reporting. |
Regulatory Clearances and Approvals
Unless an exemption applies, each medical device that we wish to commercially distribute in the United States will require prior 510(k) clearance or approval of a Pre-Market Approval Application (“PMA”) from FDA. The FDA classifies medical devices into one of three classes. Devices deemed to pose a low or moderate risk are placed in class I or II, which requires the manufacturer to submit to the FDA a 510(k) premarket notification requesting clearance for commercial distribution, unless the device type is exempt from this requirement. Devices deemed by the FDA to pose the greatest risk, such as life-sustaining, life supporting or implantable devices or devices deemed not substantially equivalent to a previously cleared 510(k) device are placed in class III, requiring submission and approval of a PMA. Both premarket clearance and approval submissions are subject to user fees, which must be paid at the time of submission for FDA review.
To obtain 510(k) clearance, we must submit a premarket notification demonstrating that the proposed device is "substantially equivalent" to a previously cleared 510(k) device or a device that was in commercial distribution before May 28, 1976 for which the FDA has not yet called for the submission of PMAs. The FDA’s 510(k) clearance pathway usually takes from three to 12 months from the date the notification is submitted, but it can take considerably longer, depending on the extent of FDA's requests for additional information and the amount of time a sponsor takes to fulfill them. FDA requests for additional information can include clinical data that the FDA determines is necessary to make a determination regarding substantial equivalence.
All of our commercial products to date have been classified as either class I or class II devices and have been cleared for marketing and distribution through the 510(k) pathway, unless exempt.
After a device receives 510(k) clearance, any modification that could significantly affect its safety or effectiveness, or that would constitute a major change in its intended use, will require a new 510(k) clearance or could require premarket approval. The FDA requires each manufacturer to make this decision initially, but the FDA can review any such decision and can disagree with a manufacturer’s determination. If the FDA disagrees with a manufacturer’s decision not to seek a new premarket clearance, the FDA can require the manufacturer to cease marketing and/or recall the modified device until 510(k) clearance or premarket approval is obtained. We have made, and plan to continue to make, product enhancements that we believe do not require new 510(k) clearances. However, if the FDA requires us to seek 510(k) clearance or premarket approval for any such modifications to previously cleared products, we may be required to cease marketing or recall the modified device until we obtain this clearance or approval, and we could be subject to significant regulatory fines or penalties.
A PMA must be submitted if a device cannot be cleared through the 510(k) clearance process. A PMA application must be supported by extensive data, including, but not limited to, technical information, preclinical data, clinical trial data, manufacturing data and labeling, to demonstrate to the FDA’s satisfaction the safety and efficacy of the device for its intended use.
Once a complete PMA application is submitted, the FDA begins an in-depth review which generally takes between one and three years, but may take significantly longer. During this review period, the FDA may request additional information or clarification of information already provided. Also during this review period, an advisory panel of experts from outside the FDA may be convened to review and evaluate the application and provide recommendations to the FDA as to the approvability of the device. In addition, the FDA will conduct a pre-approval inspection of the manufacturing facility to ensure compliance with quality system regulations. New PMA applications or supplements are required prior to marketing for product modifications that affect the safety and efficacy of the device. PMA supplements often require submission of the same type of information as a PMA application, except that the supplement is limited to information needed to support the changes to the device and may not require extensive clinical data or the convening of an advisory panel.
None of our existing products are currently approved under a PMA. In the future, we may decide to strategically
commercialize products in the U.S. that would require a PMA but we have no plans to do so at the present time.
Clinical Trials
Clinical trials are almost always required to support a PMA and are sometimes required for a 510(k) premarket notification. In the United States, these trials often require submission of an application for an investigational device exemption, or IDE, if the investigation involves a significant risk device. The IDE application must be supported by appropriate data, such as animal and laboratory testing results, showing that it is safe to test the device in humans and that the testing protocol is scientifically sound. The IDE must be approved in advance by the FDA for a specified number of patients, unless the product is deemed a non-significant risk device and is eligible for more abbreviated IDE requirements. Clinical trials for a significant risk device may begin once the IDE application is approved by the FDA and appropriate institutional review boards, or IRBs, at the clinical trial sites.
Future clinical trials of certain types of products will most likely require that we obtain an IDE from the FDA prior to commencing clinical trials and that the trial be conducted under the oversight of IRBs at the clinical trial sites. Our clinical trials must be conducted in accordance with FDA regulations and similar federal and state regulations concerning human subject protection, including requirements for informed consent, healthcare privacy and financial disclosures by the clinical investigators. The receipt of personal information in connection with our clinical trial initiatives is subject to these human subject protection laws. These laws could create liability for us if one of our research collaborators were to use or disclose research subject information without proper consent or in violation of applicable laws. A clinical trial may be suspended by the FDA or the investigational review board at any time for various reasons, including a belief that the risks to the study participants outweigh the benefits of participation in the study. Even if a study is completed, the results of our clinical testing may not demonstrate the safety and efficacy of the device, or may be equivocal or otherwise not be sufficient to obtain clearance or approval of our products. Similarly, in the EEA, conduct of clinical studies in relation to investigational medical devices is governed by detailed regulatory obligations. These include the requirement for prior authorization by the competent authorities of the country in which the study takes place and the requirement to obtain a positive opinion from a competent Ethics Committee.
Pervasive and Continuing FDA Regulation
After a device is placed on the market, numerous FDA and other regulatory requirements continue to apply. These include:
| |
| • | establishment registration and device listing with the FDA; |
| |
| • | quality system regulations, which require manufacturers to follow stringent design, testing, process control, documentation and other quality assurance procedures; |
| |
| • | labeling regulations, which prohibit the promotion of products for unapproved, i.e. “off-label,” uses and impose other restrictions on labeling; |
| |
| • | medical device reporting (MDR) regulations, which require that manufacturers report to the FDA if their device may have caused or contributed to a death or serious injury or malfunctioned in a way that would likely cause or contribute to a death or serious injury if it were to recur; |
| |
| • | corrections and removal reporting regulations, which require that manufacturers report to the FDA field corrections and product recalls or removals if undertaken to reduce a risk to health posed by the device or to remedy a violation of the FDCA that may present a risk to health; and |
| |
| • | requirements to conduct post market surveillance studies to establish continued safety data, and other post-approval conditions; and |
| |
| • | the FDA's recall authority, whereby the agency can ask, or under certain conditions order, device manufacturers to recall from the market a product that is in violation of governing laws and regulations. |
We are required to, and have, registered with the FDA and ISO as medical device manufacturers and must obtain all necessary permits and licenses to operate our business. As manufacturers, we and our suppliers are subject to announced and unannounced inspections by the FDA to determine our compliance with the QSR and other regulations. The FDA has inspected our Leesburg facility on three separate occasions: August 2006, October 2007 and January 2011. We received a
Form FDA-483 list of inspectional observations on each occasion, all of which have been closed by the FDA. We have not received any warning letters associated with any of these inspections. The FDA subsequently re-inspected our Leesburg facility in July 2015, and we did not receive a Form FDA-483 or a warning letter associated with this inspection.
Failure to comply with the applicable regulatory requirements can result in enforcement action by the FDA, which may include, among other things, any of the following sanctions:
| |
| • | warning letters, fines, injunctions, consent decrees and civil penalties; |
| |
| • | repair, replacement, refund or seizure of our products; |
| |
| • | operating restrictions, partial suspension or total shutdown of production; |
| |
| • | refusing our request for 510(k) clearance or premarket approval of new products or modifications to existing products; |
| |
| • | withdrawing or suspending clearances or approvals that are already granted; and |
International Regulations
Many foreign countries in which we market or intend to market our products have regulatory bodies and restrictions, similar to those of the FDA. International sales are subject to foreign government regulation, the requirements of which vary substantially from country to country. The time required to obtain approval in a foreign country or a CE Certificate of Conformity may be longer or shorter than that required for FDA approval and the related requirements may differ. Some third-world countries accept CE Certificates of Conformity or FDA clearance or approval as part of applications of approval for marketing of medical devices in their territory. Other countries, including Brazil, Canada, Australia and Japan, require separate regulatory filings.
In the EEA, companies compliant with ISO requirements such as the EN ISO 13485: 2003 Medical devices-Quality management systems-Requirements for regulatory purposes, benefit from a presumption of conformity with the relevant quality system requirements laid down in the Annexes to the Medical Devices Directive. This certification process requires that the Company’s quality system and facilities be inspected by a Notified Body for compliance with ISO requirements. Compliance with the ISO requirements can also facilitate market access in other jurisdictions.
We received ISO 13485 certification in November 2007, and we affix the CE Mark to our products concurrently with the 510(k) process in the U.S. We cannot assure that we or our original equipment manufacturer partners will be able to continue to obtain the necessary foreign government approvals or successfully comply with foreign regulations. Our failure to do so could hurt our business, results of operations and financial condition.
European Economic Area
In the EEA, our devices are required to comply with the Essential Requirements laid down in Annex I to the Medical Devices Directive. Compliance with these requirements entitles us to affix the CE mark to our medical devices, without which they cannot be commercialized. To demonstrate compliance with the Essential Requirements laid down in Annex I to the Medical Devices Directive and obtain the right to affix the CE mark to our medical devices, we must undergo a conformity assessment procedure, which varies according to the type of medical device and its classification. Except for low risk medical devices (Class I with no measuring function and which are not sterile), where the manufacturer can issue an EC Declaration of Conformity based on a self-assessment of the conformity of its products with the Essential Requirements laid down in the Medical Devices Directive, a conformity assessment procedure requires the intervention of a Notified Body, which is an organization designated by the competent authorities of a European Union (“EU”) country to conduct conformity assessments. Depending on the relevant conformity assessment procedure, the Notified Body would typically audit and examine products’ Technical File and the quality system for the manufacture, design and final inspection of our devices before issuing a CE Certificate of Conformity demonstrating compliance with the relevant Essential Requirements laid down in Annex I to the Medical Devices Directive. The Notified Body issues a CE Certificate of Conformity following successful completion of a conformity assessment procedure conducted in relation to the medical device and its manufacturer and their conformity with the Essential Requirements. This Certificate entitles the manufacturer to affix the CE mark to its medical devices after having prepared and signed a related EC Declaration of Conformity. We have now successfully passed annual Notified Body audits since our original certification in November
2007. Following these audits, our Notified Body issued ISO certificates and CE Certificates of Conformity allowing us to draw up an EC Declaration of Conformity and affix the CE mark of conformity to certain of our devices.
In September 2012, the European Commission adopted a Proposal for a Regulation of the European Parliament and of the Council on medical devices which will, once adopted by the European Parliament and by the Council, replace the existing Medical Devices Directive. In October 2013, the European Parliament voted on an amended draft of the Regulation and the proposed text is currently being discussed by the Trilogue (Commissions, European Parliament and Council). The expectation is that the proposals will be definitively adopted in advance of the European Parliament elections by late 2016. If it proves possible to adhere to this timeline, the Regulation on medical devices would enter into force in 2017 and become applicable three years afterward. In its current form, it would, among other things, impose additional reporting requirements on manufacturers of high risk medical devices, impose an obligation on manufacturers to appoint a “qualified person” responsible for regulatory compliance, and provide for stricter clinical evidence requirements.
Further, the advertising and promotion of our products in the EEA is subject to the provisions of the Medical Devices Directive, Directive 2006/114/EC concerning misleading and comparative advertising, and Directive 2005/29/EC on unfair commercial practices, as well as other national legislation in the EEA countries governing the advertising and promotion of medical devices. These laws may limit or restrict the advertising and promotion of our products to the general public and may impose limitations on our promotional activities with healthcare professionals.
Tissue, Cellular and Tissue Based Products
We currently distribute VIKOS machined allograft and VESUVIUS morselized products, which are manufactured by a third-party supplier. Tissue-only products are regulated by the FDA as Human Cell, Tissue and Cellular and Tissue Based Products. FDA regulations do not currently require 510(k) clearance or approval of a PMA application before marketing these products. Tissue banks must register their establishments, list products with the FDA and comply with Current Good Tissue Practices for Human Cell, Tissue and Cellular and Tissue Based Product Establishments to prevent the spread of communicable diseases and ensure other safeguards are maintained.
The FDA periodically inspects tissue processors to determine compliance with these requirements. Violations of applicable regulations noted by the FDA during facility inspections could adversely affect the continued marketing of our products. We believe we comply with all aspects of the Current Good Tissue Practices, although there can be no assurance that we will comply, or will comply on a timely basis, in the future. Entities that provide us with allograft bone tissue are responsible for performing donor recovery, donor screening and donor testing and our compliance with those aspects of the Current Good Tissue Practices regulations that regulate those functions are dependent upon the actions of these independent entities.
The procurement and transplantation of allograft bone tissue is subject to U.S. federal law pursuant to the National Organ Transplant Act, or NOTA, a criminal statute which prohibits the purchase and sale of human organs used in human transplantation, including bone and related tissue, for “valuable consideration.” NOTA permits reasonable payments associated with the removal, transportation, processing, preservation, quality control, implantation and storage of human bone tissue. With the exception of removal and implantation, we provide services in all of these areas. We make payments to vendors in consideration for the services they provide in connection with the recovery and screening of donors. Failure to comply with the requirements of NOTA could result in enforcement action against us. The procurement of human tissue is also subject to state anatomical gift acts and some states have statutes similar to NOTA. In addition, some states require that tissue processors be licensed by that state. Failure to comply with state laws could also result in enforcement action against us.
Healthcare Fraud and Abuse
Healthcare fraud and abuse laws apply to our business including when a customer submits a claim for an item or service that is reimbursed under Medicare, Medicaid or most other federally-funded healthcare programs. Companies operating in the health industry must comply with state and federal health care fraud and abuse regulations that have criminal, civil and administrative penalties for potential violations.
The federal Anti-Kickback Statute prohibits, among other things, persons from knowingly and willfully soliciting, receiving, offering or paying remuneration, directly or indirectly, in cash or in kind, to induce or reward either the referral of an individual for, or the purchase, order or recommendation of, items or services for which payment may be made, in whole or in part, under federal health care programs, such as by Medicare or Medicaid. The federal Anti-Kickback Statute is subject to evolving interpretations and has been applied by government enforcement officials to a number of common business arrangements in the medical device industry. For example, the federal government has enforced the Anti-
Kickback Statute to reach large settlements with device manufacturers based on allegedly sham consultant arrangements with physicians. A number of states also have anti-kickback laws that establish similar prohibitions that may apply to items or services reimbursed by government programs as well as any third-party payors, including commercial insurers. Further, the Affordable Care Act (ACA), among other things, clarified the intent requirements of the federal Anti-Kickback Statute and the federal criminal statute governing healthcare fraud. Specifically, a person or entity can be found to have violated the statutes without actual knowledge of these statutes or specific intent to violate them. In addition, the ACA amended the Social Security Act to provide that the government may assert that a claim for reimbursement for items or services from federal healthcare programs resulting from a violation of the federal Anti-Kickback Statute may constitute a false or fraudulent claim for purposes of the federal False Claims Act or federal civil money penalties statute potentially subjecting a company to treble damages and mandatory penalties for each false claim.
The civil False Claims Act prohibits, among other things, knowingly presenting or causing the presentation of a false, fictitious or fraudulent claim for payment of federal funds, or knowingly making, or causing to be made, a false record or statement material to a false or fraudulent claim to avoid, decrease or conceal an obligation to pay money to the federal government. Actions under the federal False Claims Act may be brought by the Attorney General or as a private citizen action (known as qui tams) brought by a private individual in the name of the government. Violations of the federal False Claims Act can result in very significant monetary penalties and treble damages. The federal government is using the False Claims Act, and the accompanying threat of significant liability, in its investigations of healthcare companies throughout the country for a wide variety of Medicare billing practices, as well as federal Anti-Kickback Statute violations and certain marketing practices, including off-label promotion, and has obtained multi-million and multi-billion dollar settlements under the federal False Claims Act in addition to individual criminal convictions under applicable criminal statutes. Given the significant size of actual and potential settlements, it is expected that the government will continue to devote substantial resources to investigating healthcare providers’ and suppliers’ compliance with the healthcare reimbursement rules and fraud and abuse laws.
The federal False Claims Act amendments in 2009 and 2010 expanded the scope of the liability for health care entities generally to potentially reach violations of regulatory duties, such as good manufacturing practices. There have been large settlements in the life sciences arena related to FDA regulatory violations related to promotional activities and the failure to maintain good manufacturing practices.
Even in instances where a company may have no actual liability, the federal False Claims Act private citizen provisions (qui tam) allow the filing of federal False Claims Act actions under seal and impose a mandatory duty on the U.S. Department of Justice to investigate such allegations. Most private citizen actions are declined by the Department of Justice or dismissed by federal courts. However, the investigation costs for a company can be significant and material even if the allegations are without merit.
Federal False Claims Act liability is potentially significant in the health industry because the statute provides for treble damages and mandatory minimum penalties of $5,500 to $11,000 per false claim or statement. Because of the potential for large monetary exposure, health care companies resolve allegations without admissions of liability for significant and material amounts to avoid the uncertainty of treble damages that may awarded in litigation proceedings. Many state jurisdictions have implemented state false claims act statutes that mirror the federal statute.
In addition to civil False Claims Act liability and anti-kickback liability, there are several criminal and administrative health care fraud statutes that provide for criminal and civil monetary penalties and the potential for exclusion from federal health care programs.
If a governmental authority were to conclude that we are not in compliance with applicable laws and regulations, we and our officers and employees could be subject to severe criminal and civil penalties, including, for example, exclusion from participation as a supplier of product to beneficiaries covered by Medicare, Medicaid and other federal health care programs.
Reimbursement Overview
Healthcare providers in the United States generally rely on third-party payors, principally private insurers and governmental payors such as Medicare and Medicaid, to cover and reimburse all or part of the cost of a spine surgery in which our products are used. We expect that sales volumes and prices of our products will continue to depend in large part on the availability of coverage and reimbursement from such third-party payors. Third-party payors perform analyses on new technologies to determine if they are medically necessary before providing coverage for them. These third-party payors may still deny reimbursement on covered technologies if they determine that a device used in a procedure was not used in accordance with the payor’s coverage policy. Particularly in the United States, third-party payors continue to carefully review, and increasingly challenge, the prices charged for procedures and medical products.
Medicare coverage and reimbursement policies are developed by the Centers for Medicare and Medicaid Services (“CMS”) and its contractors. CMS establishes Medicare coverage and reimbursement policies for medical products and procedures and such policies are periodically reviewed and updated. While private payors vary in their coverage and payment policies, most look upon the coverage and payment by Medicare as a benchmark by which to make their own coverage decisions. Medicare reimbursement rates for the same or similar procedures vary due to geographic location, nature of the facility in which the procedure is performed (i.e., teaching or community hospital) and other factors.
In the United States, a large percentage of insured individuals receive their medical care through managed care programs, which monitor and often require pre-approval of the services that a member will receive. Some managed care programs pay their providers on a per capita basis, which puts the providers at financial risk for the services provided to their patients by paying these providers a predetermined payment per member per month and, consequently, may limit the willingness of these providers to use our products.
The indications for surgical treatment of complex spine disorders such as deformity are defined by anatomical angle measurements that are established and well defined among hospitals, physicians and third-party payors. Conversely, fusion procedures for degenerative conditions are typically indicated when the source of the patient’s pain originates from the vertebral level in question and a diagnostic confirmation of degenerative disc disease is made. Current techniques to identify the source of a patient’s degenerative back pain are imprecise and it may be difficult to locate the source of pain. Third-party payors typically require a confirmed diagnosis of degenerative disc disease in order to reimburse for surgical procedures. We believe complex spine procedures typically receive a higher rate of positive insurance coverage as compared to degenerative procedures.
We believe that the overall escalating cost of medical products and services has led to, and will continue to lead to, increased pressures on the healthcare industry to reduce the costs of products and services. We cannot assure you that government or private third-party payors will cover and reimburse the procedures using our products in whole or in part in the future or that payment rates will be adequate. In addition, it is possible that future legislation, regulation or coverage and reimbursement policies of third-party payors will adversely affect the demand for our products or our ability to sell them on a profitable basis.
Internationally, reimbursement and healthcare payment systems vary substantially from country to country and include single-payor, government-managed systems as well as systems in which private payors and government managed systems exist side-by-side. Our ability to achieve market acceptance or significant sales volume in international markets we enter will be dependent in large part on the availability of reimbursement for procedures performed using our products under the healthcare payment systems in such markets. A number of countries may require us to gather additional clinical data before recognizing coverage and reimbursement for our products. It is our intent to complete the requisite clinical studies and obtain coverage and reimbursement approval in countries where it makes economic sense to do so.
Employees
As of December 31, 2015, we had 481 full time employees, 79 of whom were engaged in product research and development, 63 in general administrative and accounting activities, and 207 in sales, marketing and product development activities. Of our employees, 286 work out of our corporate headquarters in Leesburg, Virginia and 7 employees work in our machine shop operation located in Malvern, Pennsylvania. Domestic employees not located in our corporate headquarters or our Malvern, Pennsylvania facility are primarily direct sales employees and work from home offices or branch offices. Branch offices serve the Central Plains (Kansas), Chicago, Cincinnati, Dallas, Georgia, Iowa, Jacksonville, Miami, New England, Philadelphia, Pittsburgh, Sacramento, St. Louis, Great Lakes, Upstate New York and Western Michigan markets.
Internationally, we had 60 employees based in eight countries, with international offices located in the United Kingdom, Germany and Italy, as of December 31, 2015.
Our employees are not unionized and we consider our relationship with our employees to be good.
ITEM 1A. RISK FACTORS
Investing in our common stock involves a high degree of risk. You should consider carefully the risks and uncertainties described below and the other information contained in this report, including our consolidated financial statements and the related notes.
Risks Related to Our Business and Our Industry
We have incurred losses in the past and may not be able to achieve or sustain profitability in the future.
We have incurred losses in most fiscal years since inception. We incurred net losses of $39.2 million, $59.6 million and $37.9 million in 2015, 2014 and 2013, respectively. As a result of ongoing losses, we had an accumulated deficit of $169.4 million at December 31, 2015. We expect to continue to incur significant product development, clinical and regulatory, sales and marketing and other expenses. We will need to generate significant additional revenue to achieve and maintain profitability, and even if we achieve profitability, we cannot be sure that we will remain profitable for any substantial period of time. Our failure to achieve or maintain profitability could negatively impact the value of our common stock.
We must continue to successfully demonstrate to spine surgeons the merits of our technologies and techniques compared to those of our competitors.
Spine surgeons play a significant role in determining the course of treatment and, ultimately, the type of product that will be used to treat a patient. As a result, our success depends, in large part, on effectively marketing to them. In order for us to sell our products, we must continue to successfully demonstrate to spine surgeons the merits of our technologies and techniques compared to those of our competitors for use in treating patients with spinal pathologies. Acceptance of our products depends on educating spine surgeons as to the distinctive characteristics, perceived benefits, safety, ease of use and cost-effectiveness of our products as compared to our competitors’ products, and on educating spine surgeons in the proper application of our products. If we are not successful in convincing spine surgeons of the merits of our products or educating them on the use of our products, they may not use our products and we may be unable to increase our sales, sustain our growth or achieve profitability.
Furthermore, we believe many spine surgeons may be hesitant to adopt certain products unless they determine, based on experience, clinical data and published peer-reviewed journal articles, that our complex spine products, MIS technologies and techniques and degenerative products provide benefits or are an attractive alternative to existing treatments of spine disorders. Surgeons may be hesitant to change their medical treatment practices for the following reasons, among others:
| |
| • | lack of experience with our technologies; |
| |
| • | existing relationships with competitors and sales representatives that sell competitive products; |
| |
| • | lack or perceived lack of evidence supporting additional patient benefits; |
| |
| • | perceived liability risks generally associated with the use of new products and procedures; |
| |
| • | less attractive availability of coverage and reimbursement within healthcare payment systems compared to other products and techniques; |
| |
| • | costs associated with the purchase of new products and equipment; and |
| |
| • | the time commitment that may be required for training. |
In addition, we believe recommendations and support of our products by influential spine surgeons are essential for market acceptance and adoption. If we do not receive support from such surgeons or long-term data does not show the benefits of using our products, surgeons may not use our products. In such circumstances, we may not achieve expected sales or profitability.
Pricing pressure from our competitors, hospitals and changes in third-party coverage and reimbursement may impact our ability to sell our products at prices necessary to support our current business strategies.
Competition in the spinal surgery industry has increased as a result of new market entrants, new technologies and as more established companies have intensified competitive pricing pressure. As a result of these competitive forces, we believe there will be increased pricing pressure in the future. Because our products are generally purchased by hospitals that
typically bill various third-party payors, changes in the purchasing behavior of such hospitals or the amount such payors are willing to reimburse our customers for procedures using our products, including as a result of healthcare reform initiatives, could create additional pricing pressure on us. In addition to these competitive forces, we continue to see pricing pressure as hospitals introduce new pricing structures into their contracts and agreements, including fixed price formulas, capitated pricing and construct pricing intended to contain healthcare costs. Such trends continue to drive down the prices we are able to charge for our products, our profit margins will shrink, which may adversely affect our ability to invest in and grow our business.
We operate in a highly competitive market and we must continue to develop and commercialize new products or our revenues may decline. If our competitors develop and commercialize products that are safer, more effective, less costly or otherwise more attractive than our products, our ability to generate revenue may be reduced or eliminated.
Our currently marketed products are, and any future products we develop and commercialize will be, subject to intense competition. The spinal surgery industry is intensely competitive, subject to rapid change and highly sensitive to the introduction of new products or other market activities of industry participants. Our ability to compete successfully will depend on our ability to develop products that reach the market in a timely manner, receive adequate coverage and reimbursement from third-party payors, and are safer, less invasive and more effective than competing products and treatments. Because of the size of the potential market, we anticipate that companies will dedicate significant resources to developing competing products.
We are aware of several companies that compete or are developing technologies in our current and future product areas. As a result, we expect competition to remain intense. We believe that our principal competitors include Medtronic Spine and Biologics, DePuy Synthes, Stryker, Globus Medical and NuVasive, which together represent a significant portion of the spinal surgery market. We also compete with smaller spinal surgery market participants such as Alphatec Spine, LDR Holding Corporation, Orthofix and Zimmer Biomet, whose products generally have a smaller market share than the principal competitors listed above. At any time, these and other potential market entrants may develop new devices or treatment alternatives that may render our products obsolete or uncompetitive. In addition, they may gain a market advantage by developing and patenting competitive products or processes earlier than we can or by obtaining regulatory clearances or market registrations more rapidly than we can. Many of our current and potential competitors have substantially greater sales and financial resources than we do. In addition, these companies may have more established distribution networks, entrenched relationships with surgeons and greater experience in launching, marketing, distributing and selling products.
In addition, new market participants continue to enter the spinal surgery industry. Many of these new competitors specialize in a specific product or focus on a particular market sector, making it more difficult for us to increase our overall market position. The frequent introduction by competitors of products that are or claim to be superior to our products or that are alternatives to our existing or planned products may also create market confusion that may make it difficult to differentiate the benefits of our products over competing products. In addition, the entry of multiple new products and competitors may lead some of our competitors to employ pricing strategies that could adversely affect the pricing of our products and pricing in the spinal surgery market generally.
Spine surgeons often contribute to the decisions as to whether hospitals purchase our products, and we believe that many spine surgeons are highly sensitive to technological change and to the commercial reputation of spinal product companies. Accordingly, we believe that many spine surgeons actively seek new technologies and devote special attention to companies they perceive to have novel and innovative solutions to surgical challenges. As a result, we believe that we must continue to develop and commercialize innovative new products or our existing customers may decrease their purchases from us and instead purchase products from companies perceived by them to be more innovative. In order to develop innovative products, we must attract and retain talented and experienced engineers and management personnel, have productive dialogues with practicing spine surgeons and hospital purchasing administrations and have adequate capital to fund research and development efforts. If we fail to deliver innovative products to the market, our future revenue may be reduced and our stock price may decline.
In addition, we face a particular challenge overcoming the long-standing practices by some spine surgeons of using the products of our larger, more established competitors. Spine surgeons who have completed many successful, complex surgeries using the products made by these competitors may be disinclined to try new products from a source with which they are less familiar. If these spine surgeons do not try our products, then our revenue growth may slow or decline and our stock price may decline.
Our competitors may also develop and patent processes or products earlier than we can or obtain regulatory clearance,
approval or CE Certificates of Conformity for competing products more rapidly than we can, which could impair our ability to develop and commercialize similar processes or products. We also compete with our competitors in establishing clinical trial sites and patient enrollment in clinical trials, as well as in acquiring technologies and technology licenses complementary to our products or advantageous to our business. In addition, we compete with our competitors to engage the services of sales agencies and independent distributors, both those presently working with us and those with whom we hope to work as we expand.
Many of our competitors have greater resources than we have.
Many of our current and potential competitors are major medical device companies that have substantially greater financial, technical and marketing resources than we do. Many of these current and potential competitors are publicly traded or are divisions of publicly-traded companies, which enjoy several competitive advantages, including:
| |
| • | greater financial and human resources for product development, sales and marketing and patent litigation; |
| |
| • | significantly greater name recognition; |
| |
| • | established relationships with spine surgeons, hospitals and third-party payors; |
| |
| • | more expansive portfolios of intellectual property rights; |
| |
| • | broader product range and ability to cross-sell their products or offer rebates or bundle products to incentivize hospitals or surgeons to use their products; |
| |
| • | products supported by long-term clinical data; |
| |
| • | large and established sales and marketing and distribution networks; and |
| |
| • | greater experience in conducting research and development, manufacturing, clinical trials, preparing regulatory submissions and obtaining regulatory clearance, approval or CE Certificates of Conformity for products and marketing approved products. |
Aggregation of hospital purchasing from collaboration and consolidation may lead to demands for price concessions or to the exclusion of some suppliers from certain market opportunities, which could have an adverse effect on our business, results of operations or financial condition.
Because healthcare costs have risen significantly over the past decade, numerous initiatives and reforms initiated by legislators, regulators and third-party payors to curb these costs have resulted in a consolidation trend in the healthcare industry to aggregate purchasing power. As the healthcare industry consolidates, competition to provide products and services to industry participants has become more intense and may intensify. This in turn has resulted and will likely continue to result in greater pricing pressures or the exclusion of certain suppliers from certain market opportunities as group purchasing organizations, independent delivery networks and large single accounts continue to use their market power to consolidate purchasing decisions. In addition, such consolidation may lead these organizations to limit their number of suppliers. We expect that market demand, government regulation, third-party coverage and reimbursement policies and societal pressures will continue to impact the healthcare industry, resulting in further business consolidations and alliances among our customers, which may exert further downward pressure on the prices of our products and may adversely impact our business, results of operations or financial condition.
If hospitals and other healthcare providers are unable to obtain adequate coverage and reimbursement for procedures performed using our products, it is unlikely that our products will gain widespread acceptance.
Maintaining and growing sales of our products depends on the availability of adequate coverage and reimbursement from third-party payors, including government programs, such as Medicare and Medicaid, private insurance plans and managed care programs. Hospitals and other healthcare providers that purchase products, such as the ones that we manufacture, generally rely on third-party payors to pay for all or part of the costs and fees associated with the procedures performed with these products. The existence of adequate coverage and reimbursement for the procedures performed with our products by government and private insurance plans is central to the acceptance of our current and future products. We may be unable to sell our products on a profitable basis if third-party payors deny coverage or reduce their current levels of payment, or if our costs increase faster than increases in reimbursement levels. In the United States, many private payors
use coverage decisions and payment amounts determined by the Centers for Medicare and Medicaid Services, or CMS, which administers the Medicare program, as guidelines in setting their coverage and reimbursement policies. Future action by CMS or other government agencies may diminish payments to physicians, outpatient centers and/or hospitals. Those private payors that do not follow the Medicare guidelines may adopt different coverage and reimbursement policies for procedures performed with our products. For some governmental programs, such as Medicaid, coverage and reimbursement differ from state to state, and some state Medicaid programs may not pay an adequate amount for the procedures performed with our products, if any payment is made at all. As the portion of the U.S. population over the age of 65 and eligible for Medicare continues to grow, we may be more vulnerable to coverage and reimbursement limitations imposed by CMS. Furthermore, the healthcare industry in the United States has experienced a trend toward cost containment as government and private insurers seek to control healthcare costs by imposing lower payment rates and negotiating reduced contract rates with service providers. Therefore, we cannot be certain that the procedures performed with our products will be reimbursed at a cost-effective level. Accordingly, even if our products and procedures using our products are currently covered and reimbursed by third-party payors, adverse changes in payors’ coverage and reimbursement policies that affect our products would harm our ability to market and sell our products and adversely impact our business, results of operations or financial condition.
Moreover, we are unable to predict what changes will be made to the reimbursement methodologies used by third-party payors. We cannot be certain that under current and future payment systems, in which healthcare providers may be reimbursed a set amount based on the type of procedure performed, such as those used by Medicare and in many privately managed care systems, the cost of our products will be properly reflected and incorporated into the overall cost of the procedure.
In addition, as we continue to expand into international markets, market acceptance may depend, in part, upon the availability of coverage and reimbursement within prevailing healthcare payment systems. Reimbursement and healthcare payment systems in international markets such as in the EEA, which is comprised of the 28 Member States of the EU, Iceland, Liechtenstein and Norway, vary significantly by country, and include both government-sponsored healthcare and private insurance. We may not obtain international coverage and reimbursement approvals in a timely manner, if at all. Our failure to receive such approvals, and any adverse changes in coverage and the reimbursement policies of foreign third-party payors, would negatively impact market acceptance of our products in such international markets.
The safety and efficacy of our products is not yet supported by long-term clinical data, which could limit sales, and our products might therefore prove to be less safe and effective than initially thought.
We have obtained 510(k) clearances to manufacture, market and sell the products we market in the United States, unless exempt from premarket review by the U.S. Food and Drug Administration, or the FDA, and the right to affix the CE mark to the products we market in the EEA. In the 510(k) clearance process, the FDA must determine that a proposed device is “substantially equivalent” to a legally marketed device, known as a “predicate” device, with respect to intended use, technology and safety and effectiveness, which sometimes requires the submission of clinical data. In the EEA, as a general rule, compliance with the Essential Requirements laid down in Annex I to the Council Directive 93/42/EEC of 14 June 1993 concerning medical devices, or the Medical Devices Directive, must be based on clinical data, though such clinical data can originate from the literature if equivalence to the device to which the literature relates can be demonstrated. For implantable devices and devices classified as Class III in the EEA, the provisions of Annex I to the Medical Devices Directive require manufacturers to conduct clinical investigations to generate the required clinical data, unless it is justifiable to rely on the existing clinical data related to similar devices. While clinical data generated during a clinical investigation is sometimes required to support a 510(k) clearance, CE mark or product registration in other countries, we have not yet generated our own clinical data in support of our currently marketed products. As a result, we currently lack the breadth of published long-term clinical data supporting the quality, safety and efficacy of our products that might have been generated in connection with more costly and rigorous premarket approval, or PMA, processes, and that some of our competitors who have been in business longer may have collected.
To address this issue, we are currently collecting and plan to continue collecting long-term clinical data regarding the quality, safety and effectiveness of our marketed products. For example, we have recently launched voluntary postmarket studies in relation to our MESA, EVEREST and RAVINE medical devices. The clinical data collected and generated as part of these studies will enable us to further strengthen our clinical evaluation concerning safety and performance of these important products. We believe that this additional data will help with the marketing of our MESA, EVEREST and RAVINE medical devices by providing our customers with additional confidence in the long-term safety and efficacy of these products. However, as we conduct clinical trials designed to generate long-term data on our products, the data we generate may not be consistent with our existing data and may demonstrate less favorable safety or efficacy. These results could reduce demand for our products and significantly reduce our ability to achieve expected revenue. We do not expect to
undertake such studies for all of our products and will only do so in the future where we anticipate the benefits will outweigh the costs. In addition, in the degenerative disease market, we may determine from postmarket experience that certain patient characteristics, such as age or preexisting medical conditions, may affect fusion rates, which could lead to misleading or contradictory data on the efficacy of our degenerative disease products. For these reasons, spine surgeons may be less likely to purchase our products than competing products with longer-term clinical data. Also, we may not choose or be able to generate the comparative data that some of our competitors have or are generating and we may be subject to greater regulatory and product liability risks. Moreover, if future results and experience indicate that our products cause unexpected or serious complications or other unforeseen negative effects, we could be subject to mandatory product recalls or withdrawals, suspension or withdrawal of FDA or other government clearances or approvals or CE Certificates of Conformity, significant legal and regulatory liability and harm to our business reputation.
We are dependent on a limited number of third-party suppliers for most of our products and components, and the loss of any of these suppliers, or their inability to provide us with an adequate supply of quality materials, could harm our business.
We rely on third-party suppliers to supply substantially all of our products as well as the raw materials for the limited number of products we manufacture in-house. For us to be successful, our suppliers must be able to provide us with products and components in substantial quantities, in compliance with regulatory requirements, in accordance with agreed upon specifications, at acceptable costs and on a timely basis. Our anticipated growth could strain the ability of our suppliers to deliver an increasingly large supply of products, materials and components. Suppliers often experience difficulties in scaling up production, including problems with production yields and quality control and assurance, especially with biomaterials products such as allograft, which is processed human tissue. If we are unable to obtain sufficient quantities of high quality components to meet demand on a timely basis, we may not be able to produce sufficient quantities of our products to meet market demand and, as a result, could lose customers, our reputation may be harmed and our business could suffer.
Our dependence on a limited number of suppliers exposes us to risks, including limited control over pricing, availability and delivery schedules. If any one or more of our suppliers cease to provide us with sufficient quantities of manufactured products or raw materials in a timely manner or on terms acceptable to us, or cease to manufacture components of acceptable quality, we would have to seek alternative sources of supply. Because of the nature of our internal quality control requirements, regulatory requirements and the proprietary nature of the parts, we cannot quickly engage additional or replacement suppliers for many of our critical components. Failure of any of our third-party suppliers to deliver products or raw materials at the level our business requires would limit our ability to meet our sales commitments to our customers and could have a material adverse effect on our business. We may also have difficulty obtaining similar components from other suppliers that are acceptable to the FDA, the competent authorities or notified bodies of the countries of the EEA, each a Notified Body, or other foreign regulatory authorities, and the failure of our suppliers to comply with strictly enforced regulatory requirements could expose us to regulatory action including warning letters, product recalls and withdrawals, suspension or withdrawal of our regulatory clearances or CE Certificates of Conformity, termination of distribution, product seizures or civil, administrative or criminal penalties. We could incur delays while we locate and engage qualified alternative suppliers, and we may be unable to engage alternative suppliers on favorable terms or at all. Any such disruption or increased expenses could harm our business, results of operations or financial condition.
If we are unable to maintain and expand our network of direct sales employees, independent sales agencies and international distributors, we may not be able to generate anticipated sales.
In the United States we maintain a hybrid sales organization consisting of 124 direct sales employees and 85 independent agency partners. Our products are marketed in 36 countries internationally, in addition to the United States. Our international sales organization includes 39 direct sales employees, primarily located in the United Kingdom and Germany. In addition, we directly manage 10 independent sales agencies across Italy and Canada. We sell to 26 distributors in certain other international markets. Our results of operations are directly dependent upon the sales and marketing efforts of not only our employees, but also our independent sales agencies and distributors. We expect our direct sales employees, independent sales agencies and distributors to develop long-lasting relationships with the surgeons and hospitals they serve. If our direct sales employees, independent sales agencies or distributors fail to adequately promote, market and sell our products, our sales could significantly decrease. During 2015, on a net basis, we added one direct sales employee and 22 independent sales agencies. If revenue generated by our newly hired employees and independent sales agencies fails to increase over time in line with our expectations, our business, results of operations and financial condition could be materially adversely affected.
We face significant challenges and risks in managing our geographically dispersed distribution network and retaining the individuals who make up that network. If any of our direct sales employees, independent sales agencies or distributors
were to reduce their efforts to promote our products or cease to do business with us, our sales could be adversely affected. In such a situation, we may need to seek alternative direct sales employees, independent sales agencies or distributors or increase our reliance on our existing direct sales employees, which we may be unable to do in a timely and efficient manner, if at all. In addition, our competitors may require that members of our sales force cease doing business with us. We may not be able to rely on our sales force to distribute new products that we introduce that compete with products of our competitors that they also represent. If a direct sales employee, independent sales agency or distributor were to depart and be retained exclusively by one of our competitors, we may be unable to prevent them from helping competitors solicit business from our existing customers, which could further adversely affect our sales. Because of the intense competition for their services, we may be unable to recruit or retain additional qualified independent sales agencies or distributors or to hire additional direct sales employees. We also may not be able to enter into agreements with them on favorable or commercially reasonable terms, if at all. Failure to hire or retain qualified direct sales employees or independent sales agencies or distributors would adversely impact our ability to generate sales and expand our business.
As we launch new products and increase our marketing efforts with respect to existing products, we will need to expand the reach of our marketing and sales networks. Our future success will depend largely on our ability to continue to hire or contract with, train, retain and motivate skilled sales managers, direct sales employees, independent sales agencies and distributors with significant technical knowledge in various areas, such as spinal care practices, spine injuries and disease and spinal health. New hires and new independent sales agencies and distributors require training and take time to achieve full productivity. If we fail to hire quality personnel, fail to provide adequate training or experience high turnover in our sales force, the new members of our sales force may not be as productive as is necessary to maintain or increase our sales.
The proliferation of PODs could result in increased pricing pressure on our products or harm our ability to sell our products to physicians who own or are affiliated with those distributorships.
Physician-owned distributorships, or PODs, are product distributors that are owned, directly or indirectly, by physicians. These physicians derive a proportion of their revenue from selling or arranging for the sale of products for use in procedures they perform on their own patients at hospitals that agree to purchase from or through the POD, or that otherwise furnish ordering physicians with income that is based directly or indirectly on those orders of products.
We do not sell or distribute any of our products through PODs. The number of PODs in the spinal surgery industry may continue to grow as economic pressures increase throughout the industry, hospitals, insurers and physicians search for ways to reduce costs and, in the case of the physicians, search for ways to increase their incomes. PODs and the physicians who own, or partially own, them have significant market knowledge and access to the surgeons who use our products and the hospitals that purchase our products and thus the growth of PODs may reduce our ability to compete effectively for business from surgeons who own such distributorships.
A large percentage of our revenue is derived from the sale of our MESA, DENALI and EVEREST spinal systems or products that incorporate these technologies, and therefore, a decline in the sales of these products could have a material impact on our business, results of operations and financial condition.
Revenue from our MESA spinal systems and other products that incorporate our MESA technology represented approximately 29%, 31% and 35% of our revenue, for the years ended December 31, 2015, 2014 and 2013, respectively, revenue from our DENALI spinal systems and other products that incorporate our DENALI technology represented approximately 12%, 15% and 19% of our revenue for the years ended December 31, 2015, 2014 and 2013, respectively, and revenue from our EVEREST spinal systems and other products that incorporate our EVEREST technology represented approximately 21%, 16% and 12% of our revenue for the years ended December 31, 2015, 2014 and 2013, respectively. Competition is intense among companies selling devices for spinal surgery, and sales of MESA, DENALI or EVEREST could decline as a result of a number of factors, such as the introduction by a competitor of products which our customers prefer. Sales of MESA, DENALI or EVEREST could also be disrupted by allegations of intellectual property infringement which, even if meritless, could result in temporary injunctions against sales of these products and damage to relationships with agencies, distributors and customers. A decline in sales of MESA, DENALI or EVEREST for any reason could have a material adverse impact on our business, results of operations and financial condition.
Our business could suffer if we lose the services of key members of our senior management, consultants or personnel.
We are dependent upon the continued services of key members of our senior management and a limited number of consultants and personnel. In particular, we are highly dependent on the skills and leadership of our Chief Executive Officer, Eric D. Major, and our Chief Medical Officer, John P. Kostuik, M.D. The loss of either of these individuals could disrupt our operations or our strategic plans. In addition, our future success will depend on, among other things, our ability to continue to hire or contract with, and retain, the necessary qualified scientific, technical and managerial personnel, for
whom we compete with numerous other companies, academic institutions and organizations. The loss of members of our management team, consultants or personnel, or our inability to attract or retain other qualified personnel or consultants could have a material adverse effect on our business, results of operations and financial condition.
If we do not enhance our product offerings through our research and development efforts, we may be unable to effectively compete.
In order to increase our market share in the spinal surgery industry, we must enhance and broaden our product offerings in response to changing customer demands and competitive pressures and technologies. We might not be able to successfully develop, obtain regulatory clearances, approvals, or CE Certificates of Conformity for or market new products, and our future products might not be accepted by the surgeons or the third-party payors who reimburse for many of the procedures performed with our products. The success of any new product offering or enhancement to an existing product will depend on numerous factors, including our ability to:
| |
| • | properly identify and anticipate surgeon and patient needs; |
| |
| • | develop and introduce new products or product enhancements in a timely manner; |
| |
| • | adequately protect our intellectual property and avoid infringing upon the intellectual property rights of third parties; |
| |
| • | demonstrate the quality, safety and efficacy of new products; and |
| |
| • | obtain the necessary regulatory clearances, approvals or CE Certificates of Conformity for new products or product enhancements. |
If we do not develop and obtain regulatory clearance, approval or CE Certificate of Conformity for new products or product enhancements in time to meet market demand, or if there is insufficient demand for these products or enhancements, our results of operations will suffer. Our research and development efforts may require a substantial investment of time and resources before we are adequately able to determine the commercial viability of a new product, technology, material or other innovation. Such efforts may not result in the development of a viable product. In addition, even if we are able to successfully develop enhancements or new generations of our products, these enhancements or new generations of products may not produce sales in excess of the costs of development and they may be quickly rendered obsolete by changing customer preferences or the introduction by our competitors of products embodying new technologies or features.
If we fail to properly manage our anticipated growth, our business could suffer.
Our rapid growth has placed, and will continue to place, a significant strain on our operational and financial resources and systems. Failure to manage our growth effectively could cause us to over-invest or under- invest in infrastructure, and result in losses or weaknesses in our infrastructure, which could materially adversely affect our business. Any failure by us to manage our growth effectively could have an adverse effect on our ability to achieve our development and commercialization goals.
We may seek to grow our business through acquisitions of or investments in new or complementary businesses, products or technologies, through the licensing of products or technologies from third parties or other strategic alliances, and the failure to manage acquisitions, investments, licenses or other strategic alliances, or the failure to integrate them with our existing business, could have a material adverse effect on us.
Our success depends on our ability to continually enhance and broaden our product offerings in response to changing customer demands, competitive pressures, technologies and market pressures. Accordingly, from time to time we may consider opportunities to acquire, make investments in or license other technologies, products and businesses that may enhance our capabilities, complement our current products or expand the breadth of our markets or customer base. Potential and completed acquisitions, strategic investments, licenses and other alliances involve numerous risks, including:
| |
| Ÿ | problems assimilating the purchased or licensed technologies, products or business operations; |
| |
| • | issues maintaining uniform standards, procedures, controls and policies; |
| |
| • | unanticipated costs associated with acquisitions or strategic alliances; |
| |
| • | diversion of management’s attention from our core business; |
| |
| • | adverse effects on existing business relationships with suppliers and customers; |
| |
| • | risks associated with entering new markets in which we have limited or no experience; |
| |
| • | potential loss of key employees of acquired businesses; and |
| |
| • | increased legal and accounting compliance costs. |
We do not know if we will be able to identify acquisitions or strategic relationships we deem suitable, whether we will be able to successfully complete any such transactions on favorable terms or at all or whether we will be able to successfully integrate any acquired business, product or technology into our business or retain any key personnel, suppliers or distributors. Our ability to successfully grow through strategic transactions depends upon our ability to identify, negotiate, complete and integrate suitable target businesses, technologies or products and to obtain any necessary financing. These efforts could be expensive and time-consuming and may disrupt our ongoing business and prevent management from focusing on our operations. If we are unable to integrate any acquired businesses, products or technologies effectively, our business, results of operations and financial condition could be materially adversely affected.
If we are unable to educate surgeons on the safe and appropriate use of our products, we may be unable to achieve our expected growth.
An important part of our sales process includes the ability to educate surgeons on the safe and appropriate use of our products. If we become unable to attract potential new surgeon customers to our training programs, or if we are unable to attract existing customers to training programs for future products, we may be unable to achieve our expected growth.
There is a learning process involved for spine surgeons to become proficient in the use of our products. This training process may take longer than expected and may therefore affect our ability to increase sales. Following completion of training, we rely on the educated surgeons to advocate the clinical benefits of our products in the broader marketplace. Convincing surgeons to dedicate the time and energy necessary for adequate education is challenging, and we cannot assure you we will be successful in these efforts. If surgeons are not properly educated, they may misuse or ineffectively use our products. This may also result in unsatisfactory patient outcomes, patient injury, negative publicity or lawsuits against us, any of which could have an adverse effect on our business.
Although we believe our education methods for surgeons are conducted in compliance with applicable FDA and foreign regulatory requirements, if the FDA or any other regulatory authority determines that our training constitutes promotion of an unapproved use, they could request that we modify our training or subject us to regulatory enforcement actions, including the issuance of a warning letter, injunction, seizure, civil fine and criminal penalty.
We are required to maintain high levels of inventory, which could consume a significant amount of our resources, reduce our cash flows and lead to inventory impairment charges.
As a result of the need to maintain substantial levels of inventory, we are subject to the risk of inventory obsolescence. Many of our products come in sets, which feature components in a variety of sizes so that the appropriate spinal implant may be selected by the surgeon based on the patient’s needs. In order to market our products effectively, we often must maintain and provide hospitals with consigned sets which typically consist of spinal implants and instruments, including products to ensure redundancy and products of different sizes. In a typical surgery, fewer than all of the components of the set are used, and therefore certain portions of the set may become obsolete before they can be used. In the event that a substantial portion of our inventory becomes obsolete, it could have a material adverse effect on our earnings and cash flows due to the resulting costs associated with the inventory impairment charges and costs required to replace such inventory.
Our total assets include substantial amounts of goodwill and intangible assets and an impairment of our goodwill or intangible assets could adversely affect our results of operations.
Goodwill and intangible assets represented approximately 41.4% of our total assets as of December 31, 2015. We evaluate our goodwill for impairment on an annual basis or at other times during the year if events or circumstances indicate that it is more likely than not that the fair value is below the carrying value. We evaluate intangible assets for impairment when facts
or circumstances suggest that the carrying value of these assets may not be recoverable. Our evaluation of impairment requires us to make certain estimates and assumptions including projections of future results. Such estimates and assumptions may not prove to be accurate in the future. After performing our evaluation for impairment, including an analysis to determine the recoverability of intangible assets, we will record a noncash impairment loss when the carrying value of the underlying asset, asset group or reporting unit exceeds its fair value. If these impairment losses are significant, our results of operations could be adversely affected.
If we experience significant disruptions in our information technology systems, our business, results of operations and financial condition could be adversely affected.
The efficient operation of our business depends on our information technology systems. We rely on our information technology systems to effectively manage:
| |
| • | sales and marketing, accounting and financial, and legal and compliance functions; |
| |
| • | engineering and product development tasks; and |
| |
| • | our research and development data. |
Our information technology systems are vulnerable to damage or interruption from:
| |
| • | earthquakes, fires, floods and other natural disasters; |
| |
| • | terrorist attacks and attacks by computer viruses or hackers; |
| |
| • | computer systems, or Internet, telecommunications or data network failures. |
The failure of our information technology systems to perform as we anticipate or our failure to effectively implement new systems could disrupt our entire operation and could result in decreased sales, increased overhead costs, excess inventory and product shortages and a loss of important information, all of which could have a material adverse effect on our reputation, business, results of operations and financial condition.
Most of our operations are at a single location. Any disruption in this facility or any inability to ship a sufficient number of our products to meet demand could adversely affect our business and results of operations.
Most of our operations are currently at a single location in Leesburg, Virginia and we plan to move these operations to a new facility in Leesburg, Virginia in the Spring of 2016. See "We may not fully realize the anticipated benefits, or we may face interruptions and disruptions in connection with the relocation of our corporate headquarters to a new facility". We also maintain a facility in Malvern, Pennsylvania. Any of these facilities may be affected by man-made or natural disasters, such as a tornado or hurricane. While we currently rely on third parties to manufacture, assemble, package, label and sterilize most of our products and components, we might also be forced to rely on third parties to inspect, warehouse or ship our products and components in the event our facilities are affected by a disaster. Our Leesburg facility, if damaged or destroyed, could be difficult to replace and any efforts to repair or replace could require substantial lead-time. In addition, if we obtain an FDA PMA for any of our future devices, we might be required to obtain prior FDA approval of an alternate facility, which could delay or prevent our marketing of the affected products until this supplemental approval is obtained. Our Notified Body in the EEA or other international regulatory authorities may also need to audit our alternate facility to ensure that we continue to comply with applicable quality systems requirements. In addition, our products are expensive to make and are valuable to hospitals and surgeons worldwide. If a theft of our inventory occurred at our Leesburg facility or elsewhere, it could be a significant loss to us. Although we believe we possess adequate insurance for damage to our property and the disruption of our business from casualties, this insurance may not be sufficient to cover all of our potential losses and may not continue to be available to us on acceptable terms, or at all.
We may not be able to strengthen our brand.
We believe that establishing and strengthening the K2M brand and the brands associated with our individual product lines is critical to achieving widespread acceptance of our products, particularly because of the rapidly developing nature of the
market for our products. Promoting and positioning our brand will depend largely on the success of our marketing efforts and our ability to provide surgeons with a reliable product for successful treatment of spine diseases and disorders. Historically, our efforts to build our brand have involved significant expense, and it is likely that our future marketing efforts will require us to incur significant additional expenses. These brand promotion activities may not yield increased sales and, even if they do, any sales increases may not offset the expenses we incur to promote our brand. If we fail to successfully promote and maintain our brand, or if we incur substantial expenses in an unsuccessful attempt to promote and maintain our brand, our products may not be accepted by spine surgeons, which would cause our sales to decrease and would adversely affect our business, results of operations and financial condition.
Fluctuations in insurance cost and availability could adversely affect our profitability or our risk management profile.
We hold a number of insurance policies, including product liability insurance, directors’ and officers’ liability insurance, general liability insurance, property insurance and workers’ compensation insurance. If the costs of maintaining adequate insurance coverage increase significantly in the future, our results of operations could be materially adversely affected. Likewise, if any of our current insurance coverage should become unavailable to us or become economically impractical, we would be required to operate our business without indemnity from commercial insurance providers. If we operate our business without insurance, we could be responsible for paying claims or judgments against us that would have otherwise been covered by insurance, which could materially adversely affect our business, results of operations and financial condition. In addition, the financial health of our insurers may deteriorate and they may not be able to respond if we should have claims reaching their policies.
We may not fully realize the anticipated benefits, or we may face interruptions and disruptions, in connection with the relocation of our corporate headquarters to a new facility.
In December 2014, we entered into a lease for approximately 146,000 square feet to accommodate the expansion of our headquarters and operations facilities in Leesburg, Virginia. As of December 31, 2015, two adjacent buildings are presently under construction that will house our existing Leesburg operations. We expect construction of the buildings and necessary improvements to be completed by spring of 2016 and we will move our headquarters and existing Leesburg operations to the new facilities at that time. There can be no assurance, however, that the new space will be prepared and ready for our move-in and commencement of operations on or before the anticipated date. Delays may occur due to our inability to finish the fit-out of the space, obtain all requisite occupancy or regulatory approvals, force majeure events or other reasons. In addition, while we currently expect to spend approximately $9.5 million for leasehold improvements necessary to commence operations and approximately $3.8 million on furniture and equipment, we may incur higher costs to prepare the space than anticipated.
If we are unable to prepare and occupy our new space prior to the expiration of our existing lease in September 2016, we have the option to extend our existing lease. However, if we extend our existing lease, it must be for a period of five years, which could cause us to carry the costs of the existing facility for up to five years once regular lease payments under the new facilities become due. In addition, the process of moving our operations is not part of our day-to-day activities. Thus the process could cause significant disruption to our operations and the temporary diversion of management and employee attention. If we are unable to obtain the required approvals to transition our operations to the new facility as planned, we may experience delays or disruptions in our ability to conduct our day to day business activities. If we fail to qualify our new facility or equipment or encounter major observations of flaws in our system by inspectors from federal, state or international registration bodies, we may have to correct any deficiencies before product can be shipped from our new facility, which may have a material, adverse effect on our business, results of operations and financial condition.
Risks Related to our Legal and Regulatory Environment
Our products and operations are subject to extensive governmental regulation in the United States, and our failure to comply with applicable requirements could cause our business to suffer.
The medical device industry is regulated extensively by governmental authorities, principally the FDA and corresponding state and foreign regulatory agencies and authorities. The FDA and other U.S. and foreign governmental agencies and authorities regulate and oversee, among other things, with respect to medical devices:
| |
| • | design, development and manufacturing; |
| |
| • | testing, labeling, content and language of instructions for use and storage; |
| |
| • | marketing, sales and distribution; |
| |
| • | pre-market clearance and approval; |
| |
| • | conformity assessment procedures; |
| |
| • | record-keeping procedures; |
| |
| • | advertising and promotion; |
| |
| • | recalls and other field safety corrective actions; |
| |
| • | post-market surveillance, including reporting of deaths or serious injuries and malfunctions that, if they were to recur, could lead to death or serious injury; |
| |
| • | post-market studies; and |
| |
| • | product import and export. |
The regulations to which we are subject are complex and have tended to become more stringent over time. Regulatory changes could result in restrictions on our ability to carry on or expand our operations, higher than anticipated costs or lower than anticipated sales.
Our failure to comply with U.S. federal and state regulations could lead to the issuance of warning letters or untitled letters, the imposition of injunctions, suspensions or loss of regulatory clearance or approvals, product recalls, termination of distribution, product seizures or civil penalties. In the most extreme cases, criminal sanctions or closure of our manufacturing facilities are possible.
Our products and operations also are subject to extensive governmental regulation in foreign jurisdictions, such as Europe, and our failure to comply with applicable requirements could cause our business to suffer.
In the EEA, our medical devices must comply with the Essential Requirements laid down in Annex I to the Medical Devices Directive. Compliance with these requirements is a prerequisite to be able to affix the CE mark to our medical devices, without which they cannot be marketed or sold in the EEA. To demonstrate compliance with the Essential Requirements and obtain the right to affix the CE mark to our medical devices, we must undergo a conformity assessment procedure, which varies according to the type of medical device and its classification. Except for low risk medical devices (Class I with no measuring function and which are not sterile), where the manufacturer can issue an EC Declaration of Conformity based on a self-assessment of the conformity of its products with the Essential Requirements, a conformity assessment procedure requires the intervention of a Notified Body, which is an organization designated by a competent authority of an EEA country to conduct conformity assessments. Depending on the relevant conformity assessment procedure, the Notified Body would audit and examine the Technical File and the quality system for the manufacture, design and final inspection of our devices. The Notified Body issues a CE Certificate of Conformity following successful completion of a conformity assessment procedure conducted in relation to the medical device and its manufacturer and their conformity with the Essential Requirements. This Certificate entitles the manufacturer to affix the CE mark to its medical devices after having prepared and signed a related EC Declaration of Conformity.
As a general rule, demonstration of conformity of medical devices and their manufacturers with the Essential Requirements must be based, among other things, on the evaluation of clinical data supporting the safety and performance of the products during normal conditions of use. Specifically, a manufacturer must demonstrate the device achieves its intended performance during normal conditions of use and that the known and foreseeable risks, and that any adverse events, are minimized and acceptable when weighed against the benefits of its intended performance, and that any claims made about the performance and safety of the device (e.g., product labeling and instructions for use) are supported by suitable evidence. This assessment must be based on clinical data, which can be obtained from (1) clinical studies conducted on the devices being assessed, (2) scientific literature from similar devices whose equivalence with the assessed device can be demonstrated or (3) both clinical studies and scientific literature. With respect to implantable medical devices or Class III devices, the manufacturer must conduct clinical studies to obtain the required clinical data, unless reliance on existing
clinical data from equivalent devices can be justified. The conduct of clinical studies in the EEA is governed by detailed regulatory obligations. These may include the requirement of prior authorization by the competent authorities of the country in which the study takes place and the requirement to obtain a positive opinion from a competent Ethics Committee. This process can be expensive and time-consuming.
Our failure to comply with applicable foreign regulatory requirements, including those administered by the competent authorities of the EEA countries, could result in enforcement actions against us, including refusal, suspension or withdrawal of our CE Certificates of Conformity by our Notified Body, which could hurt our ability to market products in the EEA in the future.
If we fail to maintain regulatory approvals and clearances, or are unable to obtain, or experience significant delays in obtaining, FDA clearances or approvals for our future products or product enhancements, our ability to commercially distribute and market these products could suffer.
Before we can commercially distribute a new medical device product or a significant modification to an existing product in the United States, we must obtain either clearance under Section 510(k) of the Federal Food, Drug and Cosmetics Act, or the FDCA, or approval of a PMA application from the FDA, unless an exemption from premarket review applies. In the 510(k) clearance process, the FDA must determine that a proposed device is “substantially equivalent” to a legally marketed device, known as a “predicate” device, with respect to intended use, technology and safety and effectiveness, in order to clear the proposed device for marketing. Clinical data is sometimes required to support substantial equivalence. The PMA pathway requires an applicant to demonstrate the safety and effectiveness of the device based, in part, on extensive data, including, but not limited to, technical, preclinical, clinical trial, manufacturing and labeling data. The PMA process is typically required for devices that are deemed to pose the greatest risk, such as life-sustaining, life- supporting or implantable devices. Products that are approved through a PMA application generally need FDA approval before they can be modified. Similarly, some modifications made to products cleared through a 510(k) may require a new 510(k). Both the 510(k) and PMA processes can be expensive and lengthy and require the payment of significant fees, unless exempt. The FDA’s 510(k) clearance process usually takes from three to 12 months, but may last longer. The process of obtaining a PMA is much more costly and uncertain than the 510(k) clearance process and generally takes from one to three years, or even longer, from the time the application is submitted to the FDA until an approval is obtained. The process of obtaining regulatory clearances or approvals to market a medical device can be costly and time-consuming, and we may not be able to obtain these clearances or approvals on a timely basis, if at all.
Our currently commercialized products have either received premarket clearance under Section 510(k) of the FDCA or are exempt from premarket review. If the FDA requires us to go through a lengthier, more rigorous examination for future products or modifications to existing products than we had expected, our product introductions or modifications could be delayed or canceled, which could cause our sales to decline. Should the FDA disagree with our position that certain of our products are appropriately considered exempt from premarket review and require us to submit a 510(k) or PMA in order to market our devices, it could limit our ability to market these products. In addition, the FDA may determine that future products will require the more costly, lengthy and uncertain PMA process. Although we do not currently market any devices under a PMA, the FDA may demand that we obtain a PMA prior to marketing certain of our future products or modifications to existing products. In addition, if the FDA disagrees with our determination that a product we currently market is subject to an exemption from premarket review, the FDA may require us to submit a 510(k) or PMA in order to continue marketing the product. Further, even with respect to those future products where a PMA is not required, we cannot assure you that we will be able to obtain 510(k) clearance with respect to those products.
The FDA can delay, limit or deny clearance or approval of a device for many reasons, including:
| |
| • | we may not be able to demonstrate to the FDA’s satisfaction that our products are safe and effective for their intended users; |
| |
| • | the data from pre-clinical studies and clinical trials may be insufficient to support clearance or approval, where required; and |
| |
| • | the manufacturing process or facilities we use may not meet applicable requirements. |
Obtaining clearances and approvals can be a time consuming process, and delays in obtaining required future clearances or approvals would adversely affect our ability to introduce new or enhanced products in a timely manner, which in turn would harm our future growth.
Modifications to our products may require new 510(k) clearances, premarket approvals or new or amended CE Certificates of Conformity, and may require us to cease marketing or recall the modified products until clearances, approvals or the relevant CE Certificates of Conformity are obtained.
Any modification to a 510(k)-cleared device that could significantly affect its safety or effectiveness, or that would constitute a major change in its intended use, design, or manufacture, requires a new 510(k) clearance or, possibly, a PMA. The FDA requires every manufacturer to make this determination in the first instance, but the FDA may review such determinations. The FDA may not agree with our decisions regarding whether new clearances or approvals are necessary. We have modified some of our 510(k) cleared products, and have determined based on our review of the applicable FDA guidance that in certain instances new 510(k) clearances or PMAs are not required. If the FDA disagrees with our determination and requires us to submit new 510(k)s or PMAs for modifications to our previously cleared products for which we have concluded that new clearances or approvals are unnecessary, we may be required to cease marketing or to recall the modified products until we obtain clearance or approval, and we may be subject to significant regulatory fines or penalties.
Furthermore, the FDA’s ongoing review of the 510(k) program may make it more difficult for us to make modifications to our previously cleared products, either by imposing more strict requirements on when a new 510(k) for a modification to a previously cleared product must be submitted, or applying more onerous review criteria to such submissions. In July and December 2011, respectively, the FDA issued draft guidance documents addressing when to submit a new 510(k) due to modifications to 510(k)-cleared products and the criteria for evaluating substantial equivalence.
The July 2011 draft guidance document was ultimately withdrawn as the result of the FDASIA, and as a result, the FDA’s original guidance document regarding 510(k) modifications, which dates back to 1997, remains in place. It is uncertain when the FDA will seek to issue new guidance on product modifications. Any efforts to do so could result in a more rigorous review process and make it more difficult to obtain clearance for device modifications.
In the EEA, we must inform the Notified Body that carried out the conformity assessment of the medical devices we market or sell in the EEA of any planned substantial changes to our quality system or changes to our medical devices which could affect compliance with the Essential Requirements laid down in Annex I to the Medical Devices Directive or the devices’ intended use. The Notified Body will then assess the planned changes and verify whether they affect the products’ conformity with the Medical Devices Directive. If the assessment is favorable, the Notified Body will issue a new CE Certificate of Conformity or an addendum to the existing certificate attesting compliance with the Essential Requirements and quality system requirements laid down in the Annexes to the Medical Devices Directive.
We may fail to obtain or maintain foreign regulatory approvals to market our products in other countries.
We currently market our products internationally and intend to expand our international marketing. International jurisdictions require separate regulatory approvals and compliance with numerous and varying regulatory requirements. For example, we intend to seek regulatory clearance to market our primary products in Brazil, China and other key markets. The approval procedures vary among countries and may involve requirements for additional testing, and the time required to obtain approval may differ from country to country and from that required to obtain FDA clearance or approval, or a CE Certificate of Conformity in the EEA.
In certain of our international markets, our product registrations are in the name of our distributors and if we end our relationships with such distributors, we may experience difficulties in getting such product registrations back in our name or obtaining new registrations from the appropriate regulatory authorities.
Clearance or approval by the FDA, or the CE marking of our products in the EEA, does not ensure approval or certification by regulatory authorities in other countries or jurisdictions, and approval or certification by one foreign regulatory authority does not ensure approval or certification by regulatory authorities in other foreign countries, the EEA or by the FDA. The foreign regulatory approval or certification process may include all of the risks associated with obtaining FDA clearance or approval, or a CE Certificate of Conformity. We may not obtain foreign regulatory approvals on a timely basis, if at all. We may not be able to file for regulatory approvals or certifications and may not receive necessary approvals to commercialize our products in any market. If we fail to receive necessary approvals or certifications to commercialize our products in foreign jurisdictions on a timely basis, or at all, our business, results of operations and financial condition could be adversely affected.
Even after clearance or approval for our products is obtained, we are subject to extensive post-market regulation by the FDA. Our failure to meet strict regulatory requirements could require us to pay fines, incur other costs or even close our
facilities.
Even after we have obtained the proper regulatory clearance or approval to market a product, the FDA has the power to require us to conduct post-market studies. These studies can be very expensive and time-consuming to conduct. Failure to complete such studies in a timely manner could result in the revocation of clearance or approval and the recall or withdrawal of the product, which could prevent us from generating sales from that product in the United States. The FDA has broad enforcement powers, and any regulatory enforcement actions or inquiries, or other increased scrutiny on us, could dissuade some surgeons from using our products and adversely affect our reputation and the perceived safety and efficacy of our products.
We are also required to comply with the FDA’s Quality System Regulation, or QSR, which covers the methods used in, and the facilities and controls used for, the design, manufacture, quality assurance, labeling, packaging, sterilization, storage, shipping, installation and servicing of our marketed products. The FDA enforces the QSR through periodic announced and unannounced inspections of manufacturing facilities. In addition, in the future, regulatory authorities and/or customers may require specific packaging of sterile products, which could increase our costs and the price of our products.
Later discovery of previously unknown problems with our products, including unanticipated adverse events or adverse events of unanticipated severity or frequency, manufacturing problems, or failure to comply with regulatory requirements such as QSR, may result in changes to labeling, restrictions on such products or manufacturing processes, withdrawal of the products from the market, voluntary or mandatory recalls, a requirement to repair, replace or refund the cost of any medical device we manufacture or distribute, fines, suspension of regulatory approvals, product seizures, injunctions or the imposition of civil or criminal penalties which would adversely affect our business, operating results and prospects.
If our products, or malfunction of our products, cause or contribute to a death or a serious injury, we will be subject to medical device reporting regulations, which can result in voluntary corrective actions or agency enforcement actions.
Under the FDA’s medical device reporting, or MDR, regulations, we are required to report to the FDA any incident in which our product may have caused or contributed to a death or serious injury or in which our product malfunctioned and, if the malfunction were to recur, would likely cause or contribute to death or serious injury. Repeated product malfunctions may result in a voluntary or involuntary product recall, which could divert managerial and financial resources, impair our ability to manufacture our products in a cost-effective and timely manner, and have an adverse effect on our reputation, results of operations and financial condition. We are also required to follow detailed recordkeeping requirements for all firm-initiated medical device corrections and removals, and to report such corrective and removal actions to the FDA if they are carried out in response to a risk to health and have not otherwise been reported under the MDR regulations. In addition, in December of 2012, the FDA issued a draft guidance intended to assist the FDA and the industry in distinguishing medical device recalls from product enhancements. Per the guidance, if any change or group of changes to a device addresses a violation of the FDCA, that change would generally constitute a medical device recall and require submission of a recall report to the FDA.
All manufacturers bringing medical devices to market in the EEA are legally bound to report any incident that led or might have led to the death or serious deterioration in the state of health of a patient, user or other person, and which the manufacturer’s device is suspected to have caused, to the competent authority in whose jurisdiction the incident occurred. In such case, the manufacturer must file an initial report with the relevant competent authority, which would be followed by further evaluation or investigation of the incident and a final report indicating whether further action is required.
Any adverse event involving our products could result in future voluntary corrective actions, such as recalls or customer notifications, or agency action, such as inspection or enforcement action. Adverse events involving our products have been reported to us in the past, and we cannot guarantee that they will not occur in the future. Any corrective action, whether voluntary or involuntary, will require the dedication of our time and capital, distract management from operating our business and may harm our reputation and financial results.
A recall of our products, either voluntarily or at the direction of the FDA or another governmental authority, or the discovery of serious safety issues with our products, could have a significant adverse impact on us.
The FDA and similar foreign governmental authorities such as the competent authorities of the EEA countries have the authority to require the recall of commercialized products in the event of material deficiencies or defects in design or manufacture or in the event that a product poses an unacceptable risk to health. Manufacturers may, under their own initiative, recall a product if any material deficiency in a device is found. A government-mandated or voluntary recall by us or one of our distributors could occur as a result of an unacceptable risk to health, component failures, manufacturing
errors, design or labeling defects or other deficiencies and issues.
Any recalls of any of our products would divert managerial and financial resources and could have an adverse effect on our reputation, results of operations and financial condition, which could impair our ability to produce our products in a cost-effective and timely manner in order to meet our customers’ demands. We may also be required to bear other costs or take other actions that may have a negative impact on our future sales and our ability to generate profits.
Further, under the FDA’s MDR regulations, we are required to report to the FDA any incident in which our product may have caused or contributed to a death or serious injury or in which our product malfunctioned and, if the malfunction were to recur, would likely cause or contribute to death or serious injury.
In the EEA we must comply with the EU Medical Device Vigilance System. Under this system, incidents must be reported to the relevant authorities of the EEA countries, and manufacturers are required to take Field Safety Corrective Actions, or FSCAs, to reduce a risk of death or serious deterioration in the state of health associated with the use of a medical device that is already placed on the market. An incident is defined as any malfunction or deterioration in the characteristics and/or performance of a device, as well as any inadequacy in the labeling or instructions for use or an unanticipated adverse reaction or side effect which, directly or indirectly, might lead to or might have led to the death of a patient, user or other person or to a serious deterioration in their state of health. An FSCA may include the recall, modification, exchange, destruction or retrofitting of the device. FSCAs must be communicated by the manufacturer or its legal representative to its customers and/or to the end users of the device through Field Safety Notices.
Repeated product malfunctions may result in a voluntary or involuntary product recall, which could divert managerial and financial resources, impair our ability to manufacture our products in a cost-effective and timely manner and have an adverse effect on our reputation, results of operations and financial condition.
If we or our suppliers fail to comply with ongoing regulatory requirements, or if we experience unanticipated problems with our products, our products could be subject to restrictions or withdrawal from the market.
Any product for which we obtain clearance or approval, and the manufacturing processes, reporting requirements, post- approval clinical data and promotional activities for such product, will be subject to continued regulatory review, oversight and periodic inspection by the FDA and other domestic and foreign regulatory bodies. In particular, we and our third-party suppliers are required to comply with the QSR. In the EEA countries, compliance with harmonized standards is also recommended as this is interpreted as a presumption of conformity with the relevant Essential Requirements laid down in Annex I to the Medical Devices Directive. These FDA regulations and EU standards cover the methods and documentation of the design, testing, production, control, quality assurance, labeling, packaging, sterilization, storage and shipping of our products. Compliance with the QSR is subject to continual review and is monitored rigorously through periodic inspections by the FDA. Compliance with harmonized standards in the EEA is also subject to regular review through audits by Notified Bodies or other certification bodies. If we, or our manufacturers, fail to adhere to QSR requirements in the United States or other harmonized standards in the EEA, this could delay production of our products and lead to fines, difficulties in obtaining regulatory clearances and CE Certificate of Conformity, recalls, enforcement actions, including injunctive relief or consent decrees, or other consequences, which could, in turn, have a material adverse effect on our financial condition or results of operations.
The FDA has inspected our Leesburg facility on three separate occasions: August 2006, October 2007 and January 2011. We received a Form FDA-483 list of inspectional observations on each occasion all of which have been closed by the FDA. We have not received any warning letters associated with any of these inspections. The FDA subsequently re-inspected our Leesburg facility in July 2015, and we did not receive a Form FDA-483 or a warning letter associated with the inspection.
Any future failure by us or one of our suppliers to comply with applicable statutes and regulations administered by the FDA, or the failure to timely and adequately respond to any adverse inspectional observations or product safety issues, could result in any of the following enforcement actions:
| |
| • | untitled letters, warning letters, fines, injunctions, consent decrees and civil penalties; |
| |
| • | unanticipated expenditures to address or defend such actions; |
| |
| • | customer notifications or repair, replacement, refund, recall, detention or seizure of our products; |
| |
| • | operating restrictions or partial suspension or total shutdown of production; |
| |
| • | refusing or delaying our requests for 510(k) clearance or PMA approval of new products or modified products; |
| |
| • | withdrawing 510(k) clearances that have already been granted; |
| |
| • | refusal to grant export approval for our products; or |
Any of these sanctions could have a material adverse effect on our reputation, business, results of operations and financial condition. Furthermore, our key component suppliers may not currently be or may not continue to be in compliance with all applicable regulatory requirements, which could result in our failure to produce our products on a timely basis and in the required quantities, if at all.
Outside the EEA and the United States, our products and operations are also often required to comply with standards set by foreign regulatory bodies, and those standards, types of evaluation and scope of review differ among foreign regulatory bodies. We intend to comply with the standards enforced by such foreign regulatory bodies as needed to commercialize our products. If we fail to comply with any of these standards adequately, a foreign regulatory body may take adverse actions similar to those within the power of an EEA Notified Body or competent authority or the FDA. Any such action may harm our reputation and business, and could have an adverse effect on our business, results of operations and financial condition.
We may be subject to enforcement action if we engage in improper marketing or promotion of our products.
Our promotional materials and training methods must comply with FDA and other applicable laws and regulations, including the prohibition of the promotion of unapproved, or off-label, use. Surgeons may use our products off-label, as the FDA does not restrict or regulate a surgeon’s choice of treatment within the practice of medicine. However, if the FDA determines that our promotional materials or training constitutes promotion of an off-label use, it could request that we modify our training or promotional materials or subject us to regulatory or enforcement actions, including the issuance of an untitled letter, a warning letter, injunction, seizure, civil fine or criminal penalties. It is also possible that other federal, state or foreign enforcement authorities might take action if they consider our promotional or training materials to constitute promotion of an off-label use, which could result in significant fines or penalties under other statutory authorities, such as laws prohibiting false claims for reimbursement. In that event, our reputation could be damaged and adoption of the products could be impaired. Although our policy is to refrain from statements that could be considered off- label promotion of our products, the FDA or another regulatory agency could disagree and conclude that we have engaged in off-label promotion. In addition, the off-label use of our products may increase the risk of injury to patients and, in turn, the risk of product liability claims. Product liability claims are expensive to defend and could divert our management’s attention, result in substantial damage awards against us, and harm our reputation.
Further, the advertising and promotion of our products is subject to the Medical Devices Directive, Directive 2006/114/EC concerning misleading and comparative advertising, Directive 2005/29/EC on unfair commercial practices, and other EEA countries’ legislation governing the advertising and promotion of medical devices. In addition, we are subject to EU and national Codes of Conduct. These laws and Codes of Conduct may limit or restrict the advertising and promotion of our products to the general public and may impose limitations on our promotional activities with healthcare professionals.
The misuse or off-label use of our products may harm our image in the marketplace or result in injuries that lead to product liability suits, which could be costly to our business.
The FDA and the competent authorities of the EEA countries do not prevent a physician from using our products off-label, as the FDA and the laws of the EEA countries generally do not restrict or regulate a physician’s choice of treatment within the practice of medicine. The use of our products for indications other than those indications for which our products have been cleared by the FDA, or CE marked in the EEA, may not effectively treat such conditions or may increase the risk of injury to patients, which could harm our reputation in the marketplace among physicians and patients. Physicians may also misuse our products or use improper techniques if they are not adequately educated, potentially leading to injury and an increased risk of product liability. If our products are misused or used with improper technique, we may become subject to costly litigation by our customers or their patients. Product liability claims could divert management’s attention from our core business, be expensive to defend and result in sizable damage awards against us that may not be covered by insurance. Any of these events could harm our business and results of operations and cause our stock price to decline.
Clinical trials necessary to support a PMA application are expensive and require the enrollment of large numbers of patients, and suitable patients may be difficult to identify and recruit. Delays or failures in any future clinical trials will prevent us from commercializing any modified or new products associated with such trials and could adversely affect our business, results of operations and financial condition.
Certain of our future products may require the approval of a PMA. Initiating and completing clinical trials necessary to support a PMA application, and additional safety and efficacy data beyond that typically required for a 510(k) clearance, can be time consuming and expensive and the outcome uncertain. Moreover, the results of early clinical trials are not necessarily predictive of future results, and any product we advance into clinical trials may not have favorable results in later clinical trials.
Conducting successful clinical studies requires the enrollment of large numbers of patients, and suitable patients may be difficult to identify and recruit. Patient enrollment in clinical trials and completion of patient participation and follow-up depends on many factors, including the size of the patient population, the nature of the trial protocol, the attractiveness of, or the discomforts and risks associated with, the treatments received by enrolled subjects, the availability of appropriate clinical trial investigators and support staff, proximity of patients to clinical sites, patient ability to meet the eligibility and exclusion criteria for participation in the clinical trial and patient compliance. For example, patients may be discouraged from enrolling in our clinical trials if the trial protocol requires them to undergo extensive post-treatment procedures or follow-up to assess the safety and effectiveness of our products or if they determine that the treatments received under the trial protocols are not attractive or involve unacceptable risks or discomforts. Patients may also not participate in our clinical trials if they choose to participate in contemporaneous clinical trials of competitive products. In addition, patients participating in clinical trials may die before completion of the trial or suffer adverse medical events unrelated to investigational products.
Sufficient and appropriate clinical protocols to demonstrate safety and efficacy are required and we may not adequately develop such protocols to support clearance and approval. Further, the FDA may require us to submit data on a greater number of patients than we originally anticipated and/or for a longer follow-up period or change the data collection requirements or data analysis applicable to our clinical trials. Delays in patient enrollment or failure of patients to continue to participate in a clinical trial may cause an increase in costs and delays in the approval and attempted commercialization of our products or result in the failure of the clinical trial. In addition, despite considerable time and expense invested in our clinical trials, the FDA may not consider our data adequate to demonstrate safety and efficacy. Such increased costs and delays or failures could adversely affect our business, results of operations and prospects.
If the third parties on which we rely to conduct our clinical trials and to assist us with pre-clinical development do not perform as contractually required or expected, we may not be able to obtain regulatory approval for or commercialize our products.
We do not have the ability to independently conduct pre-clinical or clinical trials for our products and, if we need to conduct such trials in the future, we would need to rely on third parties, such as contract research organizations, medical institutions, clinical investigators and contract laboratories to conduct such trials. If these third parties do not successfully carry out their contractual duties or regulatory obligations or meet expected deadlines, if these third parties need to be replaced, or if the quality or accuracy of the data they obtain is compromised due to the failure to adhere to our clinical protocols or regulatory requirements or for other reasons, our pre-clinical development activities or clinical trials may be extended, delayed, suspended or terminated, and we may not be able to obtain regulatory approval for, or successfully commercialize, our products on a timely basis, if at all, and our business, results of operations and prospects may be adversely affected. Furthermore, our third-party clinical trial investigators may be delayed in conducting our clinical trials for reasons outside of their control.
The results of clinical trials may not support future product candidates or claims or may result in the discovery of adverse side effects.
In the future, we may need to conduct clinical trials to support approval of new products, and any future clinical trial activities that we undertake will be subject to extensive regulation and review by numerous governmental authorities both in the United States and abroad. Clinical studies intended to support a 510(k) or PMA must be conducted in compliance with the FDA’s Good Clinical Practice regulations and similar requirements in foreign jurisdictions. Even if our clinical trials are completed as planned, we cannot be certain that their results will support our product candidate claims or that the FDA or foreign authorities and Notified Bodies will agree with our conclusions regarding them. Success in pre-clinical studies and early clinical trials does not ensure that later clinical trials will be successful, and we cannot be sure that the later trials will replicate the results of prior trials and pre-clinical studies. The clinical trial process may fail to demonstrate that our product candidates are safe and effective for the proposed indicated uses, which could cause us to abandon a product candidate and may delay development of others. Any delay or termination of our clinical trials will delay the
filing of associated product submissions and, ultimately, our ability to commercialize products requiring submission of clinical data. It is also possible that patients enrolled in a clinical trial will experience adverse side effects that are not currently part of the product candidate’s safety profile, which could cause us to delay or abandon development of such product.
Governmental regulation and limited sources and suppliers could restrict our procurement and use of allograft bone tissue.
In the United States, the procurement and transplantation of allograft bone tissue is subject to federal law pursuant to the National Organ Transplant Act, or NOTA, a criminal statute which prohibits the purchase and sale of human organs used in human transplantation, including bone and related tissue, for “valuable consideration.” NOTA permits reasonable payments associated with the removal, transportation, processing, preservation, quality control, implantation and storage of human bone tissue. We provide processing fees to certain of our suppliers, which are registered tissue banks, for their services related to recovering allograft bone tissue. If NOTA is interpreted or enforced in a manner that prevents us from making these processing fees to our tissue bank suppliers for the services they render for us, our business could be materially adversely affected. The FDA periodically inspects tissue processors to determine compliance with these requirements. Violations of applicable regulations noted by the FDA during facility inspections could adversely affect the continued marketing of our products. We believe we comply with all aspects of the FDA’s Current Good Tissue Practice regulations, although there can be no assurance that we will comply, or will comply on a timely basis, in the future. The entity that provides us with allograft bone tissue is responsible for performing donor recovery, donor screening and donor testing and our compliance with those aspects of the Current Good Tissue Practice regulations that regulate those functions are dependent upon the actions of this independent entity.
Three third-party suppliers currently provide all of our needs for biomaterials products, which incorporate allograft bone tissue. The processing of allograft bone tissue into our biomaterials products is very labor-intensive and it is therefore difficult to maintain a steady supply stream. In addition, due to seasonal changes in mortality rates, some scarce tissues used in our biomaterials products may be, at times, in particularly short supply. We cannot be certain that our current supply of biomaterials products from our suppliers, plus any additional sources that we identify in the future, will be sufficient to meet our needs. Our dependence on a limited number of third-party suppliers and the challenges we may face in obtaining adequate supplies of allograft bone tissue involve several risks, including limited control over pricing, availability, and quality and delivery schedules. In addition, any supply interruption in a sole-sourced human tissue component, could materially harm our and our third-party suppliers’ ability to manufacture our biomaterials products until a new source of supply, if any, could be found. We may be unable to find a sufficient alternative supply channel in a reasonable time period or on commercially reasonable terms, if at all, which would have a material adverse effect on our business, results of operations and financial condition.
Negative publicity concerning methods of tissue recovery and screening of donor tissue in our industry could reduce demand for our biomaterials products and impact the supply of available donor tissue.
Media reports or other negative publicity concerning both alleged improper methods of tissue recovery from donors and disease transmission from donated tissue could limit widespread acceptance of some of our biomaterials products. Unfavorable reports of improper or illegal tissue recovery practices, both in the United States and internationally, as well as incidents of improperly processed tissue leading to the transmission of disease, may broadly affect the rate of future tissue donation and market acceptance of technologies incorporating human tissue. In addition, such negative publicity could cause the families of potential donors to become reluctant to agree to donate tissue to for-profit tissue processors. For example, the media has reported examples of alleged illegal harvesting of body parts from cadavers and resulting recalls conducted by certain companies selling human tissue based products affected by the alleged illegal harvesting. These reports and others could have a negative effect on our biomaterials business.
We are subject to environmental laws and regulations that can impose significant costs and expose us to potential financial liabilities.
The manufacture of certain of our products, including our biomaterials products, and the handling of materials used in the product testing process, including in our cadaveric laboratory, involve the controlled use of biological and/or hazardous materials and wastes. Our business and facilities and those of our suppliers are subject to foreign, federal, state and local laws and regulations relating to the protection of human health and the environment, including those governing the use, manufacture, storage, handling and disposal of, and exposure to, such materials and wastes. In addition, under some environmental laws and regulations, we could be held responsible for costs relating to any contamination at our present facilities and at third-party waste disposal sites even if such contamination was not caused by us. A failure to comply with current or future environmental laws and regulations could result in severe fines or penalties. Any such expenses or liability could have a significant negative impact on our business, results of operations and financial condition.
We or our suppliers may be the subject of claims for non-compliance with FDA regulations in connection with the processing, manufacturing or distribution of our proposed allograft bone tissue or other biomaterials products.
Allegations may be made against us or against donor recovery groups or tissue banks, including those with which we have a contractual supplier relationship, claiming that the acquisition or processing of biomaterials products does not comply with applicable FDA regulations or other relevant statutes and regulations. Allegations like these could cause regulators or other authorities to take investigative or other action against us or our suppliers, or could cause negative publicity for us or our industry generally. These actions or any negative publicity could cause us to incur substantial costs, divert the attention of our management from our business and harm our reputation.
If we or our sales representatives fail to comply with fraud and abuse laws, we could be subject to civil and criminal penalties, which could adversely impact our reputation and business operations.
There are numerous U.S. federal and state laws pertaining to healthcare fraud and abuse, including anti-kickback laws and physician self-referral laws. Our relationships with surgeons, hospitals, group purchasing organizations and our international distributors are subject to scrutiny under these laws. Violations of these laws are punishable by criminal and civil sanctions, including significant monetary penalties and, in some instances, imprisonment and exclusion from participation in federal and state healthcare programs, including the Medicare, Medicaid and Veterans Administration health programs.
Healthcare fraud and abuse regulations are complex, and even minor irregularities can potentially give rise to claims that a statute or prohibition has been violated. The laws that may affect our ability to operate include:
| |
| • | the federal Anti-Kickback Statute, which prohibits, among other things, persons from knowingly and willfully soliciting, receiving, offering or paying remuneration, directly or indirectly, in exchange for or to induce either the referral of an individual for, or the purchase, order or recommendation of, any good or service for which payment may be made under federal healthcare programs such as Medicare and Medicaid; |
| |
| • | the federal False Claims Act, which prohibits, among other things, individuals or entities from knowingly presenting, or causing to be presented, claims for payment from Medicare, Medicaid or other third-party payors that are false or fraudulent; |
| |
| • | the federal Health Insurance Portability and Accountability Act of 1996, as amended, which created federal criminal laws that prohibit executing a scheme to defraud any healthcare benefit program and making false statements relating to healthcare matters; |
| |
| • | the Federal Trade Commission Act and similar laws regulating advertisement and consumer protections; |
| |
| • | The FCPA prohibits corrupt payments, gifts or transfers of value to foreign officials; and |
| |
| • | foreign and/or U.S. state law equivalents of each of the above federal laws, such as anti-kickback and false claims laws which may apply to items or services reimbursed by any third-party payor, including commercial insurers. |
Further, the Patient Protection and Affordable Care Act, as amended by the Health Care and Education Reconciliation Act of 2010, or, collectively, the PPACA, among other things, amends the intent requirements of the federal Anti-Kickback Statute and the criminal statute governing healthcare fraud. A person or entity can now be found guilty of violating the federal Anti-Kickback Statute and the federal criminal healthcare fraud statute without actual knowledge of the statute or specific intent to violate it. In addition, the PPACA provides that the government may assert that a claim including items or services resulting from a violation of the federal Anti-Kickback Statute constitutes a false or fraudulent claim for purposes of the federal False Claims Act or federal civil money penalties statute. Possible sanctions for violation of laws include monetary fines, civil and criminal penalties, exclusion from Medicare and Medicaid programs and forfeiture of amounts collected in violation of such prohibitions. Moreover, while we do not submit claims and our customers make the ultimate decision on how to submit claims, from time-to-time, we may provide reimbursement guidance to our customers. If a government authority were to conclude that we provided improper advice to our customers and/or encouraged the submission of false claims for reimbursement, we could face action against us by government authorities. Any violations of these laws, or any action against us for violation of these laws, even if we successfully defend against it, could result in a
material adverse effect on our reputation, business, results of operations and financial condition.
Because of the breadth of these laws and the narrowness of the statutory exceptions and safe harbors available under the federal Anti-Kickback Statute, it is possible that some of our business activities, including our relationship with surgeons, hospitals, group purchasing organizations and our independent sales agencies and distributors, could be subject to challenge under one or more of such laws.
We have entered into certain agreements, including consulting agreements and royalty agreements, with surgeons, including some who order and use our products in procedures they perform. While these transactions were structured to comply with all applicable laws, including state and federal anti-kickback laws, to the extent applicable, regulatory agencies may view these transactions as prohibited arrangements that must be restructured, or discontinued, or for which we could be subject to other significant penalties, including debarment. Although compliance programs can mitigate the risk of investigation and prosecution for violations of these laws, the risks cannot be entirely eliminated. Any action against us for violation of these laws, even if we successfully defend against it, could cause us to incur significant legal expenses and divert our management’s attention from the operation of our business. We could also be adversely affected if regulatory agencies interpret our financial relationships with spine surgeons who order our products to be in violation of applicable laws. This could subject us to civil and criminal penalties for non-compliance, the cost of which could be substantial.
To enforce compliance with the federal laws, the U.S. Department of Justice, or DOJ, has recently increased its scrutiny of interactions between healthcare companies and healthcare providers, which has led to a number of investigations, prosecutions, convictions and settlements in the healthcare industry. Dealing with investigations can be time and resource consuming and can divert management’s attention from the business. In addition, settlements with the DOJ or other law enforcement agencies have forced healthcare providers to agree to additional compliance and reporting requirements as part of a consent decree or corporate integrity agreement. Any such investigation or settlement could increase our costs or otherwise have an adverse effect on our business.
In addition, there has been a recent trend of increased federal and state regulation of payments made to physicians. The PPACA imposed new reporting requirements on device manufacturers for payments made by them and in some cases, their distributors, to physicians and teaching hospitals, as well as ownership and investment interests held by physicians (commonly known as the Physician Payment Sunshine Act). Failure to submit required information may result in civil monetary penalties of up to an aggregate of $150,000 per year (or up to an aggregate of $1 million per year for “knowing failures”), for all payments, transfers of value or ownership or investment interests that are not timely, accurately and completely reported in an annual submission. Manufacturers must submit reports by the 90th day of each subsequent calendar year. Due to the difficulty in complying with the Physician Payment Sunshine Act and the use of independent sales agencies as part of our U.S. sales force, we cannot assure you that we will successfully report all transfers of value by us and our independent sales agencies, and any failure to comply could result in significant fines and penalties.
Certain states mandate implementation of commercial compliance programs, impose restrictions on device manufacturer marketing practices and tracking and/or require the reporting of gifts, compensation and other remuneration to physicians. A similar trend is observed in foreign jurisdictions such as France. In France, a recently adopted law and a decree require companies working in the health sector to publicly disclose direct or indirect benefits granted to, and agreements entered into with, physicians and other healthcare professionals. The shifting commercial compliance environment and the need to build and maintain robust and expandable systems to comply with different compliance and/or reporting requirements in multiple jurisdictions increase the possibility that a healthcare company may violate one or more of the requirements.
Most of these laws apply to not only the actions taken by us, but also actions taken by our independent sales agencies and distributors. We have limited knowledge and control over the business practices of our independent sales agencies and distributors, and we may face regulatory action against us as a result of their actions which could have a material adverse effect on our reputation, business, results of operations and financial condition.
In addition, the scope and enforcement of these laws is uncertain and subject to rapid change in the current environment of healthcare reform, especially in light of the lack of applicable precedent and regulations. Federal or state regulatory authorities might challenge our current or future activities under these laws. Any such challenge could have a material adverse effect on our reputation, business, results of operations and financial condition. Any state or federal regulatory review of us, regardless of the outcome, would be costly and time-consuming. In addition, we cannot predict the impact of any changes in these laws, whether or not retroactive.
U.S. legislative or FDA regulatory reforms may make it more difficult and costly for us to obtain regulatory approval of our
product candidates and to manufacture, market and distribute our products after approval is obtained.
From time to time, legislation is drafted and introduced in Congress that could significantly change the statutory provisions governing the regulatory approval, manufacture and marketing of regulated products or the reimbursement thereof. In addition, FDA regulations and guidance are often revised or reinterpreted by the FDA in ways that may significantly affect our business and our products. Any new regulations or revisions or reinterpretations of existing regulations may impose additional costs or lengthen review times of future products. In addition, FDA regulations and guidance are often revised or reinterpreted by the agency in ways that may significantly affect our business and our products. It is impossible to predict whether legislative changes will be enacted or FDA regulations, guidance or interpretations changed, and what the impact of such changes, if any, may be.
For example, the FDA may change its clearance and approval policies, adopt additional regulations or revise existing regulations, or take other actions which may prevent or delay approval or clearance of our products under development or impact our ability to modify our currently cleared products on a timely basis. For example, in 2011, the FDA initiated a review of the premarket clearance process in response to internal and external concerns regarding the 510(k) program, announcing 25 action items designed to make the process more rigorous and transparent. In addition, as part of the Food and Drug Administration Safety and Innovation Act of 2012, or the FDASIA, Congress enacted several reforms entitled the Medical Device Regulatory Improvements and additional miscellaneous provisions which will further affect medical device regulation both pre- and post-approval. The FDA has implemented, and continues to implement, these reforms, which could impose additional regulatory requirements upon us and delay our ability to obtain new 510(k) clearances, increase the costs of compliance or restrict our ability to maintain our current clearances. For example, the FDA recently issued guidance documents intended to explain the procedures and criteria the FDA will use in assessing whether a 510(k) submission meets a minimum threshold of acceptability and should be accepted for review. Under the “Refuse to Accept” guidance, the FDA conducts an early review against specific acceptance criteria to inform 510(k) submitters if the submission is administratively complete, or if not, to identify the missing element(s). Submitters are given the opportunity to provide the FDA with the identified information, but if the information is not provided within a defined time, the submission will not be accepted for FDA review. Any change in the laws or regulations that govern the clearance and approval processes relating to our current and future products could make it more difficult and costly to obtain clearance or approval for new products, or to produce, market and distribute existing products. Significant delays in receiving clearance or approval, or the failure to receive clearance or approval for our new products would have an adverse effect on our ability to expand our business.
U.S. legislative or regulatory healthcare reforms may make it more difficult and costly for us to market and distribute our products after clearance or approval is obtained.
Recent political, economic and regulatory influences are subjecting the healthcare industry to fundamental changes. The sales of our products depend in part on the availability of coverage and reimbursement from third-party payors such as government health programs, private health insurers, health maintenance organizations and other healthcare-related organizations. Both the federal and state governments in the United States and foreign governments continue to propose and pass new legislation and regulations designed to contain or reduce the cost of healthcare. Such legislation and regulations may result in decreased reimbursement for medical devices and/or the procedures in which they are used, which may further exacerbate industry-wide pressure to reduce the prices charged for medical devices. This could harm our ability to market our products and generate sales.
Federal and state governments in the United States have recently enacted legislation to overhaul the nation’s healthcare system. While the goal of healthcare reform is to expand coverage to more individuals, it also involves increased government price controls, additional regulatory mandates and other measures designed to constrain medical costs. The PPACA significantly impacts the medical device industry. Among other things, the PPACA:
| |
| • | imposes an annual excise tax of 2.3% on any entity that manufactures or imports medical devices offered for sale in the United States, which began on January 1, 2013 (described in more detail below); |
| |
| • | establishes a new Patient-Centered Outcomes Research Institute to oversee and identify priorities in comparative clinical effectiveness research in an effort to coordinate and develop such research; |
| |
| • | implements payment system reforms including a national pilot program on payment bundling to encourage hospitals, physicians and other providers to improve the coordination, quality and efficiency of certain healthcare services through bundled payment models; and |
| |
| • | creates an independent payment advisory board that will submit recommendations to reduce |
Medicare spending if projected Medicare spending exceeds a specified growth rate.
In addition, other legislative changes have been proposed and adopted since the PPACA was enacted. On August 2, 2011, the President signed into law the Budget Control Act of 2011, which, among other things, created the Joint Select Committee on Deficit Reduction to recommend to Congress proposals in spending reductions. The Joint Select Committee did not achieve a targeted deficit reduction of at least $1.2 trillion for the years 2013 through 2021, triggering the legislation’s automatic reduction to several government programs. This includes reductions to Medicare payments to providers of 2% per fiscal year, which went into effect on April 1, 2013, and will remain in effect through 2024 unless additional Congressional action is taken. On January 2, 2013, President Obama signed into law the American Taxpayer Relief Act of 2012, or the ATRA, which, among other things, further reduced Medicare payments to several providers, including hospitals, imaging centers and cancer treatment centers and increased the statute of limitations period for the government to recover overpayments to providers from three to five years. We expect that additional state and federal healthcare reform measures will be adopted in the future, any of which could limit the amounts that federal and state governments will pay for healthcare products and services, which could result in reduced demand for our products or additional pricing pressure.
Our financial performance may be adversely affected by medical device tax provisions in the healthcare reform laws.
The PPACA imposes, among other things, an excise tax of 2.3% on any entity that manufactures or imports medical devices offered for sale in the United States, which began on January 1, 2013. Under these provisions, the Congressional Research Service predicts that the total cost to the medical device industry may be up to $20 billion over the next decade. The Internal Revenue Service issued final regulations implementing the tax in December of 2012 which requires, among other things, bi-monthly payments and quarterly reporting. We anticipate that primarily all of our sales of medical devices in the United States will be subject to this 2.3% excise tax. On December 18, 2015, the President signed into law the Consolidated Appropriations Act, 2016 (H.R. 2029), which included a two-year suspension of the medical device excise tax beginning in 2016.
Risks Related to our Financial Results and Future Capital Needs
We will need to generate significant sales to become profitable.
We intend to increase our operating expenses and purchases of inventory as we expand our global distribution network to increase our geographic sales coverage, increase our marketing capabilities, conduct clinical trials and increase our general and administrative functions to support our growing operations. We will need to generate significant sales to achieve profitability and we might not be able to do so. Even if we do generate significant sales, we might not be able to achieve profitability on a quarterly or annual basis in the future. If our sales grow more slowly than we anticipate or if our operating expenses exceed our expectations, our financial performance will likely be adversely affected.
Our sales volumes and our results of operations may fluctuate over the course of the year.
We have experienced and continue to experience meaningful variability in our sales and gross profit among quarters, as well as within each quarter, as a result of a number of factors, including, among other things:
| |
| • | the number of products sold in the quarter; |
| |
| • | the unpredictability of sales of full sets of spinal implants and instruments to our international distributors; |
| |
| • | the demand for, and pricing of, our products and the products of our competitors; |
| |
| • | the timing of or failure to obtain regulatory clearances or approvals for products; |
| |
| • | costs, benefits and timing of new product introductions; |
| |
| • | the availability and cost of components and materials; |
| |
| • | the number of selling days in the quarter; |
| |
| • | fluctuation and foreign currency exchange rates; and |
| |
| • | impairment and other special charges. |
In addition, our sales may be influenced by summer vacation and winter holiday periods, as we have experienced a higher incidence of adolescent surgeries during these periods which may lead to higher sales of our products in the late Spring and Summer and in the fourth quarter of our fiscal year.
Our future capital needs are uncertain and we may need to raise additional funds in the future, and such funds may not be available on acceptable terms or at all.
We believe that our current cash and cash equivalents in combination with the borrowing availability under our senior secured credit facility and our expected cash from operations, will be sufficient to meet our projected operating requirements for the foreseeable future. However, continued expansion of our business will be expensive and we may seek additional funds from public and private stock offerings, borrowings under our existing or new credit facilities or other sources which we may not be able to maintain or obtain on acceptable or commercially reasonable terms, if at all. Our capital requirements will depend on many factors, including:
| |
| • | market acceptance of our products; |
| |
| • | the revenue generated by sales of our products; |
| |
| • | the costs associated with expanding our sales and marketing efforts; |
| |
| • | the expenses we incur in manufacturing and selling our products; |
| |
| • | the costs of developing and commercializing new products or technologies; |
| |
| • | the scope, rate of progress and cost of our clinical trials; |
| |
| • | the cost of obtaining and maintaining regulatory approval or clearance of our products and products in development; |
| |
| • | the costs associated with complying with state, federal and international transparency laws; |
| |
| • | the cost of filing and prosecuting patent applications and defending and enforcing our patent and other intellectual property rights; |
| |
| • | the cost of defending, in litigation or otherwise, any claims that we infringe third-party patent or other intellectual property rights; |
| |
| • | the cost of enforcing or defending against non-competition claims; |
| |
| • | the number and timing of acquisitions and other strategic transactions; |
| |
| • | the costs associated with our planned international expansion; |
| |
| • | the costs associated with increased capital expenditures, including fixed asset purchases of instrument sets which we loan to hospitals to support surgeries; and |
| |
| • | unanticipated general and administrative expenses. |
As a result of these factors, we may seek to raise additional capital to:
| |
| • | maintain appropriate product inventory levels; |
| |
| • | fund our operations and clinical trials; |
| |
| • | continue our research and development; |
| |
| • | defend, in litigation or otherwise, any claims that we infringe third-party patents or other |
intellectual property rights;
| |
| • | address FDA or other governmental, legal/enforcement actions and remediate underlying problems; |
| |
| • | commercialize our new products, if any such products receive regulatory clearance or approval for sale; and |
| |
| • | acquire companies and license products or intellectual property. |
Such capital may not be available on favorable terms, or at all. Furthermore, if we issue equity or debt securities to raise additional capital, our existing stockholders may experience dilution, and the new equity or debt securities may have rights, preferences and privileges senior to those of our existing stockholders. In addition, if we raise additional capital through collaboration, licensing or other similar arrangements, it may be necessary to relinquish valuable rights to our products, potential products or proprietary technologies, or grant licenses on terms that are not favorable to us. If we cannot raise capital on acceptable terms, we may not be able to develop or enhance our products, execute our business plan, take advantage of future opportunities, or respond to competitive pressures, changes in our supplier relationships, or unanticipated customer requirements. Any of these events could adversely affect our ability to achieve our development and commercialization goals, which could have a material adverse effect on our business, results of operations and financial condition.
Our revolving credit facility contains restrictive covenants that may limit our operating flexibility.
Our revolving credit facility contains certain restrictive covenants that limit, among other things, our ability to dispose of assets, merge with other companies or consummate certain changes of control, pay dividends, incur additional indebtedness and liens, make investments, enter into transactions with affiliates, enter new businesses or prepay subordinated indebtedness. We therefore may not be able to engage in any of the foregoing transactions unless we obtain the consent of the lenders or terminate the revolving credit facility. There is no guarantee that we will be able to generate sufficient cash flow or sales to meet the financial covenants or pay the principal and interest on such debt. Furthermore, there is no guarantee that future working capital, borrowings or equity financing will be available to repay or refinance any such debt.
Continuing worldwide economic instability could adversely affect our revenue, collectability of our accounts receivable, financial condition or results of operations and those of our suppliers, counterparties and consumers, which could harm our financial position.
Since fiscal year 2008, the global economy has been impacted by the sequential effects of an ongoing global financial crisis. This global financial crisis has caused extreme disruption in the financial markets, including severely diminished liquidity and credit availability. There can be no assurance that there will not be further deterioration in the global economy. Our customers and suppliers may experience financial difficulties or be unable to borrow money to fund their operations, which may adversely impact their ability to purchase our products, pay for our products on a timely basis, if at all, or supply us with our products. As with our customers and suppliers, these economic conditions make it more difficult for us to accurately forecast and plan our future business activities. In light of the current economic state of many countries in which we do business, we continue to monitor their creditworthiness. Failure to receive payment of all or a significant portion of these receivables could adversely affect our results of operations.
Risks Related to our Intellectual Property and Potential Litigation
If we are unable to protect our intellectual property rights, our competitive position could be harmed or we could be required to incur significant expenses to enforce our rights.
Our success depends significantly on our ability to protect our proprietary rights to the technologies and inventions used in, or embodied by, our products. We rely on patent protection, as well as a combination of copyright, trade secret and trademark laws, and nondisclosure, confidentiality and other contractual restrictions to protect our proprietary technology. However, these legal means afford only limited protection and may not adequately protect our rights or permit us to gain or keep any competitive advantage.
Patent Rights
As of December 31, 2015, we owned 175 issued U.S. patents, 123 issued foreign patents, 127 pending U.S. patent applications and 101 pending foreign patent applications. It is our practice to file continuation and divisional applications as warranted which may provide additional intellectual property protection if those continuation and divisional applications issue as U.S. patents. Our patents will expire between 2016 and 2035, subject to payment of required maintenance fees,
annuities and other charges.
We have applied for patent protection relating to certain existing and proposed products and processes. While we generally apply for patents in those countries that represent major markets where we intend to make, have made, use or sell key patented products, we may not accurately predict all of the countries where patent protection will ultimately be desirable. If we fail to timely file a patent application in any such country, we may be precluded from doing so at a later date.
Furthermore, the process of applying for patent protection itself is time consuming and expensive and we cannot assure you that any of our patent applications will issue as patents. The rights granted to us under our patents, including prospective rights sought in our pending patent applications, may not be meaningful or provide us with any commercial advantage and they could be opposed, contested or circumvented by our competitors or be declared invalid or unenforceable in judicial or administrative proceedings. In addition, our pending patent applications include claims to material aspects of our products and procedures that are not currently protected by issued patents. In addition, the patents we own may not be of sufficient scope or strength to provide us with any meaningful protection or commercial advantage, and competitors may be able to design around our patents or develop products that provide outcomes comparable to ours without infringing on our intellectual property rights.
Moreover, the United States Patent and Trademark Office, or USPTO, and various foreign governmental patent agencies require compliance with a number of procedural, documentary, fee payment and other similar provisions during the patent application process. In addition, periodic maintenance fees on issued patents often must be paid to the USPTO and foreign patent agencies over the lifetime of the patent. While an unintentional lapse can in many cases be cured by payment of a late fee or by other means in accordance with the applicable rules, there are situations in which noncompliance can result in abandonment or lapse of the patent or patent application, resulting in partial or complete loss of patent rights in the relevant jurisdiction. Non-compliance events that could result in abandonment or lapse of a patent or patent application include, but are not limited to, failure to respond to official actions within prescribed time limits, non-payment of fees and failure to properly legalize and submit formal documents. If we fail to maintain the patents and patent applications covering our products or procedures, we may not be able to stop a competitor from marketing products that are the same as or similar to our products, which would have a material adverse effect on our business.
Due to differences between foreign and U.S. patent laws, our patented intellectual property rights may not receive the same degree of protection in foreign countries as they would in the United States. Even if patents are granted outside the United States, effective enforcement in those countries may not be available, and the scope of protection may vary significantly from country to country. In some cases, we have filed patent applications outside the United States in the EEA, Canada, Australia and Japan and we therefore lack any patent protection in all other countries. In countries where we do not have significant patent protection, we may not be able to stop a competitor from marketing products in such countries that are the same as or similar to our products.
Trademarks
We rely on our trademarks as one means to distinguish our products from the products of our competitors, and have registered or applied to register many of these trademarks. As of December 31, 2015, we had 28 U.S. trademark registrations, 83 foreign trademark registrations, two pending U.S. applications to register trademarks and seven foreign applications to register trademarks. However, our trademark applications may not be approved. Third parties may oppose our trademark applications, or otherwise challenge our use of the trademarks. In the event that our trademarks are successfully challenged, we could be forced to rebrand our products, which could result in loss of brand recognition and could require us to devote resources to advertising and marketing new brands. Our competitors may infringe our trademarks and we may not have adequate resources to enforce our trademarks.
Confidentiality Agreements and Intellectual Property Assignments
Furthermore, although we have taken steps to protect our intellectual property and proprietary technology, including entering into confidentiality agreements and intellectual property assignment agreements with our employees, consultants and scientific advisors, such agreements may not be enforceable or may not provide meaningful protection for our proprietary information or technology in the event of unauthorized use or disclosure or other breaches of such agreements.
Intellectual Property Litigation
In the event a competitor infringes upon our patents, trademarks or other intellectual property rights, enforcing those patents, trademarks and other rights may be costly, difficult, time consuming or unsuccessful. Even if successful, litigation
to enforce our intellectual property rights or to defend our patents against challenge could be expensive and time consuming and could divert our management’s attention from managing our business. Litigation to defend our patents and trademarks against challenges or enforce our intellectual property rights could provoke significant retaliatory litigation, which could be costly, result in the diversion of management’s time and efforts, require us to pay damages and other amounts or prevent us from marketing our existing or future products. Moreover, we may not have sufficient resources or desire to enforce our intellectual property rights or to defend our patents or trademarks against a challenge.
We rely heavily on patent rights that we either license from others or have obtained through assignments which may be subject to assignment back to the original assignor. In both cases, if we fail to make payments, or under certain other circumstances, the other party may terminate the license or require re-assignment of the patent rights, as applicable. If we are unable to maintain our licenses to or ownership of such patent rights, as applicable, or obtain additional licenses and assignments that we may need, our ability to compete will be harmed.
We rely heavily on intellectual property that we license from others, including patented technology that is integral to our devices. We are particularly dependent on our licensing arrangements relating to our MESA technology. We also rely on our licensing arrangement relating to our angle-stable fixation systems and our licensing arrangement relating to our interbody fusion implants. Any of these licensors or other third-party licensors may terminate our license or, in some cases, terminate the limited exclusivity we enjoy under a license, in the event that we fail to make required payments or for other causes. In addition, we may not have the right to enforce licensed patents against third-party infringers, and we thus may be unable to derive full competitive advantage from the licensed patents. Approximately 47%, 50% and 53% of our revenue were derived from sales of products that incorporate licensed technologies for the years ended December 31, 2015, 2014 and 2013, respectively. Furthermore, a number of the patents and patent applications we own were acquired pursuant to assignments which are subject to assignment back to the original licensor if we fail to make required payments or for other causes. If we are unable to maintain our licenses to or ownership of certain patent rights, our ability to compete in the market for spinal surgery devices will be harmed.
In addition, as we enhance our current product offerings and develop new ones, we may find it advisable or necessary to seek additional licenses or assignments from third parties that hold patents covering technology or methods used in our products. If we cannot obtain these additional licenses or assignments, we could be forced to design around those patents at additional cost or abandon the product altogether. As a result, our ability to grow our business and compete in the market for spinal surgery devices may be harmed.
The medical device industry is characterized by patent litigation and we could become subject to litigation that could be costly, result in the diversion of management’s time and efforts and require us to pay damages or prevent us from marketing our existing or future products.
Our commercial success will depend in part on not infringing the patents or violating the other proprietary rights of others. Significant litigation regarding patent rights occurs in our industry. Our competitors in both the United States and abroad, many of which have substantially greater resources and have made substantial investments in patent portfolios and competing technologies, may have applied for or obtained or may in the future apply for and obtain, patents that will prevent, limit or otherwise interfere with our ability to make, use and sell our products. Generally, we do not conduct independent reviews of patents issued to third parties. In addition, patent applications in the United States and elsewhere can be pending for many years before issuance, so there may be applications of others now pending of which we are unaware that may later result in issued patents that will prevent, limit or otherwise interfere with our ability to make, use or sell our products. The large number of patents, the rapid rate of new patent applications and issuances, the complexities of the technology involved and the uncertainty of litigation increase the risk of business assets and management’s attention being diverted to patent litigation. In the future, we may receive communications from various industry participants alleging our infringement of their patents, trade secrets or other intellectual property rights and/or offering licenses to such intellectual property. Any lawsuits resulting from such allegations could subject us to significant liability for damages and invalidate our proprietary rights. Any potential intellectual property litigation also could force us to do one or more of the following:
| |
| • | stop making, selling or using products or technologies that allegedly infringe the asserted intellectual property rights; |
| |
| • | lose the opportunity to license our technology to others or to collect royalty payments based upon successful protection and assertion of our intellectual property rights against others; |
| |
| • | incur significant legal expenses; |
| |
| • | pay substantial damages or royalties to the party whose intellectual property rights we may be found to be infringing; |
| |
| • | pay the attorney fees and costs of litigation to the party whose intellectual property rights we may be found to be infringing; |
| |
| • | redesign those products that contain the allegedly infringing intellectual property, which could be costly, disruptive and/or infeasible; or |
| |
| • | attempt to obtain a license to the relevant intellectual property from third parties, which may not be available on reasonable terms or at all. |
Any litigation or claim against us, even those without merit, may cause us to incur substantial costs, and could place a significant strain on our financial resources, divert the attention of management from our core business and harm our reputation. Further, as the number of participants in the spinal surgery industry grows, the possibility of intellectual property infringement claims against us increases. If we are found to infringe the intellectual property rights of third parties, we could be required to pay substantial damages (which may be increased up to three times of awarded damages if we are found to have willfully infringed such intellectual property rights) and/or substantial royalties and could be prevented from selling our products unless we obtain a license or are able to redesign our products to avoid infringement. Any such license may not be available on reasonable terms, if at all, and there can be no assurance that we would be able to redesign our products in a way that would not infringe the intellectual property rights of others. If we fail to obtain any required licenses or make any necessary changes to our products or technologies, we may have to withdraw existing products from the market or may be unable to commercialize one or more of our products, all of which could have a material adverse effect on our business, results of operations and financial condition.
In addition, we generally indemnify our customers, independent sales agencies and international distributors with respect to infringement by our products of the proprietary rights of third parties. Third parties may assert infringement claims against our customers, independent sales agencies or distributors. These claims may require us to initiate or defend protracted and costly litigation on behalf of our customers, independent sales agencies or distributors, regardless of the merits of these claims. If any of these claims succeed, we may be forced to pay damages on behalf of our customers, independent sales agencies or distributors or may be required to obtain licenses for the products they use. If we cannot obtain all necessary licenses on commercially reasonable terms, our customers may be forced to stop using our products.
We may be subject to damages resulting from claims that we, our employees, our independent sales agencies or our distributors have wrongfully used or disclosed alleged trade secrets of our competitors or are in breach of non- competition or non-solicitation agreements with our competitors.
Many of our employees were previously employed at other medical device companies, including our competitors or potential competitors, in some cases until recently. Many of our independent sales agencies and distributors sell, or in the past have sold, products of our competitors. We may be subject to claims that we, our employees or our independent sales agencies and distributors have inadvertently or otherwise used or disclosed alleged trade secrets or other proprietary information of these former employers or competitors. In addition, we have been and may in the future be subject to claims that we caused an employee to breach the terms of his or her non-competition or non-solicitation agreement. Litigation may be necessary to defend against these claims. Even if we are successful in defending against these claims, litigation could result in substantial costs and could be a distraction to management. If our defense to those claims fails, in addition to paying monetary damages, we may lose valuable intellectual property rights or personnel. Any litigation or the threat thereof may adversely affect our ability to hire employees or contract with independent sales agencies and distributors and their representatives. A loss of key personnel or their work product could have an adverse effect on our business, results of operations and financial condition.
If product liability lawsuits are brought against us, our business may be harmed, and we may be required to pay damages that exceed our insurance coverage.
Our business exposes us to potential product liability claims that are inherent in the testing, manufacture and sale of medical devices for spine surgery procedures. Spine surgery involves significant risk of serious complications, including bleeding, nerve injury, paralysis and even death. Furthermore, if spine surgeons are not sufficiently educated in the use of our products, they may misuse or ineffectively use our products, which may result in unsatisfactory patient outcomes or patient injury. We could become the subject of product liability lawsuits alleging that component failures, malfunctions, manufacturing flaws, design defects or inadequate disclosure of product-related risks or product-related information resulted in an unsafe condition or injury to patients.
As of December 31, 2015 we have had, and continue to have, a small number of product liability claims relating to our products, none of which either individually, or in the aggregate, have resulted, or we believe will result, in a material negative impact on our business. In the future, we may be subject to additional product liability claims, some of which may have a negative impact on our business.
Regardless of the merit or eventual outcome, product liability claims may result in:
| |
| • | decreased demand for our products; |
| |
| • | injury to our reputation; |
| |
| • | significant litigation costs; |
| |
| • | substantial monetary awards to or costly settlements with patients; |
| |
| • | the inability to commercialize new products or product candidates; and |
| |
| • | diversion of management attention from pursuing our business strategy and may be costly to defend. |
Although we have product and other liability insurance that we believe is appropriate for our current level of operations, this insurance is subject to deductibles and coverage limitations. Our current product liability insurance may not continue to be available to us on acceptable terms, if at all, and, if it is available, the coverage may not be adequate to protect us against any future product liability claims. If we are unable to obtain insurance at acceptable cost or on acceptable terms with adequate coverage or otherwise protect against potential product liability claims, we could be exposed to significant financial and other liabilities, which may harm our business. If a product liability claim or series of claims is brought against us for uninsured liabilities or for amounts in excess of insured liabilities, it could have a material adverse effect on our business, results of operations and prospects. Any product liability claim brought against us, with or without merit, could result in the increase of our product liability insurance rates or the inability to secure coverage in the future. In addition, a recall of some of our products, whether or not the result of a product liability claim, could result in significant costs and loss of customers.
In addition, medical malpractice carriers are withdrawing coverage in certain regions or substantially increasing premiums. In the event we become a defendant in a product liability suit in which the treating surgeon or hospital does not have adequate malpractice insurance, the likelihood of liability being imposed on us could increase.
Defending a suit, regardless of merit, could be costly, could divert management’s attention from our business and might result in adverse publicity, which could result in the withdrawal of, or inability to recruit, clinical trial patient participants or result in reduced acceptance of our products in the market. As a result, any product liability claims against us, regardless of their merit, could severely harm our financial condition, strain our management and other resources and adversely affect or eliminate the prospects for commercialization or sales of a product or product candidate that is the subject of any such claim.
Because allograft bone tissue used in our biomaterials program may entail a risk of communicable diseases to human recipients, we may be the subject of product liability claims regarding our allograft bone tissue.
The development and use of allograft bone tissue and biomaterials products may entail particular risk of transmitting diseases to human recipients. Any such transmission could result in the assertion of substantial product liability claims against us. In addition, successful product liability claims made against one of our competitors could cause claims to be made against us or expose us to a perception that we are vulnerable to similar claims. Claims against us arising out of our biomaterials program, regardless of their merit or potential outcome, may also hurt our reputation and ability to sell our products.
Risks Related to Our International Operations
Our international operations subject us to certain operating risks, which could adversely impact our net sales, results of operations and financial condition.
International sales of our products represented 28%, 29% and 29% of our revenue for the years ended December 31, 2015, 2014 and 2013, respectively. The sale and shipment of our products across international borders, as well as any purchase of components and products from international sources, subject us to extensive U.S. and foreign governmental trade, import and export and customs regulations and laws. Compliance with these regulations is costly and exposes us to penalties for non-compliance. Other laws and regulations that can significantly impact us include various anti-bribery laws, including the FCPA and anti-boycott laws. Any failure to comply with applicable legal and regulatory obligations could impact us in a variety of ways that include, but are not limited to, suspension or withdrawal of our CE Certificates of Conformity, significant criminal, civil and administrative penalties, including imprisonment of individuals, fines and penalties, denial of export privileges, seizure of shipments, product recalls and withdrawals, restrictions on certain business activities, and exclusion or debarment from government contracting. Also, the failure to comply with applicable legal and regulatory obligations could result in the disruption of our shipping and sales activities.
In addition, many of the countries in which we sell our products are, to some degree, subject to political, economic or social instability. Our international operations expose us and our distributors to risks inherent in operating in foreign jurisdictions. These risks include, but are not limited to:
| |
| • | differing existing or future regulatory and certification requirements; |
| |
| • | the imposition of additional U.S. and foreign governmental controls or regulations; |
| |
| • | the imposition of costly and lengthy new export licensing requirements; |
| |
| • | pricing pressure that we may experience internationally, which could result from, among other causes, the fact that many foreign governments subject their constituent surgical device companies to a materially less costly regulatory regime than that imposed upon U.S. surgical device companies by the United States government; |
| |
| • | difficulties and costs of staffing and managing foreign operations; |
| |
| • | changes in third-party reimbursement policies that may require some of the patients who receive our products to directly absorb medical costs or that may necessitate the reduction of the selling prices of our products; |
| |
| • | changes in duties and tariffs, license obligations and other non-tariff barriers to trade; |
| |
| • | the imposition of new trade restrictions; |
| |
| • | the imposition of restrictions on the activities of foreign agents, representatives and distributors; |
| |
| • | scrutiny of foreign tax authorities which could result in significant fines, penalties and additional taxes being imposed on us; |
| |
| • | potentially adverse U.S. tax consequences, including regulatory requirements regarding our ability to repatriate profits to the United States; |
| |
| • | the imposition of U.S. or international sanctions against a country, company, person or entity with whom we do business that would restrict or prohibit continued business with the sanctioned country, company, person or entity; |
| |
| • | laws and business practices favoring local companies; |
| |
| • | greater difficulty in collecting accounts receivable and longer collection periods; |
| |
| • | management communication and integration problems related to entering new markets with different languages, cultures and political systems; |
| |
| • | difficulties in maintaining consistency with our internal guidelines in new markets; |
| |
| • | difficulties in enforcing agreements through certain foreign legal systems; |
| |
| • | the uncertainty of protection for intellectual property rights in some countries and difficulties in enforcing or defending intellectual property rights internationally; |
| |
| • | political and economic instability and terrorism; and |
| |
| • | adverse effects due to changes in the EU or Eurozone membership, including risks associated with the potential exit of United Kingdom from the EU. |
In addition, we may encounter difficulties in converting our earnings from international operations to U.S. dollars for use in the United States. These obstacles may include problems moving funds out of the countries in which the funds were earned and difficulties in collecting accounts receivable in foreign countries where the usual accounts receivable payment cycle is longer.
Any of these factors may adversely impact our operations. All of our international sales with independent distributor partners to date have been denominated in U.S. dollars. In the EEA, healthcare regulation and reimbursement for medical devices varies significantly from country-to-country. This changing environment could adversely affect our ability to sell our products in some EEA countries, which could negatively affect our results of operations.
Our international operations expose us to risks of fluctuations in foreign currency exchange rates between the US dollar and the currencies in which our foreign operations receive revenues and pay expenses.
Because our consolidated financial statements are presented in U.S. dollars, during times of a strengthening US dollar, our reported international revenues and earnings will be reduced because the local currency will translate into fewer US dollars. In addition, the assets and liabilities of our non-US subsidiaries are translated into US dollars at the exchange rates in effect at the balance sheet date. Revenues and expenses are translated into US dollars at the average exchange rate for the period. Translation adjustments arising from the use of differing exchange rates from period to period are recorded in shareholders’ equity as accumulated other comprehensive income (loss). Translation adjustments arising from intercompany receivables with our foreign subsidiaries are generally recorded as a component of other expense (income). To date, we have not used risk management techniques to hedge the risks associated with these fluctuations. Even if we were to implement hedging strategies, not every exposure can be hedged and, where hedges are put in place based on expected foreign currency exchange exposure, they are based on forecasts that may vary or that may later prove to have been inaccurate. As a result, changes in currency exchange rates and our failure to effectively hedge these risks will cause our revenues, operating costs, net loss and stockholders’ equity to fluctuate, as they have in the past, which could have a material adverse effect on our results of operations and financial condition.
Failure to comply with the FCPA and similar laws associated with our activities outside the United States could subject us to penalties and other adverse consequences.
We are subject to the FCPA and other anti-bribery legislation around the world. The FCPA generally prohibits covered entities and their intermediaries from engaging in bribery or making other prohibited payments, offers or promises to foreign officials for the purpose of obtaining or retaining business or other advantages. In addition, the FCPA imposes recordkeeping and internal controls requirements on publicly traded corporations and their foreign affiliates, which are intended to, among other things, prevent the diversion of corporate funds to the payment of bribes and other improper payments, and to prevent the establishment of “off books” slush funds from which such improper payments can be made. As a substantial portion of our revenue is, and we expect will continue to be, from jurisdictions outside of the United States, we face significant risks if we fail to comply with the FCPA and other laws that prohibit improper payments, offers or promises of payment to foreign governments and their officials and political parties by us and other business entities for the purpose of obtaining or retaining business or other advantages. In many foreign countries, particularly in countries with developing economies, some of which represent significant markets for us, it may be a local custom that businesses operating in such countries engage in business practices that are prohibited by the FCPA or other laws and regulations. Although we have implemented a company policy requiring our employees and consultants to comply with the FCPA and similar laws, such policy may not be effective at preventing all potential FCPA or other violations. Although our agreements with our international distributors clearly state our expectations for our distributors’ compliance with U.S. laws, including the FCPA, and provide us with various remedies upon any non-compliance, including the ability to terminate the
agreement, we also cannot guarantee our distributors’ compliance with U.S. laws, including the FCPA. Therefore there can be no assurance that none of our employees and agents, or those companies to which we outsource certain of our business operations, have not and will not take actions that violate our policies or applicable laws, for which we may be ultimately held responsible. Any violation of the FCPA and related policies could result in severe criminal or civil sanctions, which could have a material and adverse effect on our reputation, business, results of operations and financial condition.
Furthermore, we are subject to the export controls and economic embargo rules and regulations of the United States, including, but not limited to, the Export Administration Regulations and trade sanctions against embargoed countries, which are administered by the Office of Foreign Assets Control within the Department of the Treasury, as well as the laws and regulations administered by the Department of Commerce. These regulations limit our ability to market, sell, distribute or otherwise transfer our products or technology to prohibited countries or persons. A determination that we have failed to comply, whether knowingly or inadvertently, may result in substantial penalties, including fines and enforcement actions and civil and/or criminal sanctions, the disgorgement of profits and the imposition of a court- appointed monitor, as well as the denial of export privileges, and may have an adverse effect on our reputation.
Risks Related Ownership of Our Common Stock
We are incurring increased costs and are subject to additional regulations and requirements as a result of being a public company, which could lower our profits or make it more difficult to run our business.
As a public company, we are incurring significant legal, accounting and other expenses that we did not incur as a private company, including costs associated with public company reporting requirements. We also have incurred and will continue to incur costs associated with the Sarbanes-Oxley Act and related rules implemented by the SEC and NASDAQ. The expenses incurred by public companies generally for reporting and corporate governance purposes have been increasing. We expect these rules and regulations to increase our legal and financial compliance costs and to make some activities more time-consuming and costly, although we are currently unable to estimate these costs with any degree of certainty. These laws and regulations also could make it more difficult or costly for us to obtain certain types of insurance, including director and officer liability insurance, and we may be forced to accept reduced policy limits and coverage or incur substantially higher costs to obtain the same or similar coverage. These laws and regulations could also make it more difficult for us to attract and retain qualified persons to serve on our Board of Directors, our board committees or as our executive officers. Furthermore, if we are unable to satisfy our obligations as a public company, we could be subject to delisting of our common stock, fines, sanctions and other regulatory action and potentially civil litigation.
If we are unable to implement and maintain effective internal control over financial reporting in the future, investors may lose confidence in the accuracy and completeness of our financial reports and the market price of our common stock may be negatively affected.
As a public company, we are required to maintain internal controls over financial reporting and to report any material weaknesses in such internal controls. Beginning with this annual report on Form 10-K, we have furnished our first report by management on the effectiveness of our internal control over financial reporting, pursuant to Section 404 of the Sarbanes-Oxley Act. However, as an emerging growth company, our independent registered public accounting firm will not be required to express an opinion as to the effectiveness of our internal control over financial reporting pursuant to Section 404 until we file our annual report for the first fiscal year in which we are no longer an emerging growth company. At such time, our independent registered public accounting firm may issue a report that is adverse in the event it is not satisfied with the level at which our controls are documented, designed or operating. The process of designing, implementing, and testing the internal control over financial reporting required to comply with this obligation is time consuming, costly, and complicated. If we identify material weaknesses in our internal control over financial reporting, if we are unable to comply with the requirements of Section 404 of the Sarbanes-Oxley Act in a timely manner or assert that our internal control over financial reporting is effective or if our independent registered public accounting firm, when required, is unable to express an opinion as to the effectiveness of our internal control over financial reporting, investors may lose confidence in the accuracy and completeness of our financial reports and the market price of our common stock could be negatively affected, and we could become subject to investigations by the stock exchange on which our securities are listed, the SEC or other regulatory authorities, which could require additional financial and management resources.
The market price of shares of our common stock may be volatile, which could cause the value of your investment to decline.
The market price of our common stock may be highly volatile and could be subject to wide fluctuations. Securities markets worldwide experience significant price and volume fluctuations. This market volatility, as well as general economic, market or political conditions, could reduce the market price of shares of our common stock in spite of our operating performance. In addition, our results of operations could be below the expectations of public market analysts
and investors due to a number of potential factors, including variations in our quarterly results of operations, additions or departures of key management personnel, failure to meet analysts’ earnings estimates, publication of research reports about our industry, litigation and government investigations, changes or proposed changes in laws or regulations or differing interpretations or enforcement thereof affecting our business, adverse market reaction to any indebtedness we may incur or securities we may issue in the future, changes in market valuations of similar companies or speculation in the press or investment community, announcements by our competitors of significant contracts, acquisitions, dispositions, strategic partnerships, joint ventures or capital commitments, adverse publicity about the industries we participate in or individual scandals, and in response the market price of shares of our common stock could decrease significantly. You may be unable to resell your shares of common stock at or above the price at which you purchased them.
In the past few years, stock markets have experienced extreme price and volume fluctuations. In the past, following periods of volatility in the overall market and the market price of a company’s securities, securities class action litigation has often been instituted against these companies. This litigation, if instituted against us, could result in substantial costs and a diversion of our management’s attention and resources.
Because we have no current plans to pay cash dividends on our common stock, you may not receive any return on investment unless you sell your common stock for a price greater than that which you paid for it.
We have no current plans to pay dividends on our common stock. The declaration, amount and payment of any future dividends on shares of common stock will be at the sole discretion of our Board of Directors. Our Board of Directors may take into account general and economic conditions, our financial condition and results of operations, our available cash and current and anticipated cash needs, capital requirements, contractual, legal, tax and regulatory restrictions and implications on the payment of dividends by us to our stockholders or by our subsidiaries to us and such other factors as our Board of Directors may deem relevant. In addition, our ability to pay dividends will be limited by our revolving credit facility and may be limited by covenants of other indebtedness we or our subsidiaries incur in the future. As a result, you may not receive any return on an investment in our common stock unless you sell our common stock for a price greater than that which you paid for it.
You may be diluted by the future issuance of additional common stock in connection with our incentive plans, acquisitions or otherwise.
We have approximately 710 million shares of common stock authorized but unissued. Our amended and restated certificate of incorporation authorizes us to issue these shares of common stock and options, rights, warrants and appreciation rights relating to common stock for the consideration and on the terms and conditions established by our Board of Directors in its sole discretion, whether in connection with acquisitions or otherwise. We have reserved 342,507 shares for future issuance under our 2014 Omnibus Incentive Plan. In addition, as of December 31, 2015, we have reserved 333,753 shares of common stock for future issuance under our Employee Stock Purchase Plan (“ESPP”). Any common stock that we issue, including under our 2014 Omnibus Incentive Plan, our ESPP or other equity incentive plans that we may adopt in the future, would dilute our percentage ownership held by the investors who currently own our common stock.
If we or our pre-IPO owners sell additional shares of our common stock, the market price of our common stock could decline.
The sale of substantial amounts of shares of our common stock in the public market, or the perception that such sales could occur, could harm the prevailing market price of shares of our common stock. These sales, or the possibility that these sales may occur, also might make it more difficult for us to sell equity securities in the future at a time and at a price that we deem appropriate.
Pursuant to a registration rights agreement entered into in connection with our purchase by WCAS, we granted WCAS the right, subject to certain conditions, to require us to register the sale of their shares of our common stock under the Securities Act. By exercising their registration rights and selling a large number of shares, WCAS could cause the prevailing market price of our common stock to decline. As of December 31, 2015, the shares covered by registration rights would represent approximately 33.2% of our outstanding common stock. Registration of any of these outstanding shares of common stock would result in such shares becoming freely tradable without compliance with Rule 144 upon effectiveness of the registration statement.
As restrictions on resale end or if WCAS exercises its registration rights, the market price of our shares of common stock could drop significantly if the holders of these restricted shares sell them or are perceived by the market as intending to sell them. These factors could also make it more difficult for us to raise additional funds through future offerings of our shares of common stock or other securities.
Anti-takeover provisions in our organizational documents and Delaware law might discourage or delay acquisition attempts for us that you might consider favorable.
Our amended and restated certificate of incorporation and amended and restated bylaws contain provisions that may make the merger or acquisition of our company more difficult without the approval of our Board of Directors. Among other things:
| |
| • | although we do not have a stockholder rights plan, these provisions would allow us to authorize the issuance of undesignated preferred stock in connection with a stockholder rights plan or otherwise, the terms of which may be established and the shares of which may be issued without stockholder approval, and which may include super voting, special approval, dividend, or other rights or preferences superior to the rights of the holders of common stock; |
| |
| • | these provisions provide for a classified Board of Directors with staggered three-year terms; |
| |
| • | these provisions prohibit stockholder action by written consent from and after the date on which WCAS and its affiliates beneficially own, in the aggregate, less than 50% in voting power of the stock of the Company entitled to vote generally in the election of directors, unless such action is recommended by all directors then in office; |
| |
| • | these provisions provide that the Board of Directors is expressly authorized to make, alter, or repeal our bylaws. Since WCAS and its affiliates currently beneficially own, in the aggregate, less than 50% in voting power of all outstanding shares of the stock of the Company entitled to vote generally in the election of directors, any amendment, alteration, rescission or repeal of our bylaws by our stockholders requires the affirmative vote of the holders of at least 66 2/3% in voting power of all the then-outstanding shares of stock of the Company entitled to vote thereon, voting together as a single class; and |
| |
| • | these provisions establish advance notice requirements for nominations for elections to our board or for proposing matters that can be acted upon by stockholders at stockholder meetings. |
Further, as a Delaware corporation, we are also subject to provisions of Delaware law, which may impair a takeover attempt that our stockholders may find beneficial. These anti-takeover provisions and other provisions under Delaware law could discourage, delay or prevent a transaction involving a change in control of our company, including actions that our stockholders may deem advantageous, or negatively affect the trading price of our common stock. These provisions could also discourage proxy contests and make it more difficult for you and other stockholders to elect directors of your choosing and to cause us to take other corporate actions you desire.
We are an “emerging growth company” and we cannot be certain if the reduced disclosure requirements applicable to “emerging growth companies” will make our common stock less attractive to investors.
We are an “emerging growth company,” as defined in the Jumpstart Our Business Startups ("JOBS Act,") and we may continue to take advantage of certain exemptions and relief from various reporting requirements that are applicable to other public companies that are not “emerging growth companies.” In particular, while we remain an “emerging growth company,” (1) we are not required to comply with the auditor attestation requirements of Section 404(b) of the Sarbanes-Oxley Act, (2) we are exempt from any rules that may be adopted by the PCAOB requiring mandatory audit firm rotations or a supplement to the auditor’s report on financial statements, (3) we are subject to reduced disclosure obligations regarding executive compensation in our periodic reports and proxy statements and (4) we are not required to hold nonbinding advisory votes on executive compensation or stockholder approval of any golden parachute payments not previously approved.
In addition, we have elected to delay the adoption of new or revised accounting standards applicable to public companies until those standards apply to private companies, and as a result, we may not comply with new or revised accounting standards on the relevant dates on which adoption of such standards is required for non-emerging growth companies. As a result of this election, our financial statements may not be comparable to the financial statements of other public companies.
We also currently take advantage of the reduced disclosure requirements regarding executive compensation. We may take advantage of other exemptions, including the exemptions from the advisory vote requirements and executive
compensation disclosures under the Dodd-Frank Wall Street Reform and Customer Protection Act, or the Dodd-Frank Act, and the exemption from the provisions of Section 404(b) of the Sarbanes-Oxley Act. We may remain an “emerging growth company” until as late as December 31, 2019 (the fiscal year-end following the fifth anniversary of the completion of our IPO), though we may cease to be an “emerging growth company” earlier under certain circumstances, including (1) if the market value of our common stock that is held by nonaffiliates exceeds $700.0 million as of any June 30, in which case we would cease to be an “emerging growth company” as of the following December 31, (2) if our gross revenue exceeds $1.0 billion in any fiscal year or if we issue more than $1.0 billion in non-convertible notes in any three year period.
Our Board of Directors is authorized to issue and designate shares of our preferred stock in additional series without stockholder approval.
Our amended and restated certificate of incorporation authorizes our Board of Directors, without the approval of our stockholders, to issue 100 million shares of our preferred stock, subject to limitations prescribed by applicable law, rules and regulations and the provisions of our amended and restated certificate of incorporation, as shares of preferred stock in series, and to establish from time to time the number of shares to be included in each such series, and to fix the designation, powers, preferences and rights of the shares of each such series and the qualifications, limitations or restrictions thereof. The powers, preferences and rights of these additional series of preferred stock may be senior to or on parity with our common stock, which may reduce its value.
Our ability to use our net operating loss carryforwards may be subject to limitation.
As of December 31, 2015, we had federal net operating loss carryforwards (“NOLs”), to offset future taxable income. A lack of future taxable income would adversely affect our ability to use these NOLs and, as a result of this and other factors, we have taken a valuation allowance against the NOLs. In addition, under Section 382 of the Internal Revenue Code of 1986, as amended (the “Code”), a corporation that undergoes an “ownership change” is subject to limitations on its ability to use its NOLs to offset future taxable income. In general, a corporation that undergoes an ownership change may use its NOLs for a given year in an amount not greater than the product of the applicable federal long-term tax-exempt rate multiplied by the value of its capital stock immediately before the ownership change, and potentially increased for certain gains recognized by the corporation within five years after the ownership change if it has a net built-in gain in its assets at the time of the ownership change. We underwent such an ownership change in 2010 and 2015, and, as a result, we are limited in our ability to use the portion of our NOLs that existed as of the time of such ownership changes. Because of this limitation and other factors, we have taken a valuation allowance against all of our NOLs. If we experience another ownership change, we would also become limited in our ability to use the portion of our NOLs that did not exist as of the time of the ownership change that occurred in 2010 or 2015. Based on the current applicable federal long-term tax exempt rate, the current value of our capital stock and certain net built-in gains in our assets, in the event that we experience another ownership change as a result of this offering, we do not anticipate that our ability to use the portion of our NOLs that are not currently subject to limitation will be materially affected. Future changes in our stock ownership, however, could also result in an ownership change under Section 382 of the Code. If such an ownership change occurred, our ability to use our NOLs to offset future taxable income, if any, would depend on the applicable federal long-term tax exempt rate, the value of our capital stock, and the amount of certain net built-in gains in our assets, all as of the time of such an ownership change, and our ability to use our NOLs could be limited.
ITEM 1B. UNRESOLVED STAFF COMMENTS
None
ITEM 2. PROPERTIES
We lease our corporate headquarters of approximately 80,000 square feet, located at 751 Miller Drive SE, Leesburg, Virginia 20175. This facility houses our research, product development, medical education, administration, warehouse and shipping functions. The lease term expires in September 2016. As described below, we intend to relocate from this facility prior to the lease term expiration.
In December 2014, we entered into a lease for approximately 146,000 square feet to accommodate the expansion of our operations in Leesburg, Virginia. As of December 31, 2015, two adjacent buildings are presently under construction that will house our existing Leesburg operations. We expect construction of the buildings and improvements necessary to commence operations to be completed in the first half of 2016. The lease term commences in March 2016 and expires in September 2031. See Item 1A - Risk Factors - Risks Related to Our Business and Our Industry - We may not fully realize the anticipated benefits, or we may face interruptions and disruptions, in connection with the relocation of our corporate headquarters to a new facility.
We also lease approximately 7,000 square feet in Malvern, Pennsylvania. This facility serves as a machine shop for the production of prototypes and special instrument manufacturing. The lease term expires in December 2016. We may extend our lease or choose to let the initial lease expire and find alternative space. Elsewhere in the United States, we lease office space in Chicago, Illinois; Denver, Colorado and Jacksonville, Florida.
Outside of the United States, we lease approximately 7,000 square feet in Staines, United Kingdom which serves as our Europe/Middle East/Africa (“EMEA”) headquarters and principal distribution center serving our direct operations in Europe. This lease term expires in January 2017. We may extend our lease or choose to let the initial lease expire and find alternative office space to lease. We also lease sales office space in Rosenheim, Germany and Gallarate, Italy.
ITEM 3. LEGAL PROCEEDINGS
The medical device industry is characterized by frequent claims and litigation, including claims regarding patent and other intellectual property rights as well as improper hiring practices. We are not aware of any pending or threatened legal proceeding against us that we expect would have a material adverse effect on our business, operating results or financial condition. However, we are a party in multiple legal actions involving claimants seeking various remedies, including monetary damages and none of the outcomes are certain or entirely within our control.
ITEM 4. MINE SAFETY DISCLOSURES
Not applicable.
PART II
ITEM 5. MARKET FOR REGISTRANT'S COMMON EQUITY, RELATED STOCKHOLDER MATTERS AND ISSUER PURCHASES OF EQUITY SECURITIES
Market Information
Our common stock has been listed on the NASDAQ under the symbol “KTWO” since May 8, 2014. Prior to that date, there was no public trading market for our common stock. Our initial public offering was priced at $15.00 per share on May 7, 2014.
The following table sets forth for the periods indicated the high and low sales prices of our common stock as reported on the NASDAQ:
|
| | | | | | | | | | | | | | | | |
| | | 2015 | | 2014 |
| | | Sales Price | | Sales Price |
| | | Low | | High | | Low | | High |
| First Quarter | | $ | 21.76 |
| | $ | 22.50 |
| | $ | — |
| | $ | — |
|
| Second Quarter (from May 8, 2014) | | $ | 23.43 |
| | $ | 24.32 |
| | $ | 13.71 |
| | $ | 16.49 |
|
| Third Quarter | | $ | 16.82 |
| | $ | 18.81 |
| | $ | 12.31 |
| | $ | 17.98 |
|
| Fourth Quarter | | $ | 19.49 |
| | $ | 20.09 |
| | $ | 13.27 |
| | $ | 23.63 |
|
On February 26, 2016, the last reported sales price of our common stock on the NASDAQ was $12.74 per share and there were approximately 28 holders of our common stock.
Recent Sales of Unregistered Securities
None.
Dividend Policy
We have neither declared nor paid any cash dividends on our common stock and we do not expect to pay dividends on our common stock for the foreseeable future. We anticipate that all of our earnings will be used for the operation and growth of our business. Any decision to declare and pay dividends in the future will be made at the sole discretion of our Board of Directors and will depend on, among other things, our results of operations, cash requirements, financial condition, contractual restrictions and other factors that our Board of Directors may deem relevant. In addition, the credit agreement governing our revolving credit facility restricts our ability to pay dividends on our common stock. We expect that any future credit agreements will contain similar restrictions. See Item 7 - Management’s Discussion and Analysis of Financial Condition and Results of Operations—Liquidity and Capital Resources—Indebtedness—Revolving Credit Facility.
We did not declare or pay any dividends on our common stock in the three years ended December 31, 2015.
Securities Authorized for Issuance Under Equity Compensation Plans
The following table sets forth information regarding our equity compensation plans as of December 31, 2015:
|
| | | | | | | | | |
| Plan Category | Number of securities to be issued upon exercise of outstanding options, warrants and rights (a) | | Weighted-average exercise price of outstanding options, warrants and rights (b) | | Number of securities remaining available for future issuance under equity compensation plans (excluding securities reflected in column (a)) (c) | |
| Equity compensation plans approved by stockholders: | | | | | | |
Employees and other participants stock options (1) | 4,175,960 |
| | $ 11.51 |
| | 342,507 |
| |
| Employee stock purchase plan | 28,988 |
| | — |
| | 333,753 |
| |
(1) Consists of 3,682,019 stock options with a weighted-average exercise price of $11.51, 79,940 restricted stock and 414,001 restricted share units.
Performance Graph
The following graph compares the cumulative total stockholder return data on our common stock with the cumulative return of (i) The NASDAQ Stock Market Composite Index, and (ii) NASDAQ Medical Equipment Index during the period commencing on May 8, 2014, the initial trading day of our common stock, and ending on December 31, 2015. The graph assumes that $100 was invested at the beginning of the period in our common stock and in each of the comparative indices. The stock price performance on the following graph is based on historical results and is not necessarily indicative of future stock price performance.
The following graph and related information shall not be deemed “soliciting material” or be deemed to be “filed” with the SEC, nor shall such information be incorporated by reference into any future filing, except to the extent that we specifically incorporate it by reference into such filing.
Comparison of Cumulative Total Return
Among K2M Group Holdings, Inc.,
The NASDAQ Composite Index
And The NASDAQ Medical Equipment Index
ITEM 6. SELECTED HISTORICAL CONSOLIDATED FINANCIAL DATA
The following tables present our selected historical consolidated financial and operating data for the periods indicated. The selected consolidated statement of operations data for the years ended December 31, 2015, 2014 and 2013 and the summary consolidated balance sheet data as of December 31, 2015 and 2014 have been derived from our audited consolidated financial statements included in this filing. The selected statement of operations data for the year ended December 31, 2012 and 2011 the selected consolidated balance sheet data as of December 31, 2012 and 2011 have been derived from our audited consolidated financial statements, which are not included in this Annual Report. Our historical results are not necessarily indicative of the results that may be expected in the future. The summary financial information below should be read in conjunction with the information contained in Item 7 - Management’s Discussion and Analysis of Financial Condition and Results of Operations, the consolidated financial statements and notes thereto, and other financial information included elsewhere in this Annual Report on Form 10-K.
|
| | | | | | | | | | | | | | | | | | | | |
| | | Year Ended December 31, |
| | | 2015 | | 2014 | | 2013 | | 2012 | | 2011 |
| | | (in thousands, except per share data) | | |
| Statement of Operations Data: |
| Revenue | | $ | 216,007 |
| | $ | 186,672 |
| | $ | 157,584 |
| | $ | 135,145 |
| | $ | 118,005 |
|
| Cost of revenue | | 71,791 |
| | 62,800 |
| | 50,162 |
| | 43,962 |
| | 47,984 |
|
| Gross profit | | 144,216 |
| | 123,872 |
| | 107,422 |
| | 91,183 |
| | 70,021 |
|
| Operating expenses: | | | | | | | | | | |
| Research and development | | 19,868 |
| | 16,302 |
| | 12,402 |
| | 9,031 |
| | 11,930 |
|
| Sales and marketing | | 105,635 |
| | 95,323 |
| | 80,183 |
| | 70,163 |
| | 63,176 |
|
| General and administrative | | 54,983 |
| | 60,216 |
| | 59,758 |
| | 57,821 |
| | 49,431 |
|
| Contingent consideration | | — |
| | — |
| | — |
| | (324 | ) | | (50,436 | ) |
| Total operating expenses | | 180,486 |
| | 171,841 |
| | 152,343 |
| | 136,691 |
| | 74,101 |
|
| Loss from operations | | (36,270 | ) | | (47,969 | ) | | (44,921 | ) | | (45,508 | ) | | (4,080 | ) |
| Other expense: | | | | | | | | | | |
| Foreign currency transaction gain (loss) | | (1,813 | ) | | (4,752 | ) | | 1,477 |
| | 1,034 |
| | (560 | ) |
| Discount on prepayment of notes to stockholders | | — |
| | (4,825 | ) | | — |
| | — |
| | — |
|
| Interest expense | | (941 | ) | | (2,205 | ) | | (2,810 | ) | | (1,222 | ) | | (236 | ) |
| Total other expense, net | | (2,754 | ) | | (11,782 | ) | | (1,333 | ) | | (188 | ) | | (796 | ) |
| Loss before income taxes | | (39,024 | ) | | (59,751 | ) | | (46,254 | ) | | (45,696 | ) | | (4,876 | ) |
| Income tax expense (benefit) | | 192 |
| | (114 | ) | | (8,341 | ) | | (13,041 | ) | | (18,221 | ) |
| Net income (loss) | | (39,216 | ) | | (59,637 | ) | | (37,913 | ) | | (32,655 | ) | | 13,345 |
|
| Accretion or write-up of preferred stock | | — |
| | 6,879 |
| | (19,439 | ) | | (9,954 | ) | | (13,773 | ) |
| Net loss attributable to stockholders | | $ | (39,216 | ) | | $ | (52,758 | ) | | $ | (57,352 | ) | | $ | (42,609 | ) | | $ | (428 | ) |
| Net loss per share attributable to common stockholders: | | | | | | | | | | |
| Basic and diluted | | $ | (0.97 | ) | | $ | (1.65 | ) | | $ | (2.58 | ) | | $ | (1.94 | ) | | $ | (0.02 | ) |
| Weighted-average shares outstanding: | | | | | | | | | | |
| Basic and diluted | | 40,237,848 |
| | 31,887,246 |
| | 22,238,632 |
| | 21,920,512 |
| | 21,774,000 |
|
|
| | | | | | | | | | | | | | | | | | | | |
| | | Year Ended December 31, |
| | | 2015 | | 2014 | | 2013 | | 2012 | | 2011 |
| | | (in thousands) |
| Balance Sheet Data: | | | | | | | | | | |
| Cash and cash equivalents | | $ | 34,646 |
| | $ | 11,411 |
| | $ | 7,419 |
| | $ | 7,011 |
| | $ | 12,226 |
|
| Working capital | | 107,408 |
| | 66,293 |
| | 32,549 |
| | 47,369 |
| | 44,588 |
|
| Total assets | | 374,512 |
| | 299,191 |
| | 296,936 |
| | 299,617 |
| | 329,659 |
|
| Long-term debt, net of discount | | — |
| | — |
| | 19,650 |
| | 26,668 |
| | 13,000 |
|
| Long-term capital lease obligations | | 34,140 |
| | — |
| | — |
| | — |
| | — |
|
| Total liabilities | | 87,850 |
| | 40,737 |
| | 93,670 |
| | 71,517 |
| | 73,354 |
|
| Total redeemable convertible preferred stock | | — |
| | — |
| | 109,081 |
| | 78,068 |
| | 65,719 |
|
| Total stockholders’ equity | | 286,662 |
| | 258,454 |
| | 94,185 |
| | 150,032 |
| | 190,586 |
|
|
| | | | | | | | | | | | | | | | | | |
| | | Year Ended December 31, |
| | | 2015 | | 2014 | | 2013 | | 2012 | | 2011 |
| | | | | (in thousands) |
| Other Financial Data: | | | | | | | | | | |
| Depreciation and amortization | | $ | 24,940 |
| | 33,324 |
| | 36,776 |
| | $ | 41,824 |
| | $ | 34,831 |
|
Adjusted EBITDA(1) (unaudited) | | (142 | ) | | (8,838 | ) | | (5,266 | ) | | (1,765 | ) | | (7,353 | ) |
(1) Adjusted EBITDA represents net income (loss) plus interest expense, discount on prepayment of notes to stockholders, income tax expense (benefit), depreciation and amortization, stock-based compensation expense and foreign currency transaction loss (gain) and adjustments related to our purchase by WCAS.
We present Adjusted EBITDA because we believe it is a useful indicator of our operating performance. Our management uses Adjusted EBITDA principally as a measure of our operating performance and for planning purposes, including the preparation of our annual operating budget and financial projections. We believe that Adjusted EBITDA is useful to investors because it is frequently used by analysts, investors and other interested parties to evaluate companies in our industry. We also believe Adjusted EBITDA is useful to our management and investors as a measure of comparative operating performance from period to period.
Adjusted EBITDA is a non-GAAP financial measure and should not be considered as an alternative to net loss as a measure of financial performance or cash flows from operations as a measure of liquidity, or any other performance measure derived in accordance with GAAP and it should not be construed as an inference that our future results will be unaffected by unusual or non-recurring items. In addition, Adjusted EBITDA is not intended to be a measure of free cash flow for management’s discretionary use, as it does not reflect certain cash requirements such as tax payments, debt service requirements, capital expenditures and certain other cash costs that may recur in the future. Adjusted EBITDA contains certain other limitations, including the failure to reflect our cash expenditures, cash requirements for working capital needs and cash costs to replace assets being depreciated and amortized. In evaluating Adjusted EBITDA, you should be aware that in the future we may incur expenses that are the same as or similar to some of the adjustments in this presentation. Our presentation of Adjusted EBITDA should not be construed to imply that our future results will be unaffected by any such adjustments. Management compensates for these limitations by primarily relying on our GAAP results in addition to using Adjusted EBITDA supplementally. Our definition of Adjusted EBITDA is not necessarily comparable to other similarly titled captions of other companies due to different methods of calculation.
The following table provides a reconciliation of net income (loss) to Adjusted EBITDA:
|
| | | | | | | | | | | | | | | | | | | | |
| | | Year Ended December 31, |
| | | 2015 | | 2014 | | 2013 | | 2012 | | 2011 |
| | | (in thousands) |
| Net income (loss) | | $ | (39,216 | ) | | $ | (59,637 | ) | | $ | (37,913 | ) | | $ | (32,655 | ) | | $ | 13,345 |
|
| Interest expense | | 941 |
| | 2,205 |
| | 2,810 |
| | 1,222 |
| | 236 |
|
| Discount on prepayment of notes to stockholders | | — |
| | 4,825 |
| | — |
| | — |
| | — |
|
| Income tax expense (benefit) | | 192 |
| | (114 | ) | | (8,341 | ) | | (13,041 | ) | | (18,221 | ) |
| Depreciation and amortization | | 24,940 |
| | 33,324 |
| | 36,776 |
| | 41,824 |
| | 34,831 |
|
| Stock-based compensation expense | | 11,188 |
| | 5,807 |
| | 2,879 |
| | 2,243 |
| | 3,272 |
|
| Foreign currency transaction (gain) loss | | 1,813 |
| | 4,752 |
| | (1,477 | ) | | (1,034 | ) | | 560 |
|
| Adjustments related to our purchase by WCAS | | — |
| | — |
| | — |
| | (324 | ) | | (41,376 | ) |
Adjusted EBITDA (unaudited) | | $ | (142 | ) | | $ | (8,838 | ) | | $ | (5,266 | ) | | $ | (1,765 | ) | | $ | (7,353 | ) |
ITEM 7. MANAGEMENT’S DISCUSSION AND ANALYSIS OF FINANCIAL CONDITION AND RESULTS OF OPERATIONS
The following discussion and analysis of our financial condition and results of operations should be read together with Item 1A - Risk Factors; Item 6 - Selected Historical Consolidated Financial Data and our consolidated financial statements and related notes thereto included elsewhere in this Annual Report. In addition to historical consolidated financial information, the following discussion contains forward-looking statements that reflect our plans, estimates and beliefs. Our actual results could differ materially from those contained in or implied by the forward-looking statements. See Part I - Forward Looking Statements. All references to years, unless otherwise noted, refer to our fiscal years, which end on December 31. Certain amounts and percentages in this discussion and analysis have been rounded for convenience of presentation.
Overview
We are a global medical device company focused on designing, developing and commercializing innovative and proprietary complex spine and minimally invasive technologies and techniques. Our complex spine products are used by spine surgeons to treat some of the most difficult and challenging spinal pathologies, such as deformity (primarily scoliosis), trauma and tumor. We believe these procedures typically receive a higher rate of positive insurance coverage and often generate more revenue per procedure as compared to other spine surgery procedures. We have applied our product development expertise in innovating complex spine technologies and techniques to the design, development and commercialization of an expanding number of proprietary MIS products. These proprietary MIS products are designed to allow for less invasive access to the spine and faster patient recovery times compared to traditional open access surgical approaches. We have also leveraged these core competencies in the design, development and commercialization of an increasing number of products for patients suffering from degenerative spinal conditions.
We categorize our revenue in the United States amongst revenue generated from the treatment of complex spine pathologies, treatment using MIS approaches and the treatment of degenerative spinal conditions. We define our complex spine procedures as those that involve the treatment of the most difficult and challenging spinal pathologies, such as deformity, trauma and tumor. We consider MIS procedures as degenerative procedures done through minimally invasive approaches designed to allow for less invasive access to the spine and faster patient recovery times as compared to traditional open access surgical approaches. We categorize degenerative procedures as those involving products treating degenerative spinal conditions such as traditional spinal fusions. We report revenue related to the sale of biomaterials as part of our complex spine, MIS and degenerative spine revenue categories. We expect our revenue to continue to be driven by aggregate sales growth in all categories. Our revenue classifications may evolve as we grow our business, continue to commercialize new products, adapt to surgeon preferences and surgical techniques and expand our sales globally.
The primary market for our products has been the United States, where we sell our products through a hybrid sales organization consisting of direct sales employees and independent sales agencies. As of December 31, 2015, our U.S. sales force consisted of 124 direct sales employees and 85 independent sales agencies, who distribute our products and are compensated through a combination of base salaries, individual and company-based performance bonuses, commissions and stock options. We do not sell our products through or participate in PODs.
We also market and sell our products internationally in 36 countries. We sell our products directly in certain markets such as the United Kingdom and Germany, use independent agencies in Italy and Canada and through independent distributors in other markets such as Australia, Japan and Spain. For 2015, international sales accounted for approximately 28.1% of our revenue. As of December 31, 2015, our international sales force consisted of 39 direct sales employees, 10 independent agencies and 26 independent distributors. Our independent distributors manage the billing relationship with each hospital in their respective territories and are responsible for servicing the product needs of their surgeon customers. We believe there are significant opportunities for us to increase our presence through the expansion of our distribution network and the commercialization of additional products or product line extensions. In 2015, revenue denominated in currencies other than in US Dollars represented less than 10% of our consolidated revenue.
Components of our Results of Operations
We manage our business globally within one reportable segment, which is consistent with how our management reviews our business, prioritizes investment and resource allocation decisions and assesses operating performance.
Revenue
We market and sell spinal implants, disposables and instruments, primarily to hospitals, for use by surgeons to treat patients with spinal pathologies. In the United States and international markets where we have direct employee sales locations, which
include the United Kingdom, Ireland, Germany, Austria and Switzerland, we manage and maintain the sales relationships with our hospital customers. In those international markets where we utilize independent distributorships, we do not manage or maintain the sales relationships with the hospital customers. We do, however, support our distributor partners by providing product training, medical education and engineering expertise to surgeons practicing in these markets.
In markets where we have a direct presence, we generally assign our surgical sets to our direct sales employees. A surgical set typically contains the instruments, including any disposables, and spinal implants necessary to complete a successful surgery. With our support, the direct sales employee maintains the surgical sets and places them with our hospital customers for use by surgeons. We recognize revenue upon receipt of a delivered order confirming that our products have been used in a surgical procedure or following shipment and transfer of title to a hospital that purchases products in advance of the surgery.
In our international markets where we utilize independent distributorships, we generally sell our surgical sets and the related spinal implant replenishments to our distributors on pre-agreed business terms. We recognize revenue when the title to the goods and the risk of loss related to those goods are transferred. All such sales to distributors are not subject to contingencies and are, therefore, final.
International revenue was 28.1%, 28.7% and 29.1% of total revenue for 2015, 2014 and 2013, respectively.
In addition, we generated 56.0%, 54.3% and 56.9% of our U.S. revenue from the sale of our complex spine and MIS products for 2015, 2014 and 2013, respectively. We expect that these core product categories will continue to be a significant contributor to our revenue growth in the future.
While we believe the proportion of our international revenue from complex spine and MIS is even higher than in the United States, a significant portion of our international revenue is derived from our distributor partners who do not report their product usage at the surgeon or hospital level, which prevents us from providing a specific breakdown for our international revenue among our three product categories.
Cost of Revenue
Except for certain specialty products that we manufacture in-house, our instruments, spinal implants and related offerings are manufactured to our specifications by third-party suppliers who meet our manufacturer qualification standards. Our third-party manufacturers meet FDA, International Organization for Standardization (ISO) and other country-specific quality standards supported by our internal specifications and procedures. Substantially all of our suppliers manufacture our products in the United States. Our cost of revenue consists primarily of costs of products purchased from our third-party suppliers, amortization of surgical instruments, inventory reserves, royalties, inbound shipping, inspection and related costs incurred in making our products available for sale or use. Cost of revenue also includes related personnel and consultants’ compensation and stock-based compensation expense. Through 2015, our cost of revenue included the effect of a 2.3% excise tax on the sale of medical devices sold in the United States. Such tax was suspended by the U.S. for a two year period beginning in 2016. We expect our cost of revenue to increase in absolute terms due primarily to increased sales volume and changes in the geographic mix of our sales as our international operations tend to have a higher cost of revenue as a percentage of sales.
Research and Development
Our research and development expenses primarily consist of research and development, engineering, product development, clinical expenses, regulatory expenses, related consulting services, third-party prototyping services, outside research activities, materials production and other costs associated with the design and development of our products. Research and development expenses also include related personnel and consultants’ compensation and stock-based compensation expense. We expense research and development costs as they are incurred. We expect to incur additional costs as we continue to design and commercialize new products. While our research and development expenses fluctuate from period to period based on the timing of specific research, development and testing initiatives, we generally expect these costs will increase in absolute terms over time as we continue to expand our product portfolio and add related personnel.
Sales and Marketing
Sales and marketing expenses primarily consist of commissions to our independent distributors, as well as compensation, commissions, benefits and other related costs, including stock-based compensation, for personnel employed in our sales, marketing and clinical sales support departments. Sales and marketing also includes the costs of medical education, training, sales related shipping and corporate communications activities. We expect our sales and marketing expenses will increase in absolute terms due to increased sales volume, the continued expansion of our sales force and the continued design and commercialization of new products.
General and Administrative
General and administrative expenses include compensation, benefits and other related costs, including stock-based compensation for personnel employed in our executive management, finance, regulatory, information technology, legal and human resource departments, as well as facility costs and costs associated with consulting and other finance, legal, information technology and human resource services provided by third-parties. We include legal and litigation expenses as well as costs related to the development and protection of our intellectual property portfolio in general and administrative expenses. We expect our general and administrative expenses to continue to increase in absolute dollars as we hire additional personnel to support the growth of our business. In addition, we expect to continue to incur increased expenses as a result of being a public company. General and administrative expenses also include amortization expense of certain of our intangible assets. However, the amortization of such assets is expected to decline over the next several years as such assets subject to amortization become fully amortized based on their estimated useful lives.
Income Tax Provision
We are taxed at the rates applicable within each jurisdiction in which we operate and/or generate revenue. The effective income tax rate, tax provisions, deferred tax assets and deferred tax liabilities will vary according to the jurisdiction in which profits arise. Tax laws are complex and subject to different interpretations by management and the respective governmental taxing authorities, and require us to exercise judgment in determining our income tax provision, our deferred tax assets and liabilities and the valuation allowance recorded against our net deferred tax assets. Deferred tax assets and liabilities are determined using the enacted tax rates in effect for the years in which those tax assets are expected to be realized. A valuation allowance is established when it is more likely than not that the future realization of all or some of the deferred tax assets will not be achieved.
Material Trends and Uncertainties
The global spinal surgery industry has been growing as a result of:
| |
| • | the increased accessibility of healthcare to more people worldwide; |
| |
| • | advances in technologies for treating conditions of the spine, which have increased the addressable market of patients; and |
| |
| • | overall population growth, aging patient demographics and an increase in life expectancies around the world. |
Nonetheless, we face a number of challenges and uncertainties, as further discussed in Item 1A - Risk Factors-Risks Related to Our Business and Our Industry, including:
| |
| • | ongoing requirements from our hospital partners related to pricing and operating procedures; |
| |
| • | continued market acceptance of our new product innovations; |
| |
| • | the unpredictability of government regulation over healthcare in the worldwide markets; |
| |
| • | competitive threats in the future displacing current surgical treatment protocols; |
| |
| • | the impact of industry consolidation on the overall market. |
| |
| • | the unpredictability of foreign currency exchange rates and the exchange impact on independent distributors outside the United States who pay for our products in U.S. dollars; and |
| |
| • | competitive threats to our existing distribution and surgeon network. |
Results of Operations
The following table sets forth, for the periods indicated, our results of operations expressed as dollar amounts: |
| | | | | | | | | | | | |
| | | Year Ended December 31, |
| | | 2015 | | 2014 | | 2013 |
| | | (In thousands) |
| Revenue | | $ | 216,007 |
| | $ | 186,672 |
| | $ | 157,584 |
|
| Cost of revenue | | 71,791 |
| | 62,800 |
| | 50,162 |
|
| Gross profit | | 144,216 |
| | 123,872 |
| | 107,422 |
|
| Operating expenses: | | | | | | |
| Research and development | | 19,868 |
| | 16,302 |
| | 12,402 |
|
| Sales and marketing | | 105,635 |
| | 95,323 |
| | 80,183 |
|
| General and administrative | | 54,983 |
| | 60,216 |
| | 59,758 |
|
| Total operating expenses | | 180,486 |
| | 171,841 |
| | 152,343 |
|
| Loss from operations | | (36,270 | ) | | (47,969 | ) | | (44,921 | ) |
| Other expense: | | | | | | |
| Foreign currency transaction (loss) gain | | (1,813 | ) | | (4,752 | ) | | 1,477 |
|
| Discount on prepayment of stockholder notes | | — |
| | (4,825 | ) | | — |
|
| Interest expense | | (941 | ) | | (2,205 | ) | | (2,810 | ) |
| Total other expense, net | | (2,754 | ) | | (11,782 | ) | | (1,333 | ) |
| Loss before income taxes | | (39,024 | ) | | (59,751 | ) | | (46,254 | ) |
| Income tax expense (benefit) | | 192 |
| | (114 | ) | | (8,341 | ) |
| Net loss | | (39,216 | ) | | (59,637 | ) | | (37,913 | ) |
| Accretion and adjustment of preferred stock to fair value | | — |
| | 6,879 |
| | (19,439 | ) |
| Net loss attributable to common stockholders | | $ | (39,216 | ) | | $ | (52,758 | ) | | $ | (57,352 | ) |
Year Ended December 31, 2015 Compared to the Year Ended December 31, 2014
The following table sets forth, for the periods indicated, our revenue by geography expressed as dollar amounts and the changes in such revenue between the specified periods expressed in dollar amounts and as percentages:
|
| | | | | | | | | | | | | | | |
| | | Year Ended December 31, |
| | | 2015 | | 2014 | | $ Increase | | % Change |
| | | (In thousands) |
| United States | | $ | 155,291 |
| | $ | 133,110 |
| | $ | 22,181 |
| | 16.7 | % |
| International | | 60,716 |
| | 53,562 |
| | 7,154 |
| | 13.4 | % |
| Total revenue | | $ | 216,007 |
| | $ | 186,672 |
| | $ | 29,335 |
| | 15.7 | % |
Total revenue increased $29.3 million, or 15.7% to $216.0 million for 2015 from $186.7 million for 2014. The increase in revenue was primarily driven by $22.2 million in greater sales volume in the United States due to continued expansion of our customer base, new product introductions representing revenue of $11.2 million in the United States, and $5.2 million in growth in our international distributor markets, primarily EMEA and Asia/Pacific.
U.S. Revenue
The following table sets forth, for the periods indicated, our U.S. revenue by product category expressed as dollar amounts and the changes in such revenue between the specified periods expressed in dollar amounts and percentages. In the fourth quarter of 2015, we refined our reporting of procedure revenue that included the sale of certain single-use MIS products which are sold in support of degenerative surgical procedures as degenerative revenue. Historically these sales were reflected in the MIS product category. As a result of this change, our historically reported MIS revenue has decreased and our degenerative revenue has increased by approximately $2.5 million for 2014 to conform to the current year presentation below:
|
| | | | | | | | | | | | | | | |
| | | Year Ended December 31, |
| | | 2015 | | 2014 | | $ Increase | | % Change |
| | | (In thousands) |
| Complex spine | | $ | 63,398 |
| | $ | 54,030 |
| | $ | 9,368 |
| | 17.3 | % |
| Minimally invasive | | 23,633 |
| | 18,194 |
| | 5,439 |
| | 29.9 | % |
| Degenerative | | 68,260 |
| | 60,886 |
| | 7,374 |
| | 12.1 | % |
| Total U.S. revenue | | $ | 155,291 |
| | $ | 133,110 |
| | $ | 22,181 |
| | 16.7 | % |
U.S. revenue increased $22.2 million, or 16.7% to $155.3 million for 2015 from $133.1 million for 2014. Sales in our complex spine, MIS and degenerative categories represented 40.8%, 15.2% and 44.0% of U.S. revenue for 2015 compared to 40.6%, 13.7% and 45.7% of U.S. revenue for 2014. The overall U.S. revenue growth was driven by new surgeon users representing $14.5 million of revenue and new product revenue of $11.2 million. The complex spine category growth of $9.4 million reflects increased surgeon usage of our EVEREST(R) systems of $5.4 million, increased usage of our occipital fixation system of $1.8 million, and initial usage of our new CAPRI(R) thoraco-lumbar corpectomy device of $0.8 million. The MIS category growth of $5.4 million primarily reflects increased surgeon usage of our EVEREST(R) minimally invasive products of $4.1 million and increased surgeon usage of our RAVINE(R) lateral access interbody system of $1.1 million. The degenerative category growth of $7.4 million primarily reflects increased surgeon usage of our EVEREST(R) systems of $1.7 million, increased usage of our biomaterials offering of $2.1 million, and increased usage of both our cervical and lumbar interbody product lines of $2.6 million.
International Revenue
International revenue increased $7.1 million, or 13.4%, to $60.7 million for 2015 from $53.6 million for 2014. International revenue increased as a result of expanded customer usage of $2.1 million in our Swiss, Italian, and German markets. The revenue growth from these markets is offset by a $1.2 million currency translation impact in revenue resulting from unfavorable foreign currency fluctuations, due to a weakening of the Pound Sterling and the Euro as compared to the U.S. Dollar throughout 2015. International revenue also reflects growth of $5.2 million from our distributor partners, primarily in EMEA and Asia/Pacific as our partners continue to invest in new surgical sets and their market penetration continues to grow.
Cost of Revenue
Cost of revenue increased $9.0 million, or 14.3%, to $71.8 million for 2015 from $62.8 million for 2014. The increase was primarily due to increased sales volume and increased amortization expense associated with our surgical instruments. Amortization expense, increased $3.6 million, or 41.4%, to $12.3 million for 2015 from $8.7 million in 2014. The increase in amortization expense is primarily a result of increased investment in surgical instruments. In addition, the cost of revenue associated with the medical device excise tax in the United States was approximately $0.5 million and $2.1 million for 2015 and 2014, respectively, reflecting a decrease in 2015 primarily as a result of expected recoveries of excise tax overpayments of approximately $1.6 million.
Gross Profit
Gross profit increased as a percentage of revenue to 66.8% for 2015, from 66.4% for 2014. The increase in gross profit as a percentage of revenue is primarily due to decreased expenses associated with our custom instruments and a reduction in our medical device excise tax due to expected prior period recoveries.
Research and Development
Research and development expenses increased $3.6 million, or 21.9%, to $19.9 million for 2015 from $16.3 million for 2014. The increase was primarily due to increased development activities related to products in our pipeline and higher payroll expenses, including stock based compensation.
Sales and Marketing
Sales and marketing expenses increased $10.3 million, or 10.8%, to $105.6 million for 2015 from $95.3 million for 2014. The increase was primarily due to employee compensation costs, including stock based compensation from our hiring of direct sales employees since December 31, 2014, increased sales commissions as a result of increased sales volume and due in part to increased shipping expenses.
General and Administrative
General and administrative expenses decreased $5.2 million, or 8.7%, to $54.9 million for 2015 from $60.2 million for 2014. The decrease was primarily due to lower amortization expense on intangible assets related to developed and licensed technology acquired in the 2010 merger, partially offset by increased employee compensation and benefit costs associated with the increase in personnel to support the expansion of our business, amortization of the compensation cost of restricted stock units issuances, and increased third-party legal expenses. General and administrative expenses includes amortization of intangible assets of $10.3 million and $22.9 million for 2015 and 2014, respectively.
Other Expense
Other expense, net, decreased $9.0 million to $(2.8) million of expense for 2015 from $(11.8) million for 2014. The decrease in other expense was primarily due to the acceleration of discount expense on notes to stockholders of $4.8 million as a result of their prepayment in 2014, a decrease in interest expense of $1.3 million as a result of lower overall borrowing and a $2.9 million decrease in unrealized losses from foreign currency translation on intercompany payable balances.
Income Tax Expense
Income tax benefit decreased $0.1 million, to $0.2 million of expense for 2015. Our effective tax rate calculated as a percentage of loss before income tax expense was (0.5)% for 2015, from 0.2% for 2014. The change in the effective tax rate was due to the effect of an increase in the valuation allowance on our deferred tax assets as of December 31, 2015.
Net Loss
Net loss decreased $20.4 million, or 34.2%, to $39.2 million for 2015 from $59.6 million for 2014. The decrease in our net loss was primarily attributable to lower intangible amortization expense, the absence of our discount on prepayment of stockholder notes incurred in 2014 and decreases in our foreign currency translation losses in 2015, partially offset by increased stock-based compensation and higher operating expenses attributable to greater sales activity.
Year Ended December 31, 2014 Compared to the Year Ended December 31, 2013
The following table sets forth, for the periods indicated, our revenue by geography expressed as dollar amounts and the changes in such revenue between the specified periods expressed in dollar amounts and as percentages:
|
| | | | | | | | | | | | | | | |
| | | Year Ended December 31, |
| | | 2014 | | 2013 | | $ Increase | | % Change |
| | | (In thousands) |
| United States | | $ | 133,110 |
| | $ | 111,772 |
| | $ | 21,338 |
| | 19.1 | % |
| International | | 53,562 |
| | 45,812 |
| | 7,750 |
| | 16.9 | % |
| Total revenue | | $ | 186,672 |
| | $ | 157,584 |
| | $ | 29,088 |
| | 18.5 | % |
Total revenue increased $29.1 million, or 18.5%, to $186.7 million for 2014 from $157.6 million for 2013. The increase in revenue was primarily driven by $13.2 million in greater sales volume in the United States due to continued expansion of our customer base, increased volume within our existing United States customer base of $7.2 million, and $5.3 million in growth in our international markets, primarily Australia, Denmark and Spain.
U.S. Revenue
The following table sets forth, for the periods indicated, our U.S. revenue by product category expressed as dollar amounts and the changes in such revenue between the specified periods expressed in dollar amounts and percentages.
In the fourth quarter of 2015, we refined our reporting of procedure revenue that included the sale of certain single-use MIS products which are sold in support of degenerative surgical procedures as degenerative revenue. Historically these sales were reflected in the MIS product category. As a result of this change our historically reported MIS revenue has decreased and our degenerative revenue has increased approximately $2.5 million and $1.3 million for 2014 and 2013 to conform to the current year presentation below:
|
| | | | | | | | | | | | | | | |
| | | Year Ended December 31, |
| | | 2014 | | 2013 | | $ Increase | | % Change |
| | | (In thousands) |
| Complex spine | | $ | 54,030 |
| | $ | 46,442 |
| | $ | 7,588 |
| | 16.3 | % |
| Minimally invasive | | 18,194 |
| | 17,115 |
| | 1,079 |
| | 6.3 | % |
| Degenerative | | 60,886 |
| | 48,215 |
| | 12,671 |
| | 26.3 | % |
| Total U.S. revenue | | $ | 133,110 |
| | $ | 111,772 |
| | $ | 21,338 |
| | 19.1 | % |
U.S. revenue increased $21.3 million, or 19.1%, to $133.1 million for 2014 from $111.8 million for 2013. Sales in our complex spine, MIS and degenerative categories represented 40.6%, 13.7% and 45.7% of U.S. revenue, respectively, for 2014, compared to 41.6%, 15.3% and 43.1% of U.S. revenue, respectively, for 2013. The overall U.S. revenue growth was driven by new surgeon users representing $13.2 million of revenue and increased volume within our existing customer base of $7.2 million. The complex spine category growth of $7.6 million reflects increased surgeon usage of our MESA and EVEREST(R) systems of $3.9 million, an initial stocking order of implants of $0.5 million, which has been categorized based on experienced surgical implant usage patterns to date of such order, and increased usage of our biomaterials of $1.1 million. The MIS category growth of $1.1 million primarily reflects increased surgeon usage of our EVEREST(R) minimally invasive products. The degenerative category growth of $12.7 million primarily reflects increased surgeon usage of our EVEREST(R) product line of $2.9 million, increased usage of our biomaterials of $3.1 million, and increased usage of both our cervical and lumbar interbody product lines of $3.1 million.
International Revenue
International revenue increased $7.8 million, or 16.9%, to $53.6 million for 2014 from $45.8 million for 2013. International revenue increased as a result of expanded customer usage of $2.3 million in our Italian, United Kingdom and German markets. The revenue growth from these markets includes a $0.5 million increase in revenue resulting from favorable foreign currency fluctuations, due to a strengthening of the Pound Sterling and the Euro as compared to the U.S. Dollar in the first half of 2014. International revenue also reflects growth of $5.3 million from our international distributor partners, primarily in Australia, Denmark and Spain, as our partners continue to invest in new surgical sets and their market penetration continues to grow.
Cost of Revenue
Cost of revenue increased $12.6 million, or 25.2%, to $62.8 million for 2014 from $50.2 million for 2013. The increase was primarily due to increased sales volume, and increasing utilization of our custom designed instruments. Amortization expense, increased $3.5 million, or 67.3%, to $8.7 million for 2014 from $5.2 million in 2013. The increase in amortization expense is primarily a result of increased investment in surgical instruments and the absence of the one-time benefit realized in 2013 from the change in useful life of our surgical instruments from three years to five years. In addition, the cost of revenue associated with the medical device excise tax in the United States was approximately $2.1 million and $2.0 million for 2014 and 2013, respectively.
Gross Profit
Gross profit decreased as a percentage of revenue to 66.4% for 2014 from 68.2% for 2013. The decrease in gross profit as a percentage of revenue is primarily due to changes in the mix of products sold in the United States, pricing declines in the United States and select international markets, and higher instrument amortization expense.
Research and Development
Research and development expenses increased $3.9 million, or 31.4%, to $16.3 million for 2014 from $12.4 million for 2013. The increase was primarily due to increased development activities related to products in our pipeline and higher payroll expenses, including stock based compensation.
Sales and Marketing
Sales and marketing expenses increased $15.1 million, or 18.9%, to $95.3 million for 2014 from $80.2 million for 2013. The increase was primarily due to employee compensation costs, including stock based compensation, from our hiring of direct sales employees since December 31, 2013 and increased sales commissions as a result of increased sales volume. The increase was also due in part to increased costs associated with travel, marketing, advertising and shipping expenses.
General and Administrative
General and administrative expenses increased $0.4 million, or 0.8%, to $60.2 million for 2014 from $59.8 million for 2013. The increase was primarily due to increased employee compensation and benefit costs associated with the increase in personnel to support the expansion of our business, amortization of the compensation cost of restricted stock units issuances, and increased third-party legal and other consulting expenses, partially offset by lower amortization expense on intangible assets. General and administrative expenses includes amortization of intangible assets of $22.9 million and $30.2 million for 2014 and 2013, respectively.
Other Expense
Other expense increased $10.5 million to $11.8 million for 2014 from $1.3 million for 2013. The increase in other expense was attributable to an increase in loss on foreign currency transactions with our subsidiaries of $6.2 million and acceleration of discount expense on notes to stockholders of $4.8 million as a result of their prepayment. This increase in other expense was partially offset by lower interest expense of $0.6 million attributable to lower average debt balances during the period.
Income Tax Benefit
Income tax benefit decreased $8.2 million to $0.1 million for 2014 from $8.3 million for 2013. Our effective tax rate calculated as a percentage of loss before income tax benefit was 0.2% for 2014, from 18.0% for 2013. The change in the effective tax rate was due to the effect of an increase in the valuation allowance on our deferred tax assets as of December 31, 2014.
Non-GAAP Financial Measures
Adjusted EBITDA represents net loss plus interest expense, discount on prepayment of notes to stockholders, income tax expense (benefit), depreciation and amortization, stock-based compensation expense and foreign currency transaction loss (gain).
We present Adjusted EBITDA because we believe it is a useful indicator of our operating performance. Our management uses Adjusted EBITDA principally as a measure of our operating performance and for planning purposes, including the preparation of our annual operating budget and financial projections. We believe that Adjusted EBITDA is useful to investors because it is frequently used by analysts, investors and other interested parties to evaluate companies in our industry. We also believe Adjusted EBITDA is useful to our management and investors as a measure of comparative operating performance from period to period.
Adjusted EBITDA is a non-GAAP financial measure and should not be considered as an alternative to net loss as a measure of financial performance or cash flows from operations as a measure of liquidity, or any other performance measure derived in accordance with GAAP and it should not be construed as an inference that our future results will be unaffected by unusual or non-recurring items. In addition, Adjusted EBITDA is not intended to be a measure of free cash flow for management’s discretionary use, as it does not reflect certain cash requirements such as tax payments, debt service requirements, capital expenditures and certain other cash costs that may recur in the future. Adjusted EBITDA contains certain other limitations, including the failure to reflect our cash expenditures, cash requirements for working capital needs and cash costs to replace assets being depreciated and amortized. In evaluating Adjusted EBITDA, you should be aware that in the future we may incur expenses that are the same as or similar to some of the adjustments in this presentation. Our presentation of Adjusted EBITDA should not be construed to imply that our future results will be unaffected by any such adjustments. Management compensates for these limitations by primarily relying on our GAAP results in addition to using Adjusted EBITDA supplementally. Our definition of Adjusted EBITDA is not necessarily comparable to other similarly titled captions of other companies due to different methods of calculation.
The following table presents a reconciliation of net loss to Adjusted EBITDA for the periods presented:
|
| | | | | | | | | | | | |
| | | Year Ended December 31, |
| | | 2015 | | 2014 | | 2013 |
| | | (In thousands) |
| Net loss | | $ | (39,216 | ) | | $ | (59,637 | ) | | $ | (37,913 | ) |
| Interest expense | | 941 |
| | 2,205 |
| | 2,810 |
|
| Discount on prepayment of notes to stockholders | | — |
| | 4,825 |
| | — |
|
| Income tax expense (benefit) | | 192 |
| | (114 | ) | | (8,341 | ) |
| Depreciation and amortization | | 24,940 |
| | 33,324 |
| | 36,776 |
|
| Stock-based compensation expense | | 11,188 |
| | 5,807 |
| | 2,879 |
|
| Foreign currency transaction loss (gain) | | 1,813 |
| | 4,752 |
| | (1,477 | ) |
| Adjusted EBITDA | | $ | (142 | ) | | $ | (8,838 | ) | | $ | (5,266 | ) |
Liquidity and Capital Resources
Since our inception in 2004, we have incurred significant operating losses and anticipate that our losses will continue in the near term. We expect our operating expenses will continue to grow as we expand our product portfolio and penetrate further into existing markets and enter new markets. We will need to generate significant revenue to achieve profitability as we grow our business. Prior to our IPO in May 2014, we had funded our operations primarily with proceeds from the sales of preferred and common stock, notes to stockholders, a revolving credit facility and cash flow from operations.
From our IPO in May 2014 through our most recent public offering of common stock in July 2015, we have raised net proceeds of $173.1 million through the issuance of approximately 11.7 million shares of our common stock. Selling stockholders sold approximately 10.2 million shares of our common stock in these additional offerings for which we received no proceeds:
|
| | | | | | | | | | |
| | | Number of Shares Sold | | Net Proceeds | | Issuance or |
| Date | | K2M Issued | | Selling Stockholders | | to K2M (millions) | | Sale Price per share |
| May 2014 | | 8,825,000 |
| | 1,000,000 |
| | $118.9 | | $15.00 |
| February 2015 | | 2,044,990 |
| | 4,906,758 |
| | $35.4 | | $18.75 |
| July 2015 | | 862,500 |
| | 4,312,500 |
| | $18.8 | | $22.60 |
| Total | | 11,732,490 |
| | 10,219,258 |
| | $173.1 | | |
In May 2014, we used proceeds from the IPO of approximately $82.5 million to retire all amounts outstanding under our revolving credit facility, prepay all outstanding principal and accrued interest of notes to stockholders and fully satisfied our commitment to pay cumulative dividends outstanding on our preferred stock upon its conversion to common stock.
The proceeds we have raised from the 2015 offerings have been used for working capital, purchases of intellectual property and other general corporate purposes. We expect to use the remaining proceeds from the 2015 offerings to purchase implant inventory and surgical instruments to support sales efforts and to fund leasehold improvement and furniture and equipment costs related to our new headquarters and operations facilities. In addition, the use of proceeds may also include the acquisition of or investment in complementary products, technologies or businesses. However, the offerings undertaken in 2015 also facilitated an orderly distribution of shares by the selling stockholders and an increase the public float of our shares.
As of December 31, 2015, our cash and cash equivalents were $34.6 million compared to cash and cash equivalents as of December 31, 2014 of $11.4 million. As of December 31, 2015, we had no outstanding indebtedness and no outstanding borrowings under our revolving credit facility. As of December 31, 2015, we had working capital of $107.4 million, compared to $66.3 million as of December 31, 2014.
We are actively exploring acquisition, investment or strategic partnership opportunities to further enhance our product portfolio or development pipeline for future products. We expect these opportunities may result in additional expense or an increase in intellectual property assets when any such agreements are completed or over the period of development of such technologies. In some cases, the development period of the technologies and related expense may extend multiple years in advance of revenue generation. For instance, in January 2016, we made a milestone payment of approximately $1.3 million following the clearance of our CE Marking from the Notified Body with respect to our RHINE™ cervical arthroplasty solution intended for several markets outside the United States.
Our principal long-term liquidity need is working capital to support the continued growth of our business through the hiring of direct sales employees and independent sales agencies to expand our global sales force, purchases of additional inventory to support future sales activities and the development and commercialization of new products through our research and development efforts. We expect to fund our long-term capital needs with the proceeds from our stock offerings, availability under our revolving credit facility (which may vary due to changes in our borrowing base) and cash flow from operations. To the extent additional funds are necessary to meet our long-term liquidity needs as we continue to execute our business strategy, we anticipate that they will be obtained through the incurrence of additional indebtedness, additional equity financings or a combination of these potential sources of funds.
Although we believe that these sources will provide sufficient liquidity for us to meet our long-term capital needs, our liquidity and our ability to fund these needs will depend to a significant extent on our future financial performance, which will be subject in part to general economic, competitive, financial, regulatory and other factors that are beyond our control as discussed in Part I - Item 1A Risk Factors. In addition to these general economic and industry factors, the principal factors determining whether our cash flows will be sufficient to meet our long-term liquidity requirements will be our ability to provide attractive products to our customers, changes in our customers’ ability to obtain third-party coverage and reimbursement for procedures that use our products, increased pricing pressures resulting from intensifying competition, cost
increases and slower product development cycles resulting from a changing regulatory environment. If these factors change significantly or other unexpected factors adversely affect us, our business may not generate sufficient cash flow from operations and future financings may not be available on terms acceptable to us or at all to meet our liquidity needs.
In assessing our liquidity, management reviews and analyzes our current cash-on-hand, the average number of days our accounts receivable are outstanding, payment terms that we have established with our vendors, inventory turns, foreign exchange rates, capital expenditure commitments and income tax rates.
Cash Flows
The following table shows our cash flows from operating, investing and financing activities for 2015, 2014 and 2013:
|
| | | | | | | | | | | | |
| | | Year Ended December 31, |
| | | 2015 | | 2014 | | 2013 |
| | | (In thousands) |
| Net cash used in operating activities | | $ | (18,310 | ) | | $ | (30,162 | ) | | $ | (19,090 | ) |
| Net cash used in investing activities | | (14,280 | ) | | (22,538 | ) | | (9,934 | ) |
| Net cash provided by financing activities | | 56,226 |
| | 56,836 |
| | 29,380 |
|
| Effect of exchange rate on cash | | (401 | ) | | (144 | ) | | 52 |
|
| Net change in cash and cash equivalents | | $ | 23,235 |
| | $ | 3,992 |
| | $ | 408 |
|
Cash Used in Operating Activities
Net cash used in operating activities decreased $11.9 million to $18.3 million for 2015 from $30.2 million for 2014. The decrease in net cash used in operating activities was primarily due to increased revenue and decreased inventory purchases in 2015, partially offset by an increase in accounts receivable due to higher revenue, and the timing of payments of accounts payable and accrued liabilities.
Net cash used in operating activities increased $11.1 million to $30.2 million for 2014 from $19.1 million for 2013. The increase in net cash used in operations was due to an increase in loss from operations as a result of higher research and development and sales and marketing expenses. In addition inventory purchases increased in 2014 compared to 2013 levels as a result of the increase in sales during 2014 and to support future sales activities.
Cash Used in Investing Activities
Net cash used in investing activities decreased $8.2 million to $14.3 million for 2015 from $22.5 million for 2014. The decrease in net cash used in investing activities was primarily attributable to a decrease in purchases of surgical instruments partially offset by purchases of intellectual property rights (patents) during 2015. In addition, in 2014 we funded $6.7 million of escrow requirements related to leasehold improvements for our new corporate headquarters and operations facilities, which did not recur in 2015.
Net cash used in investing activities increased $12.6 million to $22.5 million for 2014 from $9.9 million for 2013. The increase in net cash used in investing activities was primarily attributable to amounts placed in escrow for tenant improvements for our new corporate headquarters and operations facilities, increased purchases of surgical instruments for use within our global distribution network and greater software development activities to support our internal systems.
Cash Provided by Financing Activities
Net cash provided by financing activities decreased $0.6 million to $56.2 million for 2015 from $56.8 million for 2014. During 2015, we generated net proceeds from issuances of common stock including exercises under benefit plans of approximately $56.2 million. In 2014, we generated net proceeds from issuances of common stock including exercises under benefit plans of $123.5 million and $14.6 million from issuances of notes to stockholders. In 2014, we used such proceeds to repay aggregate principal amounts outstanding under our credit facility and notes to stockholders of $62.7 million and dividends on our preferred stock of $18.5 million.
Net cash provided by financing activities increased $27.4 million to $56.8 million for 2014 from $29.4 million for 2013. For 2014, cash provided by financing activities included approximately $121.9 million received from issuances of common stock, net of expenses, and $14.6 million of proceeds from notes to stockholders. In 2013, we received $13.8 million from issuances of our preferred and common stock in private placements and $14.9 million of proceeds from the issuance of notes to stockholders. Cash used in financing activities during 2014, included prepayments of notes to stockholders of $39.2 million,
payments on the bank line of credit of $23.5 million and dividends paid on preferred stock of $18.5 million from use of the proceeds of our IPO. In 2013, such activities used in financing activities totaled approximately $1.5 million.
Capital Expenditures
Our capital expenditures were $13.7 million, $15.8 million and $9.8 million for 2015, 2014 and 2013, respectively, consisting primarily of consigned instrumentation to support surgical sales and and expansion of our global distribution network, purchases of software and software development activities, facilities hardware and computer hardware and related software licenses for our internal systems.
We expect capital expenditures to increase as we continue to expand our global distribution network and related purchase of additional surgical instruments. We expect cash and cash equivalents on hand, cash flows from our operations and funding available from our revolving credit facility to fund our future capital expenditures.
In the first half of 2016, we expect to complete construction of leasehold improvements necessary to commence operations in our new corporate headquarters and operations facilities. By June 30, 2016, we expect to spend approximately $9.5 million for such improvements and approximately $3.8 million on furniture and equipment. We expect to fund these anticipated improvements, furniture and equipment through a combination of restricted cash balances of $6.7 million, which is reflected in other current assets on the accompanying balance sheet, cash and cash equivalents on hand and borrowings under our credit facility, if needed.
We expect to fund our long-term capital needs with proceeds from our public offerings completed to date, availability under our revolving credit facility (which may vary due to changes in our borrowing base) and cash flow from operations. To the extent additional funds are necessary to meet our long-term liquidity needs as we continue to execute our business strategy, we anticipate that they will be obtained through the debt borrowings, additional equity financings or a combination of these potential sources of funds.
Indebtedness
Revolving Credit Facility
We maintain a senior secured credit facilities credit agreement (as amended from time to time) with Silicon Valley Bank and Comerica Bank as Lenders, which is secured primarily by the assets of our operating subsidiaries in the United States and United Kingdom.
The credit facility, as amended, consists of a revolving credit facility of $55.0 million with a sub-facility for letters of credit in the aggregate availability amount of $10.0 million and a swingline sub-facility in the aggregate availability amount of $5.0 million. The maturity date of the credit agreement is October 29, 2017. As of December 31, 2015, we had no outstanding borrowings on the credit facility and approximately $44.3 million of unused borrowing capacity. In addition, we had two issued but undrawn letters of credit for approximately $6.1 million, with one letter of credit representing a $6.0 million security deposit on the new headquarters and operations facilities lease.
Alternate Base Rate ("ABR") loans under the revolving credit facility bear interest at a rate per annum equal to ABR, plus 0.75%. LIBOR loans under the revolving credit facility bear interest at a rate per annum equal to the greater of (i) LIBOR, plus 3.0%. The total obligations under the amended credit facility cannot exceed the lesser of (i) the total revolving commitment of $55.0 million or (ii) the borrowing base, which is calculated as (x) 85% of accounts receivable so long as certain of those accounts receivable do not exceed, in the aggregate, 50% of the borrowing base plus (y) 50% of the value of the eligible inventory provided that the contribution of the value of the eligible inventory not exceed the lesser of 40% of the borrowing base or $15.0 million plus (z) up to $7.5 million to the extent the Borrower and its subsidiaries maintain at least $12.5 million on deposit with a lender or an affiliate of a lender. Borrowings under the revolving credit facility remain secured by a first priority lien on substantially all of the Borrower’s personal property assets, including intellectual property.
The revolving credit facility contains various financial covenants and negative covenants with which the Company must maintain compliance, including a consolidated adjusted quick ratio for K2M, Inc., K2M UK Limited and select subsidiaries not less than 1.20:1.00 as of the last day of any month; restrictive covenants which limit the Company’s ability to pay dividends on common stock and make certain investments, and the provision of certain financial reporting and company information as required. We were in compliance with all the financial and other covenants of the credit facility at December 31, 2015.
Contractual Obligations
The following table summarizes our outstanding contractual obligations as of December 31, 2015:
|
| | | | | | | | | | | | | | | | | | | | |
| | | Total | | < 1 Year | | 1-3 Years | | 4-5 Years | | After 5 Years |
| (dollars in thousands) | | | | | | | | | | |
Revolving credit facility(1) | | $ | — |
| | | | $ | — |
| | $ | — |
| | $ | — |
|
| Capital lease obligations | | 58,439 |
| | 284 |
| | 7,417 |
| | 6,968 |
| | 43,770 |
|
| Operating lease obligations | | 1,101 |
| | 947 |
| | 154 |
| | — |
| | — |
|
| Purchase obligations | | 434 |
| | 434 |
| | — |
| | — |
| | — |
|
Minimum IP obligations(2) | | 3,400 |
| | 502 |
| | 1,298 |
| | 800 |
| | 800 |
|
| | | $ | 63,374 |
| | $ | 2,167 |
|
| $ | 8,869 |
|
| $ | 7,768 |
|
| $ | 44,570 |
|
| |
| (1) | There were no amounts drawn on our $55.0 million revolving credit facility as of December 31, 2015. |
| |
| (2) | The above table does not include certain contractual obligations payable in connection with various intellectual property agreements, including (1) contingent obligations payable upon the achievement of certain regulatory and sales milestones and (2) royalties payable on net sales of products developed from the applicable intellectual property. However, the table includes all contractual obligations payable in connection with such intellectual property agreements that are fixed and determinable and not subject to cancellation provisions. |
Off-Balance Sheet Arrangements
As of December 31, 2015, we had two issued but undrawn letters of credit for $6.1 million, with one letter of credit representing a $6.0 million security deposit on the new corporate headquarters and operations facilities lease.
Critical Accounting Policies and Estimates
The preparation of our consolidated financial statements requires us to make assumptions, estimates and judgments that affect the reported amounts of assets and liabilities, the disclosures of contingent assets and liabilities as of the date of the consolidated financial statements, and the reported amounts of revenue and expenses during the reporting periods. Certain of our accounting policies require the application of significant judgment by management in selecting the appropriate assumptions for calculating financial estimates. By their nature, these judgments are subject to an inherent degree of uncertainty. We use historical experience and other assumptions as the basis for our judgments and making these estimates. Because future events and their effects cannot be determined with precision, actual results could differ significantly from these estimates. Any changes in those estimates will be reflected in our consolidated financial statements as they occur.
Management believes that the accounting estimates employed are appropriate and resulting balances are reasonable; however, actual results could differ from the original estimates, requiring adjustments to these balances in future periods. While our significant accounting policies are more fully described in Note 1 to our consolidated financial statements included elsewhere in this Annual Report on Form 10-K, we have reviewed our policies and determined that those policies remain our critical accounting policies as of and for December 31, 2015.
Revenue Recognition
We recognize revenue when all of the following criteria are met: persuasive evidence of an arrangement exists, delivery has occurred or service has been rendered, the price to the buyer is fixed or determinable and collectability is reasonably assured.
Revenue in our direct markets is generated by making our products available to hospitals that purchase specific products for use in surgery on a case-by-case basis. Revenue from sales generated by use of products is recognized upon receipt of a delivered order confirming that our products have been used in a surgical procedure or following shipment and transfer of title to a hospital that purchases products in advance of a surgery.
In our international markets where we utilize independent distributors who then resell the products to their hospital customers, we recognize revenue upon shipment of our products to the international distributors, who accept title at point of shipment.
Excess and Obsolete Inventory
We state inventory at the lower of cost or market using a weighted-average cost method. The majority of our inventory is finished goods, because we utilize third-party suppliers to source most of our products. We evaluate the carrying value of our inventory in relation to the estimated forecast of product demand, which takes into consideration the estimated life cycle of
product releases. A significant decrease in demand could result in an increase in the amount of excess inventory quantities on hand, which could lead to additional reserves for excess and obsolete inventory.
The need to maintain substantial levels of inventory impacts the risk of obsolescence. We maintain numerous different products in our inventory portfolio. Each product system is designed to include implantable parts that come in different sizes and shapes to accommodate a surgeon’s needs in the operating theater. A product set is the specific configuration of implants, disposables and instrumentation provided for use in a surgical procedure. Typically a small number of a set’s components are used in each surgical procedure and, therefore, certain components within the set may become obsolete before other components based on usage patterns. Our excess and obsolete reserves reflect the usage patterns of the components within each product set.
In addition, we continue to introduce new products and product innovations, which we believe will increase our revenue and enhance our relationships with surgeons and hospitals. As a result, we may be required to take charges for excess and/or obsolete inventory, which may have a significant impact on the value of our inventory and our results of operations. Charges incurred for excess and obsolete inventory and other inventory reserves which are included in cost of revenue, totaled $1.7 million, $0.6 million and $2.3 million in December 31, 2015, 2014 and 2013, respectively.
Goodwill and Intangible Assets
Goodwill represents the excess of the consideration transferred over the estimated fair value of assets acquired and liabilities assumed in connection with our 2010 purchase by WCAS. Goodwill is tested for impairment at least on an annual basis. Goodwill is tested for impairment at the reporting unit level by comparing the reporting unit’s fair value to its carrying value. Under recent guidance, prior to performing the annual two-step goodwill impairment test, a company is first permitted to perform a qualitative assessment to determine if the two-step quantitative test must be completed. The qualitative assessment considers events and circumstances such as macroeconomic conditions, industry and market conditions, cost factors and overall financial performance, as well as company and specific reporting unit specifications. If after performing this assessment, we conclude that it is more likely than not that the fair value of a reporting unit is less than its carrying amount, then it is required to perform a two-step quantitative test. Otherwise, the two-step test is not required. In the first step of the quantitative test, we are required to determine the fair value of each reporting unit and compare it to the carrying amount of the reporting unit. Fair value of the reporting unit is determined using an income and discounted cash flow approach.
The impairment evaluation related to goodwill requires the use of considerable management judgment to determine discounted future cash flows including estimates and assumptions regarding the amount and timing of cash flows, cost of capital and growth rates. Cash flow assumptions used in the assessment are estimated using assumptions in our annual operating budget, as well as our long-term strategic plan. Our budget and strategic plan contain revenue assumptions that are based on existing product technologies, new technologies that are in the process of being developed along with their expected launch dates and life cycle expectations. In addition, management considers relevant market information, peer company data and historical financial information.
If the carrying amount of the reporting unit exceeds the fair value of the reporting unit, we perform the second step of the impairment test, as this is an indication that the reporting unit goodwill may be impaired. In the second step of the impairment test, we determine the implied fair value of the reporting unit’s goodwill. If the carrying value of a reporting unit’s goodwill exceeds its implied fair value, then an impairment of goodwill has occurred and we must recognize an impairment loss for the difference between the carrying amount and the implied fair value of goodwill.
Our evaluation of goodwill completed in each of the three years ended December 31, 2015 resulted in no impairment losses.
Intangible assets are amortized over their estimated period of benefit using the straight line method and estimated useful lives ranging from four to seven years. Intangible assets are also reviewed for impairment when facts or circumstances suggest that the carrying value of these assets may not be recoverable.
Income Taxes
We recognize deferred tax assets and liabilities for the future tax consequences attributable to differences between the financial statement carrying amounts of existing assets and liabilities and their respective tax bases. We measure deferred tax assets and liabilities using enacted tax rates expected to apply to taxable income in the year in which those temporary differences are expected to be recovered or settled. We recognize the effect on deferred tax assets and liabilities of a change in tax rates in the period that includes the enactment date.
We establish valuation allowances when necessary to reduce net deferred tax assets to the amount expected to be realized if, based on available evidence, it is more likely than not that some or all of the deferred tax assets will not be realized.
While we believe that our tax positions are fully supportable, there is a risk that certain positions could be challenged. In these instances, we would evaluate whether a reserve is necessary. If we determine that it is more likely than not that a tax position will be sustained upon audit, based solely on the technical merits of the position, we recognize the benefit. We measure the benefit by determining the amount that is more likely than not to be sustained by a taxing authority with full knowledge of all relevant information. We monitor our tax positions, tax assets and liabilities regularly. We reevaluate the technical positions of our tax positions and recognize an uncertain tax benefit or reverse a previously recorded tax benefit when (1) a tax audit is completed, (2) applicable tax law, including tax case or legislative guidance, changes or (3) the statute of limitations expires. Significant judgment is required in accounting for tax reserves.
Valuation of Stock-Based Compensation
From time-to-time we award forms of stock-based compensation to our executives, employees, board of directors and other non-employees that provide us services. Determining the amount of stock-based compensation to be recorded requires us to develop estimates of the fair value of such awards as of their grant date. Stock-based compensation expense is recognized ratably over the requisite service period, which in most cases is the vesting period of the award. Awards issued to non-employees (excluding non-employee directors) are recorded at fair value and remeasured periodically as determined in accordance with authoritative guidance, and recognized as expense over respective service periods.
Calculating the fair value of stock-based awards requires that we make highly subjective assumptions. We use the Black-Scholes option pricing model to value our stock option awards and shares issued under our Employee Stock Purchase Plan (ESPP). The determination of the fair value of stock-based payment awards utilizing the Black-Scholes model is affected by our stock price and a number of assumptions, including expected volatility, expected term, risk-free interest rate and expected dividends. Because we have been a public company for less than two years and have a limited operating history, we utilize the historical stock price volatility from a representative group of public companies to estimate expected stock price volatility. We selected companies from the medical device industry, specifically those who are focused on the design, development and commercialization of products for the treatment of spine disorders, including those who have similar characteristics to us, such as stage of life cycle and size. We intend to continue to utilize the historical volatility of the same or similar public companies to estimate expected volatility until a sufficient amount of historical information regarding the price of our publically traded stock becomes available.
We use the simplified method as prescribed by SEC Staff Accounting Bulletin No. 107, Share-based Payment, to calculate the expected term of stock option grants to employees as we do not have sufficient historical exercise data to provide a reasonable basis upon which to estimate the expected term of stock options granted to employees. We utilize a dividend yield of zero because we have never paid cash dividends on our common stock and have no current intention to pay cash dividends. The risk-free rate of return used for each grant is based on the U.S. Treasury yield curve in effect at the time of grant for instruments with a similar expected life. The fair value of restricted stock and restricted stock units ("RSUs") awarded is based on the market price of our common stock on the date of grant. We use historical forfeiture rate trends as a basis for estimating pre-vesting forfeitures.
Most of the stock options we granted from our purchase by WCAS in 2010 through 2011 are time and performance based and include two vesting components: (i) 50% of the option is subject to a four-year time-based schedule, and (ii) 50% of the option is subject to performance-based criteria, which also includes the requirement that the four-year time-based vesting must be satisfied (the "PB options"). The performance-based vesting criteria is based on our performance at the Performance Target Measurement Event (as defined in the Non-Qualified Stock Option Award Agreement under the 2010 Equity Award Plan) which includes a deemed liquidation, initial public offering or sale of our outstanding stock, as measured by the internal rate of return performance criteria on that date as defined in the Non-Qualified Stock Option Award Agreement under the 2010 Equity Award Plan. The performance target measurement event must occur prior to the contractual term of the options in order for the options to be subject to vesting. Although the sale of our common stock from the IPO in 2014 was a Performance Target Measurement Events under the 2010 Equity Award Plan, the internal rate of return performance criteria was not met following these events because this rate is based on the return on investment WCAS has realized on their investments (common stock and preferred stock) and loans made to us since 2010. Until the internal rate of return is realized by WCAS, the PB options subject to this condition may not be exercised even if they have time-based vested.
The fair value of the PB Options was determined using a Monte Carlo Simulation Model as of each award date. We began to recognize stock-based compensation expense related to the PB options once the Performance Target Measurement Event occurred subsequent to the IPO in 2014. Between our IPO date and December 31, 2015, we recognized total stock-based compensation expense related to PB Options awarded to employees of $2.7 million. As of December 31, 2015, there was no unrecognized stock-based compensation expense from these awards. There were 991,682 PB options that had vested at an average exercise price of $9.32 per share but were not yet exercisable. As of December 31, 2015, the weighted average contractual term of the PB options is 5.32 years. All stock options granted subsequent to 2011 solely vest based on a time-
based vesting schedule and do not contain any performance-based vesting criteria. Please refer to Notes 1 and 11 to the financial statements for further information.
Stock-based compensation expense totaled $11.2 million, $5.8 million and $2.9 million for 2015, 2014 and 2013, respectively.
As of December 31, 2015, there was approximately $4.6 million of unrecognized stock-based compensation expense for restricted stock and RSUs, which is expected to be recognized over a weighted average period of approximately 1.70 years, and $5.0 million of unrecognized stock-based compensation expense underlying option awards without performance conditions, which is expected to be recognized over a weighted-average remaining vesting period of approximately 1.92 years.
Recently Issued Accounting Pronouncements
We qualify as an emerging growth company pursuant to the provisions of the JOBS Act. Section 107 of the JOBS Act provides that an “emerging growth company” can take advantage of the extended transition period provided in Section 7(a)(2)(B) of the Securities Act for complying with new or revised accounting standards. We have elected to delay the adoption of new or revised accounting standards until those standards would otherwise apply to private companies, and as a result, we may not comply with new or revised accounting standards on the relevant dates on which adoption of such standards is required for non-emerging growth companies. As a result of this election, our financial statements may not be comparable to the financial statements of other public companies. We may take advantage of these reporting exemptions until we are no longer an emerging growth company.
Deformity Business Seasonality and Other Quarterly Fluctuations in Revenue
Our revenue is typically higher in the late Spring and Summer and in the fourth quarter of our fiscal year, driven by higher sales of our complex spine products, which is influenced by the higher incidence of adolescent surgeries during these periods to coincide with the beginning of summer vacation and holiday periods. In addition, our international revenue fluctuates quarterly based on the timing of product registrations, expansion to new markets and product orders from our exclusive international distribution partners.
ITEM 7A. QUANTITATIVE AND QUALITATIVE DISCLOSURES ABOUT MARKET RISK
Overview Regarding Market Risks
We are exposed to various market risks, which may result in potential losses arising from adverse changes in market rates, such as interest rates and foreign exchange rates. We do not enter into derivatives or other financial instruments for trading or speculative purposes and do not believe we are exposed to material market risk with respect to our cash and cash equivalents.
Interest Rate Risk
We are exposed to interest rate risk in connection with any future borrowings under our revolving credit facility, which bears interest at floating rates. For variable rate debt, interest rate changes do not affect the fair value of the debt instrument, but do impact future earnings and cash flows, assuming other factors are held constant. We do not believe that a 10% change in interest rates would have a significant impact on our net loss for the period or on cash flow.
Foreign Exchange Risk
We operate in countries other than the United States, and, therefore, we are exposed to foreign currency risks. In the European markets where we manage billing relationships, we transact our business in local currencies, which are comprised primarily of Pounds Sterling and the Euro. As of December 31, 2015, revenue denominated in currencies other than U.S. Dollars represented less than 10% of our total revenue. Operating expenses related to these sales are largely denominated in the same respective currency, thereby limiting our transaction risk exposure. We therefore believe that the risk of an impact on our operating income from foreign currency fluctuations is not significant. In addition, we have intercompany foreign transactions between our subsidiaries, which are denominated in currencies other than their functional currency. Fluctuations from the beginning to the end of any given reporting period result in the re-measurement of our intercompany foreign transactions generating transaction gains or losses in the respective period and are reported in total other income (expense), net in our consolidated financial statements. We recorded a foreign currency transaction (loss) gain of $(1.8) million, $(4.8) million and $1.5 million in 2015, 2014 and 2013, respectively. The monetary assets and liabilities of our foreign subsidiaries denominated in other currencies are translated into U.S. dollars at each balance sheet date resulting in a foreign currency translation adjustment reflected in accumulated other comprehensive loss. We recorded foreign currency translation income (losses) of $0.1 million, $2.7 million and $(0.7) million in 2015, 2014 and 2013, respectively.
Our contracts with foreign distributors are denominated and settled in U.S. dollars. Such foreign distributors are impacted by foreign currency fluctuations which in turn may impact their ability to pay us in a timely manner. Revenue from such customers approximated 18.9% of our revenue for 2015 and represented 34.0% of our net outstanding accounts receivable at December 31, 2015 .
ITEM 8. FINANCIAL STATEMENTS AND SUPPLEMENTARY DATA
The consolidated financial statements and supplementary data required by this item are set forth at the pages indicated in Item 15.
ITEM 9. CHANGES IN DISAGREEMENTS WITH ACCOUNTANTS ON ACCOUNTING AND FINANCIAL DISCLOSURES
There were no changes in or disagreements with our accountants on accounting and financial disclosure matters.
ITEM 9A. CONTROLS AND PROCEDURES
Evaluation of Disclosure Controls and Procedures
We maintain disclosure controls and procedures that are designed to provide reasonable assurance that information required to be disclosed in reports we file or submit under the Securities Exchange Act of 1934, as amended (the "Exchange Act") is (i) recorded, processed, summarized, and reported within the time periods specified in the SEC’s rules and forms, and (ii) accumulated and communicated to our management, including the Chief Executive Officer (CEO) and Chief Financial Officer (CFO), as appropriate to allow timely decisions regarding required disclosures.
We carried out the evaluation required by Rules 13a-15(b) and 15d-15(b) under the supervision and with the participation of our disclosure committee and our management, including the CEO and CFO, of the effectiveness of our "disclosure controls and procedures" (as defined in the Exchange Act Rules 13a-15(e) and 15d-15(e)). Based upon this evaluation, the CEO and CFO concluded that as of December 31, 2015, our disclosure controls and procedures, were effective.
Management’s Annual Report on Internal Control Over Financial Reporting
Management is responsible for establishing and maintaining adequate internal control over financial reporting as defined in Rule 13a-15(f) under the Exchange Act. Our internal control over financial reporting is a process designed to provide reasonable assurance to our management and directors regarding the reliability of financial reporting and the preparation of financial statements for external purposes in accordance with U.S. GAAP. As required by Section 404 of the Sarbanes-Oxley Act, we conducted an evaluation of the effectiveness of our internal control over financial reporting. In making this assessment, management used the criteria established in Internal Control - Integrated Framework issued by the Committee of Sponsoring Organizations of the Treadway Commission ("COSO") in 2013. Based on our evaluation, management concluded our internal control over financial reporting was effective as of December 31, 2015.
Internal control over financial reporting includes maintaining records that in reasonable detail accurately and fairly reflect our transactions; providing reasonable assurance that transactions are recorded as necessary for preparation of our financial statements; providing reasonable assurance that receipts and expenditures of our assets are made in accordance with management’s authorization; and providing reasonable assurance that unauthorized acquisition, use or disposition of our assets that could have a material effect on the financial statements would be prevented or detected on a timely basis.
Management, including our CEO and CFO, does not expect that our internal controls will prevent or detect all errors and all fraud. A control system, no matter how well designed and operated, can provide only reasonable, not absolute, assurance that the objectives of the control system are met. Further, the design of a control system must reflect the fact that there are resource constraints, and the benefits of controls must be considered relative to their costs. In addition, any evaluation of the effectiveness of controls is subject to risks that those internal controls may become inadequate in future periods because of changes in business conditions, or that the degree of compliance with the policies or procedures deteriorates.
This Annual Report on Form 10-K does not include an attestation report of our independent registered public accounting firm regarding internal control over financial reporting. We are an EGC as of December 31, 2015 as defined in the Jumpstart Our Business Startups (JOBS) Act of 2012, and we qualify for an exemption for non-accelerated filers that permits us to provide only management’s report in this annual report, pursuant to Section 404 of the Sarbanes-Oxley Act.
Changes in Internal Control over Financial Reporting
There were no changes in our internal control over financial reporting during the quarter ended December 31, 2015 that have materially affected, or are reasonably likely to materially affect, our internal control over financial reporting.
ITEM 9B. OTHER INFORMATION
None
PART III.
Certain information required by Part III is omitted from this report because we will file a definitive proxy statement within 120 days after the end of our fiscal year pursuant to Regulation 14A (the Proxy Statement) for our annual meeting of stockholders, and certain information included in the Proxy Statement is incorporated herein by reference.
ITEM 10. DIRECTORS, EXECUTIVE OFFICERS AND CORPORATE GOVERNANCE
The information required by this Item will be included in our Proxy Statement and is incorporated herein by reference.
ITEM 11. EXECUTIVE COMPENSATION
The information required by this Item will be included in our Proxy Statement and is incorporated herein by reference.
ITEM 12. SECURITY OWNERSHIP OF CERTAIN BENEFICIAL OWNERS AND MANAGEMENT AND RELATED STOCKHOLDER MATTERS
The information required by this Item will be included in our Proxy Statement and is incorporated herein by reference.
ITEM 13. CERTAIN RELATIONSHIPS AND RELATED TRANSACTIONS, AND DIRECTOR INDEPENDENCE
The information required by this Item will be included in our Proxy Statement and is incorporated herein by reference.
ITEM 14. PRINCIPAL ACCOUNTANT FEES AND SERVICES
The information required by this Item will be included in our Proxy Statement and is incorporated herein by reference.
PART IV.
ITEM 15. EXHIBITS AND FINANCIAL STATEMENT SCHEDULES
(a) The following documents are filed as a part of this report:
(1) Financial Statements.
(2) Exhibits. See subsection (b) below.
(b) The following exhibits are filed as part of this report:
The agreements and other documents filed as exhibits to this report are not intended to provide factual information or other disclosure other than with respect to the terms of the agreements or other documents themselves, and you should not rely on them for that purpose. In particular, any representations and warranties made by us in these agreements or other documents were made solely within the specific context of the relevant agreement or document and may not describe the actual state of affairs as of the date they were made or at any other time.
|
| | | |
Exhibit Number | | Description | |
| 2.1 | | Agreement and Plan of Merger, dated as of July 2, 2010, by and among K2M Group Holdings, Inc. (formerly known as Altitude Group Holdings, Inc.), Altitude Merger Sub, Inc., K2M, Inc., and the Stockholders’ Committee (incorporated by reference to Exhibit 2.1 to the Registrant’s Registration Statement on Form S-1 filed on April 7, 2014 (No. 333-194550)) | |
| 2.2 | | Amendment No. 1 to Agreement and Plan of Merger, dated as of August 12, 2010, by and among K2M Group Holdings, Inc. (formerly known as Altitude Group Holdings, Inc.), and K2M, Inc., (incorporated by reference to Exhibit 2.2 to the Registrant’s Registration Statement on Form S-1 filed on April 7, 2014 (No. 333-194550)) | |
| 2.3 | | Amendment No. 2 to Agreement and Plan of Merger, dated as of December 21, 2012, by and among K2M Group Holdings, Inc. (formerly known as Altitude Group Holdings, Inc. and the Stockholders’ Committee (incorporated by reference to Exhibit 2.3 to the Registrant’s Registration Statement on Form S-1 filed on April 7, 2014 (No. 333-194550)) | |
| 3.1 | | Third Amended and Restated Certificate of Incorporation of K2M Group Holdings, Inc. (incorporated by reference to Exhibit 3.1 to the Registrant’s Current Report on Form 8-K filed on May 13, 2014 (No. 001-36443)) | |
| 3.2 | | Amended and Restated Bylaws of K2M Group Holdings, Inc. (incorporated by reference to Exhibit 3.2 to the Registrant’s Current Report on Form 8-K filed on May 13, 2014 (No. 001-36443)) | |
| 10.1 | | Credit Agreement, dated as of October 29, 2012, among K2M Holdings, Inc., as a Guarantor, K2M, Inc. and K2M UK Limited, jointly and severally as Borrowers, the Guarantors from time to time parties thereto, the several lenders from time to time parties thereto and Silicon Valley Bank, as Administrative Agent, Issuing Lender and Swingline Lender (incorporated by reference to Exhibit 10.1 to the Registrant’s Registration Statement on Form S-1 filed on April 7, 2014 (No. 333-194550)) | |
|
| | | |
Exhibit Number | | Description | |
| 10.2 | | Waiver and First Amendment to Credit Agreement entered into as of May 20, 2013 by and among K2M Holdings, Inc., K2M, Inc. and K2M UK Limited, as borrowers, the several banks and other financial institutions or entities party thereto, Silicon Valley Bank, as the Issuing Lender and the Swingline Lender, and Silicon Valley Bank, as administrative agent and collateral agent for the lenders (incorporated by reference to Exhibit 10.2 to the Registrant’s Registration Statement on Form S-1 filed on April 7, 2014 (No. 333-194550)) | |
| 10.3 | | Second Amendment to Credit Agreement entered into as of February 26, 2014, by and among K2M Holdings, Inc., K2M, Inc. and K2M UK Limited, as borrowers, the several banks and other financial institutions or entities party thereto, Silicon Valley Bank, as the Issuing Lender and the Swingline Lender, and Silicon Valley Bank, as administrative agent and collateral agent for the lenders (incorporated by reference to Exhibit 10.3 to the Registrant’s Registration Statement on Form S-1 filed on April 7, 2014 (No. 333-194550)) | |
| 10.4 | | Third Amendment to Credit Agreement entered into as of April 30, 2014, by and among K2M Holdings, Inc., K2M, Inc. and K2M UK Limited, as borrowers, the several banks and other financial institutions or entities party thereto, Silicon Valley Bank, as the Issuing Lender and the Swingline Lender, and Silicon Valley Bank, as administrative agent and collateral agent for the lenders (incorporated by reference to Exhibit 10.34 to the Registrant’s Registration Statement on Form S-1 filed on May 2, 2014 (No. 333-194550)) | |
| 10.5 | | Fourth Amendment to Credit Agreement entered into as of October 21, 2014, by and among K2M Holdings, Inc., K2M, Inc. and K2M UK Limited, as borrowers, the several banks and other financial institutions or entities party thereto, Silicon Valley Bank, as the Issuing Lender and the Swingline Lender, and Silicon Valley Bank, as administrative agent and collateral agent for the lenders (incorporated by reference to Exhibit 10.1 to the Registrant’s Current Report on Form 8-K filed on October 24, 2014 (No. 001-36433)) | |
| 10.6 | | Fifth Amendment to Credit Agreement and First Amendment to Guarantee and Collateral Agreement entered into as of January 7, 2015, by and among K2M Holdings, Inc., K2M, Inc. and K2M UK Limited, as borrowers, the several banks and other financial institutions or entities party thereto, Silicon Valley Bank, as the Issuing Lender and the Swingline Lender, and Silicon Valley Bank, as administrative agent and collateral agent for the lenders (incorporated by reference to Exhibit 10.1 to the Registrant’s Current Report on Form 8-K filed on January 9, 2015 (No. 001-36433)) | |
| 10.7 | | Sixth Amendment to Credit Agreement entered into as of May 8, 2015, by and among K2M Holdings, Inc., K2M, Inc. and K2M UK Limited, as borrowers, the several banks and other financial institutions or entities party thereto, Silicon Valley Bank, as the Issuing Lender and the Swingline Lender, and Silicon Valley Bank, as administrative agent and collateral agent for the lenders (incorporated by reference to Exhibit 10.1 to the Registrant’s Current Report on Form 8-K filed on May 8, 2015 (No. 001-36433)).
| |
| 10.8 | | Seventh Amendment to Credit Agreement entered into as of June 5, 2015, by and among K2M Holdings, Inc., K2M, Inc. and K2M UK Limited, as borrowers, the several banks and other financial institutions or entities party thereto, Silicon Valley Bank, as the Issuing Lender and the Swingline Lender, and Silicon Valley Bank, as administrative agent and collateral agent for the lenders (incorporated by reference to Exhibit 10.1 to the Registrant’s Current Report on Form 8-K filed on June 5, 2015 (No. 001-36433)). | |
| 10.9 | | Eighth Amendment dated October 29, 2015 to Credit Agreement dated October 29, 2012, by and among K2M Holdings, Inc., as the guarantor, K2M, Inc. and K2M UK Limited, as borrowers, and Silicon Valley Bank and Comerica Bank as lenders. (incorporated by reference to Exhibit 10.1 to the Registrant’s Current Report on Form 8-K filed on November 3, 2015 (No. 001-36433)).
| |
| 10.10 | | Guarantee and Collateral Agreement, dated as of October 29, 2012, made by K2M Holdings, Inc., K2M, Inc. and the other Grantors referred to herein in favor of Silicon Valley Bank, as Administrative Agent (incorporated by reference to Exhibit 10.4 to the Registrant’s Registration Statement on Form S-1 filed on April 7, 2014 (No. 333-194550)) | |
| 10.11 | | Export Import Bank Credit Agreement, dated as of October 29, 2012, among K2M Holdings, Inc., as a Guarantor, the other Guarantors from time to time parties hereto, K2M Inc., as the Borrower, the several Exim Lenders from time to time parties hereto, and Silicon Valley Bank, as Administrative Agent (incorporated by reference to Exhibit 10.5 to the Registrant’s Registration Statement on Form S-1 fled on April 7, 2014 (No. 333-194550)) | |
|
| | | |
Exhibit Number | | Description | |
| 10.12 | | Guarantee and Collateral Agreement for Export Import Bank Credit Facility, dated as of October 29, 2012, made by K2M Holdings, Inc., K2M, Inc. and the other Grantors referred to herein in favor of Silicon Valley Bank, as Administrative Agent (incorporated by reference to Exhibit 10.6 to the Registrant’s Registration Statement on Form S-1 filed on April 7, 2014 (No. 333-194550)) | |
| 10.13 | † | Employment Agreement, effective as of August 12, 2010, by and between K2M, Inc. and Eric Major (incorporated by reference to Exhibit 10.7 to the Registrant’s Registration Statement on Form S-1 filed on April 7, 2014 (No. 333-194550)) | |
| 10.14 | † | Amendment, dated as of January 20, 2014, to Employment Agreement, effective as of August 12, 2010, by and between K2M, Inc. and Eric Major (incorporated by reference to Exhibit 10.8 to the Registrant’s Registration Statement on Form S-1 filed on April 7, 2014 (No. 333-194550)) | |
| 10.15 | † | Employment Agreement, effective as of August 12, 2010, by and between K2M, Inc. and Gregory Cole (incorporated by reference to Exhibit 10.9 to the Registrant’s Registration Statement on Form S-1 filed on April 7, 2014 (No. 333-194550)) | |
| 10.16 | † | Amendment, dated as of January 20, 2014, to Employment Agreement, effective as of August 12, 2010, by and between K2M, Inc. and Gregory Cole (incorporated by reference to Exhibit 10.10 to the Registrant’s Registration Statement on Form S-1 filed on April 7, 2014 (No. 333-194550)) | |
| 10.17 | † | Employment Agreement, effective as of August 12, 2010, by and between K2M, Inc. and Dr. John Kostuik (incorporated by reference to Exhibit 10.11 to the Registrant’s Registration Statement on Form S-1 filed on April 7, 2014 (No. 333-194550)) | |
| 10.18 | † | Amendment, dated as of March 10, 2014, to Employment Agreement, effective as of August 12, 2010, by and between K2M, Inc. and Dr. John Kostuik (incorporated by reference to Exhibit 10.12 to the Registrant’s Registration Statement on Form S-1 filed on April 7, 2014 (No. 333-194550)) | |
| 10.19 | † | Amended and Restated K2M, Inc. 2006 Stock Option and Grant Plan (incorporated by reference to Exhibit 10.13 to the Registrant’s Registration Statement on Form S-1 filed on April 7, 2014 (No. 333-194550)) | |
| 10.20 | † | Form of Incentive Stock Option Agreement under the Amended and Restated 2006 Stock Option and Grant Plan and Stock Restriction Agreement (incorporated by reference to Exhibit 10.40 to the Registrant’s Registration Statement on Form S-1 filed on January 28, 2015 (No. 333-201597)) | |
| 10.21 | † | K2M Group Holdings, Inc. 2010 Equity Award Plan (incorporated by reference to Exhibit 10.14 to the Registrant’s Registration Statement on Form S-1 filed on April 7, 2014 (No. 333-194550)) | |
| 10.22 | † | Form of Stock Option Award Agreement for directors, under the K2M Group Holdings, Inc. 2010 Equity Award Plan (incorporated by reference to Exhibit 10.40 to the Registrant’s Registration Statement on Form S-1 filed on January 28, 2015 (No. 333-201597)) | |
| 10.23 | † | Form of Stock Option Award Agreement for employees and consultants, under the K2M Group Holdings, Inc. 2010 Equity Award Plan (incorporated by reference to Exhibit 10.41 to the Registrant’s Registration Statement on Form S-1 filed on January 28, 2015 (No. 333-201597)) | |
| 10.24 | † | K2M Group Holdings, Inc. 2014 Employee Stock Purchase Plan (incorporated by reference to Exhibit 10.15 to the Registrant’s Registration Statement on Form S-1 filed on January 28, 2015 (No. 333-194550)) | |
| 10.25 | † | K2M, Inc. Omnibus Incentive Plan (incorporated by reference to Exhibit 10.42 to the Registrant’s Registration Statement on Form S-1 filed on March 14, 2014 (No. 333-194550)) | |
| 10.26 | † | Form of Option Agreement under the K2M Group Holdings, Inc. 2014 Omnibus Incentive Plan (incorporated by reference to Exhibit 10.42 to the Registrant’s Registration Statement on Form S-1 filed on January 28, 2015 (No. 333-201597)) | |
| 10.27 | † | Form of Restricted Stock Unit Award Agreement (incorporated by reference to Exhibit 10.32 to the Registrant’s Registration Statement on Form S-1 filed on April 22, 2014 (No. 333-194550)) | |
|
| | | |
Exhibit Number | | Description | |
| 10.28 | † | Form of Side Letter to Restricted Stock Unit Award Agreement (incorporated by reference to Exhibit 10.33 to the Registrant’s Registration Statement on Form S-1 filed on April 22, 2014 (No. 333-194550)) | |
| 10.29 | † | K2M Group Holdings, Inc. 2010 Independent Agent Stock Option Plan (incorporated by reference to Exhibit 10.17 to the Registrant’s Registration Statement on Form S-1 filed on April 7, 2014 (No. 333-194550)) | |
| 10.30 | | Lease Agreement, dated as of May 12, 2004, by and between RiverAir, LC and K2 Medical, LLC, as amended, in respect of the building located at 751 Miller Drive S.E, Leesburg, Virginia 20175 (incorporated by reference to Exhibit 10.18 to the Registrant’s Registration Statement on Form S-1 filed on April 7, 2014 (No. 333-194550)) | |
| 10.31 | | Amendment to Lease Agreement, made as of April 17, 2014, by and between RiverAir, LC and K2M, Inc. (incorporated by reference to Exhibit 10.10 to the Registrant’s Quarterly Report on Form 10-Q filed on June 5, 2014 (No. 001-36443)) | |
| 10.32 | | Deed of Lease, made as of December 10, 2014, by and between TC Oaklawn Owner, LLC and K2M Group Holdings, Inc. (incorporated by reference to Exhibit 10.1 to the Registrants' Current Report on Form 8-K filed on December 12, 2014 (No. 001-36443)) | |
| 10.33 | | Exclusive License Agreement, dated as of September 2, 2004, by and between Spinal LLC and K2M, LLC (incorporated by reference to Exhibit 10.20 to the Registrant’s Registration Statement on Form S-1 filed on April 7, 2014 (No. 333-194550)) | |
| 10.34 | | Amendment to Exclusive License Agreement, entered into as of February 17, 2010, by and between Spinal LLC and K2M, LLC (incorporated by reference to Exhibit 10.21 to the Registrant’s Registration Statement on Form S-1 filed on April 7, 2014 (No. 333-194550)) | |
| 10.35 | | Asset Purchase Agreement, made and entered into as of November 21, 2011, by and between K2M, Inc. and Nexgen Spine, Inc. (incorporated by reference to Exhibit 10.22 to the Registrant’s Registration Statement on Form S-1 filed on April 7, 2014 (No. 333-194550)) | |
| 10.36 | | Royalty Agreement, made and effective as of April 1, 2007, between K2M, Inc. and Josef Gorek, M.D. (incorporated by reference to Exhibit 10.23 to the Registrant’s Registration Statement on Form S-1 filed on April 7, 2014 (No. 333-194550)) | |
| 10.37 | | Assignment and Earn-Out Agreement, made and entered into as of March 8, 2004, by and between K2 Medical, LLC, as assignee, and Fasteneix, LLC, Third Millenium Engineering, LLC, J7 Summit Medical Group, LLC, Techsys Medical, LLC, Bones Consulting, LLC and Josef Gorek (incorporated by reference to Exhibit 10.24 to the Registrant’s Registration Statement on Form S-1 filed on April 7, 2014 (No. 333-194550)) | |
| 10.38 | | Addendum, dated as of September 27, 2005, to the Assignment and Earn-out Agreement by and between K2 Medical, LLC and Fastenix, LLC, Third Millenium Engineering, LLC, J7 Summit Medical Group, LLC, Techsys Medical, LLC and Bones Consulting, LLC (incorporated by reference to Exhibit 10.25 to the Registrant’s Registration Statement on Form S-1 filed on April 7, 2014 (No. 333-194550)) | |
| 10.39 | | License Agreement, dated as of May 19/June 12, 2006, between Prof. Dr. Dietmar Wolter and K2M, LLC (incorporated by reference to Exhibit 10.26 to the Registrant’s Registration Statement on Form S-1 filed on April 7,2014 (No. 333-194550)) | |
| 10.40 | | Additional Agreement to License Agreement, dated as of June 14/June 12, 2006, between Prof. Dr. Dietmar Wolter and K2M, LLC (incorporated by reference to Exhibit 10.27 to the Registrant’s Registration Statement on Form S-1 April 7, 2014 (No. 333-194550)) | |
| 10.41 | | Addendum, dated as of February 20/February 22, 2008, to the License Agreement dated as of May 19/June 12, 2006 and the Additional Agreement to License Agreement dated as of May 19/June 12, 2006, between Prof. Dr. Dietmar Wolter and K2M, Inc. (formerly known as K2M, LLC) (incorporated by reference to Exhibit 10.28 to the Registrant’s Registration Statement on Form S-1 filed on April 7, 2014 (No. 333-194550)) | |
|
| | | |
Exhibit Number | | Description | |
| 10.42 | | Asset Purchase and Earn Out Agreement, made and entered into as of February 12, 2010, by and between K2M, Inc. and John Carbone, MD (incorporated by reference to Exhibit 10.29 to the Registrant’s Registration Statement on Form S-1 filed on April 7, 2014 (No. 333-194550)) | |
| 10.43 | | First Amendment to Asset Purchase and Earn Out Agreement, made and entered into as of June 15, 2012, by and between K2M, Inc. and John Carbone, MD (incorporated by reference to Exhibit 10.30 to the Registrant’s Registration Statement on Form S-1 filed on April 7, 2014 (No. 333-194550)) | |
| 10.44 | | Registration Rights Agreement, dated August 12, 2010, by and among K2M Group Holdings, Inc., Welsh, Carson, Anderson & Stowe XI, L.P., FFC Partners III, L.P. and the other stockholders named therein (incorporated by reference to Exhibit 10.31 to the Registrant’s Registration Statement on Form S-1 April 22, 2014 (No. 333-194550)) | |
| 21.1 | | List of Subsidiaries (filed herewith) | |
| 23.1 | | Consent of Ernst & Young LLP (filed herewith) | |
| 23.2 | | Consent of iData Research, Inc. (filed herewith) | |
| 24.1 | | Power of Attorney (filed herewith) | |
| 31.1 | | Certification of Periodic Report by Chief Executive Officer under Section 302 of the Sarbanes-Oxley Act of 2002 (filed herewith). | |
| 31.2 | | Certification of Periodic Report by Chief Financial Officer under Section 302 of the Sarbanes-Oxley Act of 2002 (filed herewith). | |
| 32.1 | | Certification of Chief Executive Officer Pursuant to 18 U.S.C. Section 1350 as Adopted Pursuant to Section 906 of the Sarbanes-Oxley Act of 2002 (filed herewith). | |
| 32.2 | | Certification of Chief Financial Officer Pursuant to 18 U.S.C. Section 1350 as Adopted Pursuant to Section 906 of the Sarbanes-Oxley Act of 2002 (filed herewith) | |
| 101.INS | | XBRL Instance Document (A) | |
| 101 SCH | | XBRL Taxonomy Extension Schema Document (A) | |
| 101.CAL | | XBRL Taxonomy Extension Calculation Linkbase Document (A) | |
| 101.DEF | | XBRL Taxonomy Extension Definition Linkbase Document (A) | |
| 101.LAB | | XBRL Taxonomy Extension Label Linkbase Document (A) | |
| 101.PRE | | XBRL Taxonomy Extension Presentation Linkbase Document (A) | |
|
| | |
| † | Identifies exhibits that consist of a management contract or compensatory plan or arrangement. | |
|
| | |
| (A) | XBRL (Extensible Business Reporting Language) information is furnished and not filed for purposes of Section 11 and 12 of the Securities Act of 1933 and Section 18 of the Securities Exchange Act of 1934. | |
SIGNATURES
Pursuant to the requirements of Section 13 or 15(d) of the Securities Exchange Act of 1934, as amended, the Company has duly caused this report to be signed on its behalf by the undersigned, thereunto duly authorized. |
| | | | | | | | |
| | | | | | | | | |
| | | K2M Group Holdings, Inc. (Registrant) | | |
| | | | |
| Date: March 3, 2016 | | By: | /s/ Eric D. Major | | |
| | | | | Name: | | Eric D. Major | | |
| | | | | Title: | | President and Chief Executive Officer (Authorized Signatory) | | |
| | | | |
Pursuant to the requirements of the Securities Exchange Act of 1934, as amended, this report has been signed below by the following persons on behalf of the Company and in the capacities and on the dates indicated.
|
| | |
| Name | Title | Date |
| /s/ Eric D. Major | President, Chief Executive Officer and Director | March 3, 2016 |
| Eric D. Major | | |
| | | |
| /s/ Gregory S. Cole | Chief Financial Officer (Principal Financial Officer) | March 3, 2016 |
| Gregory S. Cole | | |
| | | |
| * | Chief Medical Officer and Director | March 3, 2016 |
| John P. Kostuik, M.D. | | |
| | | |
| /s/ George Z. Moratis | Global Accounting Officer (Principal Accounting Officer) | March 3, 2016 |
| George Z. Moratis | | |
| | | |
| * | Director | March 3, 2016 |
| Brett P. Brodnax | | |
| | | |
| * | Director | March 3, 2016 |
| Carlos A. Ferrer | | |
| | | |
| * | Chairman | March 3, 2016 |
| Daniel A. Pelak | | |
| | | |
| * | Director | March 3, 2016 |
| Paul B. Queally | | |
| | | |
| * | Director | March 3, 2016 |
| Raymond A. Ranelli | | |
| | | |
| * | Director | March 3, 2016 |
| Sean M. Traynor | | |
| | | |
| * | Director | March 3, 2016 |
| Michael A. Turpin | | |
| | | |
| | * By: /s/ Eric. D. Major | March 3, 2016 |
| | Attorney-in Fact | |
K2M GROUP HOLDINGS, INC.
INDEX TO CONSOLIDATED FINANCIAL STATEMENTS
REPORT OF INDEPENDENT REGISTERED PUBLIC ACCOUNTING FIRM
The Board of Directors and Stockholders
K2M Group Holdings, Inc.
We have audited the accompanying consolidated balance sheets of K2M Group Holdings, Inc. (the Company), as of December 31, 2015 and 2014 and the related consolidated statements of operations, comprehensive loss, changes in stockholders’ equity and cash flows for each of the three years in the period ended December 31, 2015. These financial statements are the responsibility of the Company’s management. Our responsibility is to express an opinion on these financial statements based on our audits.
We conducted our audits in accordance with the standards of the Public Company Accounting Oversight Board (United States). Those standards require that we plan and perform the audit to obtain reasonable assurance about whether the financial statements are free of material misstatement. We were not engaged to perform an audit of the Company’s internal control over financial reporting. Our audits included consideration of internal control over financial reporting as a basis for designing audit procedures that are appropriate in the circumstances, but not for the purpose of expressing an opinion on the effectiveness of the Company’s internal control over financial reporting. Accordingly, we express no such opinion. An audit also includes examining, on a test basis, evidence supporting the amounts and disclosures in the financial statements, assessing the accounting principles used and significant estimates made by management, and evaluating the overall financial statement presentation. We believe that our audits provide a reasonable basis for our opinion.
In our opinion, the financial statements referred to above present fairly, in all material respects, the consolidated financial position of K2M Group Holdings, Inc. at December 31, 2015 and 2014, and the consolidated results of its operations and its cash flows for each of the three years in the period ended December 31, 2015 in conformity with U.S. generally accepted accounting principles.
/s/ Ernst & Young LLP
McLean, Virginia
March 3, 2016
K2M GROUP HOLDINGS, INC.
CONSOLIDATED BALANCE SHEETS
(In Thousands, Except Share and Per Share Data)
|
| | | | | | | | |
| | | December 31, |
| | | 2015 | | 2014 |
| ASSETS | | | | |
| Current assets: | | | | |
| Cash and cash equivalents | | $ | 34,646 |
| | $ | 11,411 |
|
| Accounts receivable, net | | 38,773 |
| | 33,937 |
|
| Inventory, net | | 62,002 |
| | 52,617 |
|
| Prepaid expenses and other current assets | | 19,820 |
| | 3,911 |
|
| Total current assets | | 155,241 |
| | 101,876 |
|
| Property, plant and equipment, net | | 38,318 |
| | 4,220 |
|
| Goodwill | | 121,814 |
| | 121,814 |
|
| Intangible assets, net | | 33,123 |
| | 41,609 |
|
| Other assets, net | | 26,016 |
| | 29,672 |
|
| Total assets | | $ | 374,512 |
| | $ | 299,191 |
|
| LIABILITIES AND STOCKHOLDERS’ EQUITY | | | | |
| Current liabilities: | | | | |
| Current maturities under capital lease obligation | | $ | 284 |
| | $ | — |
|
| Accounts payable | | 22,483 |
| | 14,018 |
|
| Accrued expenses | | 13,559 |
| | 10,077 |
|
| Accrued payroll liabilities | | 11,507 |
| | 11,488 |
|
| Total current liabilities | | 47,833 |
| | 35,583 |
|
| Capital lease obligation, net of current maturities | | 34,140 |
| | — |
|
| Deferred income taxes, net | | 5,042 |
| | 5,042 |
|
| Other liabilities | | 835 |
| | 112 |
|
| Total liabilities | | 87,850 |
| | 40,737 |
|
| Commitments and contingencies | |
| |
|
| Stockholders’ equity: | | | | |
Common stock, $0.001 par value, 750,000,000 shares authorized; 41,337,692 and 37,366,098 shares issued and outstanding at December 31, 2015 and at December 31, 2014, respectively | | 41 |
| | 37 |
|
| Additional paid-in capital | | 454,153 |
| | 386,795 |
|
| Accumulated other comprehensive income | | 1,889 |
| | 1,827 |
|
| Accumulated deficit | | (169,421 | ) | | (130,205 | ) |
| Total stockholders’ equity | | 286,662 |
| | 258,454 |
|
| Total liabilities and stockholders’ equity | | $ | 374,512 |
| | $ | 299,191 |
|
See accompanying notes to consolidated financial statements.
K2M GROUP HOLDINGS, INC.
CONSOLIDATED STATEMENTS OF OPERATIONS
(In Thousands, Except Share and Per Share Data)
|
| | | | | | | | | | | | |
| | | Year Ended
December 31, |
| | | 2015 | | 2014 | | 2013 |
| Revenue | | $ | 216,007 |
| | $ | 186,672 |
| | $ | 157,584 |
|
| Cost of revenue | | 71,791 |
| | 62,800 |
| | 50,162 |
|
| Gross profit | | 144,216 |
| | 123,872 |
| | 107,422 |
|
| Operating expenses: | | | | | | |
| Research and development | | 19,868 |
| | 16,302 |
| | 12,402 |
|
| Sales and marketing | | 105,635 |
| | 95,323 |
| | 80,183 |
|
| General and administrative | | 54,983 |
| | 60,216 |
| | 59,758 |
|
| Total operating expenses | | 180,486 |
| | 171,841 |
| | 152,343 |
|
| Loss from operations | | (36,270 | ) | | (47,969 | ) | | (44,921 | ) |
| Other expense, net: | | | | | | |
| Foreign currency transaction (loss) gain | | (1,813 | ) | | (4,752 | ) | | 1,477 |
|
| Discount on prepayment of notes to stockholders | | — |
| | (4,825 | ) | | — |
|
| Interest expense | | (941 | ) | | (2,205 | ) | | (2,810 | ) |
| Total other expense, net | | (2,754 | ) | | (11,782 | ) | | (1,333 | ) |
| Loss before income taxes | | (39,024 | ) | | (59,751 | ) | | (46,254 | ) |
| Income tax expense (benefit) | | 192 |
| | (114 | ) | | (8,341 | ) |
| Net loss | | (39,216 | ) | | (59,637 | ) | | (37,913 | ) |
| Accretion and adjustment of preferred stock to fair value | | — |
| | 6,879 |
| | (19,439 | ) |
| Net loss attributable to common stockholders | | $ | (39,216 | ) | | $ | (52,758 | ) | | $ | (57,352 | ) |
| Net loss per share attributable to common stockholders: | | | | | | |
| Basic and diluted | | $ | (0.97 | ) | | $ | (1.65 | ) | | $ | (2.58 | ) |
| Weighted average shares outstanding: | | | | | | |
| Basic and diluted | | 40,237,848 |
| | 31,887,246 |
| | 22,238,632 |
|
See accompanying notes to consolidated financial statements.
K2M GROUP HOLDINGS, INC.
CONSOLIDATED STATEMENTS OF COMPREHENSIVE LOSS
(In Thousands)
|
| | | | | | | | | | | | |
| | | Year Ended
December 31, |
| | | 2015 | | 2014 | | 2013 |
| Net loss | | $ | (39,216 | ) | | $ | (59,637 | ) | | $ | (37,913 | ) |
| Other comprehensive income (loss): | | | | | | |
| Foreign currency translation adjustment | | 62 |
| | 2,747 |
| | (722 | ) |
| Other comprehensive income (loss) | | 62 |
| | 2,747 |
| | (722 | ) |
| Comprehensive loss | | $ | (39,154 | ) | | $ | (56,890 | ) | | $ | (38,635 | ) |
See accompanying notes to consolidated financial statements.
K2M GROUP HOLDINGS, INC.
CONSOLIDATED STATEMENTS OF CHANGES IN STOCKHOLDERS’ EQUITY
(In Thousands, Except Share Data)
|
| | | | | | | | | | | | | | | | | | | | | | | |
| | | Common Stock | | Additional Paid-in Capital | | Accumulated Other Comprehensive (Loss) Income | | Accumulated Deficit | | Total Stockholders’ Equity |
| | | Shares | | Amount | |
| Balance at December 31, 2012 | | 22,070,165 |
| | $ | 22 |
| | $ | 182,863 |
| | $ | (198 | ) | | $ | (32,655 | ) | | $ | 150,032 |
|
| Net loss | | — |
| | — |
| | — |
| | — |
| | (37,913 | ) | | (37,913 | ) |
| Other comprehensive loss | | — |
| | — |
| | — |
| | (722 | ) | | — |
| | (722 | ) |
| Stock-based compensation | | — |
| | — |
| | 1,588 |
| | — |
| | — |
| | 1,588 |
|
| Accretion of Series A redeemable convertible preferred stock | | — |
| | — |
| | (5,304 | ) | | — |
| | — |
| | (5,304 | ) |
| Write-up of Series B redeemable convertible preferred stock to fair value at issuance | | — |
| | — |
| | (14,035 | ) | | — |
| | — |
| | (14,035 | ) |
| Accretion of Series A and B redeemable convertible preferred stock issuance costs | | — |
| | — |
| | (100 | ) | | — |
| | — |
| | (100 | ) |
| Issuance of common stock pursuant to securities purchase and other agreements | | 196,029 |
| | — |
| | 2,177 |
| | — |
| | — |
| | 2,177 |
|
| Stock option modifications | | — |
| | — |
| | (1,910 | ) | | — |
| | — |
| | (1,910 | ) |
| Issuance and exercise of stock-based compensation benefit plans, net of income tax | | 155,315 |
| | — |
| | 372 |
| | — |
| | — |
| | 372 |
|
| Balance at December 31, 2013 | | 22,421,509 |
| | $ | 22 |
| | $ | 165,651 |
| | $ | (920 | ) | | $ | (70,568 | ) | | $ | 94,185 |
|
| Net loss | | — |
| | — |
| | — |
| | — |
| | (59,637 | ) | | (59,637 | ) |
| Other comprehensive income | | — |
| | — |
| | — |
| | 2,747 |
| | — |
| | 2,747 |
|
| Stock-based compensation | |
|
| | — |
| | 5,807 |
| | — |
| | — |
| | 5,807 |
|
| Accretion of Series A and B redeemable convertible preferred stock | | — |
| | — |
| | (1,158 | ) | | — |
| | — |
| | (1,158 | ) |
| Accretion of Series A and B redeemable convertible preferred stock issuance costs | | — |
| | — |
| | (22 | ) | | — |
| | — |
| | (22 | ) |
| Issuances of common stock pursuant to securities purchase and other agreements | | 121,111 |
| | — |
| | 2,307 |
| | — |
| | — |
| | 2,307 |
|
| Adjustment of preferred stock to fair value prior to conversion | | — |
| | — |
| | 8,059 |
| | — |
| | — |
| | 8,059 |
|
| Common stock issued in conversion of Series A and B redeemable convertible preferred stock | | 5,577,016 |
| | 6 |
| | 83,650 |
| | — |
| | — |
| | 83,656 |
|
| Issuance of common stock from initial public offering, net of offering costs | | 8,825,000 |
| | 8 |
| | 118,862 |
| | — |
| | — |
| | 118,870 |
|
| Stock option modifications | | — |
| | — |
| | 2,077 |
| | — |
| | — |
| | 2,077 |
|
| Issuance and exercise of stock-based compensation benefit plans, net of income tax | | 421,462 |
| | 1 |
| | 1,562 |
| | — |
| | — |
| | 1,563 |
|
| Balance at December 31, 2014 | | 37,366,098 |
| | $ | 37 |
| | $ | 386,795 |
| | $ | 1,827 |
| | $ | (130,205 | ) | | $ | 258,454 |
|
| Net loss | | — |
| | — |
| | — |
| | — |
| | (39,216 | ) | | (39,216 | ) |
| Other comprehensive income | | — |
| | — |
| | — |
| | 62 |
| | — |
| | 62 |
|
| Stock-based compensation | | — |
| | — |
| | 11,188 |
| | — |
| | — |
| | 11,188 |
|
| Issuance of common stock, net of issuance costs | | 2,907,490 |
| | 3 |
| | 54,154 |
| | — |
| | — |
| | 54,157 |
|
| Issuance and exercise of stock-based compensation benefit plans, net of income tax | | 1,064,104 |
| | 1 |
| | 2,016 |
| | — |
| | — |
| | 2,017 |
|
| Balance at December 31, 2015 | | 41,337,692 |
| | $ | 41 |
| | $ | 454,153 |
| | $ | 1,889 |
| | $ | (169,421 | ) | | $ | 286,662 |
|
See accompanying notes to consolidated financial statements.
K2M GROUP HOLDINGS, INC.
CONSOLIDATED STATEMENTS OF CASH FLOWS
(In Thousands) |
| | | | | | | | | | | | |
| | | Year Ended
December 31, |
| | | 2015 | | 2014 | | 2013 |
| Operating activities | | | | | | |
| Net loss | | $ | (39,216 | ) | | $ | (59,637 | ) | | $ | (37,913 | ) |
| Adjustments to reconcile net loss to net cash used in operating activities: | | | | | | |
| Depreciation and amortization | | 24,940 |
| | 33,324 |
| | 36,776 |
|
| Provision for allowance for doubtful accounts | | 319 |
| | 469 |
| | 167 |
|
| Provision for inventory reserve | | 1,680 |
| | 583 |
| | 2,285 |
|
| Stock-based compensation | | 11,188 |
| | 5,807 |
| | 2,879 |
|
| Amortization of issuance and discount costs included in interest expense | | — |
| | 4,928 |
| | 98 |
|
| Deferred income taxes | | — |
| | (218 | ) | | (8,492 | ) |
| Changes in operating assets and liabilities: | | | | | | |
| Accounts receivable | | (5,082 | ) | | (2,860 | ) | | (5,825 | ) |
| Inventory | | (8,766 | ) | | (13,660 | ) | | (15,697 | ) |
| Prepaid expenses and other assets | | (9,738 | ) | | (8,450 | ) | | (1,284 | ) |
| Accounts payable, accrued expenses, and accrued payroll liabilities | | 6,365 |
| | 9,552 |
| | 7,916 |
|
| Net cash used in operating activities | | (18,310 | ) | | (30,162 | ) | | (19,090 | ) |
| Investing activities | | | | | | |
| Purchase of surgical instruments | | (10,905 | ) | | (12,848 | ) | | (8,323 | ) |
| Purchase of property, plant and equipment | | (2,787 | ) | | (2,905 | ) | | (1,494 | ) |
| Amounts placed in escrow for new corporate headquarters | | — |
| | (6,667 | ) | | — |
|
| Purchase of intangible assets | | (588 | ) | | (118 | ) | | (117 | ) |
| Net cash used in investing activities | | (14,280 | ) | | (22,538 | ) | | (9,934 | ) |
| Financing activities | | | | | | |
| Borrowings on bank line of credit | | 25,000 |
| | — |
| | 3,500 |
|
| Payments on bank line of credit | | (25,000 | ) | | (23,500 | ) | | (2,000 | ) |
| Proceeds from issuances of notes to stockholders | | — |
| | 14,634 |
| | 14,884 |
|
| Prepayment of notes to stockholders | | — |
| | (39,212 | ) | | — |
|
Proceeds from issuance of Series B redeemable convertible preferred stock, net of issuance costs | | — |
| | — |
| | 11,574 |
|
Payment of dividends on Series A and Series B redeemable convertible preferred stock | | — |
| | (18,547 | ) | | — |
|
| Proceeds from issuances of common stock, net of issuance costs | | 54,209 |
| | 121,898 |
| | — |
|
| Proceeds from private placement of common stock | | — |
| | — |
| | 2,177 |
|
Issuances and exercise of stock-based compensation benefit plans, net of income tax | | 2,017 |
| | 1,563 |
| | (755 | ) |
| Net cash provided by financing activities | | 56,226 |
| | 56,836 |
| | 29,380 |
|
| Effect of exchange rate changes on cash and cash equivalents | | (401 | ) | | (144 | ) | | 52 |
|
| Net increase in cash and cash equivalents | | 23,235 |
| | 3,992 |
| | 408 |
|
| Cash and cash equivalents at beginning of period | | 11,411 |
| | 7,419 |
| | 7,011 |
|
| Cash and cash equivalents at end of period | | $ | 34,646 |
| | $ | 11,411 |
| | $ | 7,419 |
|
| | | | | | | |
| Significant non-cash investing activities | | | | | | |
| Buildings under capital lease | | $ | 26,469 |
| | $ | — |
| | $ | — |
|
| Leasehold improvements under capital lease | | $ | 6,884 |
| | $ | — |
| | $ | — |
|
| | | | | | | |
| Significant non-cash financing activities | | | | | | |
| Capital lease obligation | | $ | 33,938 |
| | $ | — |
| | $ | — |
|
| Accretion of Series A redeemable convertible preferred stock | | $ | — |
| | $ | 1,195 |
| | $ | 6,142 |
|
| Accretion of Series B redeemable convertible preferred stock | | $ | — |
| | $ | (15 | ) | | $ | (738 | ) |
| Adjustment of preferred stock to fair value | | $ | — |
| | $ | (8,059 | ) | | $ | 14,035 |
|
| Deferred offering costs | | $ | 52 |
| | — |
| | — |
|
| | | | | | | |
| Cash paid for: | | | | | | |
| Income taxes | | $ | 126 |
| | $ | 132 |
| | $ | 130 |
|
| Interest | | $ | 428 |
| | $ | 6,690 |
| | $ | 2,405 |
|
K2M Group Holdings, Inc.
Notes to Consolidated Financial Statements
(In Thousands, Except Share and Per Share Data)
1. GENERAL AND SUMMARY OF SIGNIFICANT ACCOUNTING POLICIES
In the Annual Report on Form 10-K, unless the context otherwise requires, reference to "K2M," "the Company," "we," us," and "our," refer to K2M Group Holdings, Inc. together with its subsidiaries.
Description of Business
K2M Group Holdings, Inc. (the Company) was formed as a Delaware corporation on June 29, 2010. On July 2, 2010, K2M, Inc. (K2M), a company initially incorporated in 2004, entered into an Agreement and Plan of Merger (the Merger Agreement) with Altitude Group Holdings, Inc. (Altitude) and Altitude Merger Sub, Inc. (Merger Sub). Altitude was a newly formed corporation and an indirect wholly-owned subsidiary of Welsh, Carson, Anderson & Stowe XI, L.P., ("WCAS"). On August 12, 2010 (the Merger Date), upon the closing of the transactions under the Merger Agreement, Merger Sub merged with and into K2M with K2M being the surviving corporation of such merger (the Merger) and Altitude was renamed K2M Group Holdings, Inc.
We are a global medical device company focused on designing, developing and commercializing innovative and proprietary complex spine technologies and techniques. Our complex spine products are used by spine surgeons to treat some of the most difficult and challenging spinal pathologies, such as deformity (primarily scoliosis), trauma, and tumor. We have applied our product development expertise in innovating complex spine technologies and techniques to the design, development, and commercialization of an expanding number of proprietary minimally invasive surgery, or MIS products. Our MIS products are designed to allow for less invasive access to the spine and faster patient recovery times as compared to traditional open access surgical approaches for both complex spine and degenerative spine pathologies. We have leveraged these core competencies in the design, development and commercialization of an increasing number of products for patients suffering from degenerative spinal conditions.
Issuances of Common Stock and Use of Proceeds
On May 13, 2014, we completed an initial public offering (IPO) of 8,825,000 shares of common stock at a price of $15 per share. The IPO generated net proceeds of $118,862, after deducting underwriting commissions of $9,266 and expenses of approximately $4,283. The underwriting commissions and offering costs were reflected as a reduction to the IPO proceeds received in additional paid-in capital.
Concurrent with the closing of the IPO, the outstanding shares of the Series A redeemable convertible preferred stock (Series A Preferred) and Series B redeemable convertible preferred stock (Series B Preferred) were converted on a 2.43-to-1 basis into 5,577,016 shares of common stock. Following the closing of the IPO, there were no shares of preferred stock outstanding.
Proceeds from the IPO were used to pay cumulative dividends of approximately $11,932 to holders of Series A Preferred and $6,615 to holders of Series B Preferred following the conversion of the preferred stock. In addition, we paid approximately $23,500 to repay all outstanding indebtedness under its line of credit and $40,495 to prepay all outstanding aggregate principal and accrued interest of notes to stockholders. In connection with the prepayment, we expensed $4,825 representing the acceleration of the issuance discounts on the notes to stockholders.
On June 10, 2014, the underwriters purchased an additional 1,000,000 shares of common stock offered by selling stockholders at a price of $15.00 per share before underwriting discounts. We did not receive any proceeds from the sale of these shares.
On February 2, 2015, we completed a second public offering of 6,044,990 shares of our common stock at a price of $18.75 per share. We sold 2,044,990 shares of common stock in the offering and selling stockholders sold 4,000,000 shares of common stock. We received net proceeds from the offering of approximately $35,400 after deducting the underwriting discount and offering expenses.
On February 12, 2015, the underwriters purchased an additional 906,748 shares of common stock offered by selling stockholders at a price of $18.75 per share before underwriting discounts. We did not receive any proceeds from shares of common stock sold by the selling stockholders.
On July 13, 2015, we completed an additional public offering of 4,500,000 shares of our common stock at a price of $22.60 per share. We sold 750,000 shares of common stock in the offering and selling stockholders sold 3,750,000 shares of common
stock. We received net proceeds from the offering of approximately $16,300 after deducting the underwriting discount and estimated offering costs. We did not receive any proceeds from shares of common stock sold by the selling stockholders.
On July 17, 2015, the underwriters purchased an additional 112,500 shares offered by us and 562,500 shares of common stock offered by the selling stockholders, at a price of $22.60 per share. We received net proceeds of approximately $2,400 after deducting underwriting discounts and estimated offering costs. We did not receive any proceeds from shares of common stock sold by the selling stockholders.
We expect to use proceeds of the primary portion of these offerings for working capital and general corporate purposes which is expected to include the expansion of our global distribution network and the purchase of inventory to support sales efforts. Use of proceeds may also include the acquisition of or investment in complementary products, technologies or businesses. The principal purposes of the offerings were to facilitate an orderly distribution of shares by the selling stockholders and to increase the public float of our shares.
Out-of-Period Adjustments
In 2015, we recorded out-of-period adjustments impacting stock-based compensation and net inventories of which a majority related to stock-based compensation. The out-of-period adjustment related to stock-based compensation was to correct an error in the recognition of stock-based compensation expense related to performance based stock options we granted primarily in 2010 and 2011. Previously, we had deferred such recognition since the market condition associated with the grants had not been met but we now believe that, consistent with accounting guidance, the expense recognition should have commenced as of the date of our IPO in May 2014. The net impact of the adjustments in 2015 was to increase our net loss before taxes and net loss attributable to K2M by approximately $1,862 resulting in an increase in net loss per share of $0.05. We have determined that the impact of the error on the originating periods was immaterial. Accordingly, a restatement of prior period amounts was not considered necessary.
Principles of Consolidation
The accompanying consolidated financial statements include our accounts and all of our wholly-owned subsidiaries. All intercompany balances and transactions have been eliminated in consolidation.
Reclassifications
In 2015, we have changed our presentation of goodwill and intangible assets on our consolidated balance sheets to present each separately. In prior periods these were presented and included in the line item goodwill and intangible assets, net.
Use of Estimates
The preparation of financial statements in conformity with generally accepted accounting principles in the United States (US GAAP) requires management to make estimates and assumptions that affect the reported amounts of assets and liabilities and the disclosure of contingent assets and liabilities at the date of the consolidated financial statements and the reported amounts of revenue and expenses during the reporting period. Actual results could differ from those estimates.
Net Loss per Share
Basic net loss per common share is determined by dividing the net loss allocable to common stockholders by the weighted average number of common shares outstanding during the periods presented, without consideration of common stock equivalents. Diluted loss per share is computed by dividing the net loss allocable to common stockholders by the weighted average number of shares of common stock and common stock equivalents outstanding for the period. The treasury stock method is used to determine the dilutive effect of our stock option grants and the if-converted method is used to determine the dilutive effect of Series A Preferred and Series B Preferred, until their conversion into common stock in May 2014. The weighted average shares used to calculate both basic and diluted loss per share are the same because common stock equivalents were excluded in the calculation of diluted loss per share because their effect would be anti-dilutive.
Foreign Currency Translation and Other Comprehensive Loss
Our results of operations and cash flows are subject to fluctuations due to changes in foreign currency exchange rates. Our reporting currency is the U.S. dollar, which is also the functional currency of our domestic entities, while the functional currency of our foreign subsidiaries are the British Pound, Euro and Swiss Franc. Assets and liabilities denominated in foreign currencies are translated at the rate of exchange on the balance sheet date. Revenues and expenses are translated using the average exchange rate for the period. Net gains and losses resulting from the translation of foreign financial statements are
recorded in other comprehensive income (loss). Net foreign currency gains or losses resulting from transactions in currencies other than the functional currencies are included in other expense, net on the consolidated statements of operations.
Cash and Cash Equivalents
We consider all highly liquid investments with a maturity of three months or less when purchased to be cash equivalents.
Restricted Cash
We classify cash as restricted when cash is unavailable for withdrawal or usage. Restrictions may include legally restricted deposits, contract bids or other contractual requirements, or our statements of intention with regard to particular deposits.
Accounts Receivable
Accounts receivable are reported in the consolidated balance sheets at outstanding amounts, less the allowance for doubtful accounts. We perform ongoing credit evaluations of certain customers and generally extends credit without requiring collateral. We periodically assesses the collectability of accounts receivable considering factors such as the specific evaluation of collectability, historical collection experience and economic conditions in individual markets and records an allowance for doubtful accounts for the estimated uncollectible amount as appropriate.
Inventory
Inventory consists primarily of finished goods and surgical instruments available for sale and is stated at the lower of cost or market using a weighted-average cost method. We review our inventory on a periodic basis for excess, obsolete, and impaired inventory and record a reserve for the identified items.
Property, Plant and Equipment
Property, plant and equipment are stated at cost net of accumulated depreciation and amortization. Upon retirement or sale, the cost of assets disposed of and the related accumulated depreciation are removed from the accounts, and any resulting gain or loss is credited or charged to the consolidated statements of operations. Repairs and maintenance costs are expensed as incurred.
Buildings under capital lease are recorded at the lower of the present value of the minimum lease payments under the lease agreement or the fair market value of the underlying assets under lease on the lease commencement date.
Depreciation and amortization of property, plant and equipment is recorded using the straight-line method over the estimated useful lives of the respective assets or the lease term for buildings under capital lease. Amortization of leasehold improvements is recorded over the shorter of the life of the improvement or the remaining term of the lease using the straight-line method.
Goodwill and Other Intangible Assets
Goodwill represents the excess of the consideration transferred over the estimated fair value of assets acquired and liabilities assumed in connection with the Merger. We have concluded that the Company operates with one reporting unit.
Goodwill is not amortized but evaluated annually or more frequently for impairment if impairment indicators exist. Such indicators include, but are not limited to (i) a significant adverse change in the business climate or environment, (ii) unanticipated competition, or (iii) adverse action or assessment by a regulator. Our annual impairment measurement date is November 1. We first assess qualitative factors before performing a quantitative assessment of the reporting unit. The qualitative assessment considers events and circumstances such as macroeconomic conditions, industry and market conditions, cost factors and overall financial performance, as well as company and specific reporting unit specifications. If after performing this assessment, we conclude that it is more likely than not that the fair value of a reporting unit is less than its carrying amount, then we are required to perform a quantitative test. Our evaluation of goodwill completed during the years ended December 31, 2015, 2014, and 2013 resulted in no impairment loss.
Our indefinite-lived intangible assets include trademarks and purchased in-process research and development (IPR&D) projects, which originated from the Merger and were measured at their respective estimated fair values as of the acquisition date.
We also used a qualitative assessment for our indefinite lived intangible asset impairment testing. Our evaluation of indefinite-lived intangible assets completed during the years ended December 31, 2015, 2014 and 2013 resulted in no impairment losses.
Definite-lived intangible assets include licensed technology, developed technology, and customer relationships are amortized over estimated useful lives, which range from four to seven years. Patents and other are amortized over estimated useful lives which range from two to seventeen years. We recorded no impairment loss during the years ended December 31, 2015, 2014 and 2013.
Other Assets
Other long-term assets consist mainly of surgical instruments used primarily in the domestic and direct international distribution channels to implant our products. Surgical instruments are stated at cost less accumulated amortization. We amortize these instruments to cost of revenues over their estimated useful life.
We provide surgical instruments to our customers for use to implant our products during a surgical procedure. Following completion of the procedure, the instruments are returned to us upon which we will sanitize the instrument and provide it to another customer.
Impairment of Long-Lived Assets
Long-lived assets, such as fixed assets and other definite lived intangible assets are reviewed for impairment whenever circumstances indicate that the carrying amount of the asset may not be recoverable. The carrying amount of a long-lived asset may not be recoverable if it exceeds the sum of undiscounted cash flows expected to be generated by the asset. If an asset is determined to be impaired, the loss is measured as the amount by which the carrying amount of the asset exceeds its estimated fair value. Considerable management judgment is necessary to estimate undiscounted future cash flows. Accordingly, actual results could differ from such estimates. No events have been identified that caused an evaluation of the recoverability of the long-lived assets.
Fair Value Measurements
Fair value is defined in the fair value measurement accounting guidance as the price that would be received to sell an asset or paid to transfer a liability in an orderly transaction between market participants at the measurement date, or exit price. Assets and liabilities subject to fair value measurements are required to be disclosed within a specified fair value hierarchy. The fair value hierarchy ranks the quality and reliability of inputs or assumptions used in the determination of fair value and requires assets and liabilities carried at fair value to be classified and disclosed in one of the following categories based on the lowest level input used that is significant to a particular fair value measurement:
Level 1 – Defined as observable inputs such as unadjusted quoted prices in active markets for identical assets.
Level 2 – Defined as observable inputs other than Level 1 prices, such as quoted prices for similar assets, quoted prices in markets that are not active, or other inputs that are observable or can be corroborated by observable market data for substantially the full term of the assets or liabilities.
Level 3 – Defined as unobservable inputs in which little or no market data exists, therefore requiring an entity to develop its own assumptions.
Our cash and cash equivalents are subject to fair value measurements. In accordance with the hierarchy, the inputs used in measuring the fair value of the cash equivalents are considered to be Level 1.
We apply the fair value measurement accounting guidance to non-financial assets upon the acquisition of businesses or in conjunction with the measurement of an impairment loss of a long-lived asset, goodwill or other intangible asset under the accounting guidance for impairments.
Financial Instruments and Concentration of Credit Risk
We consider the recorded costs of certain financial assets and liabilities, including cash and cash equivalents, accounts receivable, accounts payable and accrued expenses, to approximate their fair value because of relatively short maturities at December 31, 2015 and 2014. The fair values of the capital lease obligation and other long-term liabilities approximated their respective carrying amounts as of December 31, 2015 and 2014, based on rates and terms available to us at that time.
Financial instruments that potentially subject us to a concentration of credit risk consist principally of cash and cash equivalents and accounts receivable. We maintain our cash balances with credit worthy financial institutions in the United States, and the balances may exceed, at times, the amount insured by the Federal Deposit Insurance Corporation. No single customer represented more than 10% of revenue for any period presented.
Revenue Recognition
Revenue is recognized when all of the following criteria are met: persuasive evidence of an arrangement exists, delivery has occurred or service has been rendered, the price to the buyer is fixed or determinable, and collectability is reasonably assured.
Revenue in our direct markets is generated by making its products available to hospitals that purchase specific products for use in surgery on a case-by-case basis. Revenue from sales generated by use of products is recognized upon receipt of a delivered order confirming that our products have been used in a surgical procedure or following shipment and transfer of title to a hospital that purchases products in advance of a surgery.
International sales outside of our direct markets are transacted with independent distributors, who then resell the products to their hospital customers. We recognize revenue upon shipment of our products to the international distributors, who accept title at point of shipment.
Shipping and Handling Costs
Shipping and handling costs are charged to sales and marketing expense in the consolidated statements of operations and amounted to $4,199, $3,403 and $2,311 for the years ended December 31, 2015, 2014 and 2013, respectively.
Advertising Costs
Advertising costs are charged to sales and marketing expense as incurred in the consolidated statements of operations and amounted to $290, $269 and $224 for the years ended December 31, 2015, 2014 and 2013, respectively.
Research and Development
We expense our research and development as incurred.
Stock-Based Compensation
We award stock-based compensation primarily in the form of stock options, restricted stock and RSUs. For stock options awarded, stock-based compensation is based on the fair value of such awards granted to employees using a Black-Scholes-Merton option pricing model and is expensed on a straight-line basis over the awards' vesting period, less awards expected to be forfeited using estimated forfeiture rates.
For stock options awarded that include performance and market conditions, stock-based compensation is based on the fair value of such awards granted to employees using a Monte Carlo Simulation model and expensed beginning when the performance condition is met over the service period. No such options were awarded to employees subsequent to 2011.
For restricted stock and RSUs awarded, the stock-based compensation is based on the fair value using the closing market share price of our common stock on the date of award and is expensed on a straight-line basis over the awards vesting period.
We also recognize stock-based compensation for participation in our 2014 Employee Stock Purchase Plan (“ESPP”). The ESPP provides for a look-back option feature that gives an option to the participant to purchase our common stock at a discount to the market price for such stock. Our costs are recognized over the offering period based on the fair value of the option granted to participants as determined using a Black-Scholes-Merton option pricing model and the number of shares expected to be purchased at the end of the offering period.
Income Taxes
We account for income taxes using the liability method. Deferred tax assets and liabilities are recognized for the future tax consequences attributable to differences between the financial statement carrying amounts of existing assets and liabilities, their respective tax bases and operating loss and credit carryforwards. Deferred tax assets and liabilities are measured using enacted tax rates expected to apply to taxable income in the year in which those temporary differences are expected to be recovered or settled. The effect on deferred tax assets and liabilities of a change in tax rates is recognized in operations in the period that includes the enactment date.
Valuation allowances are established when necessary to reduce net deferred tax assets to the amount expected to be realized. Income tax expense (benefit) is the tax payable (receivable) for the period and the change during the period in deferred tax assets and liabilities.
As prescribed by the accounting guidance, we use a more-likely-than-not recognition threshold based on the technical merits of the tax position taken. Tax positions that meet the more-likely-than-not recognition threshold are measured at the largest
amount of the tax benefits, as determined on a cumulative probability basis, that are more-likely-than-not to be realized upon ultimate settlement in the financial statements. We recognize interest and penalties related to income tax matters in income tax expense (benefit).
Redeemable Convertible Preferred Stock
Through their conversion in May 2014, we used the effective interest method to accrete the differences between the carrying value and the estimated redemption value of our preferred stock, such that the carrying value approximated the redemption value on the earliest possible redemption date.
Loss Contingencies
Evaluation of loss contingencies require significant judgment to estimate the amount and timing of recording a potential loss accrual in our consolidated financial statements. Such contingencies include, but are not limited to, product liability, intellectual property, litigation, regulatory proceedings; and other legal matters that arise from time to time in the ordinary course of business.
We regularly assess uncertainty to determine the degree of probability and range of possible loss that will ultimately be resolved when one or more future events occur or fail to occur. We disclose information regarding each material claim where the likelihood of a loss contingency is probable, or reasonably possible and accrue for the loss when a reasonable estimate can be made. Based on such evaluation management believes that there are no claims or pending actions threatened against us, that are expected to have a material adverse effect on our financial position for the period ended December 31, 2015.
2. ACCOUNTS RECEIVABLE
The following table summarizes the accounts receivables, net of allowances:
|
| | | | | | | | |
| | | December 31, |
| | | 2015 | | 2014 |
| Accounts receivable | | $ | 41,210 |
| | $ | 36,431 |
|
| Allowances | | (2,437 | ) | | (2,494 | ) |
| Accounts receivable, net | | $ | 38,773 |
| | $ | 33,937 |
|
The following table summarizes a rollforward of the accounts receivable allowances for the years ended December 31, 2015, 2014 and 2013:
|
| | | | | | | | | | | | |
| | | December 31, |
| | | 2015 | | 2014 | | 2013 |
| Beginning | | $ | (2,494 | ) | | $ | (2,447 | ) | | $ | (2,217 | ) |
| Additions | | (235 | ) | | (436 | ) | | (230 | ) |
| Write-offs | | 292 |
| | 389 |
| | — |
|
| Ending | | $ | (2,437 | ) | | $ | (2,494 | ) | | $ | (2,447 | ) |
3. INVENTORY
The following table summarizes inventory, net of allowances:
|
| | | | | | | | |
| | | December 31, |
| | | 2015 | | 2014 |
| Finished goods | | $ | 90,226 |
| | $ | 78,331 |
|
| Inventory allowances | | (28,224 | ) | | (25,714 | ) |
| Inventory, net | | $ | 62,002 |
| | $ | 52,617 |
|
Inventory includes surgical instruments available for sale with a carrying value of $8,946 and $8,491 at December 31, 2015 and 2014, respectively.
4. PREPAID EXPENSES AND OTHER CURRENT ASSETS
The following table summarizes prepaid expenses and other current assets:
|
| | | | | | | | |
| | | December 31, |
| | | 2015 | | 2014 |
| Restricted cash | | $ | 6,669 |
| | $ | — |
|
| Landlord incentives for leasehold improvements | | 6,454 |
| | — |
|
| Prepaid expenses | | 2,408 |
| | 2,385 |
|
| Other | | 4,289 |
| | 1,526 |
|
| Total | | $ | 19,820 |
| | $ | 3,911 |
|
As of December 31, 2015, restricted cash includes $6,669 designated for tenant improvements related to the new headquarters and operations facilities. We expect to use these funds for the tenant improvements in the first half of 2016. As of December 31, 2014, this restricted cash balance was included in other assets, net on the consolidated balance sheets.
Landlord incentives for leasehold improvements represents remaining incentives the Landlord of our new headquarters and operations facilities must provide under the capital lease agreement, which commenced in October 2015. It is expected that these incentives will be received in the first quarter of 2016 as the actual improvements are incurred.
5. PROPERTY, PLANT AND EQUIPMENT
The following table summarizes property, plant and equipment:
|
| | | | | | | | | |
| | Estimated | | December 31, |
| | Useful Lives | | 2015 | | 2014 |
| Buildings under capital lease | 16 years | | $ | 26,469 |
| | $ | — |
|
Leasehold improvements, including property under capital lease | Various | | 9,717 |
| | 1,109 |
|
| Equipment | 3 years | | 3,054 |
| | 2,725 |
|
| Software | 3 years | | 4,231 |
| | 3,923 |
|
| Computer equipment | 3 years | | 1,493 |
| | 1,445 |
|
| Furniture and office equipment | 5 years | | 1,050 |
| | 1,048 |
|
| Vehicles and other | Various | | 795 |
| | 458 |
|
| Total | | | 46,809 |
| | 10,708 |
|
| Less accumulated depreciation and amortization | | | (8,491 | ) | | (6,488 | ) |
| Property, plant and equipment, net | | | $ | 38,318 |
| | $ | 4,220 |
|
Depreciation and amortization expense was $2,297, $1,626 and $1,505 for the years ended December 31, 2015, 2014 and 2013, respectively, and included $346 of amortization expense for buildings under capital lease for the year ended December 31, 2015.
As of December 31, 2015 and 2014, we had leasehold improvements of approximately $8,242 and $136, respectively for our new headquarters and operations facilities that are under construction and will not commence depreciation and amortization until they are placed in service.
6. INTANGIBLE ASSETS
The following table summarizes intangible assets:
|
| | | | | | | | | | | | | | |
| | | As of December 31, 2015 |
| | | Estimated Useful Lives | | Gross | | Accumulated Amortization | | Net |
| Indefinite-lived intangible assets: | | | | | | | | |
| Trademarks | | — | | $ | 12,900 |
| | $ | — |
| | $ | 12,900 |
|
In-process research and development (1) | | — | | 900 |
| | — |
| | 900 |
|
| Other | | — | | 266 |
| | — |
| | 266 |
|
| Subtotal | | | | 14,066 |
| | — |
| | 14,066 |
|
| Subject to amortization | | | | | | | | |
Developed technology (1) | | 4 - 6 years | | 62,000 |
| | (52,243 | ) | | 9,757 |
|
| Licensed technology | | 4 - 6 years | | 52,600 |
| | (52,325 | ) | | 275 |
|
| Customer relationships | | 4 - 7 years | | 29,700 |
| | (22,805 | ) | | 6,895 |
|
| Patents and other | | 2 - 17 years | | 3,245 |
| | (1,115 | ) | | 2,130 |
|
| Subtotal | | | | 147,545 |
| | (128,488 | ) | | 19,057 |
|
| Total | | | | $ | 161,611 |
| | $ | (128,488 | ) | | $ | 33,123 |
|
|
| | | | | | | | | | | | | | |
| | | As of December 31, 2014 |
| | | Estimated Useful Lives | | Gross | | Accumulated Amortization | | Net |
| Indefinite-lived intangible assets: | | | | | | | | |
| Trademarks | | — | | $ | 12,900 |
| | $ | — |
| | $ | 12,900 |
|
In-process research and development (1) | | — | | 900 |
| | — |
| | 900 |
|
| Other | | — | | 278 |
| | — |
| | 278 |
|
| Subtotal | | | | 14,078 |
| | — |
| | 14,078 |
|
| Subject to amortization | | | | | | | | |
Developed technology (1) | | 4 - 6 years | | 62,000 |
| | (46,460 | ) | | 15,540 |
|
| Licensed technology | | 4 - 6 years | | 52,600 |
| | (52,175 | ) | | 425 |
|
| Customer relationships | | 4 - 7 years | | 29,700 |
| | (18,563 | ) | | 11,137 |
|
| Patents and other | | 2 - 17 years | | 1,414 |
| | (985 | ) | | 429 |
|
| Subtotal | | | | 145,714 |
| | (118,183 | ) | | 27,531 |
|
| Total | | | | $ | 159,792 |
| | $ | (118,183 | ) | | $ | 41,609 |
|
| |
| (1) | In 2015 and 2014, a total of $0 and $400 of IPRD, respectively, was reclassified to developed technology as the underlying products were introduced to market during 2014. The assets will be amortized over a six-year period. In 2015 and 2014, we expensed a total of $0 and $200 for an IPR&D project that will no longer be pursued. |
Amortization expense was $10,305, $22,946 and $30,195 for the years ended December 31, 2015, 2014 and 2013, respectively.
As of December 31, 2015, the expected amortization expense for each of the next five years and thereafter is as follows:
|
| | | | |
| 2016 | | $ | 10,369 |
|
| 2017 | | 6,755 |
|
| 2018 | | 260 |
|
| 2019 | | 256 |
|
| 2020 | | 230 |
|
| Thereafter | | 1,187 |
|
| Total | | $ | 19,057 |
|
7. OTHER ASSETS
The following table summarizes other assets:
|
| | | | | | | | |
| | | December 31, |
| | | 2015 | | 2014 |
| Surgical instruments, net | | $ | 23,945 |
| | $ | 21,392 |
|
| Restricted cash | | 1,298 |
| | 8,114 |
|
Other | | 773 |
| | 166 |
|
| Total | | $ | 26,016 |
| | $ | 29,672 |
|
Surgical instruments are stated net of accumulated amortization and allowances of $26,609 and $18,610 at December 31, 2015 and 2014, respectively. Amortization expense was $9,015, $6,494 and $2,814 for the years ended December 31, 2015, 2014 and 2013, respectively.
As of December 31, 2014, restricted cash includes amounts placed in escrow for leasehold improvement costs of $6,667 for our new headquarters and operations facilities. These amounts were reclassified to prepaid expenses and other current assets in 2015 as it is expected such improvements will be incurred in the first half of 2016. Restricted cash also includes deposits made on pending bids or contracts with customers of $1,298 and $1,447 as of December 31, 2015 and 2014, respectively.
8. ACCRUED EXPENSES
The following table summarizes accrued expenses:
|
| | | | | | | | |
| | | December 31, |
| | | 2015 | | 2014 |
| Accrued commissions | | $ | 5,336 |
| | $ | 4,942 |
|
| Accrued royalties | | 2,704 |
| | 2,464 |
|
| Other | | 5,519 |
| | 2,671 |
|
| Total | | $ | 13,559 |
| | $ | 10,077 |
|
9. DEBT
Bank Line of Credit
We maintain a senior secured credit facilities credit agreement (as amended from time to time) with Silicon Valley Bank and Comerica Bank as Lenders, which is secured primarily by the assets of our operating subsidiaries in the United States and United Kingdom.
The credit facility, as amended, consists of a revolving credit facility of $55,000 with a sub-facility for letters of credit in the aggregate availability amount of $10,000 and a swingline sub-facility in the aggregate availability amount of $5,000. The maturity date of the credit agreement is October 29, 2017. As of December 31, 2015 and 2014, we had no outstanding borrowings on the revolving credit facility. As of December 31, 2015, we had approximately $44,270 of unused borrowing capacity and we had approximately $6,100 related to two issued but undrawn letters of credit, with one letter of credit representing a $6,000 security deposit on the new headquarters and operations facilities lease.
Alternate Base Rate ("ABR") loans under the revolving credit facility bear interest at a rate per annum equal to ABR, plus 0.75%. LIBOR loans under the revolving credit facility bear interest at a rate per annum equal to the greater of (i) LIBOR, plus 3.00%. The total obligations under the amended credit facility cannot exceed the lesser of (i) the total revolving commitment of $55,000 or (ii) the borrowing base, which is calculated as (x) 85% of accounts receivable so long as certain of those accounts receivable do not exceed, in the aggregate, 50% of the borrowing base plus (y) 50% of the value of the eligible inventory provided that the contribution of the value of the eligible inventory not exceed the lesser of 40% of the borrowing base or $15,000 plus (z) up to $7,500 to the extent the Borrower and its subsidiaries maintain at least $12,500 on deposit with a lender or an affiliate of a lender. Borrowings under the revolving credit facility remain secured by a first priority lien on substantially all of the Borrower’s personal property assets, including intellectual property.
The revolving credit facility contains various financial covenants and negative covenants with which the Company must maintain compliance, including a consolidated adjusted quick ratio for K2M, Inc., K2M UK Limited and select subsidiaries not less than 1.20:1.00 as of the last day of any month, restrictive covenants which limit the Company’s ability to pay dividends on
common stock and make certain investments, and the provision of certain financial reporting and company information as required. We were in compliance with all the financial and other covenants of the credit facility at December 31, 2015.
For the years ended December 31, 2015, 2014 and 2013, we recorded interest expense of $22, $373 and $1,383, respectively, under the credit agreement and amounts of $318, $338 and $383, respectively, related to the amortization of the loan issuance fees.
Notes to Stockholders
Between June 2012 and January 2014, we issued shares of our common stock and our subsidiary, K2M Holdings, Inc., issued notes to certain stockholders with an aggregate principal of $39,212.
Prior to our IPO in May 2014, the aggregate principal and carrying value of these notes was $39,212 and $34,387 respectively. We prepaid the notes along with accrued interest of $1,283 in May 2014 using proceeds from the IPO and expensed $4,825 representing the acceleration of the issuance discounts on the notes. Interest expense for the years ended December 31, 2014 and 2013, was $1,324 and $1,410, respectively, and excluded amortization expense of $4,928 and $98, respectively.
Capital Lease
On December 11, 2014, we entered into a Deed of Lease (the “Lease Agreement”) with TC Oaklawn Owner, LLC (the “Landlord”) with respect to our new corporate headquarters and operations facilities to be located in two adjacent buildings in Leesburg, Virginia (the “Buildings”). We have agreed to, among other items, lease the entire rentable space of the Buildings, for an initial term of 186 calendar months beginning on March 15, 2016, (the lease term), which is approximately five months following when we gained access and control of the Buildings to commence the construction of our leasehold improvements referred to as the lease commencement date.
Under the terms of the Lease Agreement, from the lease commencement date, we will (subject to an initial abatement described below) pay to the Landlord an annual base rent of approximately $3,201, which will increase by 2.50% per year (without regard to the initial abatement) commencing upon the first anniversary of the commencement of the lease term. The Landlord will abate the first six months of the base rent after the commencement of the lease term. We will bear the cost for real estate taxes, utilities, maintenance, repairs and insurance. We will begin to pay rent to the landlord beginning in September 2016.
On October 15, 2015, we gained access and control of the Buildings to commence the construction of our leasehold improvements. Under the accounting guidance, we are required to account for the lease as a capital lease. The related capital lease obligation will be amortized over 191 calendar months beginning in October 2015 under the effective interest method.
The Landlord will provide a tenant improvement allowance to us for the construction of leasehold improvements. We are required to fund all actual costs of leasehold improvements in excess of Landlord’s tenant improvement allowance and currently expect to spend at least $9,500 on such excess, of which $6,667 of this was placed in an escrow account and reflected on the accompanying balance sheet in prepaid expenses and other current assets as of December 31, 2015 (See Note 4). We provided a security deposit in the form of an uncollaterized letter of a credit in the amount of $6,000, which letter of credit may be reduced from time to time upon the satisfaction of certain conditions as set forth in the Lease Agreement (See Note 7).
For the year ended December 31, 2015, we incurred interest expenses of $487 on the capital lease obligation for the period ended October 15, 2015 to December 31, 2015.
On March 13, 2015 we received $790 of cash grant incentives from several government originators, which were included in cash and cash equivalents. There are no restrictions on the use of the cash proceeds. Pursuant to the grant agreements, we or the Landlord are required to make certain investments in the Buildings and we are required to increase our workforce in Leesburg, Virginia by 96 full-time employees no later than by December 31, 2017. As a result of these commitments, we have recorded a long-term liability within other liabilities on the accompanying balance sheet of $790 at December 31, 2015 until such conditions are met.
Operating Leases
As of December 31, 2015, we lease office space for our current corporate headquarters under an operating lease agreement that expires in September 2016. This lease is cancelable after February 2016 with 30 days notice. The lease provides for an option to renew for a five year period. Monthly rent expense under the lease is approximately $132. We also lease space for our machine shop in Pennsylvania and seven other offices located in the United States, United Kingdom, Italy and Germany.
The following table summarizes our future minimum lease payments under the non-cancelable operating lease and capital lease agreements, including payments for costs directly associated with the facility leases:
|
| | | | | | | | |
| | | Capital Leases | | Operating Leases |
| Year ending December 31: | | | | |
| 2016 | | $ | 1,069 |
| | $ | 947 |
|
| 2017 | | 3,275 |
| | 132 |
|
| 2018 | | 3,357 |
| | 22 |
|
| 2019 | | 3,441 |
| | — |
|
| 2020 | | 3,527 |
| | — |
|
| Thereafter | | 43,770 |
| | — |
|
| Total minimum lease payments | | 58,439 |
| | $ | 1,101 |
|
| Less: interest | | (24,015 | ) | | |
| Capital lease obligations | | 34,424 |
| | |
| Less current portion | | (284 | ) | | |
| Long-term capital lease obligations | | $ | 34,140 |
| | |
10. PREFERRED STOCK
Preferred Stock
As of December 31, 2015 and 2014, we had 100,000,000 authorized shares of preferred stock of which no shares were issued or outstanding.
Redeemable Convertible Preferred Stock
On May 13, 2014, we converted all outstanding shares of Series A Preferred and Series B Preferred into 2,983,902 and 2,593,114 shares, respectively, of our common stock based concurrent with the IPO. In addition, we paid cumulative cash dividends of $18,547 to holders of the preferred stock.
The following is a rollforward of activity in the Series A Preferred and Series B Preferred accounts through their conversion to our common stock.
|
| | | | | | | | | | | | | | | | | | | | |
| | | Series A Preferred | | Series B Preferred |
| | | Shares | | | | Shares | | |
| | | Authorized | | Outstanding | | Amount | | Authorized | | Outstanding | | Amount |
| Balance at December 31, 2012 | | 7,300,000 |
| | 7,250,885 |
| | $ | 50,525 |
| | 5,249,000 |
| | 3,263,368 |
| | $ | 27,543 |
|
| Issuance of preferred stock | | — |
| | — |
| | — |
| | 1,251,000 |
| | 3,037,922 |
| | 11,574 |
|
| Accretion of preferred stock to fair value | | — |
| | — |
| | 6,142 |
| | — |
| | — |
| | 13,297 |
|
| Balance at December 31, 2013 | | 7,300,000 |
| | 7,250,885 |
| | 56,667 |
| | 6,500,000 |
| | 6,301,290 |
| | 52,414 |
|
| Payment of dividend | | — |
| | | | (11,932 | ) | | | | | | (6,615 | ) |
| Accretion of preferred stock to fair value | | — |
| | — |
| | 1,195 |
| | — |
| | — |
| | (15 | ) |
| Adjustment of preferred stock to fair value prior to conversion | | — |
| | — |
| | (1,170 | ) | | — |
| | — |
| | (6,889 | ) |
| Conversion to common stock | | (7,300,000 | ) | | (7,250,885 | ) | | (44,760 | ) | | (6,500,000 | ) | | (6,301,290 | ) | | (38,895 | ) |
| Balance at December 31, 2014 | | — |
| | — |
| | $ | — |
| | — |
| | — |
| | $ | — |
|
11. STOCK-BASED COMPENSATION
We have four stock-based compensation plans: The 2014 Employee Omnibus Incentive Plan (the “Omnibus Incentive Plan”), the 2010 Equity Award Plan and the 2010 Independent Agent Plan, collectively, “the Equity Incentive Plans” and the ESPP. The purpose of the Equity Incentive Plans is to provide incentives to employees, directors, agents and our advisors. The Equity Incentive Plans are administered by the compensation committee of our board of directors or its delegates. The number, type of equity incentive, exercise or share purchase price and vesting terms are determined in accordance with the respective plan, as applicable. Depending on the particular plan, incentive or other awards may take the form of incentive or non-qualified stock options, stock appreciation rights, shares of restricted stock, RSUs or other stock-based awards, subject to certain limitations. Under the Omnibus Incentive Plan, the committee may also designate any award as a “performance compensation award” intended to qualify as “performance-based compensation” under Section 162(m) of the Internal Revenue Code. As of December 31, 2015, there was a total of 676,260 shares of common stock available for future grants under the plans.
The ESPP was established to provide employees and participating affiliates with an opportunity to purchase our common stock. The ESPP is intended to qualify as an “employee stock purchase plan” under Section 423 of the Internal Revenue Code. As of December 31, 2015 and 2014, 333,753 and 384,339 shares were available for issuance under the ESPP.
Generally, all domestic employees are eligible to participate in the ESPP if they are employed by us or any participating affiliate, for at least 20 hours per week. Participants are permitted to purchase our shares of common stock through payroll deductions of no less than 1% and no more than 10% of their eligible compensation. Amounts deducted and accumulated by the participant are used to purchase shares of our common stock at the end of each offering period. The purchase price of the shares will be equal to 85% of the lower of the fair value of our common stock on the first day of the offering period, or on the common stock purchase date at the end of each offering period. Participants may end their participation at any time during an offering period and will be paid their accrued contributions that have not yet been used to purchase shares of common stock. In addition, participation ends automatically upon termination of employment.
We recognized approximately $299 and $80 of stock-based compensation expense on the ESPP for the year ended December 31, 2015 and 2014, respectively. We issued 50,586 and 27,184 shares of common stock to ESPP participants for proceeds of $871 and $346 during the year ended December 31, 2015 and 2014, respectively.
The following table summarizes the stock-based compensation expense by financial statement line item, employees and non-employees and type of award:
|
| | | | | | | | | | | | |
| | | Year Ended
December 31, |
| | | 2015 | | 2014 | | 2013 (1) |
| Cost of revenue | | $ | 705 |
| | $ | 424 |
| | $ | 532 |
|
| Research and development | | 844 |
| | 439 |
| | 92 |
|
| Sales and marketing | | 4,045 |
| | 2,146 |
| | 889 |
|
| General and administrative | | 5,594 |
| | 2,798 |
| | 1,366 |
|
| | | $ | 11,188 |
| | $ | 5,807 |
| | $ | 2,879 |
|
| | | | | | | |
| Employees | | $ | 10,904 |
| | $ | 5,537 |
| | $ | 2,664 |
|
| Non-employees | | 284 |
| | 270 |
| | 215 |
|
| Total | | $ | 11,188 |
| | $ | 5,807 |
| | $ | 2,879 |
|
| |
| (1) | Stock-based compensation expense included $1,291 related to stock option liability awards for the year ended December 31, 2013. |
|
| | | | | | | | | | | | |
| | | Year Ended
December 31, |
| | | 2015 | | 2014 | | 2013 |
| Stock options | | $ | 5,116 |
| | $ | 2,107 |
| | $ | 2,879 |
|
| Restricted stock and restricted stock units | | 5,773 |
| | 3,620 |
| | — |
|
| ESPP | | 299 |
| | 80 |
| | — |
|
| Total | | $ | 11,188 |
| | $ | 5,807 |
| | $ | 2,879 |
|
The following table summarizes stock option plans activity: |
| | | | | | | | | | | | | |
| | | Shares | | Weighted- Average Exercise Price | | Weighted- Average Remaining Contractual Term (years) | | Aggregate Intrinsic Value (1) |
| Outstanding at December 31, 2014 | | 4,277,229 |
| | 9.55 |
| | 5.83 | | $ | 48,418 |
|
| Granted | | 412,826 |
| | 22.70 |
| |
| |
|
| Exercised | | (903,859 | ) | | 7.25 |
| |
| |
|
| Expired | | (12,403 | ) | | 5.57 |
| |
| |
|
| Forfeited | | (91,774 | ) | | 13.17 |
| |
| |
|
Outstanding at December 31, 2015(2) | | 3,682,019 |
| | $ | 11.51 |
| | 5.98 | | $ | 31,586 |
|
| Vested or expected to vest: | | | | | | | | |
At December 31, 2015(3) | | 3,396,424 |
| | 11.59 |
| | 5.99 | | $ | 28,897 |
|
| Vested: | | | | | | | | |
| At December 31, 2015 | | 1,753,401 |
| | $ | 9.43 |
| | 4.85 | | $ | 18,075 |
|
| |
| (1) | Calculated using the fair market value per share of our common stock as of December 31, 2015 and 2014 of $19.74 and $20.87, respectively. |
| |
| (2) | The total includes 994,768 and 993,832 performance-based options at December 31, 2015 and 2014, respectively. |
| |
| (3) | Outstanding options, net of forfeiture rate. |
The total fair value of employee stock options that vested was approximately $1,791, $1,386 and $2,034 during the years ended December 31, 2015, 2014 and 2013, respectively.
The weighted-average fair value per share of options granted by us was $8.73, $5.54 and $4.53 during the years ended December 31, 2015, 2014 and 2013, respectively. The fair value was determined by applying the Black-Scholes-Merton option pricing model, utilizing the following weighted-average assumptions:
|
| | | | | | | | | |
| | | Year Ended
December 31, |
| | | 2015 | | 2014 | | 2013 |
| Expected dividend yield | | — | % | | — | % | | — | % |
| Expected volatility | | 36.31-41.33% |
| | 35.19-37.47% |
| | 35.42-40.00% |
|
| Risk-free interest rate | | 1.42-2.18% |
| | 1.79-2.18% |
| | 1.25-2.00% |
|
| Expected average life of options | | 7 years |
| | 6-7 years |
| | 7 years |
|
A discussion of management’s methodology for developing each of the assumptions used in the valuation model follows:
| |
| • | Dividend Yield – We have never declared or paid dividends and has no plans to do so in the foreseeable future. |
| |
| • | Risk-Free Interest Rate – This is the U.S. Treasury rate for the week of each option grant during the year that has a term that most closely resembles the expected life of the option. |
| |
| • | Expected Life of the Option Term – This is the period of time that the options granted are expected to remain unexercised. For options granted during the years ended December 31, 2015, 2014 and 2013, we derived the expected life of the option based on the average midpoint between vesting and the contractual term, as we have little exercise history. |
| |
| • | Expected Volatility – Volatility is a measure of the amount by which a financial variable such as a share price has fluctuated (historical volatility) or is expected to fluctuate (expected volatility) during a period. We use an estimated volatility based on the volatility of a number of similarly situated public companies, along with other factors deemed relevant by management. |
As of December 31, 2015 and 2014, there was approximately $5,030 and $4,253, respectively of total unrecognized compensation expense less estimated forfeitures, related to nonvested employee stock options under our stock-based compensation plans. As of December 31, 2015 and 2014, this expense is expected to be recognized over a weighted-average period of 1.92 and 2.08 years, respectively. The expected forfeiture rate is the estimated percentage of options granted that is expected to be forfeited or canceled on an annual basis before becoming fully vested. We estimate the forfeiture rate based on
past turnover data, with further consideration given to the class of employees to whom the options were granted. The forfeiture rate used during each of the years ended December 31, 2015, 2014 and 2013, was 3.1%.
Stock options granted by us subsequent to the Merger through 2011 have generally been granted with two vesting components, fifty-percent of the option is subject to a four-year time-based schedule, and 50% of the option is subject to performance and market-based criteria, "the PB options", which also includes the requirement that the four-year time-based vesting must be satisfied. The performance-based vesting criteria is based on our performance at the Performance Target Measurement Event (a deemed liquidation, IPO or sale of the Company), as measured by the internal rate of return performance criteria (“IRR”) on that date as defined in the Non-Qualified Stock Option Award Agreement under the 2010 Equity Award Plan. The Performance Target Measurement Event must occur prior to the contractual term of the options in order for the options to become exercisable.
In 2015, stock-based compensation expense included previously unrecognized compensation expense related to the PB options that had been subject to a performance target measurement event, which was met as of the date of our IPO. See "Out of Period Adjustments" in Note 1. Although the measurement event has occurred for purposes of accounting expense recognition, such options are not yet exercisable until WCAS achieves the internal rate of return performance criteria defined in the underlying Non-Qualified Stock Option Award Agreement under the 2010 Equity Award Plan.
Although the 2014 IPO was a Performance Target Measurement Event, the necessary IRR had not been achieved as of December 31, 2015 because WCAS continued to hold a significant equity position. As a result, the PB options are not yet exercisable. If an employee terminates prior to the achievement of the IRR and has not satisfied the time-based vesting criteria (same as the vesting criteria associated with the time-based portion of the options) of the PB option, the employee does not retain the right to participate in any vesting related to the performance-based portion of the options. Employees who terminate and have satisfied any portion of the time-based vesting criteria of the performance-based portion of their options may continue to participate in vesting of the performance-based portion of their options for which the time-based criteria has been satisfied, up and until the contractual expiration date of the options. All stock options granted to employees subsequent to 2011 solely vest based on a time-based vesting schedule and do not contain any performance-based vesting criteria.
The intrinsic value of options exercised during the years ended December 31, 2015, 2014 and 2013 approximated $11,643, $5,191 and $2,372, respectively.
Restricted Stock and Restricted Stock Units
In April 2014, our board of directors modified the vesting terms of the 576,132 RSUs issued to certain members of senior management in May 2013 to add time-vesting criteria. The modified vesting terms provides that the RSUs will vest in two equal installments on May 21, 2015 and 2016, subject to continued employment through the applicable vesting dates. In addition, the RSUs will continue to vest on an accelerated basis upon death, disability or a change in control. We expect to recognize stock-based compensation expense of approximately $15.94 per share or $9,185 over the vesting period. We recognized stock-based compensation expense of $4,503 and $3,004 for the years ended December 31, 2015 and 2014 related to these awards.
In May 2014, our board of directors approved issuances of 188,891 RSUs to certain of our officers. The RSUs will vest in three equal installments on the first, second and third anniversary of the grant date. We expect to recognize stock-based compensation expense of approximately $15.14 per share or $2,861 over the vesting period. Stock-based compensation expense recognized related to these awards was $957 and $616 for the year ended December 31, 2015 and 2014, respectively.
Effective July 1, 2015, our board of directors approved issuances of 79,940 shares of restricted stock to certain of our officers. The shares of restricted stock will vest in three equal installments on the first, second and third anniversary of the grant date. We expect to recognize stock-based compensation expense of approximately $23.46 per share or $1,875 over the vesting period. Stock-based compensation expense recognized related to these awards was $313 for the year ended December 31, 2015.
A summary of restricted stock and RSU activity during the year ended December 31, 2015 is as follows:
|
| | | | | | |
| | | RSUs | | Shares of Restricted Stock |
| Outstanding at December 31, 2014 | | 765,023 |
| | — |
|
| Granted | | — |
| | 79,940 |
|
Vested (1) | | (351,022 | ) | | — |
|
| Outstanding at December 31, 2015 | | 414,001 |
| | 79,940 |
|
(1) Represents RSUs which vested in 2015. These units were net settled, which resulted in the forfeiture of 155,494 units in lieu of withholding taxes for the year ended December 31, 2015, which are included in this total.
12. DEFINED CONTRIBUTION PLAN
We have a 401(k) plan which is a defined contribution plan (the “Contribution Plan”) covering substantially all employees meeting certain eligibility requirements. Participants may elect to contribute a specified portion of their compensation to the Contribution Plan on a tax-deferred basis. We make non-discretionary matches based on the participant's contribution using a predetermined basis as defined in the Contribution Plan. Additionally, we may also elect to make discretionary contributions. We made contributions to the Contribution Plan of $1,677, $1,458 and $1,096 for the years ended December 31, 2015, 2014 and 2013, respectively, all of which were non-discretionary.
13. COMMITMENTS AND CONTINGENCIES
In the normal course of business, we enter into agreements to obtain the rights to certain intellectual property. These agreements may require an up-front payment, milestone payments and/or royalties. Typically, we have certain rights to cancel these agreements, with notice, without additional payments due other than the amount due at the time of cancellation. As of December 31, 2015, the aggregate amount of these future payments, assuming achievement of applicable milestones and non-cancellation, was $1,485 over a period of not less than five years. Royalties ranging from 2% to 10% of net sales may be due on the sales of related products. Some of the agreements contain minimum annual royalty amounts.
In November 2011, we entered into an agreement to purchase certain proprietary technology which could require us to make additional aggregate payments of up to $13,350 should certain milestones be met, including those related to regulatory applications and approvals. Cumulative payments under the agreement totaled $100 through December 31, 2015. A milestone payment of $1,300 will be paid in January 2016. In addition, milestone payments of $500, $2,000 and $4,000 are due upon the achievement of net sales of related products of $10,000, $25,000 and $50,000, respectively. A royalty payment of 7% of net sales of related products may be due until such sales reaches $20,000. The product related to this agreement has not yet been commercialized.
The medical device industry is characterized by frequent claims and litigation, including claims regarding patent and other intellectual property rights as well as improper hiring practices. We are not aware of any pending or threatened legal proceeding against us that we expect would have a material adverse effect on our business, operating results or financial condition. However, we are a party in multiple legal actions involving claimants seeking various remedies, including monetary damages, and none of the outcomes are certain or entirely within our control.
14. RELATED PARTIES
In connection with the Merger, we and our subsidiary K2M Inc. entered into a management agreement with our major stockholder, which was terminated in May 2014 following our IPO. We incurred general and administrative expenses of $372 and $775 for the years ended December 31, 2014 and 2013, respectively.
15. INCOME TAXES
The following table summarizes the loss before income tax expense (benefit):
|
| | | | | | | | | | | | |
| | | Year Ended
December 31, |
| | | 2015 | | 2014 | | 2013 |
| United States | | $ | (28,830 | ) | | $ | (45,392 | ) | | $ | (37,884 | ) |
| Foreign | | (10,194 | ) | | (14,359 | ) | | (8,370 | ) |
| Total | | $ | (39,024 | ) | | $ | (59,751 | ) | | $ | (46,254 | ) |
The income taxes expense (benefit) is as follows:
|
| | | | | | | | | | | | |
| | | Year Ended
December 31, |
| | | 2015 | | 2014 | | 2013 |
| Current: | | | | | | |
| Federal | | $ | — |
| | $ | — |
| | $ | — |
|
| State | | 166 |
| | 105 |
| | 80 |
|
| Foreign | | 26 |
| | — |
| | 71 |
|
| Deferred: | | | | | | |
| Federal | | (10,179 | ) | | (16,636 | ) | | (12,590 | ) |
| State | | (963 | ) | | (975 | ) | | (1,969 | ) |
| Foreign | | (536 | ) | | (3,042 | ) | | (1,681 | ) |
| Change in valuation allowance | | 11,678 |
| | 20,434 |
| | 7,748 |
|
| Income taxes expense (benefit) | | $ | 192 |
| | $ | (114 | ) | | $ | (8,341 | ) |
The following table summarizes net deferred liability which consists of the following:
|
| | | | | | | | |
| | | December 31, |
| | | 2015 | | 2014 |
| Net operating loss (NOL) carryforwards | | $ | 32,104 |
| | $ | 24,697 |
|
| Capital lease obligations | | 12,991 |
| | — |
|
| Research and development and alternative minimum tax (AMT) credit carryforward | | 2,450 |
| | 1,907 |
|
| Inventory | | 6,570 |
| | 6,703 |
|
| Stock-based compensation | | 5,117 |
| | 4,456 |
|
| Intellectual property agreements | | 3,198 |
| | 3,227 |
|
| Other deferred temporary differences | | 2,988 |
| | 3,717 |
|
| Capital lease assets | | (12,677 | ) | | — |
|
| Intangible assets | | (11,153 | ) | | (14,797 | ) |
| Valuation allowance | | (46,630 | ) | | (34,952 | ) |
| Net deferred tax liability | | $ | (5,042 | ) | | $ | (5,042 | ) |
Approximately $7,343 of the NOL carryforward of $32,104 for the year ended December 31, 2015, is related to operations outside the United States and does not expire. The remaining NOL starts to expire in 2019. Tax credit carryforwards of $2,450 begin to expire in 2027. Under Section 382 of the Internal Revenue Code of 1986, as amended (the “IRC”), certain significant changes in ownership may restrict the future utilization of our tax loss carry forwards and tax credit carry forwards.
The following table summarizes a reconciliation of the U.S. statutory federal income tax rate to our effective tax rate, as a percentage of loss before income tax (expense) benefit for the years ended December 31, 2015, 2014 and 2013:
|
| | | | | | | | | |
| | | Year Ended
December 31, |
| | | 2015 | | 2014 | | 2013 |
| Federal tax at statutory rates | | 34.0 | % | | 34.0 | % | | 34.0 | % |
| State taxes, net of federal benefit | | 1.9 |
| | 2.3 |
| | 2.3 |
|
| Tax credits | | 1.2 |
| | 0.6 |
| | 0.5 |
|
| Permanent difference | | (0.9 | ) | | 1.7 |
| | 0.1 |
|
| Foreign income taxes | | (2.2 | ) | | (2.0 | ) | | (1.8 | ) |
| Change in valuation allowance | | (29.9 | ) | | (34.2 | ) | | (16.8 | ) |
| Tax rate adjustment and other | | (4.5 | ) | | (2.2 | ) | | (0.3 | ) |
| Income tax (expense) benefit | | (0.5 | )% | | 0.2 | % | | 18.0 | % |
The following reflects a rollforward of the deferred tax asset valuation allowance for the years ended December 31, 2015, 2014 and 2013:
|
| | | | | | | | | | | | |
| | | Year Ended
December 31, |
| | | 2015 | | 2014 | | 2013 |
| Beginning | | $ | (34,952 | ) | | $ | (14,518 | ) | | $ | (6,770 | ) |
| Increase to allowance | | (11,678 | ) | | (20,434 | ) | | (7,748 | ) |
| Ending | | $ | (46,630 | ) | | $ | (34,952 | ) | | $ | (14,518 | ) |
We are subject to income taxes in the United States and certain foreign jurisdictions. Significant judgment is required in determining the consolidated provision for income taxes and recording the related deferred tax assets and liabilities. In the ordinary course of business, there are transactions and calculations where the ultimate tax determination is uncertain.
As of December 31, 2015 and 2014, we did not have uncertain tax positions. Our tax returns are not currently under examination by the Internal Revenue Service or other taxing authorities. We are subject to income tax examinations for our U.S. federal tax returns and foreign examinations for years 2012 and subsequent; and U.S., state and local returns for years 2011 and subsequent. Although we believe that the estimates and assumptions supporting its tax positions are reasonable, the final determination of tax audits and any related litigation could be materially different from that which is reflected in historical income tax provisions and recorded assets and liabilities. Based on the results of an audit or litigation, there could be a material effect on our benefit from income taxes, net loss or cash flows in the period or periods for which that determination is made.
16. NET LOSS PER SHARE
The following table sets forth the computation of basic and diluted loss per share attributable to our common stockholders:
|
| | | | | | | | | | | | |
| | | Year Ended
December 31, |
| | | 2015 | | 2014 | | 2013 |
| Net loss per common share: | | | | | | |
| Net loss | | $ | (39,216 | ) | | $ | (59,637 | ) | | $ | (37,913 | ) |
| Less: accretion and adjustment of Series A Preferred and Series B Preferred | | — |
| | 6,879 |
| | (19,439 | ) |
| Net loss attributable to common stockholders | | $ | (39,216 | ) | | $ | (52,758 | ) | | $ | (57,352 | ) |
| Basic and diluted loss per common share | | | | | | |
| Basic and diluted weighted average common shares outstanding | | 40,237,848 |
| | 31,887,246 |
| | 22,238,632 |
|
| Basic and diluted loss per common share | | $ | (0.97 | ) | | $ | (1.65 | ) | | $ | (2.58 | ) |
Diluted loss per share for the years ended December 31, 2015, 2014 and 2013 does not reflect the following weighted average potential common shares, as the effect would be antidilutive:
|
| | | | | | | | | |
| | | Year Ended
December 31, |
| | | 2015 | | 2014 | | 2013 |
| Series A Preferred and Series B Preferred | | — |
| | — |
| | 5,576,955 |
|
| Stock options | | 3,682,019 |
| | 4,277,229 |
| | 4,179,119 |
|
| Restricted stock and RSUs | | 414,001 |
| | 765,023 |
| | 576,132 |
|
17. SEGMENT AND GEOGRAPHICAL CONCENTRATION
Operating segments are defined as components of an enterprise for which separate discrete financial information is available and evaluated regularly by the chief operating decision maker, or decision-making group, in deciding how to allocate resources and in assessing performance. We globally manage the business within one reporting segment. Segment information is consistent with how management reviews the business, makes investing and resource allocation decisions and assesses operating performance. Products are sold principally in the United States. International revenue represented 28.1% of total revenue for the year ended December 31, 2015; however, revenue earned in any individual foreign country is below 10% of our consolidated revenue.
The following table represents total revenue by geographic area, based on the location of the customer:
|
| | | | | | | | | | | | |
| | | Year Ended
December 31, |
| | | 2015 | | 2014 | | 2013 |
| United States | | $ | 155,291 |
| | $ | 133,110 |
| | $ | 111,772 |
|
| International | | 60,716 |
| | 53,562 |
| | 45,812 |
|
| Total | | $ | 216,007 |
| | $ | 186,672 |
| | $ | 157,584 |
|
We classify sales within the United States into three categories: complex spine pathologies, minimally invasive procedures and degenerative and other conditions. A significant portion of our international revenue is derived from our distributor partners who do not report their product usage at the surgeon or hospital level, which prevents us from providing a specific breakdown for our international revenue among its three product categories. These sales transactions are settled when we ship the product to the agent.
In the fourth quarter of 2015, we refined our reporting of procedure revenue that included the sale of certain single-use MIS products which are sold in support of degenerative surgical procedures as degenerative revenue. Historically these sales were reflected in the MIS product category. As a result of this change our historically reported MIS revenue has decreased and our degenerative revenue has increased approximately $2,476 and $1,287 for the years ended December 31, 2014 and 2013 to conform to the current year presentation.
|
| | | | | | | | | | | | |
| | | Year Ended
December 31, |
| | | 2015 | | 2014 | | 2013 |
| Complex spine | | $ | 63,398 |
| | $ | 54,030 |
| | $ | 46,442 |
|
| Minimally invasive | | 23,633 |
| | 18,194 |
| | 17,115 |
|
| Degenerative | | 68,260 |
| | 60,886 |
| | 48,215 |
|
| | | 155,291 |
| | 133,110 |
| | 111,772 |
|
| International | | 60,716 |
| | 53,562 |
| | 45,812 |
|
| Total | | $ | 216,007 |
| | $ | 186,672 |
| | $ | 157,584 |
|
The following table represents long-lived assets (1) by geographic area:
|
| | | | | | | | |
| | | December 31, |
| | | 2015 | | 2014 |
| United States | | $ | 57,958 |
| | $ | 23,684 |
|
| International | | 4,305 |
| | 1,928 |
|
| Total | | $ | 62,263 |
| | $ | 25,612 |
|
(1) Long-lived assets include property, plant and equipment including the capital lease for our corporate headquarters and surgical instruments in U.S.
18. RECENT ACCOUNTING PRONOUNCEMENTS
We qualify as an “emerging growth company” (“EGC”) pursuant to the provisions of the JOBS Act and has elected to take advantage of the extended transition period provided in Section 7(a)(2)(B) of the Securities Act which permits EGCs to defer compliance with new or revised accounting standards (the “EGC extension”) until non-issuers are required to comply with such standards. Accordingly, so long as we continue to qualify as an EGC, we will not have to adopt or comply with new accounting standards until non-issuers are required to comply with such standards.
In May 2014, the Financial Accounting Standards Board, or FASB, amended the existing accounting standards for revenue recognition. The amendments are based on the principle that revenue should be recognized to depict the transfer of goods and services to customers in an amount that reflects the consideration to which the entity expects to be entitled in exchange for those goods and services. In July 2015, the FASB issued guidance to defer the effective date by one year for public entities, other than EGCs that have elected the EGC extension. The guidance will now be effective for annual reporting periods beginning after December 15, 2017, with early adoption permitted for reporting periods beginning after December 15, 2016. EGCs that have elected the EGC extension, including us, and non-public entities will be required to comply with the guidance for annual reporting periods beginning after December 15, 2018. The amendments may be applied retrospectively to each prior period presented or retrospectively with the cumulative effect recognized as of the date of the initial application. We are evaluating the impact of these amendments and the transition alternatives on our consolidated financial statements.
In April 2015, the FASB issued guidance to simplify the presentation of debt issuance costs by requiring them to be presented as a deduction from the corresponding debt liability, rather than reported as an asset. This will make the presentation of debt issuance costs consistent with the presentation of debt discounts and premiums. The recognition and measurement guidance for debt issuance costs are not affected by this new guidance. In August 2015, the FASB issued further guidance to clarify that the SEC staff would not object to an entity presenting debt issuance costs relating to line-of-credit arrangements as an asset that is subsequently amortized ratably over the terms of the line-of-credit arrangement, regardless of whether there are any outstanding borrowings on the arrangement. For public entities other than EGCs that have elected the EGC extension, this guidance will be effective for annual reporting periods beginning after December 15, 2015, and interim periods within those fiscal years. EGCs that have elected the EGC extension, including us, and non-public entities will be required to comply with the guidance on a retrospective basis for fiscal years beginning after December 15, 2015, and interim periods within the fiscal years beginning after December 15, 2016. Although adoption of this new guidance may impact how such items are classified on our balance sheet, we do not anticipate that the adoption of this guidance will have a material impact on our financial position, results of operations or cash flows. There will be no changes to the presentations of our other consolidated financial statements.
In July 2015, the FASB issued authoritative guidance to simplify the subsequent measurement of inventory. Under this new standard, an entity should measure inventory at the lower of cost and net realizable value. Net realizable value is the estimated selling price in the ordinary course of business, less reasonably predictable costs of completion, disposal, and transportation. For public entities other than EGCs that have elected the EGC extension, the guidance will be effective for fiscal years, and interim periods within those fiscal years, beginning after December 15, 2016. For all other entities, EGCs that have elected the EGC extension, including us, and non-public entities will be required to comply with the guidance for fiscal years beginning after December 15, 2016, and interim periods within fiscal years beginning after December 15, 2017. The amendments in this guidance should be applied prospectively with earlier application permitted as of the beginning of an interim or annual reporting period. We are presently evaluating the impact of this guidance.
In February 2016, the FASB issued authoritative guidance which requires lessees to recognize the following for all leases (with the exception of short-term leases) at the commencement date: a lease liability, which is a lessee’s obligation to make lease payments arising from a lease, measured on a discounted basis; and a right-of-use asset, which is an asset that represents the lessee’s right to use, or control the use of, a specified asset for the lease term. The revised guidance must be applied on a modified retrospective transition approach for leases existing at, or entered into after, the beginning of the earliest comparative period presented in the financial statements. For public companies other than EGCs that have elected the EGC extension, including us, and non-public entities will be required to comply with the guidance in 2019, and interim periods within that year.
EGC’s that have elected the EGC exemption, like us, or non-public companies will be required to comply with this guidance beginning in 2020 and interim periods in 2021. Early adoption is permitted for all entities. We are presently evaluating the impact of this guidance.
Recently Adopted Accounting Standard
In November, 2015, the FASB issued authoritative guidance to simplify the presentation of deferred taxes by requiring all deferred tax assets and liabilities, and any related valuation allowance, to be classified as non-current on the balance sheet. We elected to adopt the accounting standard as of December 31, 2015 and retrospectively adjusted the 2014 presentation of deferred income taxes on the accompanying Consolidated balance sheet. Upon adoption of this guidance, current deferred income tax assets of $4,226 and $3,437 as of December 31, 2015 and 2014, respectively, have been reclassified to long-term deferred income tax liabilities as of each date.
19. SELECTED QUARTERLY FINANCIAL DATA (UNAUDITED)
The following tables summarize the unaudited quarterly statements of operations for 2015 and 2014. The tables include all necessary adjustments, consisting only of normal recurring adjustments necessary in the opinion of management for a fair statement of the results for interim periods.
|
| | | | | | | | | | | | | | | | |
| | | Quarter Ended |
| | | December 31, 2015 | | September 30, 2015 | | June 30, 2015 | | March 31, 2015 |
| Revenue | | $ | 54,220 |
| | $ | 55,009 |
| | $ | 56,354 |
| | $ | 50,424 |
|
| Gross profit | | 35,936 |
| | 37,619 |
| | 37,734 |
| | 32,927 |
|
| Loss from operations | | (7,579 | ) | | (10,010 | ) | | (8,636 | ) | | (10,045 | ) |
| Net loss | | (8,494 | ) | | (10,215 | ) | | (6,222 | ) | | (14,285 | ) |
| Net loss per common share | | (0.21 | ) | | (0.25 | ) | | (0.16 | ) | | (0.37 | ) |
|
| | | | | | | | | | | | | | | | |
| | | Quarter Ended |
| | | December 31, 2014 | | September 30, 2014 | | June 30, 2014 | | March 31, 2014 |
| Revenue | | $ | 49,309 |
| | $ | 47,624 |
| | $ | 47,488 |
| | $ | 42,251 |
|
| Gross profit | | 33,092 |
| | 31,489 |
| | 31,454 |
| | 27,837 |
|
| Loss from operations | | (8,552 | ) | | (12,906 | ) | | (12,813 | ) | | (13,698 | ) |
| Net loss | | (11,067 | ) | | (16,140 | ) | | (17,683 | ) | | (14,747 | ) |
| Net loss per common share | | (0.30 | ) | | (0.43 | ) | | (0.32 | ) | | (0.71 | ) |
EXHIBIT INDEX
|
| | | |
Exhibit Number | | Description | |
| 2.1 | | Agreement and Plan of Merger, dated as of July 2, 2010, by and among K2M Group Holdings, Inc. (formerly known as Altitude Group Holdings, Inc.), Altitude Merger Sub, Inc., K2M, Inc., and the Stockholders’ Committee (incorporated by reference to Exhibit 2.1 to the Registrant’s Registration Statement on Form S-1 filed on April 7, 2014 (No. 333-194550)) | |
| | |
| 2.2 | | Amendment No. 1 to Agreement and Plan of Merger, dated as of August 12, 2010, by and among K2M Group Holdings, Inc. (formerly known as Altitude Group Holdings, Inc.), and K2M, Inc., (incorporated by reference to Exhibit 2.2 to the Registrant’s Registration Statement on Form S-1 filed on April 7, 2014 (No. 333-194550)) | |
| | |
| 2.3 | | Amendment No. 2 to Agreement and Plan of Merger, dated as of December 21, 2012, by and among K2M Group Holdings, Inc. (formerly known as Altitude Group Holdings, Inc. and the Stockholders’ Committee (incorporated by reference to Exhibit 2.3 to the Registrant’s Registration Statement on Form S-1 filed on April 7, 2014 (No. 333-194550)) | |
| | |
| 3.1 | | Third Amended and Restated Certificate of Incorporation of K2M Group Holdings, Inc. (incorporated by reference to Exhibit 3.1 to the Registrant’s Current Report on Form 8-K filed on May 13, 2014 (No. 001-36443)) | |
| | |
| 3.2 | | Amended and Restated Bylaws of K2M Group Holdings, Inc. (incorporated by reference to Exhibit 3.2 to the Registrant’s Current Report on Form 8-K filed on May 13, 2014 (No. 001-36443)) | |
| 10.1 | | Credit Agreement, dated as of October 29, 2012, among K2M Holdings, Inc., as a Guarantor, K2M, Inc. and K2M UK Limited, jointly and severally as Borrowers, the Guarantors from time to time parties thereto, the several lenders from time to time parties thereto and Silicon Valley Bank, as Administrative Agent, Issuing Lender and Swingline Lender (incorporated by reference to Exhibit 10.1 to the Registrant’s Registration Statement on Form S-1 filed on April 7, 2014 (No. 333-194550)) | |
| 10.2 | | Waiver and First Amendment to Credit Agreement entered into as of May 20, 2013 by and among K2M Holdings, Inc., K2M, Inc. and K2M UK Limited, as borrowers, the several banks and other financial institutions or entities party thereto, Silicon Valley Bank, as the Issuing Lender and the Swingline Lender, and Silicon Valley Bank, as administrative agent and collateral agent for the lenders (incorporated by reference to Exhibit 10.2 to the Registrant’s Registration Statement on Form S-1 filed on April 7, 2014 (No. 333-194550)) | |
| 10.3 | | Second Amendment to Credit Agreement entered into as of February 26, 2014, by and among K2M Holdings, Inc., K2M, Inc. and K2M UK Limited, as borrowers, the several banks and other financial institutions or entities party thereto, Silicon Valley Bank, as the Issuing Lender and the Swingline Lender, and Silicon Valley Bank, as administrative agent and collateral agent for the lenders (incorporated by reference to Exhibit 10.3 to the Registrant’s Registration Statement on Form S-1 filed on April 7, 2014 (No. 333-194550)) | |
| 10.4 | | Third Amendment to Credit Agreement entered into as of April 30, 2014, by and among K2M Holdings, Inc., K2M, Inc. and K2M UK Limited, as borrowers, the several banks and other financial institutions or entities party thereto, Silicon Valley Bank, as the Issuing Lender and the Swingline Lender, and Silicon Valley Bank, as administrative agent and collateral agent for the lenders (incorporated by reference to Exhibit 10.34 to the Registrant’s Registration Statement on Form S-1 filed on May 2, 2014 (No. 333-194550)) | |
| 10.5 | | Fourth Amendment to Credit Agreement entered into as of October 21, 2014, by and among K2M Holdings, Inc., K2M, Inc. and K2M UK Limited, as borrowers, the several banks and other financial institutions or entities party thereto, Silicon Valley Bank, as the Issuing Lender and the Swingline Lender, and Silicon Valley Bank, as administrative agent and collateral agent for the lenders (incorporated by reference to Exhibit 10.1 to the Registrant’s Current Report on Form 8-K filed on October 24, 2014 (No. 001-36433)) | |
|
| | | |
Exhibit Number
| | Description
| |
| 10.6 | | Fifth Amendment to Credit Agreement and First Amendment to Guarantee and Collateral Agreement entered into as of January 7, 2015, by and among K2M Holdings, Inc., K2M, Inc. and K2M UK Limited, as borrowers, the several banks and other financial institutions or entities party thereto, Silicon Valley Bank, as the Issuing Lender and the Swingline Lender, and Silicon Valley Bank, as administrative agent and collateral agent for the lenders (incorporated by reference to Exhibit 10.1 to the Registrant’s Current Report on Form 8-K filed on January 9, 2015 (No. 001-36433)) | |
| 10.7 | | Sixth Amendment to Credit Agreement entered into as of May 8, 2015, by and among K2M Holdings, Inc., K2M, Inc. and K2M UK Limited, as borrowers, the several banks and other financial institutions or entities party thereto, Silicon Valley Bank, as the Issuing Lender and the Swingline Lender, and Silicon Valley Bank, as administrative agent and collateral agent for the lenders (incorporated by reference to Exhibit 10.1 to the Registrant’s Current Report on Form 8-K filed on May 8, 2015 (No. 001-36433)).
| |
| 10.8 | | Seventh Amendment to Credit Agreement entered into as of June 5, 2015, by and among K2M Holdings, Inc., K2M, Inc. and K2M UK Limited, as borrowers, the several banks and other financial institutions or entities party thereto, Silicon Valley Bank, as the Issuing Lender and the Swingline Lender, and Silicon Valley Bank, as administrative agent and collateral agent for the lenders (incorporated by reference to Exhibit 10.1 to the Registrant’s Current Report on Form 8-K filed on June 5, 2015 (No. 001-36433)). | |
| 10.9 | | Eighth Amendment dated October 29, 2015 to Credit Agreement dated October 29, 2012, by and among K2M Holdings, Inc., as the guarantor, K2M, Inc. and K2M UK Limited, as borrowers, and Silicon Valley Bank and Comerica Bank as lenders. (incorporated by reference to Exhibit 10.1 to the Registrant’s Current Report on Form 8-K filed on November 3, 2015 (No. 001-36433)).
| |
| 10.10 | | Guarantee and Collateral Agreement, dated as of October 29, 2012, made by K2M Holdings, Inc., K2M, Inc. and the other Grantors referred to herein in favor of Silicon Valley Bank, as Administrative Agent (incorporated by reference to Exhibit 10.4 to the Registrant’s Registration Statement on Form S-1 filed on April 7, 2014 (No. 333-194550)) | |
| 10.11 | | Export Import Bank Credit Agreement, dated as of October 29, 2012, among K2M Holdings, Inc., as a Guarantor, the other Guarantors from time to time parties hereto, K2M Inc., as the Borrower, the several Exim Lenders from time to time parties hereto, and Silicon Valley Bank, as Administrative Agent (incorporated by reference to Exhibit 10.5 to the Registrant’s Registration Statement on Form S-1 fled on April 7, 2014 (No. 333-194550)) | |
| 10.12 | | Guarantee and Collateral Agreement for Export Import Bank Credit Facility, dated as of October 29, 2012, made by K2M Holdings, Inc., K2M, Inc. and the other Grantors referred to herein in favor of Silicon Valley Bank, as Administrative Agent (incorporated by reference to Exhibit 10.6 to the Registrant’s Registration Statement on Form S-1 filed on April 7, 2014 (No. 333-194550)) | |
| 10.13 | † | Employment Agreement, effective as of August 12, 2010, by and between K2M, Inc. and Eric Major (incorporated by reference to Exhibit 10.7 to the Registrant’s Registration Statement on Form S-1 filed on April 7, 2014 (No. 333-194550)) | |
| 10.14 | † | Amendment, dated as of January 20, 2014, to Employment Agreement, effective as of August 12, 2010, by and between K2M, Inc. and Eric Major (incorporated by reference to Exhibit 10.8 to the Registrant’s Registration Statement on Form S-1 filed on April 7, 2014 (No. 333-194550)) | |
| 10.15 | † | Employment Agreement, effective as of August 12, 2010, by and between K2M, Inc. and Gregory Cole (incorporated by reference to Exhibit 10.9 to the Registrant’s Registration Statement on Form S-1 filed on April 7, 2014 (No. 333-194550)) | |
| 10.16 | † | Amendment, dated as of January 20, 2014, to Employment Agreement, effective as of August 12, 2010, by and between K2M, Inc. and Gregory Cole (incorporated by reference to Exhibit 10.10 to the Registrant’s Registration Statement on Form S-1 filed on April 7, 2014 (No. 333-194550)) | |
| 10.17 | † | Employment Agreement, effective as of August 12, 2010, by and between K2M, Inc. and Dr. John Kostuik (incorporated by reference to Exhibit 10.11 to the Registrant’s Registration Statement on Form S-1 filed on April 7, 2014 (No. 333-194550)) | |
|
| | | |
Exhibit Number
| | Description | |
| 10.18 | † | Amendment, dated as of March 10, 2014, to Employment Agreement, effective as of August 12, 2010, by and between K2M, Inc. and Dr. John Kostuik (incorporated by reference to Exhibit 10.12 to the Registrant’s Registration Statement on Form S-1 filed on April 7, 2014 (No. 333-194550)) | |
| 10.19 | † | Amended and Restated K2M, Inc. 2006 Stock Option and Grant Plan (incorporated by reference to Exhibit 10.13 to the Registrant’s Registration Statement on Form S-1 filed on April 7, 2014 (No. 333-194550)) | |
| 10.20 | † | Form of Incentive Stock Option Agreement under the Amended and Restated 2006 Stock Option and Grant Plan and Stock Restriction Agreement (incorporated by reference to Exhibit 10.40 to the Registrant’s Registration Statement on Form S-1 filed on January 28, 2015 (No. 333-201597)) | |
| 10.21 | † | K2M Group Holdings, Inc. 2010 Equity Award Plan (incorporated by reference to Exhibit 10.14 to the Registrant’s Registration Statement on Form S-1 filed on April 7, 2014 (No. 333-194550)) | |
| 10.22 | † | Form of Stock Option Award Agreement for directors, under the K2M Group Holdings, Inc. 2010 Equity Award Plan (incorporated by reference to Exhibit 10.40 to the Registrant’s Registration Statement on Form S-1 filed on January 28, 2015 (No. 333-201597)) | |
| 10.23 | † | Form of Stock Option Award Agreement for employees and consultants, under the K2M Group Holdings, Inc. 2010 Equity Award Plan (incorporated by reference to Exhibit 10.41 to the Registrant’s Registration Statement on Form S-1 filed on January 28, 2015 (No. 333-201597)) | |
| 10.24 | † | K2M Group Holdings, Inc. 2014 Employee Stock Purchase Plan (incorporated by reference to Exhibit 10.15 to the Registrant’s Registration Statement on Form S-1 filed on January 28, 2015 (No. 333-194550)) | |
| 10.25 | † | K2M, Inc. Omnibus Incentive Plan (incorporated by reference to Exhibit 10.42 to the Registrant’s Registration Statement on Form S-1 filed on March 14, 2014 (No. 333-194550)) | |
| 10.26 | † | Form of Option Agreement under the K2M Group Holdings, Inc. 2014 Omnibus Incentive Plan (incorporated by reference to Exhibit 10.42 to the Registrant’s Registration Statement on Form S-1 filed on January 28, 2015 (No. 333-201597)) | |
| 10.27 | † | Form of Restricted Stock Unit Award Agreement (incorporated by reference to Exhibit 10.32 to the Registrant’s Registration Statement on Form S-1 filed on April 22, 2014 (No. 333-194550)) | |
| 10.28 | † | Form of Side Letter to Restricted Stock Unit Award Agreement (incorporated by reference to Exhibit 10.33 to the Registrant’s Registration Statement on Form S-1 filed on April 22, 2014 (No. 333-194550)) | |
| 10.29 | † | K2M Group Holdings, Inc. 2010 Independent Agent Stock Option Plan (incorporated by reference to Exhibit 10.17 to the Registrant’s Registration Statement on Form S-1 filed on April 7, 2014 (No. 333-194550)) | |
| 10.30 | | Lease Agreement, dated as of May 12, 2004, by and between RiverAir, LC and K2 Medical, LLC, as amended, in respect of the building located at 751 Miller Drive S.E, Leesburg, Virginia 20175 (incorporated by reference to Exhibit 10.18 to the Registrant’s Registration Statement on Form S-1 filed on April 7, 2014 (No. 333-194550)) | |
| 10.31 | | Amendment to Lease Agreement, made as of April 17, 2014, by and between RiverAir, LC and K2M, Inc. (incorporated by reference to Exhibit 10.10 to the Registrant’s Quarterly Report on Form 10-Q filed on June 5, 2014 (No. 001-36443)) | |
| 10.32 | | Deed of Lease, made as of December 10, 2014, by and between TC Oaklawn Owner, LLC and K2M Group Holdings, Inc. (incorporated by reference to Exhibit 10.1 to the Registrants' Current Report on Form 8-K filed on December 12, 2014 (No. 001-36443)) | |
|
| | | |
Exhibit Number
| | Description | |
| 10.33 | | Exclusive License Agreement, dated as of September 2, 2004, by and between Spinal LLC and K2M, LLC (incorporated by reference to Exhibit 10.20 to the Registrant’s Registration Statement on Form S-1 filed on April 7, 2014 (No. 333-194550)) | |
| 10.34 | | Amendment to Exclusive License Agreement, entered into as of February 17, 2010, by and between Spinal LLC and K2M, LLC (incorporated by reference to Exhibit 10.21 to the Registrant’s Registration Statement on Form S-1 filed on April 7, 2014 (No. 333-194550)) | |
| 10.35 | | Asset Purchase Agreement, made and entered into as of November 21, 2011, by and between K2M, Inc. and Nexgen Spine, Inc. (incorporated by reference to Exhibit 10.22 to the Registrant’s Registration Statement on Form S-1 filed on April 7, 2014 (No. 333-194550)) | |
| 10.36 | | Royalty Agreement, made and effective as of April 1, 2007, between K2M, Inc. and Josef Gorek, M.D. (incorporated by reference to Exhibit 10.23 to the Registrant’s Registration Statement on Form S-1 filed on April 7, 2014 (No. 333-194550)) | |
| 10.37 | | Assignment and Earn-Out Agreement, made and entered into as of March 8, 2004, by and between K2 Medical, LLC, as assignee, and Fasteneix, LLC, Third Millenium Engineering, LLC, J7 Summit Medical Group, LLC, Techsys Medical, LLC, Bones Consulting, LLC and Josef Gorek (incorporated by reference to Exhibit 10.24 to the Registrant’s Registration Statement on Form S-1 filed on April 7, 2014 (No. 333-194550)) | |
| 10.38 | | Addendum, dated as of September 27, 2005, to the Assignment and Earn-out Agreement by and between K2 Medical, LLC and Fastenix, LLC, Third Millenium Engineering, LLC, J7 Summit Medical Group, LLC, Techsys Medical, LLC and Bones Consulting, LLC (incorporated by reference to Exhibit 10.25 to the Registrant’s Registration Statement on Form S-1 filed on April 7, 2014 (No. 333-194550)) | |
| 10.39 | | License Agreement, dated as of May 19/June 12, 2006, between Prof. Dr. Dietmar Wolter and K2M, LLC (incorporated by reference to Exhibit 10.26 to the Registrant’s Registration Statement on Form S-1 filed on April 7,2014 (No. 333-194550)) | |
| 10.40 | | Additional Agreement to License Agreement, dated as of June 14/June 12, 2006, between Prof. Dr. Dietmar Wolter and K2M, LLC (incorporated by reference to Exhibit 10.27 to the Registrant’s Registration Statement on Form S-1 April 7, 2014 (No. 333-194550)) | |
| 10.41 | | Addendum, dated as of February 20/February 22, 2008, to the License Agreement dated as of May 19/June 12, 2006 and the Additional Agreement to License Agreement dated as of May 19/June 12, 2006, between Prof. Dr. Dietmar Wolter and K2M, Inc. (formerly known as K2M, LLC) (incorporated by reference to Exhibit 10.28 to the Registrant’s Registration Statement on Form S-1 filed on April 7, 2014 (No. 333-194550)) | |
| 10.42 | | Asset Purchase and Earn Out Agreement, made and entered into as of February 12, 2010, by and between K2M, Inc. and John Carbone, MD (incorporated by reference to Exhibit 10.29 to the Registrant’s Registration Statement on Form S-1 filed on April 7, 2014 (No. 333-194550)) | |
| 10.43 | | First Amendment to Asset Purchase and Earn Out Agreement, made and entered into as of June 15, 2012, by and between K2M, Inc. and John Carbone, MD (incorporated by reference to Exhibit 10.30 to the Registrant’s Registration Statement on Form S-1 filed on April 7, 2014 (No. 333-194550)) | |
| 10.44 | | Registration Rights Agreement, dated August 12, 2010, by and among K2M Group Holdings, Inc., Welsh, Carson, Anderson & Stowe XI, L.P., FFC Partners III, L.P. and the other stockholders named therein (incorporated by reference to Exhibit 10.31 to the Registrant’s Registration Statement on Form S-1 April 22, 2014 (No. 333-194550)) | |
| 21.1 | | List of Subsidiaries (filed herewith) | |
| 23.1 | | Consent of Ernst & Young LLP (filed herewith) | |
| 23.2 | | Consent of iData Research, Inc. (filed herewith) | |
| 24.1 | | Power of Attorney (filed herewith) | |
| 31.1 | | Certification of Periodic Report by Chief Executive Officer under Section 302 of the Sarbanes-Oxley Act of 2002 (filed herewith). | |
|
| | | |
Exhibit Number
| | Description | |
| 31.2 | | Certification of Periodic Report by Chief Financial Officer under Section 302 of the Sarbanes-Oxley Act of 2002 (filed herewith). | |
| 32.1 | | Certification of Chief Executive Officer Pursuant to 18 U.S.C. Section 1350 as Adopted Pursuant to Section 906 of the Sarbanes-Oxley Act of 2002 (filed herewith). | |
| 32.2 | | Certification of Chief Financial Officer Pursuant to 18 U.S.C. Section 1350 as Adopted Pursuant to Section 906 of the Sarbanes-Oxley Act of 2002 (filed herewith) | |
| 101.INS | | XBRL Instance Document (A) | |
| 101 SCH | | XBRL Taxonomy Extension Schema Document (A) | |
| 101.CAL | | XBRL Taxonomy Extension Calculation Linkbase Document (A) | |
| 101.DEF | | XBRL Taxonomy Extension Definition Linkbase Document (A) | |
| 101.LAB | | XBRL Taxonomy Extension Label Linkbase Document (A) | |
| 101.PRE | | XBRL Taxonomy Extension Presentation Linkbase Document (A) | |
|
| | |
| † | Identifies exhibits that consist of a management contract or compensatory plan or arrangement. | |
|
| | |
| (A) | XBRL (Extensible Business Reporting Language) information is furnished and not filed for purposes of Section 11 and 12 of the Securities Act of 1933 and Section 18 of the Securities Exchange Act of 1934. | |