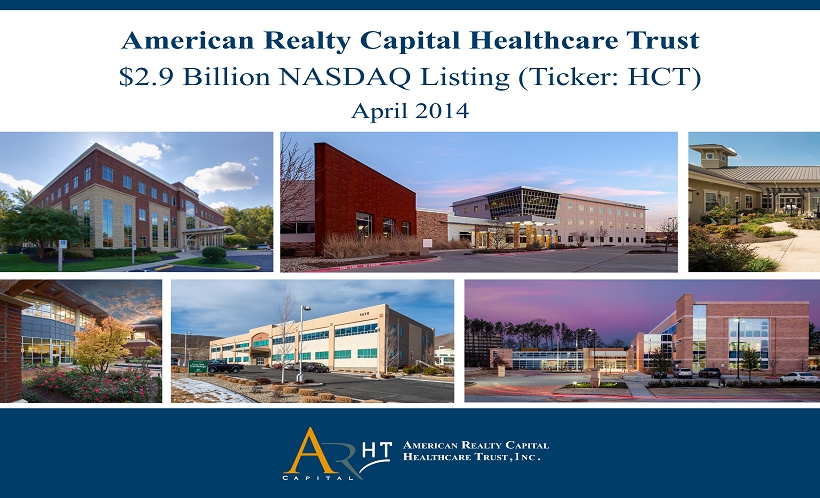
American Realty Capital Healthcare Trust $2.9 Billion NASDAQ Listing (Ticker: HCT) April 2014
Investing in the Growth of Healthcare 2 FORWARD - LOOKING STATEMENTS Certain statements made in this presentation are forward - looking statements. These forward - looking statements include statements regarding our intent, belief or current expectations and are based on various assumptions. These statements involve substantial risks and uncertainties. Actual results or events could differ materia
lly from the plans, intentions and expectations disclosed in the forward - looking statements that we make. Forward - looking statements may include, but are not limited to, statements regarding stockholder liquidity and investment value and r etu rns. The words "anticipates," "believes," "expects," "estimates," "projects," "plans," "intends," "may," "will," "would" and similar express ion s are intended to identify forward - looking statements, although not all forward - looking statements contain these identifying words. Actual results may differ materially from those contemplated by the forward - looking statement. Further, forward - looking statements speak only as of the date they are mad e, and we undertake no obligation to update or reverse any forward - looking statement to reflect changed assumptions, the occurrence of unanticipated events on changes to future operating results, unless required to do so by law. Factors that might cause such differences include, but are not limited to: our ability to complete the listing of our shares of common stock on the NASDAQ Stock Market (“NASDAQ”); our ability to complete the tender off er; the price at which our shares of common stock may trade on the NASDAQ, which may be higher or lower than the purchase price in the tender offer or our estimate of NAV contained herein; the number of shares acquired in the tender offer; the cost of any indebtedness incurred to fu nd this offer; the impact of current and future regulation ; the effects of competition; the ability of our advisor to attract, develop and retain executives and other qualified employees; changes in general economic or market conditions; and other factors, many of which are beyond our control.
Investing in the Growth of Healthcare 3 FORWARD - LOOKING STATEMENTS Other factors include: • All of our executive officers are also officers, managers and/or holders of a direct or indirect interest in our Advisor and oth er American Realty Capital - affiliated entities. As a result, our executive officers, American Realty Capital Healthcare Advisors, LLC (our "Advisor") a nd its affiliates face confl
icts of interest, including significant conflicts created by our Advisor's compensation arrangements with us and other investors e nti ties by American Realty Capital affiliates, and conflicts in allocating time among these investors and us. These conflicts could negatively impact ou r o perating results. • Because investment opportunities that are suitable for us may also be suitable for other American Realty Capital - advised program s or investors, our Advisor and its affiliates face conflicts of interest relating to the purchase of properties and other investments and such c onf licts may not be resolved in our favor, meaning that we could invest in less attractive assets, which could reduce the investment return to our stockholde rs. • We depend on tenants for our revenue, and, accordingly, our revenue is dependent upon the success and economic viability of o ur tenants. • We may not be able to achieve the rental rate incentives and our expenses could be greater, which impacts the estimates conta ine d herein • Increases in interest rates could increase the amount of our debt payments and limit our ability to pay distributions. • We may not generate cash flows sufficient to pay our distributions to stockholders, as such, we may be forced to borrow at hi ghe r rates or depend on our Advisor or our property manager, American Realty Capital Healthcare Properties, LLC (the "Property Manager"), to waive reimbursement of certain expenses and fees to fund our operations. • We may be unable to pay or maintain cash distributions or increase distributions over time. • We are obligated to pay fees, which may be substantial, to our Advisor and its affiliates, including fees payable upon the sa le of properties. • We are subject to risks associated with the significant dislocations and liquidity disruptions that recently existed or occur red in the credit markets of the United States. • We may fail to continue to qualify to be treated as a real estate investment trust for U.S. federal income tax purposes ("REI T") . • We focus on acquiring healthcare - related assets located in the United States which are subject to risks inherent in concentratin g investments in the healthcare industry . • The healthcare industry is heavily regulated, and new laws or regulations, changes to existing laws or regulations, loss of l ice nsure or failure to obtain licensure could result in the inability of tenants to make lease payments to us . All forward - looking statements should be read with the risks factors described in our reports filed with the U.S. Securities and Exchange Commission (the “SEC”), particularly in the "Risk Factors" and "Management's Discussion and Analysis of Financial Condition and Results of Op era tions" sections of our latest Annual Report on Form 10 - K, as filed with the SEC.

WE ARE LISTING ON NASDAQ Investing in the Growth of Healthcare 4 Portfolio Poised for Future Growth and Value Creation Fully Invested December 2013 Closed Non - Traded Offering April 2013 Acquired High - Quality Healthcare Real Estate ( 2011 to 2013) NASDAQ Ticker: HCT Target Listing Date: April 7, 2014 Incorporated August 2010 Listing on NASDAQ
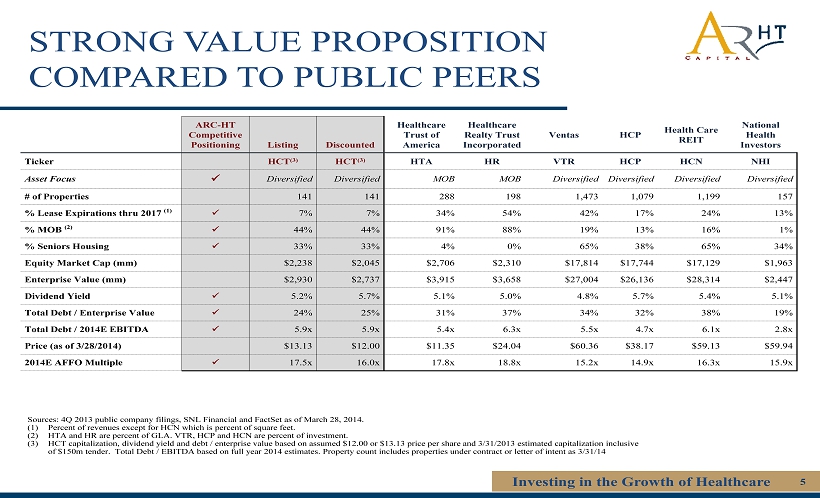
STRONG VALUE PROPOSITION COMPARED TO PUBLIC PEERS Investing in the Growth of Healthcare 5 Sources: 4Q 2013 public company filings, SNL Financial and FactSet as of March 28, 2014. (1) Percent of revenues except for HCN which is percent of square feet. (2) HTA and HR are percent of GLA. VTR, HCP and HCN are percent of investment. (3) HCT capitalization, dividend yield and debt / enterprise value based on
assumed $12.00 or $13.13 price per share and 3/31/2013 estimated capitalization inclusive of $150m tender. Total Debt / EBITDA based on full year 2014 estimates. Property count includes properties under contr act or letter of intent as 3/31/14 ARC - HT Competitive Positioning Listing Discounted Healthcare Trust of America Healthcare Realty Trust Incorporated Ventas HCP Health Care REIT National Health Investors Ticker HCT (3) HCT (3) HTA HR VTR HCP HCN NHI Asset Focus x Diversified Diversified MOB MOB Diversified Diversified Diversified Diversified # of Properties 141 141 288 198 1,473 1,079 1,199 157 % Lease Expirations thru 2017 (1) x 7% 7% 34% 54% 42% 17% 24% 13% % MOB (2) x 44% 44% 91% 88% 19% 13% 16% 1% % Seniors Housing x 33% 33% 4% 0% 65% 38% 65% 34% Equity Market Cap (mm) $2,238 $2,045 $2,706 $2,310 $17,814 $17,744 $17,129 $1,963 Enterprise Value (mm) $2,930 $2,737 $3,915 $3,658 $27,004 $26,136 $28,314 $2,447 Dividend Yield x 5.2% 5.7% 5.1% 5.0% 4.8% 5.7% 5.4% 5.1% Total Debt / Enterprise Value x 24% 25% 31% 37% 34% 32% 38% 19% Total Debt / 2014E EBITDA x 5.9x 5.9x 5.4x 6.3x 5.5x 4.7x 6.1x 2.8x Price (as of 3/28/2014) $13.13 $12.00 $11.35 $24.04 $60.36 $38.17 $59.13 $59.94 2014E AFFO Multiple x 17.5x 16.0x 17.8x 18.8x 15.2x 14.9x 16.3x 15.9x
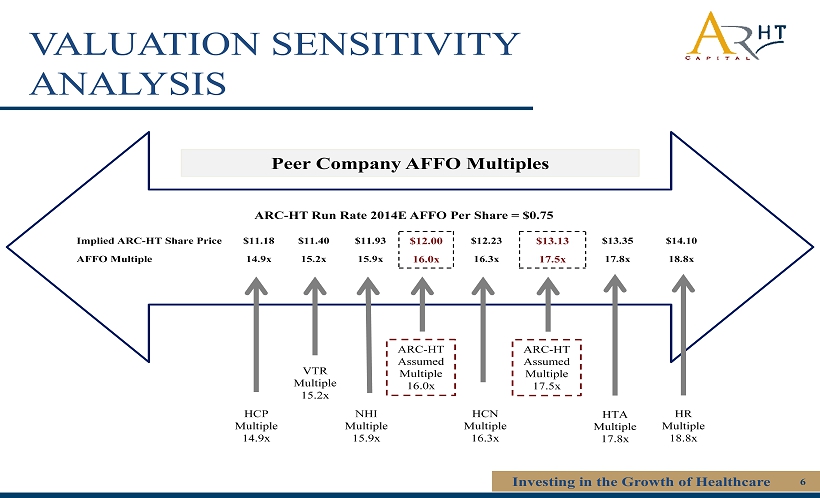
VALUATION SENSITIVITY ANALYSIS Investing in the Growth of Healthcare 6 Implied ARC - HT Share Price $11.18 $11.40 $11.93 $12.00 $12.23 $13.13 $13.35 $14.10 AFFO Multiple 14.9x 15.2x 15.9x 16.0x 16.3x 17.5x 17.8x 18.8x HCP Multiple 14.9x HR Multiple 18.8x HCN Multiple 16.3x HTA Multiple 17.8x ARC - HT Run Rate 2014E AFFO Per Share = $0.75 Peer Company AFFO Multiples ARC - HT Assumed Multiple 16.0x
VTR Multiple 15.2x NHI Multiple 15.9x ARC - HT Assumed Multiple 17.5x

TRANSACTION OVERVIEW Investing in the Growth of Healthcare 7 • American Realty Capital Healthcare Trust (“ARC - HT” or the “Company”) intends to list on NASDAQ • Listing targeted for April 7 th • Ticker symbol: HCT • There will be no lock - up for stockholders • ARC - HT is poised to expand portfolio • The Company will make a concurrent tender offer to purchase shares • Tender price expected to be $11
.00 per share • Maximum tender amount expected to be $150 million • Tender will remain open for 20 business days • The tender will be accretive to Company, FFO, AFFO and NAV per share • The Company will have modest leverage and strong coverage metrics post - transaction • Less than 30 % leverage ratio • 5.9x Debt / 2014E EBITDA • 2014E Annualized AFFO / share 1 : $0.73 - $0.78 • Dividend / share: $0.68; no change to the current dividend • AFFO payout ratio: 90% 1) See page 25 for further detail on 2014 earnings guidance

WHY WE ARE LISTING Investing in the Growth of Healthcare 8 • Current stockholders can participate in future appreciation of the Company post - listing • Strong portfolio with embedded growth • Proven external growth capabilities • Best - in - class management team with a proven track record • Access to lower cost of capital will accretively fund acquisition pipeline • S tockholders will have opportun
ity to convert shares into cash To Create Value To Create Liquidity

Investing in the Growth of Healthcare 9 • Raise Capital and Invest: Raise non - traded REIT equity capital and invest accretively into high quality sector specific real estate assets • Investment Grade Quality: Build strong, diversified real estate portfolio with high tenant quality, low leverage, long - weighted and mid - weighted average lease terms and growth potential • Liquidity and Capital Access:
Increase enterprise value and provide common stock liquidity through strategic sale or listing on an exchange • Internalize Management Team Once Critical Mass Reached: Build a dedicated team of senior professionals accountable with continued alignment with stockholders AMERICAN REALTY CAPITAL “BRAND”

INVESTMENT HIGHLIGHTS Investing in the Growth of Healthcare 10 Balanced and diversified portfolio of medical office buildings, seniors housing with select hospital and post - acute assets Healthcare market possesses attractive fundamentals with outsized demand drivers from macro demographic trends Growth focused with strong internal fundamentals and proven external growth capabilities Proven and ve
teran management team with deep understanding of the healthcare industry and capital markets Strong and flexible capital structure with investment grade quality balance sheet
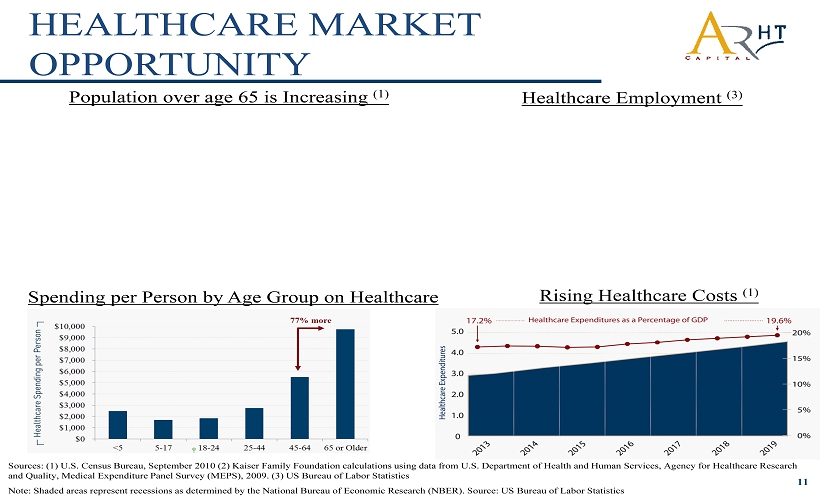
Population over age 65 is Increasing (1) Sources: (1) U.S. Census Bureau, September 2010 (2) Kaiser Family Foundation calculations using data from U.S. Department of Health and Human Services, Agency for Healthcare Research and Quality, Medical Expenditure Panel Survey (MEPS), 2009 . (3) US Bureau of Labor Statistics Note : Shaded areas represent recessions as determined by the National Bureau of Ec
onomic Research (NBER). Source: US Bureau of La bor Statistics Spending per Person by Age G roup on Healthcare (2) Healthcare Employment (3) Rising Healthcare Costs (1) 11 HEALTHCARE MARKET OPPORTUNITY

HEALTHCARE REAL ESTATE Sources: Wall Street & Company Research Investing in the Growth of Healthcare 12 • US healthcare is a $1 trillion industry • The ownership of healthcare real estate is deeply fragmented • REIT ownership ranges from 24% in the skilled nursing sector to 2% in the hospital sector • Affordable Care Act will have significant impact on healthcare real estate, as newly - insured are
added to the rolls REITs own a fraction of healthcare real estate $100 $300 $250 $350 $24 $49 $20 $7 $0 $50 $100 $150 $200 $250 $300 $350 $400 Skilled Nursing Seniors Housing Medical Office Hospitals 24% REIT 16% REIT 8% REIT 2% REIT Value ($billions) Total REITs
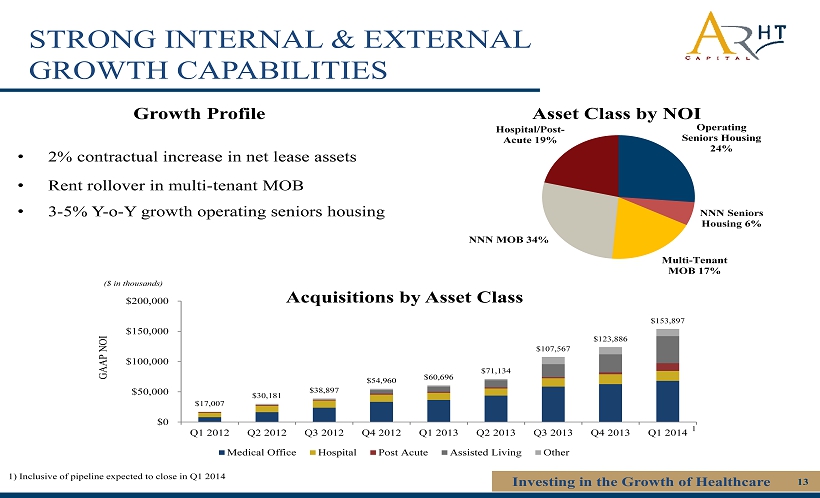
STRONG INTERNAL & EXTERNAL GROWTH CAPABILITIES Investing in the Growth of Healthcare 13 ($ in thousands) • 2% contractual increase in net lease assets • Rent rollover in multi - tenant MOB • 3 - 5% Y - o - Y growth operating seniors housing Acquisitions by Asset Class Growth Profile $17,007 $30,181 $38,897 $54,960 $60,696 $71,134 $107,567 $123,886 $153,897 $0 $50,000 $100,000 $150,000 $200,000 Q1 2012
Q2 2012 Q3 2012 Q4 2012 Q1 2013 Q2 2013 Q3 2013 Q4 2013 Q1 2014 Medical Office Hospital Post Acute Assisted Living Other GAAP NOI 1) Inclusive of pipeline expected to close in Q1 2014 1 Operating Seniors Housing 24% NNN Seniors Housing 6% Multi - Tenant MOB 17% NNN MOB 34% Hospital/Post - Acute 19% Asset Class by NOI
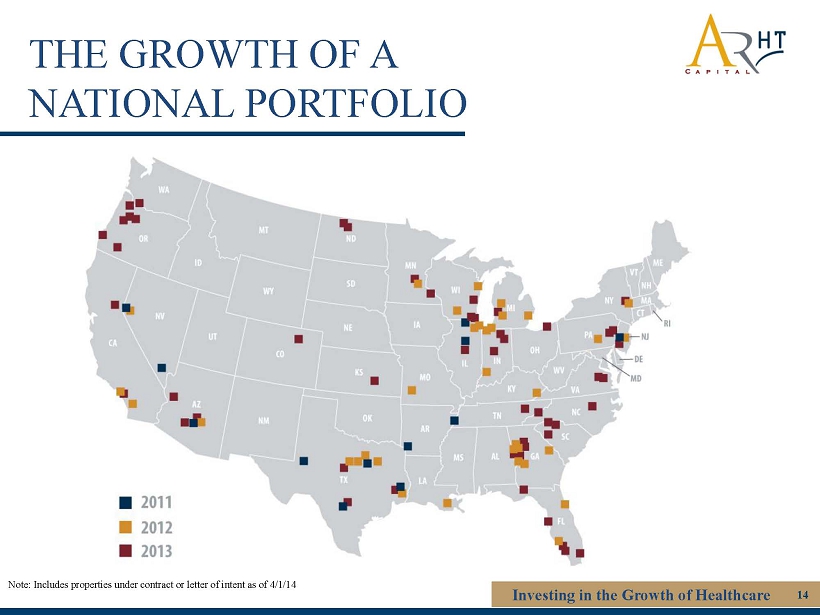
THE GROWTH OF A NATIONAL PORTFOLIO Investing in the Growth of Healthcare 14 Note: I ncludes properties under contract or letter of intent as of 4/1/14
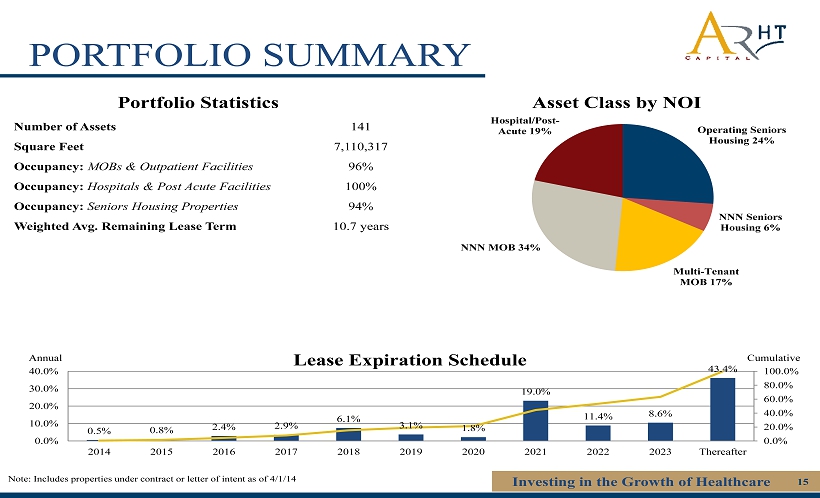
PORTFOLIO SUMMARY Investing in the Growth of Healthcare 15 Note: I ncludes properties under contract or letter of intent as of 4/1/14 0.5% 0.8% 2.4% 2.9% 6.1% 3.1% 1.8% 19.0% 11.4% 8.6% 43.4% 0.0% 20.0% 40.0% 60.0% 80.0% 100.0% 0.0% 10.0% 20.0% 30.0% 40.0% 2014 2015 2016 2017 2018 2019 2020 2021 2022 2023 Thereafter Lease Expiration Schedule Annual Cumulative Portfolio Statistics Nu
mber of Assets 141 Square Feet 7,110,317 Occupancy: MOBs & Outpatient Facilities 96% Occupancy: Hospitals & Post Acute Facilities 100% Occupancy: Seniors Housing Properties 94% Weighted Avg. Remaining Lease Term 10.7 years Operating Seniors Housing 24% NNN Seniors Housing 6% Multi - Tenant MOB 17% NNN MOB 34% Hospital/Post - Acute 19% Asset Class by NOI
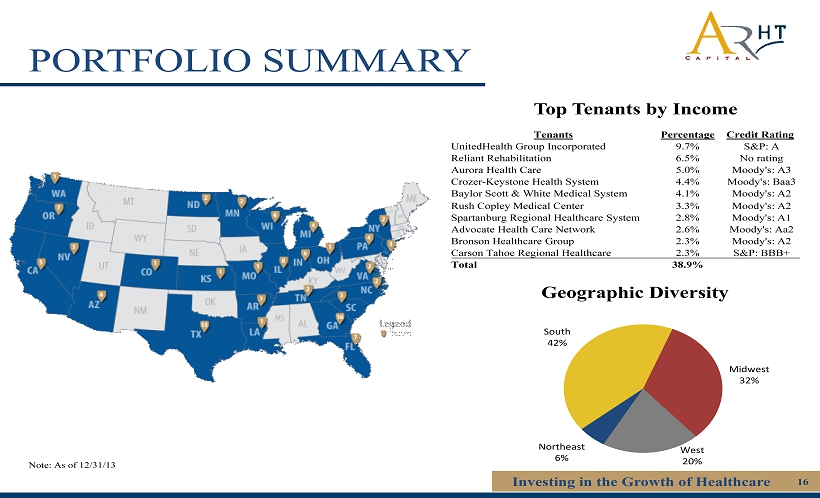
Investing in the Growth of Healthcare 16 PORTFOLIO SUMMARY Geographic Diversity Note: As of 12/31/13 Tenants Percentage Credit Rating UnitedHealth Group Incorporated 9.7% S&P: A Reliant Rehabilitation 6.5% No rating Aurora Health Care 5.0% Moody's: A3 Crozer - Keystone Health System 4.4% Moody's: Baa3 Baylor Scott & White Medical System 4.1% Moody's: A2 Rush Copley Medical Center 3.3% Moody's
: A2 Spartanburg Regional Healthcare System 2.8% Moody's: A1 Advocate Health Care Network 2.6% Moody's: Aa2 Bronson Healthcare Group 2.3% Moody's: A2 Carson Tahoe Regional Healthcare 2.3% S&P: BBB+ Total 38.9% Top Tenants by Income Northeast 6% South 42% Midwest 32% West 20%
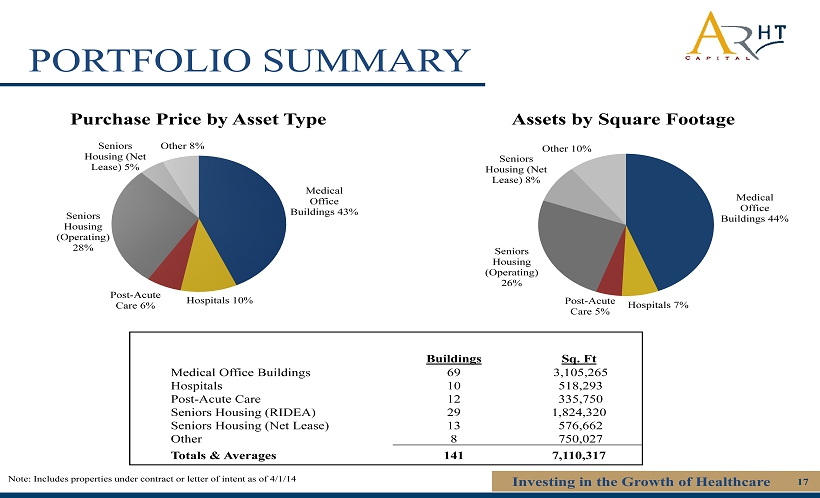
Investing in the Growth of Healthcare 17 PORTFOLIO SUMMARY Medical Office Buildings 43% Hospitals 10% Post - Acute Care 6% Seniors Housing (Operating) 28% Seniors Housing (Net Lease) 5% Other 8% Medical Office Buildings 44% Hospitals 7% Post - Acute Care 5% Seniors Housing (Operating) 26% Seniors Housing (Net Lease) 8% Other 10% Purchase Price by Asset Type Assets by Square Footage Buildings
Sq. Ft Medical Office Buildings 69 3,105,265 Hospitals 10 518,293 Post - Acute Care 12 335,750 Seniors Housing (RIDEA) 29 1,824,320 Seniors Housing (Net Lease) 13 576,662 Other 8 750,027 Totals & Averages 141 7,110,317 Note: I ncludes properties under contract or letter of intent as of 4/1/14
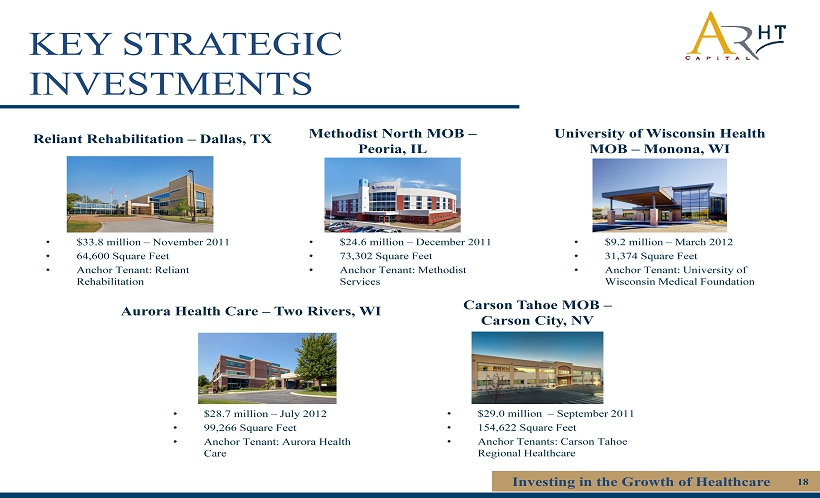
KEY STRATEGIC INVESTMENTS Investing in the Growth of Healthcare 18 • $33.8 million – November 2011 • 64,600 Square Feet • Anchor Tenant: Reliant Rehabilitation Methodist North MOB – Peoria, IL Reliant Rehabilitation – Dallas, TX Carson Tahoe MOB – Carson City, NV University of Wisconsin Health MOB – Monona, WI Aurora Health Care – Two Rivers, WI • $24.6 million – December 2011 • 73,302 Square F
eet • Anchor Tenant : Methodist Services • $9.2 million – March 2012 • 31,374 Square Feet • Anchor Tenant : University of Wisconsin Medical Foundation • $28.7 million – July 2012 • 99,266 Square Feet • Anchor Tenant : Aurora Health Care • $29.0 million – September 2011 • 154,622 Square Feet • Anchor Tenants : Carson Tahoe Regional Healthcare

PROVEN & VETERAN MANAGEMENT TEAM Investing in the Growth of Healthcare 19 Nicholas S. Schorsch, Executive Chairman Mr. Schorsch currently serves as Executive Chairman of American Realty Capital Healthcare Trust. Mr. Schorsch has also serves as Executive Chairman of American Realty Capital Properties (NASDAQ: ARCP) and he was a co - founder of ARCP. Additionally, Mr. Schorsch served as Chairman
of American Realty Capital Trust (NASDAQ: ARCT), a publicly traded net lease REIT he co - founded in 2007 and listed on the NASDAQ in March 2012. In January 2013, ARCT completed its merger with Realty Income (NYSE: O). In 2007, Mr. Schorsch co - founded AR Capital, a full service, alternative inve stment advisory firm. He currently serves as AR Capital’s Chairman and CEO and also holds CEO and board positions for other publicly registered, non - trad ed investments sponsored by AR Capital. From September 2002 until August 2006, Mr. Schorsch served as CEO of American Financial Realty Trust (AFRT), whic h h e took public in 2003 under NYSE ticker symbol ‘AFR’. Mr. Schorsch has over 20 years of real estate experience. He also served on the board of the Nat ional Association of Real Estate Investment Trusts (NAREIT) from 2005 to 2006. Tom D’Arcy, Chief Executive Officer » Over 30 years of commercial real estate experience » Former Chief Executive Officer and/or Chairman of three NYSE traded companies » Former President and Chief Executive Officer for Grubb & Ellis Company » Current Chairman of the Board of Inland Real Estate Corporation Todd Jensen, Chief Investment Officer » Serves as the Executive Vice President and Chief Investment Officer for American Realty Capital Healthcare Trust » 20 years of experience in the financing and development of commercial real estate, with more than 15 of those years focused e xcl usively on healthcare - related real estate » Former Senior Vice President for Lauth Property Group, which he led to become the 8th largest healthcare developer in the Uni ted States Ed Lange, Chief Financial Officer » 30 years executive leadership in real estate finance residential and healthcare industries » Former CFO for Health Care REIT, Inc. (HCN) » Former CFO and COO at BRE Properties, Inc. (BRE) » Former Independent Board member for two New York Stock Exchange REITs: Stag Industrial, Inc. and American Assets Trust, Inc.
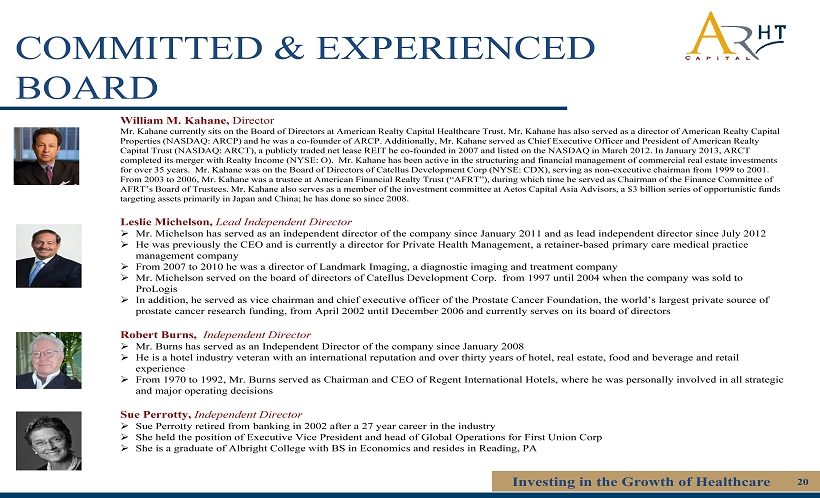
COMMITTED & EXPERIENCED BOARD Investing in the Growth of Healthcare 20 William M. Kahane, Director Mr. Kahane currently sits on the Board of Directors at American Realty Capital Healthcare Trust. Mr. Kahane has also served as a director of American Realty Capital Properties (NASDAQ: ARCP ) and he was a co - founder of ARCP. Additionally, Mr. Kahane served as Chief Executive Officer and President
of American Realty Capital Trust (NASDAQ: ARCT), a publicly traded net lease REIT he co - founded in 2007 and listed on the NASDAQ in March 2012. In January 2013, ARCT completed its merger with Realty Income (NYSE: O ). Mr. Kahane has been active in the structuring and financial management of commercial real estate investments for over 35 years. Mr . Kahane was on the Board of Directors of Catellus Development Corp (NYSE: CDX), serving as non - executive chairman from 1999 to 2001. From 2003 to 2006, Mr. Kahane was a trustee at American Financial Realty Trust (“AFRT”), during which time he served as Chair man of the Finance Committee of AFRT’s Board of Trustees. Mr. Kahane also serves as a member of the investment committee at Aetos Capital Asia Advisors, a $3 bi llion series of opportunistic funds targeting assets primarily in Japan and China; he has done so since 2008. Leslie Michelson, Lead Independent Director » Mr . Michelson has served as an independent director of the company since January 2011 and as lead independent director since Ju ly 2012 » He was previously the CEO and is currently a director for Private Health Management, a retainer - based primary care medical practice management company » From 2007 to 2010 he was a director of Landmark Imaging, a diagnostic imaging and treatment company » Mr . Michelson served on the board of directors of Catellus Development Corp. from 1997 until 2004 when the company was sold to ProLogis » In addition, he served as vice chairman and chief executive officer of the Prostate Cancer Foundation, the world’s largest priva te source of prostate cancer research funding, from April 2002 until December 2006 and currently serves on its board of directors Robert Burns, Independent Director » Mr. Burns has served as an Independent Director of the company since January 2008 » He is a hotel industry veteran with an international reputation and over thirty years of hotel, real estate, food and beverag e a nd retail experience » From 1970 to 1992, Mr. Burns served as Chairman and CEO of Regent International Hotels, where he was personally involved in a ll strategic and major operating decisions Sue Perrotty, Independent Director » Sue Perrotty retired from banking in 2002 after a 27 year career in the industry » She held the position of Executive Vice President and head of Global Operations for First Union Corp » She is a graduate of Albright College with BS in Economics and resides in Reading, PA
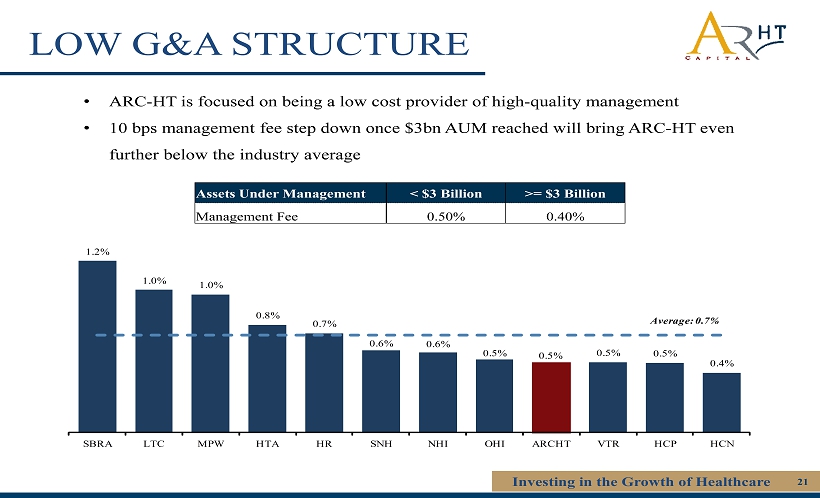
LOW G&A STRUCTURE Investing in the Growth of Healthcare 21 Assets Under Management < $3 Billion >= $3 Billion Management Fee 0.50% 0.40% 1.2% 1.0% 1.0% 0.8% 0.7% 0.6% 0.6% 0.5% 0.5% 0.5% 0.5% 0.4% SBRA LTC MPW HTA HR SNH NHI OHI ARCHT VTR HCP HCN Average: 0.7% • ARC - HT is focused on being a low cost provider of high - quality management • 10 bps management fee step down once $3b
n AUM reached will bring ARC - HT even further below the industry average
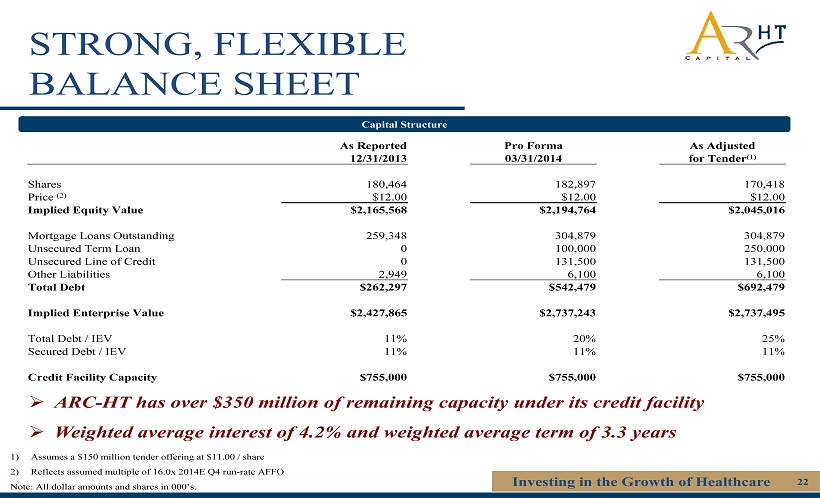
STRONG, FLEXIBLE BALANCE SHEET Investing in the Growth of Healthcare 22 Capital Structure 1) Assumes a $150 million tender offering at $11.00 / share 2) Reflects assumed multiple of 16.0x 2014E Q4 run - rate AFFO Note: All dollar amounts and shares in 000’s. » ARC - HT has over $350 million of remaining capacity under it s credit facility » Weighted average interest of 4.2% and weighted average ter
m of 3.3 years As Reported Pro Forma As Adjusted 12/31/2013 03/31/2014 for Tender (1) Shares 180,464 182,897 170,418 Price (2) $12.00 $12.00 $12.00 Implied Equity Value $2,165,568 $2,194,764 $2,045,016 Mortgage Loans Outstanding 259,348 304,879 304,879 Unsecured Term Loan 0 100,000 250,000 Unsecured Line of Credit 0 131,500 131,500 Other Liabilities 2,949 6,100 6,100 Total Debt $262,297 $542,479 $692,479 Implied Enterprise Value $2,427,865 $2,737,243 $2,737,495 Total Debt / IEV 11% 20% 25% Secured Debt / IEV 11% 11% 11% Credit Facility Capacity $755,000 $755,000 $755,000

CREDIT BENCHMARKING Investing in the Growth of Healthcare 23 3.8% 4.0% 4.2% 4.6% 4.9% 5.1% VTR HTA ARC - HT HCN HR HCP ARC - HT’s credit profile is comparable to its rated healthcare peers Source: 4Q 2013 public company filings, SNL Financial and FactSet. Note: WPC is pro forma for CPA 16 and based on individual 3Q2013 public filings of WPC and CPA 16. (1) ARC - HT as of 12/31/14 assuming fully
invested. (2) ARC - HT is based on in - place debt as of 3/31/14 pro forma for the tender offer. Secured Debt as a % of Total Debt (1) Net Debt / 2014E EBITDA (1) Weighted Average Term (years) (2) Weighted Average Interest Rate (2) 4.6x 5.3x 5.4x 5.9x 6.0x 6.2x HCP HTA VTR ARC - HT HCN HR 12% 17% 25% 28% 32% 33% HR HCP VTR HCN ARC - HT HTA 8.1 6.9 5.5 5.4 5.2 3.3 HCN VTR HR HCP HTA ARC - HT BBB+ Baa1 BBB - Baa2 BBB+ Baa2 BBB Baa2 BBB - Baa3

CREDIT BENCHMARKING Investing in the Growth of Healthcare 24 3.5% 3.9% 4.0% 4.2% 4.9% ARCP CSG ROIC ARC - HT WPC ARC - HT’s credit profile is comparable to recently rated companies 5.9x 6.5x 6.6x 6.8x 7.5x ARC - HT WPC ROIC CSG ARCP 18% 32% 38% 40% 68% ROIC ARC - HT ARCP CSG WPC 6.8 5.9 5.2 5.0 3.3 WPC ROIC ARCP CSG ARC - HT Source: 4Q 2013 public company filings, SNL Financial and FactSet
. Note: WPC is pro forma for CPA 16 and based on individual 3Q2013 public filings of WPC and CPA 16. (1) ARC - HT as of 12/31/14 assuming fully invested. (2) ARC - HT is based on in - place debt as of 3/31/14 pro forma for the tender offer. Secured Debt as a % of Total Debt (1) Net Debt / 2014E EBITDA (1) Weighted Average Term (years) (2) Weighted Average Interest Rate (2) BBB Baa2 BBB Baa2 BBB - Baa3 BBB - Baa3
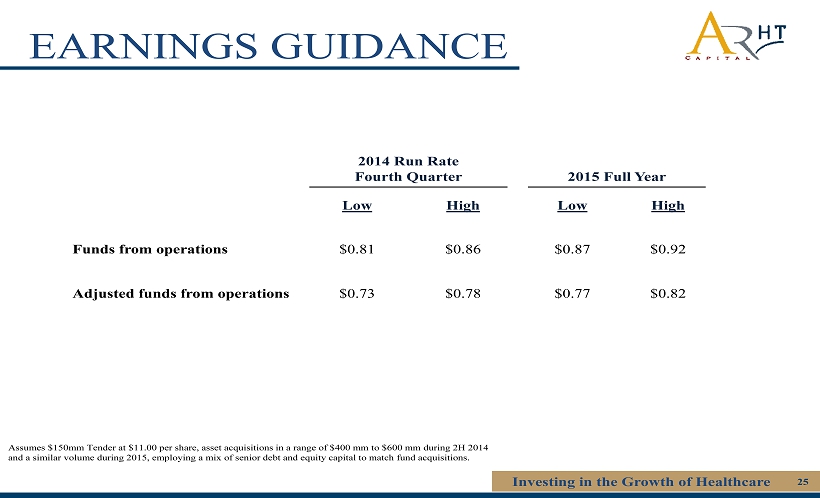
EARNINGS GUIDANCE Assumes $150mm Tender at $11.00 per share, asset acquisitions in a range of $400 mm to $600 mm during 2H 2014 and a similar volume during 2015, employing a mix of senior debt and equity capital to match fund acquisitions. Investing in the Growth of Healthcare 25 2014 Run Rate Fourth Quarter 2015 Full Year Low High Low High Funds from operations $0.81 $0.86 $0.87 $0.92 Adjusted
funds from operations $0.73 $0.78 $0.77 $0.82

APPENDIX
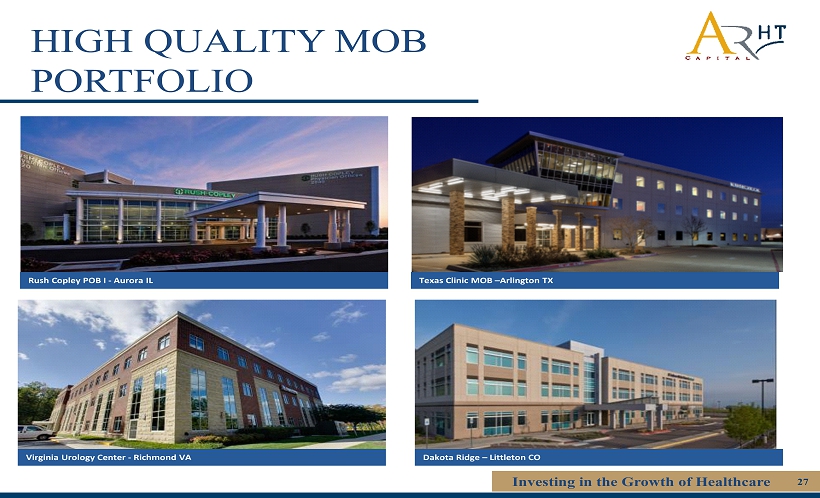
Investing in the Growth of Healthcare 27 Virginia Urology Center - Richmond VA Rush Copley POB I - Aurora IL Texas Clinic MOB – Arlington TX Dakota Ridge – Littleton CO HIGH QUALITY MOB PORTFOLIO

Investing in the Growth of Healthcare 28 MEDICAL OFFICE BUILDINGS Sources: Wall Street Research - 50 100 150 -6% -4% -2% 0% 2% 4% 6% 2007 2008 2009 2010 2011 2012 2013 2014E 2015E 2016E 2017E 2018E Index Y - o - Y Change % Y-o-Y Change Indexed • MOBs are expected to benefit from the expansion in the insured patient population as a result of the Affordable Care Act • Hospital - affiliated MOBs l
ikely to outperform, as more doctors become hospital employees, increasing demand for on - campus and affiliated facilities MOB RevPAF Projected to Grow at 3% per Annum 85% 86% 87% 88% 89% 90% 91% 92% 93% -6% -4% -2% 0% 2% 4% 6% 2007 2008 2009 2010 2011 2012 2013 2014E 2015E 2016E 2017E 2018E Occupancy % Rent Growth % Rent Growth Occupancy MOB Rent Growth Projected to R emain Positive

MEDICAL OFFICE BUILDINGS Investing in the Growth of Healthcare 29 Sources: Wall Street Research -6.0% -4.0% -2.0% 0.0% 2.0% 4.0% 6.0% 8.0% Annual NOI Growth (%) MOB Major Sectors 8.0% 8.5% 9.0% 9.5% 10.0% 10.5% 11.0% 11.5% 0 5 10 15 20 25 30 2008 2009 2010 2011 2012 2013 Vacancy Rate (%) Million Square Feet Completed Completions (MSq.ft) Vacancy Rate Historical and Projected MOB S
ame - Property NOI Growth Low Level of Completions and Declining Vacancy Rate • MOBs continued strong performance in post - recession years • Improvements in market rents and occupancy support stable, positive growth in NOI over next five years
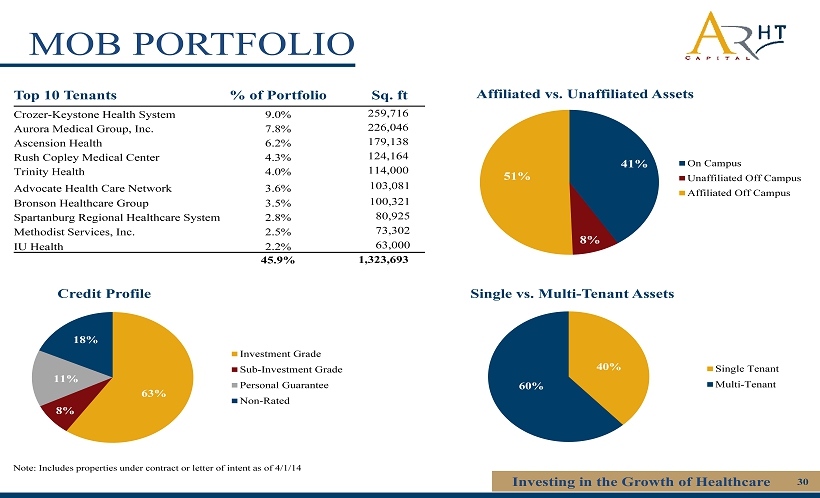
MOB PORTFOLIO Investing in the Growth of Healthcare 30 Top 10 Tenants % of Portfolio Sq. ft Crozer - Keystone Health System 9.0% 259,716 Aurora Medical Group, Inc. 7.8% 226,046 Ascension Health 6.2% 179,138 Rush Copley Medical Center 4.3% 124,164 Trinity Health 4.0% 114,000 Advocate Health Care Network 3.6% 103,081 Bronson Healthcare Group 3.5% 100,321 Spartan burg Regional Healthcare System 2.
8% 80,925 Methodist Services, Inc. 2.5% 73,302 IU Health 2.2% 63,000 45.9% 1,323,693 63% 8% 11% 18% Investment Grade Sub-Investment Grade Personal Guarantee Non-Rated 40% 60% Single Tenant Multi-Tenant Credit Profile Single vs. Multi - Tenant Assets Affiliated vs. Unaffiliated Assets Note: I ncludes properties under contract or letter of intent as of 4/1/14 41% 8% 51% On Campus Unaffiliated Off Campus Affiliated Off Campus
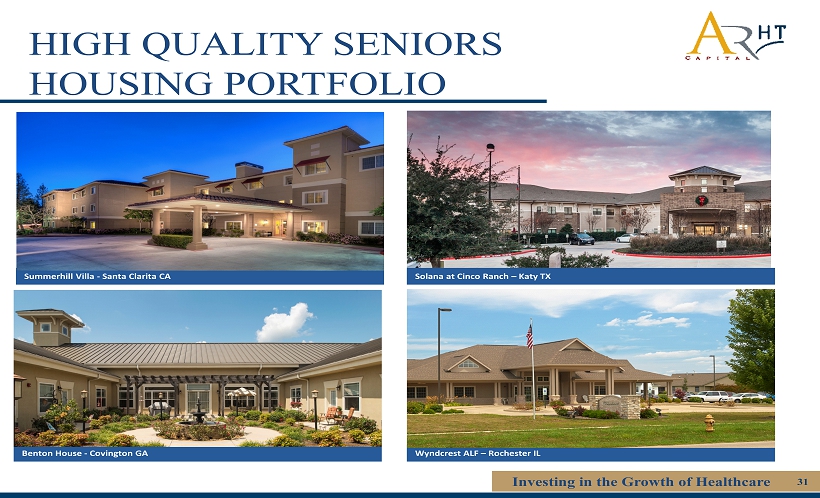
HIGH QUALITY SENIORS HOUSING PORTFOLIO Investing in the Growth of Healthcare 31 Benton House - Covington GA Summerhill Villa - Santa Clarita CA Solana at Cinco Ranch – Katy TX Wyndcrest ALF – Rochester IL

SENIORS HOUSING Sources: Wall Street Research Investing in the Growth of Healthcare 32 • The demographic impact of the baby boomer generation reaching retirement age will impact housing demand across the United States • The substantial increase in the over - 65 population will require an expansion of senior housing choices Population aged 65+ to increase 78% by 2040 10% 12% 14% 16% 18% 20% 22%
24% 0 10,000 20,000 30,000 40,000 50,000 60,000 70,000 80,000 90,000 100,000 2015 2020 2025 2030 2035 2040 2045 2050 2055 2060 Percent of total US Population Population aged 65+ ('000s) 65 Yrs and Older % of US Total Growth in the over - 65 population 20% 20% 78% 188% 0% 20% 40% 60% 80% 100% 120% 140% 160% 180% 200% Under 18 yrs 18 to 64 yrs 65 to 84 yrs 85+ yrs
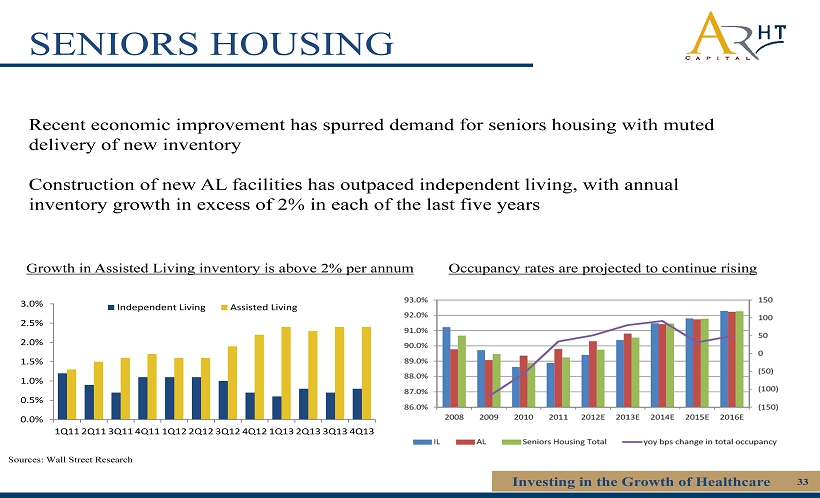
SENIORS HOUSING Sources: Wall Street Research Investing in the Growth of Healthcare 33 Recent economic improvement has spurred demand for seniors housing with muted delivery of new inventory Construction of new AL facilities has outpaced independent living, with annual inventory growth in excess of 2% in each of the last five years Occupancy rates are projected to continue rising Growth in Assisted L
iving inventory is above 2% per annum 0.0% 0.5% 1.0% 1.5% 2.0% 2.5% 3.0% 1Q11 2Q11 3Q11 4Q11 1Q12 2Q12 3Q12 4Q12 1Q13 2Q13 3Q13 4Q13 Independent Living Assisted Living
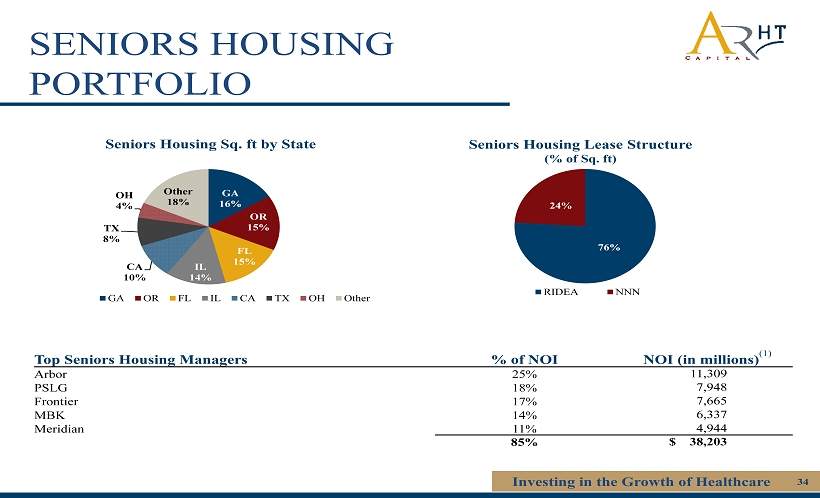
SENIORS HOUSING PORTFOLIO Investing in the Growth of Healthcare 34 Top Seniors Housing Managers % of NOI NOI (in millions) (1) Arbor 25% 11,309 PSLG 18% 7,948 Frontier 17% 7,665 MBK 14% 6,337 Meridian 11% 4,944 85% $ 38,203 76% 24% RIDEA NNN GA 16% OR 15% FL 15% IL 14% CA 10% TX 8% OH 4% Other 18% GA OR FL IL CA TX OH Other Seniors Housing Sq. ft by State Seniors Housing Lease Structure
(% of Sq . ft )
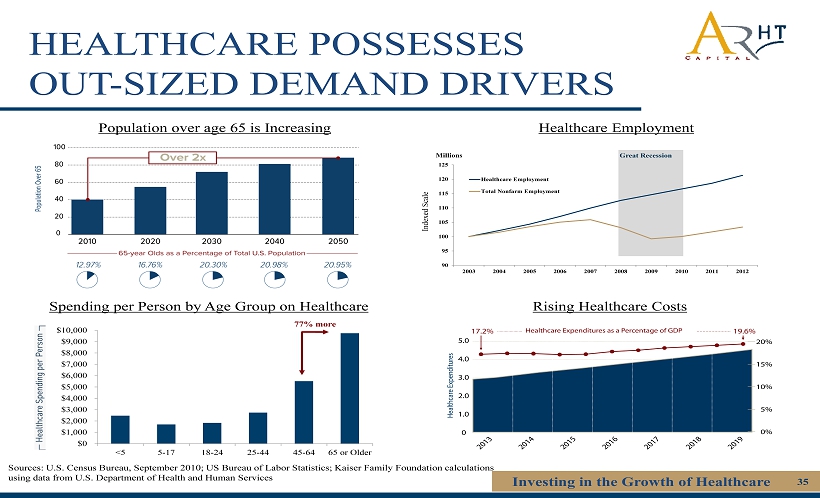
HEALTHCARE POSSESSES OUT - SIZED DEMAND DRIVERS Investing in the Growth of Healthcare 35 Population over age 65 is Increasing Rising Healthcare Costs $0 $1,000 $2,000 $3,000 $4,000 $5,000 $6,000 $7,000 $8,000 $9,000 $10,000 <5 5-17 18-24 25-44 45-64 65 or Older 77% more Spending per Person by Age Group on Healthcare Healthcare Employment Great Recession 90 95 100 105 110 115 120 125 2003 2004 2005 2006
2007 2008 2009 2010 2011 2012 Healthcare Employment Total Nonfarm Employment Indexed Scale Millions Sources: U.S. Census Bureau, September 2010; US Bureau of Labor Statistics; Kaiser Family Foundation calculations using data from U.S. Department of Health and Human Services

FREQUENTLY ASKED QUESTIONS

FREQUENTLY ASKED QUESTIONS Investing in the Growth of Healthcare 37 Will there be a change in management? No, there will not be a change in management . Is there a stockholder lock - up ? No, there is no stockholder lock - up. Investors are free to sell their shares. What will happen to the existing Dividend Reinvestment Plan (DRIP)? Existing DRIP will be suspended (last payment will be on April 1).
Will there be a new Dividend Reinvestment Plan (DRIP)? Yes, we will implement a new dividend reinvestment plan for the Company . When will the share repurchase plan be terminated? The share repurchase plan has been terminated effective immediately.
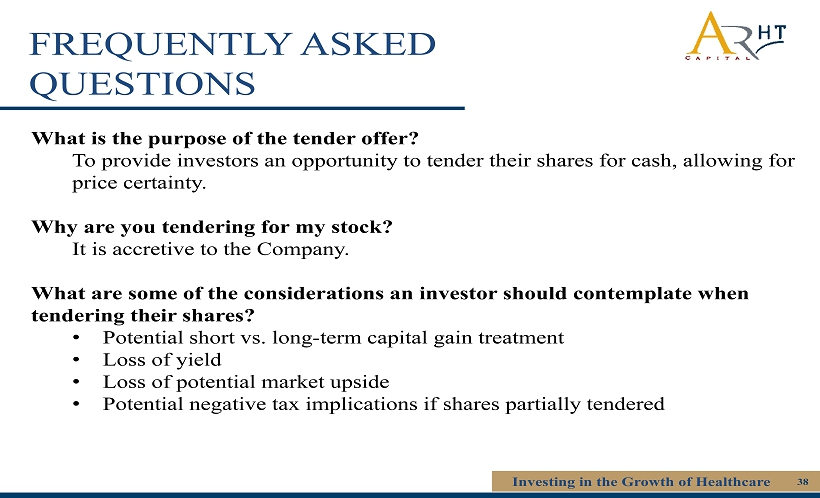
FREQUENTLY ASKED QUESTIONS Investing in the Growth of Healthcare 38 What is the purpose of the tender offer? To provide investors an opportunity to tender their shares for cash, allowing for price certainty. Why are you tendering for my stock? It is accretive to the Company. What are some of the considerations an investor should contemplate when tendering their shares? • Potential short vs. long - te
rm capital gain treatment • Loss of yield • Loss of potential market upside • Potential negative tax implications if shares partially tendered

TENDER OFFER
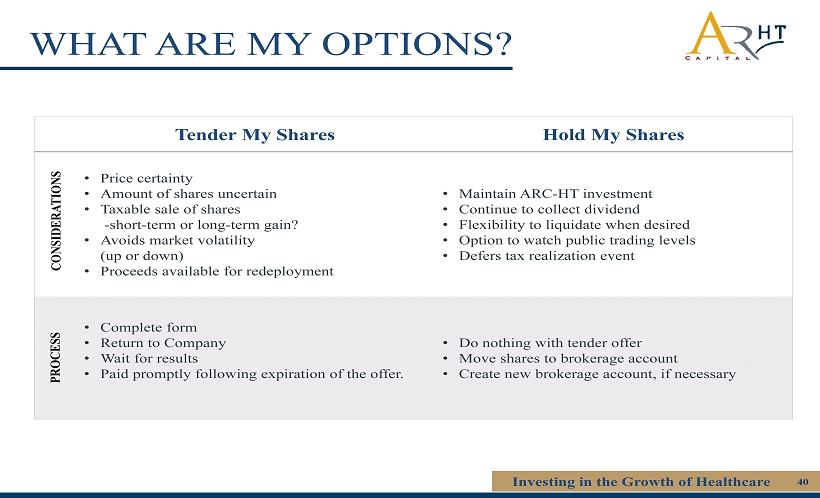
WHAT ARE MY OPTIONS? Investing in the Growth of Healthcare 40 Tender My Shares Hold My Shares • Price certainty • Amount of shares uncertain • Taxable sale of shares - short - term or long - term gain? • Avoids market volatility (up or down) • Proceeds available for redeployment • Maintain ARC - HT investment • Continue to collect dividend • Flexibility to liquidate when desired • Option to watch
public trading levels • Defers tax realization event • Complete form • Return to Company • Wait for results • Paid promptly following expiration of the offer. • Do nothing with tender offer • Move shares to brokerage account • Create new brokerage account, if necessary CONSIDERATIONS PROCESS

ADDITIONAL DISCLOSURE
Investing in the Growth of Healthcare 42 ABOUT THE DATA Funds from operations (FFO) Pursuant to the revised definition of funds from operations adopted by the Board of Governors of the National Association of Rea l Estate Investment Trusts (“NAREIT”), we calculate funds from operations (FFO), by adjusting net income (loss) attributable stockholders (computed in accordance with GAAP, including non - re
curring items) for gains (or losses) from sales of properties, impairment losses on depreciable real estate of consolidated real estate, impairment losses on investments in unc ons olidated joint ventures driven by a measurable decrease in the fair value of depreciable real estate held by the unconsolidated joint ventures, real estate related depreciation and amortization , a nd after adjustment for unconsolidated partnerships and joint ventures. FFO is a non - GAAP financial measure. The use of FFO, combined with the required primary GAAP presentations, has been f undamentally beneficial in improving the understanding of operating results of REITs among the investing public and making comparisons of REIT operating results more meaningful. Ma nag ement generally considers FFO to be a useful measure for reviewing our comparative operating and financial performance because, by excluding gains and losses related to asset sales ( lan d and property), impairment losses and real estate asset depreciation and amortization (which can vary among owners of identical assets in similar condition based on historical cost acc ounting and useful life estimates), FFO can help one compare the operating performance of a company’s real estate between periods or as compared to different companies. Our computation of FF O m ay not be comparable to FFO reported by other REITs or real estate companies that do not define the term in accordance with the current NAREIT definition or that interpret the curr ent NAREIT definition differently. FFO should not be considered as an alternative to net income attributable to stockholders (determined in accordance with GAAP) as an indication of our perfor man ce. FFO does not represent cash generated from operating activities determined in accordance with GAAP, and is not a measure of liquidity or an indicator of our ability to make cash dis tributions. We believe that to further understand our performance, FFO should be compared with our reported net income attributable to stockholders and considered in addition to cash flows det erm ined in accordance with GAAP, as presented in our consolidated financial statements. Adjusted funds from operations (AFFO) AFFO is Core FFO, excluding certain income or expense items that we consider more reflective of investing activities, other n on - cash income and expense items and the income and expense effects of other activities that are not a fundamental attribute of our business plan. These items include unrealized gains a nd losses, which may not ultimately be realized, such as gains or losses on derivative instruments, gains or losses on contingent valuation rights, gains and losses on investments and early extingui shm ent of debt. In addition, by excluding non - cash income and expense items such as amortization of above and below market leases, amortization of deferred financing costs, straight - line ren t and non - cash equity compensation from AFFO we believe we provide useful information regarding income and expense items which have no cash impact and do not provide liquidity to the c omp any or require capital resources of the company. We exclude distributions related to Class B units and certain interest expenses related to securities that are convertible to common sto ck as the shares are assumed to have converted to common stock in our calculation of weighted average common shares - fully diluted. Furthermore we include certain cash inflow and outflows that are r eflective of operating activities including preferred returns on joint ventures, second generation tenant improvement and leasing commissions (included in the period in which the lease comme nce s) and recurring capital expenditures. Although our AFFO may not be comparable to that of other REITs and real estate companies, we believe it provides a meaningful in dicator of our ability to fund cash needs and to make cash distributions to stockholders. In addition, we believe that to further understand our liquidity, AFFO should be compared with ou r cash flows determined in accordance with GAAP, as presented in our consolidated financial statements. AFFO does not represent cash generated from operating activities determined in acco rda nce with GAAP, and AFFO should not be considered as an alternative to net income (determined in accordance with GAAP) as an indication of our performance, as an alternative to net cas h flows from operating activities (determined in accordance with GAAP), or as a measure of our liquidity.
Investing in the Growth of Healthcare 43 ABOUT THE DATA Earnings before interest, taxes, depreciation and amortization (EBITDA) EBITDA is defined as net income in accordance with GAAP before interest, taxes, depreciation and amortization. We believe EBI TDA is an appropriate measure of our ability to incur and service debt. EBITDA should not be considered as an alternative to cash flows from operating
activities, as a measure of our liquidity or as an alternative to net income as an indicator of our operating activities. Other REITs may calculate EBITDA differently and our calculation s hou ld not be compared to that of other REITs. EBITDA is adjusted to include our pro - rata share of EBITDA from unconsolidated joint ventures. Net operating income (NOI) Net operating income (NOI) is a non - GAAP financial measure equal to net income attributable to stockholders, the most directly c omparable GAAP financial measure, less discontinued operations, plus corporate general and administrative expense, acquisition and transaction costs, depreciation a nd amortization and interest expense, income from unconsolidated joint ventures, interest and other income and gains from investments in securities. NOI is adjusted to in clu de our pro - rata share of NOI from unconsolidated joint ventures. We use NOI internally as a performance measure and believe NOI provides useful information to in vestors regarding our financial condition and results of operations because it reflects only those income and expense items that are incurred at the property level. Th ere fore, we believe NOI is a useful measure for evaluating the operating performance of our real estate assets and to make decisions about resource allocations. Further, we bel ieve NOI is useful to investors as a performance measure because, when compared across periods, NOI reflects the impact on operations from trends in occupancy rat es, rental rates, operating costs acquisition activity on an unleveraged basis, providing perspective not immediately apparent from net income. NOI excludes certain compon ent s from net income in order to provide results that are more closely related to a property's results of operations. For example, interest expense is not necessarily li nked to the operating performance of a real estate asset and is often incurred at the corporate level as opposed to the property level. In addition, depreciation and amortizati on, because of historical cost accounting and useful life estimates, may distort operating performance at the property level. NOI presented by us may not be comparable to NOI rep ort ed by other REITs that define NOI differently. We believe that in order to facilitate a clear understanding of our operating results, NOI should be examined in co njunction with net income as presented in our consolidated financial statements. NOI should not be considered as an alternative to net income as an indication of our perfo rma nce or to cash flows as a measure of our liquidity or ability to make distributions.