
Q4 2013 SUPPLEMENTAL INFORMATION

4Q 2013 SUPPLEMENTAL INFORMATION PAGE 2 OF 28 Table of Contents Financial Information Page Financial Summary 3 Balance Sheets 4 Statement of Operations and AFFO 5 Adjusted EBITDA Reconciliation 6 Net Operating Income by Property Type 7 Debt Analysis 8 Debt Summary 9 Debt Expiration Schedule 10 Financial Ratios 11 Portfolio Information Page Portfolio Summary 12 Portfolio Investment/NOI by State 15 Lease Expiration Schedule 17 Portfolio Composition 18 Credit and Tenancy Profile 20 Portfolio Composition by Quarter 21 Acquisition Activity 22 Top Ten Tenant Descriptions 23 Top Senior Housing Operators 25 Definitions 26 The data and other information described in these slides are as of the date of the slides or an earlier date as indicated. Future performance may not be consistent with past performance and is subject to change and inherent risks and uncertainties. This presentation contains certain statements that are American Realty Capital Healthcare Trust’s (“ARC HT”) and its Management’s hopes, intentions, beliefs, expectations, or projections of the future and might be considered to be forward-looking statements under Federal Securities laws. Prospective investors are cautioned that any such forward-looking statements are not guarantees of future performance, and involve risks and uncertainties. ARC HT’s actual future results may differ significantly from the matters discussed in these forward-looking statements, and we may not release revisions to these forward-looking statements to reflect changes after we’ve made the statements. Factors and risks that could cause actual results to differ materially from expectations are disclosed from time to time in greater detail in ARC HT’s filings with the Securities and Exchange Commission including, but not limited to, ARC HT’s report on Form 10-K, Quarterly Report on Form 10-Q, as well as ARC HT’s press releases.
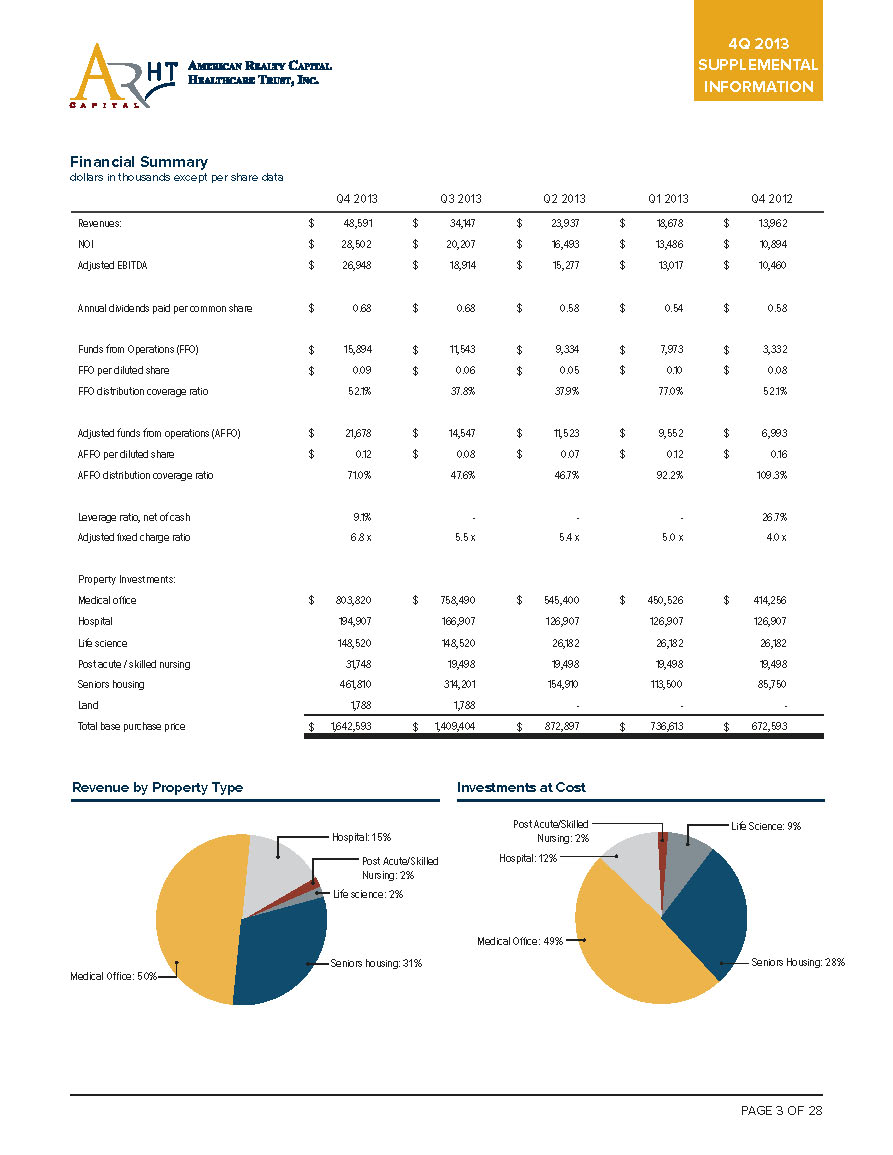
Financial Summary dollars in thousands except per share data Revenue by Property Type Investments at Cost Medical Offi ce: 50% Seniors Housing: 28% Post Acute/Skilled Nursing: 2% Seniors housing: 31% Medical Offi ce: 49% Hospital: 15% Life science: 2% Hospital: 12% Post Acute/Skilled Nursing: 2% Life Science: 9% Q4 2013 Q3 2013 Q2 2013 Q1 2013 Q4 2012 Revenues: 48,591 34,147 23,937 18,678 13,962 NOI 28,502 20,207 16,493 13,486 10,894 Adjusted EBITDA 26,948 18,914 15,277 13,017 10,460 Annual dividends paid per common share 0.68 0.68 0.58 0.54 0.58 Funds from Operations (FFO) 15,894 11,543 9,334 7,973 3,332 FFO per diluted share 0.09 0.06 0.05 0.10 0.08 FFO distribution coverage ratio 52.1% 37.8% 37.9% 77.0% 52.1% Adjusted funds from operations (AFFO) 21,678 14,547 11,523 9,552 6,993 AFFO per diluted share 0.12 0.08 0.07 0.12 0.16 AFFO distribution coverage ratio 71.0% 47.6% 46.7% 92.2% 109.3% Leverage ratio, net of cash 9.1% - - - 26.7% Adjusted fi xed charge ratio 6.8 x 5.5 x 5.4 x 5.0 x 4.0 x Property Investments: Medical offi ce 803,820 758,490 545,400 450,526 414,256 Hospital 194,907 166,907 126,907 126,907 126,907 Life science 148,520 148,520 26,182 26,182 26,182 Post acute / skilled nursing 31,748 19,498 19,498 19,498 19,498 Seniors housing 461,810 314,201 154,910 113,500 85,750 Land 1,788 1,788 - - - Total base purchase price 1,642,593 1,409,404 872,897 736,613 672,593 $ $ $ $ $ $ $ $ $ $ $ $ $ $ $ $ $ $ $ $

4Q 2013 SUPPLEMENTAL INFORMATION Balance Sheet dollars in thousands except per share data Q4 2013 Q3 2013 Q2 2013 Q1 2013 Q4 2012 Assets Real estate investments, at cost Land 107,719 112,766 60,086 51,445 48,409 Buildings, fixtures and improvements 1,363,858 1,147,659 719,065 606,692 552,085 Construction in progress 11,112 4,819 - - - Acquired intangible lease assets 181,264 158,804 97,658 81,813 77,095 Total real estate investments, at cost 1,663,953 1,424,048 876,809 739,950 677,589 Less: accumulated depreciation and amortization (87,350) (61,156) (43,780) (30,869) (21,262) Total real estate investments, net 1,576,603 1,362,892 833,029 709,081 656,327 Cash and cash equivalents 103,447 308,911 852,240 424,931 13,869 Restricted cash 1,381 1,244 365 309 127 Investment securities, at fair value 14,670 16,584 17,981 - - Receivable for sale of stock - - 127 44,972 6,943 Prepaid expenses and other assets 17,431 19,445 13,741 9,169 5,826 Due to affiliate - 4,670 - 270 190 Deferred costs, net 21,041 21,887 6,997 7,189 7,386 Total assets 1,734,573 1,735,633 1,724,480 1,195,921 690,668 Liabilities And Equity Mortgage notes payable 259,348 239,067 215,784 215,846 200,095 Mortgage premium and discount, net 2,769 3,002 2,875 3,064 2,903 Credit facility - - - - 26,000 Notes payable - - - - 2,500 Below-market lease liabilities, net 5,543 5,742 2,192 1,796 1,692 Derivatives, at fair value 333 376 300 598 643 Accounts payable and accrued expenses 17,460 14,413 9,593 10,819 5,669 Deferred rent and other liabilities 2,949 2,310 826 1,182 917 Distributions payable 10,427 9,997 9,913 5,603 2,962 Total liabilities 298,829 274,907 241,483 238,908 243,381 Common stock 1,805 1,788 1,771 1,145 556 Additional paid in capital 1,591,941 1,576,011 1,560,226 1,001,901 476,157 Accumulated other comprehensive loss (3,243) (3,241) (1,285) (598) (643) Accumulated deficit (158,378) (117,649) (81,610) (49,420) (32,832) Total stockholders' equity 1,432,125 1,456,909 1,479,102 953,028 443,238 Non-controlling interests 3,619 3,817 3,895 3,985 4,049 Total equity 1,435,744 1,460,726 1,482,997 957,013 447,287 Total liabilities and equity 1,734,573 1,735,633 1,724,480 1,195,921 690,668 $ $ $ $ $ $ $ $ $ $ $ $ $ $ $ $ $ $ $ $

Statement of Operations and AFFO dollars in thousands except per share data Q4 2013 Q3 2013 Q2 2013 Q1 2013 Q4 2012 Revenues: Rental income 41,597 29,285 20,885 15,987 11,930 Operating expense reimbursement 3,626 2,859 2,474 2,189 1,867 Resident services and fee income 3,368 2,003 578 502 165 Total revenues 48,591 34,147 23,937 18,678 13,962 Operating expenses: Property operating 20,089 13,940 7,444 5,192 3,068 Net operating income 28,502 20,207 16,493 13,486 10,894 Acquisition and transaction related 5,748 3,107 2,713 2,038 4,153 General and administrative 1,686 1,429 1,250 249 215 Depreciation and amortization 25,908 17,140 12,714 11,694 7,148 Operating income (loss) (4,840) (1,469) (184) (495) (622) Other income (expenses) Interest expense (5,089) (4,350) (3,315) (3,089) (3,064) Income from investments 308 317 244 - - Other Income 41 37 11 - 2 Gain (loss) on investments (300) - - - - Total other expense (5,040) (3,996) (3,060) (3,089) (3,062) Net loss (9,880) (5,465) (3,244) (3,584) (3,684) Net loss attributable to non-controlling interests (12) (10) (14) (22) (10) Net loss attributable to stockholders (9,892) (5,475) (3,258) (3,606) (3,694) Basic weighted average shares outstanding 179,929,602 178,231,121 170,124,871 77,029,025 43,990,171 Basic net loss per share attributable to stockholders (0.05) (0.03) (0.02) (0.05) (0.08) Funds from operations: Net loss (9,892) (5,475) (3,258) (3,606) (3,694) Depreciation and amortization 25,907 17,140 12,714 11,694 7,149 Proportionate share of adjustments related to non-controlling interests (121) (122) (122) (115) (123) Funds from operations: 15,894 11,543 9,334 7,973 3,332 Acquisition fees and expenses 5,748 3,107 2,713 2,038 4,153 Amortization of above-market lease assets and liabilities 98 160 119 67 70 Straight-line rent (1,851) (1,357) (1,174) (1,026) (962) Accretion of discount/amortization (233) (226) (188) (179) (183) Deferred financing costs 1,520 1,209 637 617 538 Non-cash stock compensation 68 13 11 9 9 Loss on sale of investments 300 - - - - Distributions on Class B units 103 63 37 17 - Proportionate share of adjustments related to non-controlling interests 31 35 34 36 36 Adjusted funds from operations (AFFO) 21,678 14,547 11,523 9,552 6,993 Diluted weighted average shares outstanding 180,545,924 178,620,686 170,356,832 77,147,958 44,018,184 Dividends declared 30,834 30,572 28,930 12,976 7,566 Distributions paid in cash 13,865 13,960 11,663 5,494 3,479 Distributions reinvested 16,537 16,519 12,954 4,847 2,918 Distributions on unvested shares 6 3 3 - - Distributions on Class B units 103 63 37 17 - Total distributions 30,511 30,545 24,657 10,358 6,397 FFO per diluted share 0.09 0.06 0.05 0.10 0.08 FFO coverage ratio - declared 51.5% 37.8% 32.3% 61.4% 44.0% FFO coverage ratio - paid 52.1% 37.8% 37.9% 77.0% 52.1% FFO payout ratio - paid 192.0% 264.6% 264.2% 129.9% 192.0% AFFO per diluted share 0.12 0.08 0.07 0.12 0.16 AFFO coverage ratio - declared 70.3% 47.6% 39.8% 73.6% 92.4% AFFO coverage ratio - paid 71.0% 47.6% 46.7% 92.2% 109.3% AFFO payout ratio - paid 140.7% 210.0% 214.0% 108.4% 91.5% $ $ $ $ $ $ $ $ $ $ $ $ $ $ $ $ $ $ $ $ $ $ $ $ $ $ $ $ $ $ $ $ $ $ $ $ $ $ $ $ $ $ $ $ $ $ $ $ $ $
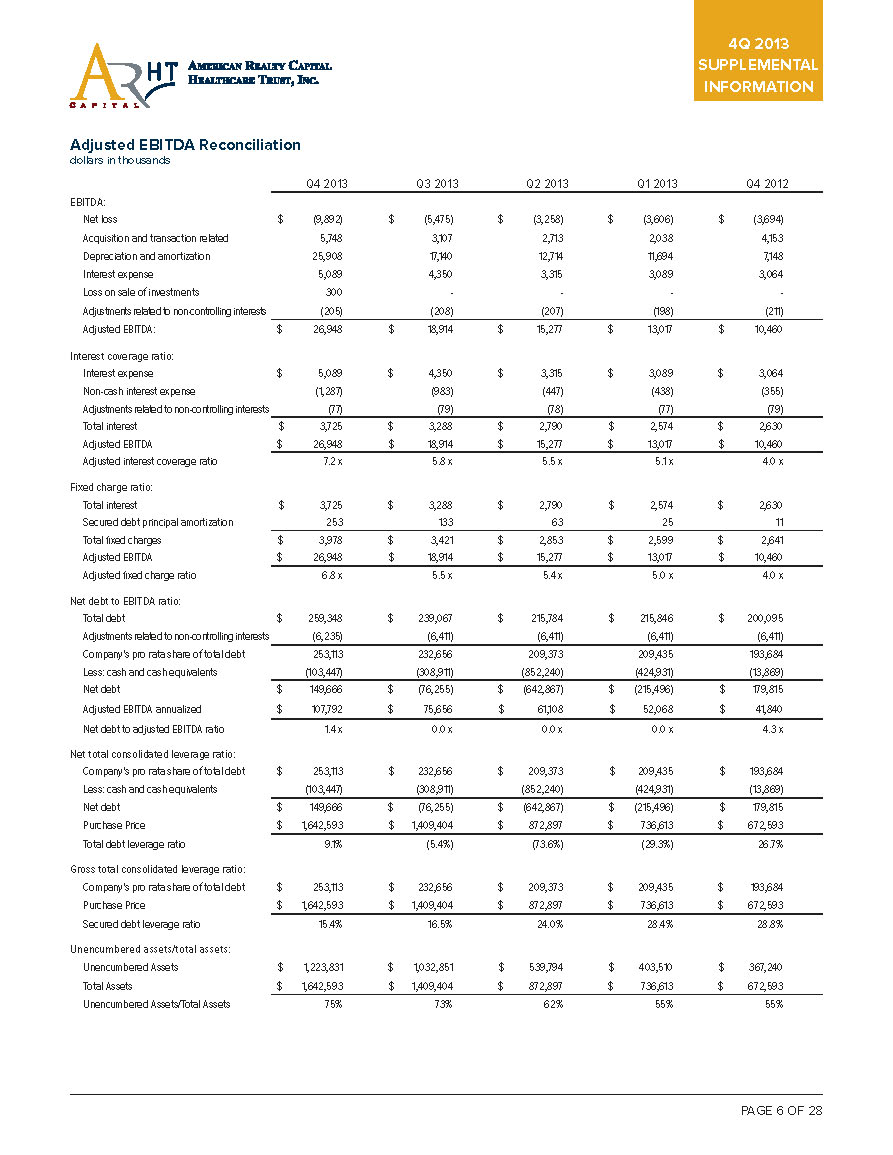
4Q 2013 SUPPLEMENTAL INFORMATION Adjusted EBITDA Reconciliation dollars in thousands Q4 2013 Q3 2013 Q2 2013 Q1 2013 Q4 2012 EBITDA: Net loss $ (9,892) $ (5,475) $ (3,258) $ (3,606) $ (3,694) Acquisition and transaction related 5,748 3,107 2,713 2,038 4,153 Depreciation and amortization 25,908 17,140 12,714 11,694 7,148 Interest expense 5,089 4,350 3,315 3,089 3,064 Loss on sale of investments 300 - - - - Adjustments related to non-controlling interests (205) (208) (207) (198) (211) Adjusted EBITDA: $ 26,948 $ 18,914 $ 15,277 $ 13,017 $ 10,460 Interest coverage ratio: Interest expense $ 5,089 $ 4,350 $ 3,315 $ 3,089 $ 3,064 Non-cash interest expense (1,287) (983) (447) (438) (355) Adjustments related to non-controlling interests (77) (79) (78) (77) (79) Total interest $ 3,725 $ 3,288 $ 2,790 $ 2,574 $ 2,630 Adjusted EBITDA $ 26,948 $ 18,914 $ 15,277 $ 13,017 $ 10,460 Adjusted interest coverage ratio 7.2 x 5.8 x 5.5 x 5.1 x 4.0 x Fixed charge ratio: Total interest $ 3,725 $ 3,288 $ 2,790 $ 2,574 $ 2,630 Secured debt principal amortization 253 133 63 25 11 Total fixed charges $ 3,978 $ 3,421 $ 2,853 $ 2,599 $ 2,641 Adjusted EBITDA $ 26,948 $ 18,914 $ 15,277 $ 13,017 $ 10,460 Adjusted fixed charge ratio 6.8 x 5.5 x 5.4 x 5.0 x 4.0 x Net debt to EBITDA ratio: Total debt $ 259,348 $ 239,067 $ 215,784 $ 215,846 $ 200,095 Adjustments related to non-controlling interests (6,235) (6,411) (6,411) (6,411) (6,411) Company's pro rata share of total debt 253,113 232,656 209,373 209,435 193,684 Less: cash and cash equivalents (103,447) (308,911) (852,240) (424,931) (13,869) Net debt $ 149,666 $ (76,255) $ (642,867) $ (215,496) $ 179,815 Adjusted EBITDA annualized $ 107,792 $ 75,656 $ 61,108 $ 52,068 $ 41,840 Net debt to adjusted EBITDA ratio 1.4 x 0.0 x 0.0 x 0.0 x 4.3 x Net total consolidated leverage ratio: Company's pro rata share of total debt $ 253,113 $ 232,656 $ 209,373 $ 209,435 $ 193,684 Less: cash and cash equivalents (103,447) (308,911) (852,240) (424,931) (13,869) Net debt $ 149,666 $ (76,255) $ (642,867) $ (215,496) $ 179,815 Purchase Price $ 1,642,593 $ 1,409,404 $ 872,897 $ 736,613 $ 672,593 Total debt leverage ratio 9.1% (5.4%) (73.6%) (29.3%) 26.7% Gross total consolidated leverage ratio: Company's pro rata share of total debt $ 253,113 $ 232,656 $ 209,373 $ 209,435 $ 193,684 Purchase Price $ 1,642,593 $ 1,409,404 $ 872,897 $ 736,613 $ 672,593 Secured debt leverage ratio 15.4% 16.5% 24.0% 28.4% 28.8% Unencumbered assets/total assets: Unencumbered Assets $ 1,223,831 $ 1,032,851 $ 539,794 $ 403,510 $ 367,240 Total Assets $ 1,642,593 $ 1,409,404 $ 872,897 $ 736,613 $ 672,593 Unencumbered Assets/Total Assets 75% 73% 62% 55% 55%
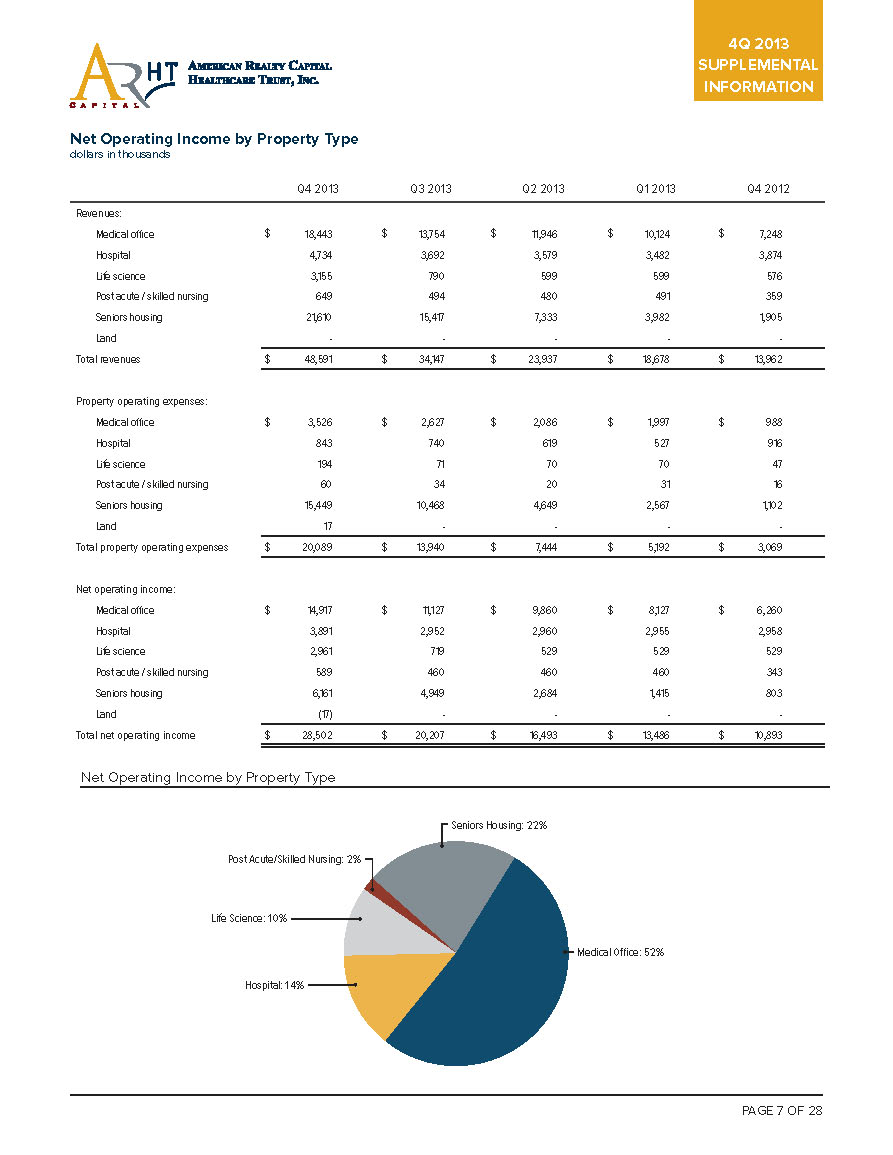
Q4 2013 Q3 2013 Q2 2013 Q1 2013 Q4 2012 Revenues: Medical offi ce 18,443 13,754 11,946 10,124 7,248 Hospital 4,734 3,692 3,579 3,482 3,874 Life science 3,155 790 599 599 576 Post acute / skilled nursing 649 494 480 491 359 Seniors housing 21,610 15,417 7,333 3,982 1,905 Land - - - - - Total revenues 48,591 34,147 23,937 18,678 13,962 Property operating expenses: Medical offi ce 3,526 2,627 2,086 1,997 988 Hospital 843 740 619 527 916 Life science 194 71 70 70 47 Post acute / skilled nursing 60 34 20 31 16 Seniors housing 15,449 10,468 4,649 2,567 1,102 Land 17 - - - - Total property operating expenses 20,089 13,940 7,444 5,192 3,069 Net operating income: Medical offi ce 14,917 11,127 9,860 8,127 6,260 Hospital 3,891 2,952 2,960 2,955 2,958 Life science 2,961 719 529 529 529 Post acute / skilled nursing 589 460 460 460 343 Seniors housing 6,161 4,949 2,684 1,415 803 Land (17) - - - - Total net operating income 28,502 20,207 16,493 13,486 10,893 Net Operating Income by Property Type Medical Offi ce: 52% Seniors Housing: 22% Hospital: 14% Life Science: 10% Post Acute/Skilled Nursing: 2% Net Operating Income by Property Type

4Q 2013 SUPPLEMENTAL INFORMATION Debt Analysis dollars in thousands Debt Maturities and Principal Payments (as of December 31, 2013) Credit Facility and Variable Rate Term Loans Senior Notes Mortgage Debt Total Debt Period Amount Rate Amount Rate Amount Rate Amount Rate 2014 $ - - $ - - $ 1,038 5.48% $ 1,038 5.48% 2015 - - - - 113,975 5.11% 113,975 5.11% 2016 - - - - 20,545 4.23% 20,545 4.23% 2017 - - - - 75,041 5.09% 75,041 5.09% 2018 - - - - 27,346 5.38% 27,346 5.38% 2019 - - - - 7,828 5.30% 7,828 5.30% 2020 - - - - 406 6.00% 406 6.00% 2021 - - - - 433 6.01% 433 6.01% 2022 - - - - 10,785 5.20% 10,785 5.20% 2023 - - - - 183 7.48% 183 7.48% 2024 & Thereafter - - - - 1,768 7.48% 1,768 7.48% Subtotal $ - - $ - - $ 259,348 5.09% $ 259,348 5.09% Total $ - $ - $ 259,348 $ 259,348 Weighted average maturity in years - - 3.1 Years 3.1 Years Debt Composition (as of December 31, 2013) Amount Rate % of Total Fixed rate debt Senior notes - - - Mortgage debt 259,348 5.09% 100.0% Total fixed rate debt $ 259,348 5.09% 100.0% Variable rate debt Credit facility - - - Mortgage debt - - - Total variable rate debt - - - Total debt $ 259,348 5.09% 100.0%

4Q 2013 SUPPLEMENTAL INFORMATION PAGE 9 OF 28 Debt Summary dollars in thousands Encumbered Property Lender Maturity Coupon Interest Rate Effective Interest Rate Interest Payment Original Mortgage Current Mortgage Percent Maturity Year Interest Rate (Fixed, Variable) Texarkana ASC - TX Guaranty Bond Bank 6/21/2016 5.50% 5.58% $ 120 $ 2,250 $ 2,143 0.8% 2016 FIXED Carson Tahoe - Specialty Medical Center GE Capital 9/18/2015 5.01% 5.08% 1,105 21,751 21,751 8.4% 2015 FIXED Durango Medical Plaza - Las Vegas NV GE Capital 9/18/2015 5.01% 5.08% 872 17,172 17,172 6.6% 2015 FIXED CareMeridian Rehab - Phoenix AZ GE Capital 9/18/2015 5.01% 5.08% 352 6,936 6,936 2.7% 2015 FIXED Reliant Rehab - Dallas TX GE Capital 9/18/2015 5.08% 5.15% 1,281 24,850 24,850 9.6% 2015 FIXED Select Rehabilitation - San Antonio TX GE Capital 9/18/2015 5.08% 5.15% 655 12,714 12,714 4.9% 2015 FIXED Spring Creek Medical Plaza - Tomball TX GE Capital 9/18/2015 5.08% 5.15% 385 7,477 7,477 2.9% 2015 FIXED Odessa Regional MOB - Odessa TX Regions 12/15/2016 4.03% 4.09% 165 4,047 4,047 1.6% 2016 FIXED Methodist North MOB - Peoria IL Regions 12/15/2016 3.93% 3.99% 540 13,544 13,544 5.2% 2016 FIXED Univ of Wisconsin Health - Monona WI Aviva Life and Annuity 4/5/2017 4.00% 4.00% 202 5,039 5,039 1.9% 2017 FIXED Reliant Rehab - Houston TX GE Capital 9/18/2015 4.92% 4.98% 670 13,437 13,437 5.2% 2015 FIXED Village Healthcare Center - Santa Ana CA GE Capital 9/18/2015 4.92% 4.98% 95 1,906 1,906 0.7% 2015 FIXED Sisters of Mercy Building - Springfield MO UBS 9/6/2017 4.05% 4.11% 226 5,500 5,500 2.1% 2017 FIXED East Pointe Medical Plaza - Lehigh Acres FL UBS 9/6/2017 4.05% 4.11% 216 5,260 5,260 2.0% 2017 FIXED Unitron Hearing - Plymouth MN UBS 9/6/2017 4.05% 4.11% 164 4,000 4,000 1.5% 2017 FIXED Carson Tahoe MOB West - Carson City NV Regions 6/7/2017 3.83% 3.88% 182 4,675 4,675 1.8% 2017 FIXED Aurora Health Care - Two Rivers WI Goldman Sachs 1/1/2017 5.52% 5.60% 1,267 22,640 22,640 8.7% 2017 FIXED Aurora Health Care - Hartford WI Goldman Sachs 1/1/2017 5.52% 5.60% 1,070 19,120 19,120 7.4% 2017 FIXED Aurora Health Care - Neenah WI Goldman Sachs 1/1/2017 5.52% 5.60% 439 7,840 7,840 3.0% 2017 FIXED Princeton Village - Clackamas OR Oregon Housing 1/31/2031 7.38% 7.48% 233 3,181 3,114 1.2% 2031 FIXED Pelican Pointe - Klamath Falls Red Mortgage Capital, LLC 4/1/2022 5.09% 5.16% 643 12,595 12,462 4.8% 2022 FIXED Fayette MOB - Fayetteville GA U.S. Bank National Association 9/8/2015 5.11% 5.18% 362 7,054 6,986 2.7% 2015 FIXED Garden House - Anderson SC Grandbridge Real Estate 12/1/2018 4.79% 4.86% 396 8,203 8,148 3.1% 2018 FIXED Benton House of Covington Grandbridge Real Estate 5/1/2019 5.19% 5.26% 427 8,160 8,120 3.1% 2019 FIXED Arbor Terrace - Asheville NC Oak Grove Commercial Mortgage, LLC 2/1/2018 5.50% 5.58% 530 9,528 9,497 3.7% 2018 FIXED Arbor Terrace - Decatur GA Oak Grove Commercial Mortgage, LLC 1/1/2018 5.49% 5.57% 611 11,006 10,970 4.2% 2018 FIXED 3.1 Years 5.09% $ 13,207 $ 259,885 $ 259,348 100.0%

4Q 2013 SUPPLEMENTAL INFORMATION Debt Expiration Schedule dollars in thousands $120,000 $113,975 $100,000 $80,000 $75,041 $60,000 $40,000 $27,346 $20,545 $20,000 $10,785 $7,828 $1,767 $183 $1,038 $406 $433 $0 2024 & Thereafter 2014 2015 2016 2017 2018 2019 2020 2021 2023 2022

4Q 2013 SUPPLEMENTAL INFORMATION Financial Ratios Net Indebtedness / Base Purchase Price Secured Debt / Base Purchase Price Notes payable minus cash divided base purchase price of properties Secured notes divided base purchase price of properties 35% 35% 30% 30% 30.97% 29% 28% 25% 25% 24% 20% 20% 15% 15% 17% 15% 10% 10% 9.11% 5% 5% 0% 0% 0% 0% 0% Q1 2013 Q2 2013 Q22013 Q4 2013 Q3 2013 Q3 2013 Q4 2013 Q4 2012 Q4 2012 Q1 2013 Unsecured Debt / Unencumbered Base Purchase Price Fixed Charge Coverage Unsecured debt divided base purchase price of unencumbered properties EBITDA divided by interest and principal payments on secured debt 7.5 x 10% 6.8 x 6.5 x 8% 8% 5.5 x 6% 5.5 x 5.4 x 5.0 x 4.5 x 4% 4.0 x 3.5 x 2% 2.5 x 0% 0% 0% 0% 1.5 x 0% Q4 2012 Q1 2013 Q2 2013 Q3 2013 Q4 2013 Q4 2012 Q1 2013 Q2 2013 Q3 2013 Q4 2013
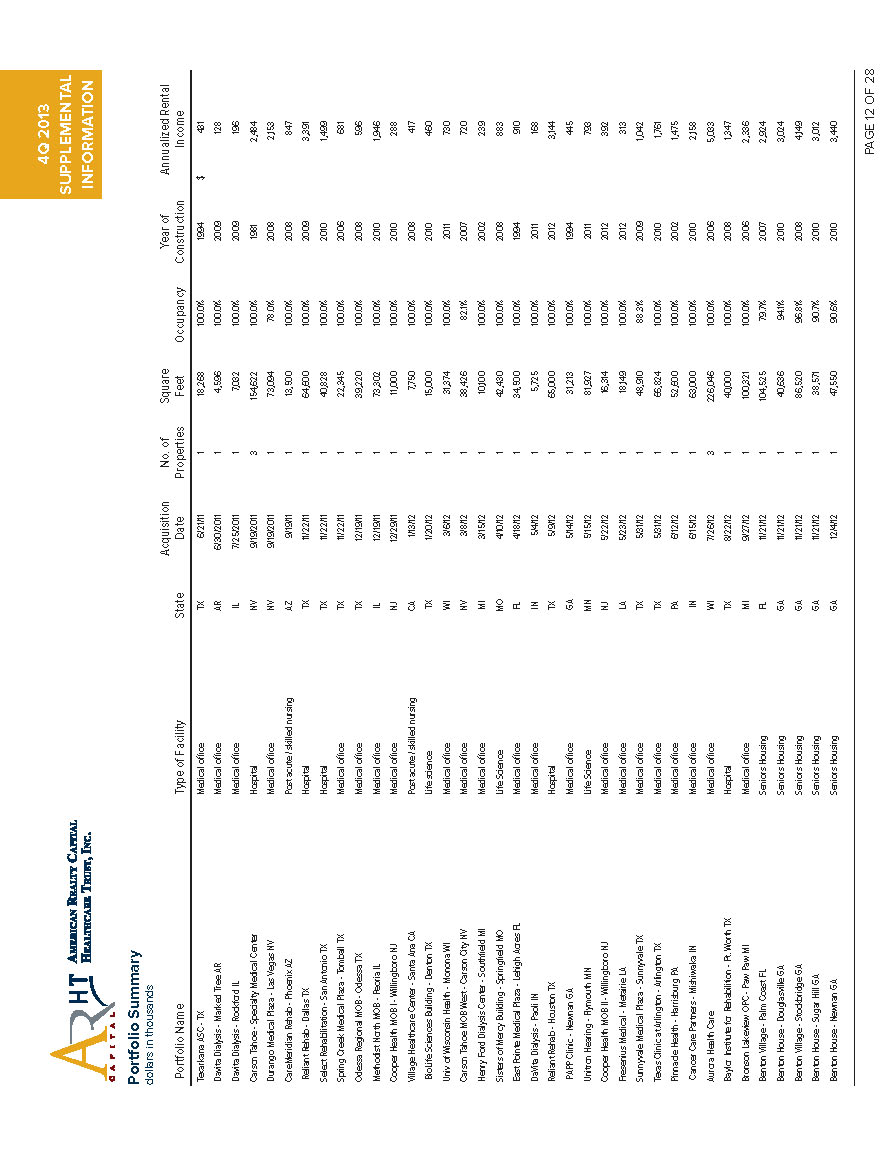
4Q 2013 SUPPLEMENTAL INFORMATION Portfolio Summary dollars in thousands Portfolio Name Type of Facility State Acquisition Date No. of Properties Square Feet Occupancy Year of Construction Annualized Rental Income Texarkana ASC - TX Medical office TX 6/21/11 1 18,268 100.0% 1994 $ 431 Davita Dialysis - Marked Tree AR Medical office AR 6/30/2011 1 4,596 100.0% 2009 128 Davita Dialysis - Rockford IL Medical office IL 7/25/2011 1 7,032 100.0% 2009 196 Carson Tahoe - Specialty Medical Center Hospital NV 9/19/2011 3 154,622 100.0% 1981 2,484 Durango Medical Plaza - Las Vegas NV Medical office NV 9/19/2011 1 73,094 78.0% 2008 2,153 CareMeridian Rehab - Phoenix AZ Post acute / skilled nursing AZ 9/19/11 1 13,500 100.0% 2008 847 Reliant Rehab - Dallas TX Hospital TX 11/22/11 1 64,600 100.0% 2009 3,391 Select Rehabilitation - San Antonio TX Hospital TX 11/22/11 1 40,828 100.0% 2010 1,499 Spring Creek Medical Plaza - Tomball TX Medical office TX 11/22/11 1 22,345 100.0% 2006 681 Odessa Regional MOB - Odessa TX Medical office TX 12/19/11 1 39,220 100.0% 2008 596 Methodist North MOB - Peoria IL Medical office IL 12/19/11 1 73,302 100.0% 2010 1,946 Cooper Health MOB I - Willingboro NJ Medical office NJ 12/29/11 1 11,000 100.0% 2010 288 Village Healthcare Center - Santa Ana CA Post acute / skilled nursing CA 1/13/12 1 7,750 100.0% 2008 417 BioLife Sciences Building - Denton TX Life science TX 1/20/12 1 15,000 100.0% 2010 460 Univ of Wisconsin Health - Monona WI Medical office WI 3/6/12 1 31,374 100.0% 2011 730 Carson Tahoe MOB West - Carson City NV Medical office NV 3/8/12 1 38,426 82.1% 2007 720 Henry Ford Dialysis Center - Southfield MI Medical office MI 3/15/12 1 10,100 100.0% 2002 239 Sisters of Mercy Building - Springfield MO Life Science MO 4/10/12 1 42,430 100.0% 2008 883 East Pointe Medical Plaza - Lehigh Acres FL Medical office FL 4/18/12 1 34,500 100.0% 1994 910 DaVita Dialysis - Paoli IN Medical office IN 5/4/12 1 5,725 100.0% 2011 168 Reliant Rehab - Houston TX Hospital TX 5/9/12 1 65,000 100.0% 2012 3,144 PAPP Clinic - Newnan GA Medical office GA 5/14/12 1 31,213 100.0% 1994 445 Unitron Hearing - Plymouth MN Life Science MN 5/15/12 1 81,927 100.0% 2011 793 Cooper Health MOB II - Willingboro NJ Medical office NJ 5/22/12 1 16,314 100.0% 2012 392 Fresenius Medical - Metairie LA Medical office LA 5/23/12 1 18,149 100.0% 2012 313 Sunnyvale Medical Plaza - Sunnyvale TX Medical office TX 5/31/12 1 48,910 88.3% 2009 1,042 Texas Clinic at Arlington - Arlington TX Medical office TX 5/31/12 1 66,824 100.0% 2010 1,761 Pinnacle Health - Harrisburg PA Medical office PA 6/12/12 1 52,600 100.0% 2002 1,475 Cancer Care Partners - Mishiwaka IN Medical office IN 6/15/12 1 63,000 100.0% 2010 2,158 Aurora Health Care Medical office WI 7/26/12 3 226,046 100.0% 2006 5,033 Baylor Institute for Rehabilition - Ft. Worth TX Hospital TX 8/22/12 1 40,000 100.0% 2008 1,347 Bronson Lakeview OPC - Paw Paw MI Medical office MI 9/27/12 1 100,321 100.0% 2006 2,336 Benton Village - Palm Coast FL Seniors Housing FL 11/21/12 1 104,525 79.7% 2007 2,924 Benton House - Douglasville GA Seniors Housing GA 11/21/12 1 40,636 94.1% 2010 3,024 Benton Village - Stockbridge GA Seniors Housing GA 11/21/12 1 86,520 96.8% 2008 4,149 Benton House - Sugar Hill GA Seniors Housing GA 11/21/12 1 38,571 90.7% 2010 3,012 Benton House - Newnan GA Seniors Housing GA 12/4/12 1 47,550 90.6% 2010 3,440

4Q 2013 SUPPLEMENTAL INFORMATION Portfolio Summary, continued dollars in thousands Portfolio Name Type of Facility State Acquisition Date No. of Properties Square Feet Occupancy Year of Construction Annualized Rental Income Advocate Beverly Center - Chicago IL Medical office IL 11/28/12 1 59,345 100.0% 1986 $ 1,315 Rush Copley POB I - Aurora IL Medical office IL 11/29/12 1 79,344 100.0% 1996 2,078 CareMeridian - La Mesa CA Post acute / skilled nursing CA 12/14/12 1 9,000 100.0% 2012 575 Wellmont Blue Ridge MOB - Bristol TN Medical office TN 12/27/12 1 23,277 100.0% 2001 361 Albany Medical Center MOB - Albany NY Medical office NY 12/28/12 1 53,229 100.0% 2010 1,105 Michiana Oncology - Mishawaka IN Medical office IN 12/28/12 1 49,410 100.0% 2010 1,686 Metro Health - Wyoming MI Medical office MI 12/28/12 1 21,502 100.0% 2008 555 Rush Copley POB II - Aurora IL Medical office IL 12/28/12 1 80,744 92.1% 2009 2,050 North Valley Orthopedic Surgery Center Medical office AZ 12/31/12 1 17,608 100.0% 2006 790 Scott & White Healthcare - Kingsland TX Medical office TX 2/21/13 1 14,974 100.0% 2012 357 Salem Medical - Woodstown NJ Medical office NJ 3/1/13 1 9,350 100.0% 2010 322 Northside East Cobb Medical office GA 3/22/13 3 68,447 99.1% 1991 1,938 Rex Wellness Center - Garner NC Medical office NC 3/27/13 1 30,000 100.0% 2003 925 Princeton Village - Clackamas OR Seniors Housing OR 3/28/13 1 39,450 98.1% 1999 2,051 Pelican Pointe - Klamath Falls Seniors Housing OR 3/28/13 1 61,045 99.1% 2011 4,860 Lakeview Terrace - Lake Havasu AZ Seniors Housing AZ 4/3/13 1 25,971 100.0% 2009 803 Crystal Lakes Medical Arts - Crystal Lake IL Medical office IL 4/30/13 1 62,588 92.6% 2007 1,494 St. Francis Cancer Center - Midlothian VA Medical office VA 5/2/13 1 51,183 96.9% 2006 1,386 Advocate Good Shepard - Crystal Lake IL Medical office IL 5/2/13 1 68,318 58.3% 2008 1,029 Dakota Ridge - Littleton CO Medical office CO 5/2/13 1 62,202 52.0% 2007 807 Pheasant Pointe - Molalla OR Seniors Housing OR 5/3/13 1 39,428 91.2% 1998 2,228 Cedar Village - Salem OR Seniors Housing OR 5/3/13 1 51,585 92.0% 1999 3,156 Ocean Ridge - Coos Bay OR Seniors Housing OR 5/3/13 1 68,139 92.6% 2006 2,874 Spectrum Health - Wyoming MI Medical office MI 5/15/13 1 52,898 100.0% 2006 1,293 Memorial Hermann - Houston TX Medical office TX 6/4/13 1 30,000 100.0% 2012 945 UC Davis Medical - Folsom CA Medical office CA 6/17/13 2 36,911 100.0% 1995 929 Wyndcrest - Rochester IL Seniors Housing IL 7/1/13 1 35,059 83.8% 2005 1,269 Fayette MOB - Fayetteville GA Medical office GA 7/16/13 1 62,016 100.0% 2004 1,364 Garden House - Anderson SC Seniors Housing SC 7/26/13 1 50,144 90.6% 2000 3,014 Arbor Terrace - Athens GA Seniors Housing GA 7/31/13 1 38,380 100.0% 1998 4,063 Arbor Terrace at Cascade - Atlanta GA Seniors Housing GA 7/31/13 1 40,547 91.2% 1999 3,574 Arbor Terrace - Decatur GA (Land)* Land GA 7/31/13 - - - N/A - Arbor Terrace - Largo FL (Tampa) Seniors Housing FL 7/30/13 1 57,844 90.5% 1992 3,509 Arbor - Terrace of Knoxville Seniors Housing TN 7/31/13 1 58,113 88.1% 1997 4,330 Barrington Terrace - Fort Myers FL Seniors Housing FL 7/31/13 1 54,307 92.3% 2001 5,394 Barrington Terrace - Naples FL Seniors Housing FL 7/31/13 1 58,169 87.5% 2004 5,387
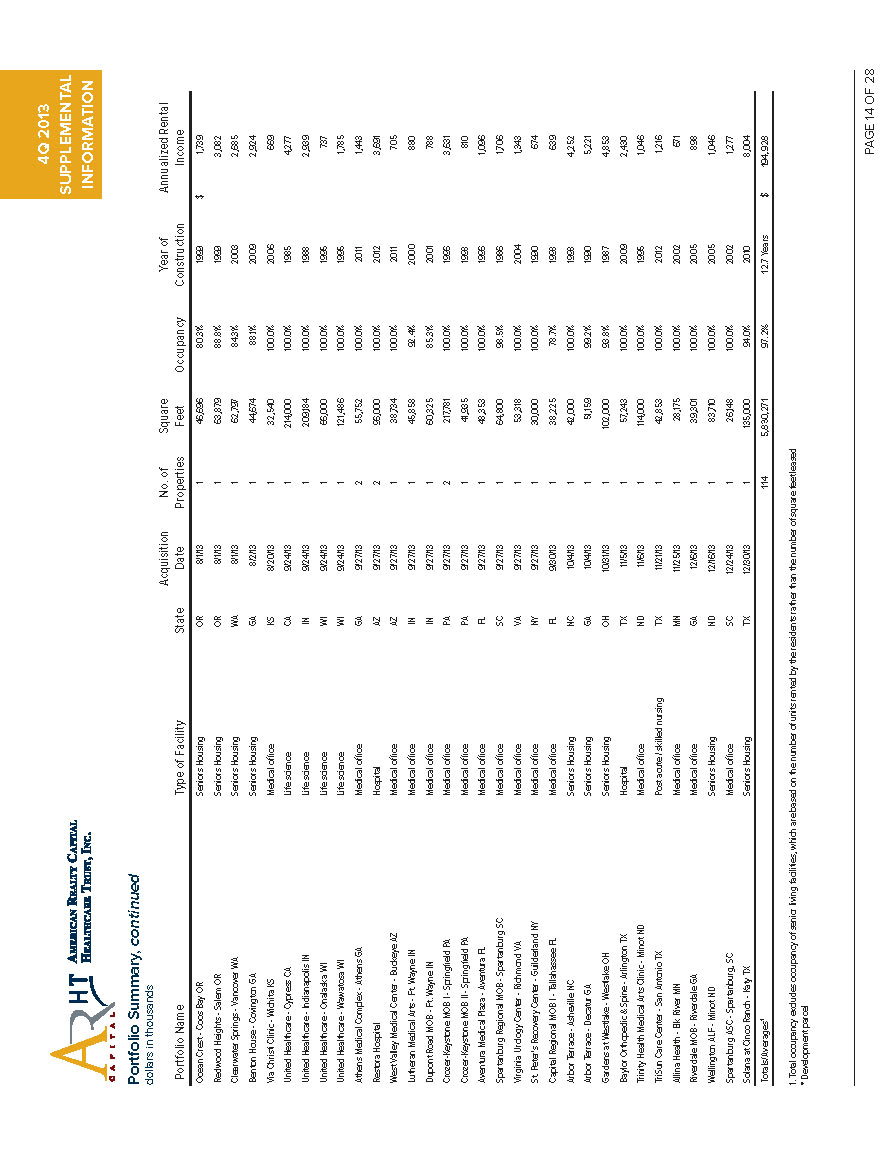
4Q 2013 SUPPLEMENTAL INFORMATION Portfolio Summary, continued dollars in thousands Portfolio Name Type of Facility State Acquisition Date No. of Properties Square Feet Occupancy Year of Construction Annualized Rental Income Ocean Crest - Coos Bay OR Seniors Housing OR 8/1/13 1 46,696 80.3% 1999 $ 1,739 Redwood Heights - Salem OR Seniors Housing OR 8/1/13 1 63,879 88.8% 1999 3,082 Clearwater Springs - Vancover WA Seniors Housing WA 8/1/13 1 62,797 84.3% 2003 2,685 Benton House - Covington GA Seniors Housing GA 8/2/13 1 44,674 88.1% 2009 2,924 Via Christi Clinic - Wichita KS Medical office KS 8/20/13 1 32,540 100.0% 2006 669 United Healthcare - Cypress CA Life science CA 9/24/13 1 214,000 100.0% 1985 4,277 United Healthcare - Indianapolis IN Life science IN 9/24/13 1 209,184 100.0% 1988 2,939 United Healthcare - Onalaska WI Life science WI 9/24/13 1 66,000 100.0% 1995 737 United Healthcare - Wawatosa WI Life science WI 9/24/13 1 121,486 100.0% 1995 1,785 Athens Medical Complex - Athens GA Medical office GA 9/27/13 2 55,752 100.0% 2011 1,443 Restora Hospital Hospital AZ 9/27/13 2 96,000 100.0% 2012 3,691 West Valley Medical Center - Buckeye AZ Medical office AZ 9/27/13 1 38,734 100.0% 2011 705 Lutheran Medical Arts - Ft. Wayne IN Medical office IN 9/27/13 1 45,858 92.4% 2000 880 Dupont Road MOB - Ft. Wayne IN Medical office IN 9/27/13 1 60,325 85.3% 2001 788 Crozer-Keystone MOB I - Springfield PA Medical office PA 9/27/13 2 217,781 100.0% 1996 3,631 Crozer-Keystone MOB II - Springfield PA Medical office PA 9/27/13 1 41,935 100.0% 1998 810 Aventura Medical Plaza - Aventura FL Medical office FL 9/27/13 1 48,353 100.0% 1996 1,096 Spartanburg Regional MOB - Spartanburg SC Medical office SC 9/27/13 1 64,800 98.5% 1986 1,706 Virginia Urology Center - Richmond VA Medical office VA 9/27/13 1 53,318 100.0% 2004 1,343 St. Peter's Recovery Center - Guilderland NY Medical office NY 9/27/13 1 30,000 100.0% 1990 674 Capital Regional MOB I - Tallahassee FL Medical office FL 9/30/13 1 38,225 78.7% 1998 639 Arbor Terrace - Asheville NC Seniors Housing NC 10/4/13 1 42,000 100.0% 1998 4,252 Arbor Terrace - Decatur GA Seniors Housing GA 10/4/13 1 51,159 99.2% 1990 5,221 Gardens at Westlake - Westlake OH Seniors Housing OH 10/31/13 1 102,000 93.8% 1987 4,853 Baylor Orthopedic & Spine - Arlington TX Hospital TX 11/5/13 1 57,243 100.0% 2009 2,430 Trinity Health Medical Arts Clinic - Minot ND Medical office ND 11/6/13 1 114,000 100.0% 1995 1,046 TriSun Care Center - San Antonio TX Post acute / skilled nursing TX 11/21/13 1 42,853 100.0% 2012 1,216 Allina Health - Elk River MN Medical office MN 11/25/13 1 28,175 100.0% 2002 671 Riverdale MOB - Riverdale GA Medical office GA 12/6/13 1 39,301 100.0% 2005 898 Wellington ALF - Minot ND Seniors Housing ND 12/16/13 1 83,710 100.0% 2005 1,046 Spartanburg ASC - Spartanburg, SC Medical office SC 12/24/13 1 26,148 100.0% 2002 1,277 Solana at Cinco Ranch - Katy TX Seniors Housing TX 12/30/13 1 135,000 94.0% 2010 8,004 Totals/Averages1 114 5,830,271 97.2% 12.7 Years $ 194,928 1. Total occupancy excludes occupancy of senior living facilities, which are based on the number of units rented by the residents rather than the number of square feet leased * Development parcel

4Q 2013 SUPPLEMENTAL INFORMATION Property Investment dollars in thousands PAGE 15 OF 28 Property Investment by State State Medical Offi ce Hospital Life Science Post Acute / Skilled Nursing Seniors Housing Land Total Properties Total Purchase Price % of Total Purchase Price Total Square Feet % of Total Square Feet Texas $ 73,156 $ 125,917 $ 5,747 $ 12,250 $ 71,250 $ - 15 $ 288,320 17.6% 701,065 12.0% Georgia 69,160 - - - 134,947 1,788 16 205,895 12.5% 644,766 11.1% Illinois 122,525 - - - 5,200 - 8 127,725 7.8% 465,732 8.0% Indiana 71,034 - 36,972 - - - 6 108,006 6.6% 433,502 7.4% Florida 35,296 - - - 68,908 - 7 104,204 6.3% 395,923 6.8% Wisconsin 72,161 - 31,462 - - - 6 103,623 6.3% 444,906 7.6% Pennsylvania 81,330 - - - - - 4 81,330 5.0% 312,316 5.4% Oregon - - - - 76,950 - 7 76,950 4.7% 370,222 6.3% Arizona 17,800 40,000 - 9,016 8,410 - 6 75,226 4.6% 191,813 3.3% California 9,460 - 53,904 10,482 - - 5 73,846 4.5% 267,661 4.6% Nevada 31,386 28,990 - - - - 5 60,376 3.7% 266,142 4.6% Michigan 56,234 - - - - - 4 56,234 3.4% 184,821 3.2% South Carolina 33,800 - - - 13,550 - 3 47,350 2.9% 141,092 2.4% Virginia 38,200 - - - - - 2 38,200 2.3% 104,501 1.8% North Carolina 9,000 - - - 18,657 - 2 27,657 1.7% 72,000 1.2% North Dakota 13,420 - - - 11,650 - 2 25,070 1.5% 197,710 3.4% New York 24,110 - - - - - 2 24,110 1.5% 83,229 1.4% Tennessee 4,850 - - - 18,488 - 2 23,338 1.4% 81,390 1.4% Ohio - - - - 22,500 - 1 22,500 1.4% 102,000 1.7% Minnesota 7,700 - 9,390 - - - 2 17,090 1.0% 110,102 1.9% New Jersey 11,615 - - - - - 3 11,615 0.7% 36,664 0.6% Washington - - - - 11,300 - 1 11,300 0.7% 62,797 1.1% Missouri - - 11,045 - - - 1 11,045 0.7% 42,430 0.7% Colorado 8,400 - - - - - 1 8,400 0.5% 62,202 1.1% Kansas 8,000 - - - - - 1 8,000 0.5% 32,540 0.6% Louisiana 3,739 - - - - - 1 3,739 0.2% 18,149 0.3% Arkansas 1,444 - - - - - 1 1,444 0.1% 4,596 0.1% Totals / Averages $ 803,820 $ 194,907 $148,520 $ 31,748 $ 461,810 $ 1,788 114 $ 1,642,593 100.00% 5,830,271 100.0% Property Investment by State - Top 15 States Other: 10.2% Nevada: 3.7% Virginia: 2.3% California: 4.5% Michigan: 3.4% South Carolina: 2.9% North Carolina: 1.7% Florida: 6.3% Illinois: 7.8% Pennsylvania: 5.0% Wisconsin: 6.3% Georgia: 12.5% Arizona: 4.6% Indiana: 6.6% Oregon: 4.7% Texas: 17.6% Property Investment by State - Top 15 States
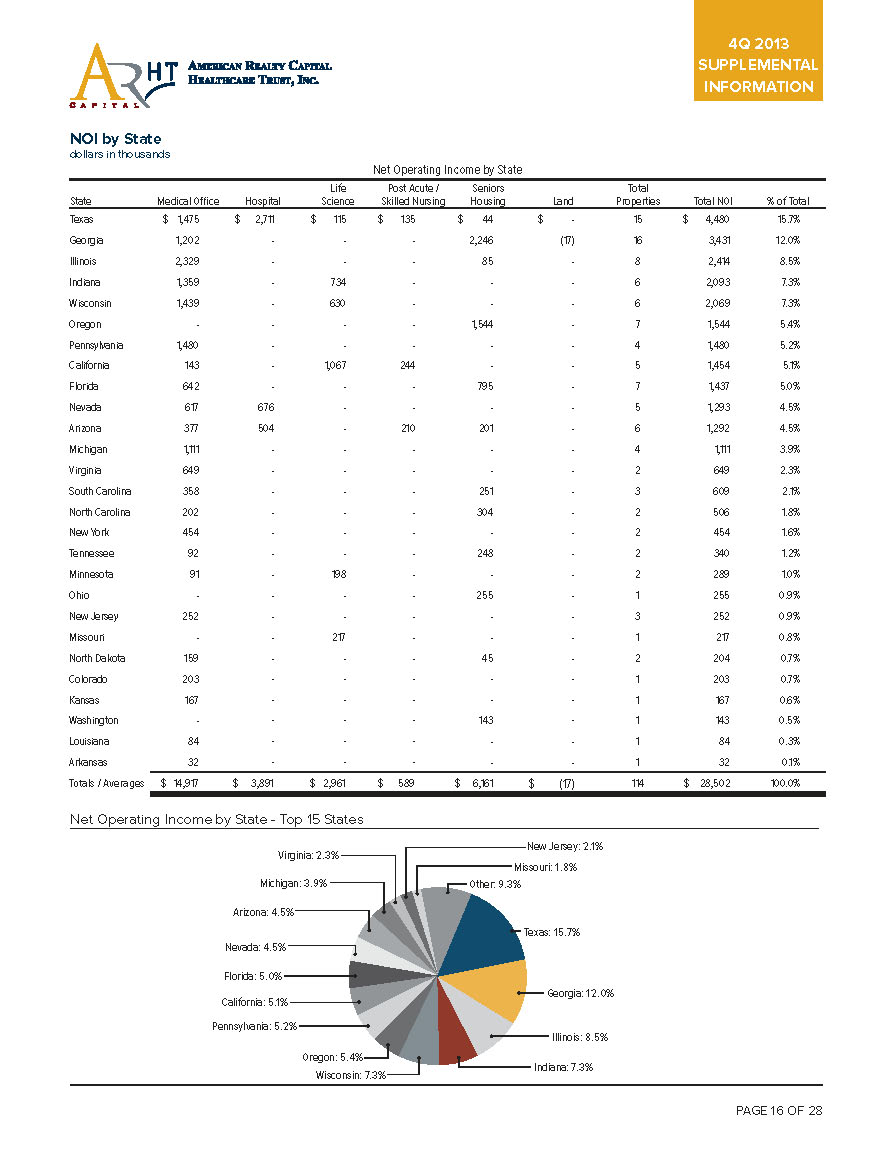
Net Operating Income by State State Medical Offi ce Hospital Life Science Post Acute / Skilled Nursing Seniors Housing Land Total Properties Total NOI % of Total Texas $ 1,475 $ 2,711 $ 115 $ 135 $ 44 $ - 15 $ 4,480 15.7% Georgia 1,202 - - - 2,246 (17) 16 3,431 12.0% Illinois 2,329 - - - 85 - 8 2,414 8.5% Indiana 1,359 - 734 - - - 6 2,093 7.3% Wisconsin 1,439 - 630 - - - 6 2,069 7.3% Oregon - - - - 1,544 - 7 1,544 5.4% Pennsylvania 1,480 - - - - - 4 1,480 5.2% California 143 - 1,067 244 - - 5 1,454 5.1% Florida 642 - - - 795 - 7 1,437 5.0% Nevada 617 676 - - - - 5 1,293 4.5% Arizona 377 504 - 210 201 - 6 1,292 4.5% Michigan 1,111 - - - - - 4 1,111 3.9% Virginia 649 - - - - - 2 649 2.3% South Carolina 358 - - - 251 - 3 609 2.1% North Carolina 202 - - - 304 - 2 506 1.8% New York 454 - - - - - 2 454 1.6% Tennessee 92 - - - 248 - 2 340 1.2% Minnesota 91 - 198 - - - 2 289 1.0% Ohio - - - - 255 - 1 255 0.9% New Jersey 252 - - - - - 3 252 0.9% Missouri - - 217 - - - 1 217 0.8% North Dakota 159 - - - 45 - 2 204 0.7% Colorado 203 - - - - - 1 203 0.7% Kansas 167 - - - - - 1 167 0.6% Washington - - - - 143 - 1 143 0.5% Louisiana 84 - - - - - 1 84 0.3% Arkansas 32 - - - - - 1 32 0.1% Totals / Averages $ 14,917 $ 3,891 $ 2,961 $ 589 $ 6,161 $ (17) 114 $ 28,502 100.0% Net Operating Income by State - Top 15 States Other: 9.3% Nevada: 4.5% New Jersey: 2.1% Florida: 5.0%Virginia: 2.3% Arizona: 4.5% Michigan: 3.9% Missouri: 1.8% Indiana: 7.3% Georgia: 12.0% Oregon: 5.4% Wisconsin: 7.3% Texas: 15.7% California: 5.1% Illinois: 8.5% Pennsylvania: 5.2% NOI by State

4Q 2013 SUPPLEMENTAL INFORMATION Lease Expiration Schedule dollars in thousands Property Type Expiration Year Total 2014 2015 2016 2017 2018 2019 2020 2021 2022 2023 Thereafter Medical Office Leases 218 8 12 26 29 28 17 9 18 25 29 17 Annualized rental income $ 65,145 $ 543 $ 1,010 $ 2,743 $ 3,551 $ 5,079 $ 3,757 $ 2,196 $ 12,106 $ 7,985 $ 10,498 $ 15,676 Hospital Leases 13 - - 1 - 5 - - - - - 7 Annualized rental income 17,986 - - 122 - 2,362 - - - - - 15,502 Life Science Leases 7 - - - - - - - 6 1 - - Annualized rental income 11,874 - - - - - - - 10,991 883 - - Post Acute / Skilled Nursing Leases 4 - - - - - - - - - - 4 Annualized rental income 3,054 - - - - - - - - - - 3,054 Seniors Housing* Leases 2 - - - - - - - - - - 2 Annualized rental income 1,849 - - - - - - - - - - 1,849 Total Annualized Income $ 99,908 $ 543 $ 1,010 $ 2,865 $ 3,551 $ 7,441 $ 3,757 $ 2,196 $ 23,097 $ 8,868 $ 10,498 $ 36,081 % of Total 100% 0.5% 1.0% 2.9% 3.6% 7.4% 3.8% 2.2% 23.1% 8.9% 10.5% 36.1% Cumulative Total 0.5% 1.6% 4.4% 8.0% 15.4% 19.2% 21.4% 44.5% 53.4% 63.9% 100.0% *Includes senior housing facilities leased to tenants under triple-net lease arrangements Lease Expiration Schedule as percentage of revenue 40.0% 100.0% 36.1% Percentage of Lease Revenue 90.0% 35.0% Cumulative Percentage of Lease Revenue 80.0% 30.0% 70.0% 25.0% 23.1% 60.0% 50.0% 20.0% 40.0% 15.0% 30.0% 10.5% 8.9% 10.0% 7.4% 20.0% 5.0% 3.8% 10.0% 3.6% 2.2% 2.9% 1.0% 0.5% 0.0% 0.0% 2021 2020 2019 2018 2017 2016 2015 2014 2022 THEREAFTER 2023

Portfolio Composition Healthcare Provider Annualized Rental Income Percentage Square Feet Percentage No. of Leases Credit Rating Private Practice* $ 17,184 17.2% 688,076 16.4% 114 No rating UnitedHealth Group Incorporated 9,738 9.7% 610,670 14.6% 4 S&P: A Reliant Rehabilitation 6,535 6.5% 129,600 3.1% 2 No rating Aurora Health Care 5,033 5.0% 226,046 5.4% 3 Moody's: A3 Crozer-Keystone Health System 4,441 4.4% 259,716 6.2% 2 Moody's: Baa3 Baylor Scott & White Medical System 4,133 4.1% 112,217 2.7% 3 Moody's: A2 Restora Healthcare 3,691 3.7% 96,000 2.3% 2 No rating Rush Copley Medical Center 3,296 3.3% 124,134 3.0% 21 Moody's: A2 Spartanburg Regional Healthcare System 2,767 2.8% 80,925 1.9% 5 Moody's: A1 Advocate Health Care Network 2,585 2.6% 103,081 2.5% 4 Moody's: Aa2 Bronson Healthcare Group 2,336 2.3% 100,321 2.4% 1 Moody's: A2 Carson Tahoe Regional Healthcare 2,331 2.3% 131,752 3.1% 7 S&P: BBB+ IU Health 2,158 2.2% 63,000 1.5% 1 Moody's: A1 Methodist HCS (Iowa Health) 1,946 1.9% 73,302 1.7% 2 Moody's: A2 Global Rehabilitation 1,499 1.5% 40,828 1.0% 1 No rating Texas Health Resources 1,383 1.4% 52,408 1.3% 12 Moody's: Aa3 Spectrum Health System 1,293 1.3% 52,898 1.3% 1 Moody's: Aa3 National Mentor Holdings, Inc. 1,264 1.3% 21,250 0.5% 2 Moody's: B3 Gentiva Health Services 1,216 1.2% 42,853 1.0% 1 No rating Pinnacle Health System 1,153 1.2% 39,208 0.9% 2 Moody's: A2 Piedmont Healthcare, Inc. 1,056 1.1% 61,031 1.5% 3 Moody's: Aa3 Meridian Senior Living, LLC 1,046 1.0% 83,710 2.0% 1 No rating Trinity Health 1,046 1.0% 114,000 2.7% 1 S&P: BBBMemorial Hermann Health System 945 0.9% 30,000 0.7% 1 Moody's: A1 The Regents of the University of California 929 0.9% 36,911 0.9% 3 S&P: AA UNC Health Care 925 0.9% 30,000 0.7% 1 Fitch: A+ Health Management Associates, Inc. 910 0.9% 34,500 0.8% 1 S&P: B+ Bon Secours Health System 905 0.9% 26,010 0.6% 1 Moody's: A3 Sisters of Mercy Health System 883 0.9% 42,430 1.0% 1 Moody's: Aa3 San Martin Surgery Center 866 0.9% 14,399 0.3% 1 No rating Frontier Management 803 0.8% 25,971 0.6% 1 No rating Phonak, AG (Sonova) 793 0.8% 81,927 2.0% 1 No rating University of Wisconsin 730 0.7% 31,374 0.7% 1 Moody's: A2 Vanguard Health Systems 705 0.7% 38,734 0.9% 1 S&P: B Cooper Health 680 0.7% 27,314 0.7% 2 S&P: BBB+ Continue Care Hospital 678 0.7% 41,435 1.0% 1 S&P: BBB+ St. Peter's Health Partners 674 0.7% 30,000 0.7% 1 Moody's: A3 Ascension Health 669 0.7% 32,540 0.8% 1 S&P: AA+ ASCOA 634 0.6% 14,537 0.3% 1 No rating Allina Health System 603 0.6% 24,273 0.6% 1 Moody's: Aa3 Cenetgra Health System 600 0.6% 24,121 0.6% 2 S&P: A+ IASIS Healthcare Corporation 596 0.6% 39,220 0.9% 1 Moody's: B2 Albany Medical Center 594 0.6% 36,200 0.9% 1 Moody's: Aa3 CareMeridian 575 0.6% 9,000 0.2% 1 Moody's: B3 Metropolitan Hospital 555 0.6% 21,502 0.5% 1 No rating Northside Hospital, Inc. 523 0.5% 19,433 0.5% 4 Moody's: Baa2 DaVita Inc. 492 0.5% 17,353 0.4% 3 S&P: BBBaxter International, Inc. 460 0.5% 15,000 0.4% 1 S&P: A+ HCA Holdings, Inc. 456 0.5% 21,897 0.5% 3 S&P: B+ Symbion 431 0.4% 18,268 0.4% 1 Moody's: B3 CVS Caremark Corporation 413 0.4% 14,745 0.4% 1 Moody's: Baa2 Wellmont Health System 361 0.4% 23,177 0.6% 1 Fitch: BBB+ CHS/Community Health Systems, Inc. 322 0.3% 9,350 0.2% 1 Moody's: B1 * Independent physician practices with no hospital ownership of the practice; 114 separate leases. † Excludes seniors housing operating properties

PAGE 19 OF 28 Fresnius Medical 313 0.3% 18,149 0.4% 1 S&P: BB+ Kaieser Permanente 243 0.2% 12,575 0.3% 1 S&P: A+ Northwest Detroit Dialysis 239 0.2% 10,100 0.2% 1 Moody's: A1 Other 229 0.2% 9,018 0.2% 4 No rating Walgreen Company 44 0.0% 1,568 0.0% 1 Moody's: Baa1- Total $ 99,908 100.0% 4,190,057 100.0% 244.00 Healthcare Provider Annualized Rental Income Percentage Square Feet Percentage No. of Leases Credit Rating Tenant Composition by Revenue Tenants below 1.5%: 30.3% Advocate Health Care Network: 2.6% Global Rehabilitation: 1.5% Spartanburg Regional Healthcare System: 2.8% IU Health: 2.2% Bronson Healthcare Group: 2.3% Carson Tahoe Regional Healthcare: 2.3% Methodist HCS (Iowa Health): 1.9% Baylor Scott & White Medical System: 4.1% Crozer-Keystone Health System: 4.4% Aurora Health Care: 5.0% Reliant Rehabilitation: 6.5% UnitedHealth Group Incorporated: 9.7% Rush Copley Medical Center: 3.3% Restora Healthcare: 3.7% Private Practice: 17.2% Portfolio Composition, continued
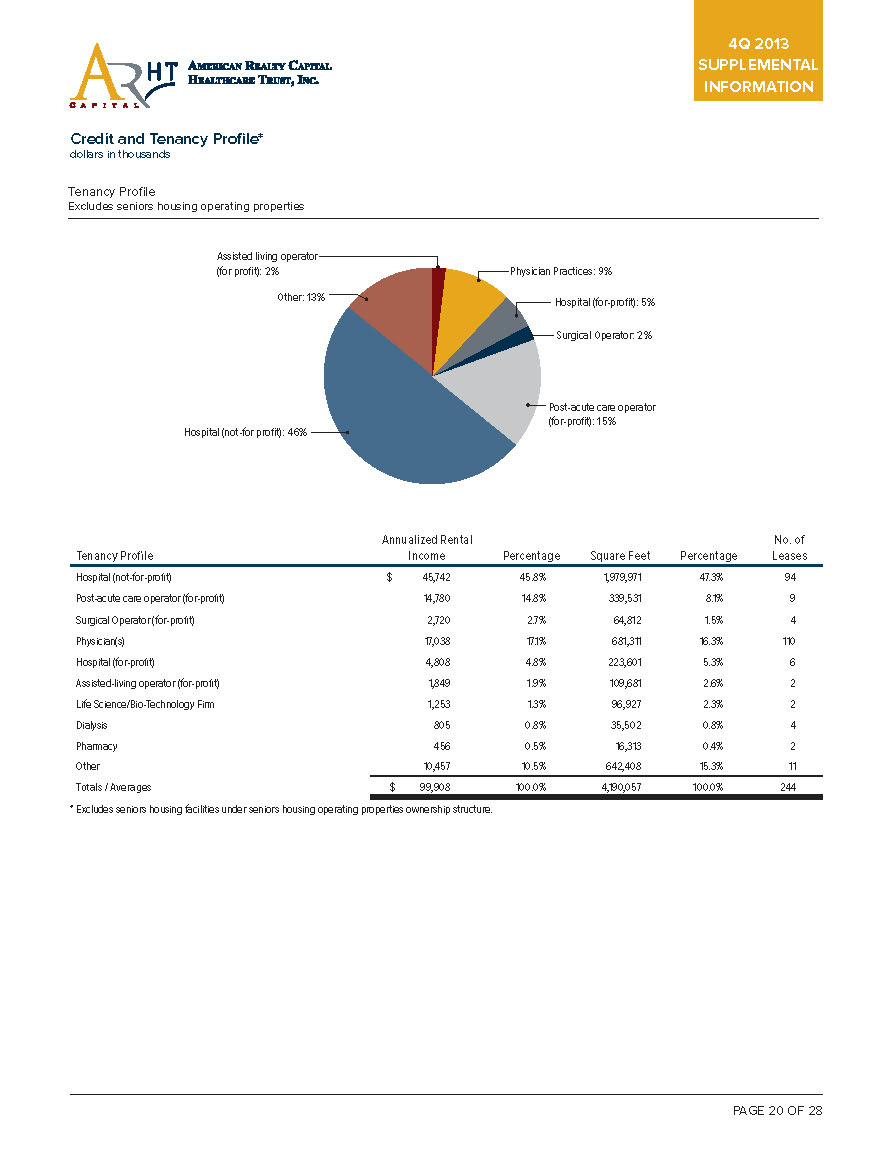
4Q 2013 SUPPLEMENTAL INFORMATION Credit and Tenancy Profile* dollars in thousands Tenancy Profile Excludes seniors housing operating properties Assisted living operator (for profit): 2% Physician Practices: 9% Other: 13% Hospital (for-profit): 5% Surgical Operator: 2% Post-acute care operator (for-profit): 15% Hospital (not-for profit): 46% Tenancy Profile Annualized Rental Income Percentage Square Feet Percentage No. of Leases Hospital (not-for-profit) $ 45,742 45.8% 1,979,971 47.3% 94 Post-acute care operator (for-profit) 14,780 14.8% 339,531 8.1% 9 Surgical Operator (for-profit) 2,720 2.7% 64,812 1.5% 4 Physician(s) 17,038 17.1% 681,311 16.3% 110 Hospital (for-profit) 4,808 4.8% 223,601 5.3% 6 Assisted-living operator (for-profit) 1,849 1.9% 109,681 2.6% 2 Life Science/Bio-Technology Firm 1,253 1.3% 96,927 2.3% 2 Dialysis 805 0.8% 35,502 0.8% 4 Pharmacy 456 0.5% 16,313 0.4% 2 Other 10,457 10.5% 642,408 15.3% 11 Totals / Averages $ 99,908 100.0% 4,190,057 100.0% 244 * Excludes seniors housing facilities under seniors housing operating properties ownership structure.
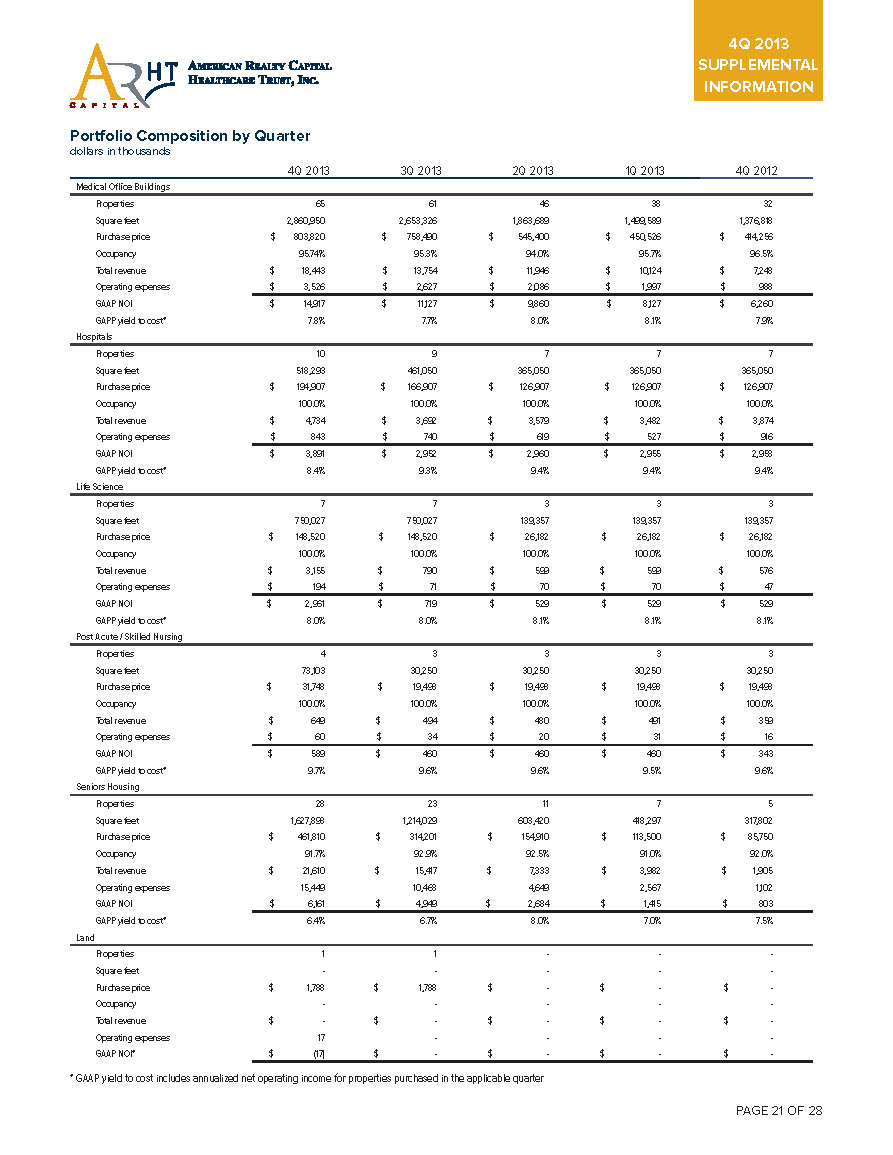
Portfolio Composition by Quarter dollars in thousands 4Q 2013 3Q 2013 2Q 2013 1Q 2013 4Q 2012 Medical Office Buildings Properties 65 61 46 38 32 Square feet 2,860,950 2,653,326 1,863,689 1,499,589 1,376,818 Purchase price $ 803,820 $ 758,490 $ 545,400 $ 450,526 $ 414,256 Occupancy 95.74% 95.3% 94.0% 95.7% 96.5% Total revenue $ 18,443 $ 13,754 $ 11,946 $ 10,124 $ 7,248 Operating expenses $ 3,526 $ 2,627 $ 2,086 $ 1,997 $ 988 GAAP NOI $ 14,917 $ 11,127 $ 9,860 $ 8,127 $ 6,260 GAPP yield to cost* 7.8% 7.7% 8.0% 8.1% 7.9% Hospitals Properties 10 9 7 7 7 Square feet 518,293 461,050 365,050 365,050 365,050 Purchase price $ 194,907 $ 166,907 $ 126,907 $ 126,907 $ 126,907 Occupancy 100.0% 100.0% 100.0% 100.0% 100.0% Total revenue $ 4,734 $ 3,692 $ 3,579 $ 3,482 $ 3,874 Operating expenses $ 843 $ 740 $ 619 $ 527 $ 916 GAAP NOI $ 3,891 $ 2,952 $ 2,960 $ 2,955 $ 2,958 GAPP yield to cost* 8.4% 9.3% 9.4% 9.4% 9.4% Life Science Properties 7 7 3 3 3 Square feet 750,027 750,027 139,357 139,357 139,357 Purchase price $ 148,520 $ 148,520 $ 26,182 $ 26,182 $ 26,182 Occupancy 100.0% 100.0% 100.0% 100.0% 100.0% Total revenue $ 3,155 $ 790 $ 599 $ 599 $ 576 Operating expenses $ 194 $ 71 $ 70 $ 70 $ 47 GAAP NOI $ 2,961 $ 719 $ 529 $ 529 $ 529 GAPP yield to cost* 8.0% 8.0% 8.1% 8.1% 8.1% Post Acute / Skilled Nursing Properties 4 3 3 3 3 Square feet 73,103 30,250 30,250 30,250 30,250 Purchase price $ 31,748 $ 19,498 $ 19,498 $ 19,498 $ 19,498 Occupancy 100.0% 100.0% 100.0% 100.0% 100.0% Total revenue $ 649 $ 494 $ 480 $ 491 $ 359 Operating expenses $ 60 $ 34 $ 20 $ 31 $ 16 GAAP NOI $ 589 $ 460 $ 460 $ 460 $ 343 GAPP yield to cost* 9.7% 9.6% 9.6% 9.5% 9.6% Seniors Housing Properties 28 23 11 7 5 Square feet 1,627,898 1,214,029 603,420 418,297 317,802 Purchase price $ 461,810 $ 314,201 $ 154,910 $ 113,500 $ 85,750 Occupancy 91.7% 92.9% 92.5% 91.0% 92.0% Total revenue $ 21,610 $ 15,417 $ 7,333 $ 3,982 $ 1,905 Operating expenses 15,449 10,468 4,649 2,567 1,102 GAAP NOI $ 6,161 $ 4,949 $ 2,684 $ 1,415 $ 803 GAPP yield to cost* 6.4% 6.7% 8.0% 7.0% 7.5% Land Properties 1 1 - - - Square feet - - - - - Purchase price $ 1,788 $ 1,788 $ - $ - $ - Occupancy - - - - - Total revenue $ - $ - $ - $ - $ - Operating expenses 17 - - - - GAAP NOI* $ (17) $ - $ - $ - $ - * GAAP yield to cost includes annualized net operating income for properties purchased in the applicable quarter

4Q 2013 SUPPLEMENTAL INFORMATION Acquisition Activity dollars in thousands Properties Acquired in 4Q 2013 Property Name Type of Facility City State Square Feet Occupancy Age of Property Average Lease Term Arbor Terrace - Asheville NC Seniors Housing Asheville NC 42,000 100.0% 1998 Operating Property Arbor Terrace - Decatur GA Seniors Housing Decatur GA 51,159 99.2% 1990 Operating Property Gardens at Westlake - Westlake OH Seniors Housing Westlake OH 102,000 93.8% 1987 Operating Property Baylor Orthopedic & Spine - Arlington TX Hospital Arlington TX 57,243 100.0% 2009 16.2 Trinity Health Medical Arts Clinic - Minot ND Medical office Minot ND 114,000 100.0% 1995 10.0 TriSun Care Center - San Antonio TX Post acute / skilled nursing San Antonio TX 42,853 100.0% 2012 13.7 Allina Health - Elk River MN Medical office Elk River MN 28,175 100.0% 2002 10.3 Riverdale MOB - Riverdale GA Medical office Riverdale GA 39,301 100.0% 2005 9.4 Wellington ALF - Minot ND Seniors Housing Minot ND 83,710 100.0% 2005 15.0 Spartanburg ASC - Spartanburg, SC Medical office Spartanburg SC 26,148 100.0% 2002 15.6 Solana at Cinco Ranch - Katy TX Seniors Housing Katy TX 135,000 94.0% 2010 Operating Property Totals / Averages 721,589 100.00% 15.0 Years
4Q 2013 SUPPLEMENTAL INFORMATION Top Ten Tenant Descriptions United Healthcare United Healthcare Services, Inc. (“United”) a wholly owned subsidiary of UnitedHealth Group (NYSE: UNH), a national healthcare insurance provider and a member of the Fortune 500. United Healthcare is the largest provider of health insurance in the United States with over $120 billion in annual revenues. The company was founded in 1974 and is based in Minnetonka, Minnesota. As of December 31, 2013, United leases four facilities from the Company totaling 610,670 square feet. Reliant Rehabilitation Partners Reliant Hospital Partners, LLC (“Reliant”) is a hospital operating company focused on developing and operating free-standing rehabilitation hospitals. Headquartered in Dallas, TX, Reliant operates nine facilities located in Texas and Ohio. Reliant is owned by Nautic Partners. As of December 31, 2013, Reliant leases two facilities from the Company totaling 129,600 square feet. Aurora Health Care Aurora Health Care (“Aurora”) is the largest health care provider in the state of Wisconsin with a leading market share position in its collective service area. Aurora is a not-for-profit system that began operations in 1984 and now operates fifteen acute care hospitals. Aurora seniormost revenue bonds are rated “A3, Stable” by Moody’s. As of December 31, 2013, Aurora Healthcare leases three properties totaling 226,046 square feet. Crozer-Keystone Health System Crozer-Keystone Health System (“CKHS”) is a not-for-profit system is comprised of five acute care hospitals situated around Delaware County with 838 total licensed beds, four comprehensive outpatient medical centers and a 300-physician Crozer-Keystone Health Network. CKHS is the largest employer in Delaware County with more than 6,800 employees and has a medical staff of 2,600 individuals, including 1,000 physicians. As of December 31, 2013, United leases one facility from the Company totaling 259,716 square feet. Baylor Scott & White Medical System Restora Healthcare (“Restora”) was founded by Rod Laughlin, former founder of Regency Hospital Company and Transitional Hospitals Corporation, where he built and operated over 40 long term acute care hospitals. Restora operates two long-term acute care facilities and is part of Banner Health’s accountable care organization providing post-acute services for patients discharged from Banner and other hospitals. Restora is headquartered in Alpharetta, Georgia. As of December 31, 2013, Restora leases two facilities from the Company totaling 96,000 square feet. Restora Healthcare Restora Healthcare (“Restora”) was founded by Rod Laughlin, former founder of Regency Hospital Company and Transitional Hospitals Corporation, where he built and operated over 40 long term acute care hospitals. Restora operates two long-term acute care facilities and is part of Banner Health’s accountable care organization providing post-acute services for patients discharged from Banner and other hospitals. Restora is headquartered in Alpharetta, Georgia. As of December 31, 2013, United leases two facilities from the Company totaling 96,000 square feet. Acquisition Date: September 2013 Square Feet: 610,670 Percent of Total Revenue: 9.7% Acquisition Dates: November 2011 May 2012 Square Feet: 129,600 Percent of Total Revenue: 6.5% Acquisition Date: July 2012 Square Feet: 226,046 Percent of Total Revenue: 5.0% Acquisition Date: September 2013 Square Feet: 259,716 Percent of Total Revenue: 4.4% Acquisition Date: September 2013 Square Feet: 112,217 Percent of Total Revenue: 4.1% Acquisition Date: September 2013 Square Feet: 96,000 Percent of Total Revenue: 3.7%

4Q 2013 SUPPLEMENTAL INFORMATION Rush-Copley Medical Center Rush–Copley Medical Center in Aurora, Illinois operates an acute care hospital facility affiliated with Rush University Medical Center that operates three hospitals in the Chicagoland area. The 209-bed hospital, founded in 1995, provides a comprehensive array of health and wellness services in the greater Fox Valley area. Rush–Copley Medical Center is part of the obligated group of Rush- Copley University Health System that carries at a credit rating of “A2, Positive” from Moody’s. As of December 31, 2013, Rush–Copley Medical Center leases two properties totaling 124,134 square feet. Spartanburg Regional Healthcare System The Spartanburg Regional Health Services District, Inc. (“SRHSD”) serves patients in Spartanburg, Cherokee and Union counties in South Carolina, and Polk and Rutherford counties in North Carolina. The system consists two acute care hospitals, including the 455-bed Spartanburg Regional Medical Center and the 48-bed Village Hospital in Greer. Established in 1920, the SRHSD is the leading provider of integrated healthcare services in Spartanburg County, SC, with over 70% market share. As of December 31, 2013, the Spartanburg Regional Health Services District leases two properties totaling 80,925 square feet. Advocate Healthcare Network Bronson Healthcare Group (“Bronson”), headquartered in Kalamazoo, Michigan, is a not-for-profit, healthcare system founded in 1900 serving southwest Michigan and northern Indiana. Bronson operates regional hospitals and health clinics, including Bronson Methodist Hospital (380 beds), Bronson Vicksburg Hospital (40 beds), and Bronson Lakeview Hospital (25 beds). With a workforce of more than 6,000, Bronson is one of the area’s largest employers. Bronson’s seniormost revenue bonds are rated “A2, Stable” by Moody’s. As of December 31, 2013, Bronson leases one property totaling 100,321 square feet. Bronson Healthcare Group The Carson Tahoe Regional Healthcare (“CTRH”) is a non-profit health care system founded in 1949 that operates a 172-bed hospital and surrounding outpatient facilities. CTRH has over 240 board- certified physicians, more than 35 medical specialties, and full Joint Commission accreditation. It affiliated entities holds an investment grade rating of “A2, Stable” from Moody’s with total revenues in excess of $240 million. As of December 31, 2013, CTRH leases space in two properties totaling 131,752 square feet. Top Ten Tenant Descriptions, continued Acquisition Dates: November 2012 December 2012 Square Feet: 124,134 Percent of Total Revenue: 3.3% Acquisition Dates: November 2012 May 201 Square Feet: 80,925 Percent of Total Revenue: 2.8% Acquisition Date: September 2012 Square Feet: 103,081 Percent of Total Revenue: 2.6% Acquisition Date: June 2012 Square Feet: 100,321 Percent of Total Revenue: 2.3%

4Q 2013 SUPPLEMENTAL INFORMATION Top Seniors Housing Operators Frontier Management Frontier Management, LLC, (“Frontier”) is a senior housing management company that owns and operates 49 retirement, assisted living, memory care, skilled nursing and home health care companies throughout the United States. Frontier was founded in 2000 and based in Portland, Oregon. Frontier ranked 25th amongst the top 40 seniors housing operators for number of facilities managed within the United States. As of December 31, 2013, Frontier operates eight of the Company’s facilities totaling 589 units. The Arbor Company The Arbor Company (“Arbor”), formed in 1986, currently manages nearly 20 properties across the southeastern United States within 7 states. Arbor’s management team has 30 years of combined experience in the senior housing industry. As of December 31, 2013, Arbor operates nine of the Company’s facilities totaling 824 units. Principal Senior Living Group Principal Senior Living Group (“PSLG”) was founded in 1997 by its partner who have a combined 50 years’ experience serving seniors. PSLG acts as the developer/owner/operator of assisted living and memory care communities and is currently serving locations in Georgia, Florida, South Carolina and Missouri, primarily under the name Benton House. As of December 31, 2013, PSLG operates seven of the Company’s facilities totaling 492 units. Good Neighbor Care Good Neighbor Care, LLC is a national operator of independent living, assisted living and memory care facilities across 9 states and either owns or operates 20 properties, 6 of which are in Illinois. Good Neighbor Care is privately owned and was founded over 20 years ago. As of December 31, 2013, GNC operates one of the Company’s facilities totaling 37 units. Acquisition Dates: March 2013 May 2013 August 2013 Total Units: 516 Assisted Living 73 Memory Care Occupancy: 91.4% Acquisition Dates: July 2013 December 2013 Total Units: 126 Independent Living 491 Assisted Living 207 Memory Care Occupancy: 92.9% Acquisition Dates: March 2013 May 2013 August 2013 Total Units: 20 Independent Living 361 Assisted Living 111 Memory Care Occupancy: 90.4% Acquisition Date: July 2013 Total Units: 37 Assisted Living Occupancy: 83.8%

4Q 2013 SUPPLEMENTAL INFORMATION Definitions This section contains an explanation of certain non-GAAP financial measures we provide in other sections of this document, as well as the reasons why management believes these measures provide useful information to investors about the Company’s financial condition or results of operations. Additional detail can be found in the Company’s most recent annual report on Form 10-K as well as other documents filed with or furnished to the SEC from time to time. Adjusted funds from operations (AFFO) AFFO is core FFO, excluding certain income or expense items that we consider more reflective of investing activities, other non-cash income and expense items and the income and expense effects of other activities that are not a fundamental attribute of our business plan. These items include unrealized gains and losses, which may not ultimately be realized, such as gains or losses on derivative instruments, gains or losses on contingent valuation rights, gains and losses on investments and early extinguishment of debt. In addition, by excluding non-cash income and expense items such as amortization of above and below market leases, amortization of deferred financing costs, straight-line rent and non-cash equity compensation from AFFO we believe we provide useful information regarding income and expense items which have no cash impact and do not provide liquidity to the company or require capital resources of the company. We exclude distributions related to Class B units and certain interest expenses related to securities that are convertible to common stock as the shares are assumed to have converted to common stock in our calculation of weighted average common shares-fully diluted. Although our AFFO may not be comparable to that of other REITs and real estate companies, we believe it provides a meaningful indicator of our ability to fund cash needs and to make cash distributions to stockholders. In addition, we believe that to further understand our liquidity, AFFO should be compared with our cash flows determined in accordance with GAAP, as presented in our consolidated financial statements. AFFO does not represent cash generated from operating activities determined in accordance with GAAP, and AFFO should not be considered as an alternative to net income (determined in accordance with GAAP) as an indication of our performance, as an alternative to net cash flows from operating activities (determined in accordance with GAAP), or as a measure of our liquidity. Annualized straight-line rent Sum of the contractual rent over the term of the lease, including escalations and free rent, divided by the number of months in the lease term and annualized. Excludes contingent rental payments, as applicable, that may be collected from certain tenants based on provisions related to sales thresholds and increases in annual rent based on exceeding certain economic indexes among other items. Earnings before interest, taxes, depreciation and amortization (EBITDA) EBITDA is defined as net income before interest, taxes, depreciation and amortization. We believe EBITDA is an appropriate measure of our ability to incur and service debt. EBITDA should not be considered as an alternative to cash flows from operating activities, as a measure of our liquidity or as an alternative to net income as an indicator of our operating activities. Other REITs may calculate EBITDA differently and our calculation should not be compared to that of other REITs. EBITDA is adjusted to include our pro-rata share of EBITDA from unconsolidated joint ventures. Funds from operations (FFO) Pursuant to the revised definition of funds from operations adopted by the Board of Governors of the National Association of Real Estate Investment Trusts (“NAREIT”), we calculate funds from operations (FFO), by adjusting net income (loss) attributable stockholders (computed in accordance with GAAP, including non-recurring items) for gains (or losses) from sales of properties, impairment losses on depreciable real estate of consolidated real estate, impairment losses on investments in unconsolidated joint ventures driven by a measurable decrease in the fair value of depreciable real estate held by the unconsolidated joint ventures, real estate related depreciation and amortization, and after adjustment for unconsolidated partnerships and joint ventures. FFO is a non-GAAP financial measure. The use of FFO, combined with the required primary GAAP presentations, has been fundamentally beneficial in improving the understanding of operating results of REITs among the investing public and making comparisons of REIT operating results more meaningful. Management generally considers FFO to be a useful measure for reviewing our comparative operating and financial performance because, by excluding gains and losses related to asset sales (land and property), impairment losses and real estate asset depreciation and amortization (which can vary among owners of identical assets in similar condition based on historical cost accounting and useful life estimates), FFO can help one compare the operating performance of a company’s real estate between
4Q 2013 SUPPLEMENTAL INFORMATION periods or as compared to different companies. Our computation of FFO may not be comparable to FFO reported by other REITs or real estate companies that do not define the term in accordance with the current NAREIT definition or that interpret the current NAREIT definition differently. FFO should not be considered as an alternative to net income attributable to stockholders (determined in accordance with GAAP) as an indication of our performance. FFO does not represent cash generated from operating activities determined in accordance with GAAP, and is not a measure of liquidity or an indicator of our ability to make cash distributions. We believe that to further understand our performance, FFO should be compared with our reported net income attributable to stockholders and considered in addition to cash flows determined in accordance with GAAP, as presented in our consolidated financial statements. Net operating income (NOI) Net operating income (NOI) is a non-GAAP financial measure equal to net income attributable to stockholders, the most directly comparable GAAP financial measure, less discontinued operations, plus corporate general and administrative expense, acquisition and transaction costs, depreciation and amortization and interest expense, income from unconsolidated joint ventures, interest and other income and gains from investments in securities. NOI is adjusted to include our pro-rata share of NOI from unconsolidated joint ventures. We use NOI internally as a performance measure and believe NOI provides useful information to investors regarding our financial condition and results of operations because it reflects only those income and expense items that are incurred at the property level. Therefore, we believe NOI is a useful measure for evaluating the operating performance of our real estate assets and to make decisions about resource allocations. Further, we believe NOI is useful to investors as a performance measure because, when compared across periods, NOI reflects the impact on operations from trends in occupancy rates, rental rates, operating costs acquisition activity on an unleveraged basis, providing perspective not immediately apparent from net income. NOI excludes certain components from net income in order to provide results that are more closely related to a property’s results of operations. For example, interest expense is not necessarily linked to the operating performance of a real estate asset and is often incurred at the corporate level as opposed to the property level. In addition, depreciation and amortization, because of historical cost accounting and useful life estimates, may distort operating performance at the property level. NOI presented by us may not be comparable to NOI reported by other REITs that define NOI differently. We believe that in order to facilitate a clear understanding of our operating results, NOI should be examined in conjunction with net income as presented in our consolidated financial statements. NOI should not be considered as an alternative to net income as an indication of our performance or to cash flows as a measure of our liquidity or ability to make distributions. Definitions, continued

Investor Inquiries For more information on American Realty Capital Healthcare Trust, Inc., please contact your financial professional. Broker Dealer Inquiries Realty Capital Securities, LLC One Beacon Street, 14th Floor, Boston, MA 02108 | 877-373-2522 All Other Inquiries American Realty Capital Healthcare Trust, Inc. 405 Park Avenue, New York, NY 10022 | 212-415-6500 www.TheHealthcareREIT.com