Exhibit 99.2
1 Second Quarter 2016 Financial and Operating Results July 2016 Customer Trading Metrics August 4, 2016
2 This presentation may contain "forward - looking statements" within the meaning of Section 27 A of the Securities Act of 1933 , Section 21 E of the Securities Exchange Act of 1934 and/or the Private Securities Litigation Reform Act of 1995 , which reflect FXCM's current views with respect to, among other things, its operations and financial performance in the future . These forward - looking statements are not historical facts and are based on current expectations, estimates and projections about FXCM's industry, management's beliefs and certain assumptions made by management, many of which, by their nature, are inherently uncertain and beyond our control . Accordingly, readers are cautioned that any such forward - looking statements are not guarantees of future performance and are subject to certain risks, uncertainties and assumptions that are difficult to predict including, without limitation, risks associated with the events that took place in the currency markets on January 15 , 2015 and their impact on FXCM's capital structure, risks associated with FXCM's ability to recover all or a portion of any capital losses, risks relating to the ability of FXCM to satisfy the terms and conditions of or make payments pursuant to the terms of the credit agreement and letter agreement with Leucadia, risks related to FXCM's dependence on FX market makers, market conditions, risks associated with the outcome of any potential litigation or regulatory inquiries to which FXCM may become subject as a result of the cybersecurity incident that was reported in a press release on October 1 , 2015 , risks associated with potential reputational damage to FXCM resulting from this cybersecurity incident, and the extent of remediation costs and other additional expenses that may be incurred by FXCM as a result of this security incident, and those other risks described under "Risk Factors" in FXCM Inc . 's Annual Report on Form 10 - K, FXCM Inc . ’s latest Quarterly Report on Form 10 - Q, and other reports or documents FXCM files with the SEC, from time to time, which are accessible on the SEC website at sec . gov . This information should also be read in conjunction with FXCM's Consolidated Financial Statements and the Notes thereto contained in FXCM's Annual Report on Form 10 - K, FXCM Inc . ’s latest Quarterly Report on Form 10 - Q and in other reports or documents the FXCM files with, or furnishes to, the SEC from time to time, which are accessible on the SEC website at sec . gov . FXCM undertakes no obligation to publicly update or review any forward - looking statement, whether as a result of new information, future developments or otherwise . Non - GAAP Financial Measures : This presentation presents certain non - GAAP financial measures . These measures should not be considered in isolation from, or as a substitute for, measures prepared in accordance with generally accepted accounting principles . See the appendix to this presentation for reconciliations of these non - GAAP financial measures to the most comparable measures calculated and presented in accordance with GAAP . Safe Harbor
3 A Message From Management Operational: Brexit - FXCM is pleased with the risk management steps the firm took including its decision to gradually raise margins as we did heading into the vote. The FXCM Trading Station operated normally throughout the Brexit market volatility and the firm was extremely pleased with the liquidity providers and staff who worked through the night, and clients who continued to heed our warnings during these historical market movements. The number of new accounts hit a record high trending up the week of the Brexit vote and we hope to see this as a continued trend as market volatility continues. On June 25th alone the firm saw a 50% boost to our daily volumes all while having significantly higher margin requirements from customers. FXCM’s system processed 335,563 FX trades on June 25th alone vs the 195,580 June average. We received largely positive feedback from our customers through and after the event. We continue to onboard new smaller clients to our dealing desk offering which has grown to 21% of retail volume as of June 30, 2016. DD volume is up from 19% of total volume in Q1 2016 and 16% of total volume in Q4 2015. Additionally our enhanced CFD offering launched in October 2015 has been gaining traction throughout 2016. CFD trading made up 35% of retail volume in Q2 2016 up from 34% in Q1 2016 and 30% in Q4 of 2015. Both initiatives have helped raise our retail trading revenue per million to $80/million up from $72/million in Q1 2016 and $67/million in Q4 of 2015. After the SNB event of January 15, 2015, FXCM has continued to stabilize the business, repaying a significant portion of the debt to Leucadia, continued to market the remaining assets held for sale and launched a number of initiatives to grow the business. Leucadia has demonstrated its commitment to FXCM to provide greater financial flexibility on the credit agreement, enhance future growth by taking a direct stake in the operations and provide additional marketing strength for FXCM going forward. FXCM and Leucadia continue to work towards finalizing the terms of the MOU announced in March 2016 – targeting to close Third Quarter 2016.
4 A Message From Management Continued Financial: Highlights for Q2 2016 include: A $11.9 million increase in Adjusted EBITDA year over year from $(2.8) million in Q2 2015 to $9.1 million in Q2 2016 from continuing operations. Excluding a $2.3 million expense relating to the settlement of a longstanding legal matter in Q2 2016, Adjusted EBITDA would have been $14.2 million better than Q2 2015. Adjusted Total Revenues from continuing operations were $70.6 million, an increase of $10.0 million from $60.5 million in Q2 2015. Our U.S. GAAP net income from continuing operations attributable to FXCM was $60.5 million, or $10.80 a share. Please note that this includes a $116.5 million non - cash net gain on the derivative liabilities related to the Leucadia Letter & Credit Agreements. Our combined continuing and discontinued operations cash position was $230.4 million and regulatory surplus was $101.1 million. Based on the current market environment, the key metrics on our retail FX business are healthy. Total active accounts increased 1% year over year, daily average trades increased 8% and total customer equity as of June 30, 2016 was $662.4 million. The firm is maintaining its cost control efforts by continuing to reduce our key operating expenses while maintaining them at a level that will assist in enhancing our future earnings growth . Excluding a $2.3M settlement of a longstanding legal matter , adjusted continuing operations expenses decreased Q2 2016 vs Q1 2016 by 4.8% and Q2 2016 vs Q2 2015 by 6.7%.
5 Q2 2016 Highlights Financial • Net revenues from continuing operations of $70.6 million • Net Income from continuing operations attributable to FXCM Inc. of $60.5 million or $10.80/share - Includes a non - cash item: $116.5 million non - cash net gain on derivative liabilities (Leucadia Letter & Credit Agreement) • Adjusted EBITDA (continuing and discontinued ops) of $10.9 million • $9.1 million of Adjusted EBITDA coming from continuing operations Operating (continuing operations only) • Retail trading revenue per million traded of $80/MM up 11.1% vs. $72/MM in Q1/16. • Retail volume of $842 billion for Q2/16 decreased 15.8% from Q2/15 • Dealing Desk (“DD”) initiative for smaller clients reached 21% of retail volume in Q2 2016 vs. 19% in Q1 2016 • Tradeable accounts increased by 4,143 or 2.5% to 171,507 since 3/31/16
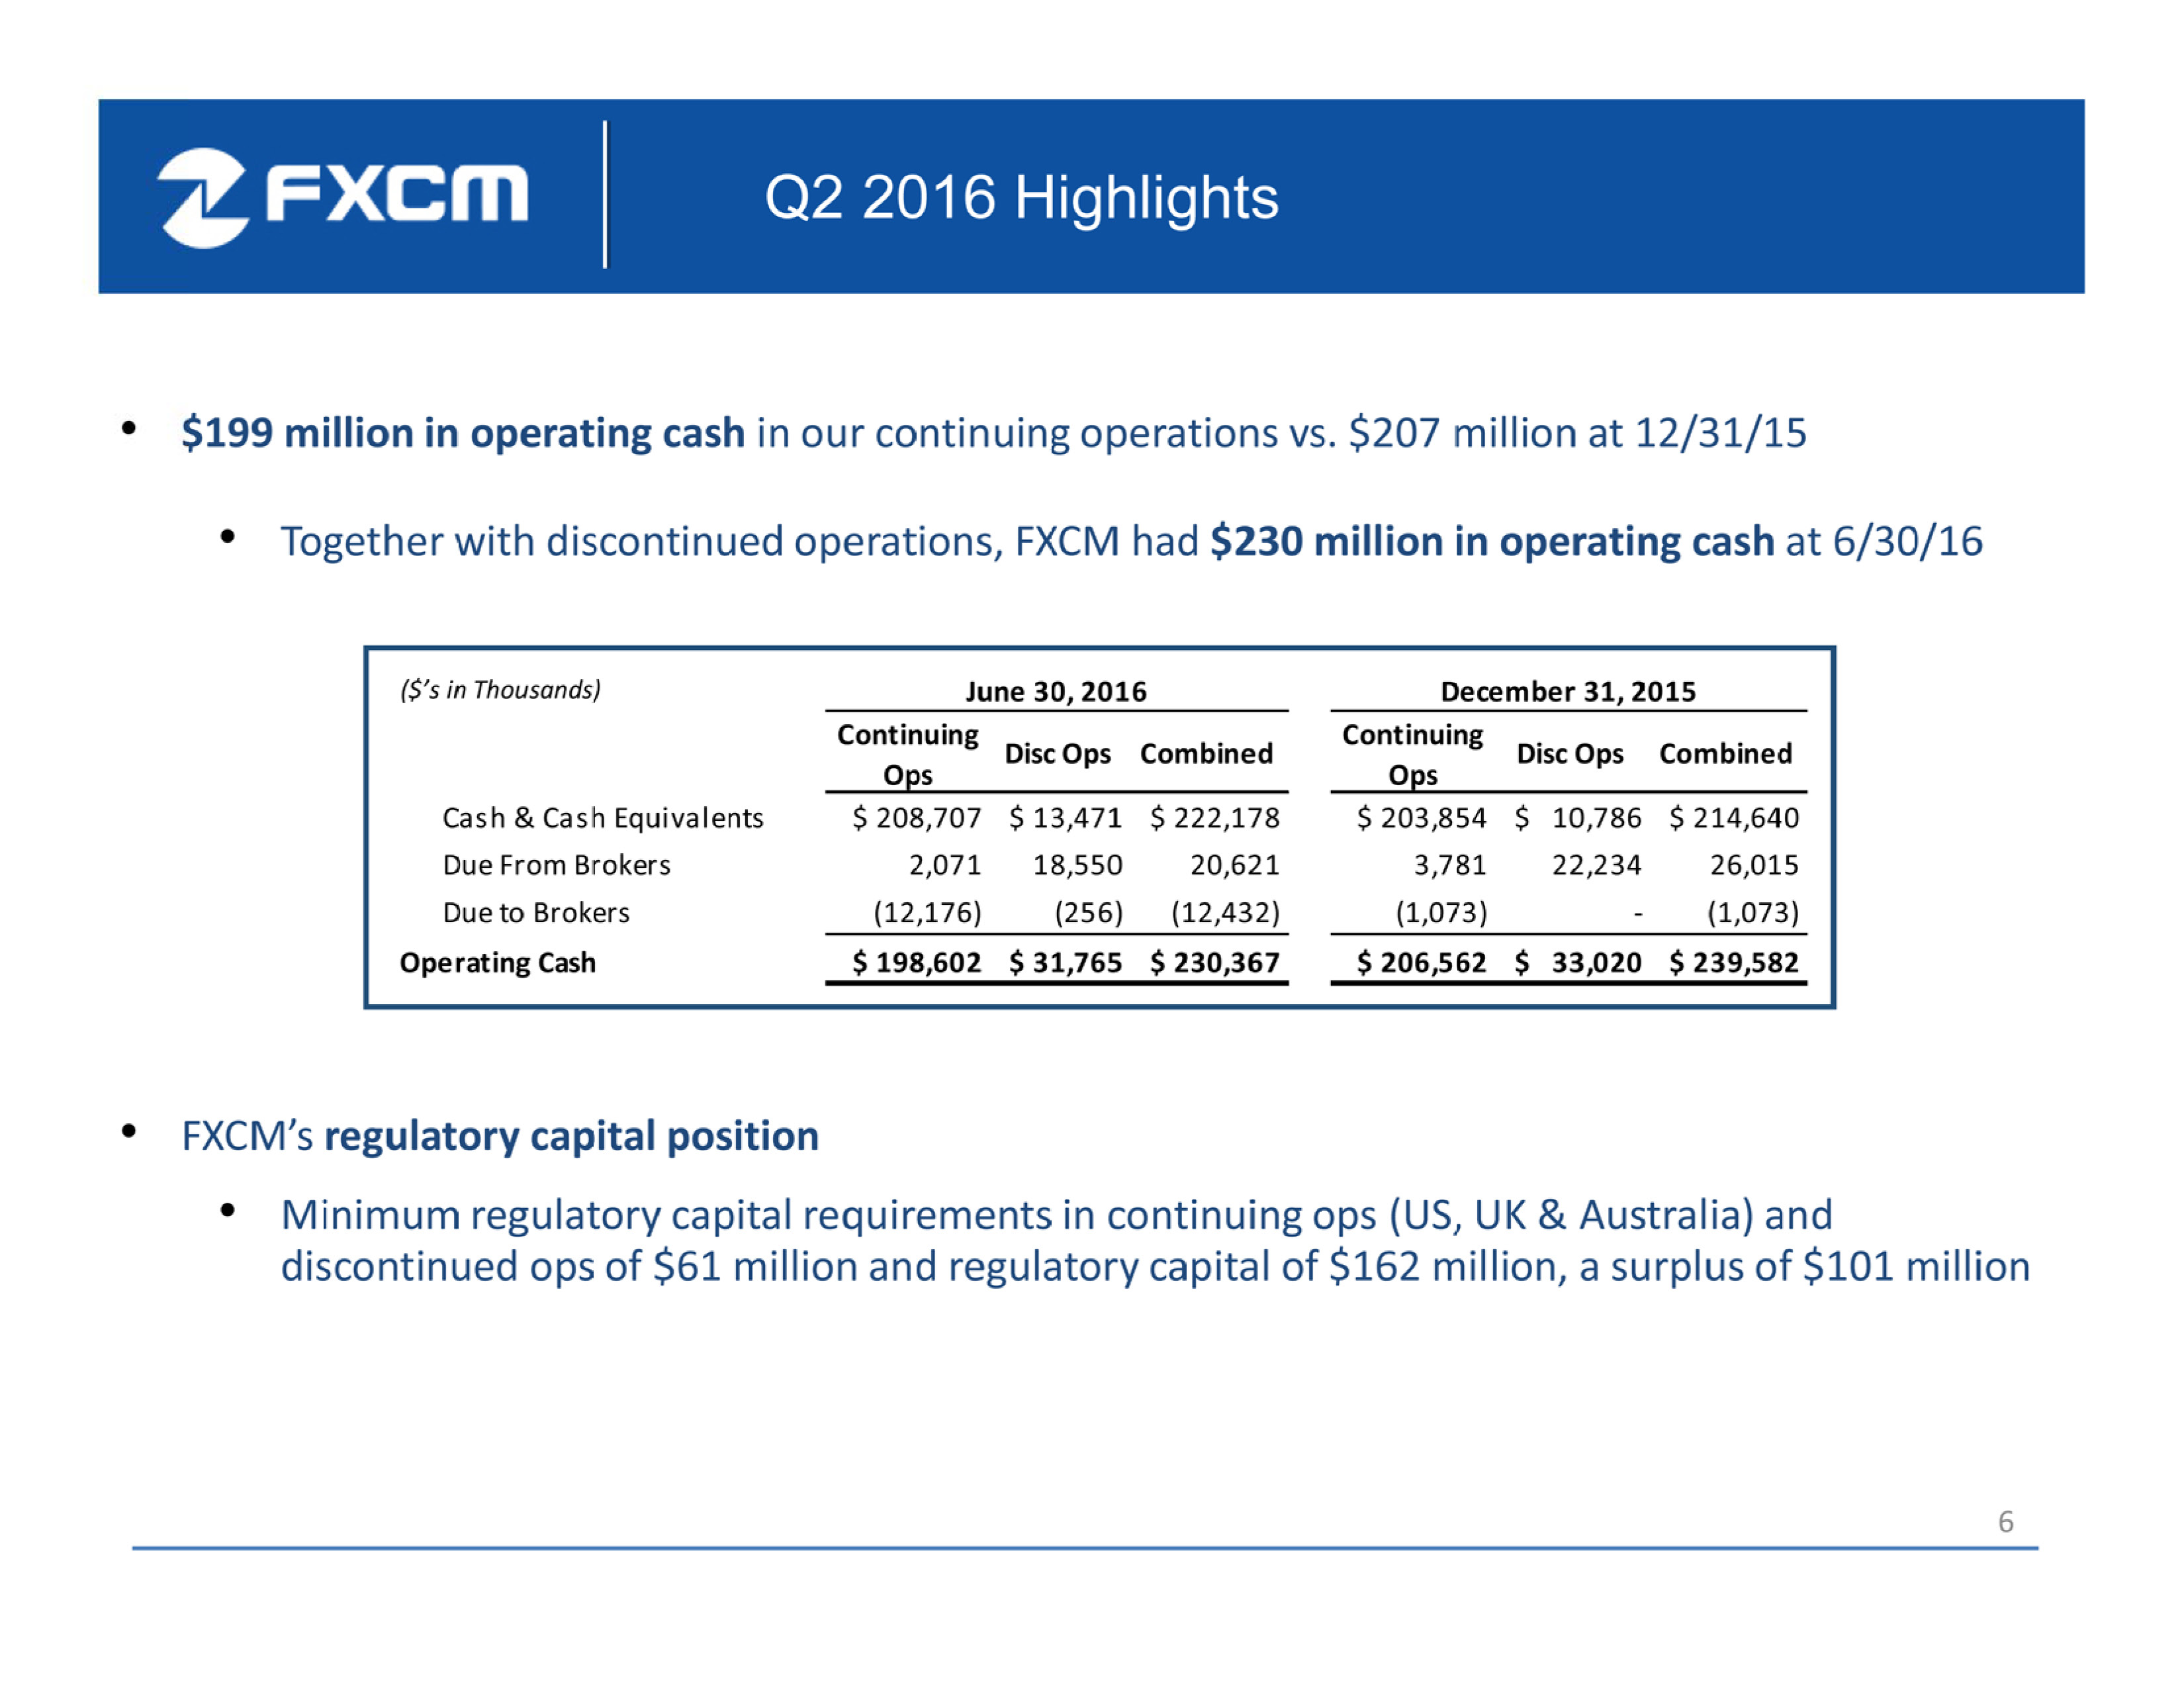
6 Q2 2016 Highlights • $199 million in operating cash in our continuing operations vs. $207 million at 12/31/15 • Together with discontinued operations, FXCM had $230 million in operating cash at 6/30/16 • FXCM’s regulatory capital position • Minimum regulatory capital requirements in continuing ops (US, UK & Australia) and discontinued ops of $61 million and regulatory capital of $162 million, a surplus of $101 million Continuing Ops Disc Ops Combined Continuing Ops Disc Ops Combined Cash & Cash Equivalents $ 208,707 $ 13,471 $ 222,178 $ 203,854 $ 10,786 $ 214,640 Due From Brokers 2,071 18,550 20,621 3,781 22,234 26,015 Due to Brokers (12,176) (256) (12,432) (1,073) - (1,073) Operating Cash $ 198,602 $ 31,765 $ 230,367 $ 206,562 $ 33,020 $ 239,582 June 30, 2016 December 31, 2015 ($’s in Thousands)
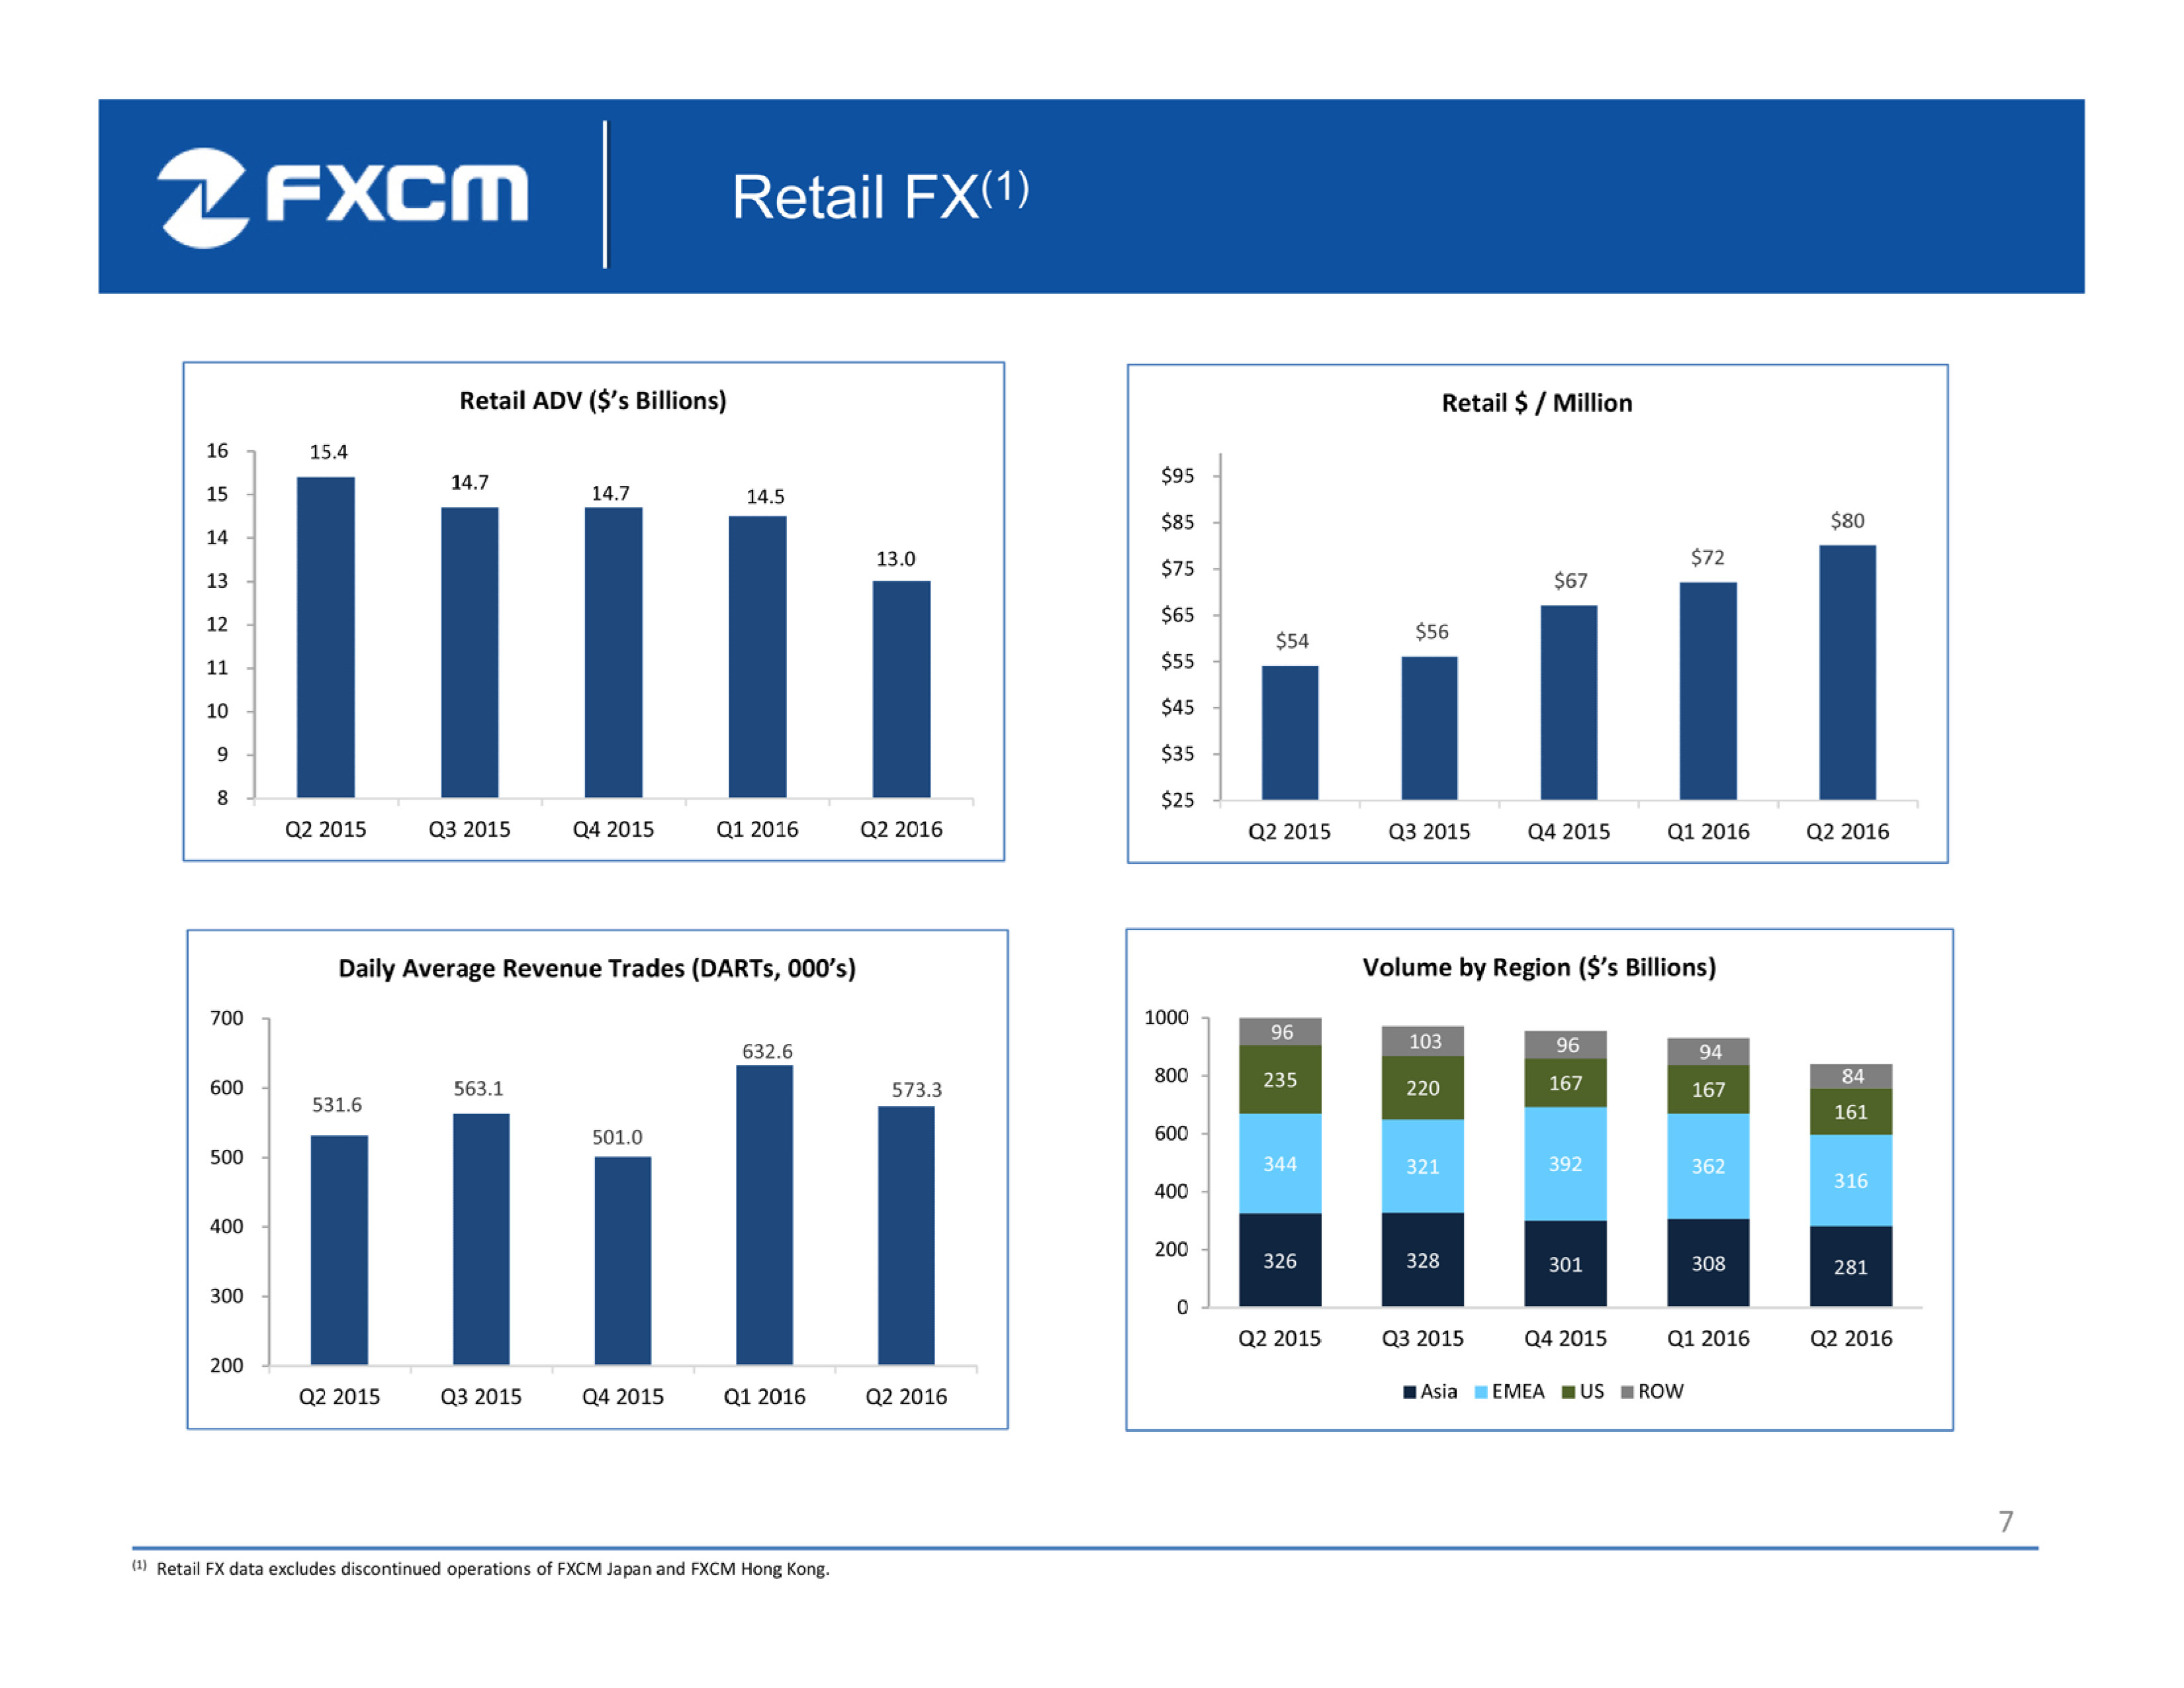
7 Retail FX (1) 15.4 14.7 14.7 14.5 13.0 8 9 10 11 12 13 14 15 16 Q2 2015 Q3 2015 Q4 2015 Q1 2016 Q2 2016 Retail ADV ($’s Billions) $54 $56 $67 $72 $80 $25 $35 $45 $55 $65 $75 $85 $95 Q2 2015 Q3 2015 Q4 2015 Q1 2016 Q2 2016 Retail $ / Million 531.6 563.1 501.0 632.6 573.3 200 300 400 500 600 700 Q2 2015 Q3 2015 Q4 2015 Q1 2016 Q2 2016 Daily Average Revenue Trades (DARTs, 000’s) 326 328 301 308 281 344 321 392 362 316 235 220 167 167 161 96 103 96 94 84 0 200 400 600 800 1000 Q2 2015 Q3 2015 Q4 2015 Q1 2016 Q2 2016 Volume by Region ($’s Billions) Asia EMEA US ROW (1) Retail FX data excludes discontinued operations of FXCM Japan and FXCM Hong Kong.
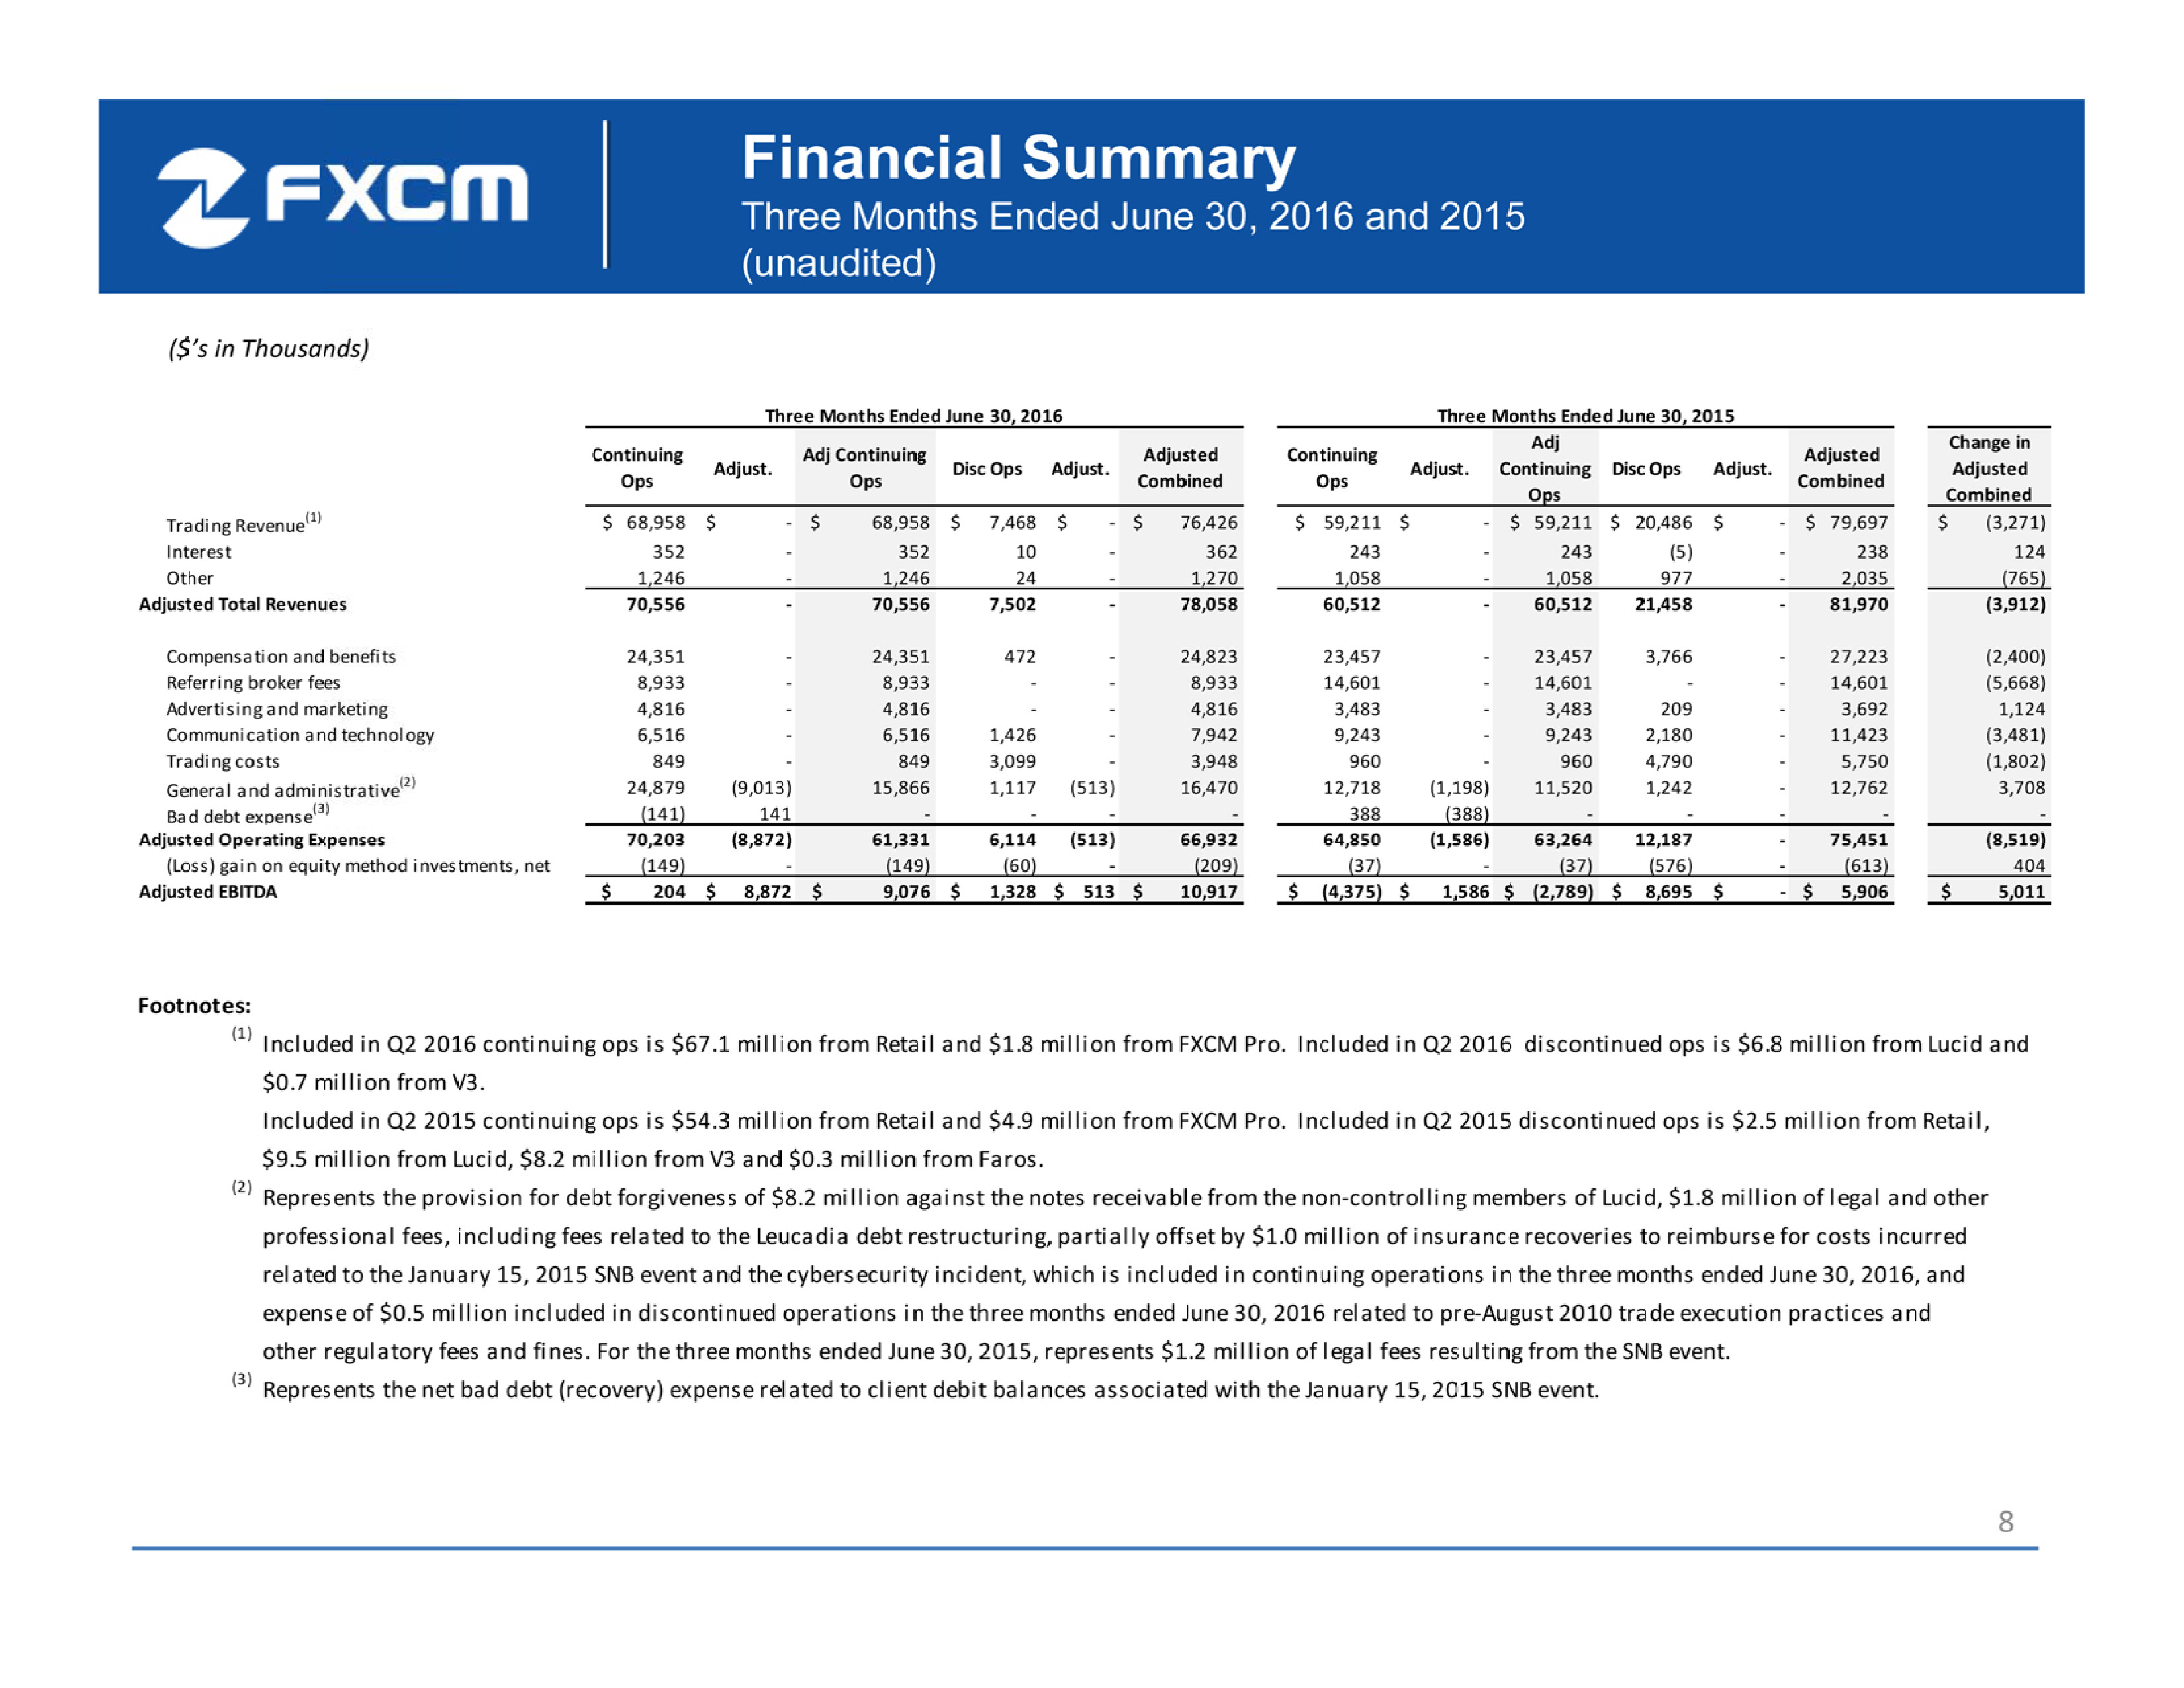
8 Financial Summary Three Months Ended June 30, 2016 and 2015 (unaudited ) ($’s in Thousands) Continuing Ops Adjust. Adj Continuing Ops Disc Ops Adjust. Adjusted Combined Continuing Ops Adjust. Adj Continuing Ops Disc Ops Adjust. Adjusted Combined Change in Adjusted Combined Trading Revenue (1) $ 68,958 $ - $ 68,958 $ 7,468 $ - $ 76,426 $ 59,211 $ - $ 59,211 $ 20,486 $ - $ 79,697 $ (3,271) Interest 352 - 352 10 - 362 243 - 243 (5) - 238 124 Other 1,246 - 1,246 24 - 1,270 1,058 - 1,058 977 - 2,035 (765) Adjusted Total Revenues 70,556 - 70,556 7,502 - 78,058 60,512 - 60,512 21,458 - 81,970 (3,912) Compensation and benefits 24,351 - 24,351 472 - 24,823 23,457 - 23,457 3,766 - 27,223 (2,400) Referring broker fees 8,933 - 8,933 - - 8,933 14,601 - 14,601 - - 14,601 (5,668) Advertising and marketing 4,816 - 4,816 - - 4,816 3,483 - 3,483 209 - 3,692 1,124 Communication and technology 6,516 - 6,516 1,426 - 7,942 9,243 - 9,243 2,180 - 11,423 (3,481) Trading costs 849 - 849 3,099 - 3,948 960 - 960 4,790 - 5,750 (1,802) General and administrative (2) 24,879 (9,013) 15,866 1,117 (513) 16,470 12,718 (1,198) 11,520 1,242 - 12,762 3,708 Bad debt expense (3) (141) 141 - - - - 388 (388) - - - - - Adjusted Operating Expenses 70,203 (8,872) 61,331 6,114 (513) 66,932 64,850 (1,586) 63,264 12,187 - 75,451 (8,519) (Loss) gain on equity method investments, net (149) - (149) (60) - (209) (37) - (37) (576) - (613) 404 Adjusted EBITDA $ 204 $ 8,872 $ 9,076 $ 1,328 $ 513 $ 10,917 $ (4,375) $ 1,586 $ (2,789) $ 8,695 $ - $ 5,906 $ 5,011 Three Months Ended June 30, 2016 Three Months Ended June 30, 2015 Footnotes: (1) Included in Q2 2016 continuing ops is $67.1 million from Retail and $1.8 million from FXCM Pro. Included in Q2 2016 discontinued ops is $6.8 million from Lucid and $0.7 million from V3. Included in Q2 2015 continuing ops is $54.3 million from Retail and $4.9 million from FXCM Pro. Included in Q2 2015 discontinued ops is $2.5 million from Retail, $9.5 million from Lucid, $8.2 million from V3 and $0.3 million from Faros. (2) Represents the provision for debt forgiveness of $8.2 million against the notes receivable from the non-controlling members of Lucid, $1.8 million of legal and other professional fees, including fees related to the Leucadia debt restructuring, partially offset by $1.0 million of insurance recoveries to reimburse for costs incurred related to the January 15, 2015 SNB event and the cybersecurity incident, which is included in continuing operations in the three months ended June 30, 2016, and expense of $0.5 million included in discontinued operations in the three months ended June 30, 2016 related to pre-August 2010 trade execution practices and other regulatory fees and fines. For the three months ended June 30, 2015, represents $1.2 million of legal fees resulting from the SNB event. (3) Represents the net bad debt (recovery) expense related to client debit balances associated with the January 15, 2015 SNB event.
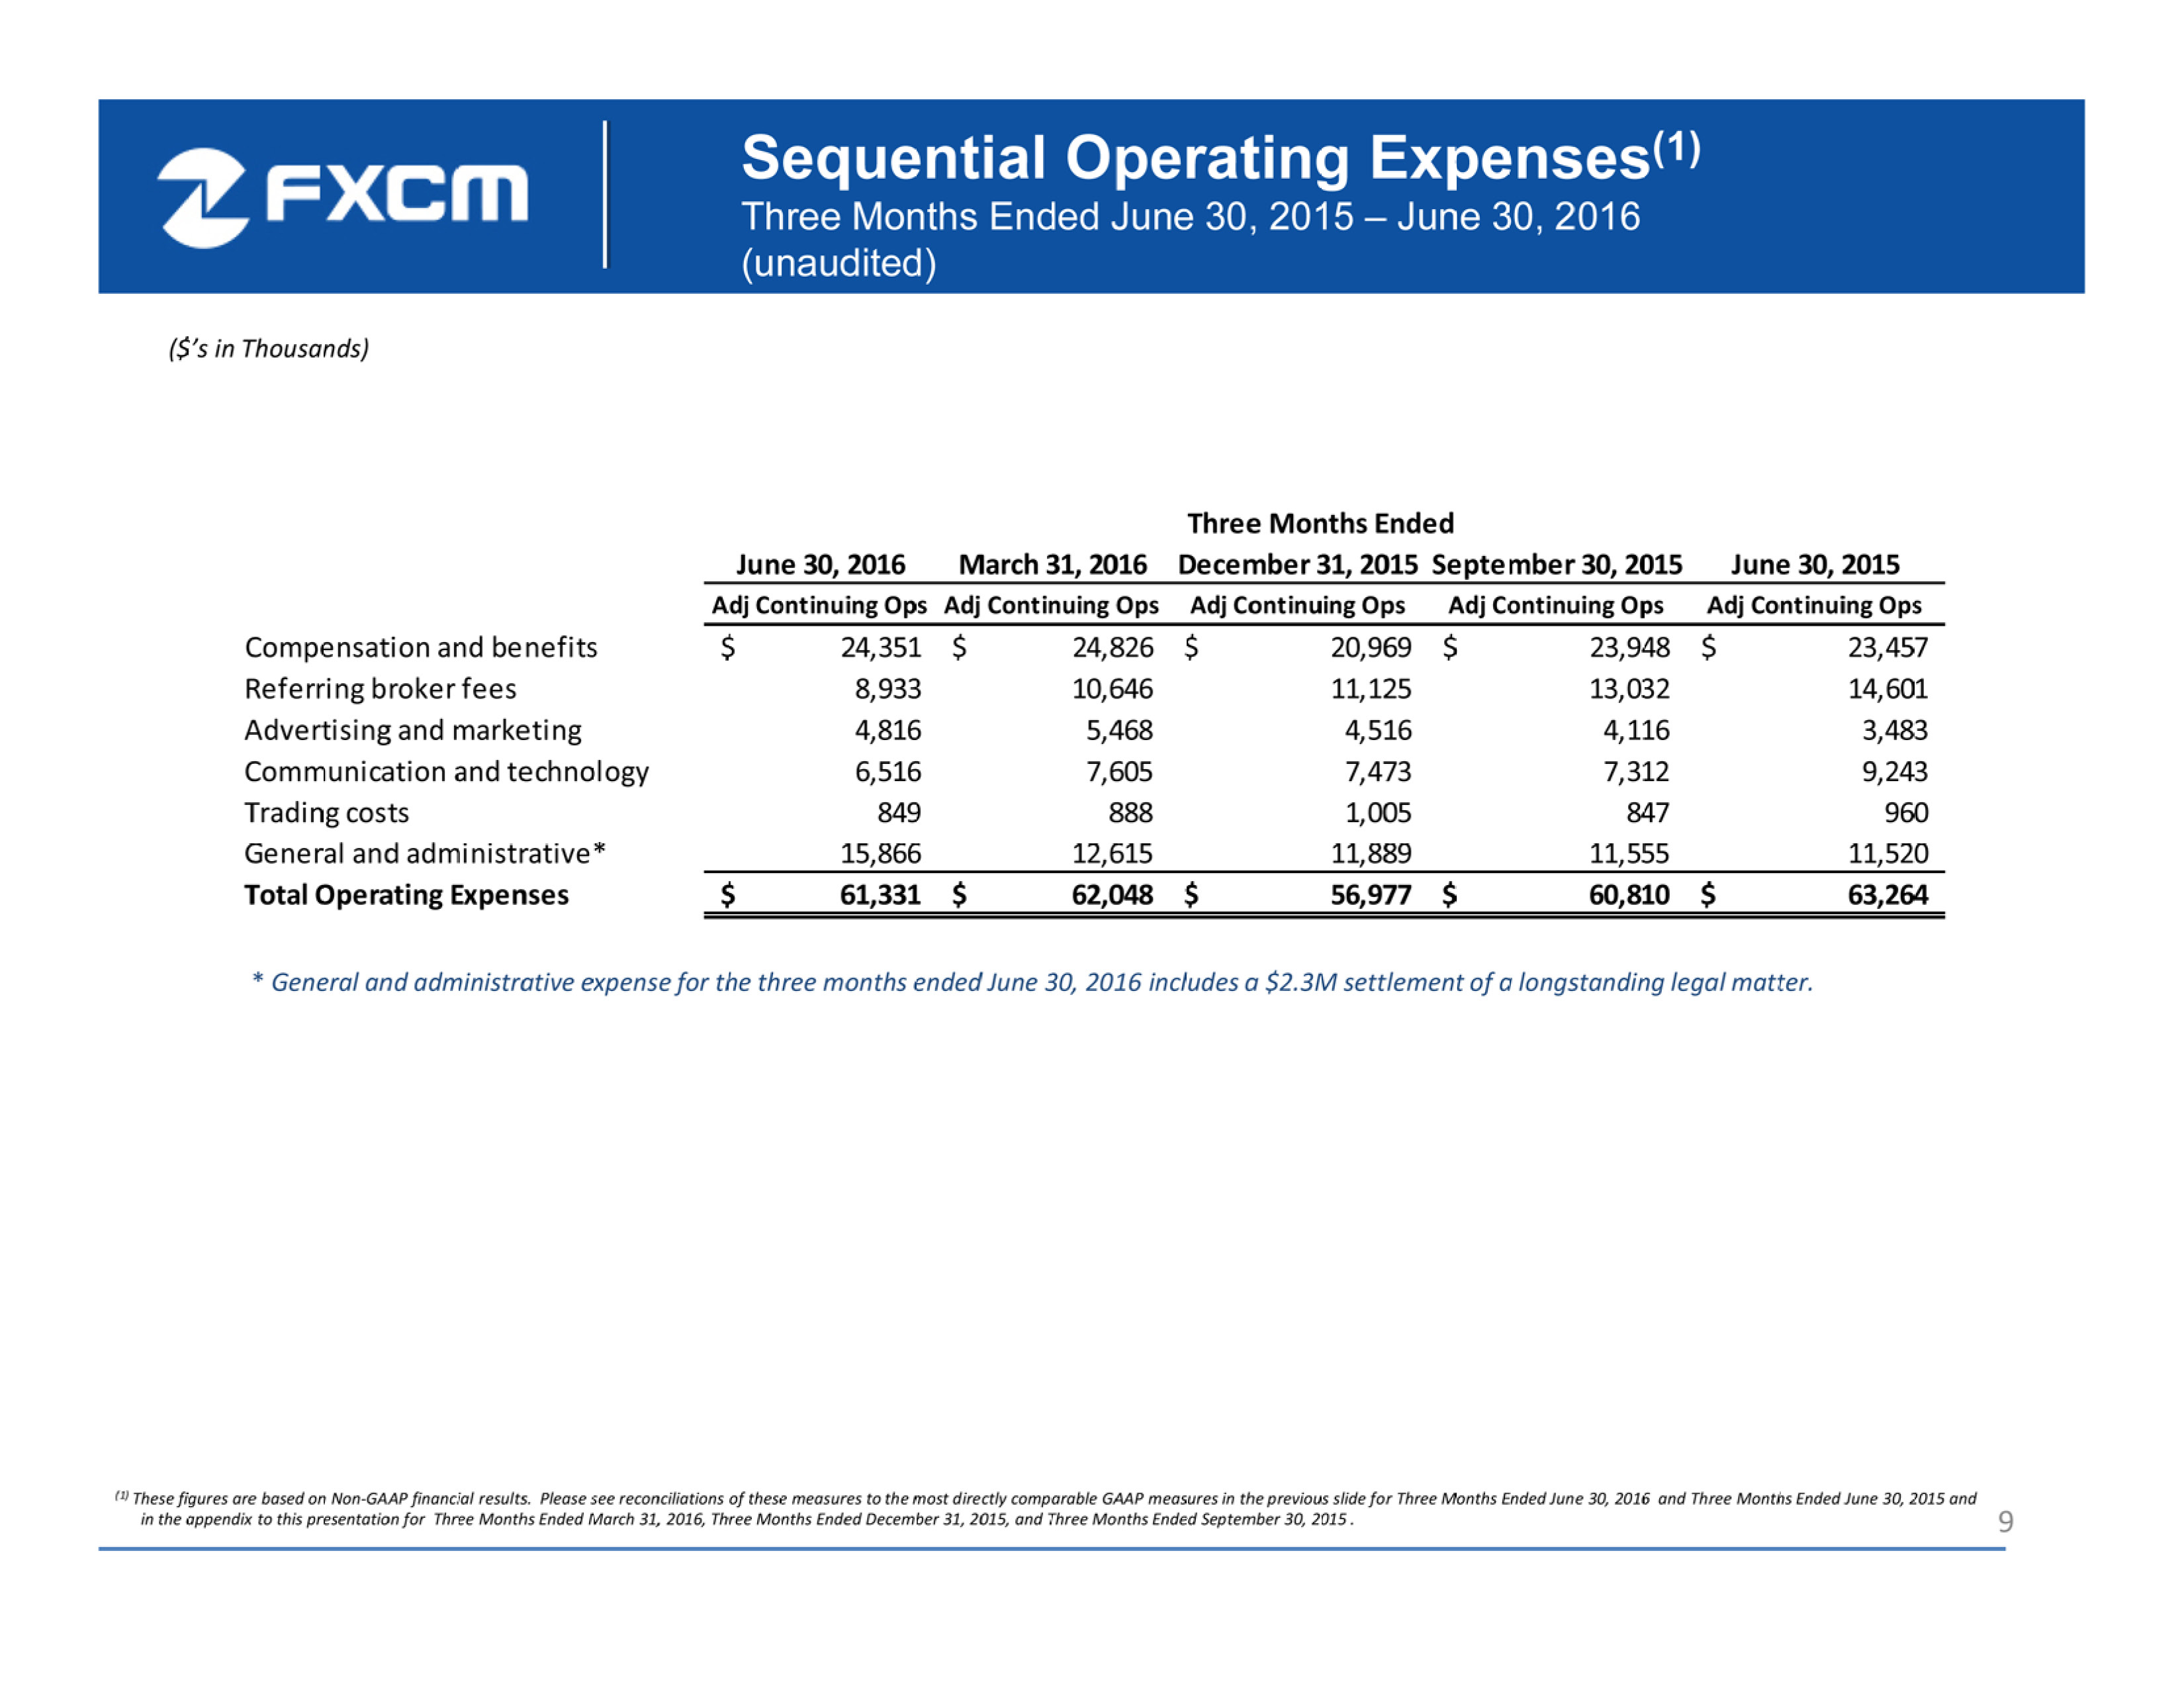
9 Sequential Operating Expenses (1) Three Months Ended June 30, 2015 – June 30, 2016 (unaudited) ($’s in Thousands) (1) These figures are based on Non - GAAP financial results. Please see reconciliations of these measures to the most directly compar able GAAP measures in the previous slide for Three Months Ended June 30, 2016 and Three Months Ended June 30, 2015 and in the appendix to this presentation for Three Months Ended March 31, 2016, Three Months Ended December 31, 2015, and Three Months Ended September 30, 2015 . June 30, 2016 March 31, 2016 December 31, 2015September 30, 2015 June 30, 2015 Adj Continuing Ops Adj Continuing Ops Adj Continuing Ops Adj Continuing Ops Adj Continuing Ops Compensation and benefits 24,351$ 24,826$ 20,969$ 23,948$ 23,457$ Referring broker fees 8,933 10,646 11,125 13,032 14,601 Advertising and marketing 4,816 5,468 4,516 4,116 3,483 Communication and technology 6,516 7,605 7,473 7,312 9,243 Trading costs 849 888 1,005 847 960 General and administrative* 15,866 12,615 11,889 11,555 11,520 Total Operating Expenses 61,331$ 62,048$ 56,977$ 60,810$ 63,264$ Three Months Ended * General and administrative expense for the three months ended June 30, 2016 includes a $2.3M settlement of a longstanding leg al matter.
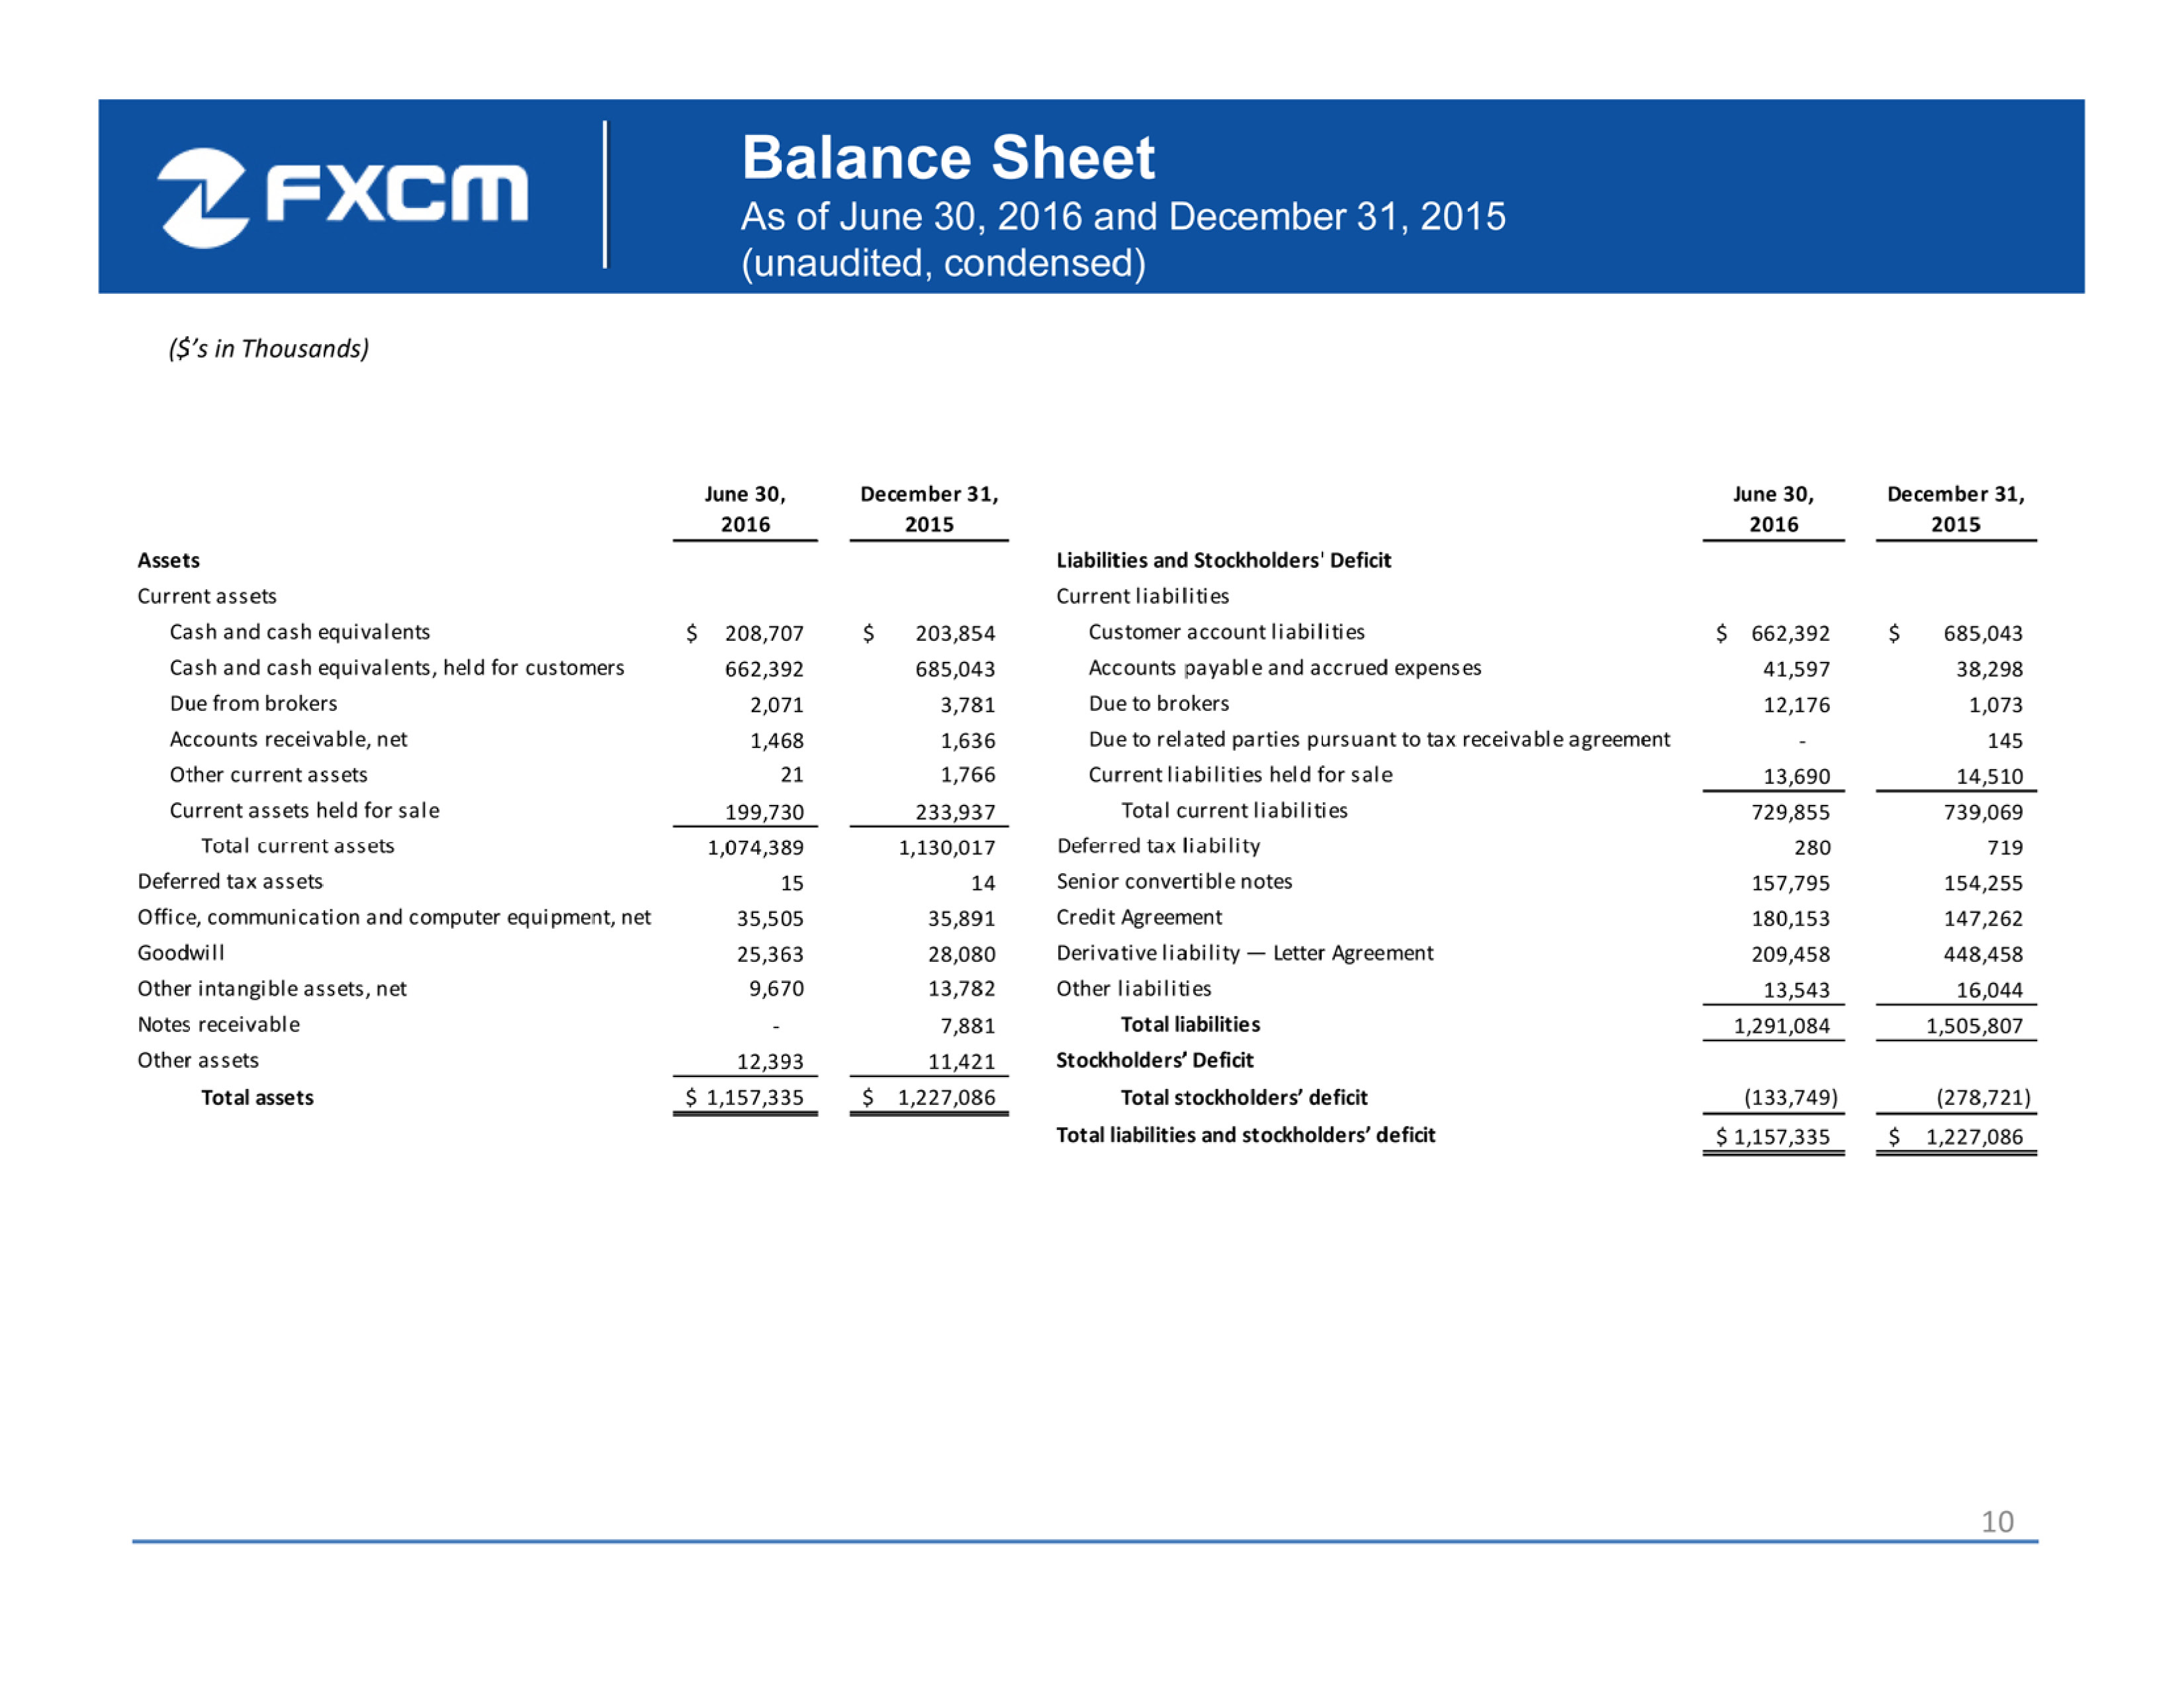
10 Balance Sheet As of June 30, 2016 and December 31, 2015 ( unaudited, condensed) ($’s in Thousands) June 30, 2016 December 31, 2015 June 30, 2016 December 31, 2015 Assets Liabilities and Stockholders' Deficit Current assets Current liabilities Cash and cash equivalents 208,707$ 203,854$ Customer account liabilities 662,392$ 685,043$ Cash and cash equivalents, held for customers 662,392 685,043 Accounts payable and accrued expenses 41,597 38,298 Due from brokers 2,071 3,781 Due to brokers 12,176 1,073 Accounts receivable, net 1,468 1,636 Due to related parties pursuant to tax receivable agreement - 145 Other current assets 21 1,766 Current liabilities held for sale 13,690 14,510 Current assets held for sale 199,730 233,937 Total current liabilities 729,855 739,069 Total current assets 1,074,389 1,130,017 Deferred tax liability 280 719 Deferred tax assets 15 14 Senior convertible notes 157,795 154,255 Office, communication and computer equipment, net 35,505 35,891 Credit Agreement 180,153 147,262 Goodwill 25,363 28,080 Derivative liability — Letter Agreement 209,458 448,458 Other intangible assets, net 9,670 13,782 Other liabilities 13,543 16,044 Notes receivable - 7,881 Total liabilities 1,291,084 1,505,807 Other assets 12,393 11,421 Stockholders’ Deficit Total assets 1,157,335$ 1,227,086$ Total stockholders’ deficit (133,749) (278,721) Total liabilities and stockholders’ deficit 1,157,335$ 1,227,086$
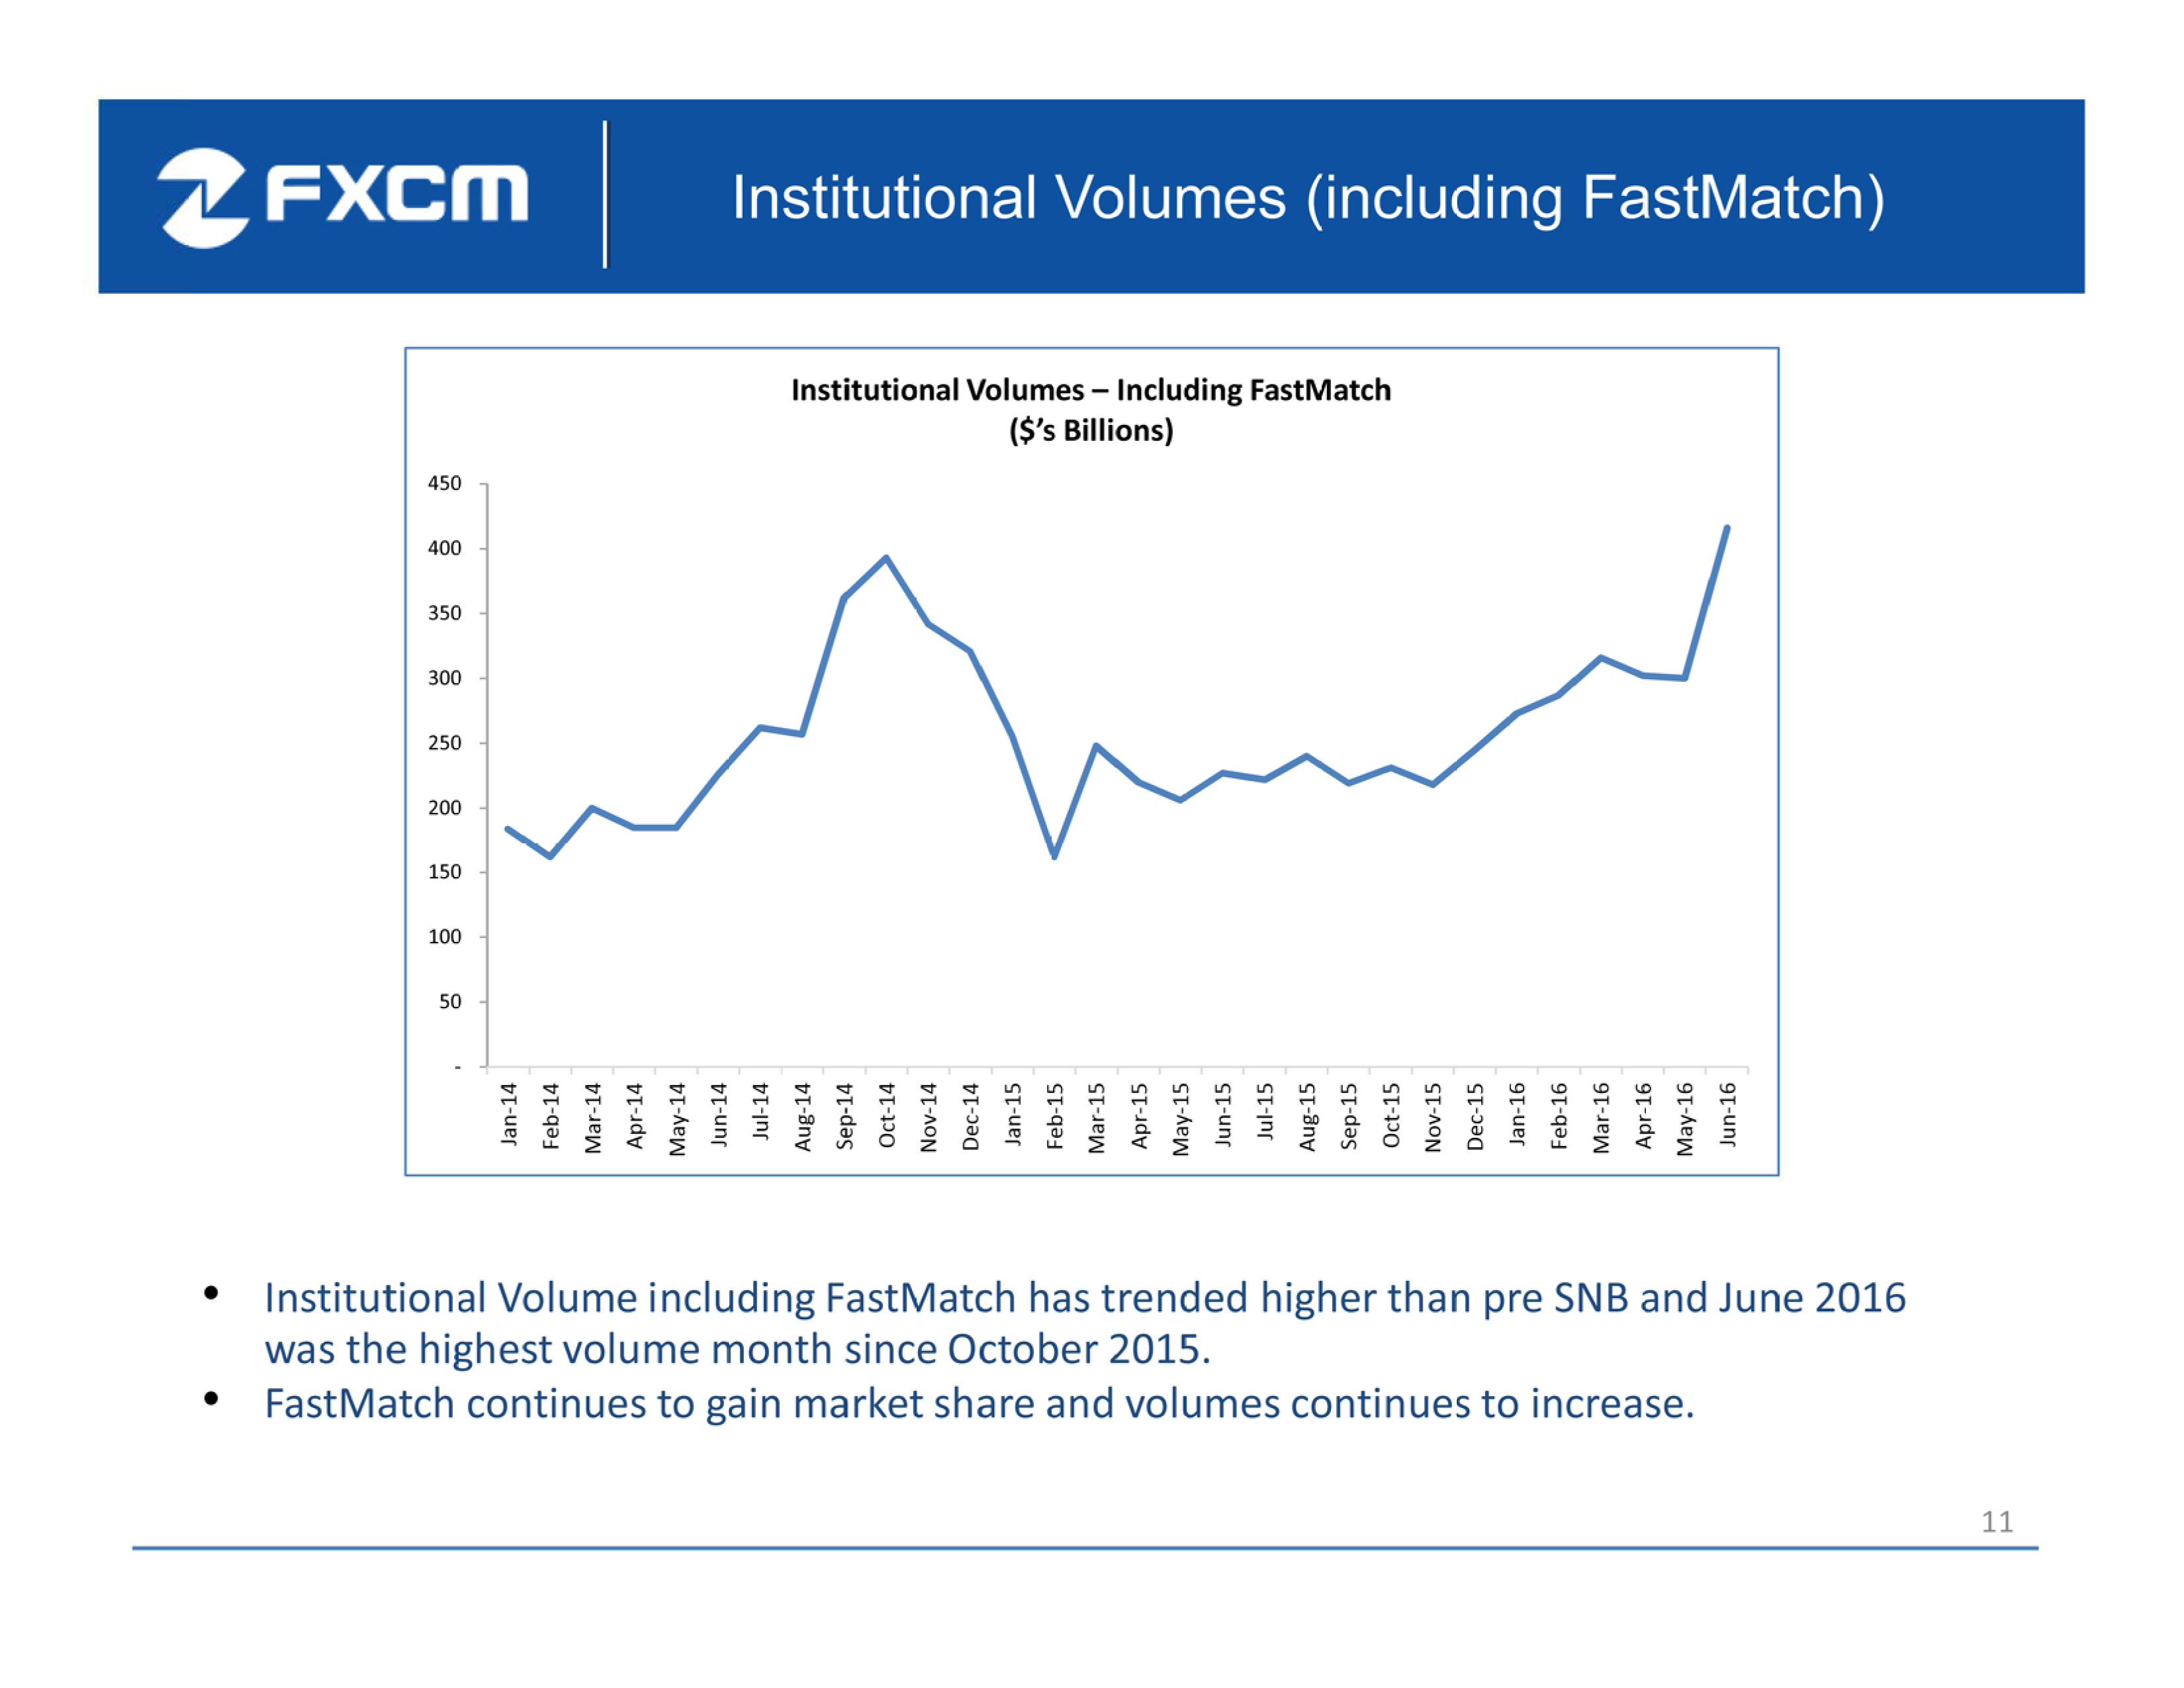
11 Institutional Volumes (including FastMatch ) - 50 100 150 200 250 300 350 400 450 Jan-14 Feb-14 Mar-14 Apr-14 May-14 Jun-14 Jul-14 Aug-14 Sep-14 Oct-14 Nov-14 Dec-14 Jan-15 Feb-15 Mar-15 Apr-15 May-15 Jun-15 Jul-15 Aug-15 Sep-15 Oct-15 Nov-15 Dec-15 Jan-16 Feb-16 Mar-16 Apr-16 May-16 Jun-16 Institutional Volumes – Including FastMatch ($’s Billions) • Institutional Volume including FastMatch has trended higher than pre SNB and June 2016 was the highest volume month since October 2015. • FastMatch continues to gain market share and volumes continues to increase.
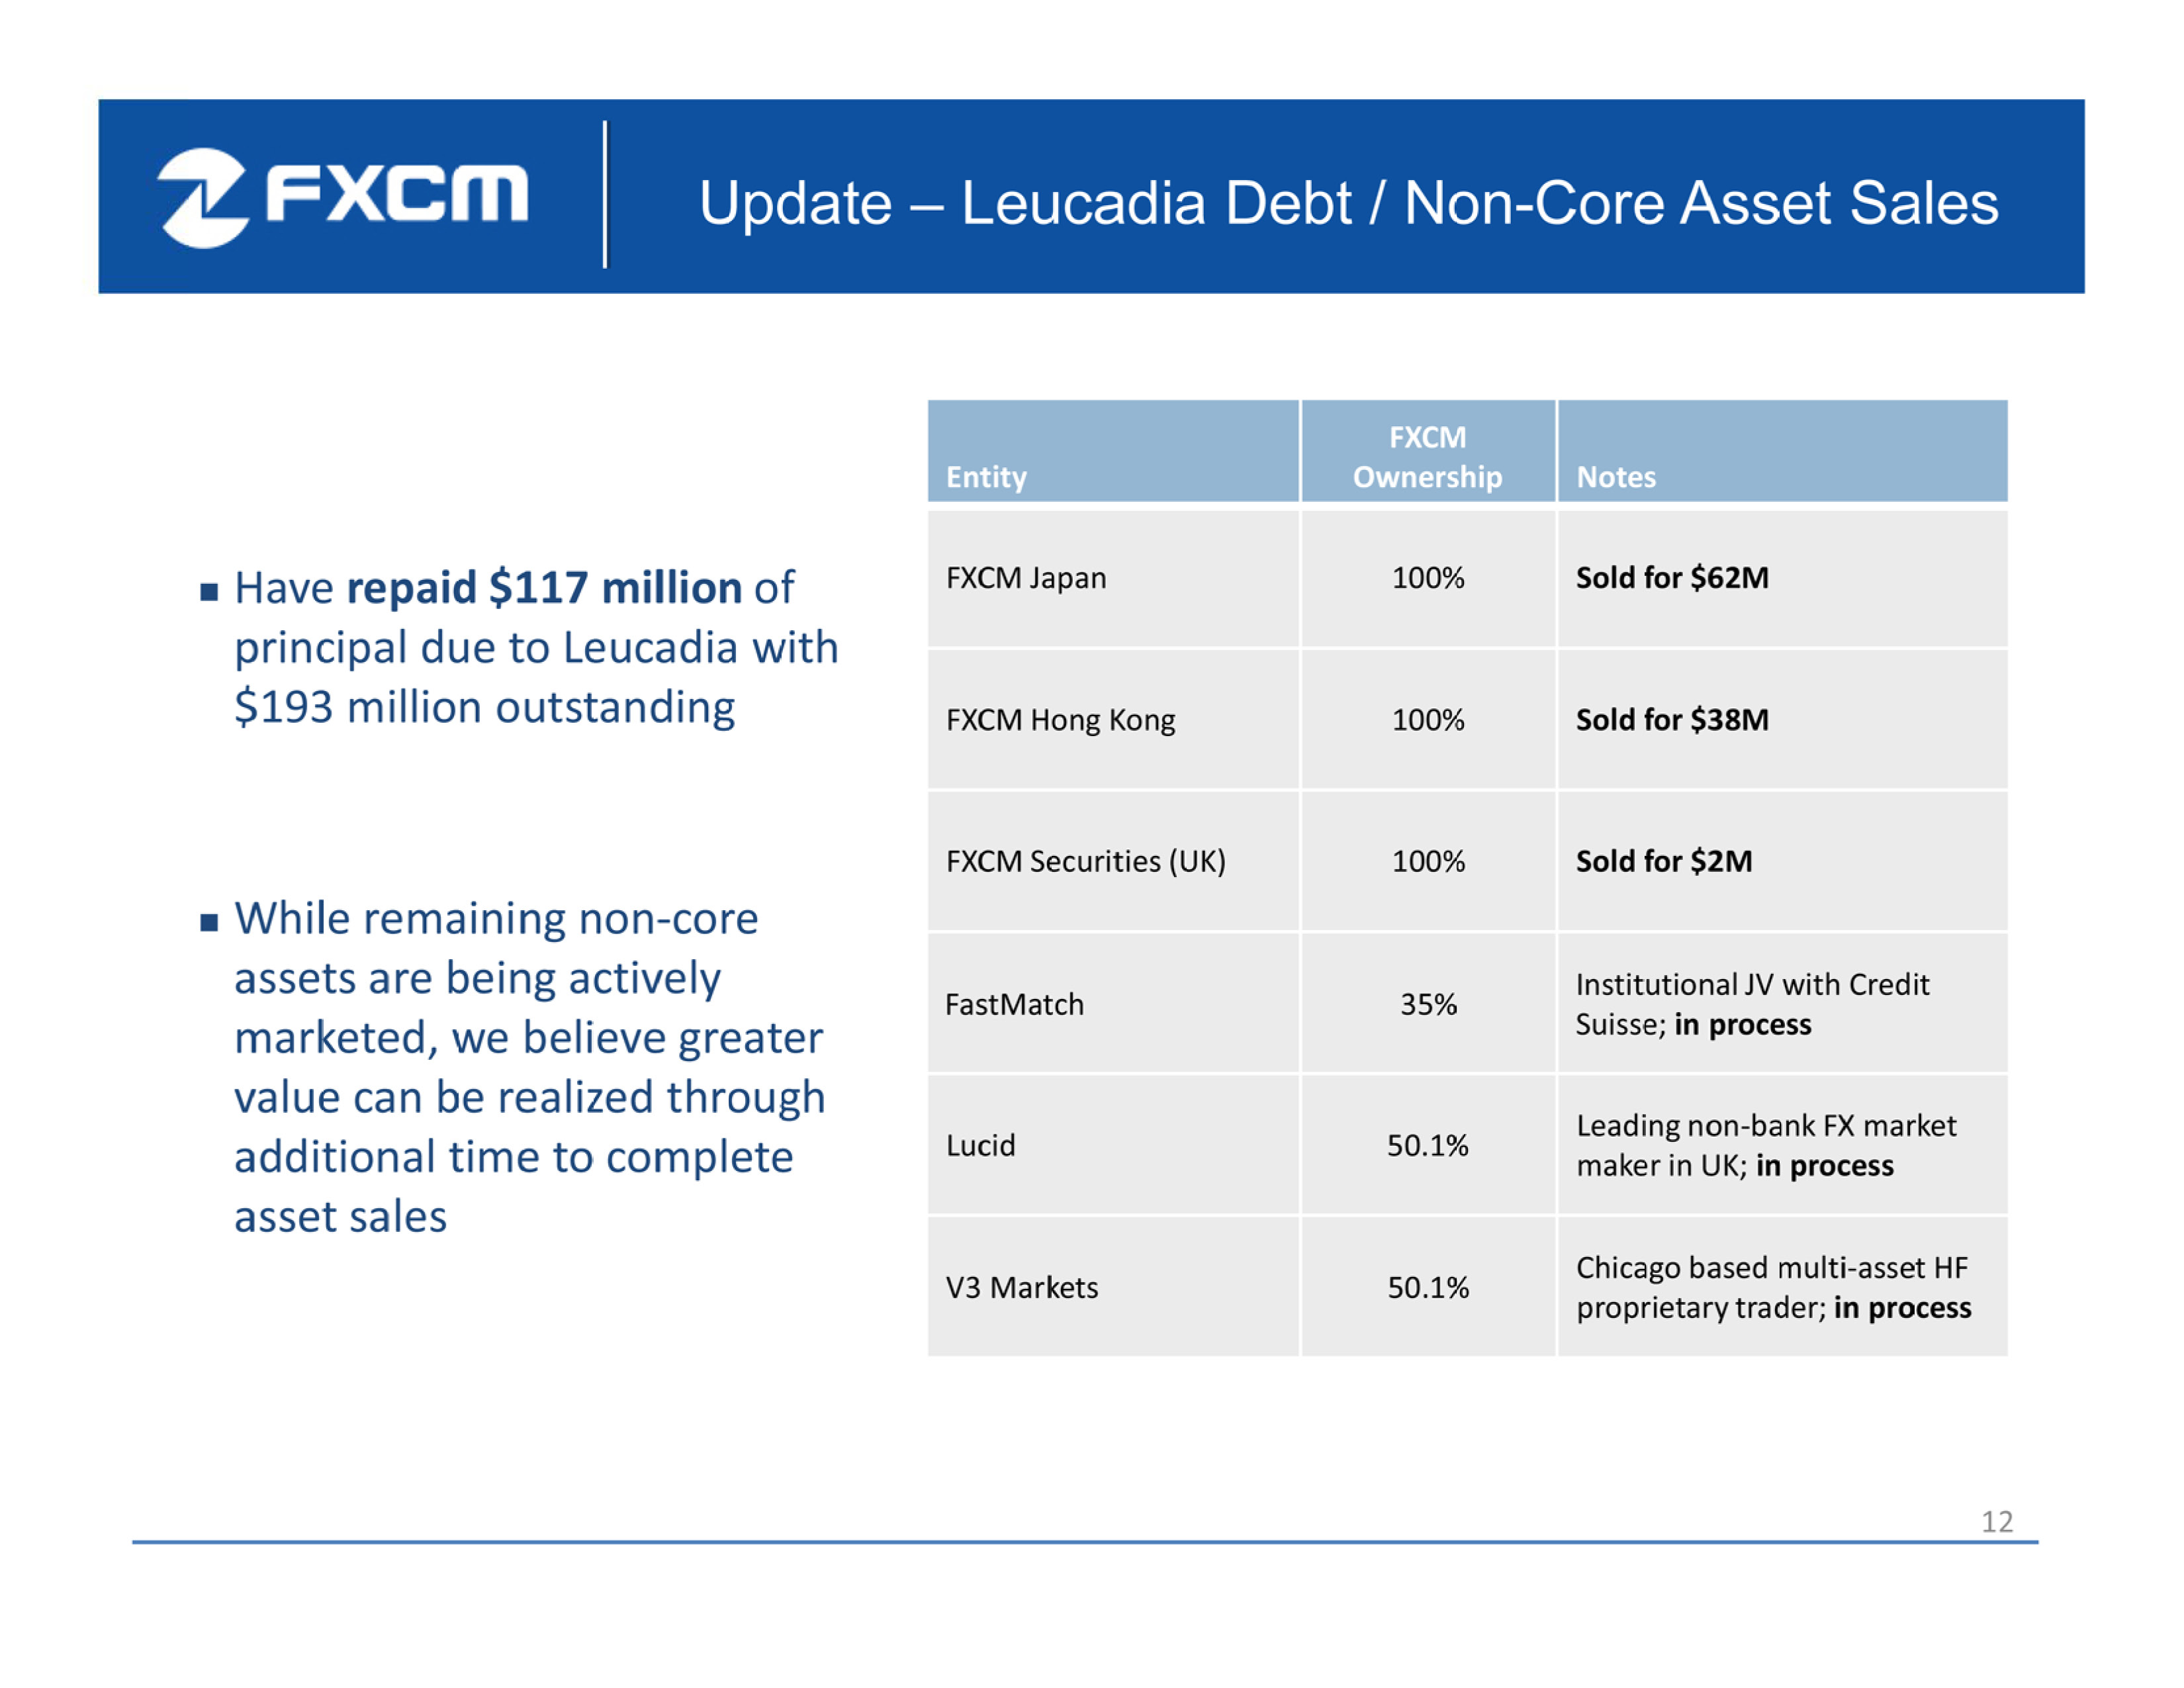
12 Update – Leucadia Debt / Non - Core Asset Sales Have repaid $117 million of principal due to Leucadia with $193 million outstanding While remaining non - core assets are being actively marketed, we believe greater value can be realized through additional time to complete asset sales Entity FXCM Ownership Notes FXCM Japan 100% Sold for $62M FXCM Hong Kong 100% Sold for $38M FXCM Securities (UK) 100% Sold for $2M FastMatch 35% Institutional JV with Credit Suisse; in process Lucid 50.1% Leading non - bank FX market maker in UK; in process V3 Markets 50.1% Chicago based multi - asset HF proprietary trader; in process
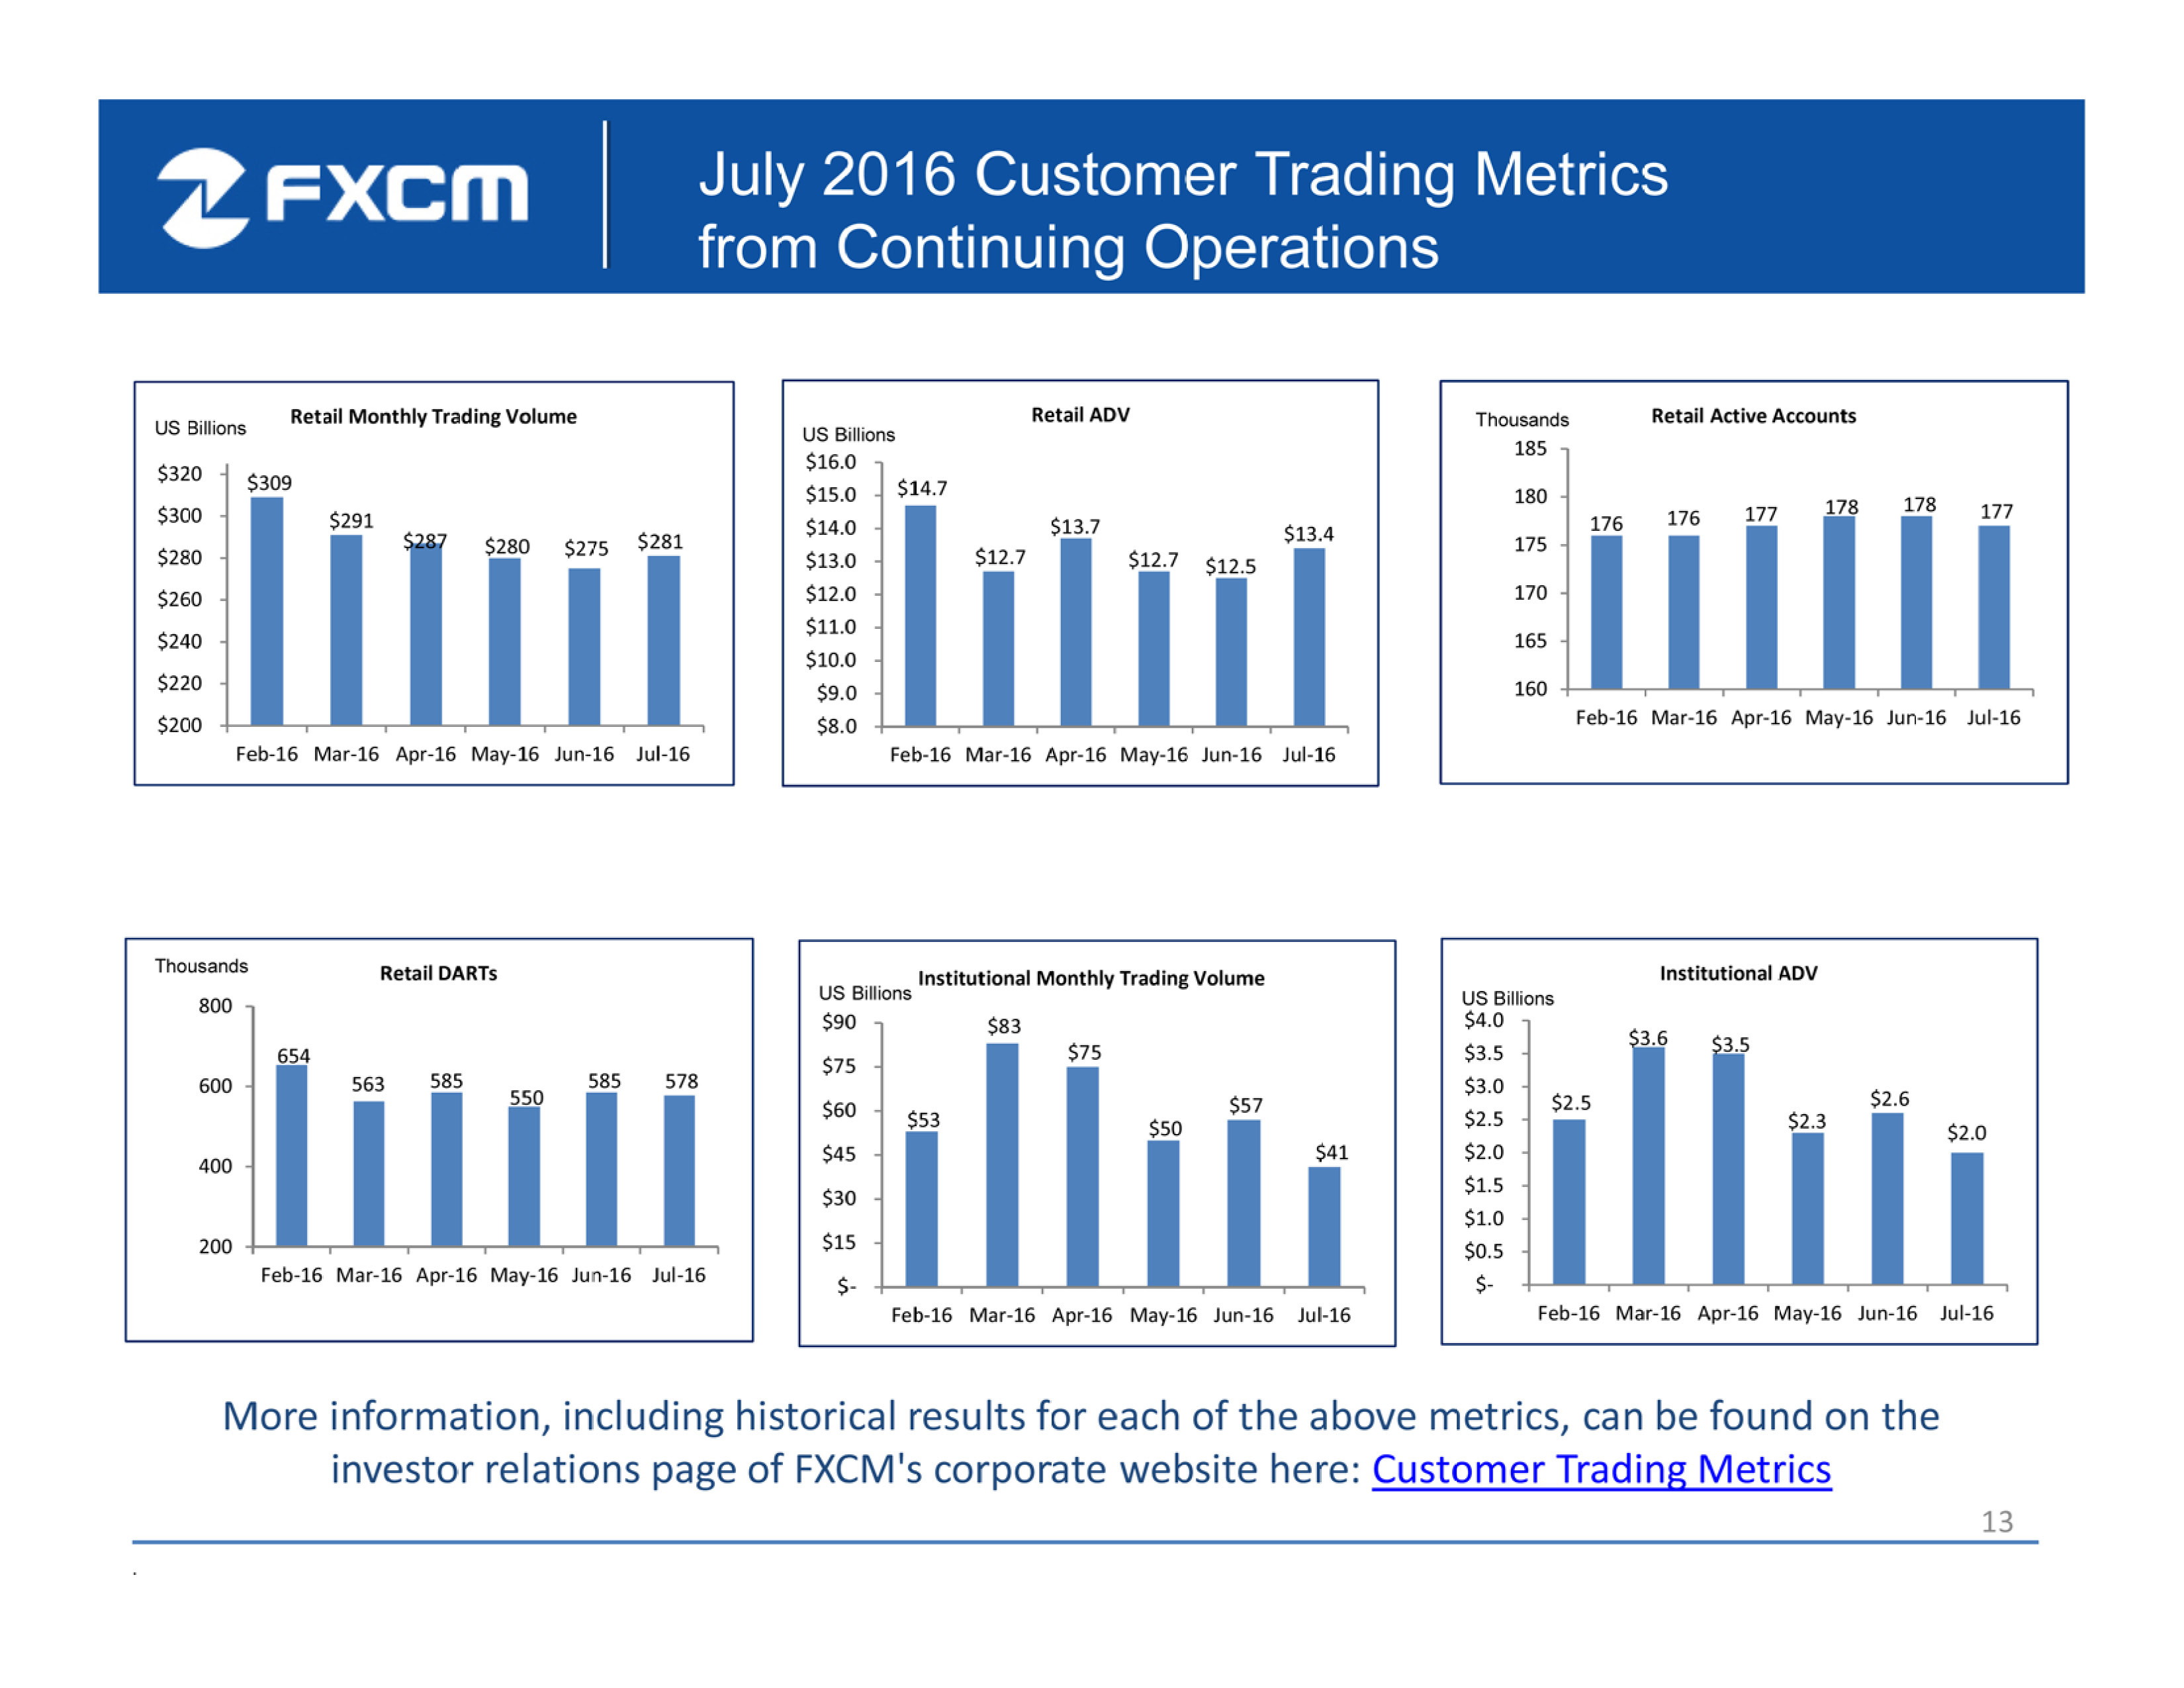
13 176 176 177 178 178 177 160 165 170 175 180 185 Feb-16 Mar-16 Apr-16 May-16 Jun-16 Jul-16 Retail Active Accounts $14.7 $12.7 $13.7 $12.7 $12.5 $13.4 $8.0 $9.0 $10.0 $11.0 $12.0 $13.0 $14.0 $15.0 $16.0 Feb-16 Mar-16 Apr-16 May-16 Jun-16 Jul-16 Retail ADV US Billions $53 $83 $75 $50 $57 $41 $- $15 $30 $45 $60 $75 $90 Feb-16 Mar-16 Apr-16 May-16 Jun-16 Jul-16 Institutional Monthly Trading Volume US Billions $2.5 $3.6 $3.5 $2.3 $2.6 $2.0 $- $0.5 $1.0 $1.5 $2.0 $2.5 $3.0 $3.5 $4.0 Feb-16 Mar-16 Apr-16 May-16 Jun-16 Jul-16 Institutional ADV US Billions July 2016 Customer Trading Metrics from Continuing Operations . Thousands 654 563 585 550 585 578 200 400 600 800 Feb-16 Mar-16 Apr-16 May-16 Jun-16 Jul-16 Retail DARTs Thousands More information, including historical results for each of the above metrics, can be found on the investor relations page of FXCM's corporate website here: Customer Trading Metrics $309 $291 $287 $280 $275 $281 $200 $220 $240 $260 $280 $300 $320 Feb-16 Mar-16 Apr-16 May-16 Jun-16 Jul-16 Retail Monthly Trading Volume US Billions
14 Summary • Brexit - FXCM is pleased with the risk management steps the firm took including its decision to gradually raise margins as we did heading into the vote. The FXCM Trading Station operated normally throughout the Brexit market volatility and we received largely positive feedback from our customers through and after the event . • With initiatives implemented in 2015 and 2016, we continue to experience an increase in Revenue per Million and tradeable accounts in Q2 2016. • FXCM is committed to selling the remaining non - core assets, but we believe greater value can be realized with additional time to complete asset sales. • FastMatch processed record trading volume following the Brexit announcement on June 24 th . • Lucid had its best trading month in June 2016 since August 2015. • Leucadia has demonstrated its commitment to FXCM to provide greater financial flexibility on the credit agreement, enhance future growth by taking a direct stake in the operations and provide additional marketing strength for FXCM going forward. FXCM and Leucadia continue to work towards finalizing the terms of the MOU announced in March 2016 – targeting to close Third Quarter 2016.

15 Appendix
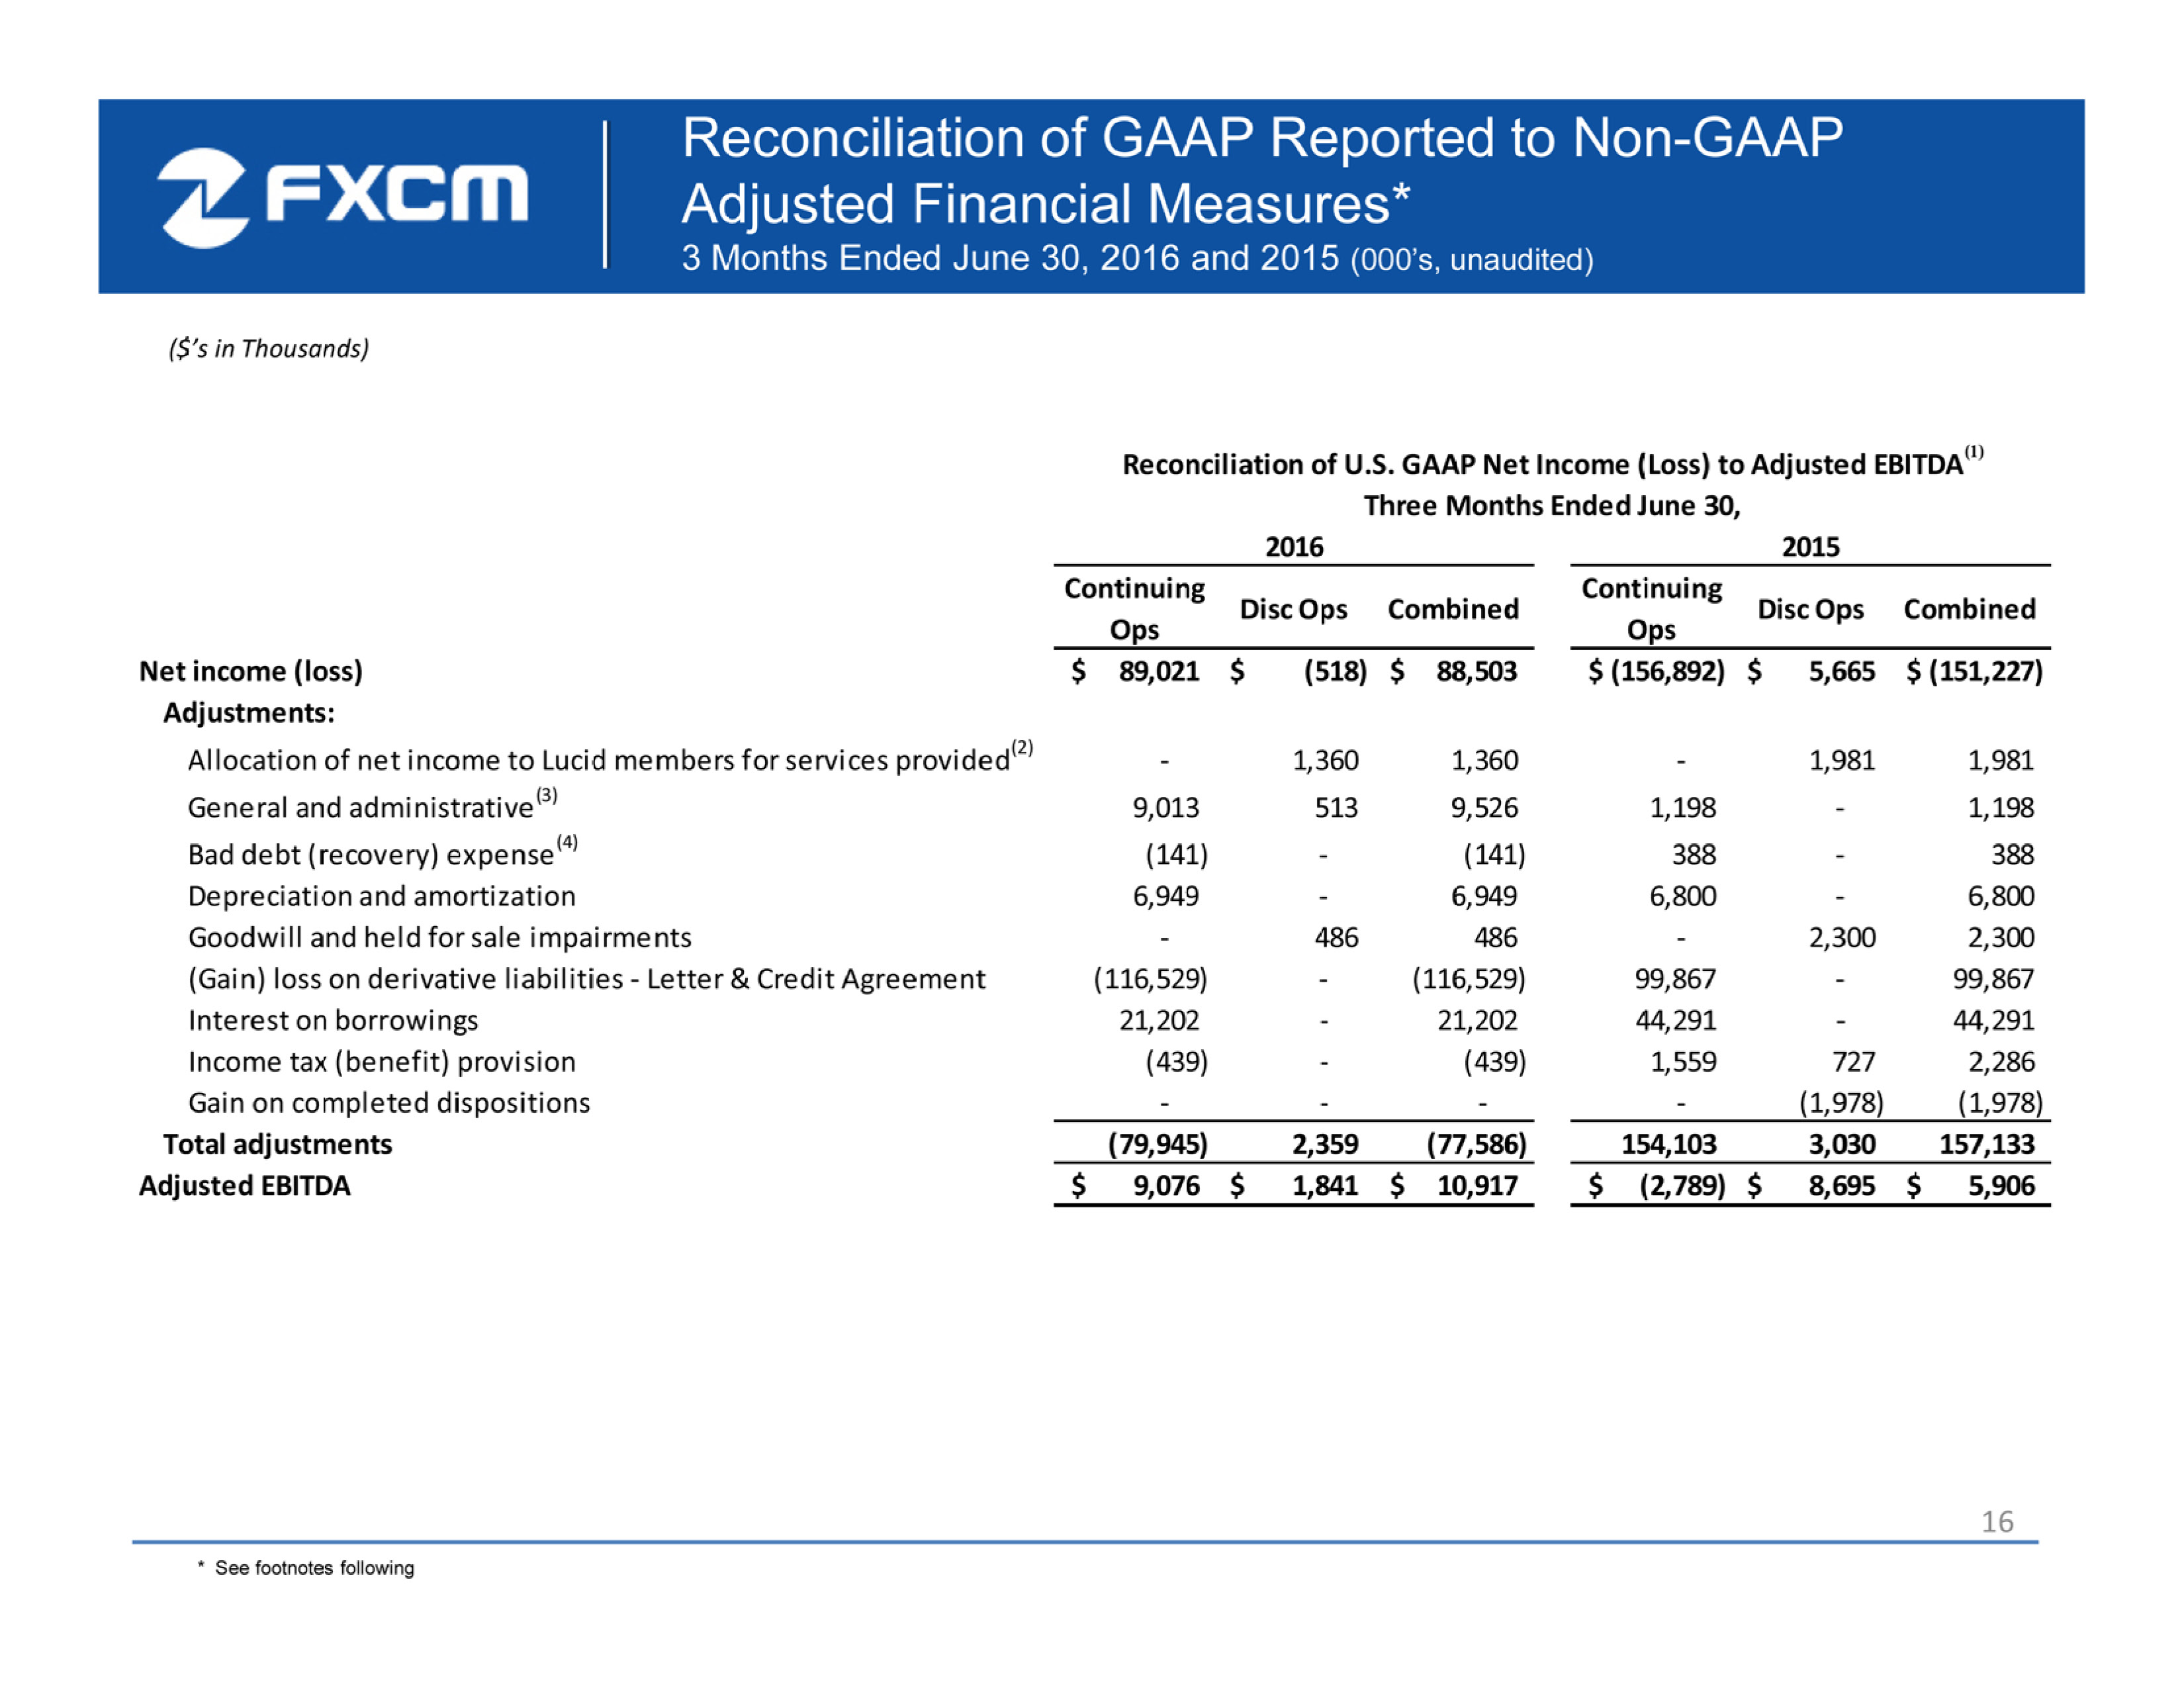
16 * See footnotes following Reconciliation of GAAP Reported to Non - GAAP Adjusted Financial Measures* 3 Months Ended June 30, 2016 and 2015 ( 000’s, unaudited) ($’s in Thousands) Continuing Ops Disc Ops Combined Continuing Ops Disc Ops Combined Net income (loss) 89,021$ (518)$ 88,503$ (156,892)$ 5,665$ (151,227)$ Adjustments: Allocation of net income to Lucid members for services provided (2) - 1,360 1,360 - 1,981 1,981 General and administrative (3) 9,013 513 9,526 1,198 - 1,198 Bad debt (recovery) expense (4) (141) - (141) 388 - 388 Depreciation and amortization 6,949 - 6,949 6,800 - 6,800 Goodwill and held for sale impairments - 486 486 - 2,300 2,300 (Gain) loss on derivative liabilities - Letter & Credit Agreement (116,529) - (116,529) 99,867 - 99,867 Interest on borrowings 21,202 - 21,202 44,291 - 44,291 Income tax (benefit) provision (439) - (439) 1,559 727 2,286 Gain on completed dispositions - - - - (1,978) (1,978) Total adjustments (79,945) 2,359 (77,586) 154,103 3,030 157,133 Adjusted EBITDA 9,076$ 1,841$ 10,917$ (2,789)$ 8,695$ 5,906$ Reconciliation of U.S. GAAP Net Income (Loss) to Adjusted EBITDA (1) Three Months Ended June 30, 2016 2015
17 Reconciliation of GAAP Reported to Non - GAAP Adjusted Financial Measures 3 Months Ended June 30, 2016 and 2015 (footnotes ) ( 1) Adjusted EBITDA is a Non - GAAP measure that is not prepared under any comprehensive set of accounting rules or principles and does not reflect all of the amounts associated with the Company's results of operations as determined in accordance with U.S. GAAP. (2) Represents the elimination of the 49.9% of Lucid's earnings allocated among the non - controlling interests recorded as compensation for U.S. GAAP purposes included in discontinued operations. (3 ) Represents the provision for debt forgiveness of $8.2 million against the notes receivable from the non - controlling members of Lucid, $1.8 million of legal and other professional fees, including fees related to the Leucadia debt restructuring, partially offset by $1.0 million of insurance recoveries to reimburse for costs incurred related to the January 15, 2015 SNB event and the cybersecurity incident, which is included in continuing operations in the three months ended June 30, 2016, and expense of $0.5 million included in discontinued operations in the three months ended June 30, 2016 related to pre - August 2010 trade execution practices and other regulatory fees and fines. For the three months ended June 30, 2015, represents $1.2 million of legal fees resulting from the SNB event . (4) Represents the net bad debt (recovery) expense related to client debit balances associated with the January 15, 2015 SNB event.

18 Financial Summary Six Months Ended June 30, 2016 and 2015 (unaudited ) ($’s in Thousands) Continuing Ops Adjust. Adj Continuing Ops Disc Ops Adjust. Adjusted Combined Continuing Ops Adjust. Adj Continuing Ops Disc Ops Adjust. Adjusted Combined Change in Adjusted Combined Trading Revenue (1) $ 138,705 $ - $ 138,705 $ 13,804 $ - $ 152,509 $ 128,425 $ - $ 128,425 $46,768 $ - $ 175,193 $ (22,684) Interest 682 - 682 139 - 821 361 - 361 147 - 508 313 Other (2) 2,684 44 2,728 24 - 2,752 146,916 (145,224) 1,692 3,372 - 5,064 (2,312) Adjusted Total Revenues 142,071 44 142,115 13,967 - 156,082 275,702 (145,224) 130,478 50,287 - 180,765 (24,683) Compensation and benefits 49,177 - 49,177 513 - 49,690 48,496 - 48,496 10,801 - 59,297 (9,607) Referring broker fees 19,579 - 19,579 - - 19,579 30,670 - 30,670 208 - 30,878 (11,299) Advertising and marketing 10,284 - 10,284 - - 10,284 6,300 - 6,300 721 - 7,021 3,263 Communication and technology 14,121 - 14,121 2,923 - 17,044 18,760 - 18,760 4,467 - 23,227 (6,183) Trading costs 1,737 - 1,737 6,709 - 8,446 2,100 - 2,100 10,538 - 12,638 (4,192) General and administrative (3) 38,980 (10,499) 28,481 1,622 (513) 29,590 26,373 (3,035) 23,338 3,237 - 26,575 3,015 Bad debt expense (4) (141) 141 - - - - 257,303 (257,303) - 8,408 (8,408) - - Adjusted Operating Expenses 133,737 (10,358) 123,379 11,767 (513) 134,633 132,699 (3,035) 129,664 29,972 - 159,636 (25,003) (Loss) gain on equity method investments, net (5) (338) - (338) 772 (679) (245) (188) - (188) (501) - (689) 444 Adjusted EBITDA $ 7,996 $ 10,402 $ 18,398 $ 2,972 $ (166) $ 21,204 $ 142,815 $(142,189) $ 626 $19,814 $ - $ 20,440 $ 764 Six Months Ended June 30, 2016 Six Months Ended June 30, 2015 Footnotes: (1) Included in Six Months Ended June 30, 2016 continuing ops is $134.6 million from Retail and $4.1 million from FXCM Pro. Included in Six Months Ended June 30, 2016 $13.2 million from Lucid and $0.6 million from V3. Included in Six Months Ended June 30, 2015 continuing ops is $117.1 million from Retail and $11.3 million from FXCM Pro. Included in Six Months Ended June 30, 2015 discontinued ops is $5.5 million from Retail, $22.9 million from Lucid, $16.1 million from V3 and $2.3 million from Faros. (2) Represents a $0.1 million charge in Q1 2016 for tax receivable agreement payments and the elimination of a $145.2 million noncash benefit in Q1 2015 attributable to the reduction of our tax receivable agreement contingent liability to zero. (3) Represents the provision for debt forgiveness of $8.2 million against the notes receivable from the non-controlling members of Lucid, $3.2 million of legal and other professional fees, including fees related to the Leucadia debt restructuring and other professional fees related to the Stockholder Rights Plan, partially offset by $1.0 million of insurance recoveries to reimburse for costs incurred related to the January 15, 2015 SNB event and the cybersecurity incident, which is included in continuing operations in the six months ended June 30, 2016, and expense of $0.5 million included in discontinued operations in the six months ended June 30, 2016 related to pre-August 2010 trade execution practices and other regulatory fees and fines. For the six months ended June 30, 2015, represents $3.0 million of legal and other professional fees, including legal fees resulting from the SNB event and professional fees related to the Stockholder Rights Plan. (4) Represents the net bad debt (recovery) expense related to client debit balances associated with the January 15, 2015 SNB event. (5) Represents the gain on the disposition of an equity method investment related to V3 of $0.7M.
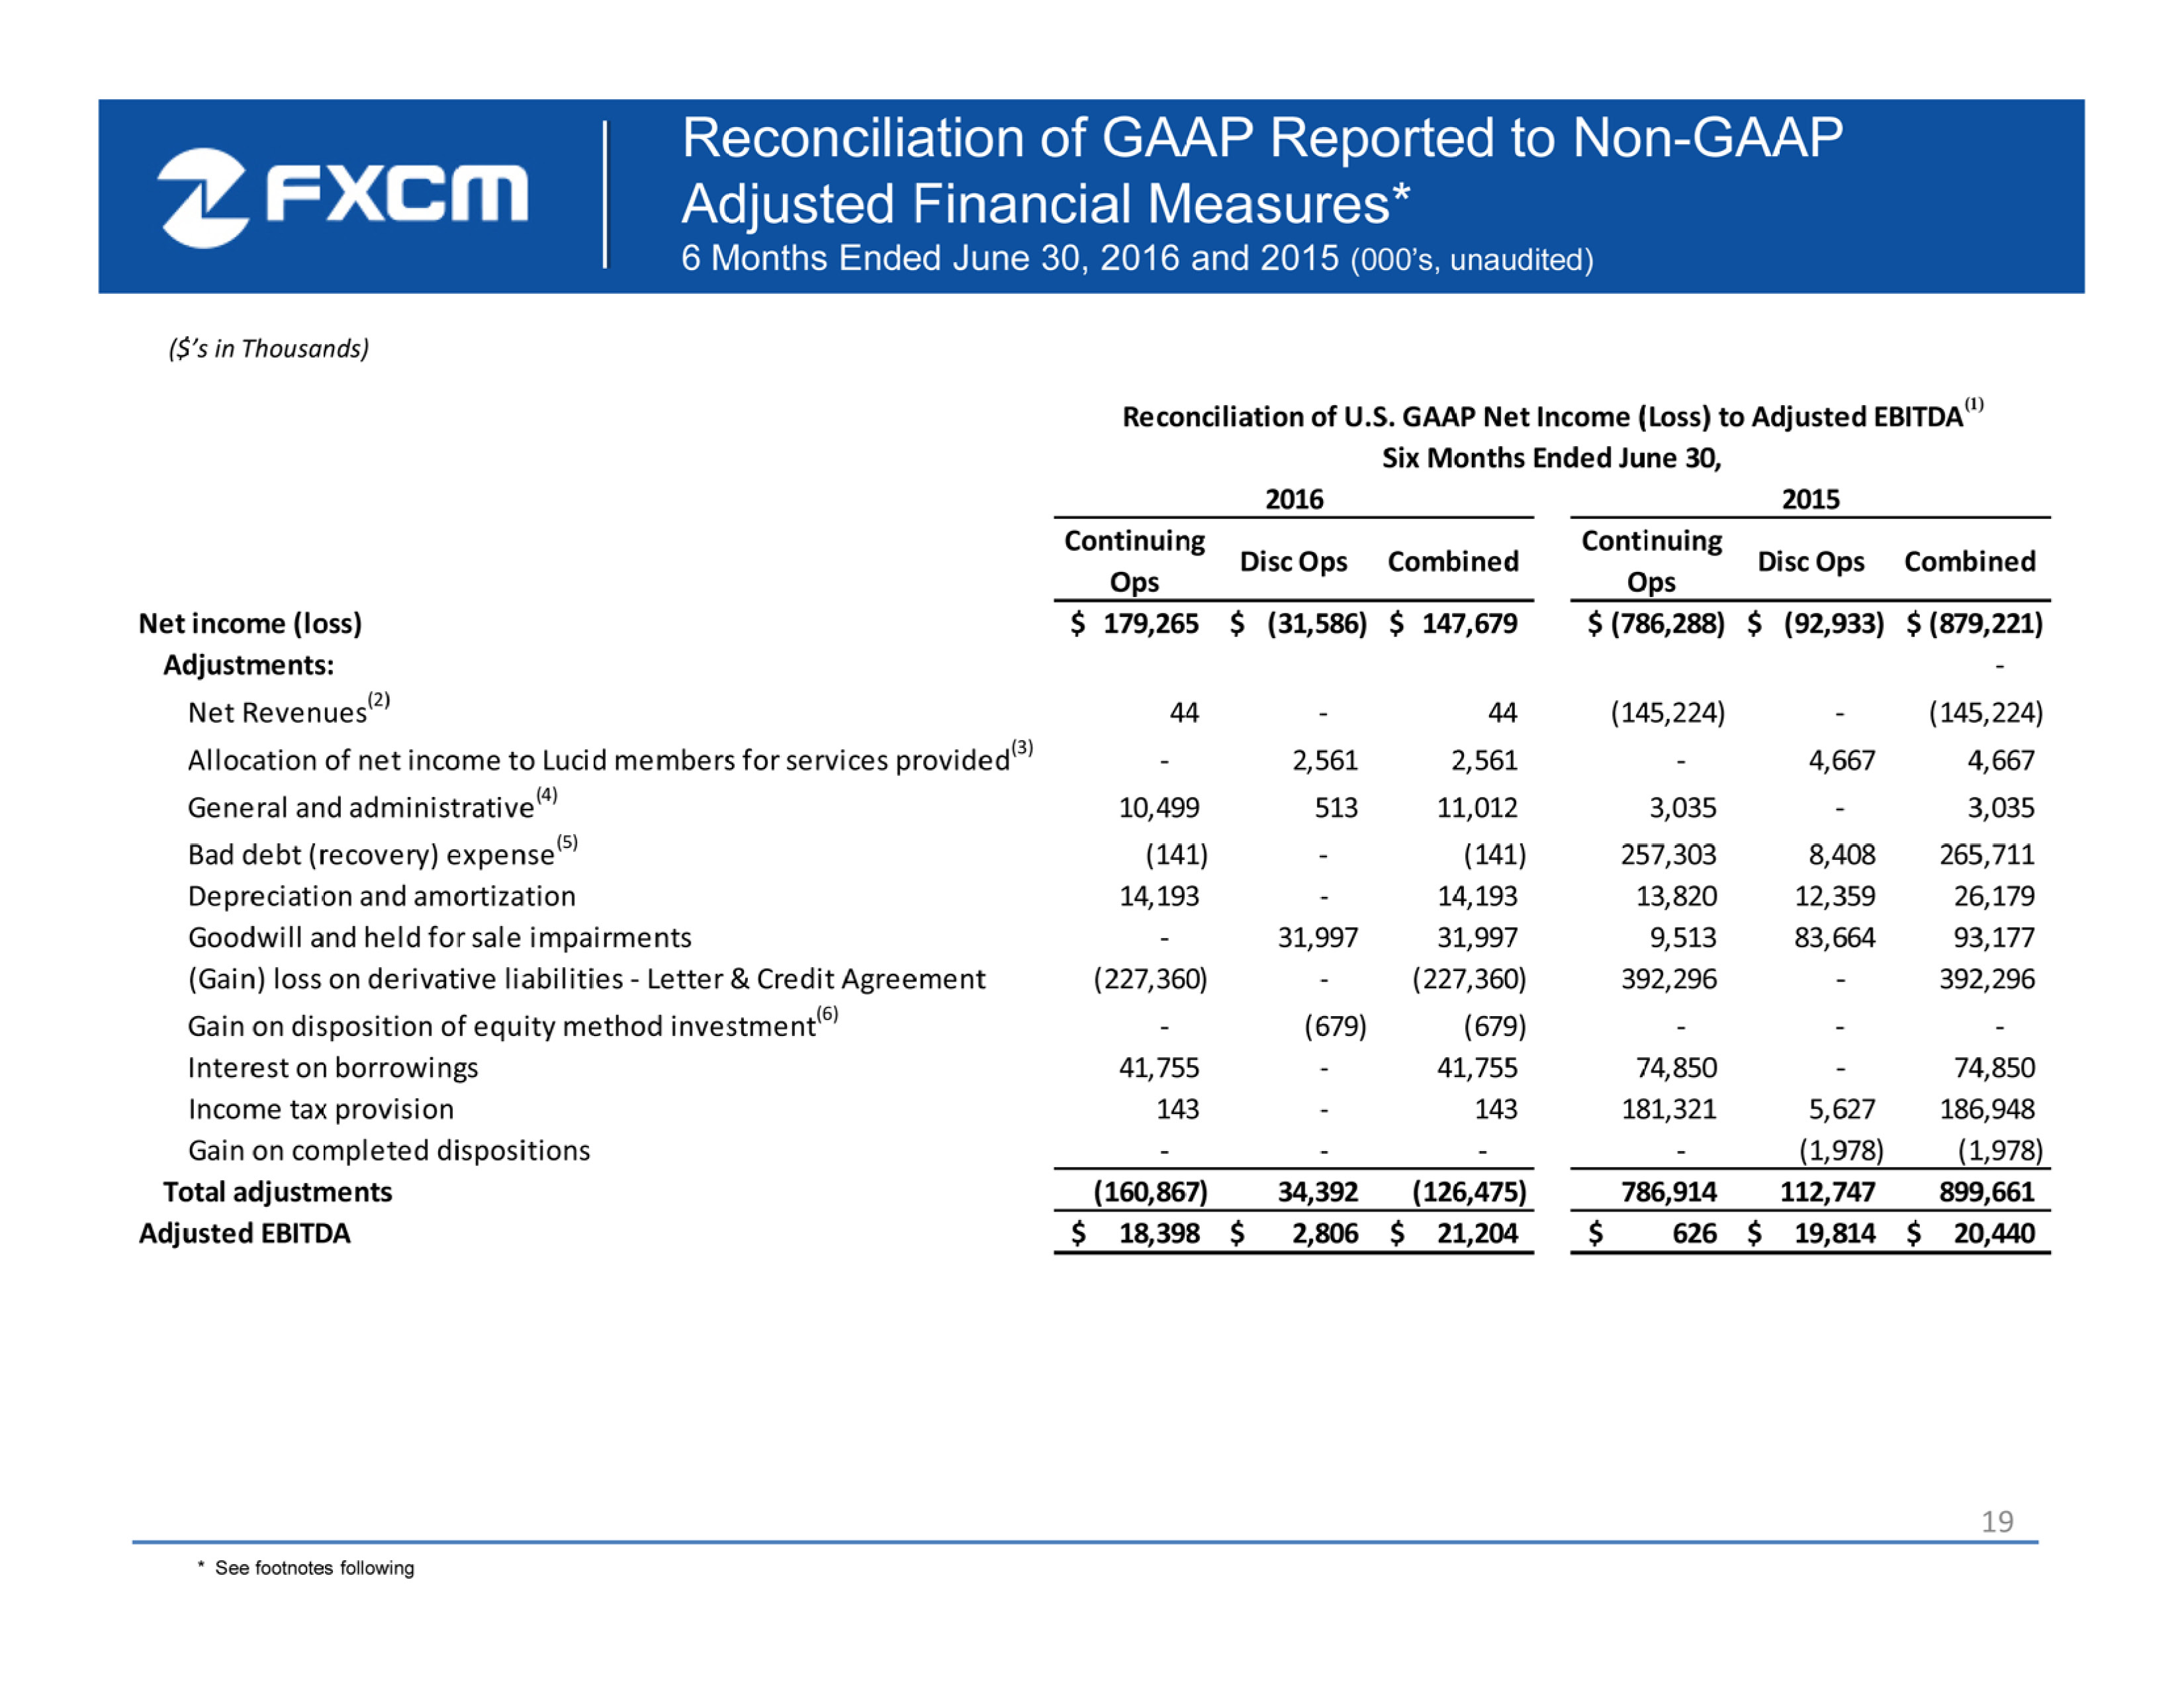
19 * See footnotes following Reconciliation of GAAP Reported to Non - GAAP Adjusted Financial Measures* 6 Months Ended June 30, 2016 and 2015 ( 000’s, unaudited) ($’s in Thousands) Continuing Ops Disc Ops Combined Continuing Ops Disc Ops Combined Net income (loss) 179,265$ (31,586)$ 147,679$ (786,288)$ (92,933)$ (879,221)$ Adjustments: - Net Revenues (2) 44 - 44 (145,224) - (145,224) Allocation of net income to Lucid members for services provided (3) - 2,561 2,561 - 4,667 4,667 General and administrative (4) 10,499 513 11,012 3,035 - 3,035 Bad debt (recovery) expense (5) (141) - (141) 257,303 8,408 265,711 Depreciation and amortization 14,193 - 14,193 13,820 12,359 26,179 Goodwill and held for sale impairments - 31,997 31,997 9,513 83,664 93,177 (Gain) loss on derivative liabilities - Letter & Credit Agreement (227,360) - (227,360) 392,296 - 392,296 Gain on disposition of equity method investment (6) - (679) (679) - - - Interest on borrowings 41,755 - 41,755 74,850 - 74,850 Income tax provision 143 - 143 181,321 5,627 186,948 Gain on completed dispositions - - - - (1,978) (1,978) Total adjustments (160,867) 34,392 (126,475) 786,914 112,747 899,661 Adjusted EBITDA 18,398$ 2,806$ 21,204$ 626$ 19,814$ 20,440$ 2016 2015 Reconciliation of U.S. GAAP Net Income (Loss) to Adjusted EBITDA (1) Six Months Ended June 30,
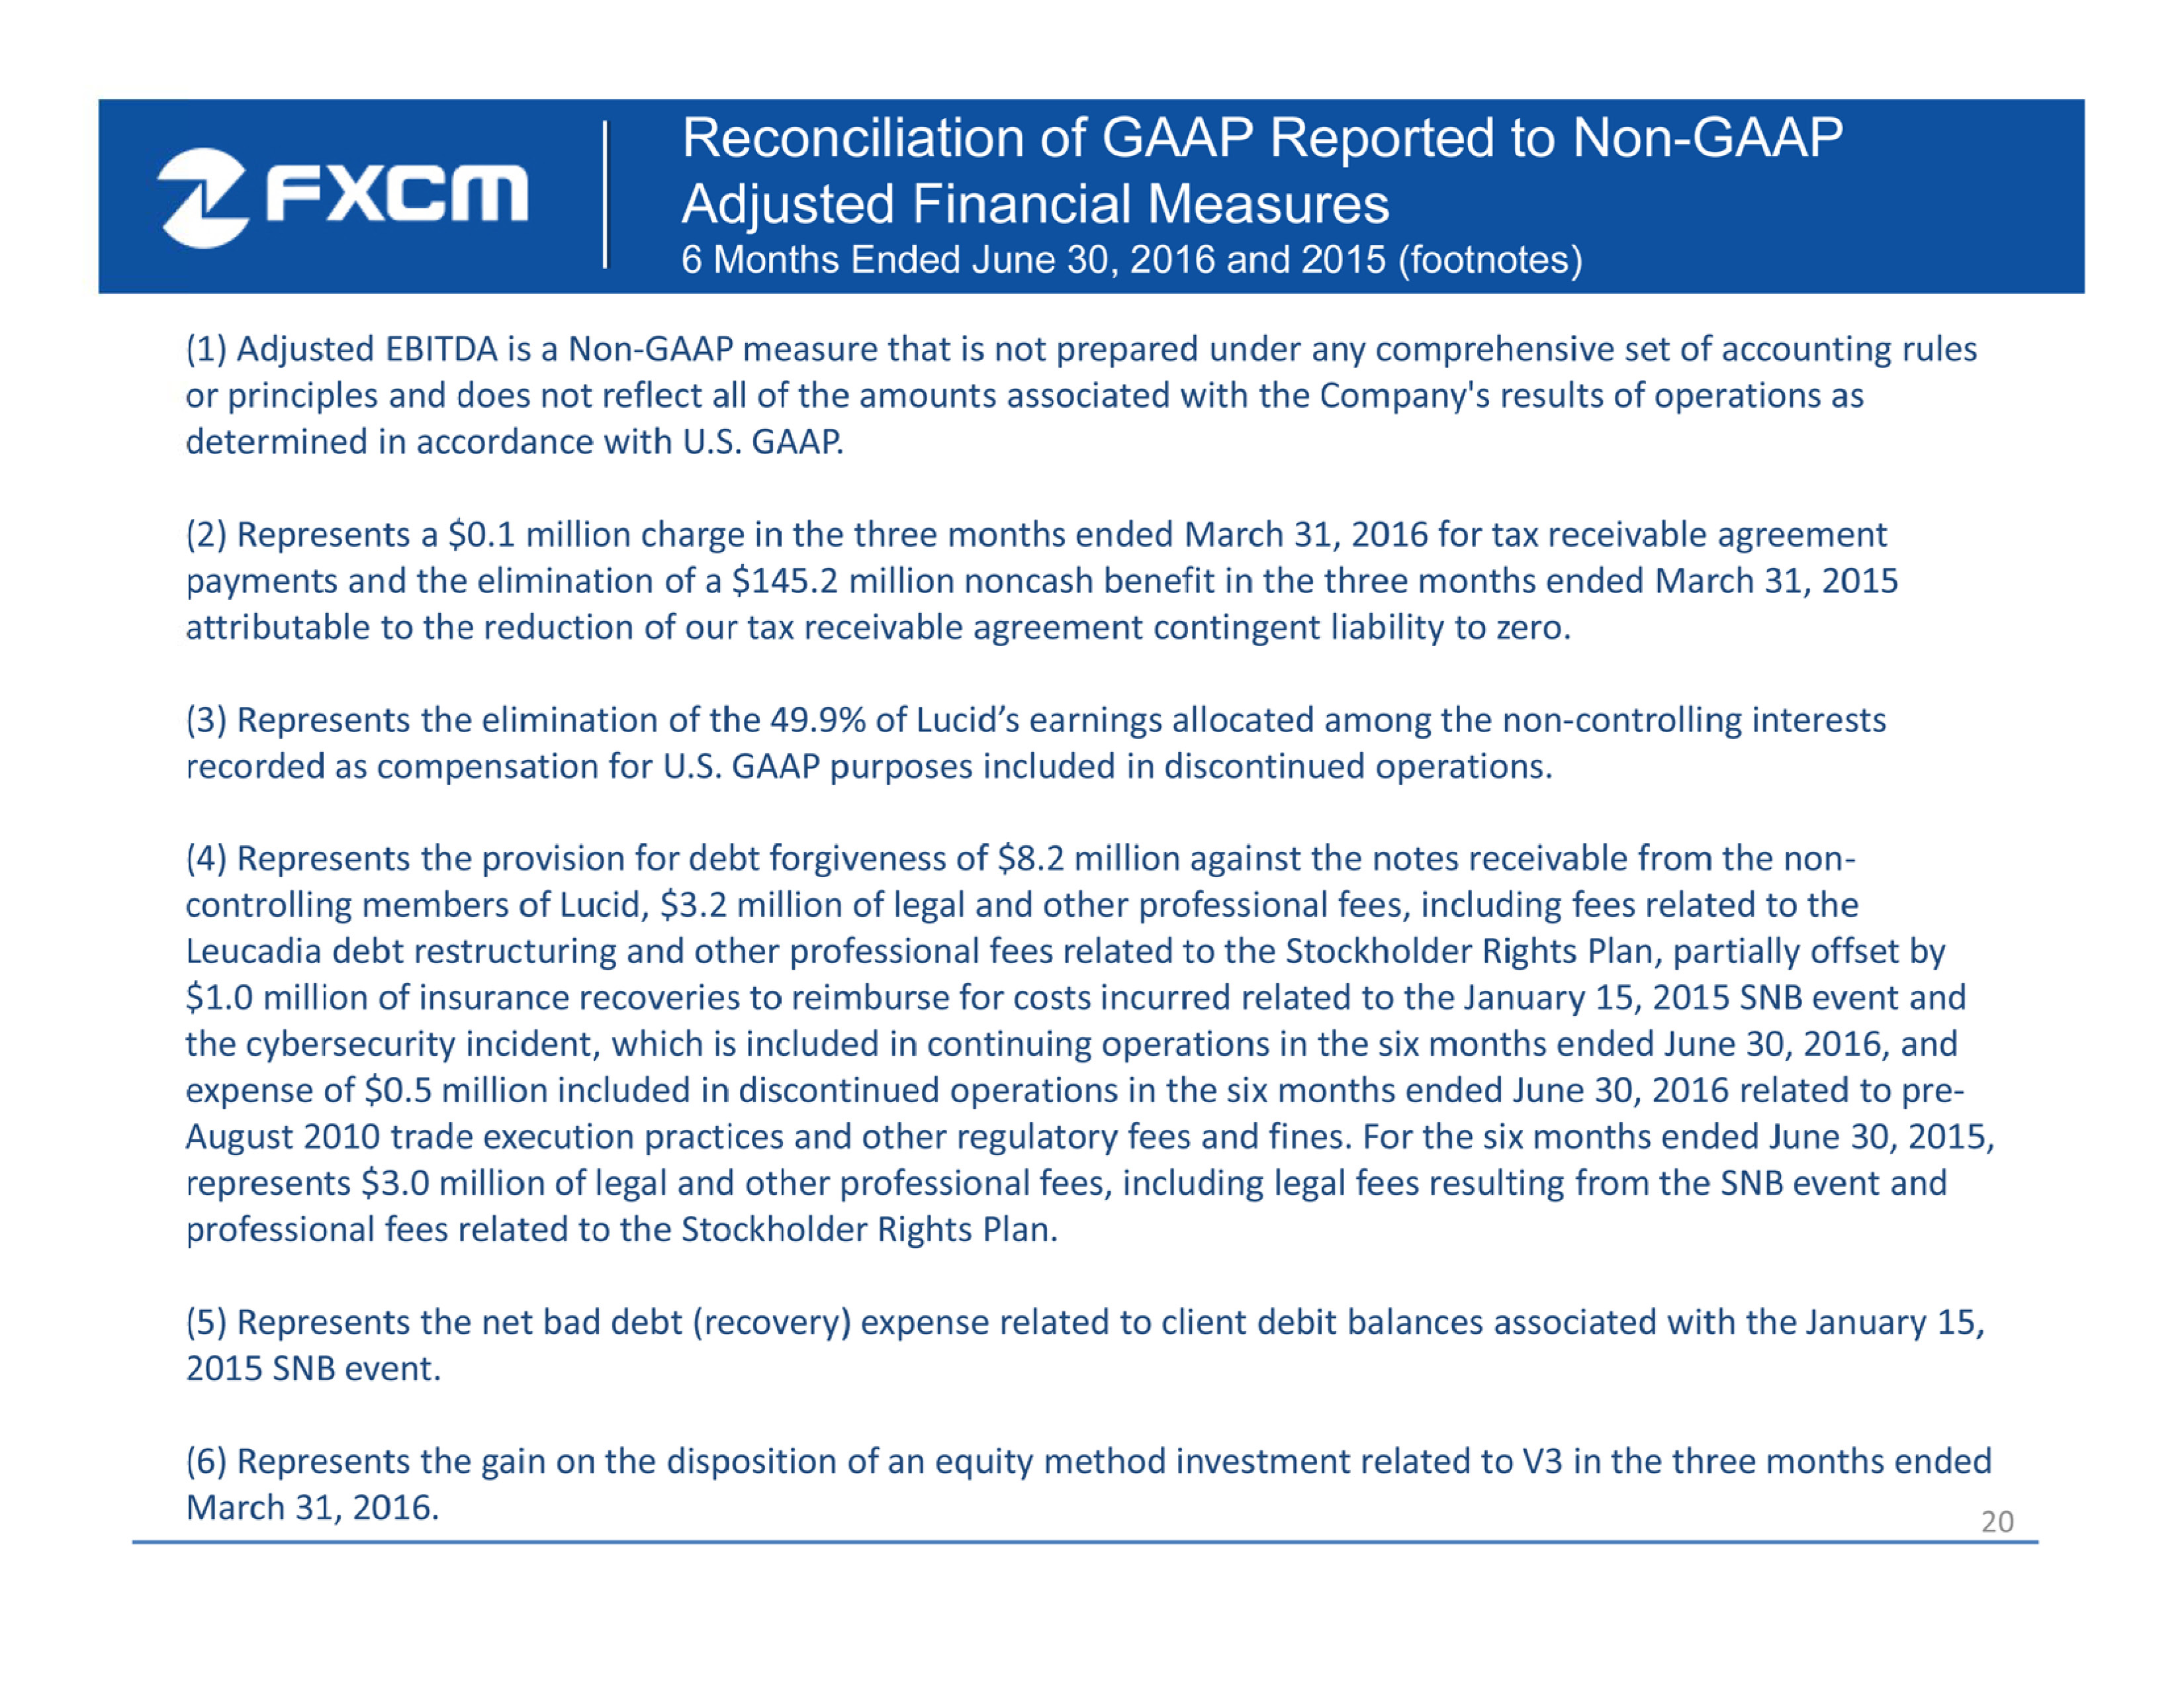
20 Reconciliation of GAAP Reported to Non - GAAP Adjusted Financial Measures 6 Months Ended June 30, 2016 and 2015 (footnotes ) ( 1) Adjusted EBITDA is a Non - GAAP measure that is not prepared under any comprehensive set of accounting rules or principles and does not reflect all of the amounts associated with the Company's results of operations as determined in accordance with U.S. GAAP. (2) Represents a $0.1 million charge in the three months ended March 31, 2016 for tax receivable agreement payments and the elimination of a $145.2 million noncash benefit in the three months ended March 31, 2015 attributable to the reduction of our tax receivable agreement contingent liability to zero. (3) Represents the elimination of the 49.9% of Lucid’s earnings allocated among the non - controlling interests recorded as compensation for U.S. GAAP purposes included in discontinued operations. (4) Represents the provision for debt forgiveness of $8.2 million against the notes receivable from the non - controlling members of Lucid, $3.2 million of legal and other professional fees, including fees related to the Leucadia debt restructuring and other professional fees related to the Stockholder Rights Plan, partially offset by $1.0 million of insurance recoveries to reimburse for costs incurred related to the January 15, 2015 SNB event and the cybersecurity incident, which is included in continuing operations in the six months ended June 30, 2016, and expense of $0.5 million included in discontinued operations in the six months ended June 30, 2016 related to pre - August 2010 trade execution practices and other regulatory fees and fines. For the six months ended June 30, 2015, represents $3.0 million of legal and other professional fees, including legal fees resulting from the SNB event and professional fees related to the Stockholder Rights Plan. (5) Represents the net bad debt (recovery) expense related to client debit balances associated with the January 15, 2015 SNB event. (6) Represents the gain on the disposition of an equity method investment related to V3 in the three months ended March 31, 2016.
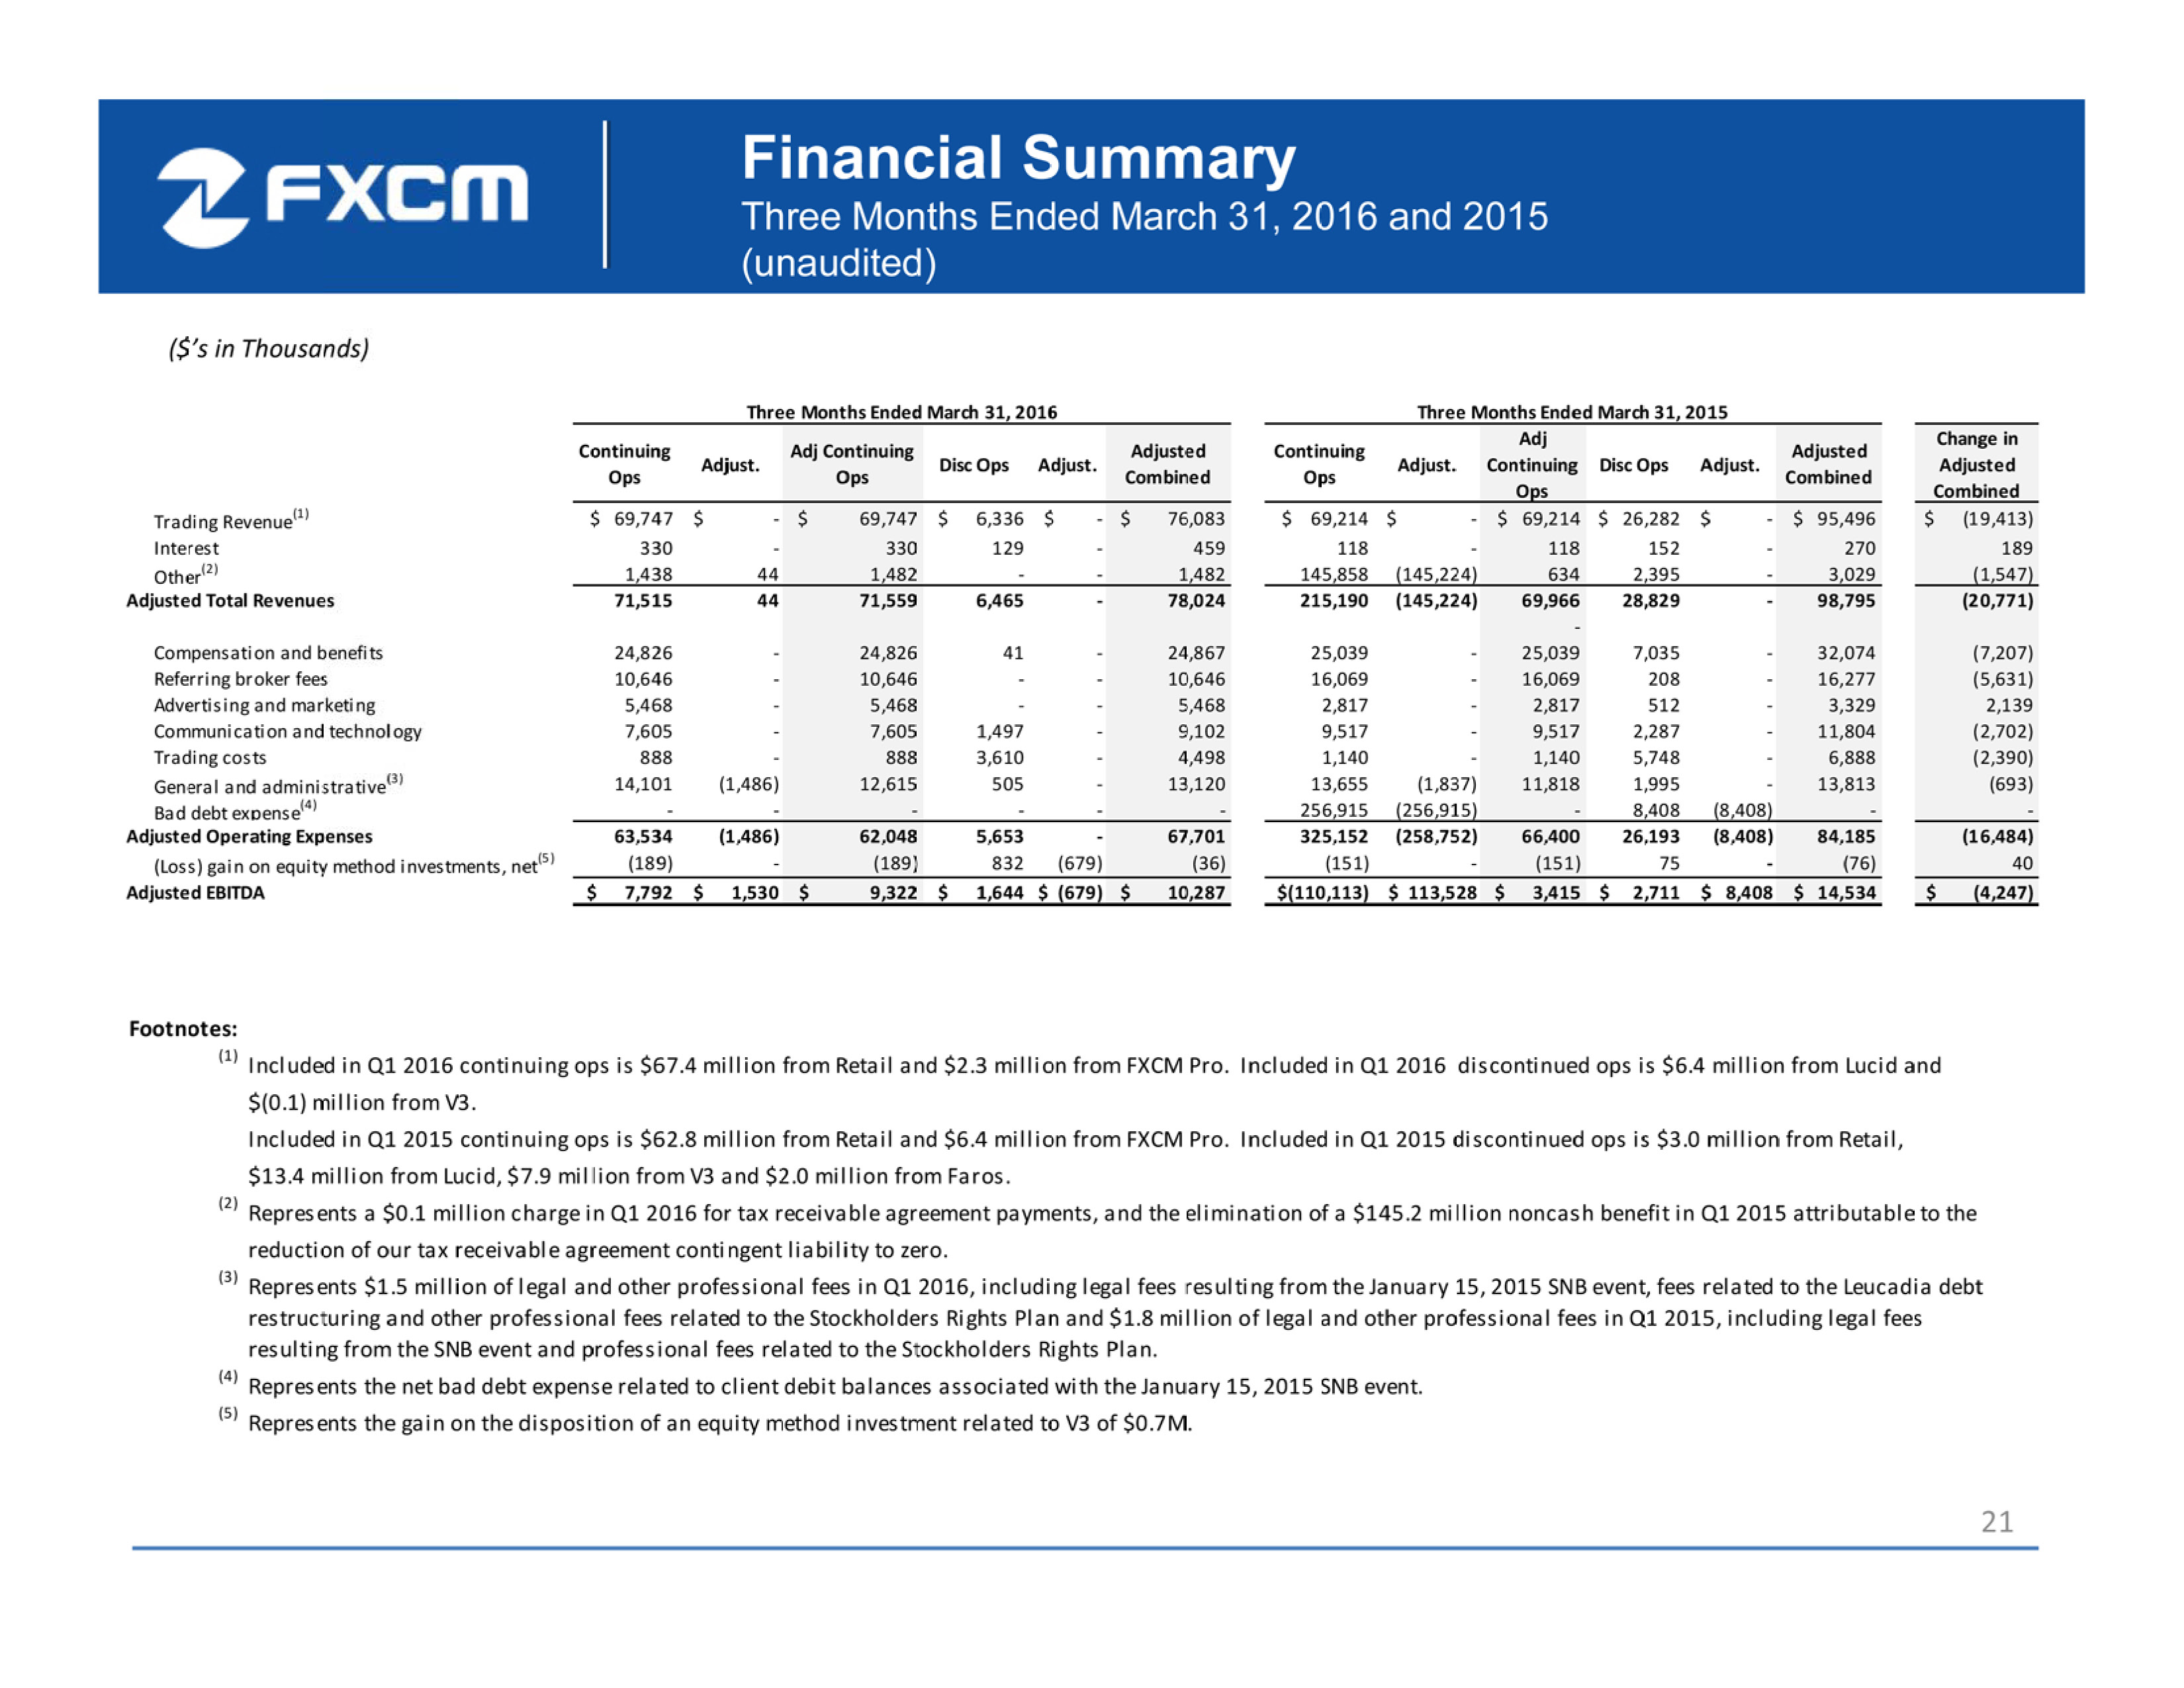
21 Financial Summary Three Months Ended March 31, 2016 and 2015 (unaudited ) ($’s in Thousands) Continuing Ops Adjust. Adj Continuing Ops Disc Ops Adjust. Adjusted Combined Continuing Ops Adjust. Adj Continuing Ops Disc Ops Adjust. Adjusted Combined Change in Adjusted Combined Trading Revenue (1) $ 69,747 $ - $ 69,747 $ 6,336 $ - $ 76,083 $ 69,214 $ - $ 69,214 $ 26,282 $ - $ 95,496 $ (19,413) Interest 330 - 330 129 - 459 118 - 118 152 - 270 189 Other (2) 1,438 44 1,482 - - 1,482 145,858 (145,224) 634 2,395 - 3,029 (1,547) Adjusted Total Revenues 71,515 44 71,559 6,465 - 78,024 215,190 (145,224) 69,966 28,829 - 98,795 (20,771) - Compensation and benefits 24,826 - 24,826 41 - 24,867 25,039 - 25,039 7,035 - 32,074 (7,207) Referring broker fees 10,646 - 10,646 - - 10,646 16,069 - 16,069 208 - 16,277 (5,631) Advertising and marketing 5,468 - 5,468 - - 5,468 2,817 - 2,817 512 - 3,329 2,139 Communication and technology 7,605 - 7,605 1,497 - 9,102 9,517 - 9,517 2,287 - 11,804 (2,702) Trading costs 888 - 888 3,610 - 4,498 1,140 - 1,140 5,748 - 6,888 (2,390) General and administrative (3) 14,101 (1,486) 12,615 505 - 13,120 13,655 (1,837) 11,818 1,995 - 13,813 (693) Bad debt expense (4) - - - - - - 256,915 (256,915) - 8,408 (8,408) - - Adjusted Operating Expenses 63,534 (1,486) 62,048 5,653 - 67,701 325,152 (258,752) 66,400 26,193 (8,408) 84,185 (16,484) (Loss) gain on equity method investments, net (5) (189) - (189) 832 (679) (36) (151) - (151) 75 - (76) 40 Adjusted EBITDA $ 7,792 $ 1,530 $ 9,322 $ 1,644 $ (679) $ 10,287 $(110,113) $ 113,528 $ 3,415 $ 2,711 $ 8,408 $ 14,534 $ (4,247) Three Months Ended March 31, 2016 Three Months Ended March 31, 2015 Footnotes: (1) Included in Q1 2016 continuing ops is $67.4 million from Retail and $2.3 million from FXCM Pro. Included in Q1 2016 discontinued ops is $6.4 million from Lucid and $(0.1) million from V3. Included in Q1 2015 continuing ops is $62.8 million from Retail and $6.4 million from FXCM Pro. Included in Q1 2015 discontinued ops is $3.0 million from Retail, $13.4 million from Lucid, $7.9 million from V3 and $2.0 million from Faros. (2) Represents a $0.1 million charge in Q1 2016 for tax receivable agreement payments, and the elimination of a $145.2 million noncash benefit in Q1 2015 attributable to the reduction of our tax receivable agreement contingent liability to zero. (3) Represents $1.5 million of legal and other professional fees in Q1 2016, including legal fees resulting from the January 15, 2015 SNB event, fees related to the Leucadia debt restructuring and other professional fees related to the Stockholders Rights Plan and $1.8 million of legal and other professional fees in Q1 2015, including legal fees resulting from the SNB event and professional fees related to the Stockholders Rights Plan. (4) Represents the net bad debt expense related to client debit balances associated with the January 15, 2015 SNB event. (5) Represents the gain on the disposition of an equity method investment related to V3 of $0.7M.

22 Financial Summary Three Months Ended December 31, 2015 and 2014 (unaudited ) ($’s in Thousands) Continuing Ops Adjust. Adj Continuing Ops Disc Ops Adjust. Adjusted Combined Continuing Ops Adjust. Adj Continuing Ops Disc Ops Adjust. Adjusted Combined Change in Adjusted Combined Trading Revenue (1) $ 65,370 $ - $ 65,370 $ 11,346 $ - $ 76,716 $ 93,485 $ - $ 93,485 $31,173 $ - $ 124,658 $ (47,942) Interest 366 - 366 25 - 391 297 - 297 80 - 377 14 Other (2) 1,258 145 1,403 898 - 2,301 7,964 (7,103) 861 1,676 - 2,537 (236) Adjusted Total Revenues 66,994 145 67,139 12,269 - 79,408 101,746 (7,103) 94,643 32,929 - 127,572 (48,164) Compensation and benefits (3) 20,969 - 20,969 3,176 - 24,145 19,081 (1,512) 17,569 6,352 - 23,921 224 Referring broker fees 11,125 - 11,125 - - 11,125 24,110 - 24,110 125 - 24,235 (13,110) Advertising and marketing 4,516 - 4,516 - - 4,516 3,328 - 3,328 686 - 4,014 502 Communication and technology 7,473 - 7,473 1,720 - 9,193 8,605 - 8,605 2,107 - 10,712 (1,519) Trading costs 1,005 - 1,005 3,662 - 4,667 2,567 - 2,567 7,004 - 9,571 (4,904) General and administrative (4) 19,202 (7,313) 11,889 2,099 (1,453) 12,535 12,087 - 12,087 1,823 - 13,910 (1,375) Bad debt expense (5) (353) 353 - - - - - - - - - - - Adjusted Operating Expenses 63,937 (6,960) 56,977 10,657 (1,453) 66,181 69,778 (1,512) 68,266 18,097 - 86,363 (20,182) (Loss) gain on equity method investments, net (168) - (168) (446) - (614) (116) - (116) (282) - (398) (216) Adjusted EBITDA $ 2,889 $ 7,105 $ 9,994 $ 1,166 $1,453 $ 12,613 $ 31,852 $(5,591) $ 26,261 $14,550 $ - $ 40,811 $ (28,198) Three Months Ended December 31, 2015 Three Months Ended December 31, 2014 Footnotes: (1) Included in Q4 2015 continuing ops is $63.7 million from Retail and $1.6 million from FXCM Pro. Included in Q4 2015 discontinued ops is $4.7 million from Lucid and $6.6 million from V3. Included in Q4 2014 continuing ops is $83.9 million from Retail and $9.5 million from FXCM Pro. Included in Q4 2014 discontinued ops is $9.9 million from Retail, $13.1 million from Lucid, $6.2 million from V3 and $2.0 million from Faros. (2) Represents the $0.1 million charge in Q4 2015 and the elimination of a $7.1 million benefit in Q4 2014 attributable to the remeasurement of our tax receivable agreement liability to reflect a revised effective tax rate. (3) Represents the elimination of stock-based compensation associated with the IPO of $1.5 million in Q4 2014. (4) Represents the elimination of a $6.8 million reserve recorded against an uncollected broker receivable, $0.8 million of legal fees resulting from the January 15, 2015 SNB event and other professional fees, $0.5 million of costs related to the cyber incident and a recovery of $0.8 million related to a settlement related to a settlement of a lawsuit, all recorded in continuing operations for Q4 2015, and a $1.5 million reserve for restitution related to pre-August 2010 trade execution practices recorded in discontinued operations in Q4 2015. (5) Represents a recovery against the net bad debt expense related to client debit balances associated with the January 15, 2015 SNB event.
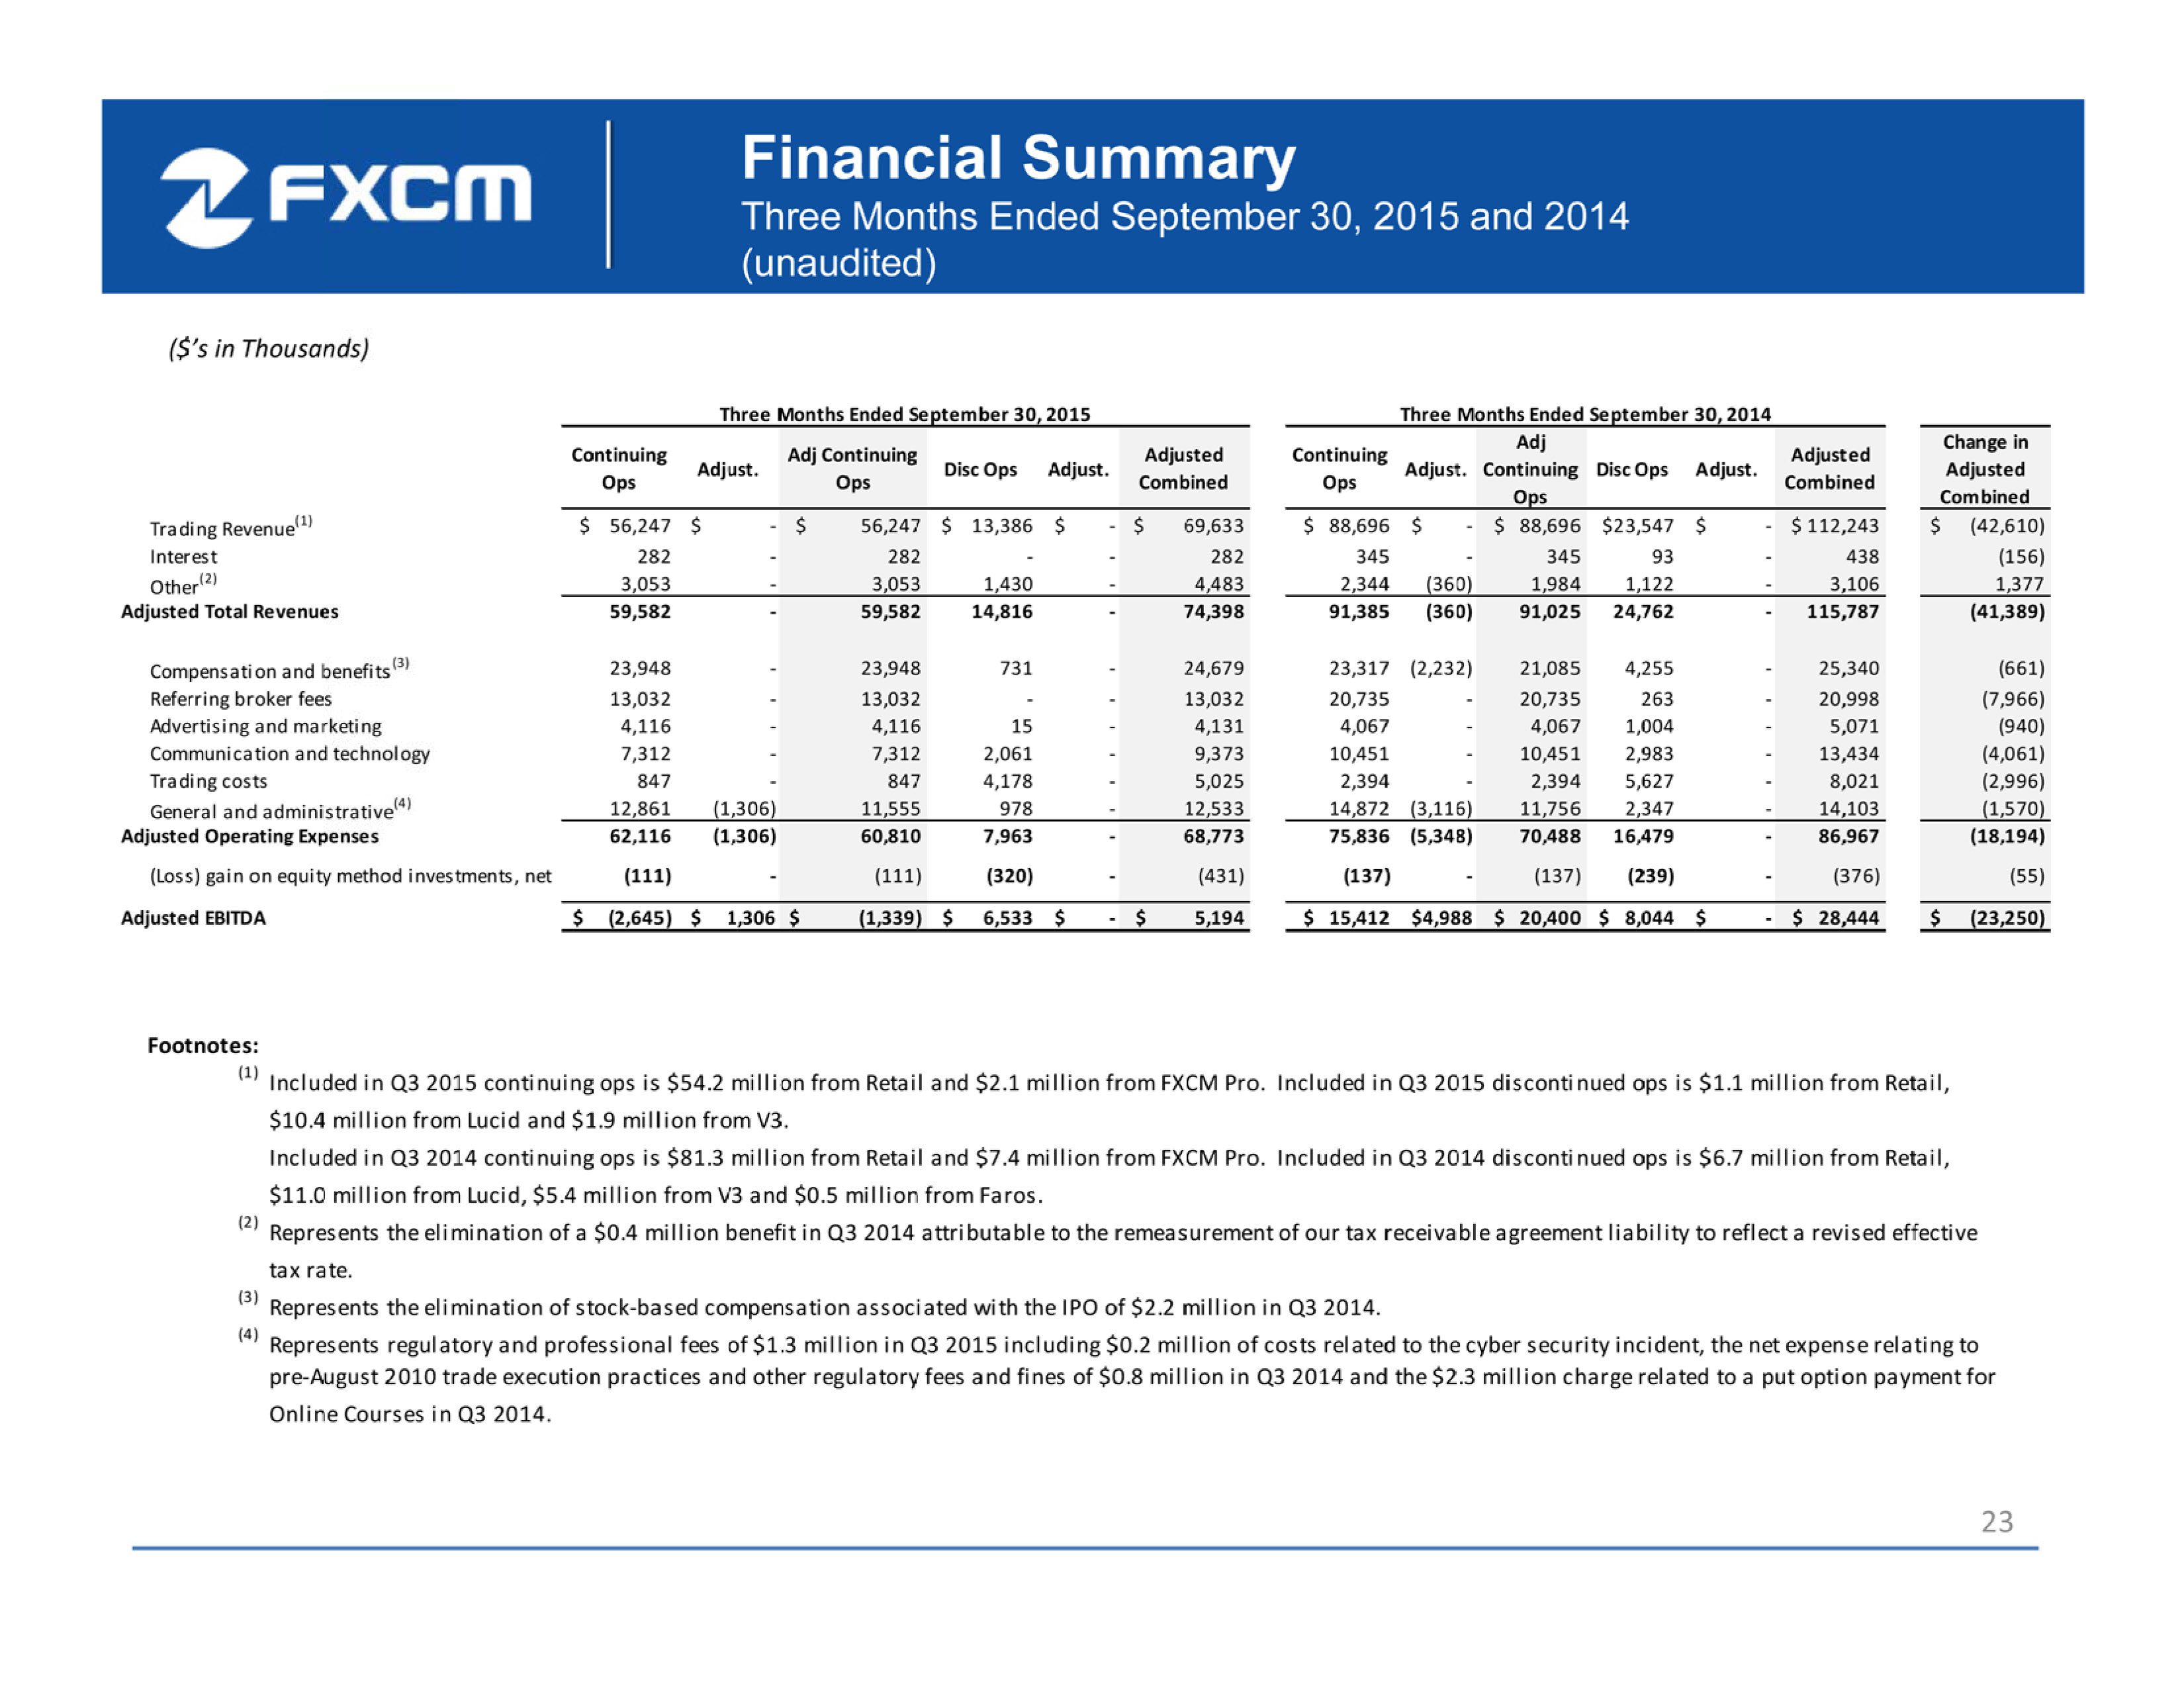
23 Financial Summary Three Months Ended September 30, 2015 and 2014 (unaudited ) ($’s in Thousands) Continuing Ops Adjust. Adj Continuing Ops Disc Ops Adjust. Adjusted Combined Continuing Ops Adjust. Adj Continuing Ops Disc Ops Adjust. Adjusted Combined Change in Adjusted Combined Trading Revenue (1) $ 56,247 $ - $ 56,247 $ 13,386 $ - $ 69,633 $ 88,696 $ - $ 88,696 $23,547 $ - $ 112,243 $ (42,610) Interest 282 - 282 - - 282 345 - 345 93 - 438 (156) Other (2) 3,053 - 3,053 1,430 - 4,483 2,344 (360) 1,984 1,122 - 3,106 1,377 Adjusted Total Revenues 59,582 - 59,582 14,816 - 74,398 91,385 (360) 91,025 24,762 - 115,787 (41,389) Compensation and benefits (3) 23,948 - 23,948 731 - 24,679 23,317 (2,232) 21,085 4,255 - 25,340 (661) Referring broker fees 13,032 - 13,032 - - 13,032 20,735 - 20,735 263 - 20,998 (7,966) Advertising and marketing 4,116 - 4,116 15 - 4,131 4,067 - 4,067 1,004 - 5,071 (940) Communication and technology 7,312 - 7,312 2,061 - 9,373 10,451 - 10,451 2,983 - 13,434 (4,061) Trading costs 847 - 847 4,178 - 5,025 2,394 - 2,394 5,627 - 8,021 (2,996) General and administrative (4) 12,861 (1,306) 11,555 978 - 12,533 14,872 (3,116) 11,756 2,347 - 14,103 (1,570) Adjusted Operating Expenses 62,116 (1,306) 60,810 7,963 - 68,773 75,836 (5,348) 70,488 16,479 - 86,967 (18,194) (Loss) gain on equity method investments, net (111) - (111) (320) - (431) (137) - (137) (239) - (376) (55) Adjusted EBITDA $ (2,645) $ 1,306 $ (1,339) $ 6,533 $ - $ 5,194 $ 15,412 $4,988 $ 20,400 $ 8,044 $ - $ 28,444 $ (23,250) Three Months Ended September 30, 2015 Three Months Ended September 30, 2014 Footnotes: (1) Included in Q3 2015 continuing ops is $54.2 million from Retail and $2.1 million from FXCM Pro. Included in Q3 2015 discontinued ops is $1.1 million from Retail, $10.4 million from Lucid and $1.9 million from V3. Included in Q3 2014 continuing ops is $81.3 million from Retail and $7.4 million from FXCM Pro. Included in Q3 2014 discontinued ops is $6.7 million from Retail, $11.0 million from Lucid, $5.4 million from V3 and $0.5 million from Faros. (2) Represents the elimination of a $0.4 million benefit in Q3 2014 attributable to the remeasurement of our tax receivable agreement liability to reflect a revised effective tax rate. (3) Represents the elimination of stock-based compensation associated with the IPO of $2.2 million in Q3 2014. (4) Represents regulatory and professional fees of $1.3 million in Q3 2015 including $0.2 million of costs related to the cyber security incident, the net expense relating to pre-August 2010 trade execution practices and other regulatory fees and fines of $0.8 million in Q3 2014 and the $2.3 million charge related to a put option payment for Online Courses in Q3 2014.