Exhibit 99.2
1 First Quarter 2017 Financial and Operating Results May 15 , 2017
2 This presentation may contain "forward - looking statements" within the meaning of Section 27 A of the Securities Act of 1933 , Section 21 E of the Securities Exchange Act of 1934 and/or the Private Securities Litigation Reform Act of 1995 , which reflect Global Brokerage's current views with respect to, among other things, its operations and financial performance in the future . These forward - looking statements are not historical facts and are based on current expectations, estimates and projections about Global Brokerage’s industry, business plans, management's beliefs and certain assumptions made by management, many of which, by their nature, are inherently uncertain and beyond our control . Accordingly, readers are cautioned that any such forward - looking statements are not guarantees of future performance and are subject to certain risks, uncertainties and assumptions that are difficult to predict including, without limitation, risks associated with Global Brokerage’s strategy to focus on its operations outside the United States, risks associated with the events that took place in the currency markets on January 15 , 2015 and their impact on Global Brokerage's capital structure, risks associated with Global Brokerage's ability to recover all or a portion of any capital losses, risks associated with the potential delisting of Global Brokerage's common stock from the Nasdaq Global Select Market and the potential consequences of such a delisting under Global Brokerage's financing agreements, risks relating to the ability of Global Brokerage to satisfy the terms and conditions of or make payments pursuant to the terms of the finance agreements with Leucadia, as well as risks associated with Global Brokerage’s obligations under its other financing agreements, risks related to Global Brokerage's dependence on FX market makers, market conditions, risks associated with the outcome of any potential litigation or regulatory inquiries to which Global Brokerage may become subject, risks associated with potential reputational damage to Global Brokerage resulting from its sale of US customer accounts, and those other risks described under "Risk Factors" in Global Brokerage’s Annual Report on Form 10 - K, Global Brokerage’s latest Quarterly Report on Form 10 - Q, and other reports or documents Global Brokerage files with the SEC from time to time, which are accessible on the SEC website at sec . gov . This information should also be read in conjunction with Global Brokerage's Consolidated Financial Statements and the Notes thereto contained in Global Brokerage’s Annual Report on Form 10 - K, Global Brokerage’s latest Quarterly Report on Form 10 - Q, and in other reports or documents that Global Brokerage files with the SEC from time to time, which are accessible on the SEC website at sec . gov . Global Brokerage undertakes no obligation to publicly update or review any forward - looking statement, whether as a result of new inform ation, future developments or otherwise . Non - GAAP Financial Measures: This presentation presents certain non - GAAP financial measures. These measures should not be considered in isolation from, or as a substitute for, measures prepared in accordance with generally accepted accounting principles. See the appendix to this pre sen tation for reconciliations of these non - GAAP financial measures to the most comparable measures calculated and presented in accordance with GAAP. Safe Harbor
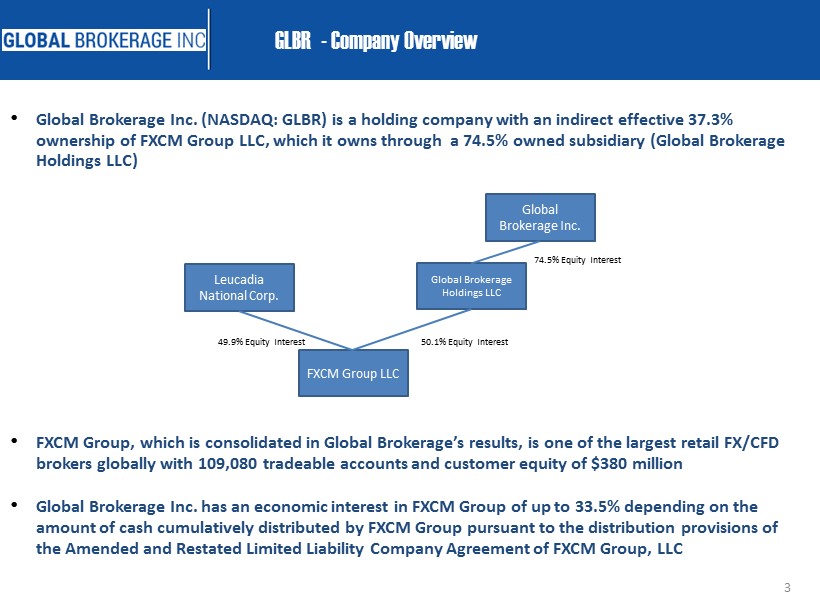
3 • Global Brokerage Inc. (NASDAQ: GLBR) is a holding company with an indirect effective 37.3% ownership of FXCM Group LLC, which it owns through a 74.5% owned subsidiary (Global Brokerage Holdings LLC ) • FXCM Group, which is consolidated in Global Brokerage’s results, is one of the largest retail FX/CFD brokers globally with 109,080 tradeable accounts and customer equity of $380 million • Global Brokerage Inc. has an economic interest in FXCM Group of up to 33.5% depending on the amount of cash cumulatively distributed by FXCM Group pursuant to the distribution provisions of the Amended and Restated Limited Liability Company Agreement of FXCM Group, LLC GLBR - Company Overview Global Brokerage Inc. Global Brokerage Holdings LLC FXCM Group LLC 74.5% Equity Interest 50.1% Equity Interest Leucadia National Corp. 49.9% Equity Interest
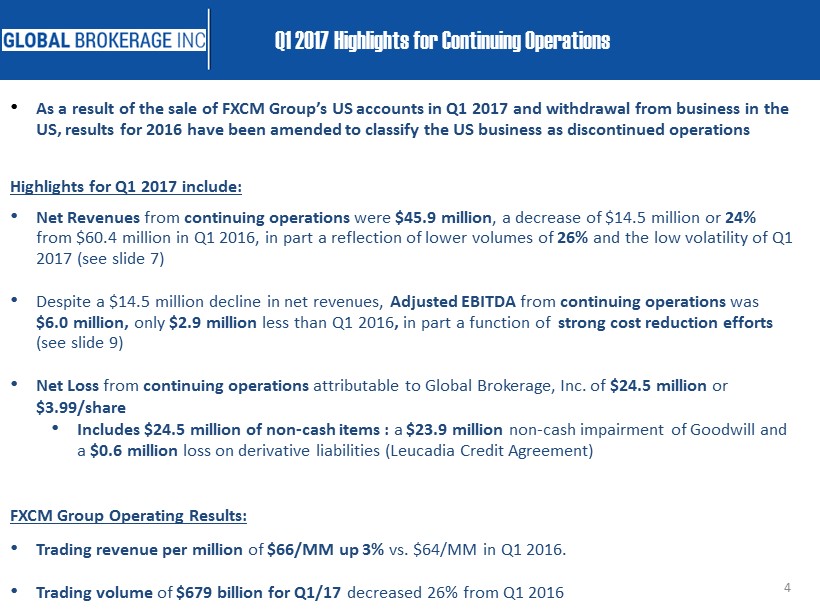
4 Q1 2017 Highlights for Continuing Operations • As a result of the sale of FXCM Group’s US accounts in Q1 2017 and withdrawal from business in the US, results for 2016 have been amended to classify the US business as discontinued operations Highlights for Q1 2017 include: • Net Revenues from continuing operations were $45.9 million , a decrease of $14.5 million or 24% from $ 60.4 million in Q1 2016, in part a reflection of lower volumes of 26% and the low volatility of Q1 2017 (see slide 7 ) • Despite a $14.5 million decline in net revenues, Adjusted EBITDA from continuing operations was $6.0 million, only $2.9 million less than Q1 2016 , in part a function of strong cost reduction efforts (see slide 9 ) • Net Loss from continuing operations attributable to Global Brokerage, Inc. of $ 24.5 million or $3.99/share • Includes $24.5 million of non - cash items : a $23.9 million non - cash impairment of Goodwill and a $0.6 million loss on derivative liabilities (Leucadia Credit Agreement) FXCM Group Operating Results: • Trading revenue per million of $66/MM up 3% vs. $64/MM in Q1 2016. • Trading volume of $679 billion for Q1/17 decreased 26% from Q1 2016

5 • $143.5 million of operating cash* at 03/31/17 in our continuing operations • Currently there is $ 121.7 million outstanding on the Leucadia loan due January 2018 – with $35 million repaid in Q1 2017 and $1.3 million subsequent to quarter - end • $ 172.5 million outstanding of convertible debt due June 2018 • Gain Capital has paid $ 6.5 million to date for the customers of the US operations • Work continues on disposing of the remaining assets held for sale ( FastMatch , Lucid, V3 Markets ) • Potential delisting in 6 months from Nasdaq Global Select Market could accelerate debt obligations; engaging with convertible bondholders • Creates a going concern issue this quarter which looks out 12 months Q1 2017 Liquidity & Capital Position * Cash and cash equivalents plus Due From Brokers Less Due to Brokers
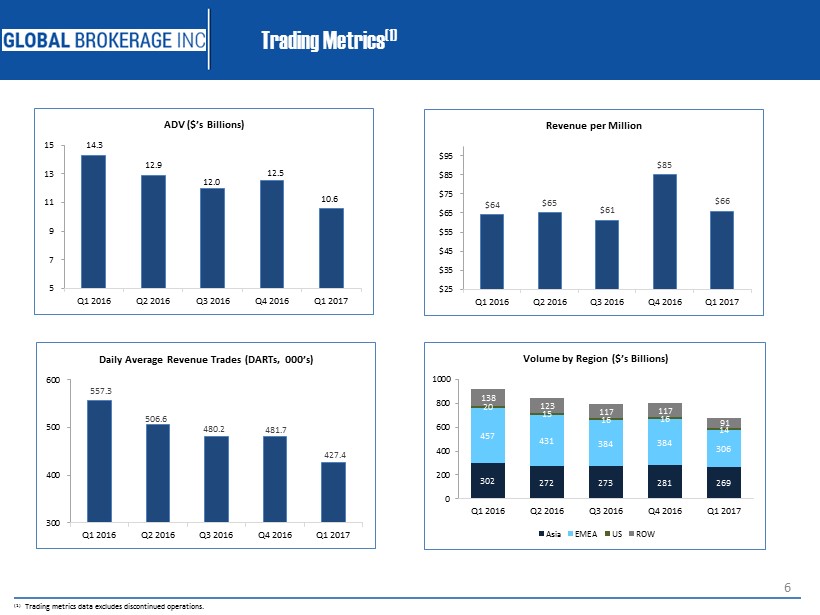
6 Trading Metrics (1) 14.3 12.9 12.0 12.5 10.6 5 7 9 11 13 15 Q1 2016 Q2 2016 Q3 2016 Q4 2016 Q1 2017 ADV ($’s Billions) $64 $65 $61 $85 $66 $25 $35 $45 $55 $65 $75 $85 $95 Q1 2016 Q2 2016 Q3 2016 Q4 2016 Q1 2017 Revenue per Million 557.3 506.6 480.2 481.7 427.4 300 400 500 600 Q1 2016 Q2 2016 Q3 2016 Q4 2016 Q1 2017 Daily Average Revenue Trades (DARTs, 000’s) 302 272 273 281 269 457 431 384 384 306 20 15 16 16 14 138 123 117 117 91 0 200 400 600 800 1000 Q1 2016 Q2 2016 Q3 2016 Q4 2016 Q1 2017 Volume by Region ($’s Billions) Asia EMEA US ROW (1) Trading metrics data excludes discontinued operations.

7 Global Brokerage, Inc. Operating Environment – Currency VIX and Equity Market VIX 7 8 9 10 11 12 13 14 JPM Global FX CVIX - January 2016 - April 2017 5 10 15 20 25 30 35 CBOE Equity VIX - January 2016 - April 2017 • Q1 2017 was one of the lowest volatility periods in recent history – in both the currency markets (as measured by the JPM Global FX CVIX above) and equity markets (as measured by the CBOE equity VIX to the right) • April has continued this low volatility trend although revenue capture has been very encouraging for the month
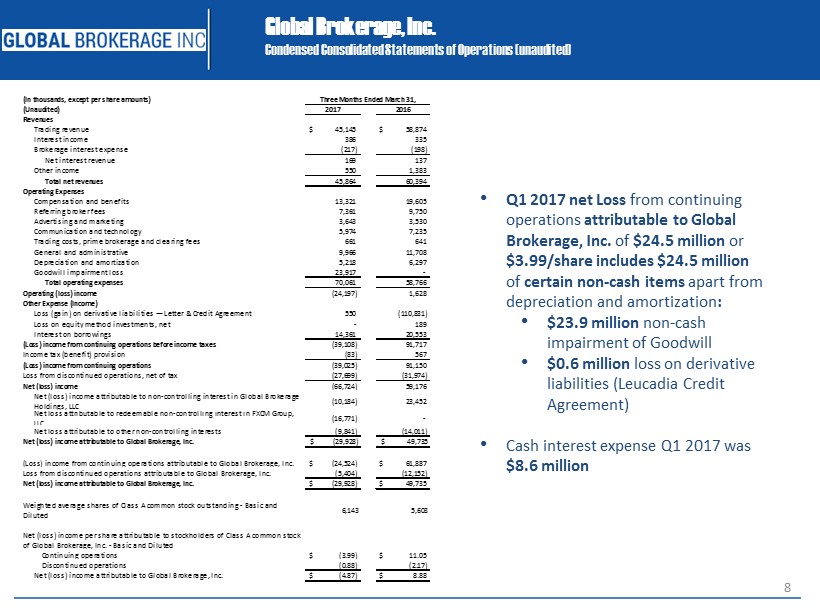
8 Global Brokerage, Inc. Condensed Consolidated Statements of Operations ( unaudited ) • Q1 2017 net Loss from continuing operations attributable to Global Brokerage, Inc. of $ 24.5 million or $3.99/share i ncludes $ 24.5 million of certain non - cash items apart from depreciation and amortization : • $23.9 million non - cash impairment of Goodwill • $0.6 million loss on derivative liabilities (Leucadia Credit Agreement ) • Cash interest expense Q1 2017 was $8.6 million (In thousands, except per share amounts) (Unaudited) 2017 2016 Revenues Trading revenue $ 45,145 $ 58,874 Interest income 386 335 Brokerage interest expense (217) (198) Net interest revenue 169 137 Other income 550 1,383 Total net revenues 45,864 60,394 Operating Expenses Compensation and benefits 13,321 19,605 Referring broker fees 7,361 9,750 Advertising and marketing 3,643 3,530 Communication and technology 5,974 7,235 Trading costs, prime brokerage and clearing fees 661 641 General and administrative 9,966 11,708 Depreciation and amortization 5,218 6,297 Goodwill impairment loss 23,917 - Total operating expenses 70,061 58,766 Operating (loss) income (24,197) 1,628 Other Expense (Income) Loss (gain) on derivative liabilities — Letter & Credit Agreement 550 (110,831) Loss on equity method investments, net - 189 Interest on borrowings 14,361 20,553 (Loss) income from continuing operations before income taxes (39,108) 91,717 Income tax (benefit) provision (83) 567 (Loss) income from continuing operations (39,025) 91,150 Loss from discontinued operations, net of tax (27,699) (31,974) Net (loss) income (66,724) 59,176 Net (loss) income attributable to non-controlling interest in Global Brokerage Holdings, LLC (10,184) 23,452 Net loss attributable to redeemable non-controlling interest in FXCM Group, LLC (16,771) - Net loss attributable to other non-controlling interests (9,841) (14,011) Net (loss) income attributable to Global Brokerage, Inc. $ (29,928) $ 49,735 (Loss) income from continuing operations attributable to Global Brokerage, Inc. $ (24,524) $ 61,887 Loss from discontinued operations attributable to Global Brokerage, Inc. (5,404) (12,152) Net (loss) income attributable to Global Brokerage, Inc. $ (29,928) $ 49,735 Weighted average shares of Class A common stock outstanding - Basic and Diluted 6,143 5,603 Net (loss) income per share attributable to stockholders of Class A common stock of Global Brokerage, Inc. - Basic and Diluted Continuing operations $ (3.99) $ 11.05 Discontinued operations (0.88) (2.17) Net (loss) income attributable to Global Brokerage, Inc. $ (4.87) $ 8.88 Three Months Ended March 31,
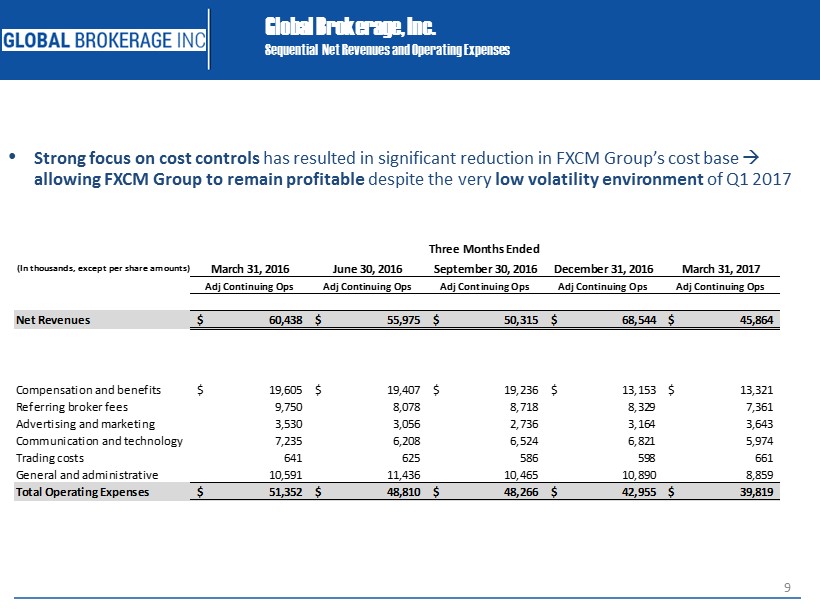
9 Global Brokerage, Inc. Sequential Net Revenues and Operating Expenses (In thousands, except per share amounts) • Strong focus on cost controls has resulted in significant reduction in FXCM Group’s cost base allowing FXCM Group to remain profitable despite the very low volatility environment of Q1 2017 March 31, 2016 June 30, 2016 September 30, 2016 December 31, 2016 March 31, 2017 Adj Continuing Ops Adj Continuing Ops Adj Continuing Ops Adj Continuing Ops Adj Continuing Ops Net Revenues 60,438$ 55,975$ 50,315$ 68,544$ 45,864$ Compensation and benefits 19,605$ 19,407$ 19,236$ 13,153$ 13,321$ Referring broker fees 9,750 8,078 8,718 8,329 7,361 Advertising and marketing 3,530 3,056 2,736 3,164 3,643 Communication and technology 7,235 6,208 6,524 6,821 5,974 Trading costs 641 625 586 598 661 General and administrative 10,591 11,436 10,465 10,890 8,859 Total Operating Expenses 51,352$ 48,810$ 48,266$ 42,955$ 39,819$ Three Months Ended
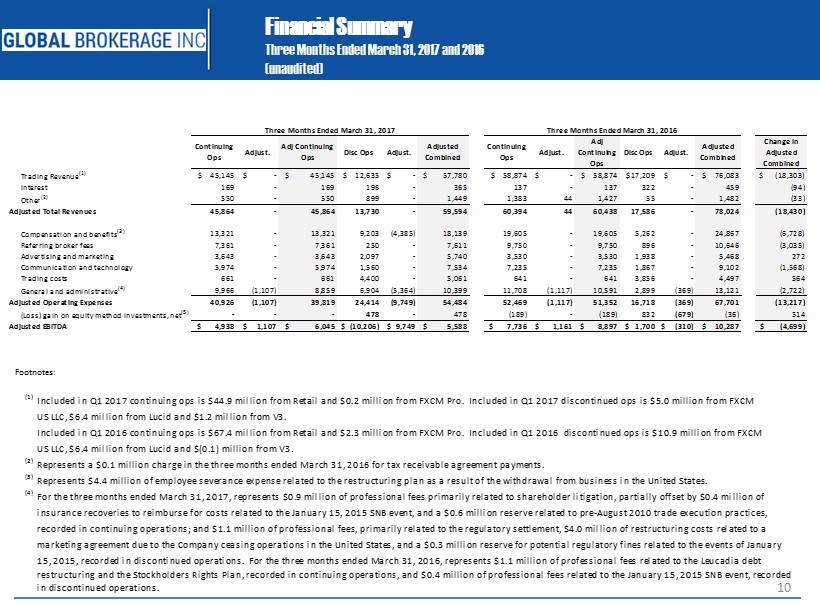
10 Financial Summary Three Months Ended March 31, 2017 and 2016 (unaudited ) Footnotes: Continuing Ops Adjust. Adj Continuing Ops Disc Ops Adjust. Adjusted Combined Continuing Ops Adjust. Adj Continuing Ops Disc Ops Adjust. Adjusted Combined Change in Adjusted Combined Trading Revenue (1) $ 45,145 $ - $ 45,145 $ 12,635 $ - $ 57,780 $ 58,874 $ - $ 58,874 $17,209 $ - $ 76,083 $ (18,303) Interest 169 - 169 196 - 365 137 - 137 322 - 459 (94) Other (2) 550 - 550 899 - 1,449 1,383 44 1,427 55 - 1,482 (33) Adjusted Total Revenues 45,864 - 45,864 13,730 - 59,594 60,394 44 60,438 17,586 - 78,024 (18,430) Compensation and benefits (3) 13,321 - 13,321 9,203 (4,385) 18,139 19,605 - 19,605 5,262 - 24,867 (6,728) Referring broker fees 7,361 - 7,361 250 - 7,611 9,750 - 9,750 896 - 10,646 (3,035) Advertising and marketing 3,643 - 3,643 2,097 - 5,740 3,530 - 3,530 1,938 - 5,468 272 Communication and technology 5,974 - 5,974 1,560 - 7,534 7,235 - 7,235 1,867 - 9,102 (1,568) Trading costs 661 - 661 4,400 - 5,061 641 - 641 3,856 - 4,497 564 General and administrative (4) 9,966 (1,107) 8,859 6,904 (5,364) 10,399 11,708 (1,117) 10,591 2,899 (369) 13,121 (2,722) Adjusted Operating Expenses 40,926 (1,107) 39,819 24,414 (9,749) 54,484 52,469 (1,117) 51,352 16,718 (369) 67,701 (13,217) (Loss) gain on equity method investments, net (5) - - - 478 - 478 (189) - (189) 832 (679) (36) 514 Adjusted EBITDA $ 4,938 $ 1,107 $ 6,045 $ (10,206) $ 9,749 $ 5,588 $ 7,736 $ 1,161 $ 8,897 $ 1,700 $ (310) $ 10,287 $ (4,699) Three Months Ended March 31, 2017 Three Months Ended March 31, 2016 (1) Included in Q1 2017 continuing ops is $44.9 million from Retail and $0.2 million from FXCM Pro. Included in Q1 2017 discontinued ops is $5.0 million from FXCM US LLC, $6.4 million from Lucid and $1.2 million from V3. Included in Q1 2016 continuing ops is $67.4 million from Retail and $2.3 million from FXCM Pro. Included in Q1 2016 discontinued ops is $10.9 million from FXCM US LLC, $6.4 million from Lucid and $(0.1) million from V3. (2) Represents a $0.1 million charge in the three months ended March 31, 2016 for tax receivable agreement payments. (3) Represents $4.4 million of employee severance expense related to the restructuring plan as a result of the withdrawal from business in the United States. (4) For the three months ended March 31, 2017, represents $0.9 million of professional fees primarily related to shareholder litigation, partially offset by $0.4 million of insurance recoveries to reimburse for costs related to the January 15, 2015 SNB event, and a $0.6 million reserve related to pre-August 2010 trade execution practices, recorded in continuing operations; and $1.1 million of professional fees, primarily related to the regulatory settlement, $4.0 million of restructuring costs related to a marketing agreement due to the Company ceasing operations in the United States, and a $0.3 million reserve for potential regulatory fines related to the events of January 15, 2015, recorded in discontinued operations. For the three months ended March 31, 2016, represents $1.1 million of professional fees related to the Leucadia debt restructuring and the Stockholders Rights Plan, recorded in continuing operations, and $0.4 million of professional fees related to the January 15, 2015 SNB event, recorded in discontinued operations.
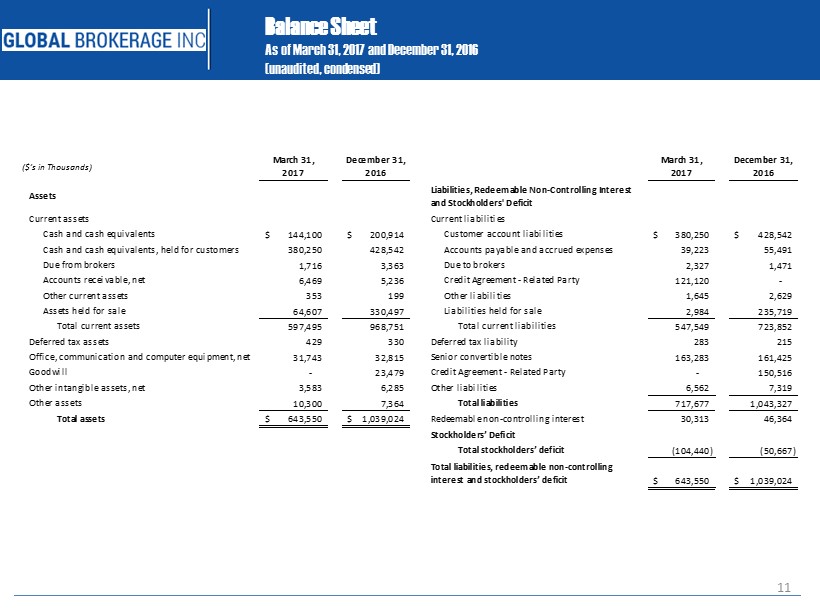
11 Balance Sheet As of March 31, 2017 and December 31, 2016 ( unaudited, condensed) ($’s in Thousands) March 31, 2017 December 31, 2016 March 31, 2017 December 31, 2016 Assets Liabilities, Redeemable Non-Controlling Interest and Stockholders' Deficit Current assets Current liabilities Cash and cash equivalents 144,100$ 200,914$ Customer account liabilities 380,250$ 428,542$ Cash and cash equivalents, held for customers 380,250 428,542 Accounts payable and accrued expenses 39,223 55,491 Due from brokers 1,716 3,363 Due to brokers 2,327 1,471 Accounts receivable, net 6,469 5,236 Credit Agreement - Related Party 121,120 - Other current assets 353 199 Other liabilities 1,645 2,629 Assets held for sale 64,607 330,497 Liabilities held for sale 2,984 235,719 Total current assets 597,495 968,751 Total current liabilities 547,549 723,852 Deferred tax assets 429 330 Deferred tax liability 283 215 Office, communication and computer equipment, net 31,743 32,815 Senior convertible notes 163,283 161,425 Goodwill - 23,479 Credit Agreement - Related Party - 150,516 Other intangible assets, net 3,583 6,285 Other liabilities 6,562 7,319 Other assets 10,300 7,364 Total liabilities 717,677 1,043,327 Total assets 643,550$ 1,039,024$ Redeemable non-controlling interest 30,313 46,364 Stockholders’ Deficit Total stockholders’ deficit (104,440) (50,667) Total liabilities, redeemable non-controlling interest and stockholders’ deficit 643,550$ 1,039,024$
12 Appendix
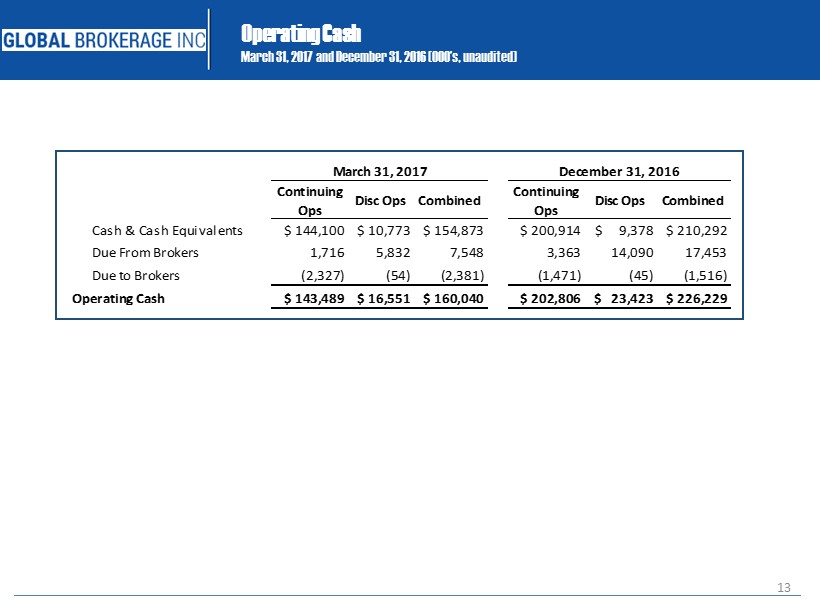
13 Operating Cash March 31, 2017 and December 31, 2016 ( 000’s, unaudited) Continuing Ops Disc Ops Combined Continuing Ops Disc Ops Combined Cash & Cash Equivalents $ 144,100 $ 10,773 $ 154,873 $ 200,914 $ 9,378 $ 210,292 Due From Brokers 1,716 5,832 7,548 3,363 14,090 17,453 Due to Brokers (2,327) (54) (2,381) (1,471) (45) (1,516) Operating Cash $ 143,489 $ 16,551 $ 160,040 $ 202,806 $ 23,423 $ 226,229 March 31, 2017 December 31, 2016
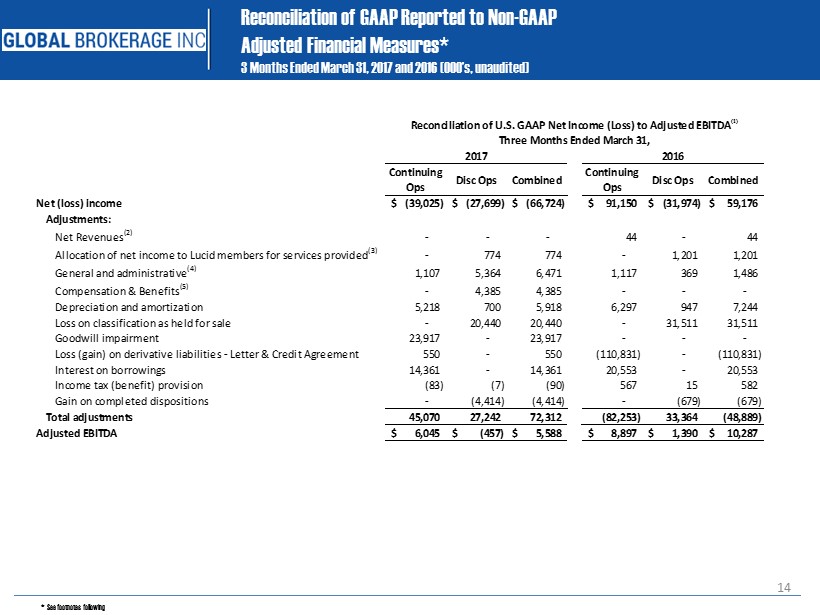
14 Reconciliation of GAAP Reported to Non - GAAP Adjusted Financial Measures* 3 Months Ended March 31, 2017 and 2016 ( 000’s, unaudited) * See footnotes following Continuing Ops Disc Ops Combined Continuing Ops Disc Ops Combined Net (loss) income (39,025)$ (27,699)$ (66,724)$ 91,150$ (31,974)$ 59,176$ Adjustments: Net Revenues (2) - - - 44 - 44 Allocation of net income to Lucid members for services provided (3) - 774 774 - 1,201 1,201 General and administrative (4) 1,107 5,364 6,471 1,117 369 1,486 Compensation & Benefits (5) - 4,385 4,385 - - - Depreciation and amortization 5,218 700 5,918 6,297 947 7,244 Loss on classification as held for sale - 20,440 20,440 - 31,511 31,511 Goodwill impairment 23,917 - 23,917 - - - Loss (gain) on derivative liabilities - Letter & Credit Agreement 550 - 550 (110,831) - (110,831) Interest on borrowings 14,361 - 14,361 20,553 - 20,553 Income tax (benefit) provision (83) (7) (90) 567 15 582 Gain on completed dispositions - (4,414) (4,414) - (679) (679) Total adjustments 45,070 27,242 72,312 (82,253) 33,364 (48,889) Adjusted EBITDA 6,045$ (457)$ 5,588$ 8,897$ 1,390$ 10,287$ Reconciliation of U.S. GAAP Net Income (Loss) to Adjusted EBITDA (1) Three Months Ended March 31, 2017 2016
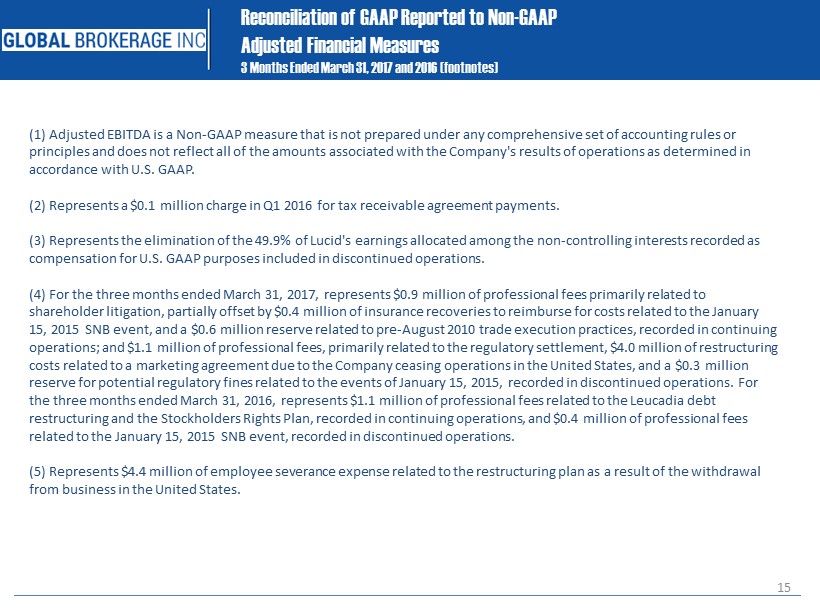
15 Reconciliation of GAAP Reported to Non - GAAP Adjusted Financial Measures 3 Months Ended March 31 , 2017 and 2016 (footnotes) (1) Adjusted EBITDA is a Non - GAAP measure that is not prepared under any comprehensive set of accounting rules or principles and does not reflect all of the amounts associated with the Company's results of operations as determined in accordance with U.S. GAAP. (2) Represents a $0.1 million charge in Q1 2016 for tax receivable agreement payments. (3) Represents the elimination of the 49.9% of Lucid's earnings allocated among the non - controlling interests recorded as compensation for U.S. GAAP purposes included in discontinued operations . (4) For the three months ended March 31, 2017, represents $0.9 million of professional fees primarily related to shareholder litigation, partially offset by $0.4 million of insurance recoveries to reimburse for costs related to the Januar y 15, 2015 SNB event, and a $0.6 million reserve related to pre - August 2010 trade execution practices, recorded in continuing operations; and $1.1 million of professional fees, primarily related to the regulatory settlement, $4.0 million of restructur ing costs related to a marketing agreement due to the Company ceasing operations in the United States, and a $0.3 million reserve for potential regulatory fines related to the events of January 15, 2015, recorded in discontinued operations. For the three months ended March 31, 2016, represents $1.1 million of professional fees related to the Leucadia debt restructuring and the Stockholders Rights Plan, recorded in continuing operations, and $0.4 million of professional fees related to the January 15, 2015 SNB event, recorded in discontinued operations. (5) Represents $4.4 million of employee severance expense related to the restructuring plan as a result of the withdrawal from business in the United States.
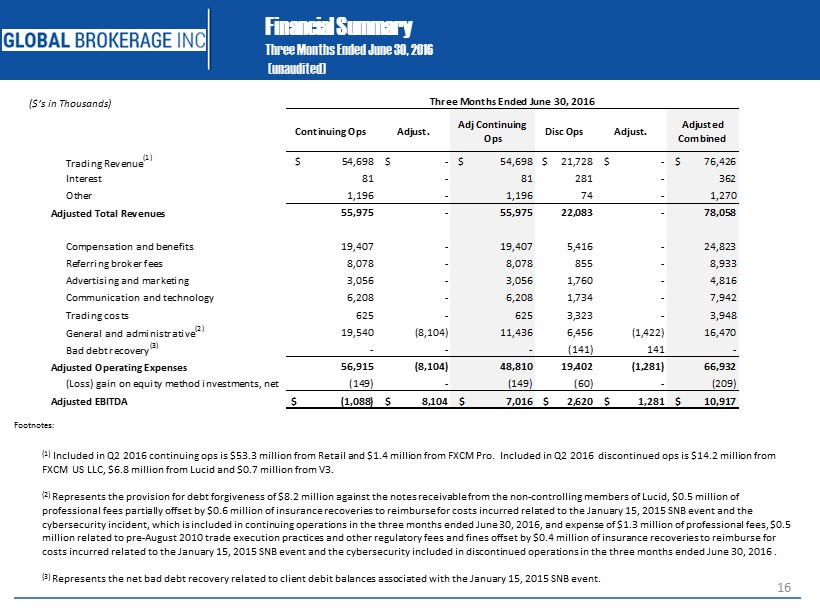
16 Financial Summary Three Months Ended June 30, 2016 ( unaudited ) ($’s in Thousands) Footnotes: ( 1) Included in Q2 2016 continuing ops is $53.3 million from Retail and $ 1.4 million from FXCM Pro. Included in Q2 2016 discontinued ops is $14.2 million from FXCM US LLC, $6.8 million from Lucid and $0.7 million from V3 . (2) Represents the provision for debt forgiveness of $8.2 million against the notes receivable from the non - controlling members of Lucid, $0.5 million of professional fees partially offset by $0.6 million of insurance recoveries to reimburse for costs incurred related to the January 15, 2015 SNB event and the cybersecurity incident, which is included in continuing operations in the three months ended June 30, 2016, and expense of $1.3 million of professional fees, $ 0.5 million related to pre - August 2010 trade execution practices and other regulatory fees and fines offset by $0.4 million of insurance recoveries to reimburse for costs incurred related to the January 15, 2015 SNB event and the cybersecurity included in discontinued operations in the three months ended June 30, 2016 . (3) Represents the net bad debt recovery related to client debit balances associated with the January 15, 2015 SNB event. Continuing Ops Adjust. Adj Continuing Ops Disc Ops Adjust. Adjusted Combined Trading Revenue (1) $ 54,698 $ - $ 54,698 $ 21,728 $ - $ 76,426 Interest 81 - 81 281 - 362 Other 1,196 - 1,196 74 - 1,270 Adjusted Total Revenues 55,975 - 55,975 22,083 - 78,058 Compensation and benefits 19,407 - 19,407 5,416 - 24,823 Referring broker fees 8,078 - 8,078 855 - 8,933 Advertising and marketing 3,056 - 3,056 1,760 - 4,816 Communication and technology 6,208 - 6,208 1,734 - 7,942 Trading costs 625 - 625 3,323 - 3,948 General and administrative (2) 19,540 (8,104) 11,436 6,456 (1,422) 16,470 Bad debt recovery (3) - - - (141) 141 - Adjusted Operating Expenses 56,915 (8,104) 48,810 19,402 (1,281) 66,932 (Loss) gain on equity method investments, net (149) - (149) (60) - (209) Adjusted EBITDA $ (1,088) $ 8,104 $ 7,016 $ 2,620 $ 1,281 $ 10,917 Three Months Ended June 30, 2016
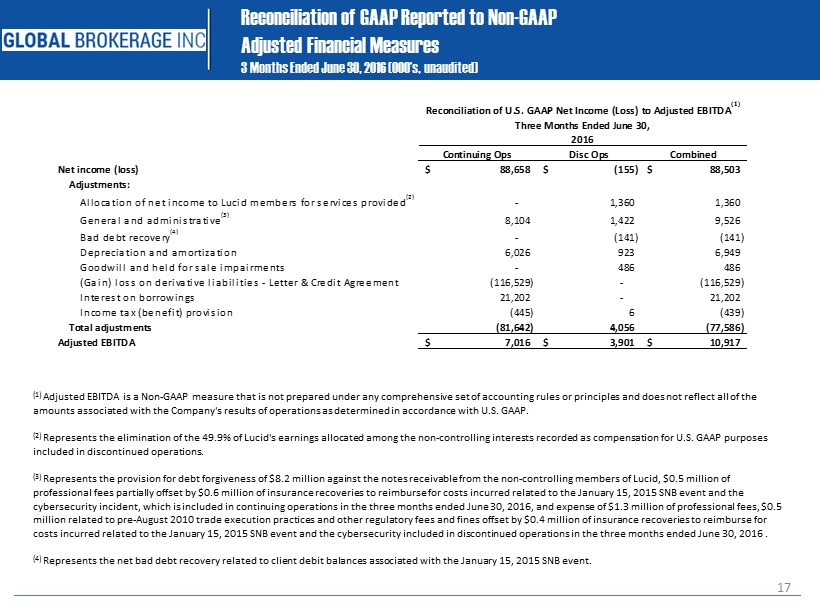
17 Reconciliation of GAAP Reported to Non - GAAP Adjusted Financial Measures 3 Months Ended June 30, 2016 (000’s, unaudited) (1 ) Adjusted EBITDA is a Non - GAAP measure that is not prepared under any comprehensive set of accounting rules or principles and doe s not reflect all of the amounts associated with the Company's results of operations as determined in accordance with U.S. GAAP. (2 ) Represents the elimination of the 49.9% of Lucid's earnings allocated among the non - controlling interests recorded as compensation for U.S. GAAP purposes included in discontinued operations . (3 ) Represents the provision for debt forgiveness of $8.2 million against the notes receivable from the non - controlling members of L ucid, $0.5 million of professional fees partially offset by $0.6 million of insurance recoveries to reimburse for costs incurred related to the Jan uar y 15, 2015 SNB event and the cybersecurity incident, which is included in continuing operations in the three months ended June 30, 2016, and expense of $1 .3 million of professional fees, $0.5 million related to pre - August 2010 trade execution practices and other regulatory fees and fines offset by $0.4 million of insur ance recoveries to reimburse for costs incurred related to the January 15, 2015 SNB event and the cybersecurity included in discontinued operations in the thr ee months ended June 30, 2016 . (4) Represents the net bad debt recovery related to client debit balances associated with the January 15, 2015 SNB event. Continuing Ops Disc Ops Combined Net income (loss) 88,658$ (155)$ 88,503$ Adjustments: Allocation of net income to Lucid members for services provided (2) - 1,360 1,360 General and administrative (3) 8,104 1,422 9,526 Bad debt recovery (4) - (141) (141) Depreciation and amortization 6,026 923 6,949 Goodwill and held for sale impairments - 486 486 (Gain) loss on derivative liabilities - Letter & Credit Agreement (116,529) - (116,529) Interest on borrowings 21,202 - 21,202 Income tax (benefit) provision (445) 6 (439) Total adjustments (81,642) 4,056 (77,586) Adjusted EBITDA 7,016$ 3,901$ 10,917$ 2016 Reconciliation of U.S. GAAP Net Income (Loss) to Adjusted EBITDA (1) Three Months Ended June 30,
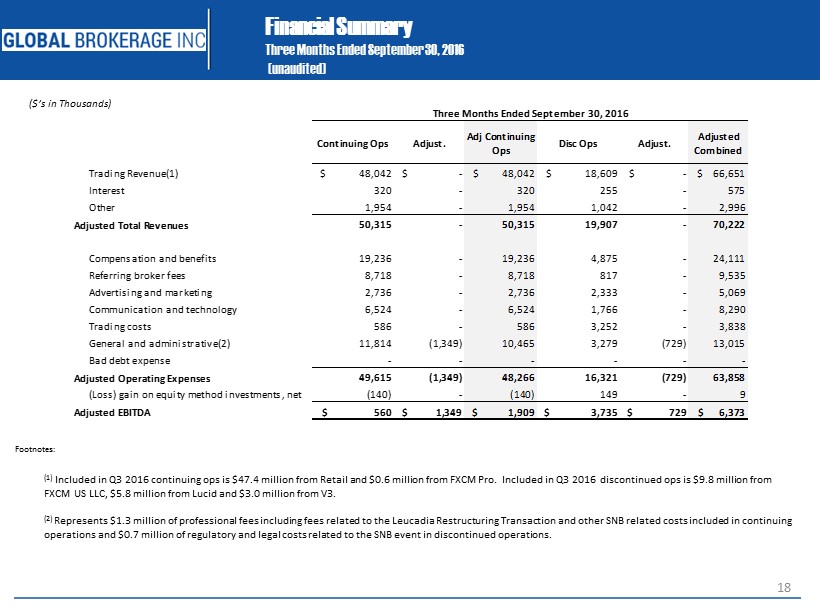
18 Financial Summary Three Months Ended September 30, 2016 ( unaudited ) ($’s in Thousands) Footnotes: ( 1) Included in Q3 2016 continuing ops is $47.4 million from Retail and $ 0.6 million from FXCM Pro. Included in Q3 2016 discontinued ops is $9.8 million from FXCM US LLC, $5.8 million from Lucid and $3.0 million from V3. (2) Represents $1.3 million of professional fees including fees related to the Leucadia Restructuring Transaction and other SNB related costs included in continuing operations and $0.7 million of regulatory and legal costs related to the SNB event in discontinued operations. Continuing Ops Adjust. Adj Continuing Ops Disc Ops Adjust. Adjusted Combined Trading Revenue(1) $ 48,042 $ - $ 48,042 $ 18,609 $ - $ 66,651 Interest 320 - 320 255 - 575 Other 1,954 - 1,954 1,042 - 2,996 Adjusted Total Revenues 50,315 - 50,315 19,907 - 70,222 Compensation and benefits 19,236 - 19,236 4,875 - 24,111 Referring broker fees 8,718 - 8,718 817 - 9,535 Advertising and marketing 2,736 - 2,736 2,333 - 5,069 Communication and technology 6,524 - 6,524 1,766 - 8,290 Trading costs 586 - 586 3,252 - 3,838 General and administrative(2) 11,814 (1,349) 10,465 3,279 (729) 13,015 Bad debt expense - - - - - - Adjusted Operating Expenses 49,615 (1,349) 48,266 16,321 (729) 63,858 (Loss) gain on equity method investments, net (140) - (140) 149 - 9 Adjusted EBITDA $ 560 $ 1,349 $ 1,909 $ 3,735 $ 729 $ 6,373 Three Months Ended September 30, 2016
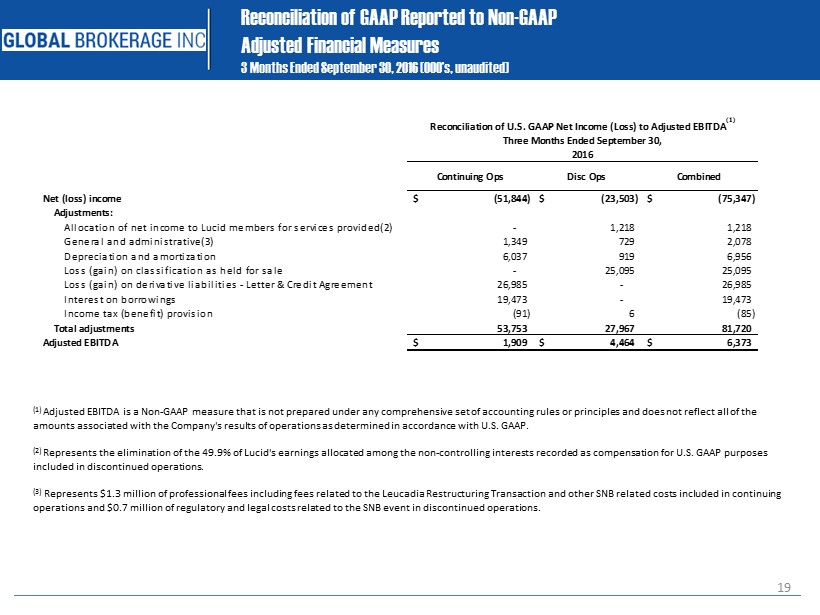
19 Reconciliation of GAAP Reported to Non - GAAP Adjusted Financial Measures 3 Months Ended September 30, 2016 (000’s, unaudited) (1 ) Adjusted EBITDA is a Non - GAAP measure that is not prepared under any comprehensive set of accounting rules or principles and doe s not reflect all of the amounts associated with the Company's results of operations as determined in accordance with U.S. GAAP. (2 ) Represents the elimination of the 49.9% of Lucid's earnings allocated among the non - controlling interests recorded as compensation for U.S. GAAP purposes included in discontinued operations . (3) Represents $1.3 million of professional fees including fees related to the Leucadia Restructuring Transaction and other SNB r ela ted costs included in continuing operations and $0.7 million of regulatory and legal costs related to the SNB event in discontinued operations. Continuing Ops Disc Ops Combined Net (loss) income (51,844)$ (23,503)$ (75,347)$ Adjustments: Allocation of net income to Lucid members for services provided(2) - 1,218 1,218 General and administrative(3) 1,349 729 2,078 Depreciation and amortization 6,037 919 6,956 Loss (gain) on classification as held for sale - 25,095 25,095 Loss (gain) on derivative liabilities - Letter & Credit Agreement 26,985 - 26,985 Interest on borrowings 19,473 - 19,473 Income tax (benefit) provision (91) 6 (85) Total adjustments 53,753 27,967 81,720 Adjusted EBITDA 1,909$ 4,464$ 6,373$ Reconciliation of U.S. GAAP Net Income (Loss) to Adjusted EBITDA (1) Three Months Ended September 30, 2016
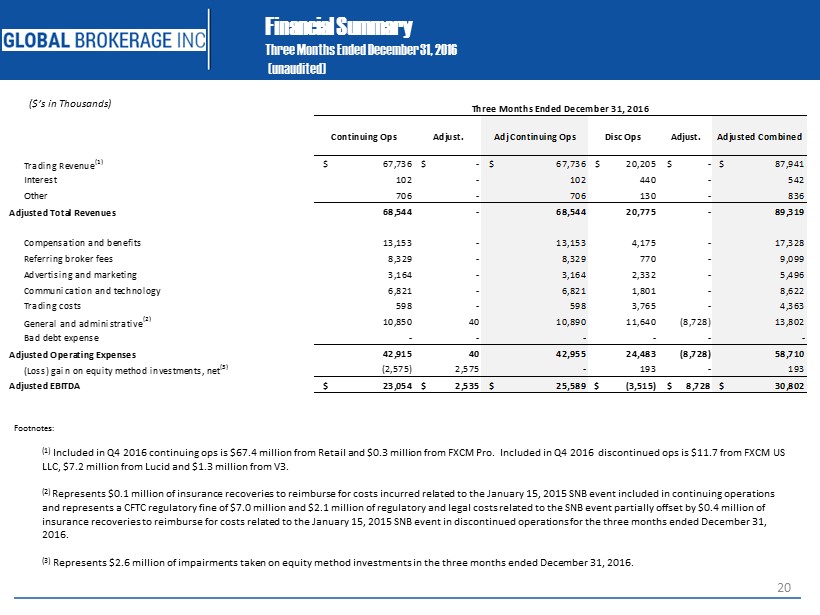
20 Financial Summary Three Months Ended December 31, 2016 ( unaudited ) ($’s in Thousands) Footnotes: ( 1) Included in Q4 2016 continuing ops is $67.4 million from Retail and $ 0.3 million from FXCM Pro. Included in Q4 2016 discontinued ops is $11.7 from FXCM US LLC, $7.2 million from Lucid and $1.3 million from V3. (2) Represents $0.1 million of insurance recoveries to reimburse for costs incurred related to the January 15, 2015 SNB event included in continuing operati ons and represents a CFTC regulatory fine of $7.0 million and $2.1 million of regulatory and legal costs related to the SNB event partially offset by $0.4 million of insurance recoveries to reimburse for costs related to the January 15, 2015 SNB event in discontinued operations for the three months ended December 31, 2016 . (3) Represents $2.6 million of impairments taken on equity method investments in the three months ended December 31, 2016. Continuing Ops Adjust. Adj Continuing Ops Disc Ops Adjust. Adjusted Combined Trading Revenue (1) $ 67,736 $ - $ 67,736 $ 20,205 $ - $ 87,941 Interest 102 - 102 440 - 542 Other 706 - 706 130 - 836 Adjusted Total Revenues 68,544 - 68,544 20,775 - 89,319 Compensation and benefits 13,153 - 13,153 4,175 - 17,328 Referring broker fees 8,329 - 8,329 770 - 9,099 Advertising and marketing 3,164 - 3,164 2,332 - 5,496 Communication and technology 6,821 - 6,821 1,801 - 8,622 Trading costs 598 - 598 3,765 - 4,363 General and administrative (2) 10,850 40 10,890 11,640 (8,728) 13,802 Bad debt expense - - - - - - Adjusted Operating Expenses 42,915 40 42,955 24,483 (8,728) 58,710 (Loss) gain on equity method investments, net (3) (2,575) 2,575 - 193 - 193 Adjusted EBITDA $ 23,054 $ 2,535 $ 25,589 $ (3,515) $ 8,728 $ 30,802 Three Months Ended December 31, 2016
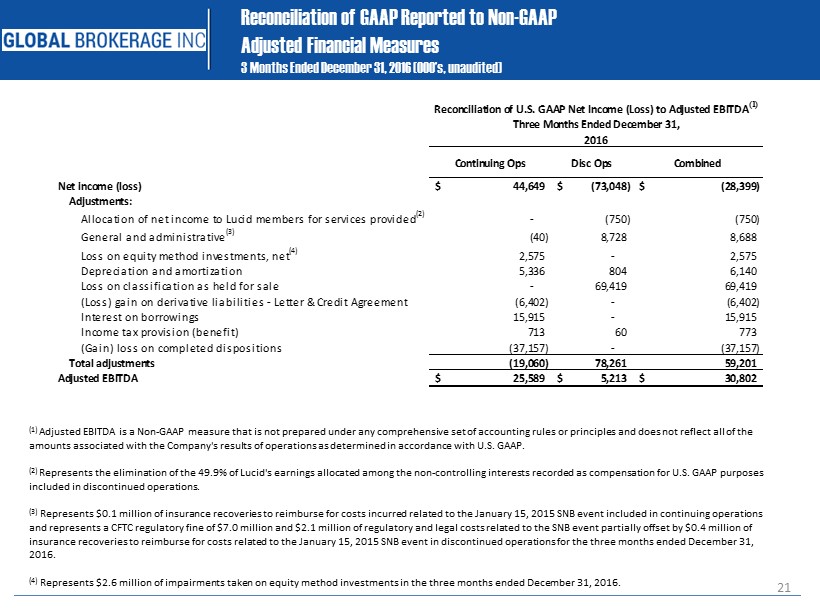
21 Reconciliation of GAAP Reported to Non - GAAP Adjusted Financial Measures 3 Months Ended December 31, 2016 (000’s, unaudited) (1 ) Adjusted EBITDA is a Non - GAAP measure that is not prepared under any comprehensive set of accounting rules or principles and doe s not reflect all of the amounts associated with the Company's results of operations as determined in accordance with U.S. GAAP. (2 ) Represents the elimination of the 49.9% of Lucid's earnings allocated among the non - controlling interests recorded as compensation for U.S. GAAP purposes included in discontinued operations . (3) Represents $0.1 million of insurance recoveries to reimburse for costs incurred related to the January 15, 2015 SNB event inc lud ed in continuing operations and represents a CFTC regulatory fine of $7.0 million and $2.1 million of regulatory and legal costs related to the SNB event pa rtially offset by $0.4 million of insurance recoveries to reimburse for costs related to the January 15, 2015 SNB event in discontinued operations for the thre e m onths ended December 31, 2016. (4) Represents $2.6 million of impairments taken on equity method investments in the three months ended December 31, 2016. Continuing Ops Disc Ops Combined Net income (loss) 44,649$ (73,048)$ (28,399)$ Adjustments: Allocation of net income to Lucid members for services provided (2) - (750) (750) General and administrative (3) (40) 8,728 8,688 Loss on equity method investments, net (4) 2,575 - 2,575 Depreciation and amortization 5,336 804 6,140 Loss on classification as held for sale - 69,419 69,419 (Loss) gain on derivative liabilities - Letter & Credit Agreement (6,402) - (6,402) Interest on borrowings 15,915 - 15,915 Income tax provision (benefit) 713 60 773 (Gain) loss on completed dispositions (37,157) - (37,157) Total adjustments (19,060) 78,261 59,201 Adjusted EBITDA 25,589$ 5,213$ 30,802$ 2016 Reconciliation of U.S. GAAP Net Income (Loss) to Adjusted EBITDA (1) Three Months Ended December 31,