 March 5, 2013 NASDAQ: SIFI NASDAQ: NFSB Acquisition of Exhibit 99.2 |
Safe Harbor Statement 2 Certain statements contained in these materials are forward-looking in nature. These include statements about the merger, including the expected closing date and anticipated cost savings, and about SI Financial Group, Inc.’s (“SIFI”) operating results or financial position and usually use words such as “expect”, “anticipate”, “believe”, and similar expressions. These statements represent management’s current beliefs, based upon information available to it at the time the statements are made with regard to the matters addressed. All forward looking statements are subject to risks and uncertainties that could cause SIFI’s actual results or financial condition to differ materially from those expressed in or implied by such statements. Factors of particular importance to SIFI include, but are not limited to: (1) delays in completing the merger; (2) difficulties in achieving expected cost savings; (3) difficulties in integrating the two organizations; (4) changes in general economic conditions, including interest rates; (5) competition among providers of financial services; (6) changes in the interest rate environment that reduce our margins or reduce the fair value of financial instruments; (7) adverse changes in the securities markets; and (8) our ability to enter new markets successfully and capitalize on growth opportunities. SIFI does not undertake any obligation to update or revise any forward-looking statements, whether as a result of new information, future events or otherwise. In connection with the proposed merger, SIFI will file with the SEC a Registration Statement on Form S-4 that will include a Proxy Statement of Newport Bancorp, Inc. (“NFSB”) and a Proxy Statement and Prospectus of SIFI, as well as other relevant documents concerning the proposed transaction. Shareholders are urged to read the Registration Statement and the Joint Proxy Statement/Prospectus regarding the merger when they become available and any other relevant documents filed with the SEC, as well as any amendments or supplements to those documents, because they will contain important information. You will be able to obtain a free copy of the Joint Proxy Statement/Prospectus, as well as other filings containing information about SIFI and NFSB at the SEC’s Internet site (http://www.sec.gov). You will also be able to obtain these documents, free of charge, from SIFI at https://www.savingsinstitute.com/ under the tab “Investor Relations” and then click on “Documents” and then “SEC Filings” or from NFSB by accessing NFSB’s website at http://investors.newportfederal.com/ and then under the “Investor Relations” menu under the heading “SEC Filings”. SIFI and NFSB and certain of their directors and executive officers may be deemed to be participants in the solicitation of proxies from the shareholders of NFSB in connection with the proposed merger. Information about the directors and executive officers of SIFI is set forth in the proxy statement for SIFI’s 2012 annual meeting of shareholders, as filed with the SEC. Information about the directors and executive officers of NFSB is set forth in the proxy statement for NFSB’s 2012 annual meeting of shareholders, as filed with the SEC. Additional information regarding the interests of those participants and other persons who may be deemed participants in the transaction may be obtained by reading the Joint Proxy Statement/Prospectus regarding the proposed merger when it becomes available. You may obtain free copies of this document as described above. |
 3 Transaction Overview Purchase Price Per Share: $17.55 per share Transaction Metrics: Price / Tangible Book Value: 116% Core Deposit Premium: 3.0% Consideration Mix: 50% Stock / 50% Cash Fixed Exchange Ratio (1) : 1.5129x Diluted Transaction Value (2) : $61.3 million Board Representation: Three NFSB directors to join SIFI board Termination Fee: Required Approvals: Regulatory, SIFI & NFSB Board of Directors and SIFI & NFSB shareholders Due Diligence: Comprehensive due diligence completed Anticipated Closing: 3 Quarter 2013 (1) Based on trailing 5 day average price of SIFI ($11.60) as of 3/4/2013 (2) Transaction value based on diluted share count of 3,355,448 (includes impact of retirement of NFSB’s ESOP plan) rd $2.5 million (approximately 4% of aggregate transaction value) |
 4 Acquisition Rationale Significant franchise enhancement Extension of SI’s shoreline branch network Newport is one of seven banks based in Rhode Island and is the fourth largest Strong deposit franchise (74% non-time deposits) Entry into attractive markets with potential for increased commercial lending and cross- selling opportunities in trust and wealth management businesses Clean balance sheet with minimal credit issues Acquisition provides greater scale and improved efficiency Similar operating cultures utilizing same core processing systems Financially attractive terms Acquisition priced below range for recent comparable New England and Mid-Atlantic transactions Significant earnings accretion expected based on conservative estimates Maintain well-capitalized standards on pro forma basis Increases liquidity in SI’s common stock |
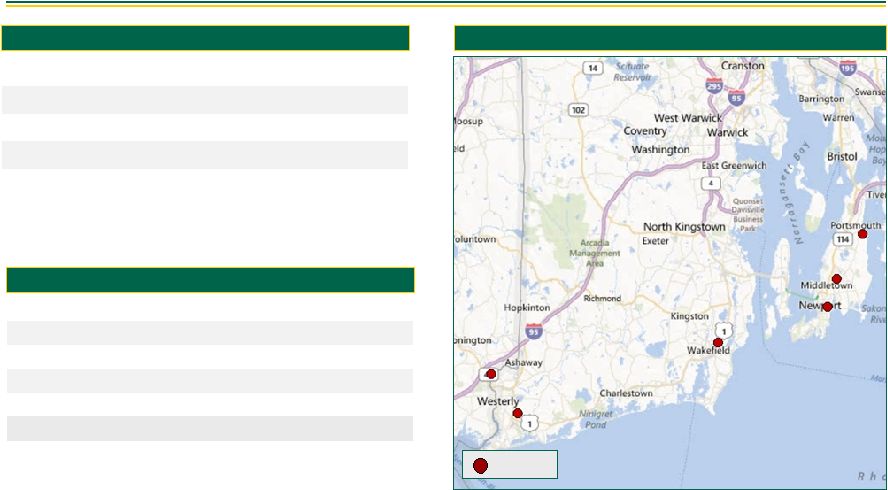 5 Overview of Newport Bancorp, Inc. Overview & History Branch Locations Source: SNL Financial. Based on regulatory data. Calculated as (nonaccrual loans + TDRs) / gross loans. Bank Subsidiary Newport Federal Headquarters Newport, RI Exchange / Ticker NASDAQ / NFSB Number of Branches 6 Banking History Began in 1888 As of December 31, 2012 Total Assets (000s) $449,413 Total Equity (000s) $53,155 TCE / TA 11.8% NPLs / Loans (1) 1.60% 2012 Net Income (000s) $1,561 Financial Summary NFSB |
 6 Pro Forma Franchise and Deposit Market Share Pro Forma Franchise Pro Forma Deposit Market Share – NFSB Markets SIFI NFSB Source: SNL Financial. Deposit data as of June 30, 2012. Newport, RI Deposits in Deposit 2012 Rank Institution (ST) Branches Market ($000) Market Share (%) 1 OceanPoint Financial Ptnrs MHC (RI) 6 657,865 48.33 2 RBS 5 270,860 19.90 3 Newport Bancorp (RI) 3 164,736 12.10 4 Bank of America Corp. (NC) 2 118,421 8.70 5 Santander 3 81,343 5.98 6 Narragansett Financial Corp. (MA) 1 39,974 2.94 7 Webster Financial Corp. (CT) 1 28,050 2.06 Market Total 21 1,361,249 Washington, RI Deposits in Deposit 2012 Rank Institution (ST) Branches Market ($000) Market Share (%) 1 Washington Trust Bancorp Inc. (RI) 10 1,580,435 54.28 2 RBS 10 635,938 21.84 3 Bank of America Corp. (NC) 3 270,829 9.30 4 Santander 2 142,020 4.88 5 Newport Bancorp (RI) 2 68,756 2.36 6 OceanPoint Financial Ptnrs MHC (RI) 2 61,920 2.13 7 Brookline Bancorp Inc. (MA) 1 55,384 1.90 8 Webster Financial Corp. (CT) 2 37,853 1.30 9 Centreville Savings Bank (RI) 2 31,702 1.09 10 Dime Bank (CT) 1 27,012 0.93 Market Total 35 2,911,849 New London, CT Deposits in Deposit 2012 Rank Institution (ST) Branches Market ($000) Market Share (%) 1 RBS 14 812,333 19.11 2 Chelsea Groton Bank (CT) 14 691,826 16.27 3 People's United Financial Inc. (CT) 12 586,442 13.80 4 Dime Bank (CT) 10 473,420 11.14 5 Liberty Bank (CT) 9 455,862 10.72 6 Bank of America Corp. (NC) 11 430,812 10.13 7 Pro Forma Company 9 233,641 5.50 7 SI Financial Group Inc. (CT) 8 193,814 4.56 8 Jewett City Savings Bank (CT) 2 110,512 2.60 9 Eastern SB (CT) 3 108,597 2.55 10 Webster Financial Corp. (CT) 3 82,970 1.95 15 Newport Bancorp (RI) 1 39,827 0.94 Market Total 82 4,062,135 |
 7 Pro Forma Demographic Profile Source: SNL Financial. Projected HH Income Growth (2012 – 2017) Median Household Income (2012) Weighted by County Deposits 15.3% 19.4% 16.4% 19.0% 18.6% 13.4% 0.0% 5.0% 10.0% 15.0% 20.0% 25.0% SIFI NFSB Pro Forma CT RI National $61,805 $65,702 $62,872 $65,549 $53,372 $50,157 $0 $20,000 $40,000 $60,000 $80,000 SIFI NFSB Pro Forma CT RI National |
 8 Financial Considerations Franchise expansion on financially attractive terms well below recent comparable regional transactions Price/tangible book value: 116% Core deposit premium: 3.0% Transformational earnings accretion EPS accretion anticipated to be in excess of 40% on a fully-phased in basis Improved scale and efficiency Significant, achievable synergies identified Tangible book value per share dilution of approximately 8.4% with an expected earn-back period of approximately five years Clean balance sheet with minimal credit issues $5.0 million gross credit mark estimated (1.4% of total loans) One time after-tax transaction costs estimated at $7.9 million Strong pro forma capital position Pro forma tangible common equity to tangible assets ratio of approximately 9.9% |
 |