 Sterne Agee Investor Conference February 11 – 13, 2015 Exhibit 99.1 |
 Forward Looking Statements This presentation contains forward-looking statements, which can be identified by the use of words such as “believes,” “expects,” “anticipates,” “estimates” or similar expressions. These forward-looking statements include, but are not limited to: statements of our goals, intentions and expectations; statements regarding our business plans, prospects, growth and operating strategies; statements regarding the asset quality of our loan and investment portfolios; and estimates of our risks and future costs and benefits. These forward-looking statements which are based on our current beliefs and expectations, are subject to significant risks and uncertainties. Actual results may differ materially from those contemplated by the forward-looking statements due to, among others, the following factors: general economic conditions, either nationally or in our market areas, that are different than expected; changes in the interest rate environment that reduce our margins or reduce the fair value of financial instruments; increased competitive pressures among financial services companies; changes in consumer spending, borrowing and savings habits; legislative or regulatory changes that adversely affect our business; adverse changes in the securities and credit markets; and changes in accounting policies and practices, as may be adopted by bank regulatory agencies or the Financial Accounting Standards Board. Any forward-looking statements made by us speak only as of the date hereof. Any of the forward-looking statements that we make in this presentation may later prove incorrect because of inaccurate assumptions, the factors illustrated above or other factors that we cannot foresee. Because of these and other uncertainties, our actual future results may be materially different from the results indicated by these forward-looking statements. We do not undertake, and specifically disclaim any obligation, to revise any forward-looking statements contained in this presentation. 2 |
 (1) Closing price on February 2, 2015 (2) See Appendix – Non-GAAP Financial Measures (3) Quarterly dividend increased to $0.04 in January 2015 Market Summary as of February 3, 2015 Issuer: SI Financial Group, Inc. Listing / Ticker Symbol: Nasdaq Global Market / “SIFI” Market Price Per Share: (1) $11.08 Shares Outstanding: 12,780,000 Market Capitalization: $141.6 million Tangible Book Value Per Share: (2) $10.89 Price to Tangible Book Value: 101.74% Dividend Yield: (3) 1.44% 3 |
 Company Overview |
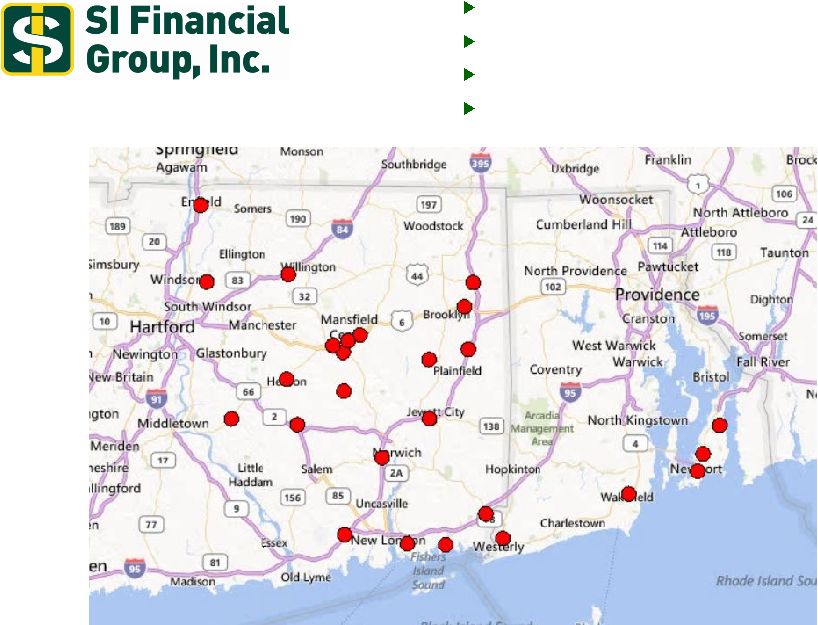 Headquartered in Willimantic, CT Established in 1842 Total assets in 1995: $252 million Total assets as of December 31, 2014: $1.35 billion 5 |
 Business Strategy Community oriented focus by offering a full range of financial products and services Optimize future growth opportunities by executing a proven business model and by opportunistically seeking branch or whole bank acquisitions in areas in or adjacent to existing market area Prudently diversify the asset mix and geographic concentration by selectively increasing the percentage of commercial business loans, multi-family and commercial real estate loans locally and in the New England region and by expanding the existing portfolio of time share and homeowner association loans Continue conservative underwriting practices and maintain a high quality loan portfolio Increase core deposits by emphasizing exceptional customer service, cross-selling our full range of financial products and increasing our commercial deposits Supplement noninterest income through expanded mortgage banking and wealth management operations 6 |
 Financial Highlights |
 Assets as of December 31, 2014 - $1.35 billion 8 |
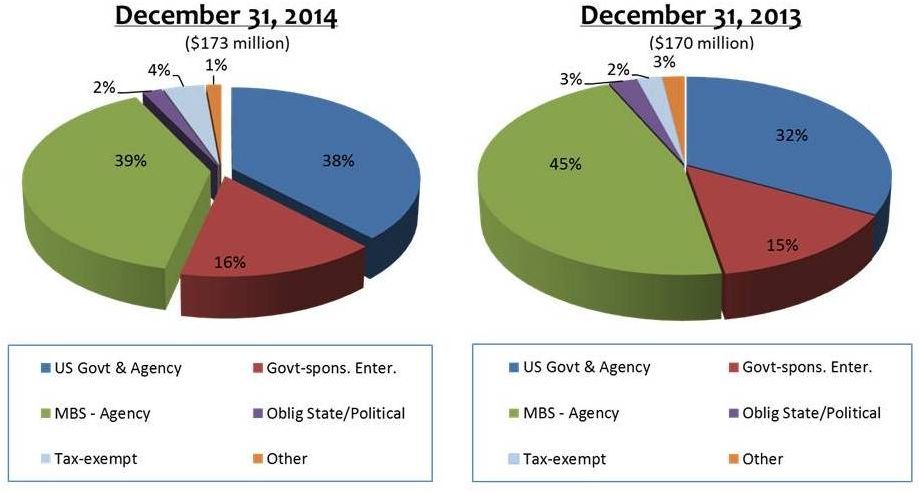 Securities Portfolio Comparison 9 |
 Loan Portfolio Comparison 10 |
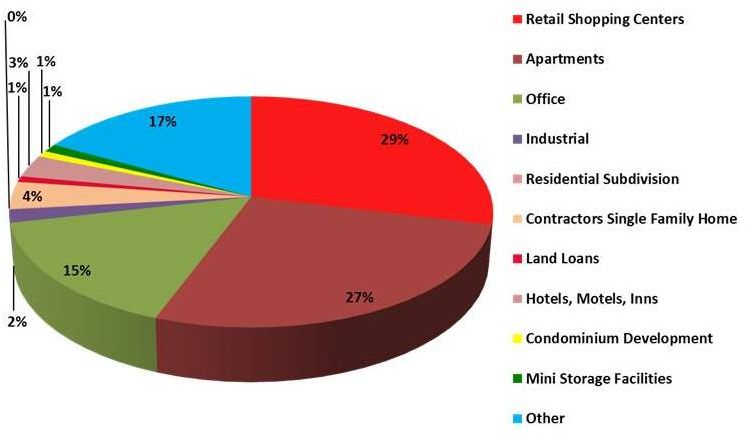 CRE Portfolio Analysis – December 31, 2014 11 |
 12 C&I Portfolio- December 31, 2014 |
 Asset Quality – Trend Savings Institute has maintained high asset quality with solid reserve coverage Aggressive with early recognition of nonperforming loans 2009 2010 2011 2012 2013 2014 Nonperforming loans $ 3,007 $ 4,925 $ 10,591 $ 7,654 $ 6,993 $ 5,002 Other real estate owned 3,680 1,285 976 1,293 2,429 1,271 Nonperforming assets 6,687 6,210 11,567 8,947 9,422 6,273 NPLs/Loans 0.49% 0.81% 1.70% 1.11% 0.66% 0.48% NPAs/Assets 0.77% 0.67% 1.21% 0.94% 0.70% 0.46% Reserves/Loans 0.80% 0.79% 0.80% 0.93% 0.66% 0.74% Reserves/NPLs 162.65% 97.44% 46.93% 83.45% 98.90% 155.88% Dollars in thousands. 13 |
 Deposits Total deposits exclude mortgagors’ and investors’ escrow accounts. Dollars in thousands. Average Interest Rate 2.25% 1.55% 1.18% 0.97% 0.75% 0.62% 14 |
 Operating Results 2012 2013 2014 Net Interest Margin 2.88% 2.93% 3.11% Net Income (Loss) $1,118 ($855) $4,411 EPS $0.11 ($0.08) $0.36 Non-Interest Income $8,717 $8,305 $10,166 Dollars in thousands, except per share amounts. 15 |
 Expenses/Efficiencies 2012 2013 2014 Non-Interest Expenses $43.7 million (1) $37.7 million (3) $41.5 million Efficiency Ratio 88.19 (2) 96.10 84.05 FTE 248 (2) 294 280 Assets/FTE $3.8 million $4.6 million $4.8 million (1) 2012 represents total for both SIFI and NFSB as independent banks. (2) SIFI Only. (3) Only four months as a combined institution. 16 |
 Financial Strength – December 31, 2014 * Represents regulatory capital ratios for Savings Institute. Ratio * Minimum Required Well Capitalized Risk-Based Capital 15.87% 8.00% 10.00% Tier 1 Risk-Based Capital 14.86% 4.00% 6.00% Tier 1 Capital 9.37% 4.00% 5.00% 17 |
 Appendix – Non-GAAP Financial Measures |
 Non-GAAP Financial Measures – December 31, 2014 Tangible Book Value Per Share: Book value per share $12.35 Effect of intangible assets per share ( 1.46) Tangible book value per share $10.89 Tangible Common Equity: Equity $157,739 Less: Intangible assets (18,697) Tangible equity $139,042 Dollars in thousands, except per share amounts. 19 |
 2015 Initiatives Add Commercial Lenders Right Size Branch Network Expiring Contracts EMV Chip Card 20 |