Consolidated Financial Statements
Ironwood Institutional Multi-Strategy Fund LLC
Year Ended April 30, 2022
With Report of Independent Registered Public Accounting Firm
Ironwood Institutional Multi-Strategy Fund LLC
Consolidated Financial Statements
Year Ended April 30, 2022
Contents
Management Discussion of Fund Performance (Unaudited) | 1 |
Report of Independent Registered Public Accounting Firm | 4
|
Consolidated Statement of Assets and Liabilities | 5 |
Consolidated Schedule of Investments | 6 |
Consolidated Statement of Operations | 11 |
Consolidated Statements of Changes in Net Assets | 12 |
Consolidated Statement of Cash Flows | 13 |
Consolidated Financial Highlights | 14 |
Notes to Consolidated Financial Statements | 15 |
Ironwood Institutional Multi-Strategy Fund LLC
Management’s Discussion of Fund Performance (Unaudited)
Investment Approach
Ironwood Institutional Multi-Strategy Fund LLC’s (“IIMS” or the “Fund”) investment objective is capital appreciation with limited variability of returns. IIMS seeks to achieve this objective by allocating capital to a select group of alternative asset managers and the investment funds they operate. The Fund primarily invests across four core hedge fund strategies: relative value, market neutral and hedged equity, event-driven, and distressed and credit securities.
Performance Overview
For the fiscal year ended April 30, 2022, Ironwood Institutional Multi-Strategy Fund LLC returned 3.73% net while the HFRI FOF: Conservative Index (“HFRI FOF”) returned 3.02% for the same period.
Performance and Portfolio Discussion
The primary macroeconomic drivers that shaped market and investor sentiment over the last twelve months included inflation, global economic growth, supply-chain disruptions, and rising interest rates. Economies and businesses entered a transitionary, re-opening phase as direct headwinds associated with the COVID-19 pandemic abated. This transition combined with continued accommodative fiscal and monetary policy created a supportive environment for corporate earnings and equity valuations in 2021, but expectations for rising rates have put pressure on markets in early 2022.
IIMS generated returns in a consistent and complementary manner throughout the fiscal year with minimal dependence on broader equity and credit markets; during the twelve months ended April 30, 2022, the Fund returned 3.73% net with an annualized standard deviation of 1.98% and a beta of 0.06 and 0.22 to the S&P 500 Total Return Index and Bloomberg Barclays Aggregate Bond Index, respectively. At the sector level, three of the Fund’s four sectors were positive over the fiscal year, and attribution from investment funds was well distributed. Looking ahead, Ironwood will continue to seek to emphasize diversification at the strategy, manager, and exposure level, while opportunistically taking advantage of clearly defined and compelling opportunities.
At the end of the fiscal period, the Fund’s exposure by sector was as follows: Relative Value (37%), Market Neutral and Hedged Equity (26%), Event Driven (18%), and Distressed and Credit Securities (6%).
Ironwood Institutional Multi-Strategy Fund LLC
Management’s Discussion of Fund Performance (Unaudited)
Fund Performance
The graph below illustrates the growth of a hypothetical $50,000 investment in the Fund over the ten years ended April 30, 2022 compared to the HFRI FOF.
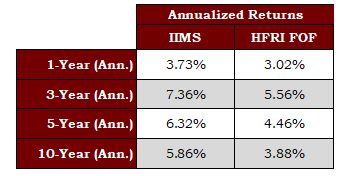
The table below presents the Fund’s average annual total returns through the fiscal year ended April 30, 2022.
Return information is unaudited, estimated, and subject to change. Fund Returns shown are net of fees (including an advisory fee of 1.20% per annum) and expenses and reflect the reinvestment of dividends and other investment income. Fund Returns shown do not include any commissions or transaction charges that may be charged by certain broker-dealers upon investing in the Fund and do not reflect the deduction of taxes that an investor would pay on Fund distributions or the redemption of Fund units. Past performance is not indicative of future results. Depending on an investor's investment date, holding period, and other factors, an investor may have overall performance that underperforms or outperforms that reflected above.
Ironwood Institutional Multi-Strategy Fund LLC
Management’s Discussion of Fund Performance (Unaudited)
Index and Statistical Definitions
Index performance is shown for illustrative purposes only and does not represent the performance of any specific investment. Index returns do not include expenses, fees or charges, which would lower performance. The indices are unmanaged and an investor cannot invest directly in an index. In reviewing the performance of the Fund, investors should not consider any of the indices presented herein to be performance benchmarks.
HFRI FOF: Conservative Index: The HFRI FOF: Conservative Index is an equal-weighted index representing funds of funds that invest with multiple managers focused on consistent performance and lower volatility via absolute return strategies. The Index includes funds of funds tracked by Hedge Fund Research, Inc. The Index is a proxy for the performance of the universe of conservative funds of funds focused on absolute return strategies. Returns are net of fees and are denominated in USD. For more information, please visit www.hedgefundresearch.com.
Bloomberg Barclays Aggregate Bond Index: The Bloomberg Barclays U.S. Aggregate Bond Index is a broad-based fixed income benchmark that measures the investment grade, U.S. dollar-denominated, fixed-rate taxable bond market. The index includes Treasuries, government-related and corporate securities, mortgage backed securities (agency fixed-rate pass-throughs), asset backed securities and commercial mortgage backed securities (agency and non-agency). For more information, please visit www.bloomberg.com/indices.
S&P 500: The S&P 500 Index includes 500 leading companies in leading industries of the U.S. economy, capturing 75% coverage of U.S. equities.
Beta: Beta is the slope of the regression line. Beta measures the risk of a particular investment relative to the market as a whole (the “market” can be any index or investment you specify). It describes the sensitivity of the investment to broad market movements.
Standard Deviation: Standard Deviation measures the degree of variation of returns around the mean (average) return. The higher the volatility of the investment returns, the higher the standard deviation will be. For this reason, standard deviation is often used as a measure of investment risk. All values are presented annualized.
 | Ernst & Young LLP 155 North Wacker Drive Chicago, IL 60606-1787 | Tel: +1 312 879 2000 Fax: +1 312 879 4000
ey.com |
Report of Independent Registered Public Accounting Firm
To the Members and the Board of Directors of Ironwood Institutional Multi-Strategy Fund LLC
Opinion on the Financial Statements
We have audited the accompanying consolidated statement of assets and liabilities of Ironwood Institutional Multi-Strategy Fund LLC (the “Fund”), including the consolidated schedule of investments, as of April 30, 2022, and the related consolidated statements of operations and cash flows for the year then ended, the consolidated statements of changes in net assets for each of the two years in the period then ended, the consolidated financial highlights for each of the five years in the period then ended and the related notes (collectively referred to as the “financial statements”). In our opinion, the financial statements present fairly, in all material respects, the consolidated financial position of the Fund at April 30, 2022, the consolidated results of its operations and its cash flows for the year then ended, the consolidated changes in its net assets for each of the two years in the period then ended and its consolidated financial highlights for each of the five years in the period then ended, in conformity with U.S. generally accepted accounting principles.
Basis for Opinion
These financial statements are the responsibility of the Fund’s management. Our responsibility is to express an opinion on the Fund’s financial statements based on our audit. We are a public accounting firm registered with the Public Company Accounting Oversight Board (United States) ("PCAOB") and are required to be independent with respect to the Fund in accordance with the U.S. federal securities laws and the applicable rules and regulations of the Securities and Exchange Commission and the PCAOB.
We conducted our audit in accordance with the standards of the PCAOB. Those standards require that we plan and perform the audit to obtain reasonable assurance about whether the financial statements are free of material misstatement, whether due to error or fraud. The Fund is not required to have, nor were we engaged to perform, an audit of the Fund’s internal control over financial reporting. As part of our audit, we are required to obtain an understanding of internal control over financial reporting, but not for the purpose of expressing an opinion on the effectiveness of the Fund’s internal control over financial reporting. Accordingly, we express no such opinion.
Our audit included performing procedures to assess the risks of material misstatement of the financial statements, whether due to error or fraud, and performing procedures that respond to those risks. Such procedures included examining, on a test basis, evidence regarding the amounts and disclosures in the financial statements. Our procedures included confirmation of investments owned as of April 30, 2022, by correspondence with the investment managers or administrators of the investment funds or by other appropriate auditing procedures where replies from the investment managers or administrators of the investment funds were not received. Our audit also included evaluating the accounting principles used and significant estimates made by management, as well as evaluating the overall presentation of the financial statements. We believe that our audit provides a reasonable basis for our opinion.
We have served as the Fund’s auditor since 2010.
June 17, 2022
Ironwood Institutional Multi-Strategy Fund LLC
Consolidated Statement of Assets and Liabilities
April 30, 2022
| Assets | |
| Cash | | $ | 107,044,933 | |
| Short-term investments, at fair value (cost $510,625,121) | | | 510,625,121 | |
| Investments in investment funds, at fair value (cost $2,570,185,172) | | | 3,493,476,927 | |
| Advance subscriptions to investment funds | | | 70,000,000 | |
| Dividends receivable | | | 90,769 | |
| Other assets | | | 99,785 | |
| Total assets | | | 4,181,337,535 | |
| | | | | |
| Liabilities | |
| Subscriptions received in advance from Ironwood Multi-Strategy Fund LLC | | | 53,106,575 | |
| Subscriptions received in advance | | | 33,837,762 | |
| Payable to Adviser | | | 11,930,601 | |
| Accrued expenses | | | 374,348 | |
| Total liabilities | | | 99,249,286 | |
| | | | | |
| Commitments and contingencies (see Note 10) | |
| | |
| Net assets | | $ | 4,082,088,249 | |
| | | | | |
| Net assets consist of: | |
| Paid-in capital | | $ | 3,893,793,884 | |
| Accumulated earnings | | | 188,294,365 | |
| Net assets | | $ | 4,082,088,249 | |
| | | | | |
| Net asset value per unit | |
| 3,381,814.44 units issued and outstanding, no par value | | $ | 1,207.07 | |
See accompanying notes to consolidated financial statements.
Ironwood Institutional Multi-Strategy Fund LLC
Consolidated Schedule of Investments
April 30, 2022
| Description | First Acquisition Date | | Number of Shares (1) | | | Cost | | | Fair Value | | | Percent of Net Assets | | | Next Available Redemption Date (2) | | Liquidity (3) |
| |
| Investment Funds |
| |
Relative Value: |
| Alphadyne Global Rates Fund II, Ltd. | 7/1/2018 | | | 115,479 | | | $ | 117,000,000 | | | $ | 126,713,438 | | | | 3.10 | % | | 6/30/2022 | | Quarterly (4) |
| Alphadyne International Fund, Ltd. | 7/1/2019 | | | 13,489 | | | | 16,000,000 | | | | 17,019,996 | | | | 0.42 | | | 6/30/2022 | | Quarterly (4) |
| D.E. Shaw Composite International Fund | 1/1/2011 | | | n/a | | | | 62,657,102 | | | | 180,623,076 | | | | 4.42 | | | 6/30/2022 | | Quarterly (5) |
| D.E. Shaw Valence International Fund, LP | 1/1/2015 | | | n/a | | | | 30,859,296 | | | | 86,431,010 | | | | 2.12 | | | 6/30/2022 | | Quarterly (6) |
| Eisler Capital Multi Strategy Fund Ltd | 7/1/2021 | | | 146,362 | | | | 147,135,560 | | | | 163,035,719 | | | | 3.99 | | | 6/30/2022 | | Quarterly (4) |
| ExodusPoint Partners International Fund, Ltd. | 6/1/2018 | | | 150,000 | | | | 150,000,000 | | | | 192,982,039 | | | | 4.73 | | | 6/30/2022 | | Quarterly (7) |
| Kirkoswald Global Macro Fund Limited | 5/1/2021 | | | 1,495,446 | | | | 148,000,000 | | | | 194,309,600 | | | | 4.76 | | | 6/30/2022 | | Quarterly (4) |
| Millennium International, Ltd. | 1/1/2011 | | | 175,877 | | | | 154,072,870 | | | | 343,100,820 | | | | 8.41 | | | 6/30/2022 | | Quarterly (8) |
| Point72 Capital International, Ltd. | 4/1/2022 | | | 710,000 | | | | 71,000,000 | | | | 72,959,600 | | | | 1.79 | | | 6/30/2022 | | Quarterly (4) |
| Two Sigma Absolute Return Cayman Fund, Ltd. | 2/1/2016 | | | 61,124 | | | | 76,000,000 | | | | 88,471,805 | | | | 2.17 | | | 5/31/2022 | | Monthly |
| Two Sigma Spectrum Cayman Fund, Ltd. | 6/1/2018 | | | 6,111 | | | | 21,603,731 | | | | 26,276,966 | | | | 0.64 | | | 6/30/2022 | | Quarterly |
| Total Relative Value | | | | | | | | 994,328,559 | | | | 1,491,924,069 | | | | 36.55 | | | | | |
| | | | | | | | | | | | | | | | | | | | | | |
Market Neutral and Hedged Equity: |
| Coatue Offshore Fund, Ltd. | 3/1/2021 | | | 132,584 | | | | 92,000,000 | | | | 81,731,873 | | | | 2.00 | | | 6/30/2022 | | Quarterly (4) |
| D1 Capital Partners Offshore LP | 3/13/2020 | | | n/a | | | | 153,000,000 | | | | 248,069,731 | | | | 6.08 | | | 6/30/2022 | | Quarterly (9) |
| Dragoneer Global Offshore Feeder II, LP | 4/1/2020 | | | n/a | | | | 109,951,781 | | | | 94,194,531 | | | | 2.31 | | | 6/30/2024 | | Semi-annually (10) |
| Holocene Advisors Offshore Fund Ltd. | 4/1/2017 | | | 124,703 | | | | 128,500,000 | | | | 192,200,671 | | | | 4.71 | | | 6/30/2022 | | Quarterly (11) |
| Polymer Asia (Cayman) Fund Ltd. | 3/1/2022 | | | 107,000 | | | | 107,000,000 | | | | 107,784,701 | | | | 2.64 | | | 3/31/2023 | | Quarterly (4) |
| Suvretta Offshore Fund, Ltd | 3/1/2013 | | | 2,109 | | | | 1,041,906 | | | | 2,105,398 | | | | 0.05 | | | n/a | | Other (12) |
Suvretta Partners, LP* | 1/1/2017 | | | n/a | | | | 10,696,714 | | | | 12,231,800 | | | | 0.30 | | | 12/31/2022 | | Annually (13) |
| Tiger Global Crossover (Cayman) L.P. | 11/16/2021 | | | n/a | | | | 113,000,000 | | | | 76,021,369 | | | | 1.86 | | | 6/30/2022 | | Annually (14) |
| Woodline Offshore Fund Ltd. | 8/1/2019 | | | 104,053 | | | | 105,650,000 | | | | 139,327,337 | | | | 3.41 | | | 6/30/2022 | | Quarterly (4) |
| XN Exponent Offshore Fund LP | 10/1/2020 | | | n/a | | | | 89,716,092 | | | | 87,530,246 | | | | 2.15 | | | 6/30/2022 | | Annually (15) |
| Total Market Neutral and Hedged Equity | | | | | | | | 910,556,493 | | | | 1,041,197,657 | | | | 25.51 | | | | | | |
See accompanying notes to consolidated financial statements.
Ironwood Institutional Multi-Strategy Fund LLC
Consolidated Schedule of Investments (continued)
April 30, 2022
| Description | First Acquisition Date | | Number of Shares (1) | | | Cost | | | Fair Value | | | Percent of Net Assets | | | Next Available Redemption Date (2) | | Liquidity (3) |
| |
| Investment Funds (continued) |
| |
Event-Driven: |
| Elliott International Limited | 1/1/2011 | | | 189,550 | | | $ | 238,589,420 | | | $ | 379,584,016 | | | | 9.30 | % | | 6/30/2024 | | Semi-annually (16) |
| HG Vora Opportunistic Capital Fund (Cayman) LP | 11/14/2019 | | | n/a | | | | 36,600,000 | | | | 49,055,518 | | | | 1.20 | | | n/a | | Other (17) |
HG Vora Special Opportunities Fund, LP* | 4/1/2017 | | | n/a | | | | 89,000,000 | | | | 131,743,010 | | | | 3.23 | | | 6/30/2022 | | Quarterly (4) |
| HG Vora Special Opportunities Fund, Ltd. | 7/1/2013 | | | 56,631 | | | | 103,937,764 | | | | 159,469,020 | | | | 3.90 | | | 6/30/2022 | | Quarterly (4) |
| Total Event-Driven | | | | | | | | 468,127,184 | | | | 719,851,564 | | | | 17.63 | | | | | | |
| | | | | | | | | | | | | | | | | | | | | | | |
Distressed and Credit Securities: |
| Apollo Offshore Credit Strategies Fund Ltd. | 3/1/2022 | | | 108,500 | | | | 108,500,000 | | | | 107,447,924 | | | | 2.63 | | | 3/31/2023 | | Annually (18) |
| Cerberus Global NPL Feeder Fund, LP | 1/11/2019 | | | n/a | | | | 17,773,147 | | | | 36,977,831 | | | | 0.91 | | | n/a | | Other (17) |
Cerberus Global NPL Fund AIV II S.C.A.** | 1/1/2021 | | | n/a | | | | 8,980,519 | | | | 10,546,518 | | | | 0.26 | | | n/a | | Other (17) |
Cerberus Global NPL Fund AIV, L.L.C.* | 12/3/2019 | | | n/a | | | | 1,027,333 | | | | 748,847 | | | | 0.02 | | | n/a | | Other (17) |
Cerberus International II, LP* | 1/1/2021 | | | n/a | | | | 60,846,770 | | | | 84,697,294 | | | | 2.07 | | | 6/30/2022 | | Semi-annually (19) |
| Cerberus International SPV, Ltd. | 3/1/2012 | | | 23 | | | | 33,658 | | | | 65,330 | | | | 0.00 | | | n/a | | Other (20) |
Cerberus International, Ltd.*** | 2/1/2011 | | | 0.01 | | | | 11,509 | | | | 19,893 | | | | 0.00 | | | n/a | | Other (20) |
| Total Distressed and Credit Securities | | | | | | | | 197,172,936 | | | | 240,503,637 | | | | 5.89 | | | | | | |
| | | | | | | | | | | | | | | | | | | | | | | |
| Total investments in Investment Funds | | | | | | | | | | | | | | | | | % | | | | �� | |
See accompanying notes to consolidated financial statements.
Ironwood Institutional Multi-Strategy Fund LLC
Consolidated Schedule of Investments (continued)
April 30, 2022
| Description | | Number of Shares (1) | | | Cost | | | Fair Value | | | Percent of Net Assets | | |
| | | |
| Short-Term Investments | | |
| | | |
Money Market Funds: | | |
Fidelity Investments Money Market Government Portfolio (yield 0.15%)*(21) | | | 171,989,896 | | | $ | 171,989,896 | | | $ | 171,989,896 | | | | 4.21 | % | |
Goldman Sachs Financial Square Treasury Instruments Fund (yield 0.35%)*(21) | | | 169,817,832 | | | | 169,817,832 | | | | 169,817,832 | | | | 4.16 | | |
JPMorgan U.S. Government Money Market Fund (yield 0.29%)*(21) | | | 168,817,393 | | | | 168,817,393 | | | | 168,817,393 | | | | 4.14 | | |
| Total Short-Term Investments | | | | | | $ | 510,625,121 | | | $ | 510,625,121 | | | | 12.51 | % | |
| | | | | | | | | | | | | | | | | | |
| Total Investments | | | | | | $ | 3,080,810,293 | | | $ | 4,004,102,048 | | | | 98.09 | % | |
| | | | | | | | | | | | | | | | | | |
| Other assets, less liabilities | | | | | | | | | | | 77,986,201 | | | | 1.91 | | |
| | | | | | | | | | | | | | | | | | |
| Net assets | | | | | | | | | | $ | 4,082,088,249 | | | | 100.00 | % | |
See accompanying notes to consolidated financial statements.
Ironwood Institutional Multi-Strategy Fund LLC
Consolidated Schedule of Investments (continued)
April 30, 2022
All investments are domiciled in the Cayman Islands except as noted.
| * | Investment is domiciled in the United States. |
| ** | Investment is domiciled in Luxembourg. |
| *** | Investment is domiciled in the Bahamas. |
Complete information about all of the investment funds' underlying investments is not readily available.
| (1) | Investments in investment funds may be composed of multiple share classes that may have different net asset values per share. |
| (2) | Investments in investment funds may be composed of multiple tranches. The Next Available Redemption Date relates to the earliest date after April 30, 2022 that a redemption from a tranche is available without a redemption fee. |
| (3) | Available frequency of redemptions without a redemption fee after initial lock-up period, if any. Different tranches may have different liquidity terms. Redemption notice periods range from 30 to 120 days. If applicable, lock-up periods range from 12 to 36 months. It is unknown when restrictions will lapse for any fund level gates, suspensions, term vehicles, or private investments. |
| (4) | Subject to a 25% quarterly investor level gate. |
| (5) | Subject to a 12.5% quarterly investor level gate. |
| (6) | Subject to an 8.33% quarterly investor level gate. If fund level redemptions are less than 8.33%, then the 8.33% investor level gate does not apply. |
| (7) | Approximately 81% of this investment is available for redemption quarterly, subject to a 25% investor level gate. The remaining 19% of this investment is available for redemption quarterly, subject to a 12.5% investor level gate. |
| (8) | Approximately 32% of this investment is available for redemption quarterly, subject to a 25% investor level gate. The remaining 68% of this investment is available for redemption quarterly, subject to a 5% investor level gate. |
| (9) | Approximately 26% of this investment is available for redemption quarterly, subject to a 12.5% investor level gate. Approximately 2% of this investment is earmarked for potential private investments. The earmarked balance is available for redemption quarterly, subject to a 12.5% investor level gate, only after the aforementioned non-earmarked balance has been fully redeemed. Approximately 72% of this investment is invested in private investments, which do not have set redemption timeframes. |
| (10) | Approximately 87% of this investment is available for redemption semi-annually, subject to a 16.67% investor level gate. The remaining 13% of this investment is invested in private investments, which do not have set redemption timeframes. |
See accompanying notes to consolidated financial statements.
Ironwood Institutional Multi-Strategy Fund LLC
Consolidated Schedule of Investments (continued)
April 30, 2022
| (11) | Approximately 86% of this investment is available for redemption quarterly, subject to a 25% investor level gate. The remaining 14% of this investment is available for redemption quarterly, is subject to a 12.5% investor level gate. |
| (12) | This investment is invested in private investments, which do not have set redemption timeframes. |
| (13) | Approximately 90% of this investment is available for redemption annually. The remaining 10% of this investment is invested in private investments, which do not have set redemption timeframes. |
| (14) | Approximately 51% of this investment is available for redemption annually, subject to a 25% investor level gate. The remaining 49% of this investment is invested in private investments, which do not have set redemption timeframes. |
| (15) | Approximately 59% of this investment is available for redemption annually, subject to a 25% investor level gate. The remaining 41% of this investment is invested in private investments, which do not have set redemption timeframes. |
| (16) | Approximately 81% of this investment is available for redemption semi-annually, subject to a 25% investor level gate. The remaining 19% of this investment is available for redemption semi-annually, subject to a 12.5% investor level gate. |
| (17) | The investment fund is a term vehicle and does not have a set redemption timeframe. |
| (18) | This investment is available for redemption annually. If the redemption request amount is 50% of this investment or less, the entire requested amount will be redeemed as of the annual redemption date. If the redemption request amount is greater than 50% of this investment, the requested redemption amount will be redeemed over four equal quarterly redemptions, the first of which takes place on the annual redemption date. |
| (19) | Subject to a 16.67% semi-annual investor level gate. |
| (20) | The investment fund does not have a set redemption timeframe but is a liquidating investment and making distributions as underlying investments are sold. |
| (21) | The rate shown is the annualized 7-day yield as of April 30, 2022. |
See accompanying notes to consolidated financial statements.
Ironwood Institutional Multi-Strategy Fund LLC
Consolidated Statement of Operations
Year Ended April 30, 2022
| Investment income | | | |
| Dividend income | | $ | 154,918 | |
| Other income | | | 64,790 | |
| Total investment income | | | 219,708 | |
| | | | | |
| Expenses | | | | |
| Advisory fees | | | 43,891,732 | |
| Administration fees | | | 1,686,417 | |
| Commitment fees | | | 1,213,333 | |
| Professional fees | | | 837,633 | |
| Custody fees | | | 468,956 | |
| Filing fees | | | 329,088 | |
| Risk monitoring fees | | | 250,908 | |
| Printing and communication fees | | | 166,333 | |
| Directors’ fees | | | 125,000 | |
| Other | | | 141,569 | |
| Total expenses | | | 49,110,969 | |
| | | | | |
| Net investment loss | | | (48,891,261 | ) |
| | | | | |
| Realized and unrealized gain from Investments | | | | |
| Net realized gain on redemptions from investments | | | 128,318,803 | |
| Net change in unrealized appreciation/depreciation on investments | | | 44,830,239 | |
| Net realized and unrealized gain on investments | | | 173,149,042 | |
| Net increase in net assets resulting from operations | | $ | 124,257,781 | |
See accompanying notes to consolidated financial statements.
Ironwood Institutional Multi-Strategy Fund LLC
Consolidated Statements of Changes in Net Assets
| | | Year Ended April 30, 2022 | | | Year Ended April 30, 2021 | |
| Operations | |
| Net investment loss | | $ | (48,891,261 | ) | | $ | (37,873,688 | ) |
| Net realized gain on redemptions from investments | | | 128,318,803 | | | | 31,066,201 | |
| Net change in unrealized appreciation/depreciation on investments | | | 44,830,239 | | | | 455,596,879 | |
| Net increase in net assets resulting from operations | | | 124,257,781 | | | | 448,789,392 | |
| | |
| Distributions to Members | |
| Distributions from net investment income | | | (189,164,935 | ) | | | (184,733,173 | ) |
| Distributions from net realized gains | | | (18,838,572 | ) | | | (5,492,977 | ) |
| Decrease in net assets resulting from distributions to Members | | | (208,003,507 | ) | | | (190,226,150 | ) |
| | |
| Member transactions | |
| Subscriptions | | | 936,210,919 | | | | 455,101,242 | |
| Reinvestment of distributions | | | 192,084,703 | | | | 173,666,161 | |
| Redemptions | | | (145,634,699 | ) | | | (240,212,649 | ) |
| Net increase in net assets resulting from Member transactions | | | 982,660,923 | | | | 388,554,754 | |
| | |
| Net increase in net assets | | | 898,915,197 | | | | 647,117,996 | |
| Net assets, beginning of year | | | 3,183,173,052 | | | | 2,536,055,056 | |
| Net assets, end of year | | $ | 4,082,088,249 | | | $ | 3,183,173,052 | |
| | |
| Unit transactions | |
| Units outstanding, beginning of year | | | 2,584,784.92 | | | | 2,264,941.01 | |
| Units issued | | | 757,634.29 | | | | 380,017.88 | |
| Units issued for reinvestment of distributions | | | 157,848.00 | | | | 144,145.81 | |
| Units redeemed | | | (118,452.77 | ) | | | (204,319.78 | ) |
| Units outstanding, end of year | | | 3,381,814.44 | | | | 2,584,784.92 | |
See accompanying notes to consolidated financial statements.
Ironwood Institutional Multi-Strategy Fund LLC
Consolidated Statement of Cash Flows
Year Ended April 30, 2022
| Operating activities | |
| Net increase in net assets resulting from operations | | $ | 124,257,781 | |
| Adjustments to reconcile net increase in net assets resulting from operations to net cash used in operating activities: | | | | |
| Net realized gain on redemptions from investments | | | (128,318,803 | ) |
| Net change in unrealized appreciation/depreciation on investments | | | (44,830,239 | ) |
| Purchases of investments in investment funds | | | (880,887,378 | ) |
| Proceeds from sales of investments in investment funds | | | 446,983,719 | |
| Purchases of short term investments, net | | | (279,325,851 | ) |
| Increase in dividends receivable | | | (88,966 | ) |
| Increase in other assets | | | (13,355 | ) |
| Increase in payable to Adviser | | | 2,739,658 | |
| Increase in accrued expenses | | | 4,054 | |
| Net cash used in operating activities | | | (759,479,380 | ) |
| | | | | |
| Financing activities | |
| Subscriptions received | | | 939,876,386 | |
| Redemptions paid | | | (132,916,655 | ) |
| Distributions paid | | | (15,918,804 | ) |
| Net cash provided by financing activities | | | 791,040,927 | |
| | | | | |
| Net change in cash | | | 31,561,547 | |
| Cash, beginning of year | | | 75,483,386 | |
| Cash, end of year | | $ | 107,044,933 | |
| | | | | |
| Supplemental disclosure of non-cash activities | |
| Reinvestment of distributions | | $ | 192,084,703 | |
| Non-cash subscriptions | | $ | 11,134,473 | |
| Non-cash redemptions | | $ | 1,583,571 | |
See accompanying notes to consolidated financial statements.
Ironwood Institutional Multi-Strategy Fund LLC
Consolidated Financial Highlights
| | | Year Ended April 30, 2022 | | | Year Ended April 30, 2021 | | | Year Ended April 30, 2020 | | | Year Ended April 30, 2019 | | | Year Ended April 30, 2018 | |
| Net asset value, beginning of year | | $ | 1,231.50 | | | | $ | 1,119.70 | | | $ | 1,135.11 | | | $ | 1,142.19 | | | $ | 1,120.11 | |
Net investment income (loss)(a) | | | (18.32 | ) | | | | (16.48 | ) | | | (13.33 | ) | | | (12.57 | ) | | | (15.71 | ) |
| Net realized and unrealized gain on investments | | | 64.87 | | | | | 211.72 | | | | 30.17 | | | | 47.11 | | | | 87.34 | |
| Net increase in net assets resulting from operations | | | 46.55 | | | | | 195.24 | | | | 16.84 | | | | 34.54 | | | | 71.63 | |
| Distributions paid from: | | | | | | | | |
| Net investment income | | | (64.55 | ) | | | | (81.03 | ) | | | (32.25 | ) | | | (41.62 | ) | | | (49.55 | ) |
| Net realized gains | | | (6.43 | ) | | | | (2.41 | ) | | | - | | | | - | | | | - | |
| Total distributions | | | (70.98 | ) | | | | (83.44 | ) | | | (32.25 | ) | | | (41.62 | ) | | | (49.55 | ) |
| Net asset value, end of year | | $ | 1,207.07 | | | | $ | 1,231.50 | | | $ | 1,119.70 | | | $ | 1,135.11 | | | $ | 1,142.19 | |
Total return(b) | | | 3.73 | % | | | | 17.60 | % | | | 1.43 | % | | | 3.15 | % | | | 6.46 | % |
Ratio of total expenses to average net assets before expense waivers and recaptures(c) | | | 1.36 | % | | | | 1.38 | % | | | 1.37 | % | | | 1.38 | % | | | 1.41 | % |
Ratio of total expenses to average net assets after expense waivers and recaptures(c) | | | 1.36 | % | | | | 1.38 | % | | | 1.37 | % | | | 1.38 | % | | | 1.41 | % |
Ratio of net investment loss to average net assets(d) | | | (1.35 | %) | | | | (1.37 | %) | | | (1.16 | %) | | | (1.14 | %) | | | (1.36 | %) |
| | | | | | | | | | | | | | | | | | |
| Portfolio turnover | | | 14.16 | % | | | | 17.05 | % | | | 15.87 | % | | | 10.99 | % | | | 4.54 | % |
| Net assets, end of year (in thousands) | | $ | 4,082,088 | | | | $ | 3,183,173 | | | $ | 2,536,055 | | | $ | 2,466,516 | | | $ | 2,141,137 | |
| (a) | Calculated based on the average units outstanding methodology. |
| (b) | Total return assumes a subscription of a unit in the Fund at the beginning of the year, a repurchase of the unit on the last day of the year, and the re-investment of all distributions during the year. |
| (c) | Ratios do not reflect the Fund’s proportionate share of the expenses of the investment funds. |
| (d) | Ratios do not reflect the Fund’s proportionate share of the income and expenses of the investment funds. |
The above ratios and total return have been calculated for the Members taken as a whole. An individual Member’s return and ratios may vary from these returns and ratios due to the timing of unit transactions.
See accompanying notes to consolidated financial statements.
Ironwood Institutional Multi-Strategy Fund LLC
Notes to Consolidated Financial Statements
Year Ended April 30, 2022
Ironwood Institutional Multi-Strategy Fund LLC (the “Fund”) was organized under the laws of the state of Delaware as a limited liability company on August 25, 2010 and commenced operations on January 1, 2011. The Fund is registered under the U.S. Investment Company Act of 1940, as amended (the “1940 Act”) as a closed-end, non-diversified management investment company. The Fund is also registered under the U.S. Securities Act of 1933, as amended (the “1933 Act”). The Fund currently complies, and intends to continue to comply with the requirements of Subchapter M of the U.S. Internal Revenue Code of 1986, as amended (the “Code”), as such requirements are described in Note 2.
The Fund’s investment objective is capital appreciation with limited variability of returns. The Fund attempts to achieve this objective by allocating capital among a number of pooled investment vehicles. Each is managed by an independent investment manager pursuant to various alternative investment strategies, including relative value; market neutral and hedged equity; event-driven; and distressed and credit securities.
The Fund is a master fund in a master-feeder structure whereby Ironwood Multi-Strategy Fund LLC (the “Feeder Fund”) invests substantially all of its assets in the Fund. As of April 30, 2022, the Feeder Fund owned 51.67% of the Fund’s net assets. Other eligible investors (together with the Feeder Fund, “Members”) in the Fund include high net worth individuals, foundations, pensions, and other institutions.
Ironwood Capital Management serves as the Fund’s investment adviser (the “Adviser”) and is responsible for providing day-to-day investment management services to the Fund, subject to the oversight of the Fund’s Board of Directors (the “Board”). The Adviser is registered as an investment adviser with the U.S. Securities and Exchange Commission under the U.S. Investment Advisers Act of 1940, as amended. The Adviser is also registered as a Commodity Pool Operator with the U.S. Commodity Futures Trading Commission and is a member of the National Futures Association. The Board has overall responsibility for monitoring and overseeing the Fund’s investment program and its management and operations. The majority of the members of the Board are not “interested persons” (as defined by the 1940 Act) of the Fund or the Adviser.
The Fund utilizes the Bank of New York Mellon (the “Administrator” and “Custodian”) as its independent administrator and custodian.
Ironwood Institutional Multi-Strategy Fund LLC
Notes to Consolidated Financial Statements (continued)
| 2. | Significant Accounting Policies |
Basis of Presentation
The following significant accounting policies are in conformity with U.S. generally accepted accounting principles (“U.S. GAAP”). Such policies are consistently followed by the Fund in the preparation of its consolidated financial statements. The consolidated financial statements are expressed in U.S. dollars.
The Fund is an investment company as described in Accounting Standards Codification (“ASC”) Topic 946, Financial Services-Investment Companies (“ASC 946”), which defines investment companies and prescribes specialized accounting and reporting requirements for investment companies. The Fund follows the accounting and reporting guidance in ASC 946.
Use of Estimates
The preparation of these consolidated financial statements in conformity with U.S. GAAP requires the Adviser to make estimates and assumptions that affect the reported amounts and disclosures in the consolidated financial statements, including the estimated fair value of investments. Actual results could differ from those estimates.
Basis of Consolidation
The consolidated financial statements include the financial position and the results of operations of the Fund and its wholly owned subsidiary, Ironwood Multi-Strategy Fund Ltd. (“CFC”), a Cayman Islands controlled foreign corporation. CFC has the same investment objective as the Fund and is primarily used to invest in investment funds which do not allow U.S. entities to invest directly. As of April 30, 2022 and for the year then ended, no investment funds were held by the wholly owned subsidiary.
Net Asset Value Determination
The net asset value of the Fund is determined as of the close of business at the end of any fiscal period, generally monthly, in accordance with the valuation principles set forth below or as determined pursuant to policies established by the Board.
Portfolio Valuation
The Fund values its investments in investment funds at fair value in accordance with ASC Topic 820, Fair Value Measurements and Disclosures (“ASC 820”). See Note 4 for more information.
Ironwood Institutional Multi-Strategy Fund LLC
Notes to Consolidated Financial Statements (continued)
Cash
The Fund places its cash in accounts with entities that are affiliated with the Custodian and the Administrator and, at times, such balances may be in excess of the Federal Deposit Insurance Corporation insurance limits. The Adviser monitors the financial condition of such entities and does not anticipate any losses from these counterparties.
Income and Expense Recognition
The Fund records investment transactions on a trade date basis and recognizes income and expenses on an accrual basis. Income, expenses, and realized and unrealized gains and losses are recorded monthly. Changes in the investment funds’ fair values are included in net change in unrealized appreciation/depreciation on investments on the consolidated statement of operations. Realized gain (loss) from investments in investment funds is calculated using the specific identification methodology.
Income Taxes
The Fund currently complies, and intends to continue to comply with the requirements of Subchapter M of the Code applicable to Regulated Investment Companies (“RICs”) and distributes substantially all of its taxable income to its Members. Therefore, no provision for federal income taxes is required. The Fund files tax returns with the U.S. Internal Revenue Service and state(s) as applicable. The Fund has concluded there are no significant uncertain tax positions that would require recognition in the consolidated financial statements as of April 30, 2022. If applicable, the Fund recognizes interest accrued related to liabilities for unrecognized tax in interest expense and penalties in other expenses on the consolidated statement of operations. The open tax years under potential examination vary by jurisdiction, but in general tax authorities can examine all tax returns filed for the last three tax years.
The Fund has a tax year that ends on April 30.
Dividend Reinvestment Plan
Each Member will have all income distributions and capital gains distributions automatically reinvested in additional units unless such Member specifically elects to receive all income distributions and capital gains distributions in cash.
| 3. | Financial Instruments with Off-Balance Sheet Risk |
In the normal course of business, the investment funds in which the Fund invests trade various financial instruments and enter into various investment activities with off-balance sheet risk. These include, but are not limited to, short selling activities, written option contracts, and swaps. The Fund’s risk of loss in these investment funds is limited to the value of the Fund’s interest in these investment funds as reported by the Fund.
Ironwood Institutional Multi-Strategy Fund LLC
Notes to Consolidated Financial Statements (continued)
| 4. | Fair Value of Financial Instruments |
ASC 820 provides for the use of net asset value (or its equivalent) as a practical expedient to estimate fair value of investments in investment funds, provided certain criteria are met. Accordingly, the Fund values its investments in investment funds at fair value, which is an amount equal to the sum of the Fund’s proportionate interests in the investment funds, as determined from financial information provided by the respective administrators or investment managers of the investment funds. These fair values represent the amounts the Fund would receive if it were able to liquidate its investments in the investment funds as of the measurement date, prior to any early withdrawal charges, if applicable. Some values received are estimates, subject to subsequent revision by the respective administrators or investment managers. Values received are generally net of management fees and incentive fees or allocations payable to the investment funds’ investment managers pursuant to the investment funds’ operating agreements. The investment funds value their underlying investments in accordance with policies established by each investment fund, as described in each of their financial statements or offering memoranda.
The investment funds hold positions in readily marketable investments and derivatives that are valued at quoted market values and/or less liquid non-marketable investments and derivatives that are valued at estimated fair value. The mix and concentration of more readily marketable investments and less liquid non-marketable investments varies across the investment funds based on various factors, including the nature of their investment strategy. The Fund’s investments in investment funds are subject to the terms and conditions of the respective operating agreements and offering memoranda.
The Adviser has designed ongoing due diligence processes with respect to investment funds, their administrators, and their investment managers. The Adviser assesses the quality of information provided and determines whether such information continues to be reliable or whether further investigation is necessary. Such investigation, as applicable, may require the Adviser to forego its normal reliance on the value provided and to independently determine the fair value of the Fund’s interest in the investment fund.
The Adviser has designated a committee to oversee the valuation of the Fund’s investments (the “Valuation Committee”). The Valuation Committee is comprised of senior personnel, the majority of whom are separate from the Fund’s portfolio management team, and is responsible for developing written valuation policies and procedures, conducting periodic reviews of those policies and procedures, and evaluating the overall fairness and consistent application of the valuation policies and procedures. The Valuation Committee meets on a quarterly basis or more frequently as needed.
If no value is readily available from an investment fund or if a value supplied by an investment fund is deemed by the Valuation Committee not to be indicative of its fair value, the Valuation Committee would determine, in good faith, the fair value of the investment fund under procedures adopted by the Board and subject to Board oversight. Because of the inherent uncertainty of valuation, the fair values of the investment funds held by the Fund may differ significantly from the values that would have been used had a ready market for the investment funds been available. As of and for the year ended April 30, 2022, all investments in investment funds were valued using the values provided by the investment funds or their administrators.
Ironwood Institutional Multi-Strategy Fund LLC
Notes to Consolidated Financial Statements (continued)
Short-term investments consist of investments in money market funds. These investments are valued at their respective net asset value per share and are categorized as Level 1 in the fair value hierarchy, as defined in ASC 820.
In accordance with U.S. GAAP, investments in investment funds that are valued at net asset value as a practical expedient are not required to be included in the fair value hierarchy. All investments in investment funds were valued at their respective net asset value as of April 30, 2022, and are excluded from the fair value hierarchy.
As of April 30, 2022, less than 0.01% of the Fund’s net assets were invested in investment funds that do not have set redemption timeframes but are liquidating investments and making distributions as underlying investments are sold. Additionally, approximately 8.91% of the Fund's net assets were invested in designated private investments maintained by the investment funds or in term vehicles, which do not have set redemption timeframes. The timing of when these investments will be liquidated is unknown.
The following is a summary of the investment strategies of the investment funds held by the Fund as of April 30, 2022.
Relative value strategies attempt to capture pricing anomalies between assets that for all economic purposes are identical. Relative value strategies capture these inefficiencies by utilizing a combination of assets including bonds, stocks, swaps, options, exchange traded funds, currencies, futures, etc. One such strategy is capital structure arbitrage which involves the purchase and short sale of different classes of securities of the same issuer where there is a relative mispricing between two classes of securities. An example of this strategy is the purchase of undervalued senior secured debt and the short sale of overvalued subordinated unsecured debt or common equity. Other examples of relative value strategies include fixed income arbitrage, relative value interest rates, convertible bond arbitrage, relative value energy, and quantitative strategies. Generally, investment funds within this strategy require a 30 to 90 day notice period to redeem at the next available redemption date.
Market neutral and hedged equity strategies involve the purchase of a stock or basket of stocks that is relatively underpriced as well as selling short a stock or basket of stocks that is relatively overpriced. Depending on the manager’s investment strategy, the determination of whether a stock is overpriced or underpriced can be made through fundamental analysis (a fundamental strategy) or by complex statistical models that examine numerous factors that affect the price of a stock (a quantitative strategy). The Adviser will utilize equity managers that target well-hedged and low net exposures and/or use a balanced approach to investing, i.e., they are short approximately the same dollar value of stocks they are long. Generally, investment funds within this strategy require a 45 to 90 day notice period to redeem at the next available redemption date.
Ironwood Institutional Multi-Strategy Fund LLC
Notes to Consolidated Financial Statements (continued)
Event-driven strategies involve the assessment of how, when, and if specific transactions will be completed and the effect on corporations and financial assets. A common event-driven strategy is merger arbitrage (also called risk arbitrage). This involves the purchase of the stock of a target company involved in a potential merger and, in the case of a stock-for-stock offer, the short sale of the stock of the acquiring company. The target company’s stock would typically trade at a discount to the offer price due to the uncertainty of the completion of the transaction. The positions may be reversed if the manager feels the acquisition may not close. This strategy aims to capture the spread between the value of the security at the close of the transaction and its discounted value at the time of purchase. Other examples of event-driven strategies and opportunities include corporate restructurings, spin-offs, operational turnarounds, activism, asset sales, and liquidations. Generally, investment funds within this strategy require a 60 to 90 day notice period to redeem at the next available redemption date.
Distressed strategies involve the purchase or short sale of debt or equity securities of issuers experiencing financial distress. These securities may be attractive because of the market’s inaccurate assessment of the issuer’s future potential or the values and timing of recoveries. Managers may obtain voting rights or control blocks and actively participate in the bankruptcy or reorganization process while other investors may remain passive investors. Examples of distressed securities trades include bankruptcies, liquidations, post-restructured equities, structured credit, and balance sheet restructurings. Credit strategies involve a variety of strategies intended to exploit inefficiencies in the high-yield and related credit markets. Generally, investment funds within these strategies require a 90 to 120 day notice period to redeem at the next available redemption date.
| 5. | Investment Transactions |
Total purchases of investment funds for the year ended April 30, 2022 were $925,887,378. Total redemptions from investment funds for the year ended April 30, 2022 were $442,981,946.
| 6. | Subscriptions and Redemptions |
The stated minimum initial investment by Members is $50,000 and the minimum subsequent investment is $10,000. The Adviser may waive these minimums, but in no event will the initial investment be less than $25,000. Members may purchase units as of the first business day of the month.
Subscriptions received in advance and subscriptions received in advance from Ironwood Multi-Strategy Fund LLC represent the amounts received on or prior to April 30, 2022 for subscriptions with an effective date of May 1, 2022.
Ironwood Institutional Multi-Strategy Fund LLC
Notes to Consolidated Financial Statements (continued)
Foreside Fund Services, LLC acts as the distributor (the “Distributor”) of the Fund’s units. The Distributor has entered into, and may continue to enter into, selected dealer agreements with various brokers and dealers (“Selling Agents”) that agree to participate in the distribution of the Fund’s units. Neither the Fund nor the Distributor impose an initial sales charge. If a Member purchases units through a Selling Agent, the Selling Agent may directly charge the Member a transaction or other fees in such amount as the Selling Agent determines. Any such transaction or other fees charged by a Selling Agent is in addition to the subscription price for units and does not form a part of a Member’s investment in the Fund.
The Board, in its sole and absolute discretion, may authorize the Fund to make a tender offer to repurchase Members’ units (an “Offer”). In determining whether the Fund should make an Offer to repurchase units from Members, the Board will consider, among other things, the recommendation of the Adviser. The Adviser expects that it will recommend to the Board that the Fund make an Offer to repurchase units from Members semi-annually on June 30 and December 31. While there can be no guarantee that it will continue this practice, to date, the Fund has offered to repurchase 10 – 20% of its units at each of its June 30 and December 31 Offers.
As part of each Offer, Members of the Fund may request to tender units and immediately subscribe the resulting proceeds to the Feeder Fund. As part of the Feeder Fund’s tender offers, Members of the Feeder Fund may request to tender units and immediately subscribe the resulting proceeds to the Fund. In these circumstances, the Fund and the Feeder Fund process the transactions without requiring the payment or receipt of cash. For the year ended April 30, 2022, the total amounts of non-cash subscriptions and redemptions were $11,134,473 and $1,583,571, respectively.
A 5% early repurchase fee is charged on repurchased units that have been held less than one year, payable to the Fund. The Board or the Adviser may waive the imposition of the early repurchase fee. For the year ended April 30, 2022, the Fund charged early repurchase fees of $2,525. Such amount is included in other income on the consolidated statement of operations.
| 7. | Advisory Fee, Related Party Transactions, and Other Expenses |
In consideration of the advisory and other services provided by the Adviser to the Fund, the Fund pays the Adviser a monthly advisory fee (the “Advisory Fee”) of 0.10% (1.20% per annum) of the Fund’s month end net asset value. The Advisory Fee is an expense paid out of the Fund’s assets and is computed based on the value of the net assets of the Fund as of the close of business on the last calendar day of each month, before adjustments for any repurchases effective on that day. The Advisory Fee is payable in arrears as of the last calendar day of the applicable fiscal quarter and is in addition to the asset-based management fees and incentive fees or allocations charged by the investment funds and indirectly borne by Members in the Fund. For the year ended April 30, 2022, the Fund incurred Advisory Fees of $43,891,732, of which $11,930,601 was payable to the Adviser as of April 30, 2022.
Ironwood Institutional Multi-Strategy Fund LLC
Notes to Consolidated Financial Statements (continued)
The Fund pays all investment expenses, including, but not limited to, brokerage commissions and all other costs of executing transactions, interest expense, commitment fees, custody fees, its share of expenses of the investment funds, including management fees to the investment managers of the investment funds (ranging from 0.00% to 3.50% of net asset value) and incentive fees or allocations to such investment managers (ranging from 0% to 35% of net profits). The Fund also pays all ongoing ordinary administrative and operational costs of the Fund, including (but not limited to) legal costs, audit and tax preparation fees, fees paid to the Administrator, fees paid to the regulatory and compliance administrator, risk monitoring fees, filing fees, insurance expense, bank charges, and taxes. The Fund will also pay any extraordinary operating expenses. Among the Fund’s operating expenses are certain costs that may be associated in part with the Feeder Fund that are not clearly allocable on a separate basis, such as joint vendor contracts. The Feeder Fund is the largest member of the Fund and as such bears a significant pro rata share of all expenses of the Fund.
The Adviser will bear all ongoing ordinary administrative and operational costs of the Adviser, including employees’ salaries, office rent, travel costs, computer and equipment costs, telephone bills, office supplies, research and data costs, legal costs, accounting costs, filing costs, and communication expenses.
The Adviser has entered into an agreement with the Fund (the “Expense Limitation Agreement”) whereby it has contractually agreed to waive its fees and/or reimburse the Fund’s expenses to the extent necessary to ensure that the monthly expenses of the Fund (excluding taxes, brokerage commissions, interest expense and commitment fees incurred in connection with any credit facility, other transaction related expenses, custody fees, bank charges, any extraordinary expenses of the Fund, any acquired fund fees and expenses, and the Advisory Fee) will not exceed 0.020833% (0.25% per annum) of the Fund’s net assets as of each month end during the term of the Expense Limitation Agreement (the “Expense Limitation”). The Fund will carry forward, for a period not to exceed 3 years from the date on which a waiver or reimbursement is made by the Adviser, any expenses in excess of the Expense Limitation and repay the Adviser such amounts; provided that the Fund is able to effect such reimbursement and remain in compliance with the Expense Limitation disclosed in the prospectus that was in effect at the time of the original waiver.
Eligible expenses were below the Expense Limitation and no eligible expenses were recaptured under the Expense Limitation Agreement during the year ended April 30, 2022. There are no amounts subject to potential future reimbursement.
Compensation to the independent directors for the year ended April 30, 2022 was $125,000.
Ironwood Institutional Multi-Strategy Fund LLC
Notes to Consolidated Financial Statements (continued)
As of April 30, 2022, directors, officers, and the Adviser and its employees held units in the Fund as follows:
| | | Units | | | Percent of Net Assets | |
Directors | | | 1,601.68 | | | | 0.05 | % |
Officers | | | 133.41 | | | | 0.01 | % |
Adviser and its employees | | | 2,191.60 | | | | 0.06 | % |
Total | | | 3,926.69 | | | | 0.12 | % |
The Fund maintains a secured credit agreement with an unaffiliated bank (the “Credit Facility”) maturing on April 14, 2023, with an early termination option subject to a 30 day notice period. The maximum availability under the Credit Facility is $300,000,000, subject to specific asset-based covenants. Borrowings are collateralized in full by certain assets of the Fund and bear interest at an annual rate of Secured Overnight Financing Rate (“SOFR”) plus 1.35% (the “Spread”). The Fund also pays an annual commitment fee of 0.40% on the amount by which the maximum availability exceeds the outstanding loan balance. Interest and commitment fees are accrued daily and, if not repaid by month end, are automatically added to the principal amount of the loan balance.
Commitment fees incurred for the year ended April 30, 2022 are included on the consolidated statement of operations. For the year ended April 30, 2022, the Fund had no outstanding loan balance. If the Fund had an outstanding loan balance as of April 30, 2022, the interest rate in effect would have been 1.63%.
The Fund generally invests in investment funds organized outside the United States that are treated as corporations for U.S. tax purposes and are expected to be classified as passive foreign investment companies (“PFICs”). Certain PFICs provide information regarding the amount of U.S. taxable income and gain. For such PFICs, the Fund has made Qualified Electing Fund (“QEF”) elections for tax purposes.
For other PFICs that do not provide information regarding taxable income and gain, the Fund has made mark-to-market (“MTM”) elections which convert any unrealized gain to ordinary taxable income.
The Fund also invests in investment funds organized in the U.S. that are treated as partnerships for U.S. income tax purposes.
Net investment income (loss) and net realized gain (loss) from investments in investment funds may not be treated the same for financial statement and for U.S. tax purposes. Temporary book-tax differences result when the Fund holds an investment in an investment fund, and such temporary book-tax differences generally become permanent upon disposal of the investment fund.
Ironwood Institutional Multi-Strategy Fund LLC
Notes to Consolidated Financial Statements (continued)
As of April 30, 2022, the aggregate cost and related gross unrealized appreciation and depreciation for tax purposes of the Fund’s investments were as follows:
| Cost of investments for tax purposes | | $ | 3,947,451,638 | |
| | | | | |
| Gross tax unrealized appreciation | | $ | 154,426,877 | |
| Gross tax unrealized depreciation | | | (97,776,467 | ) |
| Net tax unrealized appreciation on investments | | $ | 56,650,410 | |
Permanent differences, due to deemed distributions attributable to redemptions of Units, resulted in the following reclassifications among the Fund’s components of net assets as of April 30, 2022:
| Accumulated earnings | | $ | (1,969,276 | ) |
| Paid-in capital | | | 1,969,276 | |
Distribution of Income and Gains
The Fund declares and pays dividends annually from net investment income. Net realized gains, if any, are distributed at least annually. Distributions from net realized gains for book purposes may include short-term capital gains, which are included as ordinary income for tax purposes.
For the years ended April 30, 2022 and April 30, 2021, the tax character of distributions paid was as follows:
Tax Character | | April 30, 2022 | | | April 30, 2021 | |
| Ordinary income | | $ | 191,625,116 | | | $ | 184,733,173 | |
| Long-term capital gains | | | 16,378,391 | | | | 5,492,977 | |
As of April 30, 2022, the components of distributable earnings on a tax basis were as follows:
| Undistributed ordinary income | | $ | 77,699,226 | |
| Undistributed long-term capital gains | | | 53,944,729 | |
| Net unrealized appreciation | | | 56,650,410 | |
| Accumulated earnings | | $ | 188,294,365 | |
As of April 30, 2022, the Fund did not have any available unused short-term capital losses or unused long-term capital losses for federal income tax purposes.
Ironwood Institutional Multi-Strategy Fund LLC
Notes to Consolidated Financial Statements (continued)
| 10. | Commitments and Contingencies |
As of April 30, 2022, the Fund had unfunded capital commitments to investment funds of $191,543,530.
In the normal course of business, the Fund enters into contracts that provide general indemnifications and that contain a variety of representations and warranties. The Fund’s maximum exposure in connection with these contracts is unknown, as this would involve future claims that may be made against the Fund that have not yet occurred. However, no claims have been made under these indemnities in the past, and while there can be no assurances in this regard, the Fund is not aware of any such claims that may be made in the future.
Political developments, acts of war or terrorism, natural disasters, public health crises, including the ongoing COVID-19 pandemic, and other events outside of the Fund’s control may affect financial markets and the global economy, which may impact the Fund’s performance.
The Adviser has performed a subsequent events review and determined that there were no subsequent events which would have a significant impact on the Fund’s financial position or results of operations.