Exhibit (c)(2)
August 21, 2016 ROTH CAPITAL PARTNERS, LLC Member FINRA/SIPC www.ROTH.com CORPORATE OFFICES 888 San Clemente Drive Newport Beach, CA (949) 720 - 5700 REGIONAL OFFICES ROTH Capital Partners Hong Kong Limited Hong Kong Office (852) 2251 - 8585 INTERNATIONAL OFFICE ROTH Presentation to the Special Committee of the Board of Directors at Sky - mobi Limited Boston, MA Chicago , IL Houston, TX , Los Angeles, CA New York, NY San Diego, CA San Francisco, CA (949) 720 - 5745 ( 312) 564 - 8100 (949) 720 - 7115 (800) 991 - 2788 (800) 358 - 1900 (858) 509 - 2500 (800) 678 - 9147
2 | I. Transaction Overview II. Valuation Analysis Table of Contents
3 | I. Transaction Overview
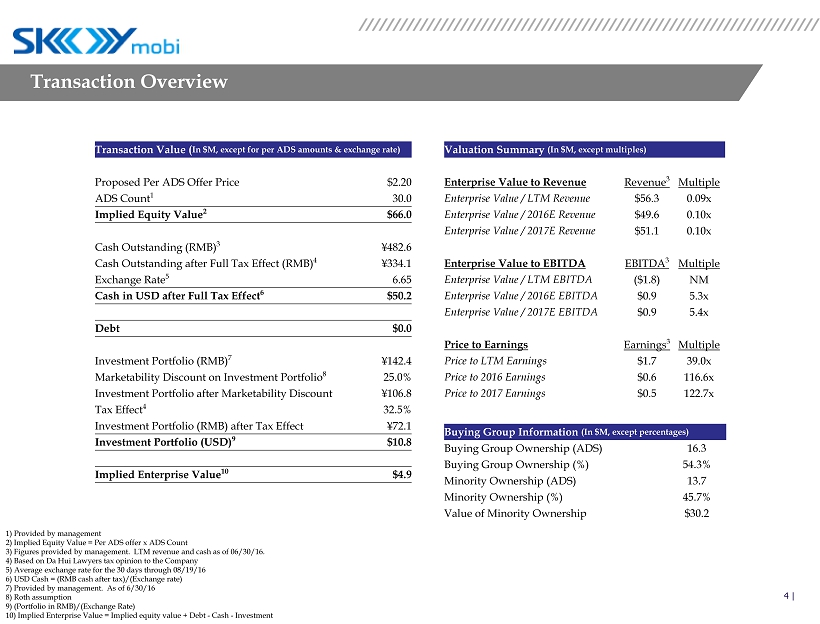
4 | Transaction Overview Transaction Value ( In $M, except for per ADS amounts & exchange rate) Valuation Summary (In $M, except multiples) Proposed Per ADS Offer Price $2.20 Enterprise Value to Revenue Revenue 3 Multiple ADS Count 1 30.0 Enterprise Value / LTM Revenue $56.3 0.09x Implied Equity Value 2 $66.0 Enterprise Value / 2016E Revenue $49.6 0.10x Enterprise Value / 2017E Revenue $51.1 0.10x Cash Outstanding ( RMB) 3 ¥482.6 Cash Outstanding after Full Tax Effect ( RMB) 4 ¥334.1 Enterprise Value to EBITDA EBITDA 3 Multiple Exchange Rate 5 6.65 Enterprise Value / LTM EBITDA ($1.8) NM Cash in USD after Full Tax Effect 6 $50.2 Enterprise Value / 2016E EBITDA $0.9 5.3x Enterprise Value / 2017E EBITDA $0.9 5.4x Debt $0.0 Price to Earnings Earnings 3 Multiple Investment Portfolio ( RMB) 7 ¥142.4 Price to LTM Earnings $1.7 39.0x Marketability Discount on Investment Portfolio 8 25.0% Price to 2016 Earnings $0.6 116.6x Investment Portfolio after Marketability Discount ¥106.8 Price to 2017 Earnings $0.5 122.7x Tax Effect 4 32.5% Investment Portfolio (RMB) after Tax Effect ¥72.1 Investment Portfolio ( USD) 9 $10.8 Implied Enterprise Value 10 $4.9 Buying Group Information (In $M, except percentages) Buying Group Ownership (ADS) 16.3 Buying Group Ownership (%) 54.3% Minority Ownership (ADS) 13.7 Minority Ownership (%) 45.7% Value of Minority Ownership $30.2 1) Provided by management 2) Implied Equity Value = Per ADS offer x ADS Count 3) Figures provided by management. LTM revenue and cash as of 06/30/16. 4) Based on Da Hui Lawyers tax opinion to the Company 5 ) Average exchange rate for the 30 days through 08/19/16 6 ) USD Cash = (RMB cash after tax)/(Exchange rate) 7) Provided by management. As of 6/30/16 8 ) Roth assumption 9 ) (Portfolio in RMB)/(Exchange Rate) 10) Implied Enterprise Value = Implied equity value + Debt - Cash - Investment
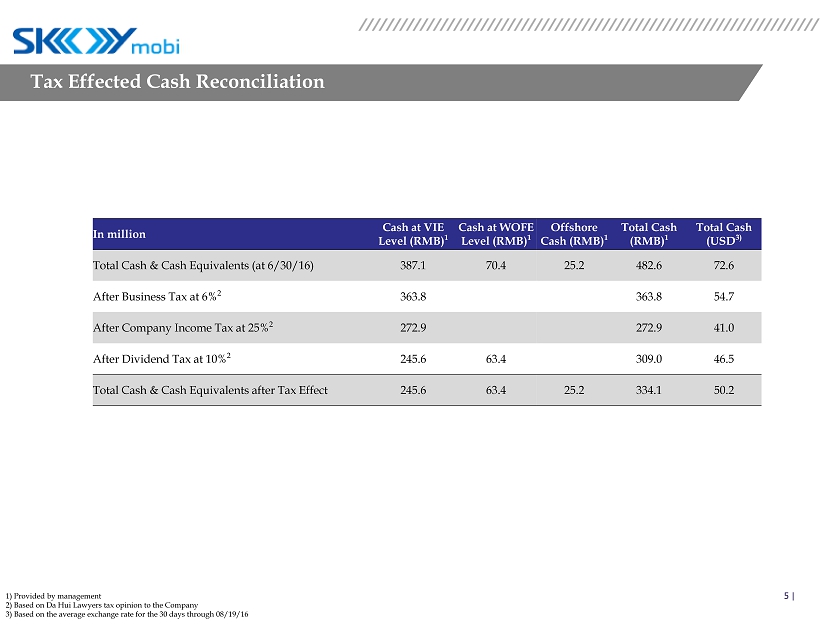
5 | Tax Effected Cash Reconciliation In million Cash at VIE Level ( RMB) 1 Cash at WOFE Level ( RMB) 1 Offshore Cash ( RMB) 1 Total Cash ( RMB) 1 Total Cash (USD 3) Total Cash & Cash Equivalents (at 6/30/16) 387.1 70.4 25.2 482.6 72.6 After Business Tax at 6% 2 363.8 363.8 54.7 After Company Income Tax at 25% 2 272.9 272.9 41.0 After Dividend Tax at 10% 2 245.6 63.4 309.0 46.5 Total Cash & Cash Equivalents after Tax Effect 245.6 63.4 25.2 334.1 50.2 1) Provided by management 2) Based on Da Hui Lawyers tax opinion to the Company 3) Based on the average exchange rate for the 30 days through 08/19/16

6 | II. Valuation Analysis
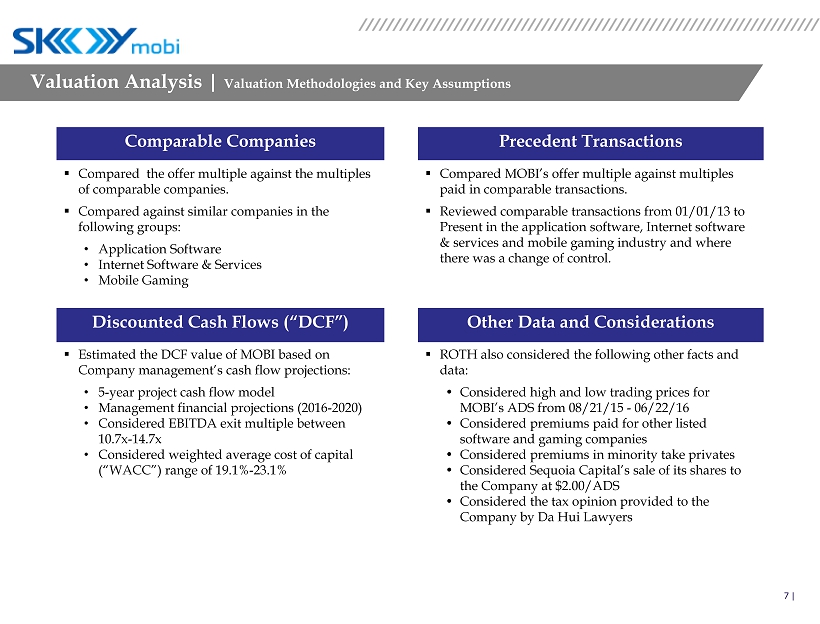
7 | Valuation Analysis | Valuation Methodologies and Key Assumptions Comparable Companies Precedent Transactions ▪ Compared the offer multiple against the multiples of comparable companies. ▪ Compared against similar companies in the following groups: • Application Software • Internet Software & Services • Mobile Gaming ▪ Compared MOBI’s offer multiple against multiples paid in comparable transactions. ▪ Reviewed comparable transactions from 01/01/13 to Present in the application software, Internet software & services and mobile gaming industry and where there was a change of control. Discounted Cash Flows (“DCF”) Other Data and Considerations ▪ Estimated the DCF value of MOBI based on Company management’s cash flow projections: • 5 - year project cash flow model • Management financial projections (2016 - 2020) • Considered EBITDA exit multiple between 10.7x - 14.7x • Considered weighted average cost of capital (“WACC”) range of 19.1% - 23.1% ▪ ROTH also considered the following other facts and data: • Considered high and low trading prices for MOBI’s ADS from 08/21/15 - 06/22/16 • Considered premiums paid for other listed software and gaming companies • Considered premiums in minority take privates • Considered Sequoia Capital’s sale of its shares to the Company at $2.00/ADS • Considered the tax opinion provided to the Company by Da Hui Lawyers
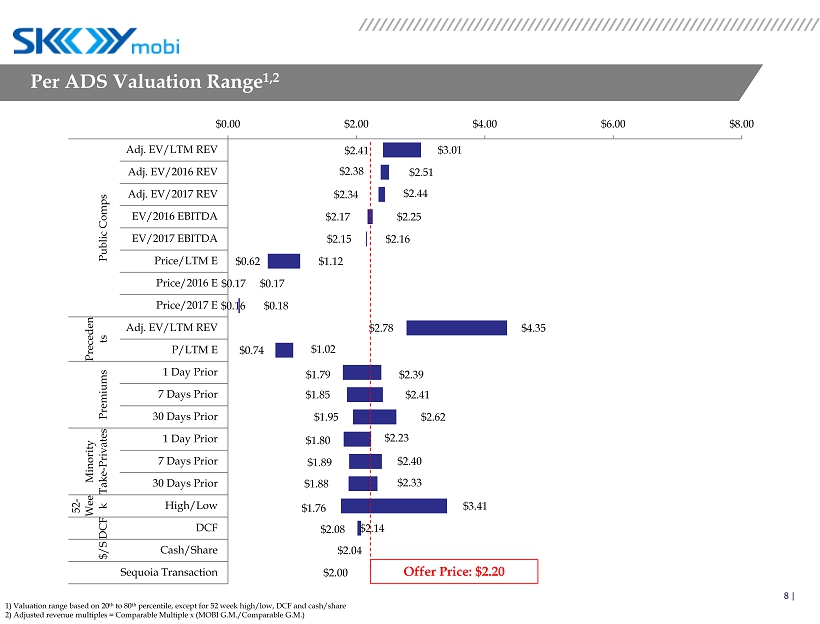
8 | $2.41 $2.38 $2.34 $2.17 $2.15 $0.62 $0.17 $0.16 $2.78 $0.74 $1.79 $1.85 $1.95 $1.80 $1.89 $1.88 $1.76 $ 2.08 $2.04 $2.00 $3.01 $2.51 $2.44 $2.25 $2.16 $1.12 $0.17 $0.18 $4.35 $1.02 $2.39 $2.41 $2.62 $2.33 $3.41 $2.14 $2.23 $2.40 $0.00 $2.00 $4.00 $6.00 $8.00 Adj. EV/LTM REV Adj. EV/2016 REV Adj. EV/2017 REV EV/2016 EBITDA EV/2017 EBITDA Price/LTM E Price/2016 E Price/2017 E Adj. EV/LTM REV P/LTM E 1 Day Prior 7 Days Prior 30 Days Prior 1 Day Prior 7 Days Prior 30 Days Prior High/Low DCF Cash/Share Sequoia Transaction Public Comps Preceden ts Premiums Minority Take-Privates 52- Wee k DCF $/S Per ADS Valuation Range 1,2 Offer Price: $2.20 1) Valuation range based on 20 th to 80 th percentile, except for 52 week high/low, DCF and cash/share 2) Adjusted revenue multiples = Comparable Multiple x (MOBI G.M ./Comparable G.M.)
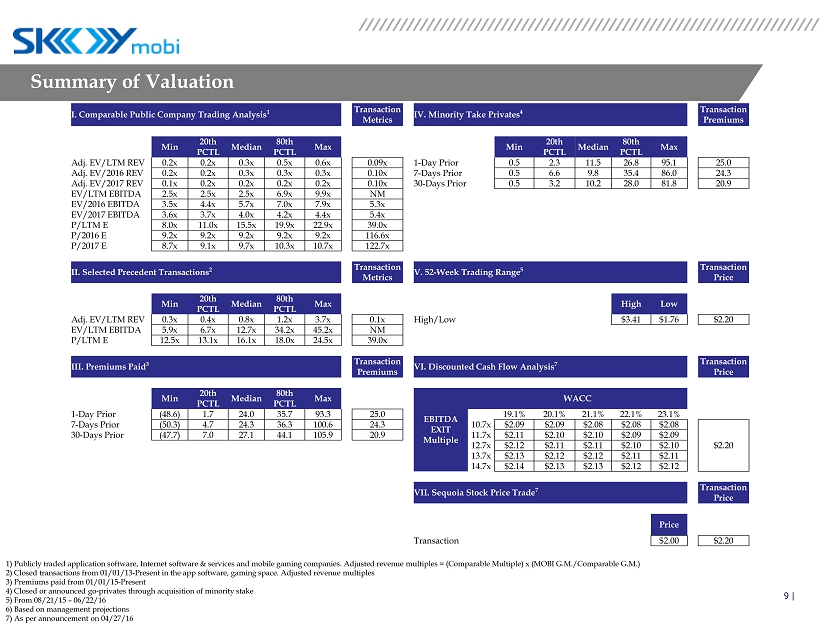
9 | I. Comparable Public Company Trading Analysis 1 Transaction Metrics IV. Minority Take Privates 4 Transaction Premiums Min 20th PCTL Median 80th PCTL Max Min 20th PCTL Median 80th PCTL Max Adj. EV/LTM REV 0.2x 0.2x 0.3x 0.5x 0.6x 0.09x 1 - Day Prior 0.5 2.3 11.5 26.8 95.1 25.0 Adj. EV/2016 REV 0.2x 0.2x 0.3x 0.3x 0.3x 0.10x 7 - Days Prior 0.5 6.6 9.8 35.4 86.0 24.3 Adj. EV/2017 REV 0.1x 0.2x 0.2x 0.2x 0.2x 0.10x 30 - Days Prior 0.5 3.2 10.2 28.0 81.8 20.9 EV/LTM EBITDA 2.5x 2.5x 2.5x 6.9x 9.9x NM EV/2016 EBITDA 3.5x 4.4x 5.7x 7.0x 7.9x 5.3x EV/2017 EBITDA 3.6x 3.7x 4.0x 4.2x 4.4x 5.4x P/LTM E 8.0x 11.0x 15.5x 19.9x 22.9x 39.0x P/2016 E 9.2x 9.2x 9.2x 9.2x 9.2x 116.6x P/2017 E 8.7x 9.1x 9.7x 10.3x 10.7x 122.7x II. Selected Precedent Transactions 2 Transaction Metrics V. 52 - Week Trading Range 5 Transaction Price Min 20th PCTL Median 80th PCTL Max High Low Adj. EV/LTM REV 0.3x 0.4x 0.8x 1.2x 3.7x 0.1x High/Low $3.41 $1.76 $2.20 EV/LTM EBITDA 5.9x 6.7x 12.7x 34.2x 45.2x NM P/LTM E 12.5x 13.1x 16.1x 18.0x 24.5x 39.0x III. Premiums Paid 3 Transaction Premiums VI. Discounted Cash Flow Analysis 7 Transaction Price Min 20th PCTL Median 80th PCTL Max EBITDA EXIT Multiple WACC 1 - Day Prior (48.6) 1.7 24.0 35.7 93.3 25.0 19.1% 20.1% 21.1% 22.1% 23.1% 7 - Days Prior (50.3) 4.7 24.3 36.3 100.6 24.3 10.7x $2.09 $2.09 $2.08 $2.08 $2.08 $2.20 30 - Days Prior (47.7) 7.0 27.1 44.1 105.9 20.9 11.7x $2.11 $2.10 $2.10 $2.09 $2.09 12.7x $2.12 $2.11 $2.11 $2.10 $2.10 13.7x $2.13 $2.12 $2.12 $2.11 $2.11 14.7x $2.14 $2.13 $2.13 $2.12 $2.12 VII. Sequoia Stock Price Trade 7 Transaction Price Price Transaction $2.00 $2.20 Summary of Valuation 1) Publicly traded application software, Internet software & services and mobile gaming companies. Adjusted revenue multiples = (Comparable Multiple) x (MOBI G.M./Comparable G.M.) 2) Closed transactions from 01/01/13 - Present in the app software, gaming space. Adjusted revenue multiples 3) Premiums paid from 01/01/15 - Present 4 ) Closed or announced go - privates through acquisition of minority stake 5 ) From 08/21/15 – 06/22/16 6 ) Based on management projections 7 ) As per announcement on 04/27/16
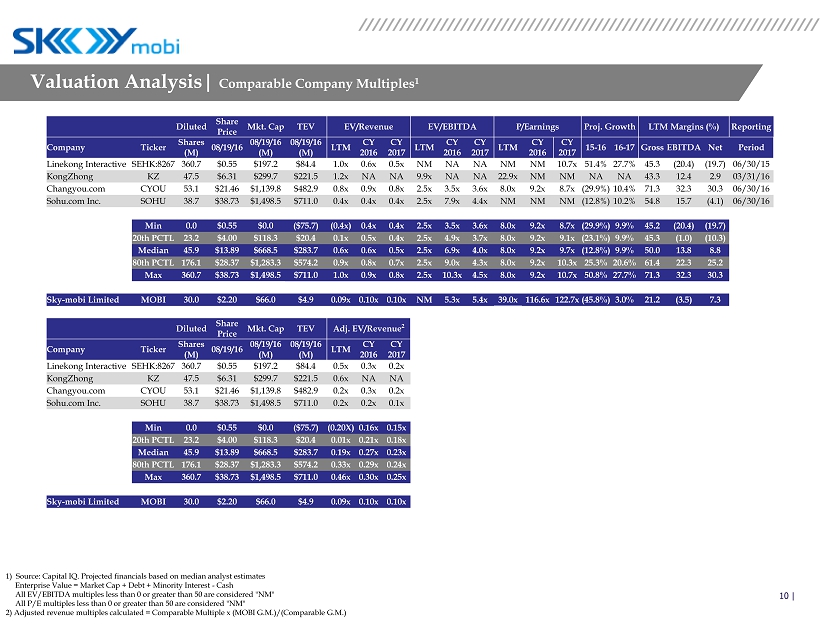
10 | Valuation Analysis | Comparable Company Multiples 1 1) Source : Capital IQ. Projected financials based on median analyst estimates Enterprise Value = Market Cap + Debt + Minority Interest - Cash All EV/EBITDA multiples less than 0 or greater than 50 are considered "NM" All P/E multiples less than 0 or greater than 50 are considered "NM" 2) Adjusted revenue multiples calculated = Comparable Multiple x (MOBI G.M .)/(Comparable G.M.) Diluted Share Price Mkt. Cap TEV EV/Revenue EV/EBITDA P/Earnings Proj. Growth LTM Margins (%) Reporting Company Ticker Shares (M) 08/19/16 08/19/16 (M) 08/19/16 (M) LTM CY 2016 CY 2017 LTM CY 2016 CY 2017 LTM CY 2016 CY 2017 15 - 16 16 - 17 Gross EBITDA Net Period Linekong Interactive SEHK:8267 360.7 $0.55 $197.2 $84.4 1.0x 0.6x 0.5x NM NA NA NM NM 10.7x 51.4% 27.7% 45.3 (20.4) (19.7) 06/30/15 KongZhong KZ 47.5 $6.31 $299.7 $221.5 1.2x NA NA 9.9x NA NA 22.9x NM NM NA NA 43.3 12.4 2.9 03/31/16 Changyou.com CYOU 53.1 $21.46 $1,139.8 $482.9 0.8x 0.9x 0.8x 2.5x 3.5x 3.6x 8.0x 9.2x 8.7x (29.9%) 10.4% 71.3 32.3 30.3 06/30/16 Sohu.com Inc. SOHU 38.7 $38.73 $1,498.5 $711.0 0.4x 0.4x 0.4x 2.5x 7.9x 4.4x NM NM NM (12.8%) 10.2% 54.8 15.7 (4.1) 06/30/16 Min 0.0 $0.55 $0.0 ($75.7) (0.4x) 0.4x 0.4x 2.5x 3.5x 3.6x 8.0x 9.2x 8.7x (29.9%) 9.9% 45.2 (20.4) (19.7) 20th PCTL 23.2 $4.00 $118.3 $20.4 0.1x 0.5x 0.4x 2.5x 4.9x 3.7x 8.0x 9.2x 9.1x (23.1%) 9.9% 45.3 (1.0) (10.3) Median 45.9 $13.89 $668.5 $283.7 0.6x 0.6x 0.5x 2.5x 6.9x 4.0x 8.0x 9.2x 9.7x (12.8%) 9.9% 50.0 13.8 8.8 80th PCTL 176.1 $28.37 $1,283.3 $574.2 0.9x 0.8x 0.7x 2.5x 9.0x 4.3x 8.0x 9.2x 10.3x 25.3% 20.6% 61.4 22.3 25.2 Max 360.7 $38.73 $1,498.5 $711.0 1.0x 0.9x 0.8x 2.5x 10.3x 4.5x 8.0x 9.2x 10.7x 50.8% 27.7% 71.3 32.3 30.3 Sky - mobi Limited MOBI 30.0 $2.20 $66.0 $4.9 0.09x 0.10x 0.10x NM 5.3x 5.4x 39.0x 116.6x 122.7x (45.8%) 3.0% 21.2 (3.5) 7.3 Diluted Share Price Mkt. Cap TEV Adj. EV/Revenue 2 Company Ticker Shares (M) 08/19/16 08/19/16 (M) 08/19/16 (M) LTM CY 2016 CY 2017 Linekong Interactive SEHK:8267 360.7 $0.55 $197.2 $84.4 0.5x 0.3x 0.2x KongZhong KZ 47.5 $6.31 $299.7 $221.5 0.6x NA NA Changyou.com CYOU 53.1 $21.46 $1,139.8 $482.9 0.2x 0.3x 0.2x Sohu.com Inc. SOHU 38.7 $38.73 $1,498.5 $711.0 0.2x 0.2x 0.1x Min 0.0 $0.55 $0.0 ($75.7) (0.20X) 0.16x 0.15x 20th PCTL 23.2 $4.00 $118.3 $20.4 0.01x 0.21x 0.18x Median 45.9 $13.89 $668.5 $283.7 0.19x 0.27x 0.23x 80th PCTL 176.1 $28.37 $1,283.3 $574.2 0.33x 0.29x 0.24x Max 360.7 $38.73 $1,498.5 $711.0 0.46x 0.30x 0.25x Sky - mobi Limited MOBI 30.0 $2.20 $66.0 $4.9 0.09x 0.10x 0.10x
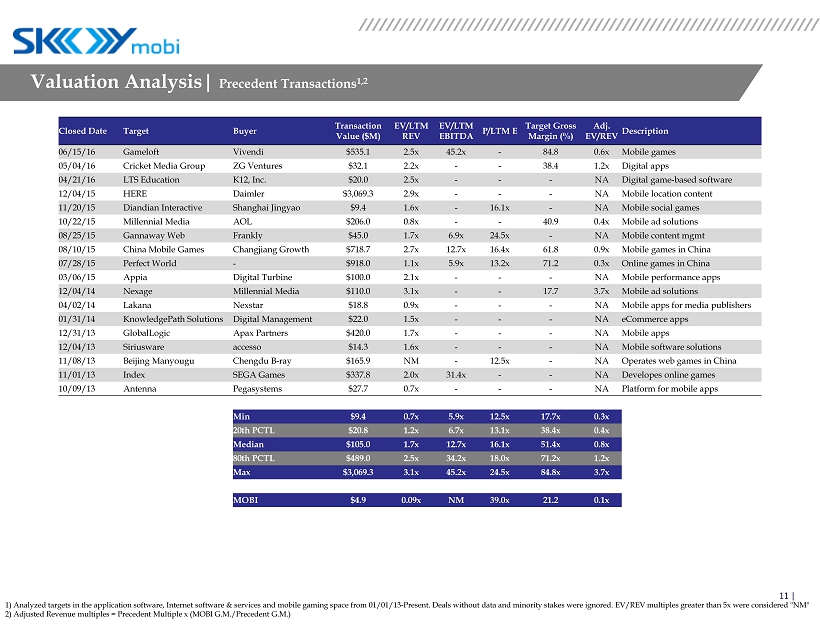
11 | Valuation Analysis | Precedent Transactions 1,2 Closed Date Target Buyer Transaction Value ($M) EV/LTM REV EV/LTM EBITDA P/LTM E Target Gross Margin (%) Adj. EV/REV Description 06/15/16 Gameloft Vivendi $535.1 2.5x 45.2x - 84.8 0.6x Mobile games 05/04/16 Cricket Media Group ZG Ventures $32.1 2.2x - - 38.4 1.2x Digital apps 04/21/16 LTS Education K12, Inc. $20.0 2.5x - - - NA Digital game - based software 12/04/15 HERE Daimler $3,069.3 2.9x - - - NA Mobile location content 11/20/15 Diandian Interactive Shanghai Jingyao $9.4 1.6x - 16.1x - NA Mobile social games 10/22/15 Millennial Media AOL $206.0 0.8x - - 40.9 0.4x Mobile ad solutions 08/25/15 Gannaway Web Frankly $45.0 1.7x 6.9x 24.5x - NA Mobile content mgmt 08/10/15 China Mobile Games Changjiang Growth $718.7 2.7x 12.7x 16.4x 61.8 0.9x Mobile games in China 07/28/15 Perfect World - $918.0 1.1x 5.9x 13.2x 71.2 0.3x Online games in China 03/06/15 Appia Digital Turbine $100.0 2.1x - - - NA Mobile performance apps 12/04/14 Nexage Millennial Media $110.0 3.1x - - 17.7 3.7x Mobile ad solutions 04/02/14 Lakana Nexstar $18.8 0.9x - - - NA Mobile apps for media publishers 01/31/14 KnowledgePath Solutions Digital Management $22.0 1.5x - - - NA eCommerce apps 12/31/13 GlobalLogic Apax Partners $420.0 1.7x - - - NA Mobile apps 12/04/13 Siriusware accesso $14.3 1.6x - - - NA Mobile software solutions 11/08/13 Beijing Manyougu Chengdu B - ray $165.9 NM - 12.5x - NA Operates web games in China 11/01/13 Index SEGA Games $337.8 2.0x 31.4x - - NA Developes online games 10/09/13 Antenna Pegasystems $27.7 0.7x - - - NA Platform for mobile apps Min $9.4 0.7x 5.9x 12.5x 17.7x 0.3x 20th PCTL $20.8 1.2x 6.7x 13.1x 38.4x 0.4x Median $105.0 1.7x 12.7x 16.1x 51.4x 0.8x 80th PCTL $489.0 2.5x 34.2x 18.0x 71.2x 1.2x Max $3,069.3 3.1x 45.2x 24.5x 84.8x 3.7x MOBI $4.9 0.09x NM 39.0x 21.2 0.1x 1) Analyzed targets in the application software, Internet software & services and mobile gaming space from 01/01/13 - Present. Dea ls without data and minority stakes were ignored. EV/REV multiples greater than 5x were considered "NM" 2) Adjusted Revenue multiples = Precedent Multiple x (MOBI G.M./Precedent G.M.)
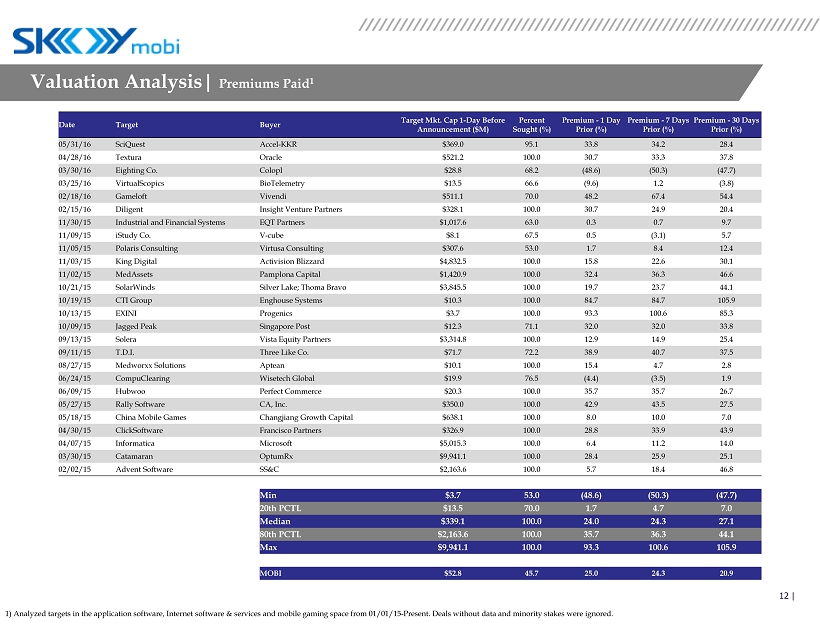
12 | Valuation Analysis | Premiums Paid 1 1) Analyzed targets in the application software, Internet software & services and mobile gaming space from 01/01/15 - Present . Deals without data and minority stakes were ignored. Date Target Buyer Target Mkt. Cap 1 - Day Before Announcement ($M) Percent Sought (%) Premium - 1 Day Prior (%) Premium - 7 Days Prior (%) Premium - 30 Days Prior (%) 05/31/16 SciQuest Accel - KKR $369.0 95.1 33.8 34.2 28.4 04/28/16 Textura Oracle $521.2 100.0 30.7 33.3 37.8 03/30/16 Eighting Co. Colopl $28.8 68.2 (48.6) (50.3) (47.7) 03/25/16 VirtualScopics BioTelemetry $13.5 66.6 (9.6) 1.2 (3.8) 02/18/16 Gameloft Vivendi $511.1 70.0 48.2 67.4 54.4 02/15/16 Diligent Insight Venture Partners $328.1 100.0 30.7 24.9 20.4 11/30/15 Industrial and Financial Systems EQT Partners $1,017.6 63.0 0.3 0.7 9.7 11/09/15 iStudy Co. V - cube $8.1 67.5 0.5 (3.1) 5.7 11/05/15 Polaris Consulting Virtusa Consulting $307.6 53.0 1.7 8.4 12.4 11/03/15 King Digital Activision Blizzard $4,832.5 100.0 15.8 22.6 30.1 11/02/15 MedAssets Pamplona Capital $1,420.9 100.0 32.4 36.3 46.6 10/21/15 SolarWinds Silver Lake; Thoma Bravo $3,845.5 100.0 19.7 23.7 44.1 10/19/15 CTI Group Enghouse Systems $10.3 100.0 84.7 84.7 105.9 10/13/15 EXINI Progenics $3.7 100.0 93.3 100.6 85.3 10/09/15 Jagged Peak Singapore Post $12.3 71.1 32.0 32.0 33.8 09/13/15 Solera Vista Equity Partners $3,314.8 100.0 12.9 14.9 25.4 09/11/15 T.D.I. Three Like Co. $71.7 72.2 38.9 40.7 37.5 08/27/15 Medworxx Solutions Aptean $10.1 100.0 15.4 4.7 2.8 06/24/15 CompuClearing Wisetech Global $19.9 76.5 (4.4) (3.5) 1.9 06/09/15 Hubwoo Perfect Commerce $20.3 100.0 35.7 35.7 26.7 05/27/15 Rally Software CA, Inc. $350.0 100.0 42.9 43.5 27.5 05/18/15 China Mobile Games Changjiang Growth Capital $638.1 100.0 8.0 10.0 7.0 04/30/15 ClickSoftware Francisco Partners $326.9 100.0 28.8 33.9 43.9 04/07/15 Informatica Microsoft $5,015.3 100.0 6.4 11.2 14.0 03/30/15 Catamaran OptumRx $9,941.1 100.0 28.4 25.9 25.1 02/02/15 Advent Software SS&C $2,163.6 100.0 5.7 18.4 46.8 Min $3.7 53.0 (48.6) (50.3) (47.7) 20th PCTL $13.5 70.0 1.7 4.7 7.0 Median $339.1 100.0 24.0 24.3 27.1 80th PCTL $2,163.6 100.0 35.7 36.3 44.1 Max $9,941.1 100.0 93.3 100.6 105.9 MOBI $52.8 45.7 25.0 24.3 20.9
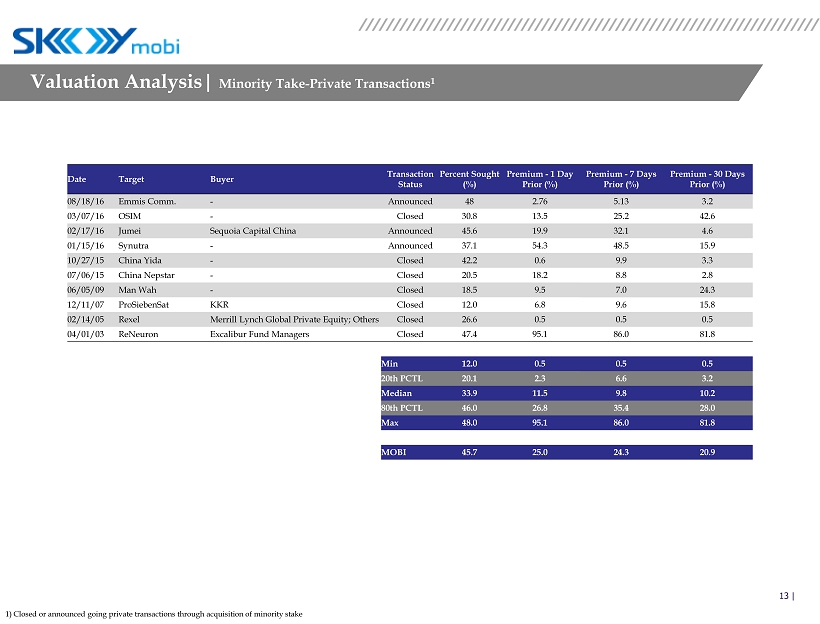
13 | Valuation Analysis | Minority Take - Private Transactions 1 1) Closed or announced going private transactions through acquisition of minority stake Date Target Buyer Transaction Status Percent Sought (%) Premium - 1 Day Prior (%) Premium - 7 Days Prior (%) Premium - 30 Days Prior (%) 08/18/16 Emmis Comm. - Announced 48 2.76 5.13 3.2 03/07/16 OSIM - Closed 30.8 13.5 25.2 42.6 02/17/16 Jumei Sequoia Capital China Announced 45.6 19.9 32.1 4.6 01/15/16 Synutra - Announced 37.1 54.3 48.5 15.9 10/27/15 China Yida - Closed 42.2 0.6 9.9 3.3 07/06/15 China Nepstar - Closed 20.5 18.2 8.8 2.8 06/05/09 Man Wah - Closed 18.5 9.5 7.0 24.3 12/11/07 ProSiebenSat KKR Closed 12.0 6.8 9.6 15.8 02/14/05 Rexel Merrill Lynch Global Private Equity; Others Closed 26.6 0.5 0.5 0.5 04/01/03 ReNeuron Excalibur Fund Managers Closed 47.4 95.1 86.0 81.8 Min 12.0 0.5 0.5 0.5 20th PCTL 20.1 2.3 6.6 3.2 Median 33.9 11.5 9.8 10.2 80th PCTL 46.0 26.8 35.4 28.0 Max 48.0 95.1 86.0 81.8 MOBI 45.7 25.0 24.3 20.9
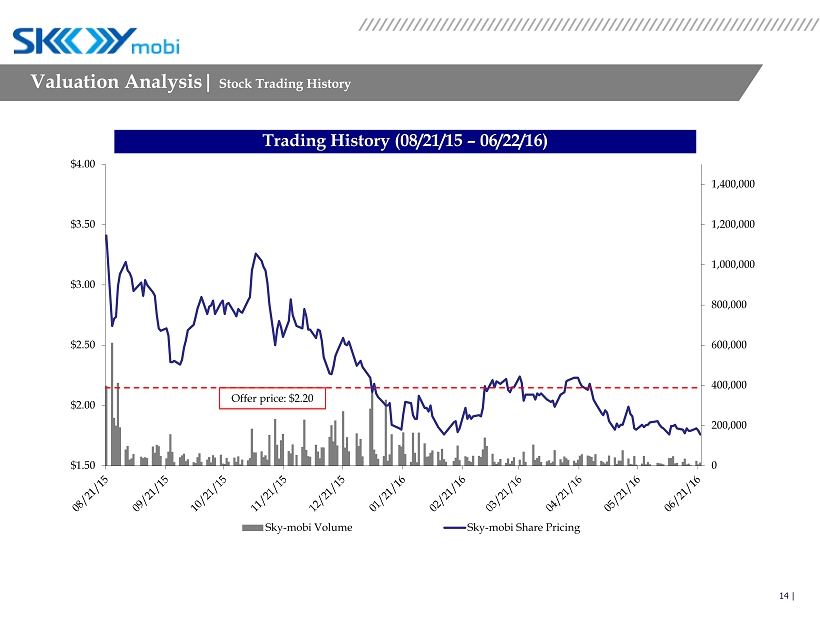
14 | 0 200,000 400,000 600,000 800,000 1,000,000 1,200,000 1,400,000 $1.50 $2.00 $2.50 $3.00 $3.50 $4.00 Sky-mobi Volume Sky-mobi Share Pricing Trading History (08/21/15 – 06/22/16) Valuation Analysis | Stock Trading History Offer price: $2.20
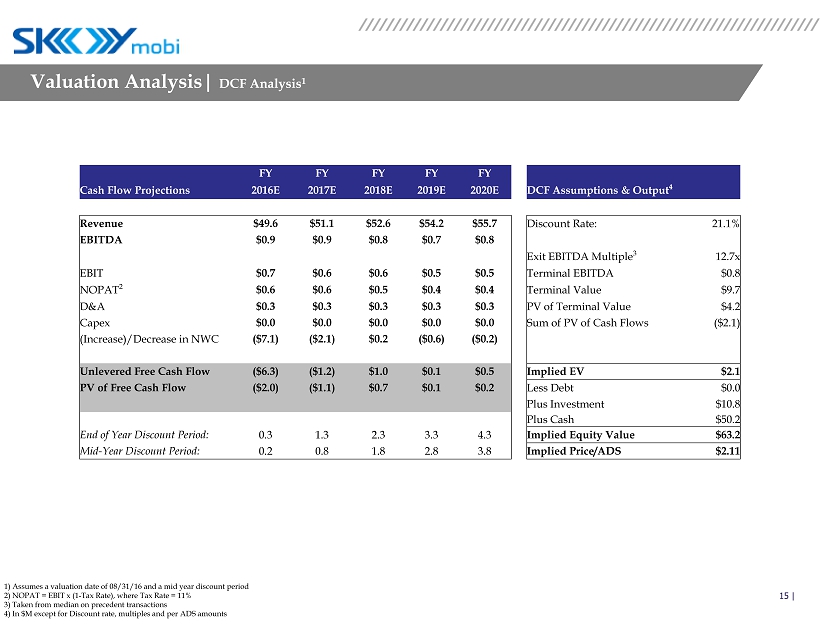
15 | Valuation Analysis | DCF Analysis 1 FY FY FY FY FY Cash Flow Projections 2016E 2017E 2018E 2019E 2020E DCF Assumptions & Output 4 Revenue $49.6 $51.1 $52.6 $54.2 $55.7 Discount Rate: 21.1% EBITDA $0.9 $0.9 $0.8 $0.7 $0.8 Exit EBITDA Multiple 3 12.7x EBIT $0.7 $0.6 $0.6 $0.5 $0.5 Terminal EBITDA $0.8 NOPAT 2 $0.6 $0.6 $0.5 $0.4 $0.4 Terminal Value $9.7 D&A $0.3 $0.3 $0.3 $0.3 $0.3 PV of Terminal Value $4.2 Capex $0.0 $0.0 $0.0 $0.0 $0.0 Sum of PV of Cash Flows ($2.1) (Increase)/Decrease in NWC ($7.1) ($2.1) $0.2 ($0.6) ($0.2) Unlevered Free Cash Flow ($6.3) ($1.2) $1.0 $0.1 $0.5 Implied EV $2.1 PV of Free Cash Flow ($2.0) ($1.1) $0.7 $0.1 $0.2 Less Debt $0.0 Plus Investment $10.8 Plus Cash $50.2 End of Year Discount Period: 0.3 1.3 2.3 3.3 4.3 Implied Equity Value $63.2 Mid - Year Discount Period: 0.2 0.8 1.8 2.8 3.8 Implied Price/ADS $2.11 1) Assumes a valuation date of 08/31/16 and a mid year discount period 2) NOPAT = EBIT x (1 - Tax Rate), where Tax Rate = 11% 3) Taken from median on precedent transactions 4) In $M except for Discount rate, multiples and per ADS amounts
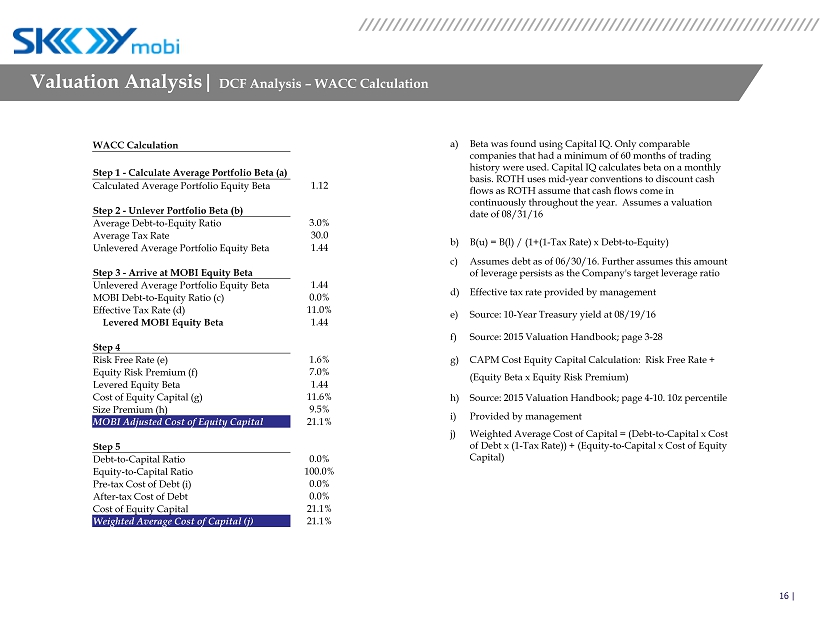
16 | a) Beta was found using Capital IQ. Only comparable companies that had a minimum of 60 months of trading history were used. Capital IQ calculates beta on a monthly basis. ROTH uses mid - year conventions to discount cash flows as ROTH assume that cash flows come in continuously throughout the year. Assumes a valuation date of 08/31/16 b) B(u) = B(l) / (1+(1 - Tax Rate) x Debt - to - Equity) c) Assumes debt as of 06/30/16. Further assumes this amount of leverage persists as the Company's target leverage ratio d) Effective tax rate provided by management e) Source: 10 - Year Treasury yield at 08/19/16 f) Source: 2015 Valuation Handbook; page 3 - 28 g) CAPM Cost Equity Capital Calculation: Risk Free Rate + (Equity Beta x Equity Risk Premium) h) Source: 2015 Valuation Handbook; page 4 - 10. 10z percentile i) Provided by management j) Weighted Average Cost of Capital = (Debt - to - Capital x Cost of Debt x (1 - Tax Rate)) + (Equity - to - Capital x Cost of Equity Capital) WACC Calculation Step 1 - Calculate Average Portfolio Beta (a) Calculated Average Portfolio Equity Beta 1.12 Step 2 - Unlever Portfolio Beta (b) Average Debt - to - Equity Ratio 3.0% Average Tax Rate 30.0 Unlevered Average Portfolio Equity Beta 1.44 Step 3 - Arrive at MOBI Equity Beta Unlevered Average Portfolio Equity Beta 1.44 MOBI Debt - to - Equity Ratio (c) 0.0% Effective Tax Rate (d) 11.0% Levered MOBI Equity Beta 1.44 Step 4 Risk Free Rate (e) 1.6% Equity Risk Premium (f) 7.0% Levered Equity Beta 1.44 Cost of Equity Capital (g) 11.6% Size Premium (h) 9.5% MOBI Adjusted Cost of Equity Capital 21.1% Step 5 Debt - to - Capital Ratio 0.0% Equity - to - Capital Ratio 100.0% Pre - tax Cost of Debt (i) 0.0% After - tax Cost of Debt 0.0% Cost of Equity Capital 21.1% Weighted Average Cost of Capital (j) 21.1% Valuation Analysis | DCF Analysis – WACC Calculation
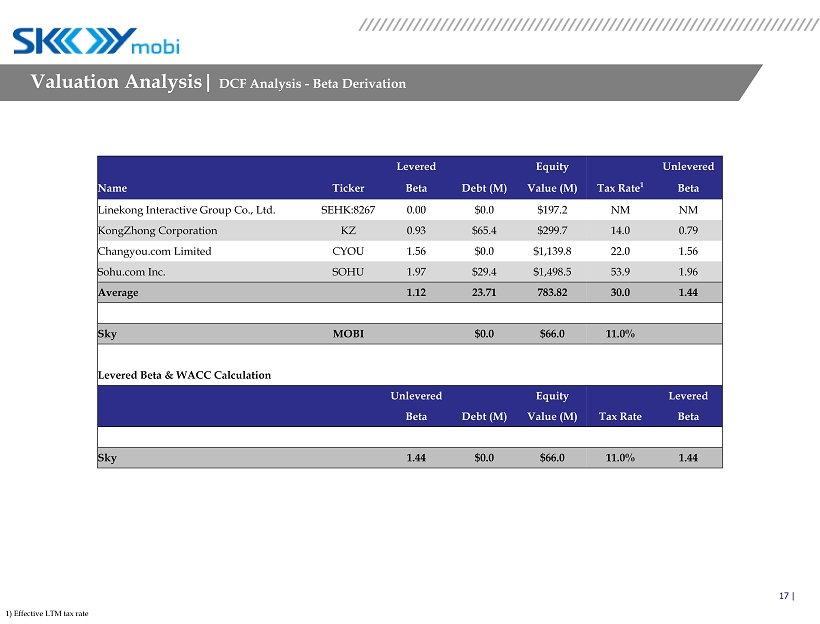
17 | Valuation Analysis | DCF Analysis - Beta Derivation 1) Effective LTM tax rate Levered Equity Unlevered Name Ticker Beta Debt (M) Value (M) Tax Rate 1 Beta Linekong Interactive Group Co., Ltd. SEHK:8267 0.00 $0.0 $197.2 NM NM KongZhong Corporation KZ 0.93 $65.4 $299.7 14.0 0.79 Changyou.com Limited CYOU 1.56 $0.0 $1,139.8 22.0 1.56 Sohu.com Inc. SOHU 1.97 $29.4 $1,498.5 53.9 1.96 Average 1.12 23.71 783.82 30.0 1.44 Sky MOBI 1.54 $0.0 $66.0 11.0% Levered Beta & WACC Calculation Unlevered Equity Levered Beta Debt (M) Value (M) Tax Rate Beta Sky 1.44 $0.0 $66.0 11.0% 1.44
18 | Disclosure This presentation was prepared by ROTH Capital Partners, LLC (“ROTH”) and provided to the Special Committee of the Board of Directors (the “Special Committee”) of Sky - mobi Limited (the “Company”) in connection with their consideration of a potential “go - private” transaction. This presentation has been provided to the Special Committee by ROTH and may not be used or relied upon by any other person for any purpose without the written consent of ROTH. The information contained herein is confidential. By accepting this presentation you agree to use it for informational purposes only and will not disclose any s uch information to any other party without the written consent of ROTH. This presentation has not been prepared with a view toward public disclosure under state or federal securities laws or otherwise. Reproduction, dissemination, quotation, summarization or reference to this presentation without our written consent is prohibited. The information utilized in preparing this presentation was obtained from the Company and other public sources. ROTH assumes no responsibility for independent investigation or verification of such information and has relied on such informatio n being complete and accurate in all material respects. To the extent such information includes estimates and/or forecasts of fut ure performance prepared by Company management, we have assumed that such estimates and forecasts have been reasonably prepared on bases reflecting the best currently available estimates and judgments of Company management. No representation or warranty, express or implied, is made as to the accuracy or completeness of such information and nothing contained herein is, or shall be relied upon as, a representation, whether as to the past or the future. ROTH has no obligation, express or implied, to update any or all of the information contained in this presentation or to advise you of any changes. Because this presentation was prepared for use in the context of an oral presentation to the Special Committee, which is fami lia r with the business and affairs of the Company, ROTH does not take any responsibility for the accuracy or completeness of any of the material included in this presentation if used by persons other than the Special Committee. This presentation is not int end ed to provide the sole basis for evaluating, and should not be considered a recommendation with respect to, any transaction or o the r matter. Prior to entering into any transaction, the Company and the Special Committee should determine, without reliance on ROTH, the economic merits and risks as well as the legal, tax and accounting consequences of any such transaction. This presentation does not constitute an opinion and ROTH’s only opinion is the written opinion that is to be rendered to the Special Committee. In preparing this presentation, ROTH has made certain assumptions regarding the information contained herein and certain limitations apply to such information. For a detailed description of these assumptions and limitations, w e r efer you to the written fairness opinion to be delivered to the Special Committee by ROTH.