UNITED STATES
SECURITIES AND EXCHANGE COMMISSION
WASHINGTON, D.C. 20549
FORM 20-F
(Mark One)
| ¨ | REGISTRATION STATEMENT PURSUANT TO SECTION 12(b) OR (g) OF THE SECURITIES EXCHANGE ACT OF 1934 |
OR
| x | ANNUAL REPORT PURSUANT TO SECTION 13 OR 15(d) OF THE SECURITIES EXCHANGE ACT OF 1934 |
For the fiscal year ended December 31, 2012
OR
| ¨ | TRANSITION REPORT PURSUANT TO SECTION 13 OR 15(d) OF THE SECURITIES EXCHANGE ACT OF 1934 |
OR
| ¨ | SHELL COMPANY REPORT PURSUANT TO SECTION 13 OR 15(d) OF THE SECURITIES EXCHANGE ACT OF 1934 |
Date of event requiring this shell company report
For the transition period from to
Commission file number: 001-34989
iSoftStone Holdings Limited
(Exact name of Registrant as specified in its charter)
Not applicable
(Translation of Registrant’s name into English)
Cayman Islands
(Jurisdiction of incorporation or organization)
Building 9 Zhongguancun Software Park
No. 8 West Dongbeiwang Road, Haidian District
Beijing 100193
People’s Republic of China
(Address of principal executive offices)
Securities registered or to be registered pursuant to Section 12(b) of the Act.
| | |
Title of each class | | Name of each exchange on which registered |
| American Depositary Shares, each representing ten ordinary shares, par value $0.0001 per share | | New York Stock Exchange, Inc. |
Securities registered or to be registered pursuant to Section 12(g) of the Act.
None
Securities for which there is a reporting obligation pursuant to Section 15(d) of the Act.
None
Indicate the number of outstanding shares of each of the issuer’s classes of capital or common stock as of the close of the period covered by the annual report: 569,206,989 ordinary shares
Indicate by check mark if the registrant is a well-known seasoned issuer, as defined in Rule 405 of the Securities Act. Yes ¨ No x
If this report is an annual or transition report, indicate by check mark if the registrant is not required to file reports pursuant to Section 13 or 15(d) of the Securities Exchange Act of 1934. Yes ¨ No x
Indicate by check mark whether the registrant (1) has filed all reports required to be filed by Section 13 or 15(d) of the Securities Exchange Act of 1934 during the preceding 12 months (or for such shorter period that the registrant was required to file such reports), and (2) has been subject to such filing requirements for the past 90 days. Yes x No ¨
Indicate by check mark whether the registrant has submitted electronically and posted on its corporate Web site, if any, every Interactive Data File required to be submitted and posted pursuant to Rule 405 of Regulation S-T (§232.405 of this chapter) during the preceding 12 months (or for such shorter period that the registrant was required to submit and post such files). Yes x No ¨
Indicate by check mark whether the registrant is a large accelerated filer, an accelerated filer, or a non-accelerated filer. See definition of “accelerated filer and large accelerated filer” in Rule 12b-2 of the Exchange Act (check one):
| | | | | | | | | | |
| Large accelerated filer ¨ | | Accelerated filer x | | Non-accelerated filer ¨ |
Indicate by check mark which basis of accounting the registrant has used to prepare the financial statements included in this filing:
| | | | | | | | | | |
| U.S. GAAP x | | International Financial Reporting Standards as issued by the International Accounting Standards Board ¨ | | Other ¨ |
If “Other” has been checked in response to the previous question, indicate by check mark which financial statement item the registrant has elected to follow: Item 17 ¨ Item 18 ¨
If this is an annual report, indicate by check mark whether the registrant is a shell company (as defined in Rule 12b-2 of the Exchange Act). Yes ¨ No x
TABLE OF CONTENTS
i
INTRODUCTION
Except where the context otherwise requires and for purposes of this annual report only:
| | • | | “ADSs” refers to our American depositary shares, each of which represents ten ordinary shares; |
| | • | | “ADRs” refers to American depositary receipts, which, if issued, evidence our ADSs; |
| | • | | all references to years are to the calendar year from January 1 to December 31; |
| | • | | all references to “Renminbi” or “RMB” are to the legal currency of China, and all references to “U.S. dollar,” “dollar,” “$” or “US$” are to the legal currency of the United States; |
| | • | | “attrition rate”, during a specified period, refers to the ratio of the number of employees that left that company during the period, excluding those employed for less than six months, to the number of employees that were on such company’s payroll at the ending date of the same period; |
| | • | | “China,” “Chinese” and the “PRC” refers to the People’s Republic of China, excluding, for purposes of this annual report only, Taiwan and the Special Administrative Regions of Hong Kong and Macau; |
| | • | | “Greater China” refers to the PRC, Taiwan and the special administrative regions of Hong Kong and Macau; |
| | • | | “professionals”, with respect to an IT services company, refers to billable employees executing IT services for its clients; |
| | • | | “ordinary shares” refers to our ordinary shares, par values $0.0001 per share; |
| | • | | “U.S. GAAP” refers to generally accepted accounting principles in the United States; and |
| | • | | “we,” “us,” “our company” and “our” refer to iSoftStone Holdings Limited, its predecessor entities, its subsidiaries, its consolidated affiliate and joint ventures, including iSoftStone Technology Service Co., Ltd., or ISST, described below. |
This annual report on Form 20-F includes our audited consolidated statements of operation data for the fiscal years ended December 31, 2010, 2011 and 2012 and audited consolidated balance sheet data as of December 31, 2011 and 2012.
In September 2012, we announced the planned formation of our consolidated subsidiary ISST. In January 2013, ISST, which is owned 75% by us and 25% by Huawei Technologies Co., Ltd., or Huawei, and has a stated term of 50 years, became operational. We formed ISST to provide a broad range of IT services to Technology and Communications clients including telecommunications carriers, telecommunications equipment manufacturers, e-commerce and internet companies, and makers of computer software, semiconductors, and computer peripherals, primarily located in China. Through ISST we plan to leverage Huawei’s leading market position in the Technology and Communication sections to further deepen our domain knowledge and expand our business (both domestically in the PRC and globally). In conjunction with ISST’s formation, among other things, we realigned to ISST all our existing Huawei business and selected non-Huawei Technology and Communications business (excluding our U.S. business and certain other agreed accounts); Huawei agreed to purchase an agreed minimum amount of services from ISST in 2013, 2014 and 2015 (with good-faith business volume discussions about additional business volumes for the years thereafter) and provide certain favorable financial terms to ISST; we agreed not to have our other business compete with ISST; we are entitled to appoint three of ISST’s five directors and key management members with Huawei selecting the other two directors, and nominating certain of ISST’s officers including the deputy general manager of the Huawei related business and ISST’s financial controller. Huawei also has customary protective veto rights with respect to certain important aspects of ISST’s operations. For a more detailed discussion of ISST, see “Item 4. Information on the Company—History and Development of the Company— iSoftStone Technology Service Co., Ltd.”
We completed our initial public offering of 12,458,334 ADSs, each representing ten ordinary shares, on December 17, 2010. Our ADSs are listed on NYSE under the symbol “ISS.”
This Annual Report on Form 20-F includes certain registered trademarks, trademarks, and trade names of us and others. All terms and product names which may be trademarks or registered trademarks of other companies are hereby acknowledged to belong to their respective owners.
1
FORWARD-LOOKING STATEMENTS
This annual report on Form 20-F contains forward-looking statements that involve risks and uncertainties. All statements other than statements of historical facts are forward-looking statements based on our current expectations, assumptions, estimates and projections about us and our industry. These statements involve known and unknown risks, uncertainties and other factors that may cause our actual results, performance or achievements to be materially different from any future results, performance or achievements expressed or implied by the forward-looking statements. In some cases, these forward-looking statements can be identified by words or phrases such as “may,” “will,” “expect,” “anticipate,” “aim,” “estimate,” “intend,” “plan,” “believe,” “potential,” “continue,” “is/are likely to” or other similar expressions. We have based these forward-looking statements largely on our current expectations and projections about future events and financial trends that we believe may affect our financial condition, results of operations, business strategy and financial needs. The forward-looking statements included in this annual report relate to, among others:
| | • | | our goals, strategies and expansion plans (including plans to grow our business organically and possibly through strategic alliances and M&A activities and an increased focus on growing business on the basis of our strength in China); |
| | • | | our future growth, business development, financial condition and results of operations; |
| | • | | projected revenues, profits, earnings and other estimated financial information; |
| | • | | our ability to acquire businesses and enter into strategic alliances complementary to our business and integrate these into our business; |
| | • | | our ability to effectively operate and expand our business through ISST and realize the anticipated financial and other related benefits; |
| | • | | competition in the PRC IT services industry and the global IT services industry generally; |
| | • | | our plans to recruit new employees and improve our retention of existing employees; |
| | • | | our plans to invest in research and development to enhance our service lines and industry vertical knowledge and domain expertise; |
| | • | | our ability to attract and retain clients; |
| | • | | fluctuations in the general economic and business conditions in the PRC, the United States, Japan, Korea, Europe and other jurisdictions where we or our clients conduct business; |
| | • | | PRC governmental policies and rules and regulations relating to the IT services industry and other areas relevant to our business activities; and |
| | • | | those other risks set forth in “Item 3.D. Key Information—Risk Factors” in this annual report. |
We believe that our expectations expressed in these forward looking statements are reasonable, however, our expectations may turn out to be incorrect and our actual results could be materially different from or worse than our expectations. The forward-looking statements made in this annual report on Form 20-F relate only to events or information as of the date on which the statements are made in this annual report. All forward-looking statements included herein attributable to us or other parties or any person acting on our behalf are expressly qualified in their entirety by the cautionary statements contained or referred to in this section. Except as required by law, we undertake no obligation to update or revise any forward-looking statements whether as a result of new information, future events or otherwise, after the date of this annual report or to reflect the occurrence of unanticipated events.
PART I
| ITEM 1. | IDENTITY OF DIRECTORS, SENIOR MANAGEMENT AND ADVISERS |
Not applicable.
| ITEM 2. | OFFER STATISTICS AND EXPECTED TIMETABLE |
Not applicable.
A. Selected Consolidated Financial Data
The following selected consolidated income statement data for the years ended December 31, 2010, 2011 and 2012, and the selected consolidated balance sheet data as of December 31, 2011 and 2012 have been derived from our audited consolidated financial statements included elsewhere in this annual report on Form 20-F. Our selected consolidated statements of operations data for the years ended December 31, 2008 and 2009 and selected consolidated balance sheet data as of December 31, 2008, 2009 and 2010 were derived from our audited consolidated financial statements, which are not included in this annual report on Form 20-F. You should read the selected consolidated financial data in conjunction with our audited financial statements and the accompanying notes included elsewhere in this annual report on Form 20-F and Item 5, “Operating and Financial Review and Prospects.” Our audited consolidated financial statements are prepared and presented in accordance with U.S. GAAP. Our historical results are not necessarily indicative of our future results.
2
Selected Consolidated Statements of Operations Data
| | | | | | | | | | | | | | | | | | | | |
| | | Year Ended December 31, | |
| | | 2008 | | | 2009 | | | 2010 | | | 2011 | | | 2012 | |
| | | (dollars in thousands, except share, per share and per ADS data) | |
Net revenues | | $ | 82,464 | | | $ | 134,387 | | | $ | 196,975 | | | $ | 283,417 | | | $ | 381,144 | |
Cost of revenues(1)(2)(3) | | | (55,083 | ) | | | (88,391 | ) | | | (125,689 | ) | | | (181,121 | ) | | | (251,540 | ) |
| | | | | | | | | | | | | | | | | | | | |
Gross profit | | | 27,381 | | | | 45,996 | | | | 71,286 | | | | 102,296 | | | | 129,604 | |
Operating expenses: | | | | | | | | | | | | | | | | | | | | |
General and administrative expenses(1)(3) | | | (16,344 | ) | | | (26,654 | ) | | | (44,277 | ) | | | (50,768 | ) | | | (63,279 | ) |
Selling and marketing expenses(1)(2)(3) | | | (11,264 | ) | | | (13,205 | ) | | | (17,468 | ) | | | (27,685 | ) | | | (32,855 | ) |
Research and development expenses(1) (3) | | | (1,057 | ) | | | (1,222 | ) | | | (3,852 | ) | | | (3,684 | ) | | | (4,951 | ) |
| | | | | | | | | | | | | | | | | | | | |
Total operating expenses | | | (28,665 | ) | | | (41,081 | ) | | | (65,597 | ) | | | (82,137 | ) | | | (101,085 | ) |
| | | | | | | | | | | | | | | | | | | | |
Changes in fair value of contingent consideration in connection with business combination | | | — | | | | (3 | ) | | | 28 | | | | (4,969 | ) | | | (1,118 | ) |
Other income (expense), net | | | 800 | | | | 981 | | | | 262 | | | | 324 | | | | (231 | ) |
Government subsidies | | | 862 | | | | 2,999 | | | | 3,269 | | | | 1,840 | | | | 1,110 | |
Gain on sale of equity of a subsidiary | | | — | | | | — | | | | 1,079 | | | | — | | | | — | |
| | | | | | | | | | | | | | | | | | | | |
Income from operations | | | 378 | | | | 8,892 | | | | 10,327 | | | | 17,354 | | | | 28,280 | |
| | | | | | | | | | | | | | | | | | | | |
Interest income | | | 228 | | | | 138 | | | | 180 | | | | 1,118 | | | | 775 | |
Interest expense | | | (363 | ) | | | (878 | ) | | | (5,742 | ) | | | (1,424 | ) | | | (1,966 | ) |
Change in fair value of warrants | | | (676 | ) | | | — | | | | — | | | | — | | | | — | |
Change in fair value of convertible notes derivatives | | | — | | | | — | | | | (8,428 | ) | | | 2,832 | | | | — | |
Gain on bargain purchase of a business | | | — | | | | 66 | | | | — | | | | — | | | | — | |
| | | | | | | | | | | | | | | | | | | | |
(Loss) income before provision for income taxes and loss in equity method investments, net of income taxes | | | (433 | ) | | | 8,218 | | | | (3,663 | ) | | | 19,880 | | | | 27,089 | |
Less: Income tax benefit (expense) | | | 492 | | | | 823 | | | | 288 | | | | (319 | ) | | | (4,370 | ) |
Income (loss) after income taxes before loss in equity method investments, net of income taxes | | | 59 | | | | 9,041 | | | | (3,375 | ) | | | 19,561 | | | | 22,719 | |
Loss in equity method investments, net of income taxes | | | (62 | ) | | | (13 | ) | | | (245 | ) | | | (565 | ) | | | (637 | ) |
| | | | | | | | | | | | | | | | | | | | |
Net (loss) income(4) | | | (3 | ) | | | 9,028 | | | | (3,620 | ) | | | 18,996 | | | | 22,082 | |
Less: Net income (loss) attributable to noncontrolling interest | | | 101 | | | | (21 | ) | | | (438 | ) | | | 151 | | | | (27 | ) |
| | | | | | | | | | | | | | | | | | | | |
Net income (loss) attributable to iSoftStone Holdings Limited | | $ | 98 | | | $ | 9,049 | | | $ | (3,182 | ) | | $ | 18,845 | | | $ | 22,109 | |
| | | | | | | | | | | | | | | | | | | | |
3
| | | | | | | | | | | | | | | | | | | | |
| | | Year Ended December 31, | |
| | | 2008 | | | 2009 | | | 2010 | | | 2011 | | | 2012 | |
| | | (dollars in thousands, except share, per share and per ADS data) | |
Net (loss) income per share | | | | | | | | | | | | | | | | | | | | |
Net (loss) income per share attributable to iSoftStone Holdings Limited shareholders: | | | | | | | | | | | | | | | | | | | | |
Basic | | | (0.03 | ) | | | 0.01 | | | | (0.05 | ) | | | 0.03 | | | | 0.04 | |
Diluted | | | (0.03 | ) | | | 0.01 | | | | (0.05 | ) | | | 0.03 | | | | 0.04 | |
Net (loss) income per ADS | | | | | | | | | | | | | | | | | | | | |
Net (loss) income attributable to iSoftStone Holdings Limited shareholders: | | | | | | | | | | | | | | | | | | | | |
Basic | | | (0.29 | ) | | | 0.13 | | | | (0.46 | ) | | | 0.34 | | | | 0.39 | |
Diluted | | | (0.29 | ) | | | 0.13 | | | | (0.46 | ) | | | 0.32 | | | | 0.38 | |
Weighted average shares used in calculating net (loss) income per ordinary share: | | | | | | | | | | | | | | | | | | | | |
Basic | | | 122,681,330 | | | | 125,106,274 | | | | 149,341,325 | | | | 547,143,620 | | | | 564,069,512 | |
Diluted | | | 122,681,330 | | | | 131,892,325 | | | | 149,341,325 | | | | 592,082,213 | | | | 582,402,472 | |
Weighted average shares used in calculating net (loss) income per ADS: | | | | | | | | | | | | | | | | | | | | |
Basic | | | 12,268,133 | | | | 12,510,627 | | | | 14,934,133 | | | | 54,714,362 | | | | 56,406,951 | |
Diluted | | | 12,268,133 | | | | 13,189,233 | | | | 14,934,133 | | | | 59,208,221 | | | | 58,240,247 | |
| (1) | Includes share-based compensation charges totaling $1.4 million, $2.4 million, $8.5 million, $9.3 million and $11.1 million in 2008, 2009, 2010, 2011 and 2012, respectively, allocated as follows: |
| | | | | | | | | | | | | | | | | | | | |
| | | Year Ended December 31, | |
| | | 2008 | | | 2009 | | | 2010 | | | 2011 | | | 2012 | |
| | | (dollars in thousands) | |
Cost of revenues | | $ | 85 | | | $ | 159 | | | $ | 175 | | | $ | 307 | | | $ | 509 | |
Operating expenses: | | | | | | | | | | | | | | | | | | | | |
General and administrative expenses | | | 1,258 | | | | 2,074 | | | | 8,091 | | | | 7,611 | | | | 8,972 | |
Selling and marketing expenses | | | 44 | | | | 110 | | | | 273 | | | | 1,225 | | | | 1,441 | |
Research and development expenses | | | 1 | | | | 7 | | | | 7 | | | | 188 | | | | 198 | |
| | | | | | | | | | | | | | | | | | | | |
Total share-based compensation expenses | | $ | 1,388 | | | $ | 2,350 | | | $ | 8,546 | | | $ | 9,331 | | | $ | 11,120 | �� |
| | | | | | | | | | | | | | | | | | | | |
| (2) | Includes amortization of intangible assets from acquisition totaling $2.6 million, $2.0 million, $1.9 million, $3.2 million and $2.8 million in 2008, 2009, 2010, 2011 and 2012, respectively, allocated as follows: |
| | | | | | | | | | | | | | | | | | | | |
| | | Year Ended December 31, | |
| | | 2008 | | | 2009 | | | 2010 | | | 2011 | | | 2012 | |
| | | (dollars in thousands) | |
Cost of revenues | | $ | 447 | | | $ | 87 | | | $ | 274 | | | $ | 985 | | | $ | 673 | |
Operating expenses: | | | | | | | | | | | | | | | | | | | | |
Selling and marketing expenses | | | 2,202 | | | | 1,928 | | | | 1,580 | | | | 2,217 | | | | 2,126 | |
| | | | | | | | | | | | | | | | | | | | |
Total amortization of intangible assets expenses | | $ | 2,649 | | | $ | 2,015 | | | $ | 1,854 | | | $ | 3,202 | | | $ | 2,799 | |
| | | | | | | | | | | | | | | | | | | | |
| (3) | Includes government subsidies as a reduction of cost of revenues and expenses totaling $1.7 million, $2.1 million, $7.7 million, $12.3 million and $17.0 million in 2008, 2009, 2010, 2011 and 2012, respectively, allocated as follows: |
| | | | | | | | | | | | | | | | | | | | |
| | | Year Ended December 31, | |
| | | 2008 | | | 2009 | | | 2010 | | | 2011 | | | 2012 | |
| | | (dollars in thousands) | |
Cost of revenues | | $ | 1,600 | | | $ | 1,815 | | | $ | 6,133 | | | $ | 9,277 | | | $ | 13,845 | |
Selling and marketing expense | | | 45 | | | | 14 | | | | 364 | | | | 769 | | | | 350 | |
General and administrative expense | | | 59 | | | | 302 | | | | 1,205 | | | | 1,775 | | | | 366 | |
Research and development expenses | | | — | | | | — | | | | — | | | | 510 | | | | 2,476 | |
| | | | | | | | | | | | | | | | | | | | |
| | $ | 1,704 | | | $ | 2,131 | | | $ | 7,702 | | | $ | 12,331 | | | $ | 17,037 | |
| | | | | | | | | | | | | | | | | | | | |
4
| (4) | To supplement our net income presented in accordance with U.S. GAAP, we use the non-GAAP financial measure of net income, which is adjusted from results based on U.S. GAAP to exclude share-based compensation, interest expense of convertible notes, changes in fair value of certain liabilities carried at fair value, amortization of intangible assets from acquisitions and gain on bargain purchase of a business. This non-GAAP financial measure is provided as additional information to help our investors compare business trends among different reporting periods on a consistent basis and to enhance investors’ overall understanding of the historical and current financial performance of our continuing operations and our prospects for the future. This non-GAAP financial measure should be considered in addition to results prepared in accordance with U.S. GAAP, but should not be considered a substitute for or superior to U.S. GAAP results. In addition, our calculation of this non-GAAP financial measure may be different from the calculation used by other companies, and therefore comparability may be limited. |
The following table sets forth the reconciliation of our non-GAAP net income (loss) to our U.S. GAAP net income (loss):
| | | | | | | | | | | | | | | | | | | | |
| | | Year Ended December 31, | |
| | | 2008 | | | 2009 | | | 2010 | | | 2011 | | | 2012 | |
| | | (dollars in thousands) | |
Net (loss) income (U.S. GAAP) | | $ | (3 | ) | | $ | 9,028 | | | $ | (3,620 | ) | | $ | 18,996 | | | $ | 22,082 | |
Share-based compensation | | | 1,388 | | | | 2,350 | | | | 8,546 | | | | 9,331 | | | | 11,120 | |
Amortization of intangible assets from acquisitions | | | 2,649 | | | | 2,015 | | | | 1,854 | | | | 3,202 | | | | 2,799 | |
Interest expense of convertible notes | | | — | | | | 63 | | | | 4,418 | | | | 654 | | | | — | |
Changes in fair value of contingent consideration in connection with business combinations | | | — | | | | 3 | | | | (28 | ) | | | 4,969 | | | | 1,118 | |
Changes in fair value of convertible notes derivatives | | | — | | | | — | | | | 8,428 | | | | (2,832 | ) | | | — | |
Changes in fair value of warrants | | | 676 | | | | — | | | | — | | | | — | | | | — | |
Gain on bargain purchase of a business | | | — | | | | (66 | ) | | | — | | | | — | | | | — | |
| | | | | | | | | | | | | | | | | | | | |
Total non-GAAP adjustments | | | 4,713 | | | | 4,365 | | | | 23,218 | | | | 15,324 | | | | 15,037 | |
| | | | | | | | | | | | | | | | | | | | |
Net income (non-GAAP) | | $ | 4,710 | | | $ | 13,393 | | | $ | 19,598 | | | $ | 34,320 | | | $ | 37,119 | |
| | | | | | | | | | | | | | | | | | | | |
Selected Consolidated Balance Sheet Data
| | | | | | | | | | | | | | | | | | | | |
| | | December 31,
2008 | | | December 31,
2009 | | | December 31,
2010 | | | December 31,
2011 | | | December 31,
2012 | |
| | | (dollars in thousands) | |
Cash | | $ | 33,776 | | | $ | 55,138 | | | $ | 181,080 | | | $ | 101,196 | | | $ | 116,597 | |
Accounts receivable, net of allowance for doubtful accounts of $309, $423, $2,320, $4,219 and $1,653 as of December 31, 2008, 2009, 2010, 2011 and 2012, respectively | | | 28,350 | | | | 69,094 | | | | 101,943 | | | | 152,663 | | | | 202,202 | |
Total assets | | | 82,841 | | | | 162,179 | | | | 343,031 | | | | 378,056 | | | | 466,510 | |
| | | | | | | | | | | | | | | | | | | | |
Total liabilities | | | 27,158 | | | | 90,935 | | | | 117,601 | | | | 83,297 | | | | 133,526 | |
Series B convertible redeemable preference shares | | | 49,459 | | | | 52,159 | | | | — | | | | — | | | | — | |
Total iSoftStone Holdings Limited shareholders’ equity | | | 6,221 | (1) | | | 18,590 | (1) | | | 224,424 | | | | 293,160 | | | | 330,073 | |
Non-controlling interest | | | 3 | | | | 495 | | | | 1,006 | | | | 1,599 | | | | 2,911 | |
| | | | | | | | | | | | | | | | | | | | |
Total equity | | | 6,224 | | | | 19,085 | | | | 225,430 | | | | 294,759 | | | | 332,984 | |
| | | | | | | | | | | | | | | | | | | | |
Total liabilities, series B convertible redeemable preference shares and equity | | $ | 82,841 | | | $ | 162,179 | | | $ | 343,031 | | | $ | 378,056 | | | | 466,510 | |
| | | | | | | | | | | | | | | | | | | | |
| (1) | Including series A convertible preference shares with carrying amount of $14.2 million for each of the periods ended December 31, 2008 and 2009. In December 2010, all series A convertible preference shares were automatically converted into ordinary shares upon the closing of our initial public offering. |
5
Exchange Rate Information
A substantial majority of our business are conducted in Renminbi. Unless otherwise noted, all translations from Renminbi to U.S. dollar amounts were made at the noon buying rate in the City of New York for cable transfers of Renminbi as certified for customs purposes by the Federal Reserve Bank of New York as of December 31, 2012, which was RMB6.2301 to $1.00. We make no representation that the Renminbi or U.S. dollar amounts referred to in this annual report could have been or could be converted into U.S. dollars or Renminbi, as the case may be, at any particular rate or at all. The PRC government restricts or prohibits the conversion of Renminbi into foreign currency and foreign currency into Renminbi for certain types of transactions. On April 19, 2013, the noon buying rate was RMB6.1772 to $1.00.
The following table sets forth information concerning exchange rates between the Renminbi and the U.S. dollar for the periods indicated. These rates are not necessarily the exchange rates that we used in this annual report or will use in the preparation of any other information to be provided to you.
| | | | | | | | | | | | | | | | |
| | | Noon Buying Rate | |
Period | | Period End | | | Average (1) | | | Low | | | High | |
| | | (RMB per $1.00) | |
2008 | | | 6.8225 | | | | 6.9193 | | | | 7.2946 | | | | 6.7800 | |
2009 | | | 6.8259 | | | | 6.8295 | | | | 6.8470 | | | | 6.8176 | |
2010 | | | 6.6000 | | | | 6.6960 | | | | 6.8330 | | | | 6.6330 | |
2011 | | | 6.2939 | | | | 6.4630 | | | | 6.6364 | | | | 6.2939 | |
2012 | | | 6.2301 | | | | 6.3088 | | | | 6.3879 | | | | 6.2221 | |
Most recent six months: | | | | | | | | | | | | | | | | |
October 2012 | | | 6.2372 | | | | 6.2627 | | | | 6.2877 | | | | 6.2372 | |
November 2012 | | | 6.2265 | | | | 6.2338 | | | | 6.2454 | | | | 6.2221 | |
December 2012 | | | 6.2301 | | | | 6.2328 | | | | 6.2502 | | | | 6.2251 | |
January 2013 | | | 6.2186 | | | | 6.2215 | | | | 6.2303 | | | | 6.2134 | |
February 2013 | | | 6.2213 | | | | 6.2323 | | | | 6.2438 | | | | 6.2213 | |
March 2013 | | | 6.2108 | | | | 6.2154 | | | | 6.2246 | | | | 6.2105 | |
April 2013 (through April 19, 2013) | | | 6.1772 | | | | 6.1927 | | | | 6.2078 | | | | 6.1720 | |
Source: Federal Reserve Bank of New York
| (1) | Annual averages are calculated using the exchange rates for the last day of each month during the year. Monthly averages are calculated using daily exchange rates during the month. |
B. Capitalization and Indebtedness
Not applicable.
C. Reasons for the Offer and Use of Proceeds
Not applicable.
6
D. Risk Factors
Risks Related to Our Business and Industry
We may be unable to effectively manage our rapid growth, which could place significant strain on our management personnel, systems and resources. We may not be able to achieve anticipated growth, which could materially and adversely affect our business and prospects.
We have experienced rapid growth and significantly expanded our business in recent years. Our net revenues grew from $82.5 million in 2008 to $283.4 million in 2011 and $381.1 million in 2012. In addition to organic growth, we have also grown through strategic acquisitions and plan to grow our business through ISST, our strategic consolidated subsidiary established with Huawei. As of the date of this annual report, we had 27 sales and delivery centers, including 20 in China, two in Japan, three in the United States, one in Canada and one in Taiwan. As of December 31, 2012, we had 14,512 employees, as compared to 3,116 and 12,510 employees as of December 31, 2007 and 2011, respectively. We intend to continue our expansion in the foreseeable future to pursue existing and potential market opportunities.
Our rapid growth has placed and will continue to place significant demands on our management and our administrative, operational and financial infrastructure. Continued expansion increases the challenges we face in:
| | • | | recruiting, training, developing and retaining sufficient skilled technical, sales and management personnel; |
| | • | | creating and capitalizing upon economies of scale; |
| | • | | managing a larger number of clients in a greater number of industries and locations; |
| | • | | maintaining effective oversight of personnel and offices; |
| | • | | coordinating work among offices and project teams and maintaining high resource utilization rates; |
| | • | | integrating new management personnel and expanded operations while preserving our culture and values; |
| | • | | developing and improving our internal administrative infrastructure, particularly our financial, operational, human resources, communications and other internal systems, procedures and controls; and |
| | • | | adhering to and further improving our high quality and process execution standards and maintaining high levels of client satisfaction. |
Moreover, as we introduce new services or enter into new markets, we may face new market, technological and operational risks and challenges with which we are unfamiliar, and it may require substantial management efforts and skills to mitigate these risks and challenges. As a result of any of these problems associated with expansion, our business, results of operations and financial condition could be materially and adversely affected. Furthermore, we may not be able to achieve anticipated growth, which could materially and adversely affect our business and prospects.
Adverse changes in the economic environment, either in China or globally, could reduce our clients’ purchases from us and increase pricing pressure, which could materially and adversely affect our revenues and results of operations.
The IT services industry is particularly sensitive to the economic environment, either in China or globally, and tends to decline during general economic downturns. Accordingly, our results of operations, financial condition and prospects are subject to a significant degree to the economic environment, especially for regions in which we and our clients operate, such as North America, Europe, China and Japan. The financial and credit markets in the United States, Europe and Asia have experienced significant disruptions since 2008, which have persisted through 2009 and 2010, and to a lesser extent in 2011 and 2012, with the European debt crisis. China’s economy has also faced challenges as its economy transitions from its former high growth pace to steady growth, as well as struggles with inflation, rising labor and other costs, and international currency issues. The financial crisis and other disruptions have led to a global economic slowdown, with the economies of those regions showing significant signs of weakness. During an economic downturn, our clients may cancel, reduce or defer their IT spending or change their IT outsourcing strategy, and reduce their purchases from us. The global economic slowdown and any future economic slowdown, and the resulting diminution in IT spending, could also lead to increased pricing pressure from our clients or greater difficulty in collecting accounts receivable. The occurrence of any of these events could materially and adversely affect our revenues and results of operations.
We face intense competition from onshore and offshore IT services companies, and, if we are unable to compete effectively, we may lose clients and our revenues may decline.
The market for IT services is highly competitive and we expect competition to persist and intensify. In addition, the PRC IT services market has started to consolidate and we expect such trend to continue. We believe that the principal competitive factors in our markets are industry expertise, breadth and depth of service offerings, quality of the services offered, reputation and track record, marketing and selling skills, scalability of infrastructure and price.
In the IT outsourcing market, we face competition from the following major competitors:
| | • | | Chinese IT services companies, such as ChinaSoft International Ltd., Neusoft Group Ltd., and Pactera Technology International Ltd.; |
7
| | • | | Indian IT services companies, such as Cognizant Technology Solutions Corp., HCL Technologies, Infosys Technologies Ltd., Tata Consultancy Services Ltd. and Wipro Technologies; |
| | • | | offshore IT services providers in emerging outsourcing destinations with low wage costs such as Southeast Asia, Latin America and Eastern Europe; and |
| | • | | in-house IT departments of large corporations. |
In the international market, we face intensified competition from Indian competitors. To date, we do not typically compete directly with the larger global consulting and outsourcing firms, such as Accenture plc, or Accenture, Cap Gemini S.A., or Capgemini, Hewlett-Packard Company, or Hewlett-Packard, and International Business Machines Corp., or IBM, who are typically engaged in conjunction with large global projects. However, we may compete with these firms if they seek smaller engagements, particularly in conjunction with a strategy to enter into or expand their presence in the domestic China market. In addition, the trend towards offshore outsourcing, international expansion by foreign and domestic competitors and continuing technological changes will result in new and different competitors entering our markets.
In the IT outsourcing market, clients tend to engage multiple outsourcing service providers instead of using an exclusive service provider, which could reduce our revenues to the extent that clients obtain services from other competing providers. Clients may prefer service providers that have facilities located globally or that are based in countries more cost-competitive than China. Our ability to compete also depends in part on a number of factors beyond our control, including the ability of our competitors to recruit, train, develop and retain highly skilled professionals, the price at which our competitors offer comparable services and our competitors’ responsiveness to client needs. Therefore, we cannot assure you that we will be able to retain our clients while competing against such competitors. Increased competition, our inability to compete successfully against competitors, pricing pressures or loss of market share could harm our business, financial condition and results of operations.
Due to intense competition for highly skilled personnel, we may fail to attract and retain enough sufficiently trained personnel to support our operations; as a result, our ability to bid for and obtain new projects may be negatively affected and our revenues could decline.
The IT services industry relies on skilled personnel, and our success depends to a significant extent on our ability to recruit, train, develop and retain qualified personnel, especially experienced middle and senior level management. The IT services industry in China has experienced significant levels of employee attrition. Our attrition rates were 19.8%, 24.8% and 23.8% per annum in 2010, 2011 and 2012, respectively. We may encounter higher attrition rates in the future, particularly if China continues to experience strong economic growth.
There is significant competition in China for skilled personnel, especially experienced middle and senior level management, with the skills necessary to perform the services we offer to our clients. Increased competition for these personnel, in the IT industry or otherwise, could have an adverse effect on us. A significant increase in our attrition rate could decrease our operating efficiency and productivity and could lead to a decline in demand for our services.
Additionally, failure to recruit, train, develop and retain personnel with the qualifications necessary to fulfill the needs of our existing and future clients or to assimilate new personnel successfully could have a material adverse effect on our business, financial condition and results of operations. Failure to retain our key personnel on client projects or find suitable replacements for key personnel upon their departure may lead to termination of some of our client contracts or cancellation of some of our projects, which could materially and adversely affect our business.
Our success depends substantially on the continuing efforts of our senior executives and other key personnel, and our business may be severely disrupted if we lose their services.
Our future success heavily depends upon the continued services of our senior executives and other key employees. In particular, we rely on the expertise, experience, client relationships and reputation of Tianwen Liu, our founder, chairman and chief executive officer. We currently do not maintain key man life insurance for any of the senior members of our management team or other key personnel. If one or more of our senior executives or key employees are unable or unwilling to continue in their present positions, it could disrupt our business operations, and we may not be able to replace them easily or at all. In addition, competition for senior executives and key personnel in our industry is intense, and we may be unable to retain our senior executives and key personnel or attract and retain new senior executive and key personnel in the future, in which case our business may be severely disrupted, and our financial condition and results of operations may be materially and adversely affected.
If any of our senior executives or key personnel joins a competitor or forms a competing company, we may lose clients, suppliers, know-how and key professionals and staff members to them. Also, if any of our business development managers, who generally keep a close relationship with our clients, joins a competitor or forms a competing company, we may lose clients, and our revenues may be materially and adversely affected. Additionally, there could be unauthorized disclosure or use of our technical knowledge, practices or procedures by such personnel. Most of our executives and key personnel have entered into employment agreements with us that contain non-competition provisions, non-solicitation and nondisclosure covenants. However, if any dispute arises between our executive officers and key personnel and us, such non-competition, non-solicitation and nondisclosure provisions might not provide effective protection to us, especially in China, where most of these executive officers and key employees reside, in light of the uncertainties with China’s legal system. See “Item 3.D. Key Information—Risk Factors—Risks Related to Doing Business in China—Uncertainties with respect to the PRC legal system could have a material adverse effect on us.”
8
We generate a significant portion of our revenues from a small number of major clients and any loss of business from these clients could reduce our revenues and significantly harm our business.
We have derived, and believe that in the foreseeable future we will continue to derive, a significant portion of our revenues from a small number of major clients. In 2010, 2011 and 2012, Huawei and Microsoft Corporation, or Microsoft, contributed 25% and 13%, 23% and 9%, and 26% and 8% of our net revenues, respectively. In the aggregate, our top five clients accounted for 46.1%, 43.2% and 47.2% of our net revenues in 2010, 2011 and 2012, respectively.
Our ability to maintain close relationships with these and other major clients is essential to the growth and profitability of our business. However, the volume of work performed for a specific client is likely to vary from year to year, especially since we are generally not our clients’ exclusive IT services provider and we do not have long-term commitments from any of our clients to purchase our services. A major client in one year may not provide the same level of revenues for us in any subsequent year. The IT services we provide to our clients, and the revenues and income from those services, may decline or vary as the type and quantity of IT services we provide changes over time. In addition, our reliance on any individual client for a significant portion of our revenues may give that client a certain degree of leverage (pricing or otherwise) against us when negotiating contracts and terms of service or cooperation. If any of our major clients elects to take advantage of such leverage to change or restructure its outsourcing arrangement with us or even require us to modify certain of our business practices, we will be in a relatively weak position in such negotiation and our business, financial condition and results of operations may be adversely impacted.
In addition, a number of factors other than our performance could cause the loss of or reduction in business or revenues from a client, and these factors are not predictable. For example, a client may decide to reduce spending on technology services or sourcing from us due to a challenging economic environment or other factors, both internal and external, relating to its business. These factors may include corporate restructuring, pricing pressure, changes to its outsourcing strategy and arrangement, switching to another IT services provider or returning work in-house.
The loss of any of our major clients, or a significant decrease in the volume of work they outsource to us or the price at which we sell our services to them, could adversely affect our financial condition and results of operations.
We may not realize the anticipated benefits of ISST which we formed together with Huawei.
We recently began providing the substantial majority of our IT services to our Technology and Communications clients through ISST we established together with Huawei. We face a number of risks and uncertainties in connection with this entity including:
| | • | | ISST was just launched in January 2013. Although ISST is our consolidated subsidiary, we only owe 75% of ISST. We face initial and ongoing issues and challenges including those related to coordinating with Huawei for our respective personnel, operations and corporate culture; |
| | • | | we may be unable to successfully leverage Huawei’s market position in the Technology and Communication sector to further deepen our domain knowledge and expand our business (both domestically in the PRC and globally). To do so, it requires close coordination with Huawei, its personnel and its customers and may require us to make significant additional investments in personnel and facilities; |
| | • | | Huawei is entitled to reduce its ISST purchase commitments if ISST fails to meet Huawei’s general requirements in terms of service quality, delivery schedule or reasonable level of cost and expenses or if ISST’s non-Huawei client business revenues is less than its Huawei-related revenues by the end of 2015 and for any year thereafter; |
| | • | | subject to its commitment to engage in good faith discussions about additional business volumes for the years after 2015, Huawei has no firm revenue commitments to ISST after 2015. To retain Huawei as a substantial customer after 2015, it requires that we continue to, among other things, promote our capability to satisfactorily meet Huawei’s changing and evolving IT services needs on mutually acceptable commercial terms; |
| | • | | Huawei has certain protective veto rights over ISST’s operations (including veto rights over any change in business scope, increase or decrease of registered capital, material acquisitions, borrowings over a certain threshold, liquidation of ISST, and amendment of ISST’s articles of association); |
| | • | | our and Huawei’s interest in and goals for ISST could significantly diverge over time reducing the anticipated economic benefits of ISST; |
9
| | • | | our chief executive officer, Mr. Tianwen Liu, also serves as ISST’s chief executive officer, which could distract his attention from our other business; |
| | • | | certain portions of our Technology and Communication business (including certain customer accounts) were not and will not be transferred to ISST due to competitive concerns or other restrictions (including U.S. government restrictions). To address these concerns and restrictions, we operate the remainder of our Technology and Communication business outside ISST, which may increase our overall costs, reduce operating efficiencies and require us to implement and maintain effective lines of separation between ISST’s business and our other businesses. Similarly, these issues and restrictions may make it difficult to attract new, and retain existing, Technology and Communications clients and may make us a less attractive acquisition or investment candidate to third parties; |
| | • | | our ability to engage in businesses potentially competitive to ISST is restricted and any dispute with Huawei regarding our activities, including those we are required to operate outside ISST, could adversely impact our Huawei relationship (including the amount of business we receive from Huawei). In contrast, Huawei currently has one joint venture with one of our competitors and (other than its revenue commitments to ISST) is not contractually prohibited from forming one or more other ventures which may compete with ISST to meet its IT services needs; and |
| | • | | we may be required to terminate ISST or purchase Huawei’s interest in ISST at fair market value prior to the expiration of its 50-year term if certain events happen (including if we materially breach the related investment agreement and such breach is not cured within two months after receiving notice of such breach, or we transfer of our interest in ISST in violation of the related investment agreement, or the revenue of ISST’s non-Huawei client business is less than 50% of our commitment in 2015 due to our intentional misconduct or gross negligence), which could be expensive, disrupt our business and require significant amount of cash that may not be readily available to us. |
If any of the above events occurs, ISST may not achieve commercial success as we expect and our business, financial condition and result of operations may be adversely impacted. For more information about ISST, see “Item 4. Information on the Company—History and Development of the Company—iSoftStone Technology Service Co., Ltd.”
If we are unable to collect our receivables from our clients, our results of operations and cash flows could be adversely affected.
Our business depends on our ability to successfully obtain payment from our clients of the amounts they owe us for work performed. The timing of invoicing and collection of our accounts receivable under our contracts is impacted by the life cycle of the projects we perform, and related payment milestones which heavily depends on the budget and payment process cycles of our large clients. In some instances our clients have requested we delay billing to meet their own budgetary and cash management goals or requirements. As of December 31, 2010, 2011 and 2012, our net billed accounts receivable totaled $26.3 million, $50.7 million and $50.7 million, respectively, and our net unbilled accounts receivable totaled $75.6 million, $102.0 million and $151.5 million, respectively. Our largest client accounted for 29.6% and 29.5% of our net accounts receivable as of December 31, 2011 and as of December 31, 2012, respectively. Since we generally do not require collateral or other security from our clients, we establish an allowance for doubtful accounts based upon estimates, historical experience and other factors surrounding the credit risk of specific clients which also requires us to make certain adjustments and assumptions. As of December 31, 2010, 2011 and 2012, the provision made for doubtful accounts was $2.3 million, $4.2 million and $1.7 million, respectively. However, actual losses on client receivables balance could differ from those that we anticipate and as a result we might need to adjust our allowance. There is no guarantee that we will accurately assess the creditworthiness of our clients. Macroeconomic conditions, including related turmoil in the global financial system, could also result in financial difficulties for our clients, including limited access to the credit markets, insolvency or bankruptcy, and as a result could cause clients to delay payments to us, request modifications to their payment arrangements that could increase our receivables balance, or default on their payment obligations to us. As a result, an extended delay or default in payment relating to a significant account will have a material and adverse effect on the aging schedule and turnover days of our accounts receivable. If we are unable to collect our receivables from our clients in accordance with the contracts with our clients, our results of operations and cash flows could be adversely affected.
In many cases our client engagements are not long-term, and our clients may terminate contracts before completion or choose not to renew contracts, which could adversely affect our business and reduce our revenues.
Our clients typically retain us on a non-exclusive, project-by-project basis and are not obligated for any long-term commitments to us. Many of our client contracts can be terminated by our clients with or without cause. There are a number of factors relating to our clients that are outside of our control which might lead them to terminate a contract or project with us, including:
| | • | | financial difficulties for the client; |
| | • | | a change in strategic priorities, resulting in elimination of the impetus for the project or a reduced level of technology spending; |
| | • | | a change in outsourcing strategy resulting in moving more work to the client’s in-house technology departments or to our competitors; |
10
| | • | | the replacement by our clients of existing software with packaged software supported by licensors; and |
| | • | | mergers and acquisitions or significant corporate restructurings. |
In addition, some of our client contracts specify that if a change of control of our company occurs during the term of the contract, the client has the right to terminate the contract. If any future event triggers any change-of-control provision in our client contracts, these contracts may be terminated, which would result in our loss of revenues in the future. If our clients terminate our contracts before completion or choose not to renew our contracts, our business, financial condition and results of operations may be materially and adversely affected.
If we are not successful in obtaining and managing increasingly large and complex projects, we may not achieve our growth goals and our results of operations and cash flow may be adversely affected.
As our domain knowledge in the industries we serve deepens and our relationships with clients strengthen, more clients have engaged us to undertake increasingly large and complex projects. To successfully obtain and manage larger and more complex projects, we need to establish closer relationships with our clients and develop a thorough understanding of their operations. In addition, we may face a number of challenges managing larger and more complex projects, including maintaining high quality control and process execution standards and controlling costs. In addition, we must maintain close client contact and high levels of client satisfaction, while at the same time maintaining continuity in personnel engaged in a particular project.
Our ability to successfully obtain and manage larger and more complex projects depends significantly on the skills of our management personnel and professionals, some of whom do not have experience managing large or complex projects. Larger and more complex projects may involve multiple engagements or stages, and there is a risk that a client may choose not to retain us for additional stages or may cancel or delay additional planned engagements. Such cancellations or delays make it difficult to plan for project resource requirements. These larger and complex projects present cash flow risks and challenges. Related cash collections are usually linked to our successfully achieving specified milestones. However, over the life of these typically longer term projects we are often required to advance employee, subcontracting and/or other costs long before we collect related cash payments from our clients.
If we are not able to successfully obtain engagements for larger and more complex projects, we may not achieve our growth goals. Even if we are successful in obtaining such engagements, a failure by us to effectively manage these larger and more complex projects could cause us to lose business and may adversely affect our reputation and results of operations.
The growth and success of our business depends on our ability to anticipate and develop new services and enhance existing services in order to keep pace with rapid changes in technology and in the industries we focus.
The IT services market is characterized by rapid technological change, evolving industry standards, changing client preferences and new product and service introductions. Our future growth and success depend significantly on our ability to anticipate developments in IT services, and offer and develop new product and service lines to meet our clients’ evolving needs. We may not be successful in anticipating or responding to these developments in a timely manner, or if we do respond, the services or technologies we develop may not be successful in the marketplace. We have been investing in service capabilities (such as our recent initiatives: Smart City Solutions, Data and Business Intelligence Services, Mobility Services and Cloud Services) that we believe will drive future growth and enable us to provide higher value-added services and address broader business needs of our clients. Our development of new services and technologies may involve significant upfront investments and the failure of these services and technologies may result in our being unable to recover these investments, in part or in full. In addition, as we introduce new services or technologies (such as our Smart City Solutions), we may face new market, technological and operational risks and challenges with which we are unfamiliar, and it may require substantial management efforts and skills to mitigate these risks and challenges. As a result of any of these problems associated with our new services or technologies, our business, results of operations and financial condition could be materially and adversely affected.
Further, services or technologies that are developed by our competitors may render our services uncompetitive or obsolete. In addition, new technologies may be developed that allow our clients to more cost-effectively perform the services that we provide, thereby reducing demand for our services. Should we fail to adapt to the rapidly changing IT services market or if we fail to develop suitable services to meet the evolving and increasingly sophisticated requirements of our clients in a timely manner, our business and results of operations could be materially and adversely affected.
We may be unsuccessful in entering into strategic alliances or identifying and acquiring suitable acquisition candidates, which could impede our growth and negatively affect our revenues and net income.
We have pursued and may continue to pursue strategic alliances and strategic acquisition opportunities to increase our scale and geographic presence, expand our service offerings and capabilities and enhance our industry and technical expertise. However, it is possible that in the future we may not succeed in identifying suitable alliances or acquisition candidates. Even if we identify suitable candidates, we may not be able to consummate these arrangements on terms commercially acceptable to us or to obtain necessary regulatory approvals in the case of acquisitions. Many of our competitors are likely to be seeking to enter into similar arrangements or acquire the same targets that we are looking to enter into or acquire. Such competitors may have substantially greater financial resources than we do and may be more attractive to our strategic partners or be able to outbid us for the targets. In addition, we may also be unable to timely deploy our existing cash balances to effect a potential acquisition, as use of cash balances located onshore in China may require specific governmental approvals or result in withholding and other tax payments. If we are unable to enter into suitable strategic alliances or complete suitable acquisitions, our growth strategy may be impeded and our revenues and net income could be negatively affected.
11
If we fail to integrate or manage acquired companies efficiently, or if the acquired companies do not perform to our expectations, we may not be able to realize the benefits envisioned for such acquisitions, and our overall profitability and growth plans may be adversely affected.
Historically, we have expanded our service capabilities and gained new clients through selective acquisitions and alliances. Our ability to successfully integrate an acquired entity and realize the benefits of any acquisition requires, among other things, successful integration of technologies, operations and personnel. Challenges we face in the acquisition and integration process include:
| | • | | integrating operations, services and personnel in a timely and efficient manner; |
| | • | | unforeseen or undisclosed liabilities; |
| | • | | generating sufficient revenue and net income to offset acquisition costs; |
| | • | | potential loss of, or harm to, employee or client relationships; |
| | • | | properly structuring our acquisition consideration and any related post-acquisition earn-outs and successfully monitoring any earn-out calculations and payments; |
| | • | | retaining key senior management and key sales and marketing and research and development personnel; |
| | • | | potential incompatibility of solutions, services and technology or corporate cultures; |
| | • | | consolidating and rationalizing corporate, information technology and administrative infrastructures; |
| | • | | integrating and documenting processes and controls; |
| | • | | entry into unfamiliar markets; and |
| | • | | increased complexity from potentially operating additional geographically dispersed sites, particularly if we acquire a company or business with facilities or operations outside of China. |
In addition, the primary value of many potential targets in the outsourcing industry lies in their skilled professionals and established client relationships. Transitioning these types of assets to our business can be particularly difficult due to different corporate cultures and values, geographic distance and other intangible factors. For example, some newly acquired employees may decide not to work with us or to leave shortly after their move to our company and some acquired clients may decide to discontinue their commercial relationships with us. These challenges could disrupt our ongoing business, distract our management and employees and increase our expenses, including causing us to incur significant one-time expenses and write-offs, and make it more difficult and complex for our management to effectively manage our operations. If we are not able to successfully integrate an acquired entity and its operations and to realize the benefits envisioned for such acquisition, our overall growth and profitability plans may be adversely affected.
If we do not succeed in attracting new clients for our services and/or growing revenues from existing clients, we may not achieve our revenue growth goals.
We plan to significantly expand the number of clients we serve to diversify our client base and grow our revenues. Revenues from a new client often rise quickly over the first several years following our initial engagement as we expand the services that we provide to that client. Therefore, obtaining new clients is important for us to achieve rapid revenue growth. We also plan to grow revenues from our existing clients by identifying and selling additional services to them. Our ability to attract new clients, as well as our ability to grow revenues from existing clients, depends on a number of factors, including our ability to offer high quality services at competitive prices, the strength of our competitors and the capabilities of our sales and marketing teams. Our consolidated subsidiary ISST established together with Huawei may also adversely impact our relationship with our other clients. If we are not able to continue to attract new clients or to grow revenues from our existing clients in the future, we may not be able to grow our revenues as quickly as we anticipate or at all.
As a result of our significant growth and acquisitions in recent years, evaluating our business and prospects may be difficult and our past results may not be indicative of our future performance.
Our future success depends on our ability to significantly increase revenue and maintain profitability from our operations. Our business has grown and evolved significantly in recent years, through both organic growth and strategic acquisitions. Our significant growth and several acquisitions in recent years make it difficult to evaluate our historical performance and make a period-to-period comparison of our historical operating results less meaningful. We may not be able to achieve a similar growth rate or maintain profitability in future periods. Furthermore, certain members of our senior management team have worked together for a relatively short period of time, and it may be difficult for you to evaluate their effectiveness, on an individual or collective basis, and their ability to address future challenges to our business. Therefore, you should not rely on our past results or our historic rate of growth as an indication of our future performance.
12
You should consider our future prospects in light of the risks and challenges encountered by a company seeking to grow and expand in a competitive industry that is characterized by rapid technological change, evolving industry standards, changing client preferences and new product and service introductions. These risks and challenges include, among others:
| | • | | the uncertainties associated with our ability to continue our growth and maintain profitability; |
| | • | | preserving our competitive position in the IT services industry in China; |
| | • | | offering consistent and high-quality services to retain and attract clients; |
| | • | | implementing our strategy and modifying it from time to time to respond effectively to competition and changes in client preferences; |
| | • | | managing our expanding operations, including the integration of our past and future acquisitions, and successfully expanding our solution and service offerings; |
| | • | | responding in a timely manner to technological or other changes in the IT services industry; |
| | • | | managing risks associated with intellectual property; and |
| | • | | recruiting, training, developing and retaining qualified managerial and other personnel. |
If we are unsuccessful in addressing any of these risks or challenges, our business may be materially and adversely affected.
We face risks associated with having a long selling and implementation cycle for our services that require us to make significant resource commitments prior to realizing revenues for those services.
We have a long selling cycle for our technology services (especially for those related to our smart city projects), which requires significant investment of capital, human resources and time by both our clients and us. Before committing to use our services, potential clients require us to expend substantial time and resources educating them on the value of our services and our ability to meet their requirements. Therefore, our selling cycle is subject to many risks and delays over which we have little or no control, including our clients’ decision to choose alternatives to our services (such as other providers or in-house resources) and the timing of our clients’ budget cycles and approval processes. For certain clients, we may begin work and incur substantial costs prior to concluding the contract.
Implementing our services also involves a significant commitment of resources over an extended period of time from both our clients and us. Our clients may experience delays in obtaining internal approvals or delays associated with technology, thereby further delaying the implementation process. Our current and future clients may not be willing or able to invest the time and resources necessary to implement our services, and we may fail to close sales with potential clients to which we have devoted significant time and resources, which could have a material adverse effect on our business, results of operations, financial condition and cash flows.
Our profitability will suffer if we are not able to maintain our resource utilization levels and continue to improve our productivity levels.
Our gross margin and profitability are significantly impacted by our utilization levels of human resources as well as other resources, such as computers, IT infrastructure and office space, and our ability to increase our productivity levels. We have expanded our operations significantly in recent years through organic growth and external acquisitions, which has resulted in a significant increase in our headcount and fixed overhead costs. We may face difficulties maintaining high levels of utilization, especially for our newly established or newly acquired businesses and resources.
The master service agreements with our clients typically do not impose a minimum or maximum purchase amount and allow our clients to place service orders from time to time at their discretion. Client demand may fall to zero or surge to a level that we cannot cost-effectively satisfy. Although we try to use all commercially reasonable efforts to accurately estimate service orders and resource requirements from our clients, we may overestimate or underestimate, which may result in unexpected cost and strain or redundancy of our human capital and adversely impact our utilization levels. In addition, some of our professionals are specially trained to work for specific clients or on specific projects and some of our sales and delivery center facilities are dedicated to specific clients or specific projects. Our ability to continually increase our productivity levels depends significantly on our ability to recruit, train, develop and retain high-performing professionals, staff projects appropriately and optimize our mix of services and delivery methods.
If we experience a slowdown or stoppage of work for any client or on any project for which we have dedicated professionals or facilities, we may not be able to efficiently reallocate these professionals and facilities to other clients and projects to keep their utilization and productivity levels high. If we are not able to maintain high resource utilization levels without corresponding cost reductions or price increases, our profitability will suffer.
13
A majority of our revenue is generated, and will in the future continue to be generated, on a project basis with a fixed price; we may not be able to accurately estimate costs and determine resource requirements in relation to our projects, which would reduce our margins and profitability.
A majority of our revenue is generated, and will in the future continue to be generated, from fees we receive for our projects with a fixed price. Our projects often involve complex technologies, entail the coordination of operations and workforces in multiple locations, utilizing workforces with different skill sets and competencies and geographically distributed service centers, and must be completed within compressed timeframes and meet client requirements that are subject to change and increasingly stringent. In addition, some of our fixed-price projects are multi-year projects that require us to undertake significant projections and planning related to resource utilization and costs. If we fail to accurately assess the time and resources required for completing projects and to price our projects profitably, our business, results of operations and financial condition could be adversely affected.
Increases in wages for professionals in China could prevent us from sustaining our competitive advantage and could reduce our profit margins.
Our most significant costs are the salaries and other compensation expenses for our professionals and other employees. Wage costs for professionals in China are lower than those in more developed countries and India. However, because of rapid economic growth, increased productivity levels, and increased competition for skilled employees in China, wages for highly skilled employees in China, in particular middle- and senior-level managers, are increasing at a faster rate than in the past. We may need to increase the levels of employee compensation more rapidly than in the past to remain competitive in attracting and retaining the quality and number of employees that our business requires. Increases in the wages and other compensation we pay our employees in China could reduce our competitive advantage unless we are able to increase the efficiency and productivity of our professionals as well as the prices we can charge for our services. In addition, any appreciation in the value of the Renminbi relative to U.S. dollar and other foreign currencies will cause an increase in the relative wage levels in China, which could further reduce our competitive advantage and adversely impact our profit margin. For more information relating to the impact of fluctuation in the value of the Renminbi to our business, please see “Item 3.D. Key Information—Risk Factors—Risks Related to Our Business and Industry—Fluctuation in the value of the Renminbi and other currencies may have a material adverse effect on the value of your investment.”
Our business operations and financial condition could be adversely affected if we cease to enjoy, or breach the restrictions imposed for, the financial incentives and subsidies provided by certain PRC government agencies.
We have in the past received financial incentives and subsidies granted by various PRC government authorities in support of our business. Our net income (loss) for 2010, 2011 and 2012 was $(3.6 million), $19.0 million and $22.1 million, respectively. In 2010, 2011 and 2012, we recognized government subsidies as a reduction to cost of revenue and expenses, primarily cost of revenues, of $7.7 million, $12.3 million and $17.0 million, respectively, and recognized government subsidies as other income of $3.3 million, $1.8 million and $1.1 million, respectively. However, we cannot assure you of the continued availability of such financial incentives and subsidies in the future. The discontinuation of these financial incentives and subsidies could adversely affect our financial condition and results of operations. In addition, future financial incentives, grants and subsidies may impose certain requirements and restrictions on our business operations. These financial incentives, grants and subsidies, for example, might impose development time and local use requirements for certain projects funded by a government incentive, grant or subsidy, which can potentially limit the manner that we operate and expand our business.
We have an existing dispute with iCarnegie Inc. regarding certain licensing arrangements. If we do not win the related legal proceedings or settle such dispute on commercially acceptable terms, we may be exposed to monetary or other liabilities, which may harm our reputation, involve significant cash payments and adversely impact the market price of our ADSs.
In 2009, in cooperation with the Wuxi City government, we established the iCarnegie-iSoftStone training center (currently owned 20% by us). Some programs provided at the iCarnegie-iSoftStone training center in 2009 utilized the technical curriculum and professional certifications developed and maintained by iCarnegie Inc. and licensed to us pursuant to a course license agreement first entered into in 2009. We had been negotiating with iCarnegie Inc. new cooperation arrangements, which were expected to replace the existing licensing arrangements including a minimum enrollment fee requirement. In October 2012, iCarnegie Inc. submitted a demand for arbitration to the American Arbitration Association against us claiming approximately $5.9 million plus interest (at a contractual rate of 18% per annum) that was allegedly due from us to iCarnegie Inc. pursuant to the course license agreement. The arbitration remains at its preliminary stage and we intend to vigorously defend the arbitration. Please see “Item 8—Financial Information—Legal Proceedings”. With four dedicated internal trainings centers in Wuxi, Tianjin, Guangzhou and Dalian, we do not currently rely on the iCarnegie Inc. arrangements to attract, train and retain our personnel. However, if we do not win the legal proceedings or determine to settle the disputes with iCarnegie Inc., we may be exposed to monetary or other liabilities. The arbitration process may incur significant expenses and divert management’s attention from day-to-day company operations. Any adverse outcome of the arbitration could have a material adverse effect on our cash position, results of operation, reputation and the market price of our ADSs.
14
Our subcontracting practices may expose us to technical uncertainties, potential liabilities and reputational harm.
In order to meet our personnel needs, increase workforce flexibility, and improve pricing competitiveness, we subcontract portions of certain projects to third parties. Despite certain advantages of subcontracting, such arrangements also give rise to a number of risks.
Although we try to source competent and credible third parties as our subcontractors, they may not be able to deliver the level of service that our clients expect us to deliver. Furthermore, we enter into confidentiality agreements with our subcontractors, but we cannot guarantee that they will not breach the confidentiality of our clients and misappropriate our or our clients’ proprietary information and technology in the course of providing service. We, as the party to the contract with the client, are directly responsible for the losses our subcontractors cause our clients. Under the subcontracting agreements we enter, our subcontractors promise to indemnify us for damages caused by their breach, but we may be unable to collect under these agreements. Moreover, their breaches may damage our reputation and adversely affect our ability to acquire new business in the future.
In some limited cases and despite internal restrictions designed to prevent these actions, we may have subcontracted certain contractual obligations to third parties without first obtaining our clients’ prior written consent under the related client contracts. Although we have not been subject to adverse claims by our clients for these actions, we cannot assure you that these actions would not result in improper disclosure of client information, or result in client dissatisfaction or client loss.
The international nature of our business exposes us to risks that could adversely affect our financial condition and results of operations.
We conduct our business throughout the world in multiple locations. Our corporate structure also spans multiple jurisdictions, with our parent holding company incorporated in the Cayman Islands and intermediate and operating subsidiaries incorporated in China, Hong Kong, the United States, Canada, Japan, Europe and Korea. As a result, we are exposed to risks typically associated with conducting business internationally, many of which are beyond our control. These risks include:
| | • | | significant currency fluctuations between the Renminbi and the U.S. dollar and other currencies in which we transact business; |
| | • | | legal uncertainty owing to the overlap and inconsistencies of different legal regimes, problems in asserting contractual or other rights across international borders and the burden and expense of complying with the laws and regulations of various jurisdictions; |
| | • | | potentially adverse tax consequences, such as scrutiny of transfer pricing arrangements by authorities in the countries in which we operate; |
| | • | | current and future tariffs and other trade barriers, including restrictions on technology and data transfers; |
| | • | | unexpected changes in regulatory requirements; |
| | • | | natural disasters, such as the March 2011 earthquake and tsunami in Japan; and |
| | • | | terrorist attacks and other acts of violence or war. |
The occurrence of any of these events could have a material adverse effect on our results of operations and financial condition.
Our net revenues and results of operations are affected by seasonal trends.
Our business is affected by seasonal trends. In particular, our net revenues are typically progressively higher in the second, third and fourth quarters of each year compared to the first quarter of each year due to seasonal trends, such as: (i) a general slowdown in business activities and a reduced number of working days for our professionals during the first quarter of each year as a result of the Chinese New Year holiday period, and (ii) our customers in general tend to spend their IT budgets in the second half of the year and in particular the fourth quarter. Other factors that may cause our quarterly operating results to fluctuate include, among others, changes in general economic conditions in China and the impact of unforeseen events. We believe that our net revenues will continue to be affected in the future by seasonal trends. As a result, you may not be able to rely on period to period comparisons of our operating results as an indication of our future performance, and we believe it is more meaningful to evaluate our business on an annual basis.
We may be forced to reduce the prices of our services due to increased competition and reduced bargaining power with our clients, which could lead to reduced revenues and profitability.
The services outsourcing industry in China is developing rapidly and related technology trends are constantly evolving. This results in the frequent introduction of new services and significant price competition from our competitors. We may be unable to offset the effect of declining average sales prices through increased sales volumes and/or reductions in our costs. Furthermore, we may be forced to reduce the prices of our services in response to offerings made by our competitors. Finally, we may not have the same level of bargaining power we have enjoyed in the past when it comes to negotiating for the prices of our services.
15
Our ability to expand our business, procure new contracts, enter into beneficial business arrangements or leverage our skills and knowledge may be affected by non-competition clauses in our agreements with existing clients.
Certain of our existing client contracts have non-competition clauses, which restrict us from providing services to customers of our existing clients. Many of our client contracts contain clauses that restrict our employees working for a particular client from providing services to the competitors of those clients, and/or in similar assignments to third parties even if they are not competitors of those clients. Our contracts with some of our clients provide that, during the term of the contract and for up to a 12-month period thereafter and under specified circumstances, we may not accept any assignments from, or render services to, those clients’ customers. These restrictions may hamper our ability to compete for and provide services to other clients in a specific industry or market in which we have expertise and may adversely affect our revenues and future profitability.
Under certain contracts, we are prohibited from using any skills and techniques used for a certain client in other projects. Such clauses may restrict our ability to develop other clients in a commercially desirable way and to extract the maximum value from the skills and knowledge we have accumulated while providing service.
If we cause disruptions to our clients’ businesses or provide inadequate service, our clients may have claims for substantial damages against us, and as a result our profits may be substantially reduced.
If our professionals make errors in the course of delivering services to our clients or fail to consistently meet service requirements of a client, these errors or failures could disrupt the client’s business, which could result in a reduction in our net revenues or a claim for substantial damages against us. In addition, a failure or inability to meet a contractual requirement could seriously damage our reputation and affect our ability to attract new business.
The services we provide are often critical to our clients’ businesses. Certain of our client contracts require us to comply with security obligations including maintaining network security and back-up data, ensuring our network is virus-free, maintaining business continuity planning procedures, and verifying the integrity of employees that work with our clients by conducting background checks. Any failure in a client’s system or breach of security relating to the services we provide to the client could damage our reputation or result in a claim for substantial damages against us. Any significant failure of our equipment or systems, or any major disruption to basic infrastructure like power and telecommunications in the locations in which we operate, could impede our ability to provide services to our clients, have a negative impact on our reputation, cause us to lose clients, reduce our revenues and harm our business.
Under our contracts with our clients, our liability for breach of our obligations is in some cases limited to a certain percentage of contract price. Such limitations may be unenforceable or otherwise may not protect us from liability for damages. In addition, certain liabilities, such as claims of third parties for which we may be required to indemnify our clients, are generally not limited under our contracts. We currently do not have commercial general or public liability insurance. The successful assertion of one or more large claims against us could have a material adverse effect on our business, reputation, results of operations, financial condition and cash flows. Even if such assertions against us are unsuccessful, we may incur reputational harm and substantial legal fees.
We may be liable to our clients for damages caused by unauthorized disclosure of sensitive and confidential information, whether through our employees or otherwise.
We are typically required to manage, utilize and store sensitive or confidential client data in connection with the services we provide. Under the terms of our client contracts, we are required to keep such information strictly confidential. We use network security technologies, surveillance equipment and other methods to protect sensitive and confidential client data. We also require our employees and subcontractors to enter into confidentiality agreements to limit access to and distribution of our clients’ sensitive and confidential information as well as our own trade secrets. We can give no assurance that the steps taken by us in this regard will be adequate to protect our clients’ confidential information. If our clients’ proprietary rights are misappropriated by our employees or our subcontractors or their employees, in violation of any applicable confidentiality agreements or otherwise, our clients may consider us liable for those acts and seek damages and compensation from us. Any such acts could cause us to lose existing and future business and damage our reputation in the market. In addition, we currently do not have any insurance coverage for mismanagement or misappropriation of such information by our subcontractors or employees. Any litigation with respect to unauthorized disclosure of sensitive and confidential information might result in substantial costs and diversion of resources and management attention.
We may not be able to prevent others from unauthorized use of intellectual property of our clients, which could harm our business and competitive position.
We rely on software licenses from our clients with respect to certain projects. To protect proprietary information and other intellectual property of our clients, we require our employees, subcontractors, consultants, advisors and collaborators to enter into confidentiality agreements with us. These agreements may not provide effective protection for trade secrets, know-how or other proprietary information in the event of any unauthorized use, misappropriation or disclosure of such trade secrets, know-how or other proprietary information. Implementation of intellectual property-related laws in China has historically been lacking, primarily because of ambiguities in the PRC laws and difficulties in enforcement. Accordingly, protection of intellectual property rights and confidentiality in China may not be as effective as that in the United States or other developed countries. Policing unauthorized use of proprietary technology is difficult and expensive. The steps we have taken may be inadequate to prevent the misappropriation of proprietary technology of our clients. Reverse engineering, unauthorized copying or other misappropriation of proprietary technologies of our clients could enable third parties to benefit from our or our clients’ technologies without paying us and our clients for doing so, and our clients may hold us liable for that act and seek damages and compensation from us, which could harm our business and competitive position.
16
We may not be able to prevent others from unauthorized use of our intellectual property, which could cause a loss of clients, reduce our revenues and harm our competitive position.
We rely on a combination of patent, copyright, trademark, software registration, anti-unfair competition and trade secret laws, as well as confidentiality agreements and other methods to protect our intellectual property rights. As of December 31, 2012, we had six patents, six trademark registrations, seven patent applications, two trademark applications and 207 software copyright registrations, and 21 domain names in China. A patent filing may not result in an issued patent and an issued patent may not sufficiently protect our intellectual property rights. Furthermore, our current limited patent protection may limit our ability to stop any unauthorized use of our software or other intellectual property. To protect our trade secrets and other proprietary information, employees, clients, subcontractors, consultants, advisors and collaborators are required to enter into confidentiality agreements. These agreements might not provide effective protection for the trade secrets, know-how or other proprietary information in the event of any unauthorized use, misappropriation or disclosure of such trade secrets, know-how or other proprietary information. Implementation of intellectual property-related laws in China has historically been lacking, primarily because of ambiguities in the PRC laws and difficulties in enforcement. Accordingly, intellectual property rights and confidentiality protections in China may not be as effective as those in the United States or other developed countries, and infringement of intellectual property rights continues to pose a serious risk of doing business in China. Policing unauthorized use of proprietary technology is difficult and expensive. The steps we have taken may be inadequate to prevent the misappropriation of our proprietary technology. Reverse engineering, unauthorized copying, other misappropriation, or negligent or accidental leakage of our proprietary technologies could enable third parties to benefit from our technologies without obtaining our consent or paying us for doing so, which could harm our business and competitive position. Though we are not currently involved in any litigation with respect to intellectual property, we may need to enforce our intellectual property rights through litigation. Litigation relating to our intellectual property may not prove successful and might result in substantial costs and diversion of resources and management attention.
We may face intellectual property infringement claims that could be time-consuming and costly to defend. If we fail to defend ourselves against such claims, we may lose significant intellectual property rights and may be unable to continue providing our existing services.
Our success largely depends on our ability to use and develop our technology and services without infringing the intellectual property rights of third parties, including patents, copyrights, trade secrets and trademarks. We may be subject to litigation involving claims of patent infringement or violation of other intellectual property rights of third parties. We typically indemnify clients who purchase our services and solutions against potential infringement of intellectual property rights underlying our services and solutions, which subject us to the risk of indemnification claims. The holders of patents and other intellectual property rights potentially relevant to our service offerings may make it difficult for us to acquire a license on commercially acceptable terms. Also, we may be unaware of intellectual property registrations or applications relating to our services that may give rise to potential infringement claims against us. There may also be technologies licensed to and relied on by us that are subject to infringement or other corresponding allegations or claims by third parties which may damage our ability to rely on such technologies. We are subject to additional risks as a result of our recent and proposed acquisitions and the hiring of new employees who may misappropriate intellectual property from their former employers. Parties making infringement claims may be able to obtain an injunction to prevent us from delivering our services or using technology involving the allegedly infringing intellectual property. Intellectual property litigation is expensive and time-consuming and could divert management’s attention from our business. A successful infringement claim against us, whether with or without merit, could, among others things, require us to pay substantial damages, develop non-infringing technology, or re-brand our name or enter into royalty or license agreements that may not be available on acceptable terms, if at all, and cease making, licensing or using products that have infringed a third party’s intellectual property rights. Protracted litigation could also result in existing or potential clients deferring or limiting their purchase or use of our products until resolution of such litigation, or could require us to indemnify our clients against infringement claims in certain instances. Any intellectual property claim or litigation in this area, whether we ultimately win or lose, could damage our reputation and have a material adverse effect on our business, results of operations or financial condition.
We may need additional capital and any failure by us to raise additional capital on terms favorable to us, or at all, could limit our ability to grow our business and develop or enhance our service offerings to respond to market demand or competitive challenges.
We believe that our current cash and cash flow from operations should be sufficient to meet our anticipated cash needs for at least the next 12 months. We may, however, require additional cash resources due to changed business conditions or other future developments, including any investments or acquisitions we may decide to pursue. In connection with the formation of ISST together with Huawei, we agreed that ISST will not pay dividends for the first three years after its inception, which restricts our ability to get cash out of ISST and, as a result, we need to raise additional capital to fund our other businesses. If our cash resources cannot satisfy our cash requirements, we may seek to sell additional equity or debt securities or obtain a credit facility. The sale of additional equity securities could result in dilution to our shareholders. The incurrence of indebtedness would result in increased debt service obligations and could require us to agree to operating and financing covenants that would restrict our operations. Our ability to obtain additional capital on acceptable terms is subject to a variety of uncertainties, including:
| | • | | investors’ perception of, and demand for, securities of technology services outsourcing companies; |
| | • | | conditions of the U.S. and other capital markets in which we may seek to raise funds; |
17
| | • | | our future results of operations and financial condition; |
| | • | | PRC government regulation of foreign investment in China; |
| | • | | economic, political and other conditions in China; and |
| | • | | PRC government policies relating to the borrowing and remittance outside China of foreign currency. |
Financing may not be available in amounts or on terms acceptable to us, if at all. Any failure by us to raise additional funds on terms favorable to us, or at all, could limit our ability to grow our business and develop or enhance our product and service offerings to respond to market demand or competitive challenges.
A significant percentage of our outstanding ordinary shares is held by a small number of our existing shareholders, and these shareholders may have significantly greater influence on us and our corporate actions by nature of the size of their shareholdings relative to our public shareholders.
As of March 31, 2013, our founder, chairman and chief executive officer Tianwen Liu beneficially owned approximately 11.7% of our outstanding ordinary shares; and AsiaVest Opportunities Fund IV owned approximately 13.4% of our outstanding ordinary shares. These major shareholders will continue to have significant influence in determining the outcome of any corporate transactions or other matters submitted to our shareholders for approval, including mergers, consolidations and schemes of arrangement, election and removal of directors and other significant corporate actions. They may not act in the best interests of our minority shareholders. In addition, without the consent of these major shareholders, we could be prevented from entering into transactions that could be beneficial to us. This concentration of ownership may also discourage, delay or prevent a change in control of our company, which could deprive our shareholders of an opportunity to receive a premium for their shares as part of a sale of our company and might reduce the price of our ADSs. These actions may be taken even if they are opposed by our other shareholders.
Failure to adhere to regulations that govern our clients’ businesses could result in breaches of contracts with our clients. Failure to adhere to the regulations that govern our business could result in our being unable to effectively perform our services.
Our clients’ business operations are subject to certain rules and regulations in China or elsewhere. Our clients may contractually require that we perform our services in a manner that would enable them to comply with such rules and regulations. Failure to perform our services in such a manner could result in breaches of contract with our clients and, in some limited circumstances, civil fines and criminal penalties for us. In addition, we are required under various Chinese laws to obtain and maintain permits and licenses to conduct our business. If we do not maintain our licenses or other qualifications to provide our services, we may not be able to provide services to existing clients or be able to attract new clients and could lose revenues, which could have a material adverse effect on our business and results of operations.
We may incur losses resulting from business interruptions resulting from occurrence of natural disasters, health epidemics and other outbreaks or events.
Our operational facilities may be damaged in natural disasters such as earthquakes, floods, heavy rains, sand storms, tsunamis and cyclones, or other events such as fires. Such natural disasters or other events may lead to disruption of information systems and telephone service for sustained periods. Damage or destruction that interrupts our provision of outsourcing services could damage our relationships with our clients and may cause us to incur substantial additional expenses to repair or replace damaged equipment or facilities. We may also be liable to our clients for disruption in service resulting from such damage or destruction. Prolonged disruption of our services as a result of natural disasters or other events may also entitle our clients to terminate their contracts with us. We currently do not have insurance against business interruptions. In March 2011, Japan was struck by a 9.0-magnitude earthquake, which resulted in a tsunami and damaged nuclear power plants, among other negative effects. In 2011, our net revenues from Japan grew slower than our other geographic markets as a result of certain projects being postponed from 2011 to 2012 due to the earthquake and tsunami. The existing and potential further radiation release from the damaged nuclear power plants in the earthquake and tsunami may result in additional adverse effects on our operations and those of our clients in Japan in the future.
In addition, our business could be adversely affected by the effects of H7N9, or avian flu, H1N1, or swine flu, severe acute respiratory syndrome, or SARS, or another epidemic or outbreak. Any prolonged occurrence of swine flu, avian flu, SARS or other adverse public health developments in China or elsewhere in the world may have a material adverse effect on our business operations. Our operations may be impacted by a number of health-related factors, including, among other things, quarantines or closures of our facilities, which could severely disrupt our operations, the sickness or death of our key officers and employees, and a general slowdown in the Chinese economy. Any of these events or other unforeseen consequences of public health problems could adversely affect our business and results of operations.
Fluctuation in the value of the Renminbi and other currencies may have a material adverse effect on the value of your investment.
Our financial statements are expressed in U.S. dollars. However, a majority of our revenues and expenses are denominated in Renminbi. Our exposure to foreign exchange risk primarily relates to the limited cash denominated in currencies other than the functional currencies of each entity and limited revenue contracts dominated in Japanese Yen in certain PRC operating entities. We do not believe that we currently have any significant direct foreign exchange risk and have not hedged exposures denominated in foreign currencies or any other derivative financial instruments. However, the value of our ADSs will be affected by the foreign exchange rate between U.S. dollars and Renminbi because the primary value of our business is effectively denominated in Renminbi, while the ADSs are traded in U.S. dollars.
18
The value of the Renminbi against the U.S. dollar and other currencies is affected by, among other things, changes in China’s political and economic conditions and China’s foreign exchange policies. The People’s Bank of China regularly intervenes in the foreign exchange market to limit fluctuations in Renminbi exchange rate and achieve certain exchange rate targets, and through such intervention kept the U.S. dollar-Renminbi exchange rate relatively stable for almost two years from July 2008. On June 20, 2010, the People’s Bank of China announced that the PRC government would further reform the Renminbi exchange rate regime and increase the flexibility of the exchange rate. Since that time, the Renminbi has gradually appreciated against the U.S. dollar. The People’s Bank of China recently announced that it expanded the daily RMB against U.S. dollar trading band of the inter-bank spot foreign exchange market from 0.5% to 1% as of April 16, 2012, to allow Renminbi to move more freely and better reflect market supply and demand. The wider trading band of the exchange rate, as well as other more flexible currency policies that may be adopted by the PRC government could result in greater fluctuation of the Renminbi against the U.S. dollar.
As we may rely on dividends paid to us by our PRC subsidiaries, any significant revaluation of the Renminbi may have a material adverse effect on our revenues and financial condition, and the value of any dividends payable on our ADSs in foreign currency terms. For example, to the extent that we need to convert U.S. dollars into Renminbi for our operations, appreciation of the Renminbi against the U.S. dollar would have an adverse effect on the Renminbi amount we receive from the conversion. Conversely, if we decide to convert our Renminbi into U.S. dollars for the purpose of making payments for dividends on our shares or ADSs or for other business purposes, appreciation of the U.S. dollar against the Renminbi would have a negative effect on the U.S. dollar amount available to us. Furthermore, appreciation or depreciation in the value of the Renminbi relative to the U.S. dollar would affect our financial results reported in U.S. dollar terms without giving effect to any underlying change in our business or results of operations.
We incurred a net foreign exchange gain of $0.4 million, a net foreign exchange loss of $0.5 million and a net foreign exchange loss of $0.6 million in 2010, 2011 and 2012, respectively. We cannot predict the impact of future exchange rate fluctuations on our results of operations and may incur net foreign exchange losses in the future. In addition, our foreign currency exchange losses may be magnified by PRC exchange control regulations that restrict our ability to convert Renminbi into foreign currencies.
Legislation in certain countries in which we have clients, particularly the United States, Japan and various European countries, may restrict companies in those countries from outsourcing work to us.
IT offshore outsourcing is a politically sensitive issue in the United States, Europe and Japan. For example, many organizations and public figures in the United States and Europe have publicly expressed concern about a perceived association between offshore outsourcing providers and the loss of jobs in their home countries. A number of U.S. states have passed legislation that restricts state government entities from outsourcing certain work to offshore service providers. Other U.S. federal and state legislation has been proposed that, if enacted, would provide tax disincentives for offshore outsourcing or require disclosure of jobs outsourced abroad. Similar legislation could be enacted in Europe, Japan and other countries in which we have clients. Any expansion of existing laws or the enactment of new legislation restricting or discouraging offshore outsourcing by companies in the United States, Europe, Japan or other countries in which we have clients could adversely impact our business operations and financial results. In addition, from time to time there has been publicity about negative experiences associated with offshore outsourcing, such as theft and misappropriation of sensitive client data. As a result, current or prospective clients may elect to perform such services themselves or may be discouraged in transferring these services from onshore to offshore providers. Any slowdown or reversal of existing industry trends towards offshore outsourcing in response to political pressure or negative publicity would harm our ability to compete effectively with competitors that operate out of onshore facilities and adversely affect our business and financial results.
Restrictions on immigration may affect our ability to compete for and provide services to clients in the United States or other countries, which could hamper our growth and cause our revenues to decline.
The vast majority of our employees are Chinese nationals. Some of our projects require a portion of the work to be undertaken at our clients’ facilities which are sometimes located outside of China. The ability of our professionals to work in the United States, Canada, Europe, Japan, Korea and other countries outside of China depends on their ability to obtain the necessary visas and work permits. Historically, the process for obtaining visas for PRC nationals to certain countries, including the United States and Japan, has been lengthy and cumbersome. We have in the past experienced delays and rejections when applying for business visas to the United States for some of our personnel. Immigration laws in the United States and in other countries are subject to legislative change, as well as to variations in standards of application and enforcement due to political forces and economic conditions. Particularly given the recent global economic slowdown, it is possible that there could be a change in the existing laws or the enactment of new legislation imposing restrictions on the deployment of work visa holders at client locations, which may adversely impact our ability to do business in the jurisdictions in which we have clients. However, it is generally difficult to predict the political and economic events that could affect immigration laws, or the restrictive impact they could have on obtaining or maintaining business visas for our employees. Our reliance on visas for a number of employees makes us vulnerable to such changes and variations as it affects our ability to staff projects with professionals who are not citizens of the country where the work is to be performed. As a result, we may not be able to obtain a sufficient number of visas for our employees or we may encounter delays or additional costs in obtaining or maintaining such visas in which case we may not be able to provide services to our clients on a timely and cost-effective basis or manage our sales and delivery centers as efficiently as we otherwise could, any of which could adversely affect our business and results of operations.
19
Disruptions in telecommunications or significant failure in our IT systems could harm our service model, which could result in a reduction of our revenue.
A significant element of our business strategy is to continue to leverage and expand our sales and delivery centers strategically located in China. We believe that the use of a strategically located network of sales and delivery centers will provide us with cost advantages, the ability to attract highly skilled personnel in various regions of the country and the world, and the ability to service clients on a regional and global basis. Part of our service model is to maintain active voice and data communications, financial control, accounting, customer service and other data processing systems between our main offices in Beijing, our clients’ offices, and our other deliveries centers and support facilities. Our business activities may be materially disrupted in the event of a partial or complete failure of any of these IT or communication systems, which could be caused by, among other things, software malfunction, computer virus attacks, conversion errors due to system upgrading, damage from fire, earthquake, power loss, telecommunications failure, unauthorized entry or other events beyond our control. Loss of all or part of the systems for a period of time could hinder our performance or our ability to complete client projects on time which, in turn, could lead to a reduction of our revenue or otherwise have a material adverse effect on our business and business reputation. We may also be liable to our clients for breach of contract for interruptions in service.
Our computer networks may be vulnerable to security risks that could disrupt our services and adversely affect our results of operations.
Our computer networks may be vulnerable to unauthorized access, computer hackers, computer viruses and other security problems caused by unauthorized access to, or improper use of, systems by third parties or employees. A hacker who circumvents security measures could misappropriate proprietary information or cause interruptions or malfunctions in our operations. Although we intend to continue to implement security measures, computer attacks or disruptions may jeopardize the security of information stored in and transmitted through our computer systems. Actual or perceived concerns that our systems may be vulnerable to such attacks or disruptions may deter our clients from using our solutions or services. As a result, we may be required to expend significant resources to protect against the threat of these security breaches or to alleviate problems caused by these breaches.
Data networks are also vulnerable to attacks, unauthorized access and disruptions. For example, in a number of public networks, hackers have bypassed firewalls and misappropriated confidential information. It is possible that, despite existing safeguards, an employee could misappropriate our clients’ proprietary information or data, exposing us to a risk of loss or litigation and possible liability. Losses or liabilities that are incurred as a result of any of the foregoing could have a material adverse effect on our business.
Our insurance coverage may be inadequate to protect us against losses.
Although we maintain professional liability insurance and property insurance coverage for certain of our facilities and equipment, we do not have any loss of data or business interruption insurance coverage for our operations. If any claims for injury are brought against us, or if we experience any business disruption, litigation or natural disaster, we might incur substantial costs and diversion of resources.
We have incurred, and may continue to incur, significant share-based compensation expenses which could adversely impact our net income.
We have granted certain options, restricted shares and share units under our share incentive plans and granted nonvested shares in connection with certain other share-based compensation arrangements in the past, as a result of which we have recorded $8.5 million, $9.3 million and $11.1 million as share-based compensation expenses for the years ended December 31, 2010, 2011 and 2012.
U.S. GAAP prescribes how we account for share-based compensation which may have an adverse or negative impact on our results of operations or the price of our ADSs. U.S. GAAP requires us to recognize share-based compensation as compensation expense in the statement of operations generally based on the fair value of equity awards on the date of the grant, with compensation expense recognized over the period in which the recipient is required to provide service in exchange for the equity award. The expenses associated with share-based compensation may reduce the attractiveness of issuing share options, share units, restricted shares and nonvested shares. However, if we do not grant share options, share units, restricted shares or nonvested shares, or reduce the number of share options, share units, restricted shares or nonvested shares we grant, we may not be able to attract and retain key personnel. If we grant more share options, share units, restricted shares or nonvested shares or other share-based compensation arrangements to attract and retain key personnel, the expenses associated with share-based compensation may adversely affect our net income.
Risks Related to Doing Business in China
Adverse changes in political, economic and other policies of the Chinese government could have a material adverse effect on the overall economic growth of China, which could materially and adversely affect the growth of our business and our competitive position.
The majority of our business operations are conducted in China. Accordingly, our business, financial condition, results of operations and prospects are affected significantly by economic, political and legal developments in China. Although the PRC economy has been transitioning from a planned economy to a more market-oriented economy since the late 1970s, the PRC government continues to exercise significant control over China’s economic growth through direct allocation of resources, monetary and tax policies, and a host of other government policies such as those that encourage or restrict investment in certain industries by foreign investors, control the exchange between the Renminbi and foreign currencies, and regulate the growth of the general or specific market. While the Chinese economy has experienced significant growth in the past 30 years, growth has been uneven, both geographically and among various sectors of the economy. Furthermore, as the PRC economy has become increasingly linked with the global economy, China is affected in various respects by downturns and recessions of major economies around the world. The economic and policy measures enacted by the PRC government to forestall economic downturns or bolster China’s economic growth could materially affect our business. Any adverse change in the economic conditions in China, in policies of the PRC government or in laws and regulations in China could have a material adverse effect on the overall economic growth of China and market demand for our outsourcing services. Such developments could adversely affect our businesses, lead to reduction in demand for our services and adversely affect our competitive position.
20
Uncertainties with respect to the PRC legal system could have a material adverse effect on us.
The PRC legal system is based on written statutes. Prior court decisions may be cited for reference but have limited precedential value. Since the late 1970s, the PRC government has been building a comprehensive system of laws and regulations governing economic matters in general. The overall effect has been to significantly enhance the protections afforded to various forms of foreign investments in China. We conduct our business primarily through our subsidiaries established in China. These subsidiaries are generally subject to laws and regulations applicable to foreign investment in China. However, since these laws and regulations are relatively new and the PRC legal system continues to rapidly evolve, the interpretations of many laws, regulations and rules are not always uniform and enforcement of these laws, regulations and rules involves uncertainties, which may limit legal protections available to us. In addition, some regulatory requirements issued by certain PRC government authorities may not be consistently applied by other government authorities (including local government authorities), thus making strict compliance with all regulatory requirements impractical, or in some circumstances impossible. For example, we may have to resort to administrative and court proceedings to enforce the legal protection that we enjoy either by law or contract. However, since PRC administrative and court authorities have discretion in interpreting and implementing statutory and contractual terms, it may be more difficult to predict the outcome of administrative and court proceedings and the level of legal protection we enjoy than in more developed legal systems. These uncertainties may impede our ability to enforce the contracts we have entered into with our business partners, clients and suppliers. In addition, such uncertainties, including any inability to enforce our contracts, together with any development or interpretation of PRC law that is adverse to us, could materially and adversely affect our business and operations. Furthermore, intellectual property rights and confidentiality protections in China may not be as effective as in the United States or other more developed countries. We cannot predict the effect of future developments in the PRC legal system, including the promulgation of new laws, changes to existing laws or the interpretation or enforcement thereof, or the preemption of local regulations by national laws. These uncertainties could limit the legal protections available to us and other foreign investors, including you. In addition, any litigation in China may be protracted and result in substantial costs and diversion of our resources and management attention.
Our failure to obtain the prior approval of the China Securities Regulatory Commission, or the CSRC, of the listing and trading of our ADSs on the NYSE could have a material adverse effect on our business, results of operations and reputation and the trading price of our ADSs.
On August 8, 2006, six PRC regulatory agencies, including the CSRC, promulgated a regulation that became effective on September 8, 2006. This regulation, among other things, has provisions that purport to require that an offshore special purpose vehicle, or SPV, formed for listing purposes and controlled directly or indirectly by PRC companies or individuals obtain the approval of the CSRC prior to the listing and trading of such SPV’s securities on an overseas stock exchange. On September 21, 2006, the CSRC published on its official website procedures specifying documents and materials required to be submitted to it by SPVs seeking CSRC approval of their overseas listings.
We completed the initial listing and trading of our ADSs on the NYSE on December 14, 2010. We did not seek CSRC approval in connection with our initial public offering. However, the application of this PRC regulation remains unclear, with no consensus currently existing among the leading PRC law firms regarding the scope and applicability of the CSRC approval requirement.
Our PRC counsel, Han Kun Law Offices, advised us that because we completed our restructuring for the initial public offering before September 8, 2006, the effective date of the new regulation, and iSoftStone Information Technology (Group) Co., Ltd., or iSoftStone WFOE, was not established through merger or acquisition, it was not necessary for us to submit the application to the CSRC for its approval, and the listing and trading of our ADSs on the NYSE did not require CSRC approval. A copy of Han Kun Law Offices’ legal opinion regarding this PRC regulation is filed as an exhibit to our registration statement on Form F-1 in connection with our initial public offering, which is available at the SEC website at www.sec.gov.
If the CSRC or another PRC regulatory agency subsequently determines that CSRC approval was required for our initial public offering, we may face regulatory actions or other sanctions from the CSRC or other PRC regulatory agencies. These regulatory agencies may impose fines and penalties on our operations in the PRC, limit our operating privileges in the PRC, delay or restrict the repatriation of the proceeds from our initial public offering into the PRC or take other actions that could have a material adverse effect on our business, financial condition, results of operations, reputation and prospects, as well as the trading price of our ADSs. Any uncertainties and negative publicity regarding this CSRC approval requirement could also have a material adverse effect on the trading price of our ADSs.
21
We face uncertainty regarding the PRC tax reporting obligations and consequences for certain indirect transfers of the stock of our operating company.
Pursuant to the Notice on Strengthening Administration of Enterprise Income Tax for Share Transfers by Non-PRC Resident Enterprises issued by the PRC State Administration of Taxation on December 10, 2009, or Circular 698, where a foreign investor transfers the equity interests of a PRC resident enterprise indirectly by way of the sale of equity interests of an overseas holding company, or an Indirect Transfer, and such overseas holding company is located in a tax jurisdiction that: (i) has an effective tax rate less than 12.5% or (ii) does not tax foreign income of its residents, the foreign investor should report such Indirect Transfer to the competent tax authority of the PRC resident enterprise. The PRC tax authority will examine the true nature of the Indirect Transfer, and if the tax authority considers that the foreign investor has adopted an abusive arrangement in order to avoid PRC tax, they will disregard the existence of the overseas holding company and re-characterize the Indirect Transfer and as a result, gains derived from such Indirect Transfer may be subject to PRC withholding tax. In addition, the PRC resident enterprise is supposed to provide necessary assistance to support the enforcement of Circular 698.
At present, the PRC tax authorities will neither confirm nor deny that they would enforce Circular 698, in conjunction with other tax collection and tax withholding rules, to make claims against our PRC subsidiary as being indirectly liable for unpaid taxes, if any, arising from Indirect Transfers by shareholders who did not obtain their shares in the public offering of our shares.
PRC regulations relating to the establishment of offshore special purpose companies by PRC residents may subject our PRC resident shareholders to personal liability and limit our ability to acquire PRC companies or to inject capital into our PRC subsidiaries, limit our PRC subsidiaries’ ability to distribute profits to us, or otherwise materially and adversely affect us.
The PRC State Administration of Foreign Exchange, or SAFE, issued a public notice in 2005 known as Circular 75 that requires PRC residents, including both legal persons and natural persons, to register with an appropriate local SAFE branch before establishing or controlling any company outside of China, referred to as an offshore special purpose company, for the purpose of acquiring any assets of or equity interest in PRC companies and raising funds from overseas. When a PRC resident contributes the assets or equity interests it holds in a PRC company into the offshore special purpose company, or engages in overseas financing after contributing such assets or equity interests into the offshore special purpose company, such PRC resident must modify its SAFE registration in light of its interest in the offshore special purpose company and any change thereof. In addition, any PRC resident that is the shareholder of an offshore special purpose company is required to amend its SAFE registration with the local SAFE branch with respect to that offshore special purpose company in connection with any increase or decrease of capital, transfer of shares, merger, division, equity investment or creation of any security interest over any assets located in China. If these shareholders fail to comply, the PRC subsidiaries of the offshore special purpose company may be prohibited from distributing their profits and proceeds from any reduction in capital, share transfer or liquidation to their offshore parent company and the offshore parent company may be restricted in its ability to contribute additional capital into its PRC subsidiaries. Moreover, failure to comply with the above SAFE registration requirements could result in liabilities under PRC laws for evasion of foreign exchange restrictions.
We are committed to complying with the Circular 75 requirements and to ensuring that our shareholders who are PRC citizens or residents comply with them. We believe that all of our current PRC citizen or resident shareholders and beneficial owners are in compliance in all material respects with the applicable SAFE Circular 75 requirements. However, we may not at all times be fully aware or informed of the identities of all our beneficial owners who are PRC citizens or residents, and we may not always be able to compel our beneficial owners to comply with the Circular 75 requirements. As a result, we cannot assure you that all of our shareholders or beneficial owners who are PRC citizens or residents will at all times comply with, or in the future make or obtain any applicable registrations or approvals required by, Circular 75 or other related regulations. Failure by any such shareholders or beneficial owners to comply with Circular 75 could subject us to fines or legal sanctions, restrict our overseas or cross-border investment activities, limit our PRC subsidiaries’ ability to make distributions or pay dividends or affect our ownership structure, which could adversely affect our business and prospects.
In addition, the PRC National Development and Reform Commission promulgated a rule in 2004 requiring its approval for overseas investment projects made by PRC entities. However, there exist extensive uncertainties as to the interpretation of this rule with respect to its application to a PRC individual’s overseas investment and, in practice, we are not aware of any precedents that a PRC individual’s overseas investment has been either approved by the National Development and Reform Commission or challenged by the National Development and Reform Commission based on the absence of its approval. Our current beneficial owners who are PRC individuals did not apply for the approval of the National Development and Reform Commission for their investment in us. We cannot predict how and to what extent this will affect our business operations or future strategy.
22
We may be subject to fines and legal sanctions imposed by SAFE or other Chinese government authorities if we or our domestic employees or directors fail to comply with the PRC regulations relating to employee stock incentive plans adopted by companies for domestic employees.
On December 25, 2006, the People’s Bank of China issued the Administration Measures on Individual Foreign Exchange Control, or the PBOC Regulation. On January 5, 2007, the SAFE issued the Implementation Rules for the PBOC Regulation. Both of these regulations became effective on February 1, 2007. According to these regulations, all foreign exchange matters relating to employee stock holding plans, share option plans or similar plans of overseas-listed companies with domestic employees’ participation require approval from the SAFE or its local branch. In February 2012, the SAFE promulgated the Notice on Issues concerning the Foreign Exchange Administration for Domestic Individuals Participating in Stock Incentive Plan of Overseas-Listed Company, or the Stock Option Rule, which terminated the Application Procedures of Foreign Exchange Administration for Domestic Individuals Participating in Employee Stock Holding Plan or Stock Option Plan of Overseas-Listed Company issued by the SAFE on March 28, 2007. Under the Stock Option Rule, domestic employees who participate in any stock incentive plan, including employee stock holding plans, share option plans or similar plans in an overseas-listed company, are required to register with the relevant local SAFE branch and complete certain other procedures through a PRC agent. Under the Stock Option Rule: (i) domestic employees include PRC citizens (inclusive of Hong Kong, Macau and Taiwan nationals) and foreign nationals who have continuously resided in China for at least a year, and (ii) a PRC agent may be a domestic company participating in the stock incentive plan or a domestic institution that is qualified to engage in asset custodian business and has been duly designated by a domestic company. We are an overseas-listed company and as a result we and our domestic employees who have been granted share options or shares under our 2008 Share Incentive Plan, 2009 Share Incentive Plan and 2010 Performance Incentive Plan are subject to the Stock Option Rule. We are in the process of filing with the relevant local SAFE branch and undertaking certain other procedures according to the Stock Option Rule. Failure to comply with these regulations may subject us to fines or other legal sanctions imposed by the SAFE or other Chinese government authorities. In addition, the Ministry of Finance and the State Administration of Taxation has issued certain circulars concerning employee share options. Pursuant to these circulars, our employees working in China who exercise share options will be subject to PRC individual income tax. Our PRC subsidiaries have an obligation to file documents related to employee share options with the relevant tax authorities and withhold individual income taxes resulting from the exercise of their share options. If our employees fail to pay and we fail to withhold their income taxes, we may face sanctions imposed by tax authorities or other relevant PRC government authorities. See “Item 4. Information on the Company—Regulation—Regulations on Employee Share Options.”
PRC regulation of loans and direct investment by offshore holding companies to PRC entities may delay or prevent us from using the proceeds of future offerings to make loans or additional capital contributions to our PRC subsidiaries, which could materially and adversely affect our liquidity and our ability to fund and expand our business.
In utilizing the proceeds from any future offerings, as an offshore holding company of our PRC subsidiaries, we may make loans to our PRC subsidiaries and controlled PRC affiliate, or we may make additional capital contributions to our PRC subsidiaries. Any loans to our PRC subsidiaries or controlled PRC affiliate are subject to PRC regulations and approvals. For example, loans by us to our PRC subsidiaries in China, each of which is a foreign-invested enterprise, to finance their activities cannot exceed statutory limits and must be registered with SAFE or its local counterpart. Loans by us to our controlled PRC affiliate, Beijing iSoftStone, which is a domestic PRC entity, must be approved by the relevant government authorities and must also be registered with SAFE or its local counterpart.
We may also decide to finance our PRC subsidiaries through capital contributions. These capital contributions must be approved by the Ministry of Commerce in China or its local counterpart. We cannot assure you that we will be able to obtain these government registrations or approvals on a timely basis, if at all, with respect to future loans by us to our PRC subsidiaries or controlled PRC affiliate or capital contributions by us to our subsidiaries or any of their respective subsidiaries. If we fail to receive such registrations or approvals, our ability to use the proceeds of the public offering and to capitalize our PRC operations may be negatively affected, which could adversely and materially affect our liquidity and our ability to fund and expand our business.
In 2008, SAFE promulgated Circular 142, a notice regulating the conversion by a foreign-invested enterprise of foreign currency into Renminbi by restricting how the converted Renminbi may be used. Circular 142 requires that Renminbi converted from the foreign currency-denominated capital of a foreign-invested enterprise may only be used for purposes within the business scope approved by the applicable governmental authority and may not be used for equity investments within the PRC unless specifically provided for otherwise in its business scope. In addition, SAFE strengthened its oversight of the flow and use of Renminbi funds converted from the foreign currency-denominated capital of a foreign-invested enterprise. The use of such Renminbi may not be changed without approval from SAFE, and may not be used to repay Renminbi loans if the proceeds of such loans have not yet been used for purposes within the foreign-invested enterprise’s approved business scope.
We cannot assure you that we will be able to complete the necessary government registrations or obtain the necessary government approvals on a timely basis, if at all, with respect to future loans by us to our PRC subsidiaries or controlled PRC affiliate or with respect to future capital contributions by us to our PRC subsidiaries. If we fail to complete such registrations or obtain such approvals, our ability to use the proceeds we receive from the public offering and to capitalize or otherwise fund our PRC operations may be negatively affected, which could adversely and materially affect our liquidity and our ability to fund and expand our business.
23
Governmental control of currency conversion may limit our ability to use our revenues effectively and the ability of our PRC subsidiaries to obtain financing.
The PRC government imposes control on the convertibility of the Renminbi into foreign currencies and, in certain cases, the remittance of currency out of China. We receive a majority of our revenues in Renminbi, which currently is not a freely convertible currency. Restrictions on currency conversion imposed by the PRC government may limit our ability to use revenues generated in Renminbi to fund our expenditures denominated in foreign currencies or our business activities outside of China. Under China’s existing foreign exchange regulations, Renminbi may be freely converted into foreign currency for payments relating to current account transactions, which include among other things dividend payments and payments for the import of goods and services, by complying with certain procedural requirements. Pursuant to the relevant regulations, a company applying for the remittance of dividends should provide to the bank handling the remittance: (i) proof of taxes paid, (ii) an audit report on the status of dividends, (iii) the relevant company’s foreign exchange registration certificate, (iv) a capital verification report issued by an accounting firm, and (v) an audit report on the company’s financial condition during the current year. These procedural requirements generally do not pose any risk to a wholly foreign-owned company’s ability to remit dividends to its offshore parent. Although the Renminbi has been fully convertible for current account transaction since 1996, we cannot assure you that the PRC government will not take measures in the future to restrict access to foreign currencies for current account transactions.
Conversion of Renminbi into foreign currencies, and of foreign currencies into Renminbi, for payments relating to capital account transactions, which include among other things investments, loans and acquisitions of land and other fixed assets overseas, generally requires the approval of SAFE and other relevant PRC governmental authorities. Restrictions on the convertibility of the Renminbi for capital account transactions could affect the ability of our PRC subsidiaries to make investments overseas or to obtain foreign currency through debt or equity financing, including by means of loans or capital contributions from us. In particular, if iSoftStone WFOE borrows foreign currency from us or other foreign lenders, it must do so within approved limits that satisfy their approval documentation and PRC debt to equity ratio requirements. Further, such loans must be registered with SAFE or its local counterpart. We cannot assure you that the registration process will not delay or prevent our conversion of Renminbi for use outside of China.
The discontinuation or revocation of the preferential tax treatments and government incentives available to us could decrease our net income and materially and adversely affect our financial condition and results of operations.
Our PRC subsidiaries are incorporated in the PRC and are governed by PRC income tax laws and regulations. Prior to January 1, 2008, entities established in the PRC were generally subject to a 30% national and 3% local enterprise income tax rate. Various preferential tax treatments promulgated by national tax authorities were available to foreign-invested enterprises or high or new technology enterprises located in certain high-tech zones of China. Under the Enterprise Income Tax Law effective on January 1, 2008, the PRC has adopted a uniform enterprise income tax rate of 25% for all PRC enterprises (including foreign-invested enterprises) and revoked the previous tax exemption, reduction and preferential treatments applicable to foreign-invested enterprises. However, the Enterprise Income Tax Law also permits enterprises to continue to enjoy their existing tax incentives, adjusted by certain transitional phase-out rules, under which enterprises established before the promulgation date of the Enterprise Income Tax Law that were granted tax holidays under the then effective tax laws or regulations may continue to enjoy their tax holidays until their expiration. The Enterprise Income Tax Law also introduced a new preferential rate of 15% for high-tech enterprises. iSoftStone WFOE and Shanghai Kangshi Information System Co., Ltd., or Shanghai Kangshi, obtained the qualification certificates of high-tech enterprises under the Enterprise Income Tax Law in 2008 with a valid period of three years from 2008 to 2010. As a result, iSoftStone WFOE and Shanghai Kangshi are eligible to enjoy a preferential tax rate of 15% as long as they maintain their qualification as a high-tech enterprise. iSoftStone WFOE and Shanghai Kangshi renewed their respective qualification certificate of high-tech enterprises in 2011. The continued qualification of the high-tech enterprise status is subject to annual evaluation and a three-year review and renewal by the relevant government authorities in China. In addition, iSoftStone WFOE, as an enterprise established before the promulgation date of the Enterprise Income Tax Law, is entitled to enjoy its exemption of enterprise income tax in 2008 and 50% tax reduction in 2009, 2010 and 2011. The local tax bureau has confirmed that the 50% reduction may be applied to the 15% preferential rate that iSoftStone WFOE enjoys as a qualified high-tech enterprise, notwithstanding a tax circular issued by the State Administration of Taxation that deals with whether these tax benefits are mutually exclusive. We cannot assure you that the tax authorities will not change their position. As a result of the foregoing preferential tax treatments and its continuous qualification as a high-tech enterprise, iSoftStone WFOE was exempted from enterprise income tax for 2008, and was subject to enterprise income taxes of 7.5% for the years 2009 to 2011 and 15% for the year 2012, respectively. Shanghai Kangshi as a qualified high-tech enterprise, was subject to enterprise income tax at a rate of 15% from 2008 to 2012. Other PRC subsidiaries of ours also enjoy a variety of tax benefits. See “Item 5.A. Operating and Financial Review and Prospects—Operating Results—Taxes and Incentives—China.”
The PRC tax policies, interpretations, and practices regarding the overlap, phase-out, and transition of preferential treatments are subject to continuous change and uncertainty. As such, we cannot assure you that our PRC subsidiaries will continue to qualify as high-tech enterprise under the new Enterprise Income Tax Law, enjoy preferential treatments under the phase-out rules, not encounter any challenges regarding past application of such treatments, or that the local tax authorities will not, in the future, change their position and revoke any of our past preferential tax treatments. The discontinuation of any of our preferential tax treatments could materially increase our tax obligations, and materially and adversely affect our financial condition and results of operations.
In addition, the PRC government has provided various incentives to companies in the software industry and to certain qualified technology related transactions in order to encourage developments of the software and technology related industries in China. A number of our PRC subsidiaries currently receive value-added tax, or VAT, refunds and business tax exemptions in addition to the preferential enterprise income tax treatments as described above. Incentives granted to us by PRC governmental authorities are subject to review and may be adjusted or revoked at any time in the future. The discontinuation or revocation of incentives currently available to us may materially and adversely affect our financial condition and results of operations.
24
We may be classified as a “resident enterprise” for PRC enterprise income tax purposes; such classification could result in unfavorable tax consequences to us and our non-PRC shareholders.
The Enterprise Income Tax Law provides that enterprises established outside of China whose “de facto management bodies” are located in China are considered PRC tax resident enterprises and will generally be subject to the uniform 25% PRC enterprise income tax rate on their global income and tax reporting obligations. In addition, a tax circular, or Circular 82, issued by the State Administration of Taxation on April 22, 2009 regarding the standards used to classify certain Chinese-controlled enterprises established outside of China as resident enterprises clarified that dividends and other income paid by such resident enterprises will be considered to be PRC source income, subject to PRC withholding tax, currently at a rate of 10%, when recognized by non-PRC enterprise shareholders. Circular 82 also subjects such resident enterprises to various reporting requirements with the PRC tax authorities. Under the implementation rules to the Enterprise Income Tax Law, a de facto management body is defined as a body that has material and overall management and control over the manufacturing and business operations, personnel and human resources, finances and other assets of an enterprise. In addition, Circular 82 details that certain Chinese-controlled enterprises will be classified as resident enterprises if the following are located or resident in China: senior management personnel and departments that are responsible for daily production, operation and management; financial and personnel decision making bodies; key properties, accounting books, company seal, and minutes of board meetings and shareholders’ meetings; and half or more of the senior management or directors having voting rights. On July 27, 2011, the State Administration of Taxation issued a supplemental tax circular, or Bulletin 45, which became effective on September 1, 2011, to provide further guidance on the implementation of Circular 82. Bulletin 45 clarifies certain issues related to determining PRC resident enterprise status, post-determination administration and which competent tax authorities are responsible for determining offshore incorporated PRC resident enterprise status. Bulletin 45 specifies that when provided with a copy of a Chinese tax resident determination certificate issued by the competent tax authorities from an offshore incorporated PRC resident enterprise, the payer should not withhold 10% withholding income tax when paying Chinese-sourced dividends, interest and royalties to the offshore incorporated PRC resident enterprise.
Currently, there are no detailed rules or precedents governing the procedures and specific criteria for determining de facto management bodies which are applicable to our company or our overseas subsidiary. Although the determining criteria set forth in Circular 82 and Bulletin 45 may reflect the State Administration of Taxation’s general position on how the “de facto management body” test should be applied in determining the tax resident status of offshore enterprises, Circular 82 and Bulletin 45 only apply to offshore enterprises controlled by PRC enterprises or PRC enterprise groups, not those controlled by individuals or foreign enterprises like us. Therefore, we do not currently consider our company or any of our overseas subsidiaries to be a PRC resident enterprise. However, if our company or any of our overseas subsidiaries is considered a PRC tax resident enterprise for PRC enterprise income tax purposes, a number of unfavorable PRC tax consequences could follow. First, our company or our overseas subsidiary will be subject to the uniform 25% enterprise income tax rate as to our global income as well as PRC enterprise income tax reporting obligations. Second, although under the Enterprise Income Tax Law and its implementing rules and Bulletin 45, dividends paid by a PRC tax resident enterprise to an offshore incorporated PRC tax resident enterprise controlled by a PRC enterprise or enterprise group would qualify as tax-exempted income, we cannot assure you that dividends paid to us from our PRC subsidiaries will not be subject to a 10% withholding tax, as the PRC foreign exchange control and tax authorities have not yet issued guidance with respect to the processing of outbound remittances to entities that are treated as resident enterprises for PRC enterprise income tax purposes but not controlled by PRC enterprise or enterprise group like us. Finally, dividends payable by us to our investors and gain on the sale of our shares may become subject to PRC withholding tax. It is possible that future guidance issued with respect to the new resident enterprise classification could result in a situation in which a withholding tax of 10% for our non-PRC enterprise investors or a potential withholding tax of 20% for non-PRC individual investors is imposed on dividends we pay to them and with respect to gains derived by such investors from transferring our shares or ADSs. In addition to the uncertainty in how the new resident enterprise classification could apply, it is also possible that the rules may change in the future, possibly with retroactive effect. If we are required under the Enterprise Income Tax law to withhold PRC income tax on our dividends payable to our foreign shareholders and ADS holders, or if you are required to pay PRC income tax on the transfer of our shares or ADSs under the circumstances mentioned above, the value of your investment in our shares or ADSs may be materially and adversely affected. It is unclear whether, if we are considered a PRC resident enterprise, holders of our shares or ADSs would be able to claim the benefit of income tax treaties or agreements entered into between China and other countries or areas.
We may rely on dividends paid by our subsidiaries for our cash needs, and any limitation on the ability of our subsidiaries to make payments to us could have a material adverse effect on our ability to conduct our business.
As a holding company, we conduct substantially all of our business through our consolidated subsidiaries incorporated in China. We may rely on dividends paid by these PRC subsidiaries for our cash needs, including the funds necessary to pay any dividends and other cash distributions to our shareholders, to service any debt we may incur and to pay our operating expenses. The payment of dividends by entities established in China is subject to limitations. Regulations in China currently permit payment of dividends only out of accumulated profits as determined in accordance with accounting standards and regulations in China. Each of our PRC subsidiaries is required to set aside at least 10% of its after-tax profit based on PRC accounting standards each year to its general reserves or statutory capital reserve fund until the aggregate amount of such reserves reaches 50% of its respective registered capital. In addition, under the related investment agreement, ISST is restricted in paying dividends and it is contemplated that all profits from ISST will be retained within ISST for at least three years. As a result, our PRC subsidiaries are restricted in their ability to transfer a portion of their net assets to us in the form of dividends. In addition, if any of our PRC subsidiaries incurs debt on its own behalf in the future, the instruments governing the debt may restrict its ability to pay dividends or make other distributions to us. Any limitations on the ability of our PRC subsidiaries to transfer funds to us could materially and adversely limit our ability to grow, make investments or acquisitions that could be beneficial to our business, pay dividends and otherwise fund and conduct our business.
25
Our current employment practices may be restricted under the PRC Labor Contract Law and our labor costs may increase as a result.
The PRC Labor Contract Law and its implementing rules impose requirements concerning contracts entered into between an employer and its employees and establishes time limits for probationary periods and for how long an employee can be placed in a fixed-term labor contract. Because the Labor Contract Law and its implementing rules have not been in effect very long and because there is lack of clarity with respect to their implementation and potential penalties and fines, it is uncertain how it will impact our current employment policies and practices. We cannot assure you that our employment policies and practices do not, or will not, violate the Labor Contract Law or its implementing rules and that we will not be subject to related penalties, fines or legal fees. If we are subject to large penalties or fees related to the Labor Contract Law or its implementing rules, our business, financial condition and results of operations may be materially and adversely affected.
In addition, according to the Labor Contract Law and its implementing rules, if we intend to enforce the non-compete provision with an employee in a labor contract or non-competition agreement, we have to compensate the employee on a monthly basis during the term of the restriction period after the termination or ending of the labor contract, which may cause extra expenses to us.
Furthermore, the Labor Contract Law and its implementation rules require certain terminations to be based upon seniority rather than merit, which significantly affects the cost of reducing workforce for employers. In the event we decide to significantly change or decrease our workforce in the PRC, the Labor Contract Law could adversely affect our ability to enact such changes in a manner that is most advantageous to our circumstances or in a timely and cost effective manner, thus our results of operations could be adversely affected.
The audit report included in this annual report are prepared by auditors who are not inspected by the Public Company Accounting Oversight Board and, as such, you are deprived of the benefits of such inspection.
Our independent registered public accounting firm that issues the audit reports included in our annual reports filed with the Securities and Exchange Commission, as auditors of companies that are traded publicly in the United States and a firm registered with the Public Company Accounting Oversight Board (United States) (the “PCAOB”), is required by the laws of the United States to undergo regular inspections by the PCAOB to assess its compliance with the laws of the United States and professional standards. Because our auditor is located in the Peoples’ Republic of China, a jurisdiction where the PCAOB is currently unable to conduct inspections without the approval of the Chinese authorities, our auditor is not currently inspected by the PCAOB.
Inspections of other firms that the PCAOB has conducted outside of China have identified deficiencies in those firms’ audit procedures and quality control procedures, which may be addressed as part of the inspection process to improve future audit quality. This lack of PCAOB inspections in China prevents the PCAOB from regularly evaluating our auditor’s audits and its quality control procedures. As a result, investors may be deprived of the benefits of PCAOB inspections.
The inability of the PCAOB to conduct inspections of auditors in China makes it more difficult to evaluate the effectiveness of our auditor’s audit procedures or quality control procedures as compared to auditors outside of China that are subject to PCAOB inspections. Investors may lose confidence in our reported financial information and procedures and the quality of our financial statements.
Recently, the SEC commenced administrative proceedings under Rule 102(e) of its Rules of Practice and also under the Sarbanes-Oxley Act of 2002 against the Chinese affiliates of the ‘‘big four’’ accounting firms, including our auditors, and also against BDO China Dahua. The Rule 102(e) proceedings initiated by the SEC relate to these firms’ failure to produce documents, including audit workpapers, to the request of the SEC pursuant to Section 106 of the Sarbanes-Oxley Act of 2002, as the auditors located in the PRC are not in a position lawfully to produce documents directly to the SEC because of restrictions under PRC law and specific directives issued by CSRC. As the administrative proceedings are ongoing, it is impossible to determine their outcome or the consequences thereof to us. The issues raised by the proceedings are not specific to our auditors. or to us, but affect equally all audit firms based in China and all China-based businesses with securities listed in the United States. However, if the administrative judge were to find in favor of the SEC under the proceeding and depending upon the remedies sought by the SEC, these audit firms could be barred from practicing before the SEC. As a result, listed companies in the United States with major PRC operations may find it difficult or impossible to retain auditors in respect of their operations in the PRC, which may result in their delisting. Moreover, any negative news about the proceedings against these audit firms may erode investor confidence in China-based, United States listed companies and the market price of our ADSs may be adversely affected.
26
Risks Related to Our ADSs
The trading prices of our ADSs have been, and are likely to continue to be, volatile, which could result in substantial losses to investors.
Between December 14, 2010 and April 19, 2013, the trading price of our ADSs on the NYSE ranged from $3.68 to $22.63 per ADS, and the last reported sale price on April 19, 2013 was $4.45 per ADS. The trading prices of our ADSs could fluctuate widely in response to factors beyond our control. Broad market and industry factors may significantly affect the market price and volatility of our ADSs, regardless of our actual operating performance, including the following:
| | • | | actual or anticipated fluctuations in our quarterly operating results and changes or revisions of our expected results; |
| | • | | changes in financial estimates by securities research analysts; |
| | • | | changes in the economic performance or market valuations of other IT services companies; |
| | • | | announcements by our competitors of new services, acquisitions, strategic partnerships, joint ventures or capital commitments; |
| | • | | technological breakthroughs in the services outsourcing industry; |
| | • | | fluctuations of exchange rates between the Renminbi and U.S. dollar or other foreign currencies; |
| | • | | release or expiry of lock-up or other transfer restrictions on our outstanding ordinary shares or ADSs; |
| | • | | sales or perceived sales of additional ordinary shares or ADSs; and |
| | • | | general market conditions or other developments affecting us, our industry or the global economy. |
In addition, the performance, and fluctuation in market prices, of other companies with business operations located mainly in China that have listed their securities in the United States may affect the volatility in the price of and trading volumes of our ADSs. Volatility in global capital markets, such as the recent global financial crisis and European debt crisis, could also have an adverse effect on the market price of our ADSs. Furthermore, short sellers and other funds may take a short position or positions in our ADSs for the specific purpose of driving down market price for our ADSs. Short sellers may also publish articles or other allegations in conjunction with such attacks. Even when there is no truth to their claims and we rebut their allegations, such attacks can have a material impact on the market price of our ADSs and divert management resources and attention. The securities market has from time to time experienced significant price and volume fluctuations that are not related to the operating performance of particular companies. These market fluctuations may also have a material adverse effect on the market price of our ADSs.
In addition to market and industry factors, the price and trading volume for our ADSs may also be highly volatile for specific business reasons including variations in our revenues, earnings and cash flow, announcements of new services, acquisitions, strategic partnerships, joint ventures or capital commitments, addition or departure of our senior management and other key personnel and potential litigation or administrative investigations. Any of these factors may result in large and sudden changes in the volume and trading price of our ADSs. In the past, following periods of volatility in the market price of a company’s securities, shareholders have often instituted securities class action litigation against that company. If we were involved in a class action suit or other securities litigation, it would divert the attention of our senior management, require us to incur significant expense and, whether or not adversely determined, could have a material adverse effect on our business, financial condition, results of operations and prospects.
The voting rights of holders of our ADSs are limited in several significant ways under the terms of the deposit agreement.
Except as described in the deposit agreement, holders of our ADSs will not be able to exercise voting rights attaching to the shares evidenced by our ADSs on an individual basis. Holders of our ADSs will appoint the depositary or its nominee as their representative to exercise the voting rights attaching to the shares represented by the ADSs. Holders of our ADSs may not receive voting materials in time to instruct the depositary to vote, and it is possible that holders, or persons who hold their ADSs through brokers, dealers or other third parties, will not have the opportunity to exercise a right to vote. Upon our written request, the depositary will mail to holders a shareholder meeting notice which contains, among other things, a statement as to the manner in which voting instructions may be given. We will make all reasonable efforts to cause the depositary to extend voting rights to holders in a timely manner, but holders may not receive the voting materials in time to ensure that they can instruct the depositary to vote their ADSs. Furthermore, the depositary and its agents will not be responsible for any failure to carry out any instructions to vote, for the manner in which any vote is cast or for the effect of any such vote. As a result, holders may not be able to exercise their right to vote and may lack recourse if their ADSs are not voted as requested. In addition, ADS holders will not be able to call a shareholders’ meeting.
Holders of our ADSs may not receive distributions on our ordinary shares or any value for them if such distribution is illegal or if any required government approval cannot be obtained in order to make such distribution available to the holders.
The depositary of our ADSs has agreed to pay to holders the cash dividends or other distributions it or the custodian receives on ordinary shares or other deposited securities underlying our ADSs, after deducting its fees and expenses. Holders of our ADSs will receive these distributions in proportion to the number of ordinary shares their ADSs represent. However, the depositary is not responsible if it decides that it is unlawful or impractical to make a distribution available to any holders of ADSs. For example, it would be unlawful to make a distribution to a holder of ADSs if it consists of securities that require registration under the Securities Act but that are not properly registered or distributed under an applicable exemption from registration. The depositary may also determine that it is not feasible to distribute certain property through the mail. Additionally, the value of certain distributions may be less than the cost of mailing them. In these cases, the depositary may determine not to distribute such property. We have no obligation to register under U.S. securities laws any ADSs, ordinary shares, rights or other securities received through such distributions. We also have no obligation to take any other action to permit the distribution of ADSs, ordinary shares, rights or anything else to holders of ADSs. This means that holders of our ADSs may not receive distributions we make on our ordinary shares or any value for them if it is illegal or impractical for us to make them available to them. These restrictions may cause a material decline in the value of our ADSs.
27
Holders of our ADSs may not be able to participate in rights offerings and may experience dilution of their holdings as a result.
We may from time to time distribute rights to our shareholders, including rights to acquire our securities. Under the deposit agreement for the ADSs, the depositary will not offer those rights to ADS holders unless both the rights and the underlying securities to be distributed to ADS holders are either registered under the Securities Act, or exempt from registration under the Securities Act with respect to all holders of ADSs. We are under no obligation to file a registration statement with respect to any such rights or underlying securities or to endeavor to cause such a registration statement to be declared effective. In addition, we may not be able to take advantage of any exemptions from registration under the Securities Act. Accordingly, holders of our ADSs may be unable to participate in our rights offerings and may experience dilution in their holdings as a result.
Holders of our ADSs may be subject to limitations on transfer of their ADSs.
ADSs are transferable on the books of the depositary. However, the depositary may close its transfer books at any time or from time to time when it deems expedient in connection with the performance of its duties. In addition, the depositary may refuse to deliver, transfer or register transfers of ADSs generally when our books or the books of the depositary are closed, or at any time if we or the depositary deem it advisable to do so because of any requirement of law or of any government or governmental body, or under any provision of the deposit agreement, or for any other reason.
Holders of our ADSs may have difficulty in effecting service of legal process and enforcing court judgments obtained against us or any of our directors or management.
We are incorporated in the Cayman Islands and conduct substantially all of our operations in China through our subsidiaries in China. Most of our officers and directors reside outside of the United States and some or all of the assets of those persons are located outside of the United States. It may be difficult or impossible for holders of our ADSs to bring an action against us or against these individuals in the Cayman Islands or in China in the event that they believe that their rights have been infringed under the securities laws of the United States or otherwise. Even if holders of our ADSs are successful in bringing an action of this kind in the United States, the respective laws of the Cayman Islands and China may render them unable to enforce a judgment against our assets or the assets of our directors and officers. There is no statutory recognition in the Cayman Islands of judgments obtained in the United States, although the courts of the Cayman Islands will generally recognize and enforce a non-penal judgment of a foreign court of competent jurisdiction without retrial on the merits. Our PRC counsel has advised us that the PRC does not have treaties with the United States or many other countries providing for the reciprocal recognition and enforcement of judgment of courts, and therefore PRC courts have discretion not to enforce judgments of U.S. courts.
We are a Cayman Islands company and, because judicial precedent regarding the rights of shareholders is more limited under Cayman Islands law than under U.S. law, holders of our ADSs may have less protection of their shareholder rights than they would under U.S. law.
Our corporate affairs are governed by our fourth amended and restated memorandum of association and fifth amended and restated articles of association and by the Companies Law and common law of the Cayman Islands. The rights of shareholders to take legal action against our directors and us, actions by minority shareholders and the fiduciary responsibilities of our directors to us under Cayman Islands law are to a large extent governed by the common law of the Cayman Islands. The common law of the Cayman Islands is derived in part from comparatively limited judicial precedent in the Cayman Islands as well as from English common law, which has persuasive, but not binding, authority on a court in the Cayman Islands. The rights of our shareholders and the fiduciary responsibilities of our directors under Cayman Islands law are not as clearly established as they would be under statutes or judicial precedents in the United States. In particular, the Cayman Islands has a less developed body of securities laws as compared to the United States, and provides significantly less protection to investors. In addition, Cayman Islands companies may not have standing to initiate a shareholder derivative action before the federal courts of the United States.
As a result of all of the above, our public shareholders may have more difficulty in protecting their interests through actions against our management, directors or major shareholders than would shareholders of a corporation incorporated in a jurisdiction in the United States.
28
Anti-takeover provisions in our organizational documents may discourage our acquisition by a third party, which could limit our shareholders’ opportunity to sell their shares at a premium.
Our fourth amended and restated memorandum of association and fifth amended and restated articles of association include provisions that could limit the ability of others to acquire control of us, modify our structure or cause us to engage in change of control transactions, including, among other things, the following:
| | • | | provisions that authorize our board of directors, without action by our shareholders, to issue preferred shares and to issue additional ordinary shares, including ordinary shares represented by ADSs; |
| | • | | provisions that restrict or limit the ability of our shareholders to replace our directors or increase the size of our board. Our directors are not subject to a term of office (unless a term is set by our board and approved by our shareholders) and their removal requires approval by a supermajority of at least two-thirds of our shareholders at a shareholders meeting or by at least two-thirds of our board of directors. The number of director nominees that our shareholders can propose in any one calendar year is limited to, in the case of a shareholders meeting convened by the company, the lesser of that number of directors that are up for election (which may be none) or 25% of the size of the board, or, in the case of a shareholders meeting properly called by shareholders, 25% of the size of the board. The size of our board is determined by our board of directors; and |
| | • | | provisions that impose advance notice, minimum shareholding periods and ownership thresholds and other requirements on the ability of our shareholders to call meetings or to propose special matters for consideration at shareholder meetings. |
These provisions could have the effect of depriving our shareholders of an opportunity to sell their ADSs at a premium over prevailing market prices by discouraging third parties from seeking to acquire control of us in a tender offer or similar transactions.
We are exempt from certain corporate governance requirements of the NYSE.
We are exempt from certain corporate governance requirements of the NYSE by virtue of being a foreign private issuer. We are required to provide a brief description of the significant differences between our corporate governance practices and the corporate governance practices required to be followed by U.S. domestic companies under the NYSE rules. The standards applicable to us are considerably different than the standards applied to U.S. domestic issuers. The significantly different standards applicable to us do not require us to:
| | • | | have a majority of the board be independent; |
| | • | | have a minimum of three members or a person with accounting or related financial management expertise in our audit committee; |
| | • | | have a compensation committee or a nominating and corporate governance committee; |
| | • | | provide an annual certification by our chief executive officer that he or she is not aware of any non-compliance with any corporate governance rules of the NYSE; |
| | • | | have regularly scheduled executive sessions with only non-management directors; |
| | • | | have at least one executive session of solely independent directors each year; |
| | • | | seek shareholder approval for (i) the implementation and material revisions of the terms of share incentive plans, (ii) the issuance of more than 1% of our outstanding ordinary shares or more than 1% of our outstanding voting power to a related party, (iii) the issuance of more than 20% of our outstanding ordinary shares, and (iv) an issuance that would result in a change of control; |
| | • | | adopt and disclose corporate governance guidelines; or |
| | • | | adopt and disclose a code of business conduct and ethics for directors, officers and employees. |
We do not intend to rely on any of the exemptions provided by the NYSE to foreign private issuers, except that we will not provide an annual certification by our chief executive officer that he or she is not aware of any non-compliance with any corporate governance rules of the NYSE, and we will not seek shareholder approval for (i) the issuance of more than 1% of our outstanding ordinary shares or more than 1% of our outstanding voting power to a related party, (ii) the issuance of more than 20% of our outstanding ordinary shares, and (iii) an issuance that would result in a change of control. As a result, you may not be provided with the benefits of certain corporate governance requirements of the NYSE.
We may be classified as a passive foreign investment company, which could result in adverse U.S. federal income tax consequences to U.S. holders of our ADSs or ordinary shares.
Depending upon the value of our ADSs or ordinary shares and the nature of our assets and income over time, we could be classified as a passive foreign investment company, or PFIC, for U.S. federal income tax purposes. We will be classified as a PFIC in any taxable year if either (a) the average quarterly value of our gross assets that produce passive income or are held for the production of passive income is at least 50% of the average quarterly value of our total gross assets or (b) 75% or more of our gross income for the taxable year is passive income. According to these technical rules, we would likely become a PFIC for a given taxable year if our market capitalization were to decrease significantly while we hold substantial cash and cash equivalents in that year.
29
We believe we were not a PFIC for U.S. federal income tax purposes for our taxable year ended December 31, 2012. Although we intend to conduct our business activities in a manner to reduce the risk of our classification as a PFIC in the future, we currently hold, and expect to continue to hold, a substantial amount of cash and other passive assets, and, because the value of our assets is likely to be determined in large part by reference to the market prices of our ADSs and ordinary shares, which are likely to fluctuate, there can no assurance that we will not be classified as a PFIC for 2013 or any future taxable year. If we are treated as a PFIC for any taxable year during which a U.S. investor holds our ADSs or ordinary shares, certain adverse U.S. federal income tax consequences would apply to the U.S. investor. For more information on the U.S. tax consequences to U.S. holders that would result from our classification as a PFIC, please see “Item 10.E. Taxation—U.S. Federal Income Taxation—Passive Foreign Investment Company.”
Compliance with rules and requirements applicable to public companies may cause us to incur increased costs, which may negatively affect our results of operations.
As a public company, we will incur significant legal, accounting and other expenses that we did not incur as a private company. In addition, the Sarbanes-Oxley Act, as well as rules subsequently implemented by the SEC and NYSE, have required changes in corporate governance practices of public companies. We expect these rules and regulations to increase our legal, accounting and financial compliance costs and to make certain corporate activities more time-consuming and costly. Complying with these rules and requirements may be especially difficult and costly for us because we may have difficulty locating sufficient personnel in China with experience and expertise relating to U.S. GAAP and U.S. public company reporting requirements, and such personnel may command high salaries relative to what similarly experienced personnel would command in the United States. If we cannot employ sufficient personnel to ensure compliance with these rules and regulations, we may need to rely more on outside legal, accounting and financial experts, which may be very costly. In addition, we will incur additional costs associated with our public company reporting requirements. We cannot predict or estimate the amount of additional costs we may incur or the timing of such costs.
ITEM 4. INFORMATION ON THE COMPANY
A. History and Development of the Company
Overview
We commenced operations in October 2001 through Beijing iSoftStone Technologies Ltd., or Beijing iSoftStone, a limited liability company established in China and majority owned by our founder Tianwen Liu. To enable us to raise equity capital from investors outside of China, in November 2005, we reorganized our corporate structure by establishing our current Cayman Islands holding company, iSoftStone Holdings Limited, or iSoftStone Holdings, and transferred substantially all the IT services business and related assets and liabilities of Beijing iSoftStone into iSoftStone WFOE, a wholly owned subsidiary of iSoftStone Holdings, in exchange for issuance of ordinary shares of iSoftStone Holdings to our founder Tianwen Liu and other shareholders of Beijing iSoftStone. Concurrently, because certain businesses primarily from PRC stated-owned entities cannot be conducted by foreign invested enterprises in China, iSoftStone WFOE entered into a series of contractual arrangements with Beijing iSoftStone and its shareholders to become its primary beneficiary and then to consolidate its financial results since the date of inception of Beijing iSoftStone. Beijing iSoftStone generated net revenues of $123,000, $30,000 and $9,000 in the year of 2010, 2011 and 2012, respectively. We don’t expect it will generate significant amount of net revenues in the near future.
We conduct our business primarily through the following subsidiaries:
| | • | | iSoftStone WFOE, which is our primary operating entity and hosts our headquarters in Beijing, China. iSoftStone WFOE operates our China-based delivery platform and holds our China-based subsidiaries, including our new consolidated subsidiary established together with Huawei and our three key regional centers: iSoftStone Information Technology Co., Ltd. located in Tianjin, iSoftStone Information System Service Co., Ltd. located in Wuxi, and Guangzhou iSoftStone Information Technology Co., Ltd. located in Guangzhou. |
| | • | | iSoftStone Inc., which is our wholly owned subsidiary incorporated in the State of Delaware. iSoftStone Inc. integrates the business of Akona Systems, Inc., or Akona, that we acquired in 2008, the business of Ascend Technologies, Inc., or Ascend, that we acquired in October 2010, and the business of Adventier Consulting Group, Inc., or Adventier, that we acquired in August 2011, and provides a wide range of services to our clients in the United States, especially our key client Microsoft, ranging from consulting, application development to R&D services. |
| | • | | iSoftStone Japan Limited, our wholly owned subsidiary incorporated in Japan that primarily provides IT service, consulting and software R&D services to our clients in Japan. |
30
iSoftStone Technology Service Co., Ltd.
In September 2012, we announced the planned formation of our consolidated subsidiary ISST together with Huawei. In January 2013, ISST became operational with a stated term of 50 years. We formed ISST to provide a broad range of IT services to Technology and Communications clients including the telecommunications carriers, telecommunications equipment manufacturers, e-commerce and internet companies, and makers of computer software, semiconductors, and computer peripherals, primarily located in China. Through ISST we plan to leverage Huawei’s leading market position in the Technology and Communication sections to further deepen our domain knowledge and expand our business (both domestically in the PRC and globally). iSoftStone WFOE and Huawei each owns 75% and 25% of the equity interests of ISST, respectively, with each contributing registered capital in cash of RMB75 million and RMB25 million, respectively. In conjunction with ISST’s formation, among other things, we realigned all our existing Huawei business and selected non-Huawei Technology and Communications business (including all personnel and intangible assets related thereto) to ISST, but excluding our U.S. businesses, certain Technology and Communications accounts mutually agreed to by Huawei and us and our product distribution and system integration services provided to international IT product vendors in connection with such vendors’ supplies to non-Technology and Communications clients. Huawei agrees to purchase services from ISST totaling at least RMB 650 million in 2013, RMB 950 million in 2014, and RMB 1.2 billion in 2015, with good-faith discussions about additional business volumes for the years thereafter, subject to Huawei’s adjustment of the business volumes granted by it to ISST if ISST fails to meet Huawei’s general requirements in terms of service quality, delivery schedule or reasonable level of cost and expenses. We have agreed that ISST’s non-Huawei client business revenues will be at least equal to the its Huawei-related revenues by the end of 2015 and for each year thereafter, failing which Huawei may reduce the business volumes granted by it to ISST on a pro rata basis. Huawei also agrees to provide ISST with certain supportive policies with respect to annual billing rate increase, gross margin, and shortening of payment cycle. For the first three years after its inception, ISST is not expected to pay dividends. iSoftStone WFOE is entitled to 100% of ISST’s profit in 2013 and 75% of ISST’s profit thereafter, except that iSoftStone WFOE’s profit sharing in 2014 may be adjusted upward if Huawei’s actual service purchases from ISST in 2013 is less than 90% of its minimum business commitment to ISST in the same year.
We appoint three of ISST’s five directors while Huawei appoints the other two. We nominate ISST’s chief executive officer, chief operating officer and chief financial officer and Huawei nominate certain other officers of ISST including the deputy general manager, chief quality officer and deputy human resources director of ISST’s Huawei related business and ISST’s financial controller (with non-management personnel contributed by Huawei to ISST being no more than 20 persons). Huawei has customary protective veto rights with respect to certain important aspects of the operations of ISST, including veto rights over any change in business scope, increase or decrease of registered capital, material acquisitions, borrowings over a certain threshold, liquidation of ISST, and amendment of ISST’s articles of association. In addition, we and ISST are subject to certain non-compete obligations in favor of Huawei including restrictions on us conducting the business contributed to ISST or forming a joint venture or other cooperative arrangements with a designated Huawei competitor. We and Huawei are subject to certain equity transfer restrictions. During the four years following ISST’s establishment, neither we nor Huawei may transfer the interest in ISST without written consent of the other party. Thereafter, one party may transfer its interest in ISST to a third party subject to certain restrictions prohibiting a transfer to a designated competitor of the other party and the other party’s right of first refusal on any proposed transfer. In a sale by us that results in us owning less than 51% equity interest in ISST, Huawei has a tag-along right.
ISST may be terminated prior to the expiration of its 50-year term (i) by the non-breaching party if the other party materially breaches the related investment agreement and such breach is not cured within two months after receiving notice of such breach, (ii) if ISST is bankrupt, or becomes the target of any liquidation or dissolution process, or ceases its operation, or is unable to pay its debt when they fall due, or (iii) by the non-breaching party if the other party’s transfer of its interest in ISST violates the related equity transfer restrictions. If (x) ISST is terminated and such termination is not due to Huawei’s breach or (y) the revenue of ISST’s non-Huawei client business is less than 50% of our commitment in 2015 due to our intentional misconduct or gross negligence, Huawei has the right to require us to purchase its equity interest in ISST at fair market value determined by a mutually agreed appraiser. If (a) ISST is terminated due to Huawei’s breach or (b) Huawei purchases from ISST less than 50% of its minimum commitment in 2015 due to its intentional misconduct or gross negligence, we have the right to require Huawei to sell its equity interest in ISST to us at fair market value determined by a mutually agreed appraiser.
For additional information on ISST, please see the related investment agreement, an English translation of which is previously furnished with the SEC.
For additional information on our organizational structure, see “Item 4.C. Information on the Company—Organizational Structure.”
Our principal executive offices are located at International Software Plaza, Building 9, Zhongguancun Software Park, No. 8 West Dongbeiwang Road, Haidian District, Beijing 100193, People’s Republic of China. Our telephone number at this address is +86-10-5874-9000 and our fax number is +86-10-5874-9002. Our main website is www.isoftstone.com. The information contained on this website is not part of this annual report.
On December 17, 2010, we completed our initial public offering of 12,458,334 ADSs, each representing ten ordinary shares. Our ADSs are listed on NYSE under the symbol “ISS.” Our agent for service of process in the United States is CT Corporation System, located at 111 Eighth Avenue, New York, New York 10011.
31
B. Business overview
Overview
We are a leading China-based IT services provider, serving both Greater China and Global clients. Our integrated suite of IT services and solutions, including Consulting & Solutions, IT Services and Business Process Outsourcing (BPO), supports large corporations in China, North America, Europe and Japan. In the twelve months ended December 31, 2012, our clients included 89 Fortune 500 companies, of which 34 were our Greater China clients and 55 were our Global clients. Increasingly we are seeking to grow our business on the basis of our strength in the domestic China market. Last year, we benefited from China’s fast-growing economy while the rest of the world experienced a slower growth. Net revenues from our Greater China and Global clients accounted for 64.0% and 36.0% of our net revenues in 2012 and 58.4% and 41.6% of our net revenues in 2011.
Our service offerings are designed to address our clients’ business and IT needs. In Consulting & Solutions engagements, our consultants work closely with clients to identify their business needs and formulate solutions by leveraging multiple components of our IT Services and BPO offerings. Our IT Services offerings help clients maintain and enhance their legacy IT systems and develop and implement new applications. In BPO, we take ownership of managing clients’ non-core business processes, which typically are time and resource intensive, allowing them to focus on running and growing their core businesses. Our Consulting & Solutions, IT Services, and BPO service lines accounted for 26.8%, 68.9% and 4.3% of our net revenues in 2011, and 33.4%, 63.1% and 3.5% of our net revenues in 2012, respectively. We have also been proactively developing new service offerings in our Smart Business, which we define to include Digital Marketing, Digital Publishing, Smart City and Smart Enterprises, to help our clients leverage emerging technologies in big data, mobile, social networking and cloud computing to embrace market changes and business transformation.
We manage our business primarily around four target industry verticals: Technology; Communications; Banking, Financial Services and Insurance, or BFSI; and Energy, Transportation and Public sector, or ETP; and their net revenue contributions were 30.2%, 38.3%, 20.4% and 5.2% of our net revenues in 2011, and 27.3%, 36.4%, 20.9% and 9.4% of our net revenues in 2012, respectively. With the formation of ISST in January 2013, we expect the substantial majority of our Technology and Communications business will be serviced by ISST going forward. The portion of our existing Technology and Communications business that will be excluded from ISST includes our related U.S. business and certain customers agreed to by us and Huawei. Our vertically focused strategy has been central to our revenue growth, enabling us to develop a deep understanding of clients’ businesses and industry trends, and build solutions tailored to meet their individual business needs. As we deepen our penetration into each vertical, we are able to expand the scope and scale of engagements with our clients to better address their challenges.
We believe that we have built one of the largest sales and delivery platforms for IT services and solutions in China. In addition, our operations in the North America, Europe and Japan allow us to be close to the main offices of key Global clients. By combining onsite/onshore support with scalable and lower-cost offsite/offshore delivery, we are able to meet client demands in a cost-effective manner while retaining significant operational flexibility. As of the date of this annual report, we had 27 sales and delivery centers, of which three are located in the U.S., one in Canada, two in Japan, one in Taiwan and 20 in China spanning Tier One cities, such as Beijing, Shanghai and Shenzhen, as well as key Tier Two and Tier Three cities, such as Changsha, Chengdu, Dalian, Foshan, Guangzhou, Hangzhou, Nanjing, Tianjin, Wuhan and Wuxi.
We were early to recognize the benefits of expanding into China’s Tier Two and Tier Three cities, which we view not just a cost-saving measure, even though labor costs tend to be lower in Tier Two and Tier Three cities. More importantly, we see this expansion as a competitive advantage that allows us access to local business opportunities, to be nearer to many of our clients, and to build closer relationships with local governments, who are the main promoters of local industry transformation, technology innovations and urbanization in China.
We believe human resource management and planning is critical to our success. We are committed to effectively recruiting, training, developing and retaining the best talent. Our total number of employees grew 16.0% in 2012 to 14,512 as of December 31, 2012. To improve the skill sets of our staff, we have established four dedicated internal training centers, in Wuxi, Tianjin, Guangzhou and Dalian. For managers, we have established a “Top 300” leadership development program to identify, develop, and promote qualified candidates to meet our middle and senior management needs.
In 2010, 2011 and 2012, our net revenues were $197.0 million, $283.4 million and $381.1 million, respectively. In 2010, 2011 and 2012, our net income (loss) improved from a net loss of $3.6 million in 2010 to a net income of $19.0 million in 2011, and then increased to a net income of $22.1 million in 2012. Our non-GAAP net income for 2010, 2011 and 2012, which excludes share-based compensation, amortization of intangible assets from acquisitions, interest expense of convertible notes, changes in fair value of contingent consideration in connection with business combinations and changes in the fair value of the convertible notes derivatives, from our U.S. GAAP net income (loss), was $19.6 million, $34.3 million and $37.1 million, respectively. For a reconciliation of our non-GAAP net income to our U.S. GAAP net income (loss), see footnote (4) on page 5 of this annual report.
32
Our Service Offerings
We provide an integrated suite of IT services and solutions, including Consulting & Solutions, IT Services and BPO service lines. The following table sets forth our net revenues by service line for the periods presented:
| | | | | | | | | | | | | | | | | | | | | | | | |
| | | Year Ended December 31, | |
| | | 2010 | | | 2011 | | | 2012 | |
| | | Net
Revenues | | | % of Net
Revenues | | | Net
Revenues | | | % of Net
Revenues | | | Net
Revenues | | | % of Net
Revenues | |
| | | (dollars in millions, except for percentages) | |
Consulting & Solutions | | $ | 54.3 | | | | 27.6 | % | | $ | 76.1 | | | | 26,8 | % | | $ | 127.2 | | | | 33.4 | % |
IT Services | | | 134.9 | | | | 68.5 | | | | 195.1 | | | | 68.9 | | | | 240.8 | | | | 63.1 | |
Business Process Outsourcing Services (BPO) | | | 7.8 | | | | 3.9 | | | | 12.2 | | | | 4.3 | | | | 13.1 | | | | 3.5 | |
| | | | | | | | | | | | | | | | | | | | | | | | |
Total net revenues | | $ | 197.0 | | | | 100.0 | % | | $ | 283.4 | | | | 100.0 | % | | $ | 381.1 | | | | 100.0 | % |
| | | | | | | | | | | | | | | | | | | | | | | | |
Consulting & Solutions
We offer a breadth of consulting services, powered by our industry-specific solutions, to help our clients derive greater business values from their IT investments, Business Process Management (BPM), Enterprise Resource Planning (ERP), Customer Relationship Management (CRM), and project and program management. We typically market these services to the business executives, as well as chief information officers and their functional IT heads.
Our business consultants work closely with clients to analyze existing environments, identify business needs, evaluate new technologies, and formulate solutions by leveraging multiple components of our IT Services and BPO service offerings as well as industry best-practices. Consulting engagement provides unique cross- and up-selling opportunities as it typically leads to deeper and broader client penetration, such as project implementation involving development of new applications, maintenance of a client’s IT system stacks, or the outsourcing of legacy business processes to improve productivity.
To help our clients better align their IT capabilities with business needs, drive consensus and achieve buy-in across their organizations, we developed and implemented Catapult™, a comprehensive vision and direction setting methodology and toolset that enables cross-functional teams to rapidly set focus, define and prioritize solutions, and build momentum for implementations.
To help us quickly and more cost effectively address our clients’ requirements, we have developed a library of industry-specific proprietary solution modules such as Smart Home Gateway Solution for our Communications clients, Treasury Management, Banking Risk Management solutions, Property and Casualty Insurance Core System and Life Insurance Core System for our BFSI clients, and Healthcare Mobile Application, Urban Public Cloud Platform & Data Center and Urban Operation Command Center for our ETP clients. These modules incorporate our proprietary intellectual property, relevant industry knowledge and best practices, and serve as building blocks around which we often deliver our broader services and solutions.
Recently, we see increasing demands in emerging technologies such as big data, mobile, social networking and cloud computing and in services and solutions of Digital Marketing, Digital Publishing, Smart City and Smart Enterprises. For example, an increasing number of PRC municipal governments are launching their “Smart City” projects, designed to improve the quality of public services by building a cross-agency data collection, information sharing, and collaborative decision-making platforms. This development is driving demand for cloud-enabled IT infrastructure and services such as data center hosting, shared services, and information exchange platform. We developed a suite of proprietary turnkey cloud computing solutions to support “Smart City”. These new solutions help lead to new opportunities in IT Services and BPO.
IT Services
Our IT Services offerings help our clients maintain and enhance their legacy IT systems and develop and implement new applications. This service line consists primarily of application development and maintenance services, or ADM, R&D services, and infrastructure and software services. We typically market these services to the chief information officers, chief technology officers, departmental IT and R&D heads and/or outsourcing project heads of our clients.
The following table sets forth net revenues from the major components of our IT Services for the periods presented:
| | | | | | | | | | | | | | | | | | | | | | | | |
| | | Year Ended December 31, | |
| | | 2010 | | | 2011 | | | 2012 | |
| | | Net
Revenues | | | % of IT
Services
Net
Revenues | | | Net
Revenues | | | % of IT
Services
Net
Revenues | | | Net
Revenues | | | % of IT
Services
Net
Revenues | |
| | | (dollars in millions, except for percentages) | |
ADM Services | | $ | 61.8 | | | | 45.8 | % | | $ | 97.4 | | | | 49.9 | % | | $ | 127.1 | | | | 52.8 | % |
R&D Services | | | 66.8 | | | | 49.5 | | | | 85.7 | | | | 43.9 | | | | 102.7 | | | | 42.6 | |
Infrastructure and Software Services | | | 6.3 | | | | 4.7 | | | | 12.0 | | | | 6.2 | | | | 11.0 | | | | 4.6 | |
| | | | | | | | | | | | | | | | | | | | | | | | |
Total IT Services | | $ | 134.9 | | | | 100.0 | % | | $ | 195.1 | | | | 100.0 | % | | $ | 240.8 | | | | 100.0 | % |
| | | | | | | | | | | | | | | | | | | | | | | | |
33
Application Development and Maintenance Services (ADM). ADM involves the architecture, design, development, testing and maintenance of software applications customized to meet a client’s particular business needs.
We are a leading China-based provider of traditional ADM services such as packaged software customization, embedded application development, software quality assurance, and enterprise application integration. Clients also outsource to us the maintenance of their legacy applications, for which we perform regular and ongoing maintenance work. Outsourcing maintenance allows our clients to focus on developing new IT capabilities while ensuring that existing mission-critical systems continue to operate without interruption.
R&D Services. We provide outsourced R&D services, primarily for product development, to chief technology officers, product managers, and R&D heads of our clients. Our offerings encompass the entire software product development lifecycle, including requirements analysis, concept generation, product realization, localization, quality assurance, and technology transfer to the client. Our cost-effective delivery model and specialized skill sets such as embedded software development and mobile device testing allow clients to shorten their product development cycle, increase speed to market, and lower overall development costs.
Infrastructure and Software Services. Our infrastructure and software services typically involve the management of our clients’ systems from onsite or offsite locations. These services range from desktop management, data center management and information security management, to maintenance of third-party packaged software from vendors such as IBM and SAP. We help our clients build and maintain stable, reliable, secure, and cost-effective infrastructure to support their business strategies, while reducing risks and lowering overall costs.
Business Process Outsourcing Services
In our BPO services, we take ownership of managing clients’ non-core business processes, which typically are time and resource intensive, so that they can focus on running and growing their core businesses. We typically market these services to c-level executives and other business executives, as well as functional operation heads across business units of our clients.
We provide our clients with a high degree of transparency about our effectiveness, quality and work product by utilizing mutually agreed governance arrangements, systematic reporting practices and clearly defined key performance indicators. We believe that our cost-effective delivery model and deep industry expertise help our clients achieve significant operational efficiency and cost savings.
Our highly trained team of BPO professionals in China supports clients from the United States, Europe and China. We have built strong BPO service capabilities in the following verticals:
| | • | | Banking and financial services, such as securities trade processing services for investment banks. In 2008, we were awarded a significant BPO contract with the global investment banking group of a leading investment bank in Europe. Our facilities in Shanghai provide operations support to the bank’s derivatives trading desks around the world. Currently, we provide this client with a wide variety of services including trade capture, deal review, settlement, confirmation, reconciliation and management information system reporting. Given the important nature of these tasks, our services have become an integral part of the client’s trade life cycle. |
| | • | | Technology, such as the search engine performance judging and verification. |
| | • | | Insurance, such as digitization and archiving of policyholder information, as well as account processing and customer services. |
In addition, we are developing additional capabilities in the areas like digital publishing, including digital publication production, online publishing, rights management and transactions, short-run printing, and similar services.
We view BPO as an important service because the nature of our BPO engagements allows us to gain deep understanding of the unique business attributes of our clients. We leverage our Consulting & Solutions capabilities to identify business process optimization opportunities and other needs for our BPO clients, which often lead to us providing additional engagements. Through our ongoing and increasingly deep client relationships, we are able to further enhance our industry domain expertise.
New Service Initiatives
In addition to constantly enhancing our traditional service offerings, we are also investing in service capabilities that we believe will drive future growth and enable us to provide higher value-added services, addressing broader business needs of our clients:
| | • | | Data and Business Intelligence Services, including data governance and architecture, data management and planning, data processing, and analysis-based decision-making tools for various industries, such as banking, securities and funds, corporate finance, insurance, government, manufacturing, retail and healthcare; |
34
| | • | | Mobility Services, including embedded software for smart terminals (smart phones, tablet PCs and set-top-boxes), customized smart terminal operating systems, mobile applications, mobile Internet services, and value-added services delivered through the mobile cloud; and |
| | • | | Cloud Services, including the design, building, and operating of public and private cloud platforms for governments and large and medium-sized enterprises. Our proprietary iSoftStone Cloud Foundation contains a library of pre-built, pre-tested software modules that incorporate industry best-practices and help clients develop and deploy their infrastructure and software as services (IaaS and SaaS) over the cloud. |
Our Delivery Platform
We believe that we have built one of the largest sales and service delivery platforms for IT services and solutions in China, growing from six sales and delivery centers as of January 1, 2007 to 27 sales and delivery centers as of the date of this annual report, of which 20 are located in China, spanning Tier One cities, such as Beijing, Shanghai and Shenzhen, as well as key Tier Two and Tier Three cities, such as Changsha, Chengdu, Dalian, Foshan, Guangzhou, Hangzhou, Nanjing, Tianjin, Wuhan and Wuxi. With this strong and diversified delivery platform, we are able to combine our onshore consulting and project management capabilities with scalable and lower-cost offshore delivery facilities that meet clients’ needs in a cost-effective manner while retaining significant operational flexibility. Our integrated onsite/onshore and offsite/offshore delivery model allows us to cost effectively and efficiently deliver our services to clients around the clock.
Onsite/Onshore. We have personnel stationed in China, the United States, Canada and Japan, in locations close to the main offices of our key clients. These teams of high-caliber professionals travel regularly to clients’ sites to engage with clients in person, manage projects, and more closely address their needs. Our onsite/onshore delivery model is particularly important for complex projects where clients wish to have greater control of or influence over the project management.
Offsite/Offshore. We have a dedicated pool of professionals in China that form a virtual extension of our onsite/onshore project team or a client’s own development team.
We tailor the composition of our teams to the specific needs of each client. In the initial phases of a project, we normally engage a greater portion of onsite/onshore professionals to help understand a client’s needs, facilitate knowledge transfer, formalize the operating model between the two teams, and build relationships. At the implementation stage, we generally utilize a greater portion of offsite/offshore and other China-based resources, which allows us to better leverage our substantial base of onsite/offshore resources and maximize the cost-effectiveness of our services.
We were early to recognize the benefits of expanding into China’s Tier Two and Tier Three cities, which we view not just a cost-saving measure, even though labor costs tend to be lower in Tier Two and Tier Three cities. More importantly, we see this expansion as a competitive advantage that enables us to access local business opportunities, to increase our supply of high quality resources, to be nearer to many of our clients, and to build closer relationships with local governments, who are the main promoters of local industry transformation, technology innovations and urbanization in China. In 2012, we opened six new regional offices in Tier Two and Tier Three cities: Foshan, Jinan, Lanzhou, Liaoyuan, Shijiazhuang and Suzhou. As of the date of this annual report, approximately 74% of our office space in China is located in Tier Two and Tier Three cities.
Our Clients
We were founded on the principle of Customer First. We have built long term relationships with large corporations in China, the United States, Europe and Japan. We are extremely proud of the quality and diversity of our clients. In 2012, 89 Fortune 500 companies chose iSoftStone as an IT outsourcing partner. In 2012, we had 49 clients that contributed net revenues exceeding $1.0 million. We have been able to grow with our clients by increasingly expanding the scope and size of our engagements. In addition, we are increasingly seeking to grow our business on the basis of our strength in the domestic China market.
35
The following table shows our net revenue breakdown by geographic markets for the periods presented:
| | | | | | | | | | | | | | | | | | | | | | | | |
| | | Year Ended December 31, | |
| | | 2010 | | | 2011 | | | 2012 | |
| | | Net
Revenues | | | % of Net
Revenues | | | Net
Revenues | | | % of Net
Revenues | | | Net
Revenues | | | % of Net
Revenues | |
| | | (dollars in millions, except for percentages) | |
Greater China | | $ | 110.1 | | | | 55.9 | % | | $ | 165.5 | | | | 58.4 | % | | $ | 244.0 | | | | 64.0 | % |
Global: | | | | | | | | | | | | | | | | | | | | | | | | |
United States | | | 53.6 | | | | 27.1 | | | | 71.4 | | | | 25.2 | | | | 86.4 | | | | 22.7 | |
Europe | | | 12.7 | | | | 6.5 | | | | 21.4 | | | | 7.5 | | | | 25.0 | | | | 6.6 | |
Japan | | | 20.4 | | | | 10.4 | | | | 24.3 | | | | 8.6 | | | | 23.3 | | | | 6.1 | |
Others | | | 0.2 | | | | 0.1 | | | | 0.8 | | | | 0.3 | | | | 2.4 | | | | 0.6 | |
| | | | | | | | | | | | | | | | | | | | | | | | |
Global total | | | 86.9 | | | | 44.1 | | | | 117.9 | | | | 41.16 | | | | 137.1 | | | | 36.0 | |
| | | | | | | | | | | | | | | | | | | | | | | | |
Total net revenues | | $ | 197.0 | | | | 100.0 | % | | $ | 283.4 | | | | 100.0 | % | | $ | 381.1 | | | | 100.0 | % |
| | | | | | | | | | | | | | | | | | | | | | | | |
Highlights of our geographic market mix include:
| | • | | We are a leading China-based IT services provider in China’s banking, insurance, communications and ETP industries, and we expect to see increased growth and investment activities in these industries in the foreseeable future. While developed markets faced financial crises and economic slowdowns, China maintained its growth momentum in 2012, fueled by macroeconomic factors such as urbanization, industrial transformation, and growing middle-class consumption. As one of the seven Priority Industries promoted by China’s 12th Five-Year Plan, IT services industry is expected to attract significant investments in the next several years, which we believe will fuel our business growth in this market. |
| | • | | We saw moderate business growth in the U.S. and European markets as the global economy gradually recovered from the financial crisis. As increasing number of U.S. and European clients enter the China market, we are well-positioned to support their growth with our strong presence in China and globally balanced capabilities. However, given the uncertainties of the U.S. and European economy (especially the impact of the prolonged European debt crisis), intensified competition from Indian competitors in the international market and the anticipated higher growth of our businesses from Greater China clients, we expect our business in the U.S. and European markets to grow at a slower pace in the near future. |
| | • | | Our business in the Japanese market slightly declined in 2012 due to the lingering weakness in Japan’s economy and a depreciating Yen, as well as the Sino-Japan geopolitical standoff. We do not anticipate that the Japanese market will experience a substantial recovery in 2013. |
We have derived, and believe that in the foreseeable future we will continue to derive, a significant portion of our revenues from a small number of clients. In 2010, 2011 and 2012, Huawei and Microsoft contributed 25% and 13%, 23% and 9%, and 26% and 8% of our net revenues, respectively. In aggregate, our top five clients accounted for 46.1%, 43.2% and 47.2% of our net revenues in 2010, 2011 and 2012, respectively. See “Item 3.D. Key Information—Risk Factors—Risks Related to Our Business and Industry—We generate a significant portion of our revenues from a small number of major clients and any loss of business from these clients could reduce our revenues and significantly harm our business.”
Target Industry Verticals
As the IT services industry in China continues to mature, clients are looking for partners who understand their businesses and industry trends, and have solutions tailored to meet their individual business needs. By focusing our business around four industry verticals—Technology, Communications, Banking, Financial Services and Insurance, or BFSI, and Energy, Transportations and Public Sector, or ETP, we are able to understand the full context of our clients’ challenges and develop deep expertise to address their needs. Our Technology, Communications, BFSI and ETP verticals accounted for, in aggregate by client industry, 27.3%, 36.4%, 20.9% and 9.4%, respectively, of our net revenues in 2012. The following table sets forth our net revenues by client industry for the periods presented:
| | | | | | | | | | | | | | | | | | | | | | | | |
| | | Year Ended December 31, | |
| | | 2010 | | | 2011 | | | 2012 | |
| | | Net
Revenues | | | % of Net
Revenues | | | Net
Revenues | | | % of Net
Revenues | | | Net
Revenues | | | % of Net
Revenues | |
| | | (dollars in millions, except for percentages) | |
Technology | | $ | 65.2 | | | | 33.1 | % | | $ | 85.6 | | | | 30.2 | % | | $ | 104.2 | | | | 27.3 | % |
Communications | | | 75.7 | | | | 38.3 | | | | 108.6 | | | | 38.3 | | | | 138.9 | | | | 36.4 | |
BFSI | | | 33.6 | | | | 17.1 | | | | 57.9 | | | | 20.4 | | | | 79.7 | | | | 20.9 | |
ETP | | | 12.5 | | | | 6.4 | | | | 14.8 | | | | 5.2 | | | | 36.0 | | | | 9.4 | |
Other | | | 10.0 | | | | 5.1 | | | | 16.5 | | | | 5.9 | | | | 22.3 | | | | 6.0 | |
| | | | | | | | | | | | | | | | | | | | | | | | |
Total net revenues | | $ | 197.0 | | | | 100.0 | % | | $ | 283.4 | | | | 100.0 | % | | $ | 381.1 | | | | 100.0 | % |
| | | | | | | | | | | | | | | | | | | | | | | | |
36
| | • | | Technology. In the technology industry, our key clients include some of world’s leading software and hardware vendors, such as Microsoft, Lenovo, and IBM. We provide R&D, application development, and quality assurance and BPO services to these clients to help them quickly respond to market changes and accelerate the time to market for their products and technologies. In addition, we offer a go-to-market strategy, whereby we are able to incorporate their technologies into our solutions to other clients. |
| | • | | Communications. Communications has traditionally been our stronghold. Our clients span the entire telecommunications value chain, from handset manufacturers such as Sharp, Sony Mobile and HTC, to carriers such as AT&T, China Mobile and China Telecom, and equipment suppliers such as Huawei and Alcatel-Lucent. We have built strong capabilities in network management, Business Operation Support Systems (BOSS), business intelligence, network-embedded products, network security products, and mobility. We believe that we are now a leading China-based provider of embedded software for smart terminals (smart phones, tablet PCs, and set-top boxes), customized smart terminal Operating Systems (OS), mobile applications, and mobile Internet services. Moreover, we have built our own mobile development tool—iMobot, and are actively making innovations in the field of mobile payment and mobile commerce to assist our communications clients in the rapidly evolving mobile eco-system. |
| | • | | BFSI. Through organic growth and acquisitions of personnel, we believe that we have become a leading China-based provider in this industry with an extensive client portfolio and comprehensive service offerings. In 2012, our clients included all four Tier One Chinese state-owned banks, other major banks in China, several leading banks and financial institutions in the U.S. and Europe, and the ten largest Chinese insurance companies. We provide our BFSI clients with a variety of consulting, IT, and BPO services. |
| | • | | ETP. ETP was our fastest growing industry vertical in 2012. We see ETP as a significant source for future growth, driven by two factors: first, global technology innovations around green energy; and second, the Chinese government’s efforts to improve the well-being of its citizens and upgrade the country’s technology infrastructure to meet the trends of urbanization and a growing middle-class. The key component of our ETP service offerings centers around our Smart City solution suites including smart healthcare, smart transportation, smart tourism and city command center. |
Following the formation of ISST in January 2013, we expect the substantial majority of our Technology and Communications business will be conducted through ISST. In addition to Huawei, clients expected to be served through ISST include telecommunications carriers, telecommunications equipment manufacturers, e-commerce and internet companies and makers of computer software, semiconductors, and computer peripherals, primarily located in China. Through ISST we plan to leverage Huawei’s leading market position in the Technology and Communication sections to further deepen our domain knowledge and expand our business (both domestically in the PRC and globally). Given the terms agreed to by Huawei, we believe ISST will benefit iSoftStone and our shareholders strategically, financially, and operationally. In addition to securing a long-term, large-scale, and sustained business account from Huawei, it should help us strengthen our core competitiveness through the continued integration of the fragmented IT services industry in China. ISST began operation in January 2013.
We are constantly evaluating new technology trends and investing in business initiatives that have potential to become future growth drivers. We believe that two of our initiatives in particular have good growth potential: Digital Marketing and Smart City Solution Suites.
| | • | | Digital Marketing.The new generation of digital consumers pervasively use digital devices to be better informed, always stay connected, and more actively participate in their social networks. Enterprises need to rapidly evolve their customer and employee engagement strategies to capitalize on this new trend of consumer behavior. We have been closely monitoring the emergence of the digital consumer generation in China and actively developing digital marketing solutions. Through our digital marketing solutions, we provide full digital marketing services across the entire customer engagement life cycle—from tracking consumer behavior and analyzing consumer data to managing digital properties of clients’ brands or products. |
| | • | | Smart City Solution Suites.We believe that we are one of the pioneers and a leading China-based provider of one-stop integrated services for Smart City planning, construction and operations. In Smart City projects, we leverage our accumulated domain knowledge in technology, communications, public, healthcare and other industries and integrate capabilities in cloud computing, Internet of Things (IOT), mobile and big data. In addition, we have been building strategic partnerships with selected solution providers to expand our service offerings to satisfy a variety of needs from different municipalities that have embarked on urbanization processes. We currently participate in the planning and building of Smart City projects in Hubei, Jiangsu, Guangzhou, Jilin, Gansu, Sichuan, Chongqing and Macau. |
Human Capital
Our ability to rapidly recruit, train, develop and retain employees is critical to the success of our business. We are committed to being a highly regarded employer within our industry in China, and we have dedicated executives focused solely on human capital and leadership development. We believe our employees deliver services on par with widely accepted quality standards in the global IT outsourcing industry. We had 9,285, 12,510 and 14,512 employees as of December 31, 2010, 2011 and 2012, respectively.
37
Recruiting and Retention. We have built our talent pool by recruiting students from a variety of universities in China and hiring highly qualified project leaders and middle-level managers from the market. We are committed to maintaining stringent recruitment standards to continue to hire highly qualified candidates, minimize attrition and increase the chances for the development of long-term careers for our employees. We offer competitive remuneration and benefits, a challenging work environment, ongoing skill development initiatives, and attractive career advancement opportunities. We continually assess and refine our selection process based on performance tracking of past recruits. We also maintain a database of experienced potential lateral hires from which we have recruited a large number of middle to senior level staff over the years. Our attrition rates were 19.8%, 24.8% and 23.8% in 2010, 2011 and 2012, respectively.
Training and Development. We have training, continuing education and career development programs designed to ensure our technology and managerial personnel enhance their skill-sets in alignment with their respective roles. We have developed and promoted significant numbers of middle to senior level technical and management personnel from within our company. We continually review our competency model, which is based on the core values of our company culture, to determine the needs of capability development for technology and managerial personnel, while providing cross-functional assignments and exposure to internal strategic initiatives to prepare them for their next job role. As part of our systematic work force management practices, we conduct quarterly reviews and terminate employees that do not meet the quality levels required by our development programs and ultimately our clients.
We provide ongoing training for both new college graduates and experienced staff, including technical training and certification coursework, as well as language and management training. We have four dedicated internal training centers alongside our sales and delivery centers in Wuxi, Tianjin, Guangzhou and Dalian. The students gain hands-on experience in these programs, and the top students often obtain employment with us after graduation.
We are particularly focused on development of middle management and leadership. Our “Top 300” leadership development program is focused on systematically identifying and nurturing the development of middle and senior management. Using this program, we cultivate talent through formal leadership training, evaluation, development and promotion.
Research and Development
We continuously invest in research and development to enhance our domain knowledge and develop industry specific solutions to improve our competitiveness. We have established six R&D bases, in Beijing, Chengdu, Shenzhen, Tianjin, Wuhan and Wuxi, to explore new technologies and related applications (such as cloud computing) which can be applied horizontally across our integrated suite of service offerings. At the industry vertical level, we have several innovation centers focused on developing solutions to help us more quickly and cost-effectively address our clients’ requirements. In 2012, we launched iSoftStone Postdoctoral Workstation to further strengthen our R&D capabilities through cooperation with leading national research institutions and universities. As of December 31, 2012, we had been selected to participate in a number of key technological innovation projects in China, including the National Information Security Special Project and the Modern Service Industry Pilot Program.
Sales and Marketing
Our sales and marketing strategy seeks to increase client awareness of our service offerings, generate new and recurring business from target clients, promote client loyalty and enhance brand recognition. We promote our services directly through our business development teams and other client-facing personnel. Members of our executive management team are also actively involved in managing key client relationships through regular interaction with our clients’ senior management.
Sales and Marketing Organization. We have invested in building a broad sales force and marketing team. As of December 31, 2012, our business development teams consisted of 383 full-time sales and marketing personnel, including 151 sales and account managers, each of whom is responsible for a designated sales region, industry vertical or client account. We group our sales offices by regions in China and globally, and we had sales offices in 21 major cities in China, as well as in the United States, Canada and Japan, as of December 31, 2012. We plan to enhance our sales efforts by recruiting more sales personnel both domestically and overseas.
Strategic Alliances. We frequently enter into strategic alliances to help global technology companies “go to market” in China by jointly targeting business opportunities in the domestic China market. Through these alliances, our clients gain greater market access for their products and solutions and we gain valuable industry experience, technology know-how and additional revenue opportunities. Examples of these strategic alliances include our partnership with IBM to build Cloud Center of Excellence in cities like Foshan, Liaoyuan, Lanzhou and Xiangyang.
Competition
The market for IT services is highly competitive, and we expect competition to persist and intensify. In addition, the PRC IT services market has started to consolidate and we expect such trend to continue. We believe that the principal competitive factors in our markets are industry expertise, breadth and depth of service offerings, quality of the services offered, reputation and track record, marketing and selling skills, scalability of infrastructure and price.
38
In the IT outsourcing market, we face competition from the following major competitors:
| | • | | Chinese IT services companies, such as ChinaSoft International Ltd., Neusoft Group Ltd., and Pactera Technology International Ltd.; |
| | • | | Indian IT services companies, such as Cognizant Technology Solutions Corp., HCL Technologies, Infosys Technologies Ltd., Tata Consultancy Services Ltd. and Wipro Technologies; |
| | • | | Offshore IT services providers in emerging outsourcing destinations with low wage costs such as Southeast Asia, Latin America and Eastern Europe; and |
| | • | | In-house IT departments of large corporations. |
In the international market, we face intensified competition from Indian competitors. To date, we have not typically competed directly with the larger global consulting and outsourcing firms, such as Accenture, Capgemini, Hewlett-Packard and IBM, who are typically engaged in conjunction with large global projects. However, we may compete with these firms if they seek smaller engagements, particularly in conjunction with a strategy to enter the domestic China market. In addition, the trend towards offshore outsourcing, international expansion by foreign and domestic competitors and continuing technological changes will result in new and different competitors entering our markets. We believe that our delivery capabilities are competitive with companies such as these, and that our domestic China market experience and know-how provide us with a competitive advantage in serving our clients.
Intellectual Property and Confidentiality
Protecting our IP rights and the IP rights of our clients is critical to our business. We have invested and will continue to invest in research and development to enhance our domain knowledge and create industry-specific solutions. As of December 31, 2012, we had registered IP including six patents, 207 software copyrights, six trademarks and 21 domain names registered in China; two trademarks and one domain name registered in the United States; one domain name registered in Japan; two trademarks and two domain names registered in Taiwan; and we had seven patent applications and two trademark applications in China.
We employ a multi-layered approach to protect our clients’ IP, including implementing advanced technology and process-based protection and enforcement practices mandated by recognized security standards. Among other security measures, we require our employees and subcontractors to enter into non-disclosure agreements to limit access to and distribution of our clients’ proprietary and confidential information as well as our own. These agreements generally provide that any confidential or proprietary information developed by us or on our behalf must be kept confidential. We screen our employees and provide security training. Physical layer security measures include clustered and multi-level firewalls, intrusion detection mechanisms, vulnerability assessments, antivirus software, access control mechanisms and encryption techniques as required. We also operate our sales and delivery centers according to the security requirements of our clients, including guards, restricted access to server rooms, segregated networks, closed-circuit TV with recording devices, and other specific client requests.
Technology and Infrastructure
We have invested significantly in building our technology and infrastructure. As part of our technology infrastructure, we have our own data centers in Beijing, Wuxi, Nanjing and Shenzhen to support company operations and also serve our clients with infrastructure services. We are building our enterprise private cloud platform to better support business growth and achieve lower cost. We also plan to invest in our own IT infrastructure with more advanced technologies in our new office in Beijing, such as Smart Card system and energy saving system.
Telecommunications linkage with client sites is a core component of our global delivery platform. We have designed a high-quality, scalable and secured network architecture that provides client connectivity, sales and delivery center connectivity and broadband connectivity.
Our clients operate in multiple jurisdictions and have a variety of voice and data systems. Our IT support team has the capability to integrate our clients’ voice and data networks with our networks, support procedures, security environment and reporting procedures to create a homogeneous environment for consistent service delivery.
We use SAP’s human resources management system and financial management solutions to optimize our human resource and finance functions. We expect to continue to invest in our business applications (e.g., mobile applications) to improve process and collaboration efficiency among our customers and employees.
Quality Assurance
We have invested heavily in our service delivery quality, including project lifecycle management and quality controls. To standardize, document and make our development process more easily replicable, we have implemented since 2005 iSoftStone Project Development Process, or iPDP, our in-house project management and quality assurance methodology. The increased automation enabled by iPDP allows for more cost-effective project delivery. Depending upon the needs of our clients, we can also follow the standard processes requested by them, according to their specific needs. Throughout the development cycle and implementation process, our quality assurance methodology is embedded into the work we deliver. Through regular reports and communication, our clients have full visibility into the project progress.
39
We have achieved a wide range of recognition for our quality. We became ISO 9001:2008 certified in 2010. We continually refine our software development and project delivery methodologies, tools and techniques, and implement performance metrics to drive ongoing improvements in our service delivery.
Legal Proceedings
We are subject to legal proceedings, investigations and claims incidental to the conduct of our business from time to time. See Item 8 for certain ongoing litigation and dispute matters. Any adverse determination against us or unfavorable settlement of currently pending or future dispute could harm our reputation, subject us to significant liabilities, require significant cash payments by us or otherwise adversely impact our results of operations and financial condition.
Regulations
This section sets forth a summary of the most significant rules and regulations that affect our business activities in China or our shareholders’ rights to receive dividends and other distributions from us.
Regulations Relating to PRC Information Technology Service Industry
According to the Guidelines on Foreign Investment issued by the State Council in 2002 and the Catalog on Foreign Invested Industries (2011 Revision) issued by the National Development and Reform Commission and the Ministry of Commerce, IT services fall into the category of industries in which foreign investment is encouraged. The State Council has promulgated several notices since 2000 to launch favorable policies for IT services, such as preferential tax treatments and credit support.
Under rules and regulations promulgated by various Chinese government agencies, enterprises that have met specified criteria and are recognized as software enterprises by the relevant government authorities in China are entitled to preferential treatment, including financing support, preferential tax rates, export incentives, discretion and flexibility in determining employees’ welfare benefits and remuneration. For example, a recognized software enterprise is entitled to an exemption from enterprise income tax for its first two profitable years and a 50% reduction of its applicable enterprise income tax rate for the three following years. Software enterprise qualifications are subject to annual examination. Enterprises that fail to meet the annual examination standards will lose the favorable enterprise income tax treatment. Enterprises exporting software or producing software products that are registered with the relevant government authorities are also entitled to preferential treatment including governmental financial support, preferential import/export policies and preferential tax rates. iSoftStone Information Technology Co., Ltd., iSoftStone Information System Service Co., Ltd., Guangzhou iSoftStone Information Technology Co., Ltd., iSoftStone Information Technology Group (Wuhan) Co., Ltd., Shenzhen iSoftStone Technology Co., Ltd., iSoftStone Information Technology Group Chengdu Technology Co., Ltd., iSoftStone Technology Service Co., Ltd., iSoftStone Information System Service Yancheng Co., Ltd. and Suzhou iSoftStone Information Technology Co., Ltd. were recognized as software enterprises in July 2007, October 2007, August 2010, December 2011, March 2012, November 2012, November 2012, December 2012 and December 2012 respectively and remain so as of the date of this annual report.
Companies in China engaging in systems integration are required to obtain qualification certificates from the Ministry of Industry and Information Technology. Companies planning to set up computer information systems may only retain systems integration companies with appropriate qualification certificates. The qualification certificate is subject to review every two years and is renewable every four years. In 2003, the Ministry of Industry and Information Technology promulgated the Amended Appraisal Condition for Qualification Grade of Systems Integration of Computer Information to elaborate the conditions for appraising each of the four qualification grades of systems integration companies. Companies applying for qualification are graded depending on the scale of the work they undertake. The grades range from Grade 1 (highest) to Grade 4 (lowest) in the scale of the work the respective companies can undertake. Companies with Grade 3 qualification can independently undertake projects at the medium-scale and small-scale enterprise level and undertake projects at the large-scale enterprise level in cooperation with other entities. Our subsidiary Tianjin iSoftStone Technology Service Co., Ltd. obtained Grade 2 qualification certificate for systems integration in October 2012 and maintains this grade as of the date of this annual report.
In 2009, the Ministry of Commerce and the Ministry of Industry and Information Technology jointly promulgated a rule aiming to protect a fair competition environment in the PRC service outsourcing industry. This rule requires that each of the domestic enterprises which provides IT and technological BPO services and each of its shareholders, directors, supervisors, managers and employees should not violate the service outsourcing contract to disclose, use or allow others to use the confidential information of its client. Such enterprises are also required to establish an information protection system and take various measures to protect clients’ confidential information, including causing their employees and third parties who have access to clients’ confidential information to sign confidentiality agreements and/or non-competition agreements.
Regulations on Intellectual Property Rights
The PRC Copyright Law, as amended, together with various regulations and rules promulgated by the State Council and the National Copyright Administration, protect software copyright in China. These laws and regulations establish a voluntary registration system for software copyrights administered by the Copyright Protection Center of China. Unlike patent and trademark registration, copyrighted software does not require registration for protection. Although such registration is not mandatory under PRC law, software copyright owners are encouraged to go through the registration process and registered software may receive better protection. As of December 31, 2012, we had registered 207 software copyrights with the National Copyright Administration.
40
The PRC Trademark Law, as amended, together with its implementation rules, protect registered trademarks. The Trademark Office of the State Administration for Industry and Commerce handles trademark registrations and grants a renewable protection term of 10 years to registered trademarks. As of December 31, 2012, we had registered six trademarks with the Trademark Office of the State Administration for Industry and Commerce and have two trademark applications outstanding in China.
Regulations on Foreign Currency Exchange
Under the PRC Foreign Exchange Administrative Regulations and various rules and regulations promulgated by SAFE, the Renminbi is freely convertible under current account transactions, including the distribution of dividends, interest payments, trade and service-related foreign exchange transactions. For foreign exchange transactions under capital account items, such as making inbound and outbound direct investment, borrowing foreign loans, repatriating investment and investment in securities outside of China, prior approval of or registration with SAFE or its local branches is required.
Foreign-invested enterprises may only buy, sell and remit foreign currencies at those banks authorized to conduct foreign exchange business after providing valid commercial documents and, in the case of capital account transactions, after obtaining approval from SAFE or its local branches. Capital investments by foreign-invested enterprises outside of China are also subject to limitations, which include approvals by the Ministry of Commerce, SAFE and the National Development and Reform Commission or their local counterparts.
Regulations on Offshore Parent Holding Companies’ Direct Investment in and Loans to Their PRC Subsidiaries
An offshore company may make an equity investment in a PRC company, which will transform the PRC company into a subsidiary of the offshore holding company and a foreign-invested enterprise after the investment. Such equity investment is subject to a series of laws and regulations generally applicable to any foreign-invested enterprise in China. Under these laws and regulations, the increase of the registered capital of a foreign-invested enterprise is subject to prior approval by the original approval authority of its establishment, which is usually the Ministry of Commerce or its local counterpart. In addition, the increase of registered capital and the total investment amount must both be registered with the State Administration for Industry and Commerce and SAFE or their local counterparts.
Shareholder loans made by offshore parent holding companies to their PRC subsidiaries are regarded as foreign debts in China for regulatory purposes and are subject to a number of PRC laws and regulations. Under these laws and regulations, such loans must be registered with SAFE or its local branches. Furthermore, the total amount of foreign debts that can be borrowed by such PRC subsidiaries, including any shareholder loans, should not exceed the difference between the total investment amount and the registered capital amount of the PRC subsidiaries, both of which are subject to governmental approvals.
In 2008, SAFE promulgated Circular 142 to regulate the conversion by a foreign-invested enterprise of foreign currency into Renminbi by restricting how the converted Renminbi may be used. Circular 142 requires that the registered capital of a foreign-invested enterprise converted from foreign currencies and settled in Renminbi may only be used for purposes within the business scope approved by the applicable governmental authorities and may not be used for equity investments within the PRC unless otherwise specifically provided for. In addition, SAFE strengthened its oversight of the flow and use of the registered capital of a foreign-invested enterprise converted from foreign currencies and settled in Renminbi. The use of such Renminbi capital may not be changed without SAFE approval, and it may not in any case be used to repay Renminbi loans if the proceeds of such loans have not been used for purposes within the foreign-invested enterprise’s approved business scope. Violations of Circular 142 may result in severe penalties, including substantial fines as set forth in the PRC Foreign Exchange Administrative Regulations.
Regulations on Dividend Distribution
Under applicable PRC laws and regulations, wholly foreign-owned enterprises in China may pay dividends only out of their accumulated profits, if any, determined in accordance with Chinese accounting standards and regulations. In addition, wholly foreign-owned enterprises in China are required to allocate at least 10% of their accumulated after-tax profits each year, if any, to fund certain reserve funds until these reserves have reached 50% of the registered capital of the enterprise. These reserves are not distributable as cash dividends. iSoftStone WFOE is restricted from distributing any dividends to us until it has met these requirements set out in the regulations.
According to the Enterprise Income Tax Law and its implementation rules, both of which became effective on January 1, 2008, dividends payable by a foreign-invested enterprise to its foreign investors will be subject to a 10% withholding tax if the foreign investors are considered as non-resident enterprises that are without any establishment or premise of business within China or if the dividends payable to such foreign investors do not have any connection with the establishment or premises of business of the foreign investors within China, to the extent that the dividends are deemed China-sourced income, unless such foreign investor’s jurisdiction of incorporation has a tax treaty with the PRC that provides for a different withholding arrangement.
41
Regulations on Overseas Investment by PRC Residents
In 2005, SAFE issued the Notice on Relevant Issues Concerning Foreign Exchange Administration for PRC Residents to Engage in Financing and Return Investments via Overseas Special Purpose Vehicles, or Circular 75. Circular 75 requires PRC residents, including both legal persons and natural persons, to register with an appropriate local SAFE branch before establishing or controlling any company outside of China, referred to as an “offshore special purpose company,” for the purpose of acquiring any assets of or equity interest in PRC companies and raising fund from overseas. When a PRC resident contributes the assets or equity interests it holds in a PRC company into the offshore special purpose company, or engages in overseas financing after contributing such assets or equity interests to the offshore special purpose company, such PRC resident must modify its SAFE registration in light of its interest in the offshore special purpose company and any change thereof. In addition, any PRC resident that is the shareholder of an offshore special purpose company is required to amend its SAFE registration with the local SAFE branch with respect to that offshore special purpose company in connection with any increase or decrease of capital, transfer of shares, merger, division, long-term equity investment or creation of any security interest. If these shareholders fail to comply, the PRC subsidiaries of the offshore special purpose company may be prohibited from distributing their profits and proceeds from any reduction in capital, share transfer or liquidation to their offshore parent company and the offshore parent company may be restricted in its ability to contribute additional capital into its PRC subsidiaries. Moreover, failure to comply with the above SAFE registration requirements could result in liability under PRC laws for evasion of foreign exchange restrictions.
In addition, the National Development and Reform Commission promulgated a rule in 2004 requiring its approval for overseas investment projects made by PRC entities. However, there exists great uncertainty as to the interpretation of this rule with respect to its application to a PRC individual’s overseas investment and, in practice, we are not aware of any precedents that a PRC individual’s overseas investment has been either approved by the National Development and Reform Commission or challenged by the National Development and Reform Commission based on the absence of its approval. See “Item 3.D. Key Information—Risk Factors—Risks Related to Doing Business in China—PRC regulations relating to the establishment of offshore special purpose companies by PRC residents may subject our PRC resident shareholders to personal liability and limit our ability to acquire PRC companies or to inject capital into our PRC subsidiaries, limit our PRC subsidiaries’ ability to distribute profits to us, or otherwise materially and adversely affect us.”
Regulations on Employee Share Options
According to regulations and rules issued by the People’s Bank of China and SAFE, all foreign exchange matters relating to employee stock holding plans, share option plans or similar plans of overseas listed companies with PRC citizens’ participation require approval from SAFE or its local counterpart. Domestic employees who are granted share options or shares by an overseas listed company are required to register with the relevant SAFE branch through a PRC agent and complete certain other procedures. Under the Stock Option Rule: (i) domestic employees include PRC citizens (inclusive of Hong Kong, Macau and Taiwan nationals) and foreign nationals who have continuously resided in China for at least a year, and (ii) a PRC agent may be a domestic company participating in the stock incentive plan or a domestic institution that is qualified to engage in asset custodian business and has been duly designated by a domestic company. The individuals’ foreign exchange income received from the sale of shares or dividends distributed by the overseas-listed company which is repatriated back to China shall first be remitted into a collective foreign exchange account opened and managed by the PRC agent before distribution to such individuals in a foreign currency or in RMB. We and our domestic employees who have been granted share options or shares are subject to these rules and in the process of filing with the relevant SAFE branch and undertaking certain other procedures according to these rules. In addition, the Ministry of Finance and the State Administration of Taxation has issued certain circulars concerning employee share options. Pursuant to the following circulars, our employees working in China who exercise share options will be subject to PRC individual income tax, and our PRC subsidiaries have an obligation to file documents related to employee share options with the relevant tax authorities and withhold individual income taxes resulting from the exercise of their share options:
| | • | | Circular on Issues relating to Collection of Individual Income Tax in connection with Income arising from Individual Stock Option, issued by the Ministry of Finance and the State Administration of Taxation on March 28, 2005; |
| | • | | Supplemental Notice on Payment of Individual Income Tax in connection with Income arising from Individual Share Option, issued by the State Administration of Taxation on September 30, 2006; |
| | • | | Circular on Several Issues on Collection of Individual Income Tax in connection with Income arising from Share Appreciation Rights and Restricted Shares, issued by the Ministry of Finance and the State Administration of Taxation on January 7, 2009; and |
| | • | | Circular on Issues relating to Individual Income Tax in connection with Share Incentive, issued by the State Administration of Taxation on August 24, 2009. |
If our employees fail to pay and we fail to withhold their individual income taxes, we may face sanctions imposed by tax authorities or other relevant PRC government authorities.
See “Item 3.D. Key Information—Risk Factors—Risks Related to Doing Business in China—We may be subject to fines and legal sanctions imposed by SAFE or other Chinese government authorities if we or our domestic employees or directors fail to comply with the PRC regulations relating to employee stock incentive plans adopted by companies for domestic employees.”
42
Regulation of Merger and Acquisitions of Domestic Enterprises by Foreign Investors
In 2006, six PRC regulatory agencies, including the CSRC, promulgated the Provisions Regarding Mergers and Acquisitions of Domestic Enterprises by Foreign Investors, or the M&A Rule, to more effectively regulate foreign investment in PRC domestic enterprises. Under the M&A Rule, equity or assets merger and acquisition of Chinese enterprises by foreign investors will be subject to the approval from the Ministry of Commerce or its competent local branches. The M&A Rule also requires offshore special purpose vehicles formed for the purposes of overseas listing of equity interests in PRC companies and controlled directly or indirectly by PRC companies or individuals to obtain the approval of the CSRC prior to the listing and trading of the securities of such special purpose vehicles on an overseas stock exchange.
The interpretation and application of the M&A Rule is currently unclear. However, our PRC counsel, Han Kun Law Offices, has advised us that based on its understanding of current PRC laws, rules and regulations, the M&A Rule does not require us to obtain prior CSRC approval for the listing and trading of our ADSs on the NYSE, because our iSoftStone WFOE was established as a foreign-invested enterprise before September 8, 2006, the effective date of the M&A Rule, and iSoftStone WFOE was not established through merger or acquisition. A copy of Han Kun Law Offices legal opinion regarding the M&A Rule is filed as an exhibit to our registration statement on Form F-1, which is available at the SEC’s website at www.sec.gov.
See “Item 3.D. Key Information—Risk Factors—Risks Related to Doing Business in China—Our failure to obtain the prior approval of the China Securities Regulatory Commission, or the CSRC, of the listing and trading of our ADSs on the NYSE could have a material adverse effect on our business, results of operations and reputation and the trading price of our ADSs.”
Regulation on Employment
The PRC Labor Contract Law and its implementing rules impose requirements concerning contracts entered into between an employer and its employees and establishes time limits for probationary periods and for how long an employee can be placed in a fixed-term labor contract. The Labor Contract Law and its implementation rules also require certain terminations to be based upon seniority rather than merit, which significantly affects the cost of reducing workforce for employers. In addition, if an employer intends to enforce a non-compete provision with an employee in a labor contract or non-competition agreement, it has to compensate the employee on a monthly basis during the term of the restriction period after the termination or ending of the labor contract. Employers in most cases are also required to provide a severance payment to their employees after their employment relationships are terminated, including under the circumstance that a labor contract expires without renewal because the employer refuses to renew the labor contract or provides less favorable terms for renewal. Because the Labor Contract Law and its implementing rules have not been in effect very long and because there is lack of clarity with respect to their implementation and potential penalties and fines, it is uncertain how it will impact our current employment policies and practices.
On October 28, 2010, the Standing Committee of the National People’s Congress promulgated the PRC Social Insurance Law, which became effective on July 1, 2011. According to the Social Insurance Law, employees must participate in pension insurance, work-related injury insurance, medical insurance, unemployment insurance and maternity insurance and the employers must, together with their employees or separately, pay the social insurance premiums for such employees.
Regulations on PRC Taxation
For a discussion of applicable PRC tax regulations, see “Item 5.A. Operating and Financial Review and Prospects—Operating Results —Taxes and Incentives—China.”
C. Organizational Structure
We are a Cayman Islands holding company and conduct substantially all of our business through 35 operating subsidiaries in China, two operating subsidiaries in the United States, one operating subsidiary in Canada, one operating subsidiary in the United Kingdom, one operating subsidiary in Germany, one operating subsidiary in South Korea, two operating subsidiary in Japan and one operating subsidiary in Hong Kong.
The following diagram illustrates our current corporate structure and the place of formation and the ownership of our major subsidiaries and affiliated entity as of the date of this annual report. All of our subsidiaries are 100% owned or controlled by us except for Beijing Guodian Ruantong Technology Co., Ltd., in which we have a 86.7% equity interest, Beijing Guodian Ruantong Jiangsu Technology Co., Ltd., in which we have a 86.7% equity interest, Beijing iSoftStone Jiewen Information Technology Co., Ltd., in which we have a 67% equity interest, iSYS Information Technology Co., Ltd., in which we have a 65% equity interest, Shenzhen Tengzhengxinbao Technology Co., Ltd., in which we have a 60% equity interest, Suzhou iSoftStone Information Technology Co., Ltd., in which we have a 60% equity interest, iSoftStone Technology Service Co., Ltd., in which we have a 75% equity interest, Tianjin iSoftStone Technology Service Co., Ltd., in which we have a 75% equity interest, Nanjing iSoftStone Technology Service Co., Ltd., in which we have a 75% equity interest, iSoftStone Technology Service Wuxi Co., Ltd., in which we have a 75% equity interest, and Xi’an iSoftStone Technology Service Co., Ltd., in which we have a 75% equity interest.
43
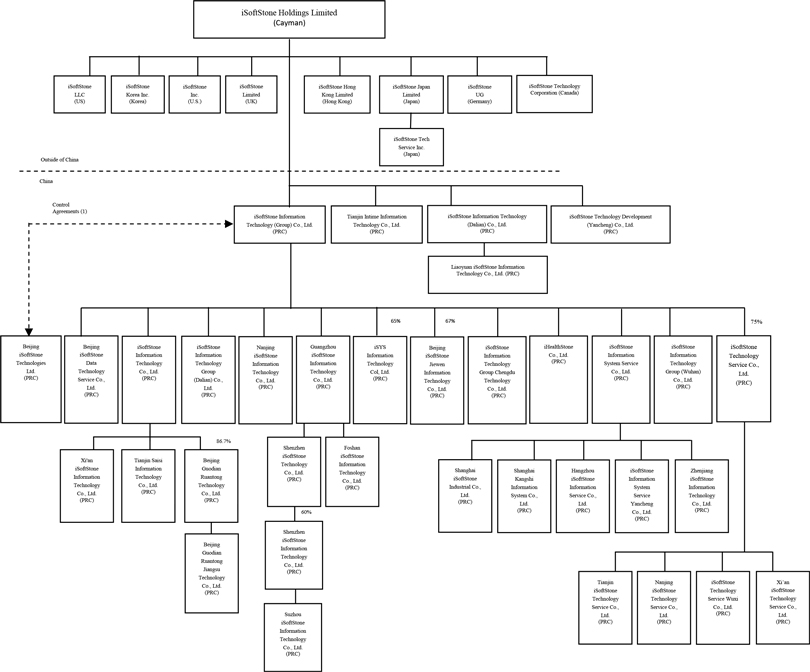
| (1) | Includes a series of contractual arrangements among iSoftStone WFOE, Beijing iSoftStone, and certain shareholders of Beijing iSoftStone, including an exclusive outsourcing agreement, an exclusive technology consulting and management service agreement, a trademark and software licensing agreement, an equity pledge agreement, and an irrevocable proxy. |
44
D. Property, Plant and Equipment
Facilities
Our principal executive offices are located on premises comprising approximately 12,948 square meters in an office building in Zhongguancun Software Park, Beijing, China. Except for the facility in Wuxi which is owned by us, we have leased all of our facilities from unrelated parties under leases with terms ranging from one to five years, and most of our leases are renewable at our option.
As of the date of this annual report, we had offices in 22 cities across the Greater China region, namely Beijing, Changsha, Chengdu, Dalian, Foshan, Guangzhou, Hangzhou, Jinan, Lanzhou, Liaoyuan, Nanjing, Shanghai, Shenzhen, Shijianzhuang, Suzhou, Tianjin, Wuhan, Wuxi, Xi’an, Yancheng, Zhenjiang and Taipei occupying an aggregate of 130,326 square meters. Outside of the Greater China region, we maintain offices in Boston, Kirkland (WA), New York, Toronto, Tokyo and Fukuoka, occupying an aggregate of 2,632 square meters .
45
The following table describes the space and uses of property for each of our facilities as of the date of this annual report:
| | | | | | |
Location | | Space | | | Usage of Property |
| | | (in square meters) | | | |
Greater China | | | | | | |
Beijing | | | 15,462 | | | Delivery center Headquarter Sales Office Data Center iSoftStone R&D Institute |
Changsha | | | 1,168 | | | Delivery center Sales Office |
Chengdu | | | 4,445 | | | Delivery center Sales Office |
Dalian | | | 1,523 | | | Delivery center Sales Office Training Center |
Foshan | | | 2,197 | | | Delivery center Sales Office |
Guangzhou | | | 3,684 | | | Delivery center Sales Office Training Center |
Hangzhou | | | 3,110 | | | Delivery center Sales Office |
Jinan | | | 537 | | | Delivery center Sales Office |
Lanzhou | | | 119 | | | Sales Office |
Liaoyuan | | | 758 | | | Delivery center Sales Office |
Nanjing | | | 17,465 | | | Delivery center Sales Office Data Center |
Shanghai | | | 6,227 | | | Delivery center Sales Office |
Shenzhen | | | 12,679 | | | Delivery center Sales Office Data Center |
Shijiazhuang | | | 128 | | | Delivery center Sales Office |
Suzhou | | | 278 | | | Delivery center Sales Office |
Tianjin | | | 8,009 | | | Delivery center Sales Office Data Center Training Center iSoftStone R&D Institute |
Wuhan | | | 5,725 | | | Delivery center Sales Office iSoftStone R&D Institute |
Wuxi | | | 37,738 | | | Delivery center Sales Office Data Center iSoftStone R&D Institute Training Center |
Xi’an | | | 7,142 | | | Delivery center Sales Office |
Yancheng | | | 1,499 | | | Delivery center Sales Office |
Zhenjiang | | | 380 | | | Delivery center Sales Office |
Taipei | | | 52 | | | Delivery center Sales Office |
Japan | | | | | | |
Fukuoka | | | 62 | | | Delivery center Sales Office |
Tokyo | | | 184 | | | Delivery center Sales Office |
U.S. | | | | | | |
Boston | | | 246 | | | Delivery center Sales Office |
Kirkland (WA) | | | 1,900 | | | Delivery center Sales Office |
New York | | | 160 | | | Delivery center Sales Office |
Canada | | | | | | |
Toronto | | | 80 | | | Delivery center Sales Office |
46
In November 2010, we opened a new facility for our sales and delivery center in Wuxi. We initially leased approximately 10,000 square meters at this facility and purchased the whole office building with a space of 37,738 square meters in July 2011 from Wuxi Xutian Software Science Development Co., Ltd., a wholly owned subsidiary of TecPark Technology Development Co., Ltd., or TecPark. TecPark is a real estate company that is specialized in developing IT and software parks throughout China. TecPark is controlled by Mr. Jiadong Qu, who is a minority shareholder owning less than 5% of our shares upon closing of our initial public offering and less than 1% of our shares as of March 31, 2013. None of our officers or directors or their respective close family members has a direct or indirect ownership interest or serves as a director, officer or employee in TecPark.
In August 2012, we signed an agreement to lease new office premises with an area of approximately 43,200 square meters in Beijing from Beijing Ruantong Xutian Technology Development Co., Ltd., which will be used as our company headquarters to replace existing rented offices in multiple locations in Beijing and to meet the growth of our global business and increase of the number of employees. The related lease has a ten years term starting from January 1, 2013 with rental expense for the entire term being approximately $94.6 million. We expect to move in the new office in the second quarter of 2013. TecPark, as a limited partner, owns 30% interest in a private equity fund which owns 99.9999% interest in Beijing Ruantong Xutian Technology Development Co., Ltd. The remaining interests in Beijing Ruantong Xutian Technology Development Co., Ltd. are owned by independent third parties. None of our officers or directors or their respective close family members has a direct or indirect ownership interest or serves as a director, officer or employee in Beijing Ruantong Xutian Technology Development Co., Ltd. or the related private equity fund.
Our facility expansion plan has been and will be assessed, evaluated, and approved by our management and board independently on a case by case basis as need arises.
ITEM 4A. UNRESOLVED STAFF COMMENTS
None.
ITEM 5. OPERATING AND FINANCIAL REVIEW AND PROSPECTS
The following discussion of our financial condition and results of operations is based upon and should be read in conjunction with our consolidated financial statements and their related notes included in this annual report on Form 20-F. This report contains forward-looking statements within the meaning of Section 27A of the Securities Act of 1933, or the Securities Act, and Section 21E of the Securities Exchange Act of 1934, as amended, or the Exchange Act. In evaluating our business, you should carefully consider the information provided under “Item 3.D. Key Information—Risk Factors.” We caution you that our business and financial performance are subject to substantial risks and uncertainties.
47
A. Operating Results
Overview
We are a leading China-based IT services provider, serving both Greater China and Global clients. Revenues from our Greater China clients include all revenues from companies headquartered in Greater China, and revenues from Global clients include all revenues from companies headquartered outside of Greater China, including revenues from the Greater China-based operations of these overseas clients. Net revenues from our Greater China and Global client groups accounted for 55.9% and 44.1% of our net revenues in 2010, 58.4% and 41.6% of our net revenues in 2011, and 64.0% and 36.0% of our net revenues in 2012, respectively.
Our integrated suite of IT services and solutions includes IT Services (including application development and maintenance services, or ADM, R&D services, and infrastructure and software services), Consulting & Solutions and BPO services. Our IT Services, Consulting & Solutions and BPO service lines accounted for 68.5%, 27.6% and 3.9% of our net revenues in 2010, 68.9%, 26.8% and 4.3% of our net revenues in 2011, and 63.1%, 33.4% and 3.5% of our net revenues in 2012, respectively.
We organize and manage our business primarily around four target industry verticals: Technology; Communications; Banking, Financial Services and Insurance, or BFSI; and Energy, Transportation and Public sector, or ETP. Our Technology, Communications, BFSI, and ETP industry verticals accounted for 33.1%, 38.3%, 17.1% and 6.4% of our net revenues in 2010, 30.2%, 38.3%, 20.4% and 5.2% of our net revenues in 2011, and 27.3%, 36.4%, 20.9% and 9.4% of our net revenues in 2012, respectively. Since the formation of ISST in January 2013, we expect most of our Technology and Communications business will be operated by ISST going forward. The portion of our existing Technology and Communications business that will be excluded from ISST includes our related U.S. business and certain customers agreed to by us and Huawei.
We have built one of the largest sales and delivery platforms for IT services and solutions in China. We have grown from six sales and delivery centers as of January 1, 2007 to 27 sales and delivery centers as of the date of this annual report, of which 20 are located in China, spanning Tier One cities, such as Beijing, Shanghai and Shenzhen, as well as key Tier Two and Tier Three cities, such as Changsha, Chengdu, Dalian, Foshan, Guangzhou, Hangzhou, Nanjing, Tianjin, Wuhan and Wuxi. We also have operations in the North America, Europe and Japan that are close to the main offices of key Global clients.
Human resource management and planning is critical to our success, and we are committed to effectively recruiting, training, developing and retaining the best talent. Our total number of employees has grown from 1,527 employees as of January 1, 2007 to 14,512 employees as of December 31, 2012. To improve the skill sets of our staff, we have established four dedicated internal training centers, in Wuxi, Tianjin, Guangzhou and Dalian. For managers, we have established a “Top 300” leadership development program to identify, develop, and promote qualified candidates to meet our middle and senior management needs.
Since inception, our net revenues have grown primarily through our organic business development efforts, supplemented by strategic acquisitions and alliances. Historically, acquisitions have allowed us to acquire additional expertise and capabilities and expand our client base and presence in key client locations, such as the United States and Japan. Recent strategic acquisitions include: our January 2011 acquisition of iHealthStone Co., Ltd., or iHealthStone, which enhanced our capability in providing IT services to Greater China and Global clients in the healthcare industry; our August 2011 acquisition of Adventier, which enhanced our end-to-end service offerings, including ERP consulting and delivery capabilities; our April 2012 acquisition of assets and business of Nanjing Jiangchen Science & Technology Co., Ltd., or Jiangchen, which strengthened our capabilities and domain knowledge in electric power distribution and broadened our IT service capabilities in the entire electric power industry; and our June 2012 acquisition of Abovenet International Inc., or Abovenet, which further strengthened our business intelligence and data services with more advanced capability and greater geography coverage.
In 2010, 2011 and 2012, our net revenues were $197.0 million, $283.4 million and $381.1 million, respectively. In 2010, 2011 and 2012, our net income (loss) improved from a net loss of $3.6 million in 2010 to a net income of $19.0 million in 2011, and then increased to a net income of $22.1 million in 2012. Our non-GAAP net income for 2010, 2011 and 2012, which excludes share-based compensation, amortization of intangible assets from acquisitions, interest expense of convertible notes, changes in fair value of contingent consideration in connection with business combinations and changes in the fair value of the convertible notes derivatives from our U.S. GAAP net income (loss), was $19.6 million, $34.3 million, and $37.1 million, respectively. For a reconciliation of our non-GAAP net income to our U.S. GAAP net income (loss), see footnote (4) on page 5 of this annual report.
Factors Affecting Our Results of Operations
We believe that the most significant macro-level factors affecting our results of operations include:
| | • | | health of the global economy and the growth and development of China’s economy; |
| | • | | the overall growth of China’s IT services industry; |
| | • | | IT spending by Greater China and Global clients; |
| | • | | competition and related pricing pressure from other IT services providers in China, India and other global delivery locations; |
| | • | | wage inflation, particularly in China where most of our employees are based; and |
| | • | | changes in exchange rates, especially changes in the exchange rate between the Renminbi and the U.S. dollar. |
48
Our results of operations are also expected to benefit from PRC government policies and regulations designed to foster the IT services industry in China. These policies and benefits are reflected in, among other things:
| | • | | China’s IT services industry designation as a priority industry under the PRC government’s current Five-Year Plan, the central government’s strategic roadmap for economic development; |
| | • | | strong central, provincial and local government support for China-based IT services providers in the form of grants, subsidies, incentive and other awards for training, technology development, research and development and other infrastructure development; |
| | • | | favorable tax treatment and policies, including the tax policy announced in July 2010 exempting certain companies located in 21 jurisdictions, including Beijing, Shanghai, Guangzhou and Shenzhen, from paying a 5% business tax on income derived from contracts signed with offshore entities for providing information technology outsourcing, business processing outsourcing and knowledge process outsourcing services; |
| | • | | actions by the Chinese government to encourage state-owned enterprises to outsource more IT and non-core operational functions to enhance their competitiveness and efficiency; and |
| | • | | an increasing number of PRC municipal governments starting to implement their “Smart City” strategies and launching their “Smart City” projects, designed to improve the quality of local industry, environment protection as well as public services by building a cross-agency data collection, information sharing, and collaborative decision-making platforms. By January 2013, the PRC Ministry of Housing and Urban-Rural Development had announced 90 national Smart City pilot programs, as one of the government’s key initiatives to accelerate China’s urbanization process. |
Early on, we sought to identify and benefit from the various government incentives, subsidies and other efforts designed to promote growth of the IT services industry in China. For more information, please see “Item 5.A. Operating and Financial Review and Prospects—Operating Results—Government Subsidies”.
Our results of operations in any given period are more directly affected by company specific factors, including:
| | • | | Revenue mix by service line. Our IT Services, Consulting & Solutions and BPO service lines accounted for 68.5%, 27.6% and 3.9% of our net revenues in 2010, 68.9%, 26.8% and 4.3% of our net revenues in 2011, and 63.1%, 33.4% and 3.5% of our net revenues in 2012, respectively. Our Consulting & Solutions service line has generally enjoyed higher margins, followed by our IT Services then BPO service lines. As the mix of services we deliver in any period will vary, we expect our margins will vary accordingly. |
| | • | | Our ability to deepen and expand our suite of service offerings while maintaining our high standard of quality. The breadth and depth of our service offerings impacts our ability to grow revenues from new and existing clients. Through research and development, targeted hiring and strategic acquisitions, we have proactively invested in broadening our existing service lines, including those for serving our specific industry verticals. Our future growth and success depend significantly on our ability to anticipate the needs of our clients and rapidly develop and maintain these capabilities, including relevant industry vertical domain knowledge and technological capabilities required to meet those needs, while maintaining our high standard of quality. |
| | • | | Diversity of our client base. In recent years, as we have expanded significantly in the IT services industry, we have diversified our client base of both Greater China and Global clients. In the twelve months ended December 31, 2012, our clients included 89 Fortune 500 companies, of which 34 were our Greater China clients and 55 were our Global clients. While we are seeking out new clients in each of our target industry verticals, we will continue to enhance our strategic relationships with our existing clients. Our five largest clients accounted for 46.1%, 43.2% and 47.2% of our net revenues in 2010, 2011 and 2012, respectively. The gain or loss of any significant client, or any significant change in the business volume from a significant client, will affect our results of operations. |
| | • | | Pricing of our services. For time-and-expense contracts, our billing rates are a key factor impacting our gross margins and profitability. Billing rates vary by service offering and location of service delivery, and aggregate billings per engagement are driven by a number of factors, including the mix of delivery model (onsite/onshore or offsite/offshore) and the mix of experience levels of personnel on a particular project. Some larger clients receive reduced pricing through reduced billing rates. As a client relationship matures and deepens, we seek to maximize our billings and profitability by expanding the scope of services offered to the client and optimizing the mix of professionals providing services to that client. We are entering into a growing portion of our contracts on a fixed-price basis. Our ability to profitably price these contracts requires that we accurately assess the time and resources required for completing projects. Underestimating the required time and resources may result in cost overruns or mismatches in project staffing, thereby yielding lower profit margins than anticipated. Conversely, overestimating our costs may result in our submitting uncompetitive bids and inability to win business. |
49
| | • | | Effective retention and management of employees. Our ability to effectively retain and manage our employees will have an effect on our gross margin and our results of operations. We manage employee headcount and utilization based on ongoing assessments of our project pipeline and requirements for professional capabilities. An unanticipated termination of a significant project could also cause us to experience lower employee utilization resulting from a higher than expected number of idle employees. Our ability to effectively utilize our employees is typically improved by longer-term engagements due to increasing predictability of client needs over the course of the engagement. Our attrition rates were 19.8%, 24.8% and 23.8% in 2010, 2011 and 2012, respectively. A significant increase in our attrition rate could decrease our productivity and, in turn, our profitability. |
| | • | | Investments in our delivery platform. We have grown from six sales and delivery centers as of January 1, 2007 to 27 sales and delivery centers as of the date of this annual report, of which 20 are located in China, spanning Tier One cities such as Beijing, Shanghai and Shenzhen, as well as key Tier Two and Tier Three cities such as Changsha, Chengdu, Dalian, Foshan, Guangzhou, Hangzhou, Nanjing, Tianjin, Wuhan and Wuxi, and we have operations in the North America, Europe and Japan that are close to the main offices of key Global clients. Our integrated global delivery platform allows us to deliver our services through a blend of onsite/onshore and offsite/offshore model. Early on, we recognized the benefits of expanding into China’s Tier Two and Tier Three cities, which we view not just a cost-saving measure, even though labor costs tend to be lower in Tier Two and Tier Three cities. More importantly, we see this as a competitive advantage that allows us access to local business opportunities, to be nearer to our clients, and to build closer relationships with local governments who are the main promoters of local industry transformation, technology innovations and urbanization in China. Our ability to effectively utilize this robust delivery platform will significantly affect our results of operations in the future. |
| | • | | Investments in training and R&D. To develop deeper industry knowledge and deeper understanding of our clients’ needs and more quickly and cost-effectively address our clients’ requirements while maintaining the high quality standard of our services, we continually invest in training and research and development. We have four dedicated internal training centers alongside our sales and delivery centers in Wuxi, Tianjin, Guangzhou and Dalian. In addition, we continuously invest in R&D to enhance our domain knowledge and improve our competitiveness. Among other activities, we established four iSoftStone R&D institutes in Beijing, Tianjin, Wuhan and Wuxi and have leveraged our R&D efforts to build a library of industry-specific proprietary software modules for our use in the delivery of our services. We expect that our ability to effectively utilize our training and R&D capabilities will significantly affect our results of operations in the future. |
| | • | | Impact of strategic alliances and business acquisitions (including ISST). We have pursued and may continue to pursue strategic alliance and acquisition opportunities to expand our geographic presence, establish or deepen client relationships, increase our service offerings and capabilities and enhance our industry and technical expertise. For example, our acquisition of Adventier in 2011 enhanced our end-to-end service offerings, including ERP consulting and delivery capabilities, and our acquisition of Abovenet in 2012 further strengthened our business intelligence and data services with more advanced capability and greater geography coverage. Our ability to successfully identify, execute, integrate and manage new alliances and acquisitions can have a significant effect on our results of operations. We often enter into strategic alliances with Global technology clients as they are expanding into the China market. Examples of these strategic alliances include our partnership with IBM to build Cloud Center of Excellence in cities like Foshan, Liaoyuan, Lanzhou and Xiangyang. The strategic formation of ISST is expected to favorably impact our financial results and operations in future periods with expected benefits including: Huawei revenue commitments totaling at least RMB 650 million in 2013, RMB 950 million in 2014, and RMB 1.2 billion in 2015, with good-faith discussions about additional business volumes for the years thereafter (subject to reduction if ISST fails to meet Huawei’s general requirements in terms of service quality, delivery schedule or reasonable level of cost and expenses or if ISST’s non-Huawei client business revenues are less than its Huawei-related revenues by the end of 2015 and for each year thereafter); Huawei’s commitment to provide ISST with certain supportive policies with respect to annual billing rate increase, gross margin, and shortening of payment cycle; and opportunities to leverage Huawei’s leading market position in the Technology and Communication sections to further deepen our domain knowledge and expand our business (both domestically in the PRC and globally). Please see “Item 4. Information on the Company—History and Development of the Company—iSoftStone Technology Service Co., Ltd.” and “Item 3.D. Key Information—Risk Factors—Risks Relating to Our Business and Industry—We may not realize the anticipated benefits ISST which we formed together with Huawei” for more information. |
| | • | | Seasonality. Our business is also affected by seasonal trends. In particular, our net revenues are typically progressively higher in the second, third and fourth quarters of each year compared to the first quarter of each year due to seasonal trends, such as: (i) a general slowdown in business activities and a reduced number of working days for our professionals during the first quarter of each year as a result of the Chinese New Year holiday period, and (ii) our customers in general tend to spend their IT budgets in the second half of the year and in particular the fourth quarter. Other factors that may cause our quarterly operating results to fluctuate include, among others, changes in general economic conditions in China and the impact of unforeseen events. We believe that our net revenues will continue to be affected in the future by seasonal trends. As a result, you may not be able to rely on period to period comparisons of our operating results as an indication of our future performance, and we believe it is more meaningful to evaluate our business on an annual basis. |
50
Acquisitions
Since inception, our net revenues have grown primarily from organic business development, supplemented by strategic acquisitions. Historically, acquisitions have allowed us to acquire additional expertise and capabilities and expand our client base and presence in key client locations, such as the United States and Japan. The financial results for our acquired businesses are consolidated in our operating results for periods after the acquisition. Due to integration with our other operations, it is generally difficult for us to track the revenue contributions of specific, individual acquisitions in subsequent periods.
To assist in identifying revenue attributable to recent acquisitions in any period and in evaluating comparable period results, in recent periods we have begun to track organic and acquired revenues. For purposes of period-over-period comparisons, revenues from acquisitions completed within 12 months of the relevant period end are deemed acquired revenues and subtracted from total period revenues to determine organic revenues for the respective period. Of the $283.4 million and $381.1 million in total net revenues for 2011 and 2012, 99.5% and 99.1% were organic, with acquisitions completed within the 12-month period preceding December 31, 2011 and 2012, as appropriate, contributing the remaining 0.5% and 0.9% of the total net revenues. In future periods, depending on the acquisition structure, size and the speed with which an acquired business is integrated into our existing business or other factors, it may not be practicable or meaningful to distinguish acquired revenues.
The following are what we believe our most significant recent acquisitions:
| | • | | In October 2010, we acquired Ascend, expanding our geographic and service capabilities to better serve global BFSI clients and deepen our BFSI domain expertise. |
| | • | | In November 2010, we acquired Shanghai Kangshi Information Systems Company Limited, or Shanghai Kangshi, enhancing our capability to provide business intelligence services to our Greater China and Global clients. |
| | • | | In January 2011, we acquired iHealthStone, which enhanced our capability in providing IT services to Greater China and Global clients in the healthcare industry. |
| | • | | In August 2011, we acquired Adventier, which enhanced our end-to-end service offerings, including ERP consulting and delivery capabilities. |
| | • | | In April 2012, we acquired assets and business of Jiangchen, which strengthened our capabilities and domain knowledge in electric power distribution and broadened our IT services capabilities in the entire electric power industry. |
| | • | | In June 2012, we acquired Abovenet, which further strengthened our business intelligence and data services with more advanced capability and greater geography coverage. |
We anticipate that selective acquisitions and strategic alliances will expand our capabilities, geographic presence and service offerings, increase our scale, and continue to be a source of revenue growth. Acquisition-related challenges include quickly and effectively integrating the acquired business and services into our existing business and service offerings and retaining acquired clients and employees. For additional information on these and other acquisitions, see “Item 3.D. Key Information—Risk Factors—Risks Relating to Our Business and Industry—If we fail to integrate or manage acquired companies efficiently, or if the acquired companies do not perform to our expectations, we may not be able to realize the benefits envisioned for such acquisitions, and our overall profitability and growth plans may be adversely affected.” As a result, we may not realize the benefits of our acquisitions as soon as anticipated or at all. Also, these challenges become more difficult as we expand our business from primarily operating in China to operating on a global basis, or as we acquire technology or industry domain knowledge or technical know-how in which we have not historically maintained expertise.
Investments
We are constantly evaluating new investment opportunities and technology trends and investing in business initiatives that have potential to become future growth drivers. For example, in September 2012, we formed a joint venture called Foshan iSoftStone Information Technology Co., Ltd. with Guangdong WIOT, to provide services including the planning, construction and operation of Smart City projects. This joint venture provides our Smart City clients an integrated suite of consulting and solutions services, including top-level design, application integration, Internet of Things (IOT) construction and data center operation.
Certain Income Statement Line Items
Net Revenues
Our net revenues represent our total revenues from operations, less business taxes. In recent years, we have experienced rapid growth and significantly expanded our business. We are subject to business taxes at a rate of 5% of total revenues for certain types of contracts. Our net revenues increased from $197.0 million in 2010 to $283.4 million in 2011 and $381.1 million in 2012, or 43.9% and 34.5% growth, respectively. We discuss below the breakdown of our net revenues by service line, geographic markets, client industry, major clients and pricing method.
51
Net Revenues by Service Line
We derive net revenues by providing an integrated suite of IT services and solutions, including: (i) IT Services, which primarily includes application development and maintenance services, or ADM, as well as R&D services and infrastructure and software services; (ii) Consulting & Solutions; and (iii) BPO services. The following table presents our net revenues by service line for 2010, 2011 and 2012:
| | | | | | | | | | | | | | | | | | | | | | | | |
| | | Year Ended December 31, | |
| | | 2010 | | | 2011 | | | 2012 | |
| | | Net
Revenues | | | % of Net
Revenues | | | Net
Revenues | | | % of Net
Revenues | | | Net
Revenues | | | % of Net
Revenues | |
| | | (dollars in millions, except for percentages) | |
IT Services | | $ | 134.9 | | | | 68.5 | % | | $ | 195.1 | | | | 68.9 | % | | $ | 240.8 | | | | 63.1 | % |
Consulting & Solutions | | | 54.3 | | | | 27.6 | | | | 76.1 | | | | 26.8 | | | | 127.2 | | | | 33.4 | |
BPO Services | | | 7.8 | | | | 3.9 | | | | 12.2 | | | | 4.3 | | | | 13.1 | | | | 3.5 | |
| | | | | | | | | | | | | | | | | | | | | | | | |
Total net revenues | | $ | 197.0 | | | | 100.0 | % | | $ | 283.4 | | | | 100.0 | % | | $ | 381.1 | | | | 100.0 | % |
| | | | | | | | | | | | | | | | | | | | | | | | |
IT Services. Historically, IT Services has represented the substantial majority of our net revenues. Our net revenues from IT Services increased significantly in absolute terms as a result of our strengthened ability to increase the number and scope of our engagements with our major IT Services clients and the strong demand for outsourced technology services. The following table sets forth our net revenues by the major components of our IT Services for 2010, 2011 and 2012:
| | | | | | | | | | | | | | | | | | | | | | | | |
| | | Year Ended December 31, | |
| | | 2010 | | | 2011 | | | 2012 | |
| | | Net
Revenues | | | % of IT
Services
Net
Revenues | | | Net
Revenues | | | % of IT
Services
Net
Revenues | | | Net
Revenues | | | % of IT
Services
Net
Revenues | |
| | | (dollars in millions, except for percentages) | |
ADM Services | | $ | 61.8 | | | | 45.8 | % | | $ | 97.4 | | | | 49.9 | % | | $ | 127.1 | | | | 52.8 | % |
R&D Services | | | 66.8 | | | | 49.5 | | | | 85.7 | | | | 43.9 | | | | 102.7 | | | | 42.6 | |
Infrastructure and Software Services | | | 6.3 | | | | 4.7 | | | | 12.0 | | | | 6.2 | | | | 11.0 | | | | 4.6 | |
| | | | | | | | | | | | | | | | | | | | | | | | |
Total IT Services net revenues | | $ | 134.9 | | | | 100.0 | % | | $ | 195.1 | | | | 100.0 | % | | $ | 240.8 | | | | 100.0 | % |
| | | | | | | | | | | | | | | | | | | | | | | | |
Key drivers for growth in particular IT Services components include:
| | • | | Greater China clients’ increasing adoption of technology outsourcing and desire to engage with China-based companies as their providers; |
| | • | | Global clients’ increasing their focus on China as a long-term growth market for their own products and services and increasing acceptance of China as a primary or complementary location for delivery of IT services; |
| | • | | a growing willingness by independent software vendors and hardware original equipment manufacturers, or OEMs, to outsource product development; |
| | • | | a growing willingness of our existing clients to engage us to provide additional services which they may not have purchased from us or others previously; and |
| | • | | strategic alliances and business acquisitions, such as our acquisition in March 2009 of the IT services business of Shenzhen Star Ronghe Science and Technology Co., Ltd., or Shenzhen Star, enhancing our client relationship with Huawei and significantly increasing the growth of our R&D service line. |
52
Consulting & Solutions. We have provided Consulting & Solutions services since our inception. Our industry expertise and technical know-how in targeted industry verticals have enabled us to grow our Consulting & Solutions revenues by delivering solutions designed to improve a client’s technology functionality, business performance and overall competitiveness. In 2011 and 2012, we won an increasing number of Smart City Consulting & Solutions service projects in Chinese domestic public sector in various Tier Two and Tier Three cities in China and we expect that these types of Consulting & Solutions businesses will continue to be one of our growth drivers in the future. Our Consulting & Solutions engagements are often strategic in nature and involve frequent contact with c-level executives. Consulting & Solutions engagements also help us identify and secure additional opportunities to offer clients complementary IT Services. Key investments in this service line include development of industry-specific solutions and strategic hires and acquisitions to obtain critical domain expertise.
BPO Services. We began investing in our BPO service line and recognized our first BPO services revenues in 2008. Our BPO service line leverages our industry expertise, allowing clients to achieve operational efficiencies and cost savings by outsourcing non-core business processes to us. By providing BPO services, we gain knowledge of each client’s unique business, often resulting in opportunities for us to cross-sell additional services.
While we expect IT Services to continue to grow and account for the majority of our net revenues in the foreseeable future, we also expect continued growth in our Consulting & Solutions and BPO net revenues in absolute terms.
Net Revenues by Geographic Markets
We classify our net revenues into the following geographic markets: Greater China (which includes China, Taiwan, Hong Kong and Macau) and Global (which includes the United States, Europe, Japan and others), which accounted for 55.9% and 44.1% of our net revenues in 2010, 58.4% and 41.6% of our net revenues in 2011, and 64.0% and 36.0% of our net revenues in 2012, respectively. We record our net revenues based on the headquarters of our clients, irrespective of the location of the specific client entity which we serve or the locations at which our services are delivered or the invoice is rendered. The following table sets forth our net revenues by geographic market for 2010, 2011 and 2012:
| | | | | | | | | | | | | | | | | | | | | | | | |
| | | Year Ended December 31, | |
| | | 2010 | | | 2011 | | | 2012 | |
| | | Net
Revenues | | | % of Net
Revenues | | | Net
Revenues | | | % of Net
Revenues | | | Net
Revenues | | | % of Net
Revenues | |
| | | (dollars in millions, except for percentages) | |
Greater China | | $ | 110.1 | | | | 55.9 | % | | $ | 165.5 | | | | 58.4 | % | | $ | 244.0 | | | | 64.0 | % |
Global: | | | | | | | | | | | | | | | | | | | | | | | | |
United States | | | 53.6 | | | | 27.1 | | | | 71.4 | | | | 25.2 | | | | 86.4 | | | | 22.7 | |
Europe | | | 12.7 | | | | 6.5 | | | | 21.4 | | | | 7.5 | | | | 25.0 | | | | 6.6 | |
Japan | | | 20.4 | | | | 10.4 | | | | 24.3 | | | | 8.6 | | | | 23.3 | | | | 6.1 | |
Others | | | 0.2 | | | | 0.1 | | | | 0.8 | | | | 0.3 | | | | 2.4 | | | | 0.6 | |
| | | | | | | | | | | | | | | | | | | | | | | | |
Global total | | | 86.9 | | | | 44.1 | | | | 117.9 | | | | 41.6 | | | | 137.1 | | | | 36.0 | |
| | | | | | | | | | | | | | | | | | | | | | | | |
Total net revenues | | $ | 197.0 | | | | 100.0 | % | | $ | 283.4 | | | | 100.0 | % | | $ | 381.1 | | | | 100.0 | % |
| | | | | | | | | | | | | | | | | | | | | | | | |
The table above reflects, among other things, the strength of our Greater China business during the recent economic crisis. Also, despite the significant slowing of IT spending in the United States and Europe, we were able to grow our net revenues in those markets, both organically and through key hiring and strategic acquisitions.
We expect sales to our Greater China clients to grow as they continue and increase outsourcing to third-party IT services providers to achieve the benefits associated with outsourcing, such as the ability to focus on their core businesses, leverage best-in-class systems knowledge and benefit from operational efficiencies over time. At the same time, we also expect that, sales to our Global clients will grow, although at a slower rate compared to Greater China sales, as Global clients increase their focus on China as a long-term growth market for their own products and services and continue to develop long-term relationships with China-based IT services providers as they continue to diversify the key locations to which they send outsourced work.
Net Revenues by Client Industry
To date, we have focused on serving clients in four target industry verticals, each with large and growing demand for IT services and solutions: Technology, Communications, BFSI and ETP.
53
The following table sets forth our net revenues by client industry for 2010, 2011 and 2012:
| | | | | | | | | | | | | | | | | | | | | | | | |
| | | Year Ended December 31, | |
| | | 2010 | | | 2011 | | | 2012 | |
| | | Net
Revenues | | | % of Net
Revenues | | | Net
Revenues | | | % of Net
Revenues | | | Net
Revenues | | | % of Net
Revenues | |
| | | (dollars in millions, except for percentages) | |
Technology | | $ | 65.2 | | | | 33.1 | % | | $ | 85.6 | | | | 30.2 | % | | $ | 104.2 | | | | 27.3 | % |
Communications | | | 75.7 | | | | 38.3 | | | | 108.6 | | | | 38.3 | | | | 138.9 | | | | 36.4 | |
BFSI | | | 33.6 | | | | 17.1 | | | | 57.9 | | | | 20.4 | | | | 79.7 | | | | 20.9 | |
ETP | | | 12.5 | | | | 6.4 | | | | 14.8 | | | | 5.2 | | | | 36.0 | | | | 9.4 | |
Other | | | 10.0 | | | | 5.1 | | | | 16.5 | | | | 5.9 | | | | 22.3 | | | | 6.0 | |
| | | | | | | | | | | | | | | | | | | | | | | | |
Total net revenues | | $ | 197.0 | | | | 100.0 | % | | $ | 283.4 | | | | 100.0 | % | | $ | 381.1 | | | | 100.0 | % |
| | | | | | | | | | | | | | | | | | | | | | | | |
Historically, a substantial majority of our net revenue are from clients in the technology industry and the communications industry, which includes both telecommunications operators and communications equipment vendors. Our growth in net revenues from these industries has been driven primarily by the increase in demand for outsourced technology services. Following the formation of ISST, we expect the substantial majority of our Technology and Communications business will be conducted by ISST going forward. With the long-term, large-scale and sustained business account we secured from Huawei in connection with the formation of ISST, we expect net revenue from our clients in the technology industry and the communications industry to continue to grow. In the future, we expect to focus increasingly on serving clients in a broader range of industries, including a greater focus on BFSI and ETP. With increased focus on these industries, we expect net revenue from these industries to grow significantly.
Net Revenues by Key Clients
We have grown with our clients by increasingly expanding the scope and size of our engagements, and we have grown our key client base both by our internal business development efforts and through strategic acquisitions. From 2010 to 2012, we increased the number of clients generating over $1.0 million in annual net revenues from 30 in 2010 to 45 in 2011 and 49 in 2012, and we increased the number of clients generating over $3.0 million in annual net revenues from eight in 2010 to 13 in 2011 and 17 in 2012. The following table sets forth total net revenues contributed by our top five and top ten clients for 2010, 2011 and 2012:
| | | | | | | | | | | | | | | | | | | | | | | | |
| | | Year Ended December 31, | |
| | | 2010 | | | 2011 | | | 2012 | |
| | | Net
Revenues | | | % of Net
Revenues | | | Net
Revenues | | | % of Net
Revenues | | | Net
Revenues | | | % of Net
Revenues | |
| | | (dollars in millions, except for percentages) | |
Top five | | $ | 90.8 | | | | 46.1 | % | | $ | 122.4 | | | | 43.2 | % | | $ | 180.0 | | | | 47.2 | % |
Top ten | | $ | 107.0 | | | | 54.3 | % | | $ | 153.1 | | | | 54.0 | % | | $ | 222.0 | | | | 58.2 | % |
In 2010, 2011 and 2012, Huawei and Microsoft contributed 25% and 13%, 23% and 9% and 26% and 8% of our net revenues, respectively.
The volume of work we perform for specific clients is likely to vary from year to year, as we are typically not their exclusive external IT services provider, and a major client in one year may not contribute the same amount or percentage of our net revenues in a subsequent year.
Net Revenues by Pricing Method
We provide our services on a time-and-expense basis, a fixed-price basis or, with respect to our BPO services, on the basis of volume of work processed for our clients. Our engagement models depend on the type of services provided to a client, the mix and locations of professionals involved, and the business outcomes our clients are looking to achieve. We derive a majority of our net revenues on a fixed-price basis, which our clients in Greater China typically prefer. The following table sets forth out net revenues by pricing method for 2010, 2011 and 2012:
| | | | | | | | | | | | | | | | | | | | | | | | |
| | | Year Ended December 31, | |
| | | 2010 | | | 2011 | | | 2012 | |
| | | Net
Revenues | | | % of Net
Revenues | | | Net
Revenues | | | % of Net
Revenues | | | Net
Revenues | | | % of Net
Revenues | |
| | | (dollars in millions, except for percentages) | |
Time-and-expense basis | | $ | 79.4 | | | | 40.3 | % | | $ | 107.3 | | | | 37.9 | % | | $ | 142.5 | | | | 37.5 | % |
Fixed-price basis | | | 115.8 | | | | 58.8 | | | | 172.7 | | | | 60.9 | | | | 235.9 | | | | 61.9 | |
Volume basis (BPO) | | | 1.8 | | | | 0.9 | | | | 3.4 | | | | 1.2 | | | | 2.7 | | | | 0.6 | |
| | | | | | | | | | | | | | | | | | | | | | | | |
Total net revenues | | $ | 197.0 | | | | 100.0 | % | | $ | 283.4 | | | | 100.0 | % | | $ | 381.1 | | | | 100.0 | % |
| | | | | | | | | | | | | | | | | | | | | | | | |
54
Cost of Revenues, Gross Profit and Gross Margin
The following table sets forth our net revenues, cost of revenues, gross profit and gross margin, as well as a breakdown of the principal components of our cost of revenues in 2010, 2011 and 2012:
| | | | | | | | | | | | | | | | | | | | | | | | |
| | | Year Ended December 31, | |
| | | 2010 | | | 2011 | | | 2012 | |
| | | Total | | | % of Net
Revenues | | | Total | | | % of Net
Revenues | | | Total | | | % of Net
Revenues | |
| | | (dollars in millions, except for percentages) | |
Total net revenues | | $ | 197.0 | | | | 100.0 | % | | $ | 283.4 | | | | 100.0 | % | | $ | 381.1 | | | | 100.0 | % |
Cost of revenues | | | | | | | | | | | | | | | | | | | | | | | | |
Salary and compensation expenses | | | 96.6 | | | | 49.0 | | | | 139.8 | | | | 49.4 | | | | 197.0 | | | | 51.7 | |
Subcontracting costs | | | 16.3 | | | | 8.3 | | | | 24.1 | | | | 8.5 | | | | 30.7 | | | | 8.1 | |
Rental expenses | | | 3.6 | | | | 1.8 | | | | 5.6 | | | | 2.0 | | | | 8.4 | | | | 2.2 | |
Travel and transportation expenses | | | 3.9 | | | | 2.0 | | | | 4.0 | | | | 1.4 | | | | 6.4 | | | | 1.7 | |
Depreciation and amortization expenses | | | 1.9 | | | | 0.9 | | | | 4.1 | | | | 1.4 | | | | 5.1 | | | | 1.3 | |
Other | | | 3.4 | | | | 1.8 | | | | 3.5 | | | | 1.2 | | | | 3.9 | | | | 1.0 | |
Total cost of revenues | | | 125.7 | | | | 63.8 | | | | 181.1 | | | | 63.9 | | | | 251.5 | | | | 66.0 | |
| | | | | | | | | | | | | | | | | | | | | | | | |
Gross profit and gross margin | | $ | 71.3 | | | | 36.2 | % | | $ | 102.3 | | | | 36.1 | % | | $ | 129.6 | | | | 34.0 | % |
| | | | | | | | | | | | | | | | | | | | | | | | |
Cost of Revenues
The principal component of our cost of revenues is salaries and other compensation expenses, including share-based compensation expenses. Salary and compensation expenses for senior management who are not directly responsible for performing client services, business development personnel and other personnel involved in support functions are included in operating expenses. Our salary and compensation expenses increased by 44.7% from $96.6 million in 2010 to $139.8 million in 2011 and by 40.9% to $197.0 million in 2012.
A significant majority of our employees are located in China, where labor costs in the IT services industry are relatively low compared to more developed nations. Within China, labor costs vary across different regions, with wage levels generally being higher in more developed cities such as Beijing, Shanghai and Shenzhen. As a result, our cost of revenues is significantly affected by the location from which we deliver services. Early on, we recognized the cost benefits of expanding into China’s Tier Two and Tier Three cities and have increased the proportion of our employees in sales and delivery centers in cities with lower wage levels. For example, as of the date of this report, we had established 17 sales and delivery centers in Tier Two and Tier Three cities across China. As wages in China continue to increase, we may experience increases in our labor costs for all levels of our employees. We seek to maintain compensation levels in accordance with prevailing trends in our industry. Additionally, we sought to identify and benefit from the various government incentives, subsidies and other efforts designed to promote growth of the IT services industry in China. We expect to continue to offset our labor costs by leveraging the benefits of government subsidies, which has resulted in lower salary and compensation expenses as a percentage of revenue.
Subcontracting costs reflect purchases of certain implementation services and, to a lesser extent, hardware and software from third parties. These expenses have varied from period to period, primarily as result of our project-by-project assessment of the need for subcontracting services.
Other expenses included in cost of revenues include rental expenses, travel and transportation expenses, and depreciation and amortization expenses. As we move into our new, larger Beijing office in the second quarter of 2013, we expect our rental expenses to significantly increase, both in absolute dollar terms and as a percentage of our net revenue.
We expect our cost of revenues to increase in absolute dollar terms with the growth of our business and to vary as a percentage of net revenues depending on service mix, billing rates and our ability to capture operational efficiencies from our integrated delivery platform as our business grows in China and globally.
55
Gross Profit and Gross Margin
Gross profit is equal to net revenues less cost of revenues. Gross margin is equal to gross profit as a percentage of net revenues. Our gross profit and gross margin are affected by factors affecting our net revenues, such as overall demand for outsourced technology services, pricing and billing rates for our individual client engagements, and our cost of revenues, such as wage levels. Other factors resulting in changes in our gross profit and gross margin include: our ability to optimize employee utilization, delivery of our services through our integrated onsite/onshore and offsite/offshore delivery model and to maintain appropriate staffing levels; changes in pricing terms; and variation in the duration, type, size, timing and scope of our engagements.
Our overall gross profit and gross margin is impacted by our service mix. Generally, we realize the highest gross margins on our Consulting & Solutions services, followed by our IT Services and then our BPO services. We anticipate opportunities to expand our overall margins as we begin to realize operational efficiencies from prior investments in our global delivery platform and software modules, partially offset by lower gross margins on our BPO services. BPO services generally generate lower overall gross margins, particularly in the initial stages of an engagement, with margin improvement as these services scale and mature. BPO services contribute favorably to our client retention and understanding of our clients’ businesses, and provide opportunities to cross-sell our other services. Our overall gross profit and gross margin is also impacted by our government subsidies, which serve primarily to offset our salary and compensation component of our cost of revenues. The amounts that we have received in the past have fluctuated significantly.
Operating Expenses
Our operating expenses principally consist of general and administrative expenses, selling and marketing expenses and research and development expenses. The following table sets forth our operating expenses in 2010, 2011 and 2012:
| | | | | | | | | | | | | | | | | | | | | | | | |
| | | Year Ended December 31, | |
| | | 2010 | | | 2011 | | | 2012 | |
| | | Total | | | % of Net
Revenues | | | Total | | | % of Net
Revenues | | | Total | | | % of Net
Revenues | |
| | | (dollars in millions, except for percentages) | |
General and administrative expenses | | $ | 44.3 | | | | 22.5 | % | | $ | 50.7 | | | | 17.9 | % | | $ | 63.3 | | | | 16.6 | % |
Selling and marketing expenses | | | 17.5 | | | | 8.9 | | | | 27.7 | | | | 9.8 | | | | 32.9 | | | | 8.6 | |
Research and development expenses | | | 3.8 | | | | 1.9 | | | | 3.7 | | | | 1.3 | | | | 5.0 | | | | 1.3 | |
| | | | | | | | | | | | | | | | | | | | | | | | |
Total operating expenses | | $ | 65.6 | | | | 33.3 | % | | $ | 82.1 | | | | 29.0 | % | | $ | 101.2 | | | | 26.5 | % |
| | | | | | | | | | | | | | | | | | | | | | | | |
General and Administrative Expenses
General and administrative expenses consist primarily of salary and compensation expenses, including share-based compensation expenses, relating to our finance, legal, human resources and executive office personnel, and also include rental expenses, depreciation and amortization expenses, office overhead, professional service fees and travel and transportation costs. Our general and administrative expenses have increased primarily as a result of our expanding operations and the build out of our senior and mid-level management teams to support our growth.
We expect our general and administrative expenses to continue to increase in absolute terms as our business expands. As we move into our new, larger Beijing office in the second quarter of 2013, we expect our rental expenses to significantly increase, both in absolute dollar terms and as a percentage of our net revenue.
Selling and Marketing Expenses
Selling and marketing expenses consist primarily of salary and compensation expenses, including share-based compensation expenses, relating to our sales and marketing personnel, and also include amortization expenses, entertainment, travel and transportation, and other expenses relating to our marketing activities. Our selling and marketing expenses in 2010, 2011 and 2012 included $1.6 million, $2.2 million and $2.2 million, respectively, in amortization expenses related to the intangible assets of our acquired entities, primarily of acquired client bases. While we expect our selling and marketing expenses to increase in absolute terms as we continue our business expansion, we expect these expenses to remain relatively steady as a percentage of our net revenues to support our business growth.
Research and Development Expenses
Research and development expenses consist primarily of compensation and benefit expenses, including share-based compensation expenses, relating to our research and development personnel, and also include travel and transportation, office overhead and other expenses relating to our research and development activities. Although we expend significant resources on our research and development efforts, we have done so by efficiently leveraging China’s overall cost structure and government subsidies, experience gained from prior client engagements and our continuous investment in our library of industry-specific proprietary software modules. This investment has enhanced our domain knowledge, improved our competitiveness and enabled us to identify attractive market opportunities for new and enhanced services and solutions. We have also established four iSoftStone R&D institutes in Beijing, Tianjin, Wuhan and Wuxi. We expect to continue to invest in research and development. We expect that our ability to effectively utilize our research and development capabilities significantly affect our results of operations in the future.
56
Change in Fair Value of Contingent Consideration in connection with Business Combination
The total amount of change in fair value of contingent consideration in connection with business combination was an unfavorable change in fair value of $5.0 million in 2011 and $1.1 million in 2012. The $5.0 million change in 2011 mainly included $3.0 million and $1.8 million related to our acquisition of Ascend and Adventier, respectively. Those two acquisition transactions contained contingent consideration arrangements based primarily on the performance of the acquired business for the periods ended September 30, 2011 and December 31, 2011, respectively. The amount of $1.1 million in 2012 mainly included $0.5 million and $0.4 million related to our acquisition of Adventier and Abovenet, respectively. The fair value of contingent consideration was reassessed at each reporting date until it was settled and the change in fair value was charged to the statement of operations.
Government Subsidies
Government subsidies consist of government grants, subsidies and similar incentives that we apply for, and from time to time we receive from various PRC government authorities, related, for example, to grants for training and employment of graduates, technology development and assistance for the development of operational infrastructure. The amounts that we have received in the past have fluctuated significantly. While we intend to continue to apply for government subsidies and government incentives in the future, there can be no guarantee that we will receive any such subsidies and incentives in the future.
Government subsidies are recorded as receivables when the approval documents are obtained from the local government authorities and we have the right to receive the subsidies. Subsidies intended to compensate for specific expenditure are recognized in our statement of operations as deductions to the cost of revenues and related expenses when the receivable is booked. Subsidies not intended to compensate for specific expenditures are recognized as other operating income when the receivable is booked.
Early on, we sought to identify and benefit from the various government incentives, subsidies and other efforts designed to promote growth of the IT services industry in China. Government subsidies are reflected in our consolidated statement of operations for 2010, 2011 and 2012 as (i) a reduction to related expenses, primarily cost of revenues, of $7.7 million, $12.3 million and $17.0 million, respectively, and (ii) other income of $3.3 million, $1.8 million and $1.1 million, respectively.
Interest Expense
Our interest expenses have arisen from our short-term bank borrowings, primarily at fixed interest rates, and, historically, accrued interest on our convertible notes. Our interest expense in 2010, 2011 and 2012 was $5.7 million, $1.4 million and $2.0 million, respectively. Our interest expense in 2010 included imputed interest of $4.4 million accrued for our $38.0 million principal amount of convertible notes and $1.3 million of interest on short-term bank borrowings. Our interest expense in 2011 included imputed interest of $0.7 million accrued for our $20 million principal amount of convertible notes, and $0.7 million of interest on short-term bank borrowings. Our interest expense of $2.0 million in 2012 was incurred on short-term bank borrowings. In connection with our initial public offering, which closed in December 2010, $18.0 million of the $38.0 million principal amount of convertible notes, together with accrued interest thereon, were converted into our ordinary shares. In March 2011, the holders of the remaining $20.0 million principal amount of convertible notes converted all their convertible notes plus accrued interest into our ordinary shares. After the first quarter of 2011, when the conversion was completed, there has no longer been an impact on our statement of operations from (i) the change in fair value of convertible notes derivatives or (ii) accrued interest expenses on our convertible notes. The increase of interest expense from 2011 to 2012 was due to more short-term bank loans borrowed to supplement our working capital needs.
Change in Fair Value of Convertible Notes Derivatives
In December 2009 and April 2010, we issued notes convertible into our ordinary shares in the aggregate principal amount of $38 million in a series of private placements to several investors. Certain terms of these convertible notes were determined as embedded derivatives and carried at fair value at each period end. The change in fair value of convertible notes derivatives was recognized as an expense of $8.4 million in 2010 in our consolidated statement of operations. In connection with our initial public offering in December 2010, our convertible notes with an aggregate principal amount of $18.0 million were converted into our ordinary shares. In March 2011, all of the remaining convertible notes with an aggregate principal amount of $20.0 million were converted into our ordinary shares. The change in fair value of convertible notes derivatives was recognized as an income of approximately $2.8 million in 2011 in our consolidated statement of operations.
57
Income Tax Benefit (Expense)
Although we had operating income in 2010, we recorded income tax benefit of $0.3 million in 2010. We incurred income tax expense of $0.3 million and $4.4 million in 2011 and 2012, respectively. The income tax benefits in 2010 reflect the fact that: (i) our major profitable entities in China, where our operations are primarily based, either benefited from reduced income tax rates or were otherwise not subject to income tax in the periods reported, and (ii) the income tax expenses of the profitable entities were offset by the tax credits of other loss making entities, which deferred tax assets benefit has been recognized. In 2011, as certain of our significant subsidiaries had increased taxable income or reduced loss, we incurred income tax expense. In 2012, we incurred higher income tax expenses as the tax exemptions and tax holidays for some of our operating entities in China expired by the end of 2011. Consistent with these trends in 2012, we expect to incur income expenses in the foreseeable future.
Share-Based Compensation Expenses
During 2010, 2011 and 2012, we recognized share-based compensation expenses in connection with option grants, share unit grants, restricted share grants and arrangements with respect to unvested shares. The following table sets forth the share-based compensation expenses recognized as part of cost of revenues, general and administrative expenses, selling and marketing expenses and research and development expenses, respectively, during 2010, 2011 and 2012:
| | | | | | | | | | | | |
| | | Year Ended December 31, | |
| | | 2010 | | | 2011 | | | 2012 | |
| | | (dollars in thousands) | |
Cost of revenues | | $ | 175 | | | $ | 307 | | | $ | 509 | |
General and administrative expenses | | | 8,091 | | | | 7,611 | | | | 8,972 | |
Selling and marketing expenses | | | 273 | | | | 1,225 | | | | 1,441 | |
Research and development expenses | | | 7 | | | | 188 | | | | 198 | |
| | | | | | | | | | | | |
Total share-based compensation expenses | | $ | 8,546 | (1) | | $ | 9,331 | | | $ | 11,120 | |
| | | | | | | | | | | | |
| (1) | Included in the $8.5 million share-based compensation charge in 2010 is a $2.7 million charge related to the issuance of 4.5 million ordinary shares in April and June 2010 to certain key employees. |
Option Grants
We adopted our 2008 Share Incentive Plan, or the 2008 Plan, in March 2008 and subsequently amended it in September 2010. We adopted our 2009 Share Incentive Plan, or the 2009 Plan, in December 2009, and subsequently amended it in April and September 2010. As of March 31, 2013, options to purchase 23,762,520 ordinary shares are outstanding under our 2008 Plan and options to purchase 40,291,582 ordinary shares are outstanding under our 2009 Plan.
We adopted our 2010 Performance Plan, or the 2010 Plan, in November 2010. We stopped granting options or any other awards under the 2008 Plan and 2009 Plan upon the adoption of the 2010 Plan. The maximum number of ordinary shares that may be issued pursuant to all awards under the 2010 Plan is 7,500,000, plus the number of any shares subject to share options granted under the 2008 Plan or 2009 Plan and outstanding on the date of the adoption of the 2010 Plan, which expire, or for any reason are cancelled or terminated, after the date of the adoption of the 2010 Plan without being exercised, plus an annual increase on January 1 of each calendar year beginning in 2011 equal to the lesser of (i) two and one-half percent (2.5%) of the total number of our ordinary shares issued and outstanding on December 31 of the immediately preceding calendar year, (ii) 20,000,000 ordinary shares or (iii) such number of ordinary shares as may be established by our board of directors. As of March 31, 2013, the maximum number of ordinary shares that may be issued pursuant to all awards under the 2010 Plan is 14,527,878 and options to purchase 16,949,152 ordinary shares and awards with respect to 287,665 restricted shares and 10,513,844 share units are outstanding under the 2010 Plan.
Share-based payment transactions with employees such as share options are measured based on the grant date fair value of the equity instrument. Subject to certain forfeiture assumptions and related adjustments, we recognize the compensation costs over the requisite service period of the award, generally the vesting period of the award with the graded vesting schedule. Shares awards issued to non-employees, such as consultants, are measured at fair value at the earlier of the commitment date or the date the service is completed and recognized over the period the service is provided with the graded vesting schedule.
In 2012, we granted 7,642,000 options to some employees under the 2012 Plan. In 2012, we recognized $5.4 million in related share-based compensation expense in connection with existing option grants. Based on existing option grants as of December 31, 2012, we had a total of $7.8 million unrecognized compensation expenses related to unvested options, which we expect to recognize over a weighted averaged period of 1.3 years with the graded vesting schedule using the straight-line method. We expect to continue to grant options under our share incentive plans and incur further share-based compensation charges in future periods.
58
On December 13, 2012, our Compensation Committee revised the exercise price for 8,910,750 outstanding employee share options granted on and after April 29, 2011 and held by individuals then employed by us. The exercise price was reduced to the greater of (i) the per-share closing price of our ordinary shares on December 13, 2012 or (ii) the average of the per-share closing prices over the period of 30 trading days ended on December 13, 2012. There was no change to the related vesting provisions or the number of option shares. This was accounted for as a share option modification and required the remeasurement of the fair value of these share options. The remeasurement resulted in a total incremental share-based compensation of $0.9 million, of which $0.3 million was recognized in the year ended December 31, 2012 and the remaining is to be recognized ratably over the remaining vesting period of the awards.
Nonvested Shares
We entered into the arrangements described below which constitute share-based compensation arrangements with respect to nonvested shares and resulted in share-based compensation expense:
| | • | | In November 2005, in connection with our series A financing, 90,304,561 ordinary shares owned by certain of our founders, who were also our senior management, were subject to repurchase rights at $0.01485 per share (significantly lower than their fair value at the date of grant), exercisable if any of these founders terminated their employment with us within 24 months. This arrangement was treated as a share-based compensation based on the difference of the grant date fair value of the ordinary shares and the repurchase price. |
| | • | | From 2006 to 2010, we granted 1,580,764 ordinary shares, in aggregate, to certain employees in connection with the acquisition of Beijing Kebao in 2006, the acquisition of the IT services business of MDCL-Frontline (China) Ltd., or MDCL, in 2009 and the employment of certain other employees, subject to a right of return in our favor for free if the grantees terminated their employment within a period of 24-36 months. These arrangements were treated as a share-based compensation. In 2010, 2011 and 2012, we recognized $50,000, $7,000 and nil in related share-based compensation expense in connection with these arrangements. |
As of December 31, 2012, the total unrecognized compensation expense relating to the nonvested shares was nil.
Share Units
In 2012, we granted 10,280,840 share units to some employees, directors and non-employees under the 2010 Plan. In 2012, we recognized $5.7 million in related share-based compensation expense in connection with these arrangements.
Based on existing unvested shares units as of December 31, 2012, we had a total of $5.7 million unrecognized compensation expenses related to unvested shares units which we expect to recognize over a weighted average period of 2.7 years using the straight-line method under the graded vesting schedule.
Restricted Shares
In 2012, we did not grant any restricted shares to our employees under the 2010 Plan.
Based on existing unvested restricted shares as of December 31, 2012, we had a total of $0.4 million unrecognized compensation expenses related to unvested restricted shares which we expect to recognize over a weighted average period of 2.3 years using the straight-line method under the graded vesting schedule.
Other share-based compensation arrangements
In April 2010, we entered into a share incentive agreement with certain key employees. Pursuant to this agreement, we issued 4,500,000 of our ordinary shares in April and June 2010, which were considered share-based compensation, and we incurred a $2.7 million charge to our consolidated statement of operations immediately for 2010.
We also agreed to issue up to 1,000,000 of our ordinary shares to these key employees based on their performance in 2010. We recognized a $0.6 million compensation expense for 2010 for this share-based compensation arrangement.
59
Amortization of Intangible Assets
The following table sets forth the amortization of intangible assets (comprised of client base, contract backlog, software copyright and non-compete arrangements) recognized as part of our cost of revenues and selling and marketing expenses for 2010, 2011 and 2012:
| | | | | | | | | | | | |
| | | Year Ended December 31, | |
| | | 2010 | | | 2011 | | | 2012 | |
| | | (dollars in thousands) | |
Cost of revenues | | $ | 385 | | | $ | 1,213 | | | $ | 1,280 | |
Selling and marketing expenses | | | 1,580 | | | | 2,219 | | | | 2,168 | |
| | | | | | | | | | | | |
Total intangible amortization expenses | | $ | 1,965 | | | $ | 3,432 | | | $ | 3,448 | |
| | | | | | | | | | | | |
We expect to recognize amortization expenses of $2.8 million, $1.5 million, $0.9 million, $0.5 million, $0.2 million and $30,000 for the years ending December 31, 2013, 2014, 2015, 2016, 2017 and 2018, respectively. These amortization expenses are primarily a result of amortization of intangible assets related to historical acquisitions.
Taxes and Industry Incentive Policies
Cayman Islands
We are incorporated in the Cayman Islands. Under the current law of the Cayman Islands, we are not subject to income or capital gains tax. In addition, dividend payments made by us are not subject to withholding tax in the Cayman Islands.
United States; Canada; Japan; Taiwan; Germany; United Kingdom; Korea, Hong Kong
Our U.S. subsidiaries, iSoftStone Inc. and iSoftStone LLC, are subject to U.S. federal income taxes at graduated tax rates from 15% to 35%.
Our Canadian Subsidiary, iSoftStone Technology Corporation, is subject to Canadian income taxes at gradual tax rates at 26.5%.
Our Japanese subsidiary, iSoftStone Japan, is subject to Japanese income taxes of 42%.
iSoftStone Hong Kong Limited, Taiwan Branch is subject to Taiwan income taxes of 17%.
Our German subsidiary, iSoftStone UG, is subject to German income taxes of 15%.
Our United Kingdom subsidiary, iSoftStone Limited, is subject to United Kingdom income taxes at gradual tax rates from 20% to 26% since its inception in 2011.
Our Korean subsidiary, iSoftStone Korea Inc., is subject to Korean income taxes at 10%, 13%, and 13% for the years ended December 31, 2010, 2011 and 2012, respectively.
Our Hong Kong subsidiary, iSoftStone Hong Kong Limited, is subject to Hong Kong income taxes of 16.5%.
China
Our PRC subsidiaries are incorporated in the PRC and are governed by PRC income tax laws and regulations. Prior to January 1, 2008, entities established in the PRC were generally subject to a 30% national and 3% local enterprise income tax rate. Various preferential tax treatments promulgated by national tax authorities were available to foreign-invested enterprises or high or new technology enterprises located in certain high-tech zones of China. iSoftStone WFOE, as a new technology enterprise, was granted a six-year tax holiday commencing from 2006, which entitles it to a three-year income tax exemption followed by a three-year 50% enterprise income tax rate reduction. Under the Enterprise Income Tax Law effective on January 1, 2008, the PRC has adopted a uniform enterprise income tax rate of 25% for all PRC enterprises (including foreign-invested enterprises) and revoked the previous tax exemption, reduction and preferential treatments applicable to foreign-invested enterprises. However, the Enterprise Income Tax Law also permits enterprises to continue to enjoy their existing tax incentives, adjusted by certain transitional phase-out rules, under which enterprises established before the promulgation date of the Enterprise Income Tax Law that were granted tax holidays under the then effective tax laws or regulations may continue to enjoy their tax holidays until their expiration. iSoftStone WFOE, as an enterprise established before the promulgation date of the Enterprise Income Tax Law, is entitled to enjoy its exemption of enterprise income tax in 2008 and 50% tax reduction in 2009, 2010 and 2011. The Enterprise Income Tax Law and its implementation regulations also permit qualified “high-tech enterprises” to enjoy a reduced 15% enterprise income tax rate. iSoftStone WFOE and Shanghai Kangshi obtained the qualification certificates of high-tech enterprise status in 2008 with a valid period of three years from 2008 to 2010, and therefore they are eligible to enjoy a preferential tax rate of 15% as long as they maintain their qualification as a high-tech enterprise. iSoftStone WFOE and Shanghai Kangshi renewed their respective qualification certificate of high-tech enterprises in 2011. The local tax bureau has confirmed that the 50% reduction may be applied to the 15% preferential rate that iSoftStone WFOE enjoys as a qualified high-tech enterprise, notwithstanding a tax circular issued by the State Administration of Taxation that deals with whether these tax benefits are mutually exclusive. As a result of the foregoing preferential tax treatments and its continuous qualification as a high-tech enterprise, iSoftStone WFOE was exempted from enterprise income tax for 2008 and was subject to enterprise income taxes of 7.5% for the years 2009 to 2011 and 15% for the year 2012, respectively. Shanghai Kangshi as a qualified high-tech enterprise, was subject to enterprise income tax at a rate of 15% from 2008 to 2012. See “Item 3.D. Key Information—Risk Factors—Risks Related to Doing Business in China—The discontinuation or revocation of the preferential tax treatments and government incentives available to us could decrease our net income and materially and adversely affect our financial condition and results of operations.”
60
Under the Enterprise Income Tax Law and its implementation regulations, a newly established software enterprise is entitled to a two-year exemption followed by a three-year 50% enterprise income tax rate reduction from its first profit-making year. iSoftStone Information System Service Co., Ltd. has been recognized as a newly established software enterprise and was entitled to an enterprise income tax exemption for 2008 and 2009, and a 50% enterprise income tax rate reduction for 2010, 2011 and 2012, based on the statutory enterprise income tax rate of 25%, if it can maintain its qualification as a software enterprise. In addition, iSoftStone Information System Service Co., Ltd. was recognized as a key software enterprise in 2010 and was entitled to a reduced income tax rate of 10% for 2010 according to a Notice regarding Several Preferential Policies for Enterprise Income Tax promulgated by the Ministry of Finance and the State Administration of Taxation on February 22, 2008. In addition, iSoftStone Information System Service Co., Ltd. was recognized as a key software enterprise in 2010 and 2011 and was entitled to a reduced income tax rate of 10% for 2010 and 2011 according to a Notice regarding Several Preferential Policies for Enterprise Income Tax promulgated by the Ministry of Finance and the State Administration of Taxation on February 22, 2008. Since the key software enterprise status is granted on an annual basis by the relevant government authority in China, iSoftStone Information System Service Co., Ltd. has not obtained the approval of key software enterprise status for 2012 yet and therefore a tax rate of 12.5% was used in our provisional enterprise income tax filings in 2012. Similarly, iSoftStone Information Technology Co., Ltd., which qualified as a software enterprise, is entitled to an enterprise income tax exemption for 2010 and 2011, and a 50% enterprise income tax rate reduction for 2012, 2013 and 2014, based on the statutory enterprise income tax rate of 25%. In addition, iSoftStone Information Technology Co., Ltd. has applied for key software enterprise status for 2011 and 2012 but has not received the formal written approval yet. Therefore, a tax rate of 12.5% was used in our provisional enterprise income tax filings in 2012. In addition, iSoftStone Guangzhou qualified as a software enterprise and enjoyed a two-year tax exemption from 2012 to 2013, and will subject to a reduced tax rate of 12.5% for the period from 2014 to 2016. Our several other subsidiaries in China are also qualified as newly established software enterprises, and therefore will be entitled to the two-year tax exemption followed by three-year 50% tax rate reduction from its first profit-making year respectively.
In addition, the PRC government has provided various incentives to companies in the software industry and to certain qualified technology related transactions in order to encourage development of the software and technology related industries in China. A number of our PRC subsidiaries currently receive value-added tax, or VAT, rebates and business tax exemptions in addition to the preferential enterprise income tax treatments as described above. For some of our software solutions, we are entitled to receive a 14% VAT rebate on the total VAT payable at the rate of 17% if we have registered the copyright for these solutions in China and have met certain government authorities’ requirements. We record the VAT rebate as revenue when we pay the relevant VAT and properly file the rebate application to tax authority when the related rebates become receivables. In addition, we were exempted from business taxes for revenues generated from technology development, transfer and related consulting services.
On July 28, 2010, the PRC government issued a preferential tax policy which exempts certain companies located in 21 jurisdictions including Beijing, Shanghai, Guangzhou and Shenzhen, among others, from paying a 5% business tax on income derived from contracts signed with offshore entities for providing information technology outsourcing, business processing outsourcing and knowledge process outsourcing services. A number of our PRC subsidiaries qualify for the tax benefits as provided in this tax policy.
In November 2011, the Ministry of Finance and the State Administrations of Taxation jointly issued circulars No. 110 and No. 111 regarding the pilot collection of VAT in lieu of business tax in certain industries in Shanghai. In July 2012, the Ministry of Finance and the State Administration of Taxation jointly issued Circular on Launching the Pilot Collection of Value Added Tax Instead of Business Tax in Transportation and Certain Areas of Modern Services Industries in Eight Provinces and Municipalities Including Beijing, or Circular 71. Such VAT pilot program was phased in Beijing, Jiangsu, Anhui, Fujian, Guangdong, Tianjin, Zhejiang, and Hubei between September 2012 and December 2012. Therefore, effective from January 1, 2012, Shanghai Kangshi Information System Co., Ltd. became subject to VAT at the rate of 6%, on certain service revenues which were previously subject to business tax. From September 1, 2012, iSoftStone WFOE became subject to VAT at the rate of 6%, on certain service revenues which were previously subject to business tax. Effective from October 1, 2012, November 1, 2012 and December 1, 2012, respectively, iSoftStone Information System Service Co., Ltd., Guangzhou iSoftStone Information Technology Co., Ltd and Shanghai iSoftStone Industrial Co., Ltd., also became subject to the VAT at the rate of 6% on certain service revenues which were previously subject to business tax. VAT exemptions are generally available if the revenue from certain services can be eligible for business tax exemption prior to enforcement of the VAT pilot program.
Preferential tax treatments and incentives granted to us by PRC governmental authorities are subject to review and may be adjusted or revoked at any time in the future. The discontinuation or revocation of any preferential tax treatments and incentives currently available to us will cause our effective tax rate to increase, which will decrease our net income and materially and adversely affect our financial condition and results of operations.
Dividends paid by our PRC subsidiaries out of the profits earned after December 31, 2007 to us were and will continue to be subject to PRC withholding tax. The current withholding tax rate is 10%.
Aggregate undistributed earnings of our subsidiaries located in the PRC that are available for distribution at December 31, 2012 are considered to be indefinitely reinvested under ASC topic 740Income Taxes-Other Considerations or Special Areas, and, accordingly, no provision has been made for taxes that would be payable upon the distribution of those amounts to any entity within our company outside the PRC. Unrecognized deferred tax liabilities for temporary differences related to investments in foreign subsidiaries were not recorded because the determination of that amount is not practicable.
61
We have never declared or paid any dividends since our incorporation, nor do we have any present plan to pay any cash dividends on our ordinary shares in the foreseeable future. We intend to retain most, if not all, of our available funds and any future earnings to operate and expand our business.
Results of Operations
The following table sets forth a summary of our consolidated results of operations by amount and as a percentage of our net revenues for the periods indicated. This information should be read together with our consolidated financial statements and related notes included elsewhere in this annual report. The operating results in any period are not necessarily indicative of the results that may be expected for any future period.
| | | | | | | | | | | | | | | | | | | | | | | | |
| | | Year Ended December 31, | |
| | | 2010 | | | 2011 | | | 2012 | |
| | | Total | | | % of Net
Revenues | | | Total | | | % of Net
Revenues | | | Total | | | % of Net
Revenues | |
| | | (dollars in thousands, except percentages) | |
Net revenues: | | $ | 196,975 | | | | 100.0 | % | | $ | 283,417 | | | | 100.0 | % | | $ | 381,144 | | | | 100.0 | % |
IT Services | | | 134,872 | | | | 68.5 | | | | 195,142 | | | | 68.9 | | | | 240,753 | | | | 63.1 | |
Consulting & Solutions | | | 54,327 | | | | 27.6 | | | | 76,039 | | | | 26.8 | | | | 127,227 | | | | 33.4 | |
Business Process Outsourcing Services | | | 7,776 | | | | 3.9 | | | | 12,236 | | | | 4.3 | | | | 13,164 | | | | 3.5 | |
Cost of revenues (1)(2)(3) | | | (125,689 | ) | | | (63.8 | ) | | | (181,121 | ) | | | (63.9 | ) | | | (251,540 | ) | | | (66.0 | ) |
| | | | | | | | | | | | | | | | | | | | | | | | |
Gross profit | | | 71,286 | | | | 36.2 | | | | 102,296 | | | | 36.1 | | | | 129,604 | | | | 34.0 | |
Operating expenses: | | | | | | | | | | | | | | | | | | | | | | | | |
General and administrative expenses (1)(3) | | | (44,277 | ) | | | (22.5 | ) | | | (50,768 | ) | | | (17.9 | ) | | | (63,279 | ) | | | (16.6 | ) |
Selling and marketing expenses (1)(2)(3) | | | (17,468 | ) | | | (8.9 | ) | | | (27,685 | ) | | | (9.8 | ) | | | (32,855 | ) | | | (8.6 | ) |
Research and development expenses (1) (3) | | | (3,852 | ) | | | (1.9 | ) | | | (3,684 | ) | | | (1.3 | ) | | | (4,951 | ) | | | (1.3 | ) |
Total operating expenses (1)(2) | | | (65,597 | ) | | | (33.3 | ) | | | (82,137 | ) | | | (29.0 | ) | | | (101,085 | ) | | | (26.5 | ) |
Change in fair value of contingent consideration in connection with business combination | | | 28 | | | | — | | | | (4,969 | ) | | | (1.8 | ) | | | (1,118 | ) | | | (0.3 | ) |
Other income (expense), net | | | 262 | | | | 0.1 | | | | 324 | | | | 0.1 | | | | (231 | ) | | | (0.1 | ) |
Government subsidies | | | 3,269 | | | | 1.7 | | | | 1,840 | | | | 0.6 | | | | 1,110 | | | | 0.3 | |
Gain on sale of equity of a subsidiary | | | 1,079 | | | | 0.5 | | | | — | | | | — | | | | — | | | | — | |
| | | | | | | | | | | | | | | | | | | | | | | | |
Income from operations | | | 10,327 | | | | 5.2 | | | | 17,354 | | | | 6.1 | | | | 28,280 | | | | 7.4 | |
Interest income | | | 180 | | | | 0.1 | | | | 1,118 | | | | 0.4 | | | | 775 | | | | 0.2 | |
Interest expense | | | (5,742 | ) | | | (2.9 | ) | | | (1,424 | ) | | | (0.5 | ) | | | (1,966 | ) | | | (0.5 | ) |
Change in fair value of convertible notes derivatives | | | (8,428 | ) | | | (4.3 | ) | | | 2,832 | | | | 1.0 | | | | — | | | | — | |
| | | | | | | | | | | | | | | | | | | | | | | | |
(Loss) income before provision for income taxes and loss in equity method investments, net of income taxes | | | (3,663 | ) | | | (1.9 | ) | | | 19,880 | | | | 7.0 | | | | 27,089 | | | | 7.1 | |
Income taxes benefit (expenses) | | | 288 | | | | 0.1 | | | | (319 | ) | | | (0.1 | ) | | | (4,370 | ) | | | (1.1 | ) |
Loss in equity method investments, net of income taxes | | | (245 | ) | | | — | | | | (565 | ) | | | (0.2 | ) | | | (637 | ) | | | (0.2 | ) |
| | | | | | | | | | | | | | | | | | | | | | | | |
Net (loss) income | | $ | (3,620 | ) | | | (1.8 | )% | | $ | 18,996 | | | | 6.7 | % | | $ | 22,082 | | | | 5.8 | % |
| | | | | | | | | | | | | | | | | | | | | | | | |
62
| (1) | Includes share-based compensation charges totaling $8.5 million, $9.3 million and $11.1 million in 2010, 2011 and 2012, respectively, allocated as follows: |
| | | | | | | | | | | | |
| | | For the year ended December 31, | |
| | | 2010 | | | 2011 | | | 2012 | |
| | | (dollars in thousands) | |
Cost of revenues | | $ | 175 | | | $ | 307 | | | $ | 509 | |
Operating expenses: | | | | | | | | | | | | |
General and administrative expenses | | | 8,091 | | | | 7,611 | | | | 8,972 | |
Selling and marketing expenses | | | 273 | | | | 1,225 | | | | 1,441 | |
Research and development expenses | | | 7 | | | | 188 | | | | 198 | |
| | | | | | | | | | | | |
Total share-based compensation expenses | | $ | 8,546 | | | $ | 9,331 | | | $ | 11,120 | |
| | | | | | | | | | | | |
| (2) | Includes amortization of intangible assets from acquisition totaling $1.9 million, $3.2 million and $2.8 million in 2010, 2011 and 2012, respectively, allocated as follows: |
| | | | | | | | | | | | |
| | | For the year ended December 31, | |
| | | 2010 | | | 2011 | | | 2012 | |
| | | (dollars in thousands) | |
Cost of revenues | | $ | 274 | | | $ | 985 | | | $ | 673 | |
Operating expenses: | | | | | | | | | | | | |
Selling and marketing expenses | | | 1,580 | | | | 2,217 | | | | 2,126 | |
| | | | | | | | | | | | |
Total amortization of intangible assets expenses | | $ | 1,854 | | | $ | 3,202 | | | $ | 2,799 | |
| | | | | | | | | | | | |
| (3) | Includes government subsidies as a reduction of cost of revenues and expenses totaling $7.7 million, $12.3 million and $17.0 million in 2010, 2011 and 2012, respectively, allocated as follows: |
| | | | | | | | | | | | |
| | | Year Ended December 31, | |
| | | 2010 | | | 2011 | | | 2012 | |
| | | (dollars in thousands) | |
Cost of revenues | | $ | 6,133 | | | $ | 9,277 | | | $ | 13,845 | |
Selling and marketing expense | | | 364 | | | | 769 | | | | 350 | |
General and administrative expense | | | 1,205 | | | | 1,775 | | | | 366 | |
Research and development expenses | | | — | | | | 510 | | | | 2,476 | |
| | | | | | | | | | | | |
| | $ | 7,702 | | | $ | 12,331 | | | $ | 17,037 | |
| | | | | | | | | | | | |
Comparison of 2010, 2011 and 2012
Net Revenues
In recent years, we have experienced rapid growth and significantly expanded our business. Our net revenues increased from $197.0 million in 2010 to $283.4 million in 2011 and $381.1 million in 2012, or 43.9% and 34.5% growth, respectively. The increase primarily reflects organic growth driven by, among other things, growth in the China IT services market and domestic demand for outsourced technology services and consulting, despite the effects from recent financial crisis, complemented by strategic acquisitions to acquire service capabilities, skilled personnel and access to potential key clients. Of the $283.4 million and $381.1 million in total net revenues for 2011 and 2012, 99.5% and 99.1% were organic, with acquisitions completed within the 12-month period preceding December 31, 2011 and 2012, contributing the remaining 0.5% and 0.9% of the total net revenues. Significant acquisitions in the 12-month period preceding December 31, 2011 included our acquisition of iHealthStone and Adventier; and in the 12-month period preceding December 31, 2012 included our acquisition of Jiangchen and Abovenet. Our significant growth and several acquisitions in recent years make period-to-period comparison of our historical operating results less comparable.
63
Net Revenues by Service Line
IT Services. Our net revenues from IT Services increased significantly from $134.9 million in 2010 to $195.1 million in 2011 and $240.8 million in 2012, or 44.7% and 23.4% growth, respectively, primarily as a result of:
| | • | | the growth of our ADM services net revenues, which increased from $61.8 million in 2010 to $97.4 million in 2011 and $127.1 million in 2012, or 57.6% and 30.4% growth, respectively, primarily as a result of our organic growth with both Greater China and Global clients, such as Huawei, Lenovo, Bank of China and Microsoft; and |
| | • | | the growth of our R&D services net revenues, which increased from $66.8 million in 2010 to $85.7 million in 2011 and $102.7 million in 2012, or 28.2% and 19.9% growth, respectively, primarily as a result of the expansion of our relationship with Greater China clients such as Huawei as well as diversification of our Global client base, such as AT&T, Sharp and Sony. |
Consulting & Solutions. Our net revenues from Consulting & Solutions increased significantly from $54.3 million in 2010 to $76.1 million in 2011 and $127.2 million in 2012, or 40.0% and 67.3% growth, respectively, reflecting primarily organic growth of our business with AT&T, Microsoft and Lenovo, increase in revenues from business intelligence projects for Bank of China and Fidelity, as well as public sector Smart City Consulting & Solution projects wins in various Tier Two and Tier Three cities in China.
BPO Services. Our net revenues from BPO services increased from $7.8 million in 2010 to $12.2 million in 2011 and $13.1 million in 2012, or 57.4% and 7.6% growth, respectively, primarily as a result of organic growth with our long-term clients in the banking and insurance industries. Our slower growth of net revenues from BPO services from 2011 to 2012 was primarily due to the fact that certain projects with China Life were completed by 2011.
Net Revenues by Geographic Markets.
Our net revenues from Greater China clients increased significantly from $110.1 million in 2010 to $165.5 million in 2011 and $244.0 million in 2012, or 50.4% and 47.4% growth, respectively, reflecting the continued growth and strength of our business in China. Net revenues in Greater China continued to grow more than the net revenues in the Global market which was experiencing weaker macro-economic conditions than in Greater China. Our net revenues from Global clients increased from $86.9 million in 2010 to $117.9 million in 2011 and $137.1 million in 2012, or 35.7% and 16.4% growth, respectively, reflecting primarily our organic growth. Despite the significant slowing of IT spending in the United States and Europe, we were able to grow our net revenues in those markets, both organically and through key hiring and strategic acquisitions. From 2010 to 2011, our revenues from Europe grew faster than our other geographic markets as a result of a deeper penetration into European markets. In 2011, our net revenues from Japan grew slower than our other geographic markets caused by the March 2011 earthquake and tsunami in Japan. In 2012, our net revenues from Japan decreased by 4.2% due to reduced demand from Japan clients, potentially impacted by the Sino-Japan geopolitical standoff.
Net Revenues by Client Industry.
Our net revenues from technology clients increased significantly from $65.2 million in 2010 to $85.6 million in 2011 and $104.2 million in 2012, or 31.3% and 21.8% growth, respectively, primarily as a result of the growth of Microsoft, Lenovo and NCR Japan, among others, as key clients. Our net revenues from communications clients increased significantly from $75.7 million in 2010 to $108.6 million in 2011 and $138.9 million in 2012, or 43.5% and 27.8% growth, respectively, primarily as a result of the growth of Huawei and AT&T, among others, as key clients. Our slower growth of net revenues from communications clients from 2011 to 2012 was primarily due to slower growth from AT&T in 2012. Our net revenues from BFSI clients increased significantly from $33.6 million in 2010 to $57.9 million in 2011 and $79.7 million in 2012, or 72.4% and 37.5% growth, respectively, primarily as a result of the growth of UBS, Bank of China, China Everbright Bank, Agricultural Bank of China and Fidelity, among others, as key clients, and our deeper penetration into BFSI industry clients. Our slower growth of net revenues from BFSI clients from 2011 to 2012 was primarily due to reduced demands from HSBC in 2012. Our net revenues from ETP clients increased from $12.5 million in 2010 to $14.8 million in 2011 and $36.0 million in 2012, or 18.4% and 142.7% growth, respectively, primarily as a result of the growth of China’s State Grid as well as other public sector clients, and the positive results from our launch of Smart City projects—an area where we made significant breakthroughs in 2011 and 2012. Our net revenues from clients in other industries increased significantly from $10.0 million in 2010 to $16.5 million in 2011 and $22.3 million in 2012, or 64.8% and 36.1% growth, respectively, primarily as a result of our organic growth and diversification of our client base to several other industries.
Net Revenues by Key Clients.
We have grown with our clients by increasingly expanding the scope and size of our engagements. We have also grown our key client base. From 2010 to 2012, we increased the number of clients generating over $1.0 million in annual net revenues from 30 in 2010 to 45 in 2011 and 49 in 2012, and we increased the number of clients generating over $3.0 million in annual net revenues from eight in 2010 to 13 in 2011 and 17 in 2012. In 2010, 2011 and 2012, Huawei and Microsoft contributed 25% and 13%, 23% and 9% and 26% and 8% of our net revenues, respectively.
64
Cost of Revenues
Our cost of revenues increased from $125.7 million in 2010 to $181.1 million in 2011 and $251.5 million in 2012, or 44.1% and 38.9% growth, respectively, primarily as a result of increased headcount and subcontracting costs, expanded office facilities and more travel to enable and match the growth of our business. Our total number of employees grew from 9,285 employees as of December 31, 2010 to 12,510 employees as of December 31, 2011 and 14,512 employees as of December 31, 2012. Our cost of revenues as a percentage of net revenues over the past three years increased from 63.8% in 2010 to 63.9% in 2011 and then to 66.0% in 2012, primarily due to (a) annual salary increases for delivery personnel in 2011 and 2012, (b) more higher-end delivery employees hired starting from the fourth quarter of 2011, and (c) expanded office facilities in several delivery centers, which were partly offset by more government subsidies recognized as a percentage of net revenues and favorable business mix and efficiency improvements. The following table sets forth our net revenues, cost of revenues, gross profit and gross margin, as well as a breakdown of the principal components of our cost of revenues in 2010, 2011 and 2012:
| | | | | | | | | | | | | | | | | | | | | | | | |
| | | Year Ended December 31, | |
| | | 2010 | | | 2011 | | | 2012 | |
| | | Total | | | % of Net
Revenues | | | Total | | | % of Net
Revenues | | | Total | | | % of Net
Revenues | |
| | | (dollars in millions, except for percentages) | |
Total net revenues | | $ | 197.0 | | | | 100.0 | % | | $ | 283.4 | | | | 100.0 | % | | $ | 381.1 | | | | 100.0 | % |
Cost of revenues | | | | | | | | | | | | | | | | | | | | | | | | |
Salary and compensation expenses | | | 96.6 | | | | 49.0 | | | | 139.8 | | | | 49.4 | | | | 197.0 | | | | 51.7 | |
Subcontracting costs | | | 16.3 | | | | 8.3 | | | | 24.1 | | | | 8.5 | | | | 30.7 | | | | 8.1 | |
Rental expenses | | | 3.6 | | | | 1.8 | | | | 5.6 | | | | 2.0 | | | | 8.4 | | | | 2.2 | |
Travel and transportation expenses | | | 3.9 | | | | 2.0 | | | | 4.0 | | | | 1.4 | | | | 6.4 | | | | 1.7 | |
Depreciation and amortization expenses | | | 1.9 | | | | 0.9 | | | | 4.1 | | | | 1.4 | | | | 5.1 | | | | 1.3 | |
Other | | | 3.4 | | | | 1.8 | | | | 3.5 | | | | 1.2 | | | | 3.9 | | | | 1.0 | |
Total cost of revenues | | | 125.7 | | | | 63.8 | | | | 181.1 | | | | 63.9 | | | | 251.5 | | | | 66.0 | |
| | | | | | | | | | | | | | | | | | | | | | | | |
Gross profit and gross margin | | $ | 71.3 | | | | 36.2 | % | | $ | 102.3 | | | | 36.1 | % | | $ | 129.6 | | | | 34.0 | % |
| | | | | | | | | | | | | | | | | | | | | | | | |
In 2010, 2011 and 2012, salary and compensation expenses were $96.6 million, $139.8 million and $197.0 million, representing, 49.0%, 49.4% and 51.7% of our total net revenues, respectively. The period-over-period increase in salary and compensation expenses as a percentage of revenue in 2010, 2011 and 2012 resulted primarily from headcount and wage increases from 2010 to 2012, the offsetting impact of government subsidies and mix of services offered.
Subcontracting costs increased from $16.3 million in 2010 to $24.1 million in 2011 and $30.7 million in 2012, representing 8.3%, 8.5% and 8.1% of our net revenues, respectively. The period-over-period fluctuation in subcontracting costs as a percentage of net revenues is primarily due to different needs for purchases of implementation services and, to a lesser extent, hardware and software from third parties based on our project-by-project assessment.
Rental expenses increased from $3.6 million in 2010 to $5.6 million in 2011 and $8.4 million in 2012, representing 1.8%, 2.0% and 2.2% of our net revenues, respectively. The period-over-period increase in rental expenses is primarily due to increase in rental fees per square meter at certain of our offices such as Beijing, expansion of office space in Wuhan to accommodate the ISST business and growth in the number of our service delivery facilities, in particular to the expansion of our footprint in Chengdu, Yancheng and Zhenjiang in 2011 and in Foshan, Jinan, Liaoyuan, Suzhou and Shijiazhuang in 2012.
Travel and transportation expenses increased from $3.9 million in 2010 to $4.0 million in 2011 and $6.4 million in 2012, representing 2.0%, 1.4% and 1.7% of our net revenues, respectively. As we continue to control our cost, especially after our initial public offering in December 2010, the period-over-period increase in travel and transportation expenses is generally to support the growth of our business in broadening our geographic reach.
Depreciation and amortization expenses increased from $1.9 million in 2010 to $4.1 million in 2011 and $5.1 million in 2012, representing 0.9%, 1.4% and 1.3% of our net revenues, respectively. The period-over-period increase in depreciation and amortization expenses is primarily due to an increase in depreciation of property and equipment primarily including computers and software and office equipment.
65
Gross Profit and Gross Margin
Our gross profit increased from $71.3 million in 2010 to $102.3 million in 2011 and $129.6 million in 2012, or 43.5% and 26.7% growth, respectively. Overall gross margin was 36.2% in 2010, remained stable at 36.1% in 2011 and then decreased to 34.0% in 2012, primarily due to (a) annual salary increases for delivery personnel in 2011 and 2012, (b) more higher-end delivery employees hired starting from the fourth quarter of 2011, and (c) expanded office facilities in several delivery centers, which were partly offset by more government subsidies recognized as a percentage of net revenues and favorable business mix and efficiency improvements.
Operating Expenses
Our total operating expenses increased from $65.6 million in 2010 to $82.1 million in 2011 and $101.1 million in 2012, or 25.2% and 23.1% growth, respectively. Our operating expenses as a percentage of net revenues over the past three years decreased from 33.3% in 2010 to 29.0% in 2011 and 26.5% in 2012. Our operating expenses for 2010, 2011 and 2012 include share-based compensation expenses of $8.4 million, $9.0 million and $10.6 million and amortization of intangible assets expenses of $1.6 million, $2.2 million and $2.1 million, respectively. Excluding share-based compensation and amortization of intangible assets from acquisitions, our operating expenses were 28.3%, 25.0% and 23.7% of net revenues in 2010, 2011 and 2012, respectively. The decrease of operating expenses as a percentage of net revenues from 2010 to 2012 reflected our scale efficiencies realized.
General and Administrative Expenses
Our general and administrative expenses increased from $44.3 million in 2010 to $50.7 million in 2011 and $63.3 million in 2012. Increases in salary and compensation expenses for general and administrative personnel were the largest component of these increases, increasing from $25.1 million in 2010 to $26.6 million in 2011 and $37.5 million in 2012. This increase in salary and compensation expenses reflects the continued build-up of our corporate infrastructure, general wage increases, and our continued investment in our senior and middle management teams. In addition, our general and administrative expenses increased as a result of our establishment of regional management functions to better support our front line operations since 2010. Our salary and compensation expenses include $8.1 million, $7.6 million and $9.0 million of share-based compensation charges in 2010, 2011 and 2012, respectively. Included in the $8.1 million share-based compensation charge in 2010 is a one-time $2.7 million charge related to the issuance of 4.5 million ordinary shares in April and June 2010 to certain key employees.
In addition, rental expenses increased from $4.2 million in 2010 to $5.6 million in 2011 and $6.5 million in 2012, primarily due to increases in rental fees at certain offices, rents of new offices as we extended our operational footprint in China in 2011 and 2012 and relocation of one of our US offices in 2011. We also had a bad debt provision charge in the amount of $2.5 million, $2.4 million and $0.2 million in 2010, 2011 and 2012, respectively, as a result of periodic assessment of the credit risk of specific clients.
As a result of the foregoing, our general and administrative expenses as a percentage of net revenues decreased from 22.5% in 2010 to 17.9% in 2011 and to 16.6% in 2012.
Selling and Marketing Expenses
Our selling and marketing expenses increased from $17.5 million in 2010 to $27.7 million in 2011 and $32.9 million in 2012. This increase is primarily due to increased salary and compensation expenses for sales and marketing personnel, primarily our investment in growing our sales operations in Japan, the United States and in multiple locations in China and related headcount growth. The salary and compensation expenses increased from $11.4 million in 2010 to $17.2 million in 2011 and $19.1 million in 2012. Our selling and marketing expenses include amortization of intangible assets acquired in acquisitions of $1.6 million in 2010, $2.2 million in 2011 and $2.1 million in 2012. Selling and marketing expenses as a percentage of our net revenues varied from 8.9% in 2010 to 9.8% in 2011 and 8.6% in 2012.
Research and Development Expenses
Our research and development expenses slightly decreased from $3.9 million in 2010 to $3.7 million in 2011 and then increased to $5.0 million in 2012. The slight decrease from 2010 to 2011 was primarily due to government subsidiaries of $0.5 million as reduction of research and development expenses and completion of certain research and development activities, such as the multi-media terminal solution based on Android. The increase from 2011 to 2012 was primarily due to the fact that we launched several research projects related to cloud computing and mobile internet application in 2012. As a result, research and development expenses as a percentage of our net revenues decreased from 1.9% in 2010 to 1.3% in 2011 and remained at 1.3% in 2012.
Change in fair value of contingent consideration in connection with business combination
The total amount of change in fair value of contingent consideration in connection with business combination was a favorable change in fair value of $28,000 in 2010, an unfavorable change in fair value of $5.0 million in 2011 and an unfavorable change in fair value of $1.1 million in 2012. The amount of $5.0 million in 2011 was principally comprised of $3.0 million and $1.8 million related to our acquisitions of Ascend and Adventier, respectively, as the performance exceeded estimated targets. The amount of $1.1 million in 2012 was principally comprised of $0.5 million and $0.4 million related to our acquisition of Adventier and Abovenet, respectively.
66
Government Subsidies
We recognized government subsidies as other income of $3.3 million in 2010, $1.8 million in 2011 and $1.1 million in 2012, primarily due to incentives from local government authorities to, among other things, encourage exportation of our services and the development of our industry in general and attract us to open offices in local areas. We also recognized government subsidies as a reduction to the related expenses, primarily to cost of revenues, of $7.7 million, $12.3 million and $17.0 million, in 2010, 2011 and 2012, respectively, allocated as follows:
| | | | | | | | | | | | |
| | | Year Ended December 31, | |
| | | 2010 | | | 2011 | | | 2012 | |
| | | (dollars in thousands) | |
Cost of revenues | | $ | 6,133 | | | $ | 9,277 | | | $ | 13,845 | |
Selling and marketing expense | | | 364 | | | | 769 | | | | 350 | |
General and administrative expense | | | 1,205 | | | | 1,775 | | | | 366 | |
Research and development expenses | | | — | | | | 510 | | | | 2,476 | |
| | | | | | | | | | | | |
| | $ | 7,702 | | | $ | 12,331 | | | $ | 17,037 | |
| | | | | | | | | | | | |
In aggregate, government subsidies reflected in our consolidated statement of operations totaled $11.0 million, $14.2 million and $18.1 million, respectively, in 2010, 2011 and 2012.
Interest Expense
Our interest expense in 2010, 2011 and 2012 was $5.7 million, $1.4 million and $2.0 million, respectively. Our interest expense in 2010 included imputed interest of $4.4 million accrued for our $38.0 million principal amount of convertible notes and $1.3 million of interest on short-term bank borrowings. Our interest expense in 2011 included imputed interest of $0.7 million accrued for our $20 million principal amount of convertible notes, and $0.7 million of interest on short-term bank borrowings. Our interest expense of $2.0 million in 2012 was incurred on short-term bank borrowings. In connection with our initial public offering, which closed in December 2010, $18.0 million of the $38.0 million principal amount of convertible notes, together with accrued interest thereon, were converted into our ordinary shares. In March 2011, the holders of the remaining $20.0 million principal amount of convertible notes converted all their convertible notes plus accrued interest into our ordinary shares.
Income Tax Benefit (Expense)
Although we had operating income in 2010, we recorded income tax benefit of $0.3 million in 2010. We incurred income tax expense of $0.3 million and $4.4 million in 2011 and 2012, respectively. The income tax benefits in 2010 reflect the fact that: (i) our major profitable entities in China, where our operations are primarily based, either benefited from reduced income tax rates or were otherwise not subject to income tax in the periods reported, and (ii) the income tax expenses of the profitable entities were offset by the tax credits of other loss making entities, which deferred tax assets benefit has been recognized. In 2011, as certain of our significant subsidiaries had increased taxable income or reduced loss, we incurred income tax expense. In 2012, we recorded higher income tax expenses as the tax exemptions and tax holidays for some of our operating entities in China expired by the end of 2011.
Net Income (Loss)
As a result of the foregoing, we realized a net loss of $3.6 million in 2010, a net income of $19.0 million in 2011 and a net income of $22.1 million in 2012. Our non-GAAP net income for 2010, 2011 and 2012, which excludes share-based compensation, amortization of intangible assets from acquisitions, interest expense of convertible notes, changes in fair value of contingent consideration in connection with business combinations and changes in fair value of the convertible notes derivatives from our U.S. GAAP net income (loss), was $19.6 million, $34.3 million and $37.1 million, respectively. For a reconciliation of our non-GAAP net income to our U.S. GAAP net income (loss), see footnote (4) on page 5 of this report.
Critical Accounting Policies
We prepare our consolidated financial statements in accordance with U.S. GAAP, which requires us to make judgments, estimates and assumptions that affect: (i) the reported amounts of assets and liabilities (ii) disclosure of contingent assets and liabilities at the end of each reporting period and (iii) the reported amounts of revenue and expenses during each reporting period. We evaluate these estimates and assumptions based on historical experience, knowledge and assessment of current business and other conditions, and expectations regarding the future based on available information and reasonable assumptions, which together form a basis for making judgments about matters not readily apparent from other sources. Since the use of estimates is an integral component of the financial reporting process, actual results could differ from those estimates. Some of our accounting policies require higher degrees of judgment than others in their application. When reviewing our financial statements, you should consider (i) our selection of critical accounting policies, (ii) the judgment and other uncertainties affecting the application of such policies and (iii) the sensitivity of reported results to changes in conditions and assumptions. We consider the policies discussed below to be critical to an understanding of our financial statements as their application places significant demands on the judgment of our management.
67
The preparation of our consolidated financial statements and related notes requires us to make judgments, estimates and assumptions that affect the reported amounts of assets, liabilities, net sales and expenses, and related disclosure of contingent assets and liabilities. We have based our estimates on historical experience and on various other assumptions that we believe to be reasonable under the circumstances, the results of which form the basis for making judgments about the carrying values of assets and liabilities that are not readily apparent from other sources. Our management has discussed the development, selection and disclosure of these estimates with our board of directors. Actual results may differ from these estimates under different assumptions or conditions.
An accounting policy is considered to be critical if it requires an accounting estimate to be made based on assumptions about matters that are highly uncertain at the time the estimate is made, and if different estimates that reasonably could have been used, or changes in the accounting estimates that are reasonably likely to occur periodically, could materially impact the consolidated financial statements. We believe that the following critical accounting policies are the most sensitive and require more significant estimates and assumptions used in the preparation of our consolidated financial statements. You should read the following descriptions of critical accounting policies, judgments and estimates in conjunction with our consolidated financial statements and other disclosures included in this annual report.
Business Combination
Business combinations are recorded using the purchase method of accounting. The assets acquired, the liabilities assumed, and any noncontrolling interest of the acquiree at the acquisition date, if any, are measured at their fair values as of that date. Goodwill is recognized and measured as the excess of the total consideration transferred plus the fair value of any noncontrolling interest of the acquiree, if any, at the acquisition date over the fair values of the identifiable net assets acquired.
Common forms of the consideration made in acquisitions include cash and common equity instruments. Consideration transferred in a business acquisition is measured at the fair value as at the date of acquisition. For shares issued in a business combination, we have estimated the fair value as of the date of acquisition before our shares became publicly traded.
Where the consideration in an acquisition includes contingent consideration, the payment of which depends on the achievement of certain specified conditions post-acquisition, the contingent consideration is recognized and measured at its fair value at the acquisition date, and if recorded as a liability, it is subsequently carried at fair value with changes in fair value reflected in earnings.
Goodwill and Intangible Assets
Goodwill represents the cost of an acquired business in excess of the fair value of identifiable tangible and intangible net assets purchased. We generally seek for assistance from independent valuation services providers in determining the fair value of the identifiable intangible net assets of the acquired business.
There are several methods that can be used to determine the fair value of assets acquired and liabilities assumed. For intangible assets, we typically use the income method. This method starts with a forecast of all of the expected future net cash flows associated with a particular intangible asset. These cash flows are then adjusted to present value by applying an appropriate discount rate that reflects the risk factors associated with the cash flow streams. Some of the more significant estimates and assumptions inherent in the income method or other methods include the amount and timing of projected future cash flows; the discount rate selected to measure the risks inherent in the future cash flows; and the assessment of the asset’s economic life cycle and the competitive trends impacting the asset, including consideration of any technical, legal, regulatory or economic barriers to entry. Determining the useful life of an intangible asset also requires judgment as different types of intangible assets will have different useful lives.
Goodwill is tested for impairment at the reporting unit level on an annual basis and between annual tests if an event occurs or circumstances change that would more likely than not reduce the fair value of a reporting unit below its carrying value. These events or circumstances could include a significant change in our stock prices, business climate, legal factors, operating performance indicators, competition, or sale or disposition of a significant portion of a reporting unit.
Application of the goodwill impairment test requires judgment, including the identification of reporting units, assignment of assets and liabilities to reporting units, assignment of goodwill to reporting units, and determination of the fair value of each reporting unit. The estimation of fair value of each reporting unit using a discounted cash flow methodology also requires significant judgments, including estimation of future cash flows, which is dependent on internal forecasts, estimation of the long-term rate of growth for our business, estimation of the useful life over which cash flows will occur, and determination of our weighted average cost of capital. The estimates used to calculate the fair value of a reporting unit change from year to year based on operating results and market conditions. Changes in these estimates and assumptions could materially affect the determination of fair value and goodwill impairment for the reporting unit. If those assumptions change in the future when we conduct our periodic reviews in accordance with applicable accounting standards, we may be required to record impairment changes. It is possible that future reviews will result in future write-downs of goodwill.
68
In September 2011, the FASB issued an authoritative pronouncement related to testing goodwill for impairment. The guidance permits us to first assess qualitative factors to determine whether it is “more likely than not” that the fair value of a reporting unit is less than its carrying amount as a basis for determining whether it is necessary to perform the two-step goodwill impairment test. We adopted this pronouncement in 2012. If it is more likely than not that the fair value of a reporting unit is less than its carrying amount, goodwill is then tested following the two-step process. The first step compares the fair value of each reporting unit to its carrying amount, including goodwill. If the fair value of each reporting unit exceeds its carrying amount, goodwill is not considered to be impaired and the second step will not be required. If the carrying amount of a reporting unit exceeds its fair value, the second step compares the implied fair value of goodwill to the carrying value of a reporting unit’s goodwill. The implied fair value of goodwill is determined in a manner similar to accounting for a business combination with the allocation of the assessed fair value determined in the first step to the assets and liabilities of the reporting unit. The excess of the fair value of the reporting unit over the amounts assigned to the assets and liabilities is the implied fair value of goodwill. An impairment loss is recognized for any excess in the carrying value of goodwill over the implied fair value of goodwill. We recognized no impairment loss on goodwill in 2010, 2011 and 2012.
The following table sets forth the estimated fair values, carrying values of and goodwill allocated to our reporting units as of December 31, 2012:
| | | | | | | | | | | | |
Reporting Unit | | China | | | Japan | | | US and
Canada | |
| | | (dollars in thousands, except percentages) | |
Estimated fair value | | $ | 328,624 | | | $ | 4,034 | | | $ | 30,264 | |
Carrying value | | $ | 290,316 | | | $ | 3,015 | | | $ | 19,105 | |
Percentage by which the fair value exceed the carrying value | | | 13 | % | | | 34 | % | | | 58 | % |
The amount of goodwill allocated to the reporting unit | | $ | 11,417 | | | $ | 206 | | | $ | 15,360 | |
Intangible assets with determinable useful lives are amortized either on a straight-line basis or based on the estimated attrition pattern of the acquired intangible assets in the case of client base.
We evaluate intangible assets with determinable useful life for recoverability whenever events or changes in circumstances indicate that their carrying amounts may not be recoverable. Recoverability of long-lived assets to be held and used is measured by a comparison of the carrying amount of an asset to the future undiscounted net cash flows expected to be generated by the asset. If these assets are considered to be impaired, the impairment to be recognized is measured by the amount by which the carrying value of the assets exceeds the fair value of the assets. We did not recognize impairment for intangible assets for the periods presented in this annual report.
Estimates of fair value result from a complex series of judgments about future events and uncertainties and rely heavily on estimates and assumptions at a point in time. The judgments made in determining an estimate of fair value can materially impact our results of operations. The valuations are based on information available as of the impairment review date and are based on expectations and assumptions that have been deemed reasonable by management. Any changes in key assumptions, including unanticipated events and circumstances, may affect the accuracy or validity of such estimates and could potentially result in an impairment charge.
Revenue Recognition
We have three service lines: (i) IT Services; (ii) Consulting & Solutions; and (iii) BPO services. Historically, our revenues primarily were generated from IT Services and Consulting & Solutions. Revenue is considered realizable and earned when all of the following criteria are met: persuasive evidence of a sales arrangement exists; delivery has occurred or services have been rendered; the price is fixed or determinable; and collectability is reasonably assured. The rights to software developed by us on behalf of our clients belong to the clients and we do not have the option to acquire such rights from our clients. We provided services on a time-and-expense basis, a fixed-price basis or, with respect to some BPO services, on a volume basis.
Time-and-Expense Basis Contracts
Revenues from time-and-expense basis contracts are recognized as the related services are rendered assuming all other basic revenue recognition criteria are met. Our time-and-material contractual billing terms call for collection within an agreed contractual period. Under our time-and-expense contracts, clients are charged for actual service hours incurred at negotiated pre-agreed hourly billing rates, with revenues recognized as services are rendered. As part of our revenue recognition process for each period, we separately record, on an hourly basis, and verify with our clients, in a timely manner, the actual service hours rendered for each client during the period, with pre-agreed hourly billing rates clearly stated in each client’s service contract. Consequently, for revenue recognition purposes, services fees earned from time-and-expense projects in each period are fixed and determinable and generally collected in approximately one year.
69
As described in the discussion below of our year-end unbilled accounts receivable balances, in certain instances unbeknownst to us when executing the contract and prior to agreed billing dates, certain customers, who are dominant within the Chinese marketplace, have requested that we change the client’s bill schedule resulting in a longer aging of unbilled receivables. Despite these changes, the amounts actually billed and actually collected under the related contracts were not materially affected.
Fixed-Price Basis Contracts
Revenues from fixed-price basis contracts require us to perform services throughout the contractual period, which are generally less than two years. Revenues from this type of arrangements are generally recognized using the proportional performance method based on the proportion of direct labor costs incurred to the budgeted direct labor costs. We recognize cost of revenues for labor and other costs on actual basis with no deferral of project costs. We believe we can reasonably estimate the service hours expected to be incurred on each project and there are no retention provisions based on our historic experience. To date, we have not incurred a material loss on any contracts. However, as a policy, provisions for estimated losses on such engagements will be made during the period in which a loss becomes probable and can be reasonably estimated.
Volume Basis Contracts
For volume basis contracts, we recognize service revenues based on the volume of the transactions processed for the clients and a pre-agreed unit price for each type of process.
The following table sets forth our net revenues by pricing method for the periods presented:
| | | | | | | | | | | | | | | | | | | | | | | | |
| | | Year Ended December 31, | |
| | | 2010 | | | 2011 | | | 2012 | |
| | | Net
Revenues | | | % of Net
Revenues | | | Net
Revenues | | | % of Net
Revenues | | | Net
Revenues | | | % of Net
Revenues | |
| | | (dollars in millions, except for percentages) | |
Time-and-expense basis | | $ | 79.4 | | | | 40.3 | % | | $ | 107.3 | | | | 37.9 | % | | $ | 142.5 | | | | 37.5 | % |
Fixed-price basis | | | 115.8 | | | | 58.8 | | | | 172.7 | | | | 60.9 | | | | 235.9 | | | | 61.9 | |
Volume basis (BPO) | | | 1.8 | | | | 0.9 | | | | 3.4 | | | | 1.2 | | | | 2.7 | | | | 0.6 | |
| | | | | | | | | | | | | | | | | | | | | | | | |
Total net revenues | | $ | 197.0 | | | | 100.0 | % | | $ | 283.4 | | | | 100.0 | % | | $ | 381.1 | | | | 100.0 | % |
| | | | | | | | | | | | | | | | | | | | | | | | |
Accounts Receivable
As of December 31, 2010, 2011 and 2012, our total billed and unbilled accounts receivable totaled $101.9 million, $152.7 million and $202.2 million, respectively, net of allowances for doubtful accounts. Since we generally do not require collateral or other security from our clients, we establish an allowance for doubtful accounts based upon estimates, historical experience and other factors surrounding the credit risk of specific clients. As of December 31, 2010, 2011 and 2012, the provision made for doubtful accounts was $2.3 million, $4.2 million and $1.7 million, respectively. Our management periodically monitors outstanding receivables and collection status and assesses the adequacy of allowances for accounts where collection may be in doubt as frequency and amount of client defaults change due to our clients’ financial condition or general economic conditions. We are focused on improving our cash collection procedures.
Our accounts receivable balances have been significantly affected by the relatively high concentration of our client base. In 2010, 2011 and 2012, our five largest clients accounted for 46.1%, 43.2% and 47.2%, respectively, of our net revenues, and our largest client accounted for 26.0%, 29.6% and 29.5% of our net accounts receivable as of December 31, 2010, 2011 and 2012, respectively.
Billed Accounts Receivable
Our billed receivables represent the amounts billed based on agreed-upon project milestones or payment schedules that remain outstanding, and correspond to the period between billing and collection. As of December 31, 2010, 2011 and 2012, our billed accounts receivable, net of allowance for doubtful accounts, totaled $26.3 million, $50.6 million and $50.7 million, respectively. As of December 31, 2012, a substantial portion of our billed receivables outstanding as of December 31, 2010 and 2011, in each case net of allowance for doubtful accounts, had been collected. Furthermore, as of December 31, 2010, 2011 and 2012, billed receivables which have been outstanding for more than one year totaled $1.3 million, $1.6 million and $5.4 million, respectively, representing 4.9%, 3.1% and 10.6% of our total billed accounts receivable, respectively. As of the date of this annual report, we do not note indicators of default in payment relating to these billed accounts receivable, even though their agings are more than one year and in a few cases, two years. The amount of the billed receivables aging more than two years is not material.
70
The following table sets forth the aging schedule of our billed receivables, net of allowance for doubtful accounts, as of the dates indicated:
| | | | | | | | | | | | | | | | | | | | | | | | |
| | | As of December 31, | |
| | | 2010 | | | 2011 | | | 2012 | |
| | | Billed | | | % of
Total | | | Billed | | | % of
Total | | | Billed | | | % of
Total | |
| | | (dollars in thousands, except for percentages) | |
Within 90 days | | $ | 22,178 | | | | 84.3 | % | | $ | 42,102 | | | | 83.1 | % | | $ | 32,440 | | | | 64.0 | % |
91 days-one year | | | 2,853 | | | | 10.8 | | | | 6,980 | | | | 13.8 | | | | 12,876 | | | | 25.4 | |
> one year | | | 1,293 | | | | 4.9 | | | | 1,552 | | | | 3.1 | | | | 5,365 | | | | 10.6 | |
| | | | | | | | | | | | | | | | | | | | | | | | |
Total | | $ | 26,324 | | | | 100.0 | % | | $ | 50,634 | | | | 100.0 | % | | $ | 50,681 | | | | 100.0 | % |
| | | | | | | | | | | | | | | | | | | | | | | | |
There were $10.9 million of our billed receivables pledged by us for borrowing short term bank loans as of December 31, 2012.
We currently expect that, among the total billed receivable balances of $50.7 million as of December 31, 2012, approximately 95% will be collected in 2013 and the remaining 5% will be collected in 2014 or onwards, based on our analysis of the payment term and the implementation status of each individual client project. However, since the payment behaviors of the clients are difficult to predict, the actual amount of cash collection in each year may be different from our estimates.
Unbilled Accounts Receivable
Our unbilled receivables represent the excess of recognized revenues over billings and correspond to the period between revenue recognition and invoicing. Such period generally arises from: (i) with respect to our time-and-expense contracts, the long, multi-year nature of the related projects and unanticipated requests from time to time to delay billing by some of our clients; and (ii) with respect to our fixed-price contracts, the period between revenue recognition and the time when our billing milestones are reached. This period may vary significantly based on the number of progress billings and the amount of each billing agreed upon. As of December 31, 2010, 2011 and 2012, our net unbilled receivables, totaled $75.6 million, $102.0 million and $151.5 million, respectively. The increase of our year-end unbilled receivable balances is consistent with our overall net revenue growth.
As of December 31, 2012, a substantial portion of our unbilled receivables outstanding as of December 31, 2010 and 2011 were subsequently billed. Furthermore, as of December 31, 2010, 2011 and 2012, unbilled receivables which remain unbilled for more than one year totaled $12.5 million, $18.8 million and $19.2 million, respectively, representing 16.5%, 18.4% and 12.7% of our total unbilled accounts receivable, respectively. As of the date of this annual report, we do not note indicators that will prevent our unbilled amount from subsequently becoming billable regardless of the agings. If any triggering events happening in the future make us believe any amount turn to be uncollectible, we will write off the uncollectible balances and deduct revenue accordingly.
We currently expect that, among the total unbilled receivable balances of $151.5 million as of December 31, 2012, approximately 82% will be collected in 2013 and the remaining 18% will be collected in 2014 or onwards, based on our analysis of the payment term and the implementation status of each individual client project. However, since the payment behaviors of the clients are difficult to predict, the actual amount of cash collection in each year may be different from our estimates.
Fair Value of Our Ordinary Shares
Prior to the closing of our initial public offering in December 2010, we were a private company with no quoted market prices for our ordinary shares. We therefore needed to make estimates of the fair value of our ordinary shares at various dates for the purpose of:
(1) Determining the fair value of our shares at the date of acquisition when we had acquired another entity and the consideration given includes our ordinary shares.
(2) Determining the fair value of our ordinary shares at the date of the grant of a share-based compensation award to our employees and non-employees as one of the inputs into determining the grant date fair value of the award.
(3) Determining the fair value of our ordinary shares at the date of issuance of our convertible instruments in the determination of any beneficial conversion feature.
71
The following table sets forth the fair value of our ordinary share estimated at different times:
| | | | | | | | | | | | | | | | |
Date | | Class of shares | | Fair value | | | Purpose of valuation | | DLOM | | | Discount rate | |
November 18, 2005 | | Ordinary shares | | $ | 0.09 | | | Issuance of series A preference shares and warrant | | | 26 | % | | | 33 | % |
November 28, 2006 | | Ordinary shares | | $ | 0.12 | | | Grant of nonvested shares | | | * | | | | * | |
December 15, 2006 | | Ordinary shares | | $ | 0.12 | | | Share option grant | | | 18 | % | | | 32 | % |
December 25, 2006 | | Ordinary shares | | $ | 0.12 | | | Grant of nonvested shares | | | * | | | | * | |
March 16, 2007 | | Ordinary shares | | $ | 0.13 | | | Issuance of series B preference shares and warrant | | | 17 | % | | | 32 | % |
March 28, 2007 | | Ordinary shares | | $ | 0.13 | | | Grant of nonvested shares | | | * | | | | * | |
April 1, 2007 | | Ordinary shares | | $ | 0.13 | | | Share option grant | | | * | | | | * | |
July 2, 2007 | | Ordinary shares | | $ | 0.15 | | | Grant of nonvested shares | | | * | | | | * | |
December 31, 2007 | | Ordinary shares | | $ | 0.19 | | | Issuance for acquisition of Shanghai Jiefeng Computer Science Co., Ltd., or Shanghai Jiefeng and series B warrant remeasurement | | | 16 | % | | | 29 | % |
February 22, 2008 | | Ordinary shares | | $ | 0.21 | | | Issuance for acquisition of Akona and series B warrant remeasurement | | | * | | | | * | |
April 1, 2008 | | Ordinary shares | | $ | 0.22 | | | Share option grant | | | 16 | % | | | 29 | % |
December 20, 2008 | | Ordinary shares | | $ | 0.30 | | | Share option grant | | | 16 | % | | | 27 | % |
June 6, 2009 | | Ordinary shares | | $ | 0.44 | | | Grant of nonvested shares | | | * | | | | * | |
August 31, 2009 | | Ordinary shares | | $ | 0.46 | | | Share option grant | | | 16 | % | | | 22.5 | % |
October 12, 2009 | | Ordinary shares | | $ | 0.48 | | | Issuance for settlement of contingent consideration for acquisition of Akona | | | * | | | | * | |
December 23, 2009 | | Ordinary shares | | $ | 0.48 | | | Issuance of convertible note, Issuance for acquisition of iSoftStone Resource Ltd. and share option grant | | | 16 | % | | | 22.5 | % |
April 18, 2010 | | Ordinary shares | | $ | 0.54 | | | Issuance of common shares | | | 14 | % | | | 19 | % |
June 30, 2010 | | Ordinary shares | | $ | 0.64 | | | Issuance of common shares and computation of intrinsic value of employee share option | | | 13 | % | | | 17.5 | % |
August 1, 2010 | | Ordinary shares | | $ | 0.65 | | | Share option grant | | | 10 | % | | | 17.5 | % |
September 15, 2010 | | Ordinary shares | | $ | 1.13 | | | Share option grant | | | * | * | | | * | * |
| * | Fair value determined by us by reference to a recent valuation performed by American Appraisal China Limited. |
| ** | Fair value determined by us based on a then estimation of our initial public offering price. |
When estimating the fair value of the ordinary shares, our management considered a number of factors, including the result of a third party appraisal and equity transactions of our company, while taking into account standard valuation methods and the achievement of certain events.
The fair value of the ordinary shares was determined with the assistance of American Appraisal China Limited, or AA, an independent third party valuation firm. The valuation reports from AA were used as part of our analysis in reaching our conclusion on share values. We reviewed the valuation methodologies used by AA, who took into consideration of the guidance prescribed by the AICPA Audit and Accounting Practice Aid “Valuation of Privately-Held-Company Equity Securities Issued as Compensation,” or the Practice Aid, and believe the methodologies used were appropriate and the valuation results were representative of the fair value of our ordinary shares.
72
AA used the income approach/discounted cash flow method as the primary approach and the market approach as a cross-check to derive the fair value of our ordinary shares. The determination of the fair value of our ordinary shares required us to make complex and subjective judgments regarding our projected financial and operating results, our unique business risks, the liquidity of our shares and our operating history and prospects at the time of each grant.
The major assumptions used in calculating the fair value of ordinary shares included:
| | • | | Weighted average cost of capital, or WACC. WACCs of 32%, 32%, 29%, 27%, 22.5%, 22.5%, 19%, 17.5% and 17.5% were used for valuation as of December 15, 2006, April 1, 2007, April 1, 2008, December 20, 2008, September 1, 2009, December 23, 2009, April 18, 2010, June 30, 2010 and August 1, 2010 respectively. The WACCs were determined based on a consideration of the factors including risk-free rate, comparative industry risk, equity risk premium, company size and non-systematic risk factors. This decrease in WACCs was due to the combined results of (i) the continuous growth of our business and company size and realization of synergies through our various acquisitions, particularly the acquisition of Beijing Kebao, Akona, Shenzhen Star and MDCL (ii) additional financing obtained through the issuance of preference shares and (iii) the proximity of our initial public offering. The decrease in WACC used for valuation purposes resulted in an increase in the determined fair value of the ordinary shares. |
| | • | | Comparable companies. In deriving the WACCs, which were used as the discount rates under the income approach, six publicly traded companies in the software outsourcing industry were selected for reference as our guideline companies for valuation as of 2005 to April 2008. The selected guideline companies included Lionbridge Technologies Inc, Cognizant Technology Solutions Corporation, Infosys Technologies Limited, Wipro Limited, Tata Consultancy Services and Sino Software Group Limited. For valuation as of December 2008 to 2010, since the trading history of three U.S. listed Chinese software outsourcing companies became long enough to derive a reliable beta, a measure of systematic risks factor, they were also added as our guideline companies to increase the representativeness of the data. These three newly selected comparable companies were Vanceinfo Technologies Inc., Longtop Financial Technologies Limited and Yucheng Technologies Inc. |
In deriving the WACCs, which were used as the discount rates under the income approach, six publicly traded companies in the software outsourcing industry were selected for reference as our guideline companies.
| | • | | Discount for lack of marketability, or DLOM. AA quantified DLOM using the Black-Scholes option-pricing model. Under this option pricing method, the cost of the put option, which can hedge the price change before the privately held shares can be sold, was considered as a basis to determine the DLOM. This option pricing method is one of the methods commonly used in estimating DLOM as it can take into consideration factors like timing of liquidity events, such as an initial public offering, and estimated volatility of our shares. The farther the valuation date is from an expected liquidity event, the higher the put option value and thus the higher the implied DLOM. DLOMs of between 18% (as at December 31, 2006) and 10% (as at August 1, 2010) were used in our valuations. The lower the DLOM used for valuation purposes, the higher the determined fair value of the ordinary shares. |
The income approach involves applying appropriate discount rates to estimated cash flows that are based on earnings forecasts. Our revenues and earnings growth rates, as well as major milestones that we had achieved, contributed significantly to the increase in the fair value of our ordinary shares. However, these fair values were inherently uncertain and highly subjective. The assumptions used in deriving the fair values were consistent with our business plan. These assumptions included: no material changes in the existing political, legal and economic conditions in China; no major changes in the tax rates applicable to our subsidiaries and consolidated affiliated entity in China; our ability to retain competent management, key personnel and staff to support our ongoing operations; and no material deviation in market conditions from economic forecasts. These assumptions were inherently uncertain. The risks associated with achieving our forecasts were assessed in selecting the appropriate WACCs, which ranged from 17.5% to 33%.
We used the option-pricing method to allocate enterprise value to preference shares and ordinary shares, taking into account the guidance prescribed by the Practice Aid. The method treats ordinary shares and preference shares as call options on the enterprise’s value, with exercise prices based on the liquidation preference of the preference shares. Under this method, the ordinary shares have value only if the funds available for distribution to shareholders exceed the value of the liquidation preference at the time of a liquidity event.
The option-pricing method involves making estimates of the anticipated timing of a potential liquidity event, such as a sale of our company or an initial public offering, and estimates of the volatility of our equity securities. The anticipated timing is based on the plans of our board of directors and management. Estimating the volatility of the share price of a privately held company is complex because there is no readily available market for the shares. We estimated the volatility of our shares to range from 36% to 68.2% based on the historical volatilities of comparable publicly traded companies engaged in similar lines of business. Had we used different estimates of volatility, the allocations between preferred and ordinary shares would have been different.
73
The fair value of our ordinary shares increased from $0.12 as of December 15, 2006 and $0.13 as of March 16, 2007 to $0.22 as of April 1, 2008. We believe the increase in the fair value of our ordinary shares was primarily due to the following:
| | • | | During this period, we completed the acquisition of the remaining 25% equity interest in Beijing Kebao, the remaining 49% equity interest in iSoftStone Information System Service Co., Ltd., the operating assets and liabilities of Wuxi Huayang Software Co., Ltd., the business of Shanghai Jiefeng and the business of Akona. These acquisitions increased our scale and geographic presence, expanded our capabilities, and provided a significant source of revenue growth. In view of this, we decreased the discount rate used for valuation of our ordinary shares from 32% as of December 15, 2006 to 29% as of April 1, 2008, and adjusted our financial forecast upward to account for the effect of these acquisitions. |
The fair value of our ordinary shares increased from $0.22 as of April 1, 2008 to $0.30 as of December 20, 2008. We believe the increase in fair value of our ordinary shares during the period was primarily due to the fact that we experienced continuous improvement in our operations and financial results. In spite of global financial crisis, we improved our financial results from a $10.3 million net loss in 2007 to breakeven for 2008. In view of this, we decreased the discount rate used for valuation of our ordinary shares from 29% as of April 1, 2008 to 27% in December 20, 2008.
The fair value of our ordinary shares increased from $0.30 as of December 20, 2008 to $0.46 as of August 31, 2009 and $0.48 as of December 23, 2009. We believe the increase in fair value of our ordinary shares was preliminary due to the following:
| | • | | In connection with recovery of the global economy, the demand for our services increased. In 2009, our revenue increased by 63.0%, as compared to 2008. Our operating margin improved from 0.5% in 2008 to 6.6% in 2009. |
| | • | | During this period, we completed the acquisition of Shenzhen Star and the IT services business of MDCL. These acquisitions further increased our scale and geographic presence, expanded our capabilities, and provided a significant source of revenue growth. In view of this, we decreased the discount rate used for valuation of our ordinary shares from 27% as of December 20, 2008 to 22.5% as of December 31, 2009, and adjusted our financial forecast upward to account for the effect of these acquisitions. |
The fair value of our ordinary shares increased from $0.48 as of December 23, 2009 to $0.54 as of April 18, 2010. We believe the increase in the fair value of our ordinary shares was primarily due to the following:
| | • | | In February 2010, we established an audit committee to strengthen our internal controls over financial reporting. |
| | • | | During this period, we made a geographic breakthrough in developing key customers in the U.S., such as a major U.S. telecom operator. In addition, we also entered into a new framework agreement with a major China-based computer manufacturer and developed more contracts with clients in our area of ETP industry vertical such as China’s State Grid. |
| | • | | We believe that these milestone events of our business development activities, together with the improvement in our internal controls, reduced the uncertainty about achieving our financial forecasts, lowered the market participants’ perceived risks of and hence the required rate of return for investing in our securities. As a result, our estimated WACC was lowered from 22.5% in December 2009 to 19% as of April 2010. |
The fair value of our ordinary shares increased from $0.54 as of April 18, 2010 to $0.64 as of June 30, 2010 and $0.65 as of August 1, 2010. We believe the increase in the fair value of our ordinary shares was primarily due to the following:
| | • | | During this period, we achieved substantial progress in the preparation for our initial public offering and completed our first confidential submission in August 2010. The proximity of our initial public offering increased the liquidity of our shares and hence lowered DLOM from 14% as of April 2010 to 10% as of August 2010. In addition, as our company progressed towards our initial public offering, the perceived risk of investing in our company would tend to be lower than in an earlier stage. In view of the above, our estimated WACC also declined from 19% to 17.5%. |
| | • | | We continued to bolster our management and finance and accounting functions by appointing Mr. Xiaosong (Jonathan) Zhang, who has U.S. publicly listed company and extensive financial reporting and auditing experience, as our chief financial officer. |
We believe that the increase in the estimated fair value of our ordinary shares from $0.65 as of August 1, 2010 to the initial public offering price of $1.30 per ordinary share, or $13.00 per ADS, was primarily attributable to the following factors:
| | • | | Market-Specific Factors: |
| | • | | Reactions to the U.S. Federal Reserve announcements and actions had raised expectations regarding increasing liquidity and dollar devaluation, contributing to a sharp rise in U.S. and global capital markets since the end of August 2010. |
| | • | | China-based issuers, in particular, have benefited from positive economic outlook and strong investor demand, with (i) China IPOs into the U.S. having significantly outperformed the broader IPO market since August 1, 2010 and (ii) the trading prices for the company’s closest China-based and Indian comparables increasing significantly during the period. |
| | • | | Company-Specific Factors: |
74
Although our then most recent financial forecasts had not materially changed from those used in deriving the August 1, 2010 appraised valuation of $0.65 per ordinary share, we had achieved several business specific milestones since early August 2010:
| | • | | In October 2010, we acquired Ascend and in November 2010, we acquired Shanghai Kangshi, expanding our geographic and service capabilities to better serve global BFSI clients and enhancing our business intelligence service capabilities to address Greater China and Global clients. |
| | • | | We continued to expand our business operations, most notably establishing a second facility at our sales and delivery center in Wuxi, China in November 2010, providing increased economies of scale and revenue generation opportunities. |
| | • | | We continued to make substantial progress in the preparation for our initial public offering. Completion of our initial public offering will provide us additional capital, enhance our ability to access capital markets and expand our business, raise our customer profile and provide our shareholders with greater liquidity. |
| | • | | In November 2010, we entered into binding conversion agreements with holders of $18 million of the total $38 million aggregate principal amount of convertible notes, pursuant to which they agreed to convert their notes upon the closing of our initial public offering, which we expected should significantly mitigate public investor uncertainty regarding the number of our shares issuable to convertible note holders, potential additional related accounting charges and our ability to utilize the proceeds of our initial public offering. |
Share-Based Compensation Expenses
Our share-based payment transactions with employees are measured based on the grant date fair value of the equity instrument we issued and recognized as compensation expense on a straight-line basis over the requisite service period with the graded vesting schedule, with a corresponding impact reflected in additional paid-in capital. Share awards issued to non-employees, such as consultants, are measured at fair value at the earlier of the commitment date or the date the service is completed and recognized over the period the service is provided.
The following table sets forth certain information regarding the share options granted:
| | | | | | | | | | | | | | | | | | | | |
Grant date | | Options
granted | | | Exercise price
per option(1) | | | Option FV -
Employee | | | Option
FV -
Non-
employee | | | Type of Valuation | |
December 15, 2006 | | | 11,116,500 | | | $ | 0.30 | | | $ | 0.04 | | | $ | 0.07 | | | | Retrospective | |
April 1, 2007 | | | 8,445,500 | | | | 0.30 | | | | 0.04 | | | | 0.07 | | | | Retrospective | |
April 1, 2008 | | | 11,382,303 | | | | 0.30 | | | | 0.10 | | | | 0.14 | | | | Retrospective | |
December 20, 2008 | | | 9,131,962 | | | | 0.30 | | | | 0.15 | | | | 0.21 | | | | Retrospective | |
September 1, 2009 | | | 590,000 | | | | 0.50 | | | | 0.24 | | | | — | | | | Retrospective | |
December 23, 2009 | | | 26,160,702 | | | | 0.50 | | | | 0.27 | | | | 0.34 | | | | Retrospective | |
August 1, 2010 | | | 16,347,380 | | | | 0.65 | | | | 0.36 | | | | 0.46 | | | | Contemporaneous | |
September 15, 2010 | | | 4,932,835 | | | | 0.65 | | | | 0.76 | | | | — | | | | Retrospective | |
November 18, 2010 | | | 400,000 | | | | 1.24 | | | | — | | | | 0.68 | | | | Retrospective | |
April 29, 2011 | | | 492,500 | | | | 0.43 | (2) | | | 1.04 | | | | — | | | | Contemporaneous | |
June 27, 2011 | | | 1,125 | | | | 0.3 | | | | — | | | | 1.18 | | | | Contemporaneous | |
June 27, 2011 | | | 9,218,172 | | | | 0.43 | (2) | | | 0.71 | | | | — | | | | Contemporaneous | |
October 7, 2011 | | | 500,000 | | | | 0.65 | | | | — | | | | 0.65 | | | | Contemporaneous | |
November 11, 2011 | | | 400,000 | | | | 0.43 | (2) | | | 0.53 | | | | — | | | | Contemporaneous | |
November 22, 2011 | | | 90,000 | | | | 0.43 | (2) | | | 0.49 | | | | — | | | | Contemporaneous | |
December 31, 2011 | | | 50,000 | | | | 0.50 | | | | 0.56 | | | | — | | | | Contemporaneous | |
December 13, 2012 | | | 7,642,000 | | | | 0.41 | | | | 0.19 | | | | 0.19 | | | | Contemporaneous | |
| (1) | The exercise prices of the share options we granted are denominated in U.S. dollars, which is the functional currency and reporting currency of iSoftStone Holdings Limited. |
| (2) | On December 13, 2012, our Compensation Committee revised the exercise price for these outstanding options held by individuals then employed by us. The exercise price was set at the greater of (i) the per-share closing price of our ordinary shares on December 13, 2012 or (ii) the average of the per-share closing prices over the period of 30 trading days ended on December 13, 2012. |
75
The fair value of an option award is estimated on the date of grant using the Black-Scholes option pricing model that uses the following assumptions:
| | | | | | | | | | | | | | | | | | | | |
| | | 2008 | | | 2009 | | | 2010 | | | 2011 | | | 2012 | |
Risk-free interest rate of return | | | 4.35% – 4.86% | | | | 2.78% – 2.86% | | | | 1.94% | | | | 1.09 – 1.43% | | | | 0.89% | |
Expected term | | | 5.5 – 10 years | | | | 7 – 10 years | | | | 5.3 – 10 years | | | | 5 – 10 years | | | | 6.1 years | |
Volatility | | | 47.1% – 55.7% | | | | 50.4% – 63.3% | | | | 57.0% – 61.2% | | | | 55.3% – 58.9% | | | | 57.4% | |
Dividend yield | | | — | | | | — | | | | — | | | | — | | | | — | |
The risk-free rate for periods within the expected life of the option is based on the implied yield rates of U.S. dollar denominated bonds issued by the Chinese government as of the valuation dates.
The expected life of options represents the period of time the granted options are expected to be outstanding. As we did not grant options prior to December 15, 2006 and few options have been exercised, no sufficient historical pattern of exercise could be followed in estimating the expected life. Therefore, the expected life is estimated based on a consideration of factors including contractual term, vesting period and empirical study on exercise behavior of employee share options. Our employees who received our stocks options are assumed to exhibit similar behavior. As we expected to grow our business with internally generated cash, we did not expect to pay dividends in the foreseeable future. For the options granted to non-employees, we estimated the expected term as the original contractual term.
The expected volatility was based on the historical volatilities of the same set of comparable publicly traded companies used for determination of our weighted average cost of capital, or WACC.
We also granted restricted shares and share units to certain employees, directors and non-employees under which the fair value of the ordinary shares as of the grant day was used to determine the share-based compensation expenses. The following table sets forth certain information regarding the restricted shares and share units granted:
| | | | | | | | | | | | | | | | |
| Grant date | | Restricted Shares
granted | | | Restricted
Share FV -
Employee | | | Restricted Share FV -
Non-employee | | | Type of Valuation | |
April 29, 2011 | | | 665,999 | | | $ | 1.98 | | | $ | — | | | | Contemporaneous | |
| | | | |
| Grant date | | Share Units
granted | | | Share Units FV -
Employee | | | Share Units FV -
Non-employee | | | Type of Valuation | |
2011 | | | 8,157,581 | | | $ | 0.65-1.16 | | | $ | 0.65-1.54 | | | | Contemporaneous | |
2012 | | | 10,280,840 | | | | 0.38-1.01 | | | | 0.38-1.06 | | | | Contemporaneous | |
We recorded share-based compensation expenses of $8.5 million, $9.3 million and $11.1 million for the years ended December 31, 2010, 2011 and 2012, respectively, with the amount of compensation expenses recognized using the straight-line method in any period not less than the portion of the grant date fair value of the awards vested during that period in accordance with the graded vesting schedule. As of December 31, 2011 and December 31, 2012, we had a total of $17.6 million and $13.4 million, respectively, in unrecognized compensation expense related to unvested share options, unvested restricted shares and unvested share units. The expense is expected to be recognized over a weighted average period of 1.3 years using the straight-line method for unvested share options, 2.3 years using the straight-line method for unvested restricted shares and 2.7 years using the straight-line method for unvested share units, in accordance with the graded vesting schedule respectively.
Income Taxes
In preparing our consolidated financial statements, we must estimate our income taxes in each of the jurisdictions in which we operate. We estimate our actual tax exposure and assess temporary differences resulting from different treatment of items for tax and accounting purposes. These differences result in deferred tax assets and liabilities, which we include in our consolidated balance sheet. We must then assess the likelihood that we will recover our deferred tax assets from future taxable income. If we believe that recovery is not likely, we must establish a valuation allowance. To the extent we establish a valuation allowance or increase this allowance, we must include an expense within the tax provision in our statement of operations.
Management must exercise significant judgment to determine our provision for income taxes, our deferred tax assets and liabilities and any valuation allowance recorded against our net deferred tax assets. We base the valuation allowance on our estimates of taxable income in each jurisdiction in which we operate and the period over which our deferred tax assets will be recoverable. If actual results differ from these estimates or we adjust these estimates in future periods, we may need to establish an additional valuation allowance, which could materially impact our financial position and results of operations.
U.S. GAAP requires that an entity recognize the impact of an uncertain income tax position on the income tax return at the largest amount that is more likely than not to be sustained upon audit by the relevant tax authority. If we ultimately determine that payment of these liabilities will be unnecessary, we will reverse the liability and recognize a tax benefit during that period. Conversely, we record additional tax charges in a period in which we determine that a recorded tax liability is less than the expected ultimate assessment. We did not recognize any significant unrecognized tax benefits during the periods presented in this annual report.
76
Uncertainties exist with respect to the application of the Enterprise Income Tax Law of PRC and its implementing rules to our operations, specifically with respect to our tax residency status. The Enterprise Income Tax Law specifies that legal entities organized outside of the PRC will be considered residents for PRC income tax purposes if their “de facto management bodies” are located within the PRC. The Enterprise Income Tax Law’s implementation rules define the term “de facto management bodies” as “establishments that carry out substantial and overall management and control over the manufacturing and business operations, personnel, accounting, properties, etc. of an enterprise.”
Despite the uncertainties resulting from limited PRC tax guidance on the issue, we do not believe that our legal entities organized outside of the PRC constitute residents under the Enterprise Income Tax Law. If one or more of our legal entities organized outside of the PRC were characterized as PRC tax residents, the impact would adversely affect our results of operations. See “Item 3.D. Key Information—Risk Factors—Risk Related to Doing Business in China—We may be classified as a “resident enterprise” for PRC enterprise income tax purposes; such classification could result in unfavorable tax consequences to us and our non-PRC shareholders.”
Government Subsidies
Government subsidies are recorded as receivables when the approval documents are obtained from the local government authorities and we have the right to receive the subsidies. Subsidies intended to compensate for specific expenditure are recognized in our statement of operations as deductions to the cost of revenues and related expenses when the receivable is booked. Subsidies not intended to compensate for specific expenditures are recognized as other operating income when booked.
B. Liquidity and Capital Resources
Our operations and our growth have primarily been financed by cash collected from customers, issuances of our preference shares and convertible notes and short-term bank borrowings, as well as by our initial public offering in December 2010. As of December 31, 2012, $54.0 million was outstanding under our short-term bank borrowings. Our short-term bank borrowing agreements do not contain any material financial covenants, accordingly, we are not in violation of any material financial covenants as of December 31, 2012. The annual interest rates on these short-term bank borrowings range from 6.00% to 7.22% and are fixed at rates published by the People’s Bank of China or at a premium to such benchmark rates. The maturity dates range from June 26, 2013 to December 25, 2013. Out of the $54.0 million bank borrowings, $31.5 million were without any collateral, and the remaining $22.5 million were guaranteed by a director of our company and pledged accounts receivable of iSoftStone WFOE and iSoftStone Information System Service Co., Ltd. As described below under “—Financing Activities”, proceeds received from the issuance of preference shares and convertible notes were primarily used for financing our operating activities, making purchase of property and equipment and as consideration for various acquisitions, and proceeds from our short-term borrowings incurred within one year were primarily used for financing our operations.
As of December 31, 2012, we had $116.6 million in cash, compared to $101.2 million as of December 31, 2011 and $181.1 million as of December 31, 2010. The decrease from 2010 to 2011 was primarily due to the payment of $36.8 million to purchase the office building and land use right in Wuxi, $11.6 million for purchase of property and equipment, $12.0 million for long term investments and the net payments on short term bank borrowings of $22.7 million in 2011, partially offset by the increase of cash collection from exercise of options at the amount of $4.0 million. The increase from 2011 to 2012 was primarily due to increase of cash from additional net bank borrowings of $38.3 million and $9.9 million provided by operating activities, partially offset by payment of $20.6 million for purchase of property and equipment and payments of $9.4 million for long term investment and business acquisitions. Our cash consists primarily of cash on hand and highly liquid investments. We believe that our current cash and anticipated cash flow from operations will be sufficient to meet our anticipated cash needs, including our cash needs for working capital and capital expenditures, for at least the next 12 months. We may, however, require additional cash due to changing business conditions or other future developments, including any investments or acquisitions we may decide to pursue.
Our liquidity is impacted by the billing and collection of our accounts receivable. Our client base primarily consists of leading companies in Greater China and globally. The timing of invoicing and collection of our accounts receivable under our contracts is dependent upon the life cycle of each project and related payment milestones and heavily impacted by the budget and payment cycles of our large enterprise clients in China. As of December 31, 2010, 2011 and 2012, our net unbilled receivables, totaled $75.6 million, $102.0 million and $151.5 million, respectively. The increase in the related unbilled receivable balances reflect significant revenue growth from 2010 to 2012 derived from large dominant domestic Chinese clients (many of which are large state owned enterprises) and multi-national companies involving large and long, multi-year projects. The increase of our year-end unbilled receivable balances also reflects, in a material respect, increases resulting from unanticipated requests from time to time to delay billing by some of these large, industry dominant clients. These requests to delay billing were made, for example, so that the client could meet its own budgetary cycles and/or internal cash management mandates. The delay of billing could vary from days to weeks or even months. Despite these delays, the amounts actually billed and actually collected under the related contracts were not materially affected. As of December 31, 2010, 2011 and 2012, our billed accounts receivable, net of allowance for doubtful accounts, totaled $26.3 million, $50.6 million and $50.7 million, respectively. For the aging of our billed accounts receivable, please see “Item 5.A. Operating and Financial Review and Prospects—Operating Results—Critical Accounting Policies—Accounts Receivable.” In connection the formation of ISST, Huawei agreed to provide ISST with certain supportive policies which we believe will help improve the collection of, and therefore reduce the aging of, our account receivables.
77
Our PRC subsidiaries and our single, small consolidated affiliated entity, in the aggregate, held RMB532.0 million (US$85.4 million) in cash and cash equivalents as of December 31, 2012. Historically, our non-PRC operations and expansions have mainly been funded by amounts raised at the Cayman Islands holding company level and used to fund those operations and expansions and by cash flow from operations of our respective non-PRC subsidiaries, and we had not transferred any funds from our PRC subsidiaries and our single, small consolidated affiliated entity to our entities outside of the PRC. However, if our PRC subsidiaries (including ISST) and consolidated affiliated entity were required to distribute dividend or other payment to our Cayman Islands holding company or other non-PRC entities, we will be subject to certain restrictions and potential tax liabilities. For more information, please see “Risk Factors—Risks Relating to Doing Business in China—Governmental control of currency conversion may limit our ability to use our revenues effectively and the ability of our PRC subsidiaries to obtain financing”, “—We may rely on dividends paid by our subsidiaries for our cash needs, and any limitation on the ability of our subsidiaries to make payments to us could have a material adverse effect on our ability to conduct our business”, and “—PRC regulations relating to the establishment of offshore special purpose companies by PRC residents may subject our PRC resident shareholders to personal liability and limit our ability to acquire PRC companies or to inject capital into our PRC subsidiaries, limit our PRC subsidiaries’ ability to distribute profits to us, or otherwise materially and adversely affect us.”
Our PRC subsidiaries generally earn their revenues in Reminbi which is not a freely convertible currency. Although our PRC subsidiaries generally may convert Reminbi into foreign currency to pay dividends, our PRC subsidiaries must follow specific procedural requirements which could result in delay or which could change in the future. In addition, each of our PRC subsidiaries may pay dividends only out of its accumulated distributable profits, if any, determined in accordance with its articles of association and the accounting standards and regulations in the PRC. We are not required to publicly release financial statements for our PRC subsidiaries prepared in accordance with PRC accounting standards. Based on our understanding of U.S. GAAP and PRC accounting standards, we are not aware of any significant differences between accumulated profits as calculated under PRC accounting standards and those accounting standards used in preparing our U.S. GAAP financial statements. Moreover, pursuant to applicable PRC laws and regulations, 10% of the after-tax profits of each of our PRC subsidiaries are required to be set aside in a statutory surplus reserve fund each year until the reserve balance reaches 50% of such PRC subsidiary’s registered capital. Allocations to these statutory reserves may only be used for specific purposes and are not distributable to us in the form of loans, advances or cash dividends. In addition, under the related investment agreement, ISST is restricted in paying dividends and it is contemplated that all profits from ISST will be retained within ISST for at least three years. As a result of these regulatory and contractual restrictions, our PRC subsidiaries and consolidated affiliated entity are restricted in their ability to transfer a portion of their net assets to our Cayman Islands holding company (either in the form of dividends, loans or advances), which restricted portion as calculated under US GAAP amounted to approximately RMB830.3 million (US$131.9 million) and RMB836.5 million (US$134.3 million), respectively, as of December 31, 2011 and 2012.
We are a holding company incorporated under the laws of the Cayman Islands. We derive a substantial majority of our income from our PRC subsidiaries’ business operation in China. Prior to January 1, 2008, dividends derived by foreign enterprises from business operations in China were not subject to the PRC enterprise income tax. However, such tax exemption ceased after January 1, 2008 with the effectiveness of the Enterprise Income Tax Law and a withholding tax rate of 10% will apply on such dividends, unless any such foreign investor’s jurisdiction of incorporation has a tax treaty with China that provides for a preferential withholding arrangement. The economic benefits of our single, small PRC consolidated affiliated entity Beijing iSoftStone are mainly transferred to iSoftStone WFOE through payment of outsourcing fees, service fees and licensing fees under the Exclusive Outsourcing Agreement, the Exclusive Technology Consulting and Management Service Agreement and the Trademark and Software Licensing Agreement entered into between Beijing iSoftStone and iSoftStone WFOE. Such outsourcing fees, service fees and licensing fees are subject to PRC business tax (prior to September 1, 2012) or VAT (after September 1, 2012) and related surcharges. Upon receipt of such fees, they will become a portion of iSoftStone WFOE’s revenues and can be remitted to the Cayman Islands holding company in the form of dividend distribution.
The following table sets forth a summary of our net cash flows for the years ended December 31, 2010, 2011 and 2012:
| | | | | | | | | | | | |
| | | Year Ended December 31, | |
| | | 2010 | | | 2011 | | | 2012 | |
| | | (dollars in thousands) | |
Net cash provided by (used in) operating activities | | $ | 1,499 | | | $ | (463 | ) | | $ | 9,937 | |
Net cash (used in) investing activities | | | (17,010 | ) | | | (59,833 | ) | | | (29,004 | ) |
Net cash provided by (used in) financing activities | | | 139,838 | | | | (21,763 | ) | | | 34,920 | |
Effect of exchange rate changes | | | 1,615 | | | | 2,175 | | | | (452 | ) |
Net increase (decrease) in cash | | | 125,942 | | | | (79,884 | ) | | | 15,401 | |
Cash, beginning of year | | | 55,138 | | | | 181,080 | | | | 101,196 | |
Cash, end of year | | $ | 181,080 | | | $ | 101,196 | | | $ | 116,597 | |
78
Operating Activities
Net cash provided by operating activities in 2012 was $9.9 million, as compared to net income of $22.1 million. The principal working capital items accounting for the difference between our net cash provided by operating activities and our net income were increases in the balances of accounts receivable, which were partially offset by the increase of income tax payable and accrued expenses and other current liabilities. Our accounts receivable increased by $47.1 million, which was in line with the increase of our net revenues. Our income tax payable increased by $4.2 million, which was mainly due to increase of income tax expenses in 2012. Our accrued expenses and other current liabilities increased by $3.4 million, which was mainly due to the increase of employee payroll and welfare payable. The other principal non-cash items accounting for the difference between our net cash provided by operating activities and our net income were depreciation and intangible assets amortization expenses totaling $12.6 million, and share-based compensation of $11.1 million.
Net cash used in operating activities in 2011 was $0.5 million, as compared to net income of $19.0 million. The principal working capital items accounting for the difference between our net cash provided by operating activities and our net income were increases in the balances of accounts receivable, prepaid expenses, land use right and other current assets, which were partially offset by the increase of accounts payable, accrued expenses and other current liabilities. Our accounts receivable increased by $46.4 million, which was in line with the increase of our net revenues. Our prepaid expenses and other current assets increased by $7.7 million, which was mainly due to increase of prepaid project costs, rental deposits and project deposits. We paid $3.3 million to acquire the land use right in Wuxi. Our accounts payable increased by $1.6 million, which was in line with the increase of our subcontracting costs. Our accrued expenses and other current liabilities increased by $7.4 million, which was mainly due to the increase of employee payroll and welfare payable and income tax payable. The other principal non-cash items accounting for the difference between our net cash provided by operating activities and our net income were depreciation and intangible assets amortization expenses totaling $10.4 million, and share-based compensation of $9.3 million.
Net cash provided by operating activities in 2010 was $1.5 million, as compared to net loss of $3.6 million. The principal working capital items accounting for the difference between our net cash provided by operating activities and our net loss were increases in the balances of accounts receivable and prepaid expenses and other current assets, which were partially offset by the increase of accounts payable, accrued expenses and other current liabilities. Our accounts receivable increased by $29.6 million, which was in line with the increase of our net revenues. Our prepaid expenses and other current assets increased by $3.2 million, which was mainly due to increase of prepaid project costs, rental deposits and project deposits. Our accounts payable increased by $4.9 million, which was in line with the increase of our subcontracting costs. Our accrued expenses and other current liabilities increased by $3.0 million, which was mainly due to the increase of employee payroll and welfare payable. The other principal non-cash items accounting for the difference between our net cash provided by operating activities and our net loss were depreciation and intangible assets amortization expenses totaling $6.6 million, and share-based compensation of $8.5 million.
Investing Activities
Net cash used in investing activities in 2012 was $29.0 million, consisting primarily of $20.6 million in purchase of property and equipment and payment of $7.2 million as restricted cash to issue bank accepted draft. Among the $20.6 million in purchase of property and equipment, $6.3 million was related to the leasehold improvement of a new office building in Beijing and the rest was primarily related to the purchases of computers and software, furniture and office equipment and leasehold improvements of other offices.
Net cash used in investing activities in 2011 was $59.8 million, consisting primarily of $44.3 million in purchase of property and equipment, $12.0 million in payment of costs of long term investments and $5.0 million as part of the consideration paid for the acquisition of Shanghai Kangshi, iHealthStone and Adventier. Among the $44.3 million in purchase of property and equipment, $33.5 million was related to the purchase of our new facility in Wuxi and the rest was primarily related to purchases of computers and software, furniture and office equipment and leasehold improvements.
Net cash used in investing activities in 2010 was $17.0 million, consisting primarily of $11.7 million in property and equipment purchases primarily related to purchases of computers and software, furniture and office equipment and leasehold improvements, and $3.8 million as part of the consideration paid for the acquisition of Shenzhen Star, MDCL, Ascend and Shanghai Kangshi.
Financing Activities
Net cash used in financing activities in 2012 was $34.9 million, which primarily reflected $15.2 million of repayment of short-term borrowings and $5.7 million of deferred and contingent consideration paid for business acquisitions, offset by $53.5 million of proceeds from short-term borrowings and $1.9 million of proceeds from exercise of options.
Net cash used in financing activities in 2011 was $21.8 million, which primarily reflected $37.6 million of repayment of short-term borrowings, offset by $14.9 million of proceeds from short-term borrowings and $4.0 million of proceeds from exercise of options.
Net cash provided by financing activities in 2010 was $139.8 million, which primarily reflected $125.1 million in proceeds from our initial public offering, $40.8 million of proceeds from short-term borrowings and $8.6 million of proceeds from issuance of convertible notes, offset by $32.5 million of repayment of short-term borrowings.
79
Capital Expenditures
We incur capital expenditures primarily in connection with purchases of property and equipment, including real property, computers and software, furniture and office equipment, motor vehicles and leasehold improvements. Our capital expenditures in such property and equipment were $11.7 million, $44.3 million and $20.6 million in 2010, 2011 and 2012, respectively. We expect our capital expenditures to increase in the future as we expand our business to implement our growth strategy. Of the capital expenditures of $44.3 million in 2011, $32.7 million was related to the acquisition of our new office in Wuxi in July 2011. Of the capital expenditures of $20.6 million in 2012, $6.3 million was related to the leasehold improvement of our new office in Beijing in 2012.
C. Research and Development
For a discussion of our activities related to research and development, see “Item 5.A. Operating and Financial Review and Prospects—Operating Results,” which we hereby incorporate by reference.
D. Trend Information
Other than as disclosed elsewhere in this annual report on Form 20-F, we are not aware of any trends, uncertainties, demands, commitments or events for the period from January 1, 2010 to December 31, 2012 that are reasonably likely to have a material adverse effect on our revenues, income, profitability, liquidity or capital resources, or that caused the disclosed financial information not necessarily to be indicative of future operating results or financial conditions.
E. Off-Balance Sheet Arrangements
We do not engage in trading activities involving non-exchange traded contracts or interest rate swap transactions or foreign currency forward contracts. In the ordinary course of our business, we do not enter into transactions involving, or otherwise form relationships with, unconsolidated entities or financial partnerships that are established for the purpose of facilitating off-balance sheet arrangements or other contractually narrow or limited purposes.
F. Tabular Disclosure of Contractual Obligations
The following table sets forth our contractual obligations, including the interest portion, as of December 31, 2012:
| | | | | | | | | | | | | | | | | | | | |
| | | Payment Due by Period | |
| | | Total | | | Within 1 Year | | | 1-3 Years | | | 3-5 Years | | | More than 5 Years | |
| | | (dollars in thousands) | |
Operating lease obligations(i) | | $ | 111,762 | | | | 14,359 | | | | 22,687 | | | | 18,547 | | | | 56,169 | |
Deferred consideration in connection with business acquisitions(ii) | | | 3,942 | | | | 2,480 | | | | 1,462 | | | | — | | | | — | |
Contingent consideration payable in connection with business acquisitions(iii) | | | 2,280 | | | | 1,032 | | | | 1,248 | | | | — | | | | — | |
Short term borrowings | | | 54,012 | | | | 54,012 | | | | — | | | | — | | | | — | |
| | | | | | | | | | | | | | | | | | | | |
Total | | $ | 171,996 | | | $ | 71,883 | | | $ | 25,397 | | | $ | 18,547 | | | $ | 56,169 | |
| | | | | | | | | | | | | | | | | | | | |
| (i) | In August 2012, we signed an agreement to lease a new office premises with an area of approximately 43,200 square meters in Beijing from Beijing Ruantong Xutian Technology Development Co., Ltd. The lease has a term of ten years starting from January 1, 2013. The total rental expense for ten years is approximately $94.6 million and we expect to pay $4.0 million, $16.8 million, $17.6 million and $56.2 million within 1 year, in 1 to 3 years, in 3 to 5 years and in 5 to 10 years, respectively. |
| a. | In connection with acquisition of Adventier in 2011, we agreed to pay contingent consideration up to $8.0 million in cash, based on the actual performance of the acquired business for the year ended December 31, 2011, which is determined to be $8.0 million. Out of the total contingent consideration, $3.6 million, $2.5 million and $1.1 million were paid in 2011 and 2012 and April 2013, respectively, and the rest will be paid in the first quarter of 2014. |
| b. | In connection with acquisition of Shanghai Kangshi in 2010, we agreed to pay cash consideration of $6.4 million and 970,215 ordinary shares of the Company valued at $1.235 per share. A portion of these shares will be subject to repurchase at a nominal price if the performance of the acquired business for each of the year 2010, 2011 and 2012 fails to achieve that year’s performance target. The repurchase right for the ordinary shares issued was accounted for as a contingent receivable, which was valued at $0.2 million. Out of the total cash consideration of $6.4 million, $1.9 million, $2.6 million, $1.4 million and $0.6 million were paid in 2010, 2011, 2012 and January 2013, respectively. |
80
| c. | In connection with acquisition of Abovenet in 2012, we agreed to pay contingent consideration up to $3.0 million in cash, based on the actual performance of the acquired business for the year ended December 31, 2012, which is determined to be $2.3 million. Out of the total contingent consideration, $0.9 million and $0.6 million was paid in 2012 and March 2013, and the rest will be paid from 2014 to 2015. |
| | In connection with acquisition of Jiangchen in 2012, we agreed to pay contingent consideration up to $4.0 million in cash, primarily based on the performance of the acquired business for the year ended December 31, 2012, which is currently estimated to be $3.4 million. Out of the total contingent consideration, $1.4 million was paid in June 2012, and the rest will be paid from 2013 to 2015. |
G. Safe Harbor
This annual report contains forward-looking statements within the meaning of Section 27A of the Securities Act and Section 21E of the Exchange Act and as defined in the Private Securities Litigation Reform Act of 1995. See “Introduction—Forward-Looking Statements.”
ITEM 6. DIRECTORS, SENIOR MANAGEMENT AND EMPLOYEES
A. Directors and Senior Management
The following table sets forth information regarding our directors and executive officers as of the date of this annual report. The business address of each of our directors and executive officers is Building 9 Zhongguancun Software Park, No.8 West Dongbeiwang Road, Haidian District, Beijing 100193, People’s Republic of China.
| | | | | | |
Name | | Age | | | Position/Title |
Tianwen Liu(1) (2) (4) | | | 50 | | | Chairman of the Board and Chief Executive Officer |
Yong Feng(4) | | | 43 | | | Director and Chief Operating Officer |
Chung-Kao Hsieh(1) | | | 48 | | | Independent Director |
Benson Tam(3) | | | 50 | | | Independent Director |
Al-Noor Gulamali Abdulla Ramji(1) (2) (3) | | | 58 | | | Independent Director |
Tom Manning(2) (3) | | | 57 | | | Independent Director |
Xiaosong Zhang(4) | | | 49 | | | Chief Financial Officer |
Li Wang(4) | | | 47 | | | Executive Vice President and Chief Human Resource Officer |
Ying Huang(4) | | | 45 | | | President of Telecom, and Communication Business Group |
Junhe Che(4) | | | 42 | | | President of China Business Group |
Qiang Peng(4) | | | 56 | | | President of Global Business Group |
Xiaohui Zhu(4) | | | 46 | | | President of Strategic Account Business Group |
Yenwen Kang(4) | | | 61 | | | Executive Vice President |
| (1) | Member, Compensation Committee |
| (2) | Member, Nominating and Corporate Governance Committee |
| (3) | Member, Audit Committee |
| (4) | Member, Executive Management Committee. We established the Executive Management Committee in March 2013 to make significant company decisions as a team with members of the Executive Management Committee constituting our executive officers. |
Mr. Tianwen Liu (T.W. Liu) is our founder, our Chairman of the Board and Chief Executive Officer. Mr. Liu has over 20 years experience in the IT consulting and services industry. Prior to founding our business, Mr. Liu co-founded AsiaEC.com in 1999, which grew to China’s largest on-line office supply and service provider and was acquired by Office Depot in 2006. Prior to AsiaEC.com, Mr. Liu served as business unit general manager in Siemens from 1996 to 1999, and as senior project manager in Bechtel Corporation from 1993 to 1995 and as IT consultant in Digital Equipment Corporation from 1991 to 1993. Mr. Liu also currently serves as an independent director of ChinaEdu Corporation, a Nasdaq-listed company. Mr. Liu received his MBA degree from Massachusetts Institute of Technology, his master degree in electrical engineering from the University of Massachusetts and his bachelor degree in engineering from Huazhong University of Science and Technology.
81
Mr. Yong Feng (Frank Feng) is our Chief Operating Officer. Mr. Feng has been a director of our company since 2006. Mr. Feng has over 15 years of experience in the IT industry, with rich experience in supply chain management system. Prior to joining us, Mr. Feng founded United Innovation Ltd. Prior to that, Mr. Feng served at various sales and managerial positions in Mitsui & Co. (China) Ltd. and General Motors. Mr. Feng received his MBA degree from Duke University and his bachelor degree in science from Peking University.
Dr. Chung-Kao Hsieh (Peter Hsieh) has been a director of our company since 2005 and has been our independent director since November 2012. Dr. Hsieh was a partner of AsiaVest Partners from 2004 to 2012. During the period, he invested in and served as a board member of Lattice Power Corporation and Leyou.com. Prior to joining AsiaVest Partners in 2004, Dr. Hsieh served as a partner of Harbinger Venture. Dr. Hsieh started his venture capital career in 1997 in Silicon Valley with InveStar Capital, and later with H&Q Asia Pacific. Prior to his venture capital career, Dr. Hsieh spent several years with KLA Instruments as an engineer, engineering manager, then sales manager for Asia. Dr. Hsieh received his master and PhD degree in engineering from Stanford University and his bachelor degree in mechanical engineering from National Taiwan University.
Mr. Benson Tam has been our independent director since March 2012. Mr. Tam is a chartered accountant, and prior to our December 2010 initial public offering served on our audit committee. From 2002 until February 2012, Mr. Tam was a partner and head of technology investments at Fidelity Growth Partners Asia (formerly named Fidelity Asia Ventures). Prior to joining Fidelity Growth Partners Asia, Mr. Tam was a partner of Electra Partners Asia from 1998 to 2002, and was the founding director of Hellman & Friedman Asia from 1992 to 1998. Mr. Tam worked in M&A Corporate Finance at S.G. Warburg from 1989 to 1992. Mr. Tan is currently a director of Beijing Crystal Digital Technology Co. Ltd, Datuu Holding Limited, China PnR Limited, Mineloader Software Co. Ltd, and Im20 Interactive Investment Holdings Limited. Mr. Tam received his master degree in computer science from Oxford University and his bachelor degree in civil engineering from Imperial College of London University.
Mr. Al-Noor Gulamali Abdulla Ramji has been our independent director since 2008. Mr. Ramji currently serves as executive vice president and general manager of banking in Misys plc. Prior to that, Mr. Ramji served as chief executive officer of BT Innovate and Design and chief information officer of BT Group plc. from 2004 to 2010, as executive vice president and chief information officer in Qwest Communications from 2001 to 2004, and as chief information officer of Dresdner Kleinwort Benson from 1996 to 2001. Mr. Ramji founded Webtek Software, one of the leading software houses in India in the 1990s. Mr. Ramji has also served as chief information officer at UBS (then called SBC) and as global head of operations at Credit Suisse First Boston prior to that. Mr. Ramji also currently serves as a non-executive director of Virtusa Corporation, a Nasdaq-listed company. Mr. Ramji received his bachelor degree in electronics from University of London. Mr. Ramji is a Chartered Financial Analyst.
Mr. Tom Manning has been our independent director since 2010. Mr. Manning is a Lecturer in Law at the University of Chicago Law School, where he teaches corporate governance. Mr. Manning served as chief executive officer of Cerberus Asia Operations & Advisory Limited, a subsidiary of Cerberus Capital Management, a global private equity firm, from 2010 to 2012. Previously, he served as chief executive officer of Indachin Limited, a venture management firm in Hong Kong from 2005 to 2009, as chairman of China Board Directors Limited, a board advisory firm based in Hong Kong from 2005 to 2010, and from 2003 to 2005, as director of Bain & Company. From 2000 to 2003, he was the chief executive officer of Capgemini EY Asia. Prior to Capgemini’s merger with Ernst & Young Consulting, from 1996 to 2000, he was the chief executive officer of Ernst & Young Consulting Asia Pacific. Mr. Manning currently serves as a board director of AsiaInfo-Linkage, Inc., a Nasdaq-listed company and as a board director of Clear Media Limited, a Hong Kong Stock Exchange listed company. Mr. Manning served as a board director of Gome Electrical Appliances, Inc., a company listed on the Hong Kong Stock Exchange, from 2007 to 2012, and Bank of Communications, a company listed on the Hong Kong Stock Exchange and Shanghai Stock Exchange, from 2004 to 2010. Mr. Manning received his MBA degree from Stanford University and his bachelor degree in East Asian studies from Harvard University.
Mr. Xiaosong Zhang (Jonathan Zhang) has served as our Chief Financial Officer since July 2010 and was our independent director between February 2010 and July 2010 before becoming our Chief Financial Officer. Prior to joining us, Mr. Zhang served as chief financial officer of BJB Career Education Company Limited from 2009 to June 2010, as chief financial officer of Emarket Holding Group, Ltd. from 2008 to 2009, as chief financial officer of Chinacars, Inc. from 2007 to 2008 and as chief financial officer of Vimicro International Corporation, a Nasdaq-listed company, from 2004 to 2007. From 2000 to 2004, Mr. Zhang was a manager and then a senior manager at the Beijing office of PricewaterhouseCoopers. From 1995 to 1999, Mr. Zhang was an auditor and then a senior auditor at the Los Angeles office of KPMG LLP. Mr. Zhang received his master degree in accountancy from University of Illinois, his master degree in professional meteorology from Saint Louis University, and his bachelor degree in meteorology from Peking University. Mr. Zhang is a Certified Public Accountant in the State of California.
Ms. Li Wang(Lucy Wang) has served as our Executive Vice President and Chief Human Resource Officer since 2013. Ms. Wang has over 20 years of experience in the business consulting and IT services industry with rich experience in human resource management. Prior to joining us, Ms. Wang served as the head of R&D department in AsiaEC before 2001. Ms. Wang received her EMBA from China Europe International Business School and Master of software engineering from University of Science and Technology of China.
Mr. Ying Huang has served as our President of Telecom and Communication Business Group since 2013 and our Executive Vice President since 2005. Prior to joining us, Mr. Huang co-founded United Innovation Ltd. in 2002. Prior to that, Mr. Huang served as senior vice president in Capital Networks from 2000 to 2002 in China, as a senior technical staff member in AT&T Labs from 1997 to 2000 and as a research scientist in Air Force Institute of Technology from 1995 to 1996 in the U.S. Mr. Huang received his PhD degree in mathematics from Rutgers, The State University of New Jersey and his bachelor degree in applied mathematics from Tsinghua University.
82
Mr. Junhe Che (Carson Che) has served as our President of China Business Group since 2013 and our Executive Vice President since 2006. Prior to joining us in 2001, Mr. Che served as a consulting manager in Deloitte Touche Tohmatsu CPA Ltd. from 1995 to 1999 and as a project manager in Kehai Group from 1993 to 1995. Mr. Che received his MBA degree from Peking University and his bachelor degree in both precision instrument and management science from Tianjin University.
Mr. Qiang Peng (John Peng) has served as our President of Global Business Group since 2013 and our Executive Vice President since 2005. Prior to joining us, Mr. Peng served as vice president of China technology delivery in E5 Systems Inc. from 2002 to 2004, as engineering vice president in Forefield, Inc. from 2000 to 2002, as director of software development in NetPaper.com, Inc. in 2000, as technical lead in Softrax Corporation from 1997 to 2000, as a senior system analyst in John Hancock Funds from 1996 to 1997, and as a business analyst in Mellon Financial Corporation from 1994 to 1996. Mr. Peng received his MBA degree from the University of Rhode Island, his master degree in public policies from the Institute of Science and Technology and his bachelor degree in mechanical engineering from Beijing University of Technology.
Mr. Xiaohui Zhu has served as our President of Strategic Account Business Group since 2013 and our Executive Vice President since 2011. Prior to joining us, Mr. Zhu served as vice president of Nortel Networks (China) Limited from 2008 to 2009, as senior vice president of Alcatel-Lucent (China) Co., Ltd. in 2007, as vice president of Lucent Technologies (China) Co., Ltd. from 2005 to 2006, as vice president of Gemplus Greater China from 2003 to 2005, as vice president of Digital China (China) Limited from 2001 to 2003, as President & CEO of Beijing Runway Technology Co., Ltd. from 2000 to 2001, as general manager of business development department of China Hewlett-Packard Co., Ltd. from 1996 to 2000, and as COO and executive vice president of Changan Information Industry (Group) Co., Ltd. from 1988 to 1996. Mr. Zhu received his bachelor degree in computer science and engineering from University of Shanghai for Science and Technology.
Mr. Yenwen Kang (Steve Kang) has served as our Executive Vice President since 2012. Mr. Kang has over 30 years of experience in the IT industry. Prior to joining us in 2008, Mr. Kang served as Business Executive Leader for Linux related middleware software for IBM Software Group in Asia Pacific from 2006 to 2008, as WebSphere Software Channel Business Executive Leader for IBM Software Group in Asia Pacific from 2003 to 2005, as Business Executive Leader for IBM Software Business, General Business and Channel, in Greater China from 1998 to 2002, and as IBM Software Business Executive Leader for China in 1997. Mr. Kang also held different business leader positions in sales management, product management, mass marketing, channel management and business development for IBM Taiwan since 1982. Mr. Kang received his MBA degree from National Chiao-Tung University in Taiwan and his bachelor degree in mathematics from National Taiwan Normal University.
There is no family relationship between any of our directors or executive officers.
B. Compensation
Compensation of Directors and Executive Officers
For the fiscal year ended December 31, 2012, we and our subsidiaries paid aggregate cash compensation of approximately RMB8.7 million ($1.4 million) to our directors and executive officers as a group. We do not pay or set aside any amounts for pensions, retirement or other benefits for our officers and directors.
As of December 31, 2012, our directors and executive officers as a group held, in the aggregate, options to acquire 41,074,035 of our ordinary shares. These options have a weighted-average exercise price of $0.49. Of these options, 4,934,000 expire on March 31, 2017; 3,520,000 expire on March 31, 2018; 330,000 expire on December 19, 2018; 12,150,000 expire on December 22, 2019; 6,050,000 expire on July 31, 2020; 4,932,835 expire on September 14, 2020; 400,000 expire on November 17, 2020; 5,417,200 expire on June 26, 2021; and 3,340,000 expire on December 12, 2022.
As of December 31, 2012, our directors and executive officers as a group held outstanding awards with respect to an aggregate of 999,300 share units. Of these share units, 243,900 vested on March 1, 2013; 206,410 vest on June 1, 2013; 206,490 vest on September 1, 2013; 40,000 vest on September 30, 2013; 37,500 vest on November 12, 2013; 37,500 vest on March 1, 2014; 40,000 vest on September 30, 2014; 37,500 vest on November 12, 2014; 37,500 vest on March 1, 2015; 37,500 vest on November 12, 2015; 37,500 vest on March 1, 2016; and 37,500 vest on November 12, 2016.
Equity Incentive Plans
Our incentive plans are intended to promote our success and to enhance our ability to motivate, attract and retain the services of selected directors, officers, employees and other eligible persons. Our board of directors or a duly established committee of our board of directors is the administrator of our incentive plans and has broad authority to interpret the plan provisions and make all required determinations under the plan, including authority to make required proportionate adjustments to outstanding awards upon the occurrence of certain corporate events such as reorganizations, mergers and stock splits. Awards under our incentive plans are generally non-transferable. However, the plan administrator may establish procedures for the transfer of awards to other persons or entities, provided that such transfers comply with applicable securities laws and, with limited exceptions, are not made for value.
83
Pre-IPO Plans. As of March 31, 2013, a total of 23,762,520 ordinary shares are subject to outstanding options granted under our 2008 Share Incentive Plan, or the 2008 Plan, adopted in March 2008 and subsequently amended in September 2010, and a total of 40,291,582 ordinary shares are subject to outstanding options granted under our 2009 Share Incentive Plan, or the 2009 Plan, adopted in December 2009 and subsequently amended in April and September 2010.
Options granted under our incentive plans generally do not vest unless the grantee remains under our employment or in service with us on the given vesting date. Such options generally vest over a period of four years, with 25% vesting on a yearly basis, starting from the first anniversary of the vesting commencement date as indicated in the relevant option award agreement. Our plan administrator may accelerate the vesting to permit immediate exercise of options granted to a grantee. The number of options that may vest in any given year for certain grantees under our 2009 Plan is also subject to certain performance requirements established and evaluated by our human resources department.
The options granted under our incentive plans that were outstanding on the date of our initial public offering will expire on the earliest of (i) the tenth anniversary of the grant date, (ii) the date that is 12 months after the termination date if the grantee’s service terminates for death, disability, or retirement, or (iii) the 30th day after the termination date if the grantee’s service terminates for any reason, other than death, disability, retirement or cause. If a grantee’s service terminates for cause, all the options granted to the grantee under our incentive plans will immediately be forfeited and expire.
2010 Performance Incentive Plan. In November 2010, we adopted our 2010 Performance Incentive Plan, or the 2010 Plan. We stopped granting options or any other awards under the 2008 Plan and 2009 Plan upon the adoption of the 2010 Plan. The maximum number of ordinary shares that may be issued pursuant to all awards under the 2010 Plan is 7,500,000, plus the number of any shares subject to share options granted under the 2008 Plan or 2009 Plan and outstanding on the date of the adoption of the 2010 Plan, which expire, or for any reason are cancelled or terminated, after the date of the adoption of the 2010 Plan without being exercised, plus an annual increase on January 1 of each calendar year beginning in 2011 equal to the lesser of (i) two and one-half percent (2.5%) of the total number of our ordinary shares issued and outstanding on December 31 of the immediately preceding calendar year, (ii) 20,000,000 ordinary shares or (iii) such number of ordinary shares as may be established by our board of directors. As of March 31, 2013, the maximum number of ordinary shares that may be issued pursuant to all awards under the 2010 Plan is 14,527,878 and options to purchase 16,949,152 ordinary shares and awards with respect to 287,665 restricted shares and 10,513,844 share units are outstanding under the 2010 Plan.
Awards under the 2010 Plan may be in the form of incentive or nonqualified stock options, share appreciation rights, share bonuses, restricted shares, share units, performance shares, phantom shares, dividend equivalents and other forms of awards including cash awards. Nonqualified and incentive stock options may not be granted at prices below the fair market value of our ordinary shares on the date of grant. Incentive stock options must have an exercise price that is at least equal to the fair market value of our common stock, or 110% of fair market value of our ordinary shares or incentive stock option grants to any 10% owner of our ordinary shares, on the date of grant. These and other awards may also be issued solely or in part for services. Awards are generally paid in cash or our ordinary shares. The plan administrator may also provide for the repricing of share options or share appreciation rights granted under the 2010 Plan (by amendment, cancellation and regrant, exchange or other means) without shareholder approval.
Generally, and subject to limited exceptions set forth in the 2010 Plan, if we dissolve or undergo certain corporate transactions such as a merger, business combination, consolidation, or other reorganization; exchange of our ordinary share; a sale of substantially all of our assets; or any other event in which we are not the surviving entity, all awards then-outstanding under the 2010 Plan will become fully vested or paid, as applicable, and will terminate or be terminated in such circumstances, unless the plan administrator provides for the assumption, substitution or other continuation of the award. The plan administrator also has the discretion to establish other change in control provisions with respect to awards granted under the 2010 Plan. For example, the administrator could provide for the acceleration of vesting or payment of an award in connection with a corporate event that is not described above and provide that any such acceleration shall be automatic upon the occurrence of any such event.
Our board of directors may amend or terminate the 2010 Plan at any time, but no such action will affect any outstanding award in any manner materially adverse to a participant without the consent of the participant. Plan amendments will be submitted to shareholders for their approval as required by applicable law or any applicable listing agency. The 2010 Plan is not exclusive, and our board of directors and compensation committee may grant share and performance incentives or other compensation, in shares or cash, under other plans or authority. The plan will terminate on April 13, 2020. However, the plan administrator will retain its authority until all outstanding awards are exercised or terminated. The maximum term of options, share appreciation rights and other rights to acquire our ordinary shares under the plan is ten years after the initial date of the award.
84
Employment Agreements
We have entered into employment agreements with each of our executive officers. The terms of these agreements are substantially similar to each other, with terms of two years which are automatically renewable and providing that the agreements are terminable for cause at any time. A senior executive officer may terminate his or her employment at any time by 30-day prior written notice. Each senior executive officer is entitled to certain benefits upon termination, including a severance payment equal to a certain specified number of months of his or her salary if we terminate his or her employment without cause. Each executive officer has agreed to hold in strict confidence and not to use, except for the benefit of our company, any proprietary information, technical data, trade secrets and know-how of our company or the confidential or proprietary information of any third party, including our subsidiaries and our clients, received by our company. Each of these executive officers has also agreed not to engage in any other employment, occupation, consulting or other business activity directly related to the business in which we are involved.
C. Board Practices
Duties of Directors
Under Cayman Islands law, our directors have a duty to act honestly, in good faith and with a view to our best interests. Our directors also have a duty to exercise the care, diligence and skills that a reasonably prudent person would exercise in comparable circumstances. In fulfilling their duty of care to us, our directors must ensure compliance with our memorandum and articles of association, as amended and restated from time to time. Under some circumstances, a shareholder has the right to seek damages if a duty owed by our directors is breached.
Our board of directors has all the powers necessary for managing, and for directing and supervising, our business affairs. The functions and powers of our board of directors include, among others:
| | • | | convening shareholders’ annual general meetings and reporting its work to shareholders at such meetings; |
| | • | | declaring dividends and distributions; |
| | • | | appointing officers and determining the term of office of the officers; |
| | • | | exercising the borrowing powers of our company and mortgaging the property of our company; |
| | • | | determining our business plans and investment proposals; |
| | • | | formulating our major acquisition and disposition plans, and plans for merger, division or dissolution; and |
| | • | | exercising any other powers conferred by the shareholders’ meetings or under our articles of association. |
Terms of Directors and Executive Officers
Our directors are not subject to a term of office (unless a term is set by our board and approved by our shareholders) and hold office until such time as they resign or are removed from office by special resolution of at least two-thirds of the shareholders or by a vote of at least two-thirds of our board of directors. A director will be removed from office automatically if, among other things, the director becomes bankrupt or makes any arrangement or composition with his creditors, or dies or is found by our company to be or to have become of unsound mind. The board (or a committee thereof) has the power to adopt policies governing the term of office of our directors subject to approval by our shareholders.
All of our executive officers are appointed by and serve at the discretion of our board of directors.
Committees of the Board of Directors
To enhance our corporate governance, we have restructured our board of directors and the three committees under the board of directors prior to the closing of our initial public offering: the audit committee, the nominating and corporate governance committee and the compensation committee. We have adopted a charter for each of these committees. The committees have the following functions and members.
Audit Committee
Our audit committee consists of Al-Noor Gulamali Abdulla Ramji, Tom Manning and Benson Tam. Mr. Manning is the chairman of our audit committee. Mr. Tam meets the criteria of an audit committee financial expert as set forth under the applicable rules of the SEC. Our board of directors has determined that each of Mr. Ramji, Mr. Manning and Mr. Tam satisfies the “independence” requirements within the meaning of Section 303A of the Corporate Governance Rules of the NYSE and satisfies the “independence” requirements under Rule 10A-3 under the Exchange Act. The audit committee oversees our accounting and financial reporting processes and the audits of the financial statements of our company.
The audit committee is responsible for, among other things:
| | • | | appointing the independent auditor; |
| | • | | pre-approving all auditing and non-auditing services permitted to be performed by the independent auditor; |
85
| | • | | setting clear hiring policies for employees and former employees of the independent auditor; |
| | • | | reviewing with the independent auditor any audit problems or difficulties and management’s responses; |
| | • | | reviewing and approving all related party transactions, as defined under applicable U.S. securities laws and regulations; |
| | • | | reviewing and discussing the annual audited financial statements with management and the independent auditor; |
| | • | | reviewing and discussing with management and the independent auditor the quarterly financial statements and significant changes to accounting principles and other major items; |
| | • | | reviewing reports prepared by management or by the independent auditor relating to significant financial reporting issues and judgments; |
| | • | | discussing earnings press releases with management, as well as financial information and earnings guidance provided to analysts and rating agencies; |
| | • | | reviewing with management and the independent auditor the effect of regulatory and accounting initiatives, as well as off-balance sheet structures, on our financial statements; |
| | • | | discussing policies with respect to risk assessment and risk management with management, internal auditors and the independent auditor; |
| | • | | timely reviewing reports from the independent auditor regarding all critical accounting policies and practices to be used by our company, all alternative treatments of financial information within U.S. GAAP that have been discussed with management and all other material written communications between the independent auditor and management; |
| | • | | establishing procedures for the receipt, retention and treatment of complaints received by our company regarding accounting, internal accounting controls or auditing matters, and the confidential, anonymous submission by our employees of concerns regarding questionable accounting or auditing matters; |
| | • | | annually reviewing and reassessing the adequacy of our audit committee charter; |
| | • | | meeting separately, periodically, with management, internal auditors and the independent auditor; |
| | • | | reporting regularly to the full board of directors; and |
| | • | | handling such other matters that are specifically delegated to our audit committee by our board of directors from time to time. |
Compensation Committee
Our compensation committee consists of Al-Noor Gulamali Abdulla Ramji, Tianwen Liu and Chung-Kao Hsieh. Mr. Ramji is the chairman of our compensation committee. Our board of directors has determined that each of Mr. Ramji and Mr. Hsieh satisfies the “independence” standards of Section 303A of the Corporate Governance Rules of the NYSE.
Our compensation committee is responsible for:
| | • | | establishing our general compensation philosophy; |
| | • | | reviewing and approving corporate goals and objectives relevant to the compensation of our chief executive officer, evaluating our chief executive officer’s performance in light of those goals and objectives and determining our chief executive officer’s compensation level based on this evaluation; |
| | • | | determining the compensation level of our other executive officers; |
| | • | | making recommendations to the board of directors with respect to our incentive-compensation plan and equity-based compensation plans; |
| | • | | administering our equity-based compensation plans in accordance with the terms thereof; |
| | • | | reviewing and making recommendations to the board of directors with respect to the compensation of our directors; and |
| | • | | handling such other matters that are specifically delegated to the compensation committee by our board of directors from time to time. |
86
Nominating and Corporate Governance Committee
Our nominating and corporate governance committee consists of Al-Noor Gulamali Abdulla Ramji, Tianwen Liu and Tom Manning. Mr. Ramji is the chairman of our nominating and corporate governance committee. Our board of directors has determined that each of Mr. Ramji and Mr. Manning satisfies the “independence” standards of Section 303A of the Corporate Governance Rules of the NYSE.
Our nominating and corporate governance committee is responsible for, among other things:
| | • | | recommending to the board of directors and periodically reviewing criteria for the selection of new directors; |
| | • | | identifying and recommending to the board of directors qualified individuals to become new directors as needed; |
| | • | | identifying and recommending to the board of directors qualified board members to fill vacancies on any committee of the board of directors; |
| | • | | overseeing the system of our corporate governance; and |
| | • | | handling such other matters that are specifically delegated to the nominating and corporate governance committee by our board of directors from time to time. |
Corporate Governance
Our board of directors has adopted a code of ethics, which is applicable to our senior executive and financial officers. In addition, our board of directors has adopted a code of conduct, which is applicable to all of our directors, officers, employees and advisors. We have made our code of ethics and our code of conduct publicly available on our website. In addition, our board of directors has adopted a set of corporate governance guidelines. The guidelines reflect certain guiding principles with respect to our board’s structure, procedures and committees. The guidelines are not intended to change or interpret any law, or our memorandum and articles of association, as amended from time to time. The code of ethics, code of conduct and corporate governance guidelines all became effective upon the closing of our initial public offering.
Interested Transactions
Subject to any separate requirement for audit committee approval under applicable law or the applicable rules of the NYSE, and unless disqualified by the chairman of the relevant board meeting, a director may vote in respect of any contract or transaction in which he is interested, provided that the nature of the interest of any director in such contract or transaction shall be disclosed by him or her at or prior to its consideration and any vote on that matter. A general notice or disclosure to the directors or otherwise contained in the minutes of a meeting or a written resolution of the directors or any committee of directors that a director is a shareholder of any specified firm or company and is to be regarded as interested in any transaction with such firm or company will be sufficient disclosure, and, after such general notice, it will not be necessary to give special notice relating to any particular transaction.
Other than post-termination benefits that our management directors (Mr. Tianwen Liu and Mr. Yong Feng) are entitled to receive as our executive officers (as described under “—B. Compensation—Employment Agreements”), our directors are not entitled to any post-termination benefits.
D. Employees
Our ability to rapidly recruit, train, develop and retain employees is critical to the success of our business. We are committed to being a highly regarded employer within our industry in China and we have dedicated executives focused solely on human capital and leadership development. We believe our employees deliver services on par with widely accepted quality standards in the global IT outsourcing industry. We had 9,285, 12,510 and 14,512 employees as of December 31, 2010, 2011 and 2012, respectively.
Recruiting and Retention. We have built our talent pool by recruiting students from leading universities in China and hiring highly qualified project leaders and middle-level managers from the market. We are committed to maintaining stringent recruitment standards to continue to hire highly qualified candidates, minimize attrition and increase the chances for the development of long-term careers for our employees. We offer competitive remuneration and benefits, a challenging work environment, ongoing skill development initiatives, and attractive career advancement opportunities. We continually assess and refine our selection process based on performance tracking of past recruits. We also maintain a database of experienced potential lateral hires from which we have recruited a large number of middle to senior level staff over the years. Our attrition rates were 19.8%, 24.8% and 23.8% in 2010, 2011 and 2012, respectively.
Training and Development. We have training, continuing education and career development programs designed to ensure our technology and managerial personnel enhance their skill-sets in alignment with their respective roles. We have developed and promoted significant numbers of middle to senior level technical and management personnel from within our company. We continually review our competency model, which is based on the core values of our company culture, to determine the needs of capability development for technology and managerial personnel, while providing cross-functional assignments and exposure to internal strategic initiatives to prepare them for their next job role. As part of our systematic work force management practices, we conduct quarterly reviews and terminate employees that do not meet the quality levels required by our development programs and ultimately our clients.
87
We provide ongoing training for both new college graduates and experienced staff, including technical training and certification coursework, as well as language and management training. We have four dedicated internal training centers alongside our sales and delivery centers in Wuxi, Tianjin, Guangzhou and Dalian. These training centers are supported by a combination of government subsidies, tuition from the students and funds from us. The students gain hands-on experience in these programs, and the top students often obtain employment with us after graduation.
We are particularly focused on development of middle management and leadership. Our “Top 300” leadership development program is focused on systematically identifying and nurturing the development of middle and senior management. Using this program, we cultivate talent through formal leadership training, evaluation, development and promotion.
E. Share Ownership
The following table sets forth information with respect to the beneficial ownership of our ordinary shares, as of March 31, 2013, the latest practicable date, by:
| | • | | each of our directors and executive officers; |
| | • | | our directors and executive officers as a group; and |
| | • | | each person known to us to own more than 5.0% of our ordinary shares. |
| | | | | | | | |
| | | Ordinary Shares
Beneficially Owned | |
| | | Number(1) | | | % (2) | |
Directors and Executive Officers: | | | | | | | | |
Tianwen Liu(3) | | | 68,561,021 | | | | 11.7 | % |
Yong Feng(4) | | | 18,701,815 | | | | 3.3 | % |
Chung-Kao Hsieh | | | * | | | | * | |
Benson Tam | | | * | | | | * | |
Al-Noor Gulamali Abdulla Ramji | | | * | | | | * | |
Tom Manning | | | * | | | | * | |
Xiaosong Zhang | | | * | | | | * | |
Li Wang | | | * | | | | * | |
Ying Huang(5) | | | 8,799,062 | | | | 1.5 | % |
Junhe Che | | | * | | | | * | |
Qiang Peng | | | * | | | | * | |
Xiaohui Zhu | | | * | | | | * | |
Yenwen Kang | | | * | | | | * | |
All directors and executive officers as a group | | | 106,779,863 | | | | 17.8 | % |
Principal Shareholders: | | | | | | | | |
Tekventure Limited(6) | | | 53,250,000 | | | | 9.4 | % |
AsiaVest Opportunities Fund IV(7) | | | 76,142,376 | | | | 13.4 | % |
Fidelity Entities(8) | | | 82,136,850 | | | | 14.4 | % |
J. Stephen F. Mandel, Jr. and affiliated entities(9) | | | 52,537,390 | | | | 9.2 | % |
| * | Less than 1% of our outstanding ordinary shares. |
| (1) | The number of ordinary shares beneficially owned by each of the listed persons includes ordinary shares that such person has the right to acquire within 60 days after March 31, 2013. |
| (2) | Percentage of beneficial ownership for each of the persons listed above is determined by dividing (i) the number of ordinary shares beneficially owned by such person by (ii) the total number of ordinary shares outstanding, plus the number of ordinary shares such person has the right to acquire within 60 days after March 31, 2013. The total number of ordinary shares outstanding as of March 31, 2013 is 568,462,392. |
| (3) | Represents 53,250,000 ordinary shares held by Tekventure Limited, a British Virgin Islands company, 19,217.7 American Depositary Shares representing 192,177 ordinary shares held by Mr. Liu, 13,735,000 ordinary shares issuable upon exercise of options within 60 days of March 31, 2013 held by Colossal Win Limited, a British Virgin Islands company of which Mr. Liu is the sole director, and 1,383,844 ordinary shares issuable upon exercise of options within 60 days of March 31, 2013 held by Mr. Liu. Mr. Liu holds 84.5% of the outstanding shares of, and is the sole director of, Tekventure Limited and, as such, exercises voting power on behalf of this shareholder on all matters of our company requiring shareholder approval. Mr. Liu disclaims beneficial ownership of such 53,250,000 ordinary shares except to the extent of his pecuniary interest. The business address of Mr. Liu is International Software Plaza, Building 9 Zhongguancun Software Park, No.8 West Dongbeiwang Road, Haidian District, Beijing 100193, China. |
88
| (4) | Represents 16,076,678 ordinary shares held by United Innovation (China) Ltd., a British Virgin Islands company of which Mr. Feng is the sole shareholder and sole director, 2,361 American Depositary Shares representing 23,610 ordinary shares held by Mr. Feng, and 2,225,000 ordinary shares issuable upon exercise of options within 60 days of March 31, 2013 held by High Flier Limited, a British Virgin Islands company of which Mr. Feng is the sole director, and 376,527 ordinary shares issuable upon exercise of options within 60 days of March 31, 2013 held by Mr. Feng. The business address of Mr. Feng is International Software Plaza, Building 9 Zhongguancun Software Park, No.8 West Dongbeiwang Road, Haidian District, Beijing 100193, China. |
| (5) | Represents 1,027,883 ordinary shares held by Mr. Huang directly and 5,500,000 ordinary shares held by Rich Skill Holdings Limited, a company wholly owned by Mr. Huang’s wife, and 2,271,179 ordinary shares issuable upon exercise of options within 60 days of March 31, 2013 held by Mr. Huang. The business address of Mr. Huang is International Software Plaza, Building 9 Zhongguancun Software Park, No.8 West Dongbeiwang Road, Haidian District, Beijing 100193, China. |
| (6) | Represents 53,250,000 ordinary shares held by Tekventure Limited. Tekventure Limited is a company incorporated under the laws of the British Virgin Islands. The shareholders of Tekventure Limited are Tianwen Liu Yan Zhou, Junhe Che, Qiang Peng and Li Wang. Tianwen Liu holds 84.5% of the outstanding shares of, and is the sole director of, Tekventure Limited. The address of Tekventure Limited is P.O. Box 957, Offshore Incorporations Centre, Road Town, Tortola, British Virgin Islands. |
| (7) | The number of ordinary shares beneficially owned is as of December 31, 2012, as reported in a Schedule 13G/A filed by AsiaVest Opportunities Fund IV and AsiaVest Partners, TCW/YFY Ltd., on February 5, 2013. The business address of these filers reported on the Schedule 13G/A is 11/F, 318 Ruei Guang Road, Taipei 114, Taiwan. |
| (8) | The number of ordinary shares beneficially owned is as of December 31, 2011, as reported in a Schedule 13G/A filed by Edward C. Johnson 3d and affiliated entities, including FMR LLC and FIL Limited (collectively, the “Fidelity Entities”) on February 14, 2012. The address of FIL Limited reported on the Schedule 13G/A is Pembroke Hall, 42 Crow Lane, Hamilton, Bermuda. The address of FMR LLC reported on the Schedule 13G/A is 82 Devonshire Street, Boston, MA 02109. |
| (9) | The number of ordinary shares beneficially owned is as of December 31, 2012, as reported in a Schedule 13G/A filed by J. Stephen F. Mandel, Jr. and affiliated entities, including Lone Dragon Pine, L.P. and Lone Pine Capital LLC, on February 14, 2013. The business address of these filers reported on the Schedule 13G/A is Two Greenwich Plaza, Greenwich, Connecticut 06830. |
As of March 31, 2013, approximately 65.0% of our outstanding ordinary shares are held by 43 record holders in the United States.
Historical Changes in Shareholdings of our Major Shareholders
In 2011, Tekventure Limited transferred an aggregate of 29,989,750 ordinary shares to two BVI entities formed by two of its then shareholders. The purpose of such transfer is only to make these two then shareholders of Tekventure Limited direct holders of our ordinary shares. As of March 31, 2013, Mr. Tianwen Liu beneficially owned 88,243,561 ordinary shares (including 53,250,000 ordinary shares held by Tekventure Limited in which he held 84.5% interest) and he has not sold any of his shares since the completion of our initial public offering.
In 2011, our then shareholders Fidelity Asia Ventures Fund L.P., Fidelity Asia Principals Fund L.P. and Asia Ventures II L.P. distributed all the ordinary shares held by them to their respective general partners and limited partners including FIL Limited (with respect to 57,523,250 ordinary shares), Impresa Fund III Limited Partnership (with respect to 24,613,600 ordinary shares) and Benson Tam, one of our independent directors.
In 2011, AsiaVest Opportunities Fund IV sold 580,000 ordinary shares as represented by 58,000 ADSs to the open market. In 2012, AsiaVest Opportunities Fund VI sold 11,000,000 ordinary shares in a private sale, and 8,765,050 ordinary shares as represented by 876,505 ADSs in the open market.
ITEM 7. MAJOR SHAREHOLDERS AND RELATED PARTY TRANSACTIONS
A. Major Shareholders
Please refer to “Item 6.E. Directors, Senior Management and Employees—Share Ownership.”
B. Related Party Transactions
Contractual Arrangements with Beijing iSoftStone
In November 2005, we entered into a series of agreements with Beijing iSoftStone and its shareholders, which enable us to
| | • | | exercise effective control over Beijing iSoftStone; and |
| | • | | receive a substantial portion of the economic benefits from Beijing iSoftStone in consideration for the services provided by iSoftStone WFOE. |
89
Agreements that Transfer Economic Benefits to Us
Exclusive Outsourcing Agreement. Pursuant to the exclusive outsourcing agreement dated November 16, 2005 between iSoftStone WFOE and Beijing iSoftStone, Beijing iSoftStone agreed to exclusively subcontract its business contracts, to the extent that subcontracting is permitted by such business contracts, to iSoftStone WFOE and pay the revenue collected under such business contracts to iSoftStone WFOE. The exclusive outsourcing agreement is currently effective and will only terminate upon written agreement by the parties.
Exclusive Technology Consulting and Management Service Agreement. Pursuant to the exclusive technology consulting and management service agreement dated November 16, 2005 between iSoftStone WFOE and Beijing iSoftStone, iSoftStone WFOE agreed to provide exclusive technology consulting and management services to Beijing iSoftStone for service fees equal to the revenue realizable under the business contracts of Beijing iSoftStone that are not subcontracted to iSoftStone WFOE. The exclusive technology consulting and management service agreement is currently effective, has a term of three years from its signing date and is renewable an unlimited number of times for three years unless terminated upon written agreement by the parties.
Trademark and Software Licensing Agreement. Pursuant to the trademark and software licensing agreement dated November 16, 2005 between iSoftStone WFOE and Beijing iSoftStone, iSoftStone WFOE agreed to license its trademarks, software copyrights and domain names to Beijing iSoftStone on a non-exclusive basis. Beijing iSoftStone pays licensing fees in a lump sum equal to the revenue realizable under the business contracts of Beijing iSoftStone that are not subcontracted to iSoftStone WFOE and that are not otherwise paid to iSoftStone WFOE pursuant to the aforesaid exclusive technology consulting and management service agreement. The trademark and software licensing agreement is currently effective, has a term of three years from its signing date and is renewable an unlimited number of times for three years unless terminated upon written agreement by the parties.
Agreements that Provide Effective Control over Beijing iSoftStone
Equity Pledge Agreement. Pursuant to the equity pledge agreement dated November 16, 2005 between iSoftStone WFOE and the individuals collectively holding over 90% of the equity interests in Beijing iSoftStone, which was subsequently amended on October 8, 2010, each signing shareholder agreed to pledge his or her equity interest in Beijing iSoftStone to iSoftStone WFOE to secure the performance of Beijing iSoftStone’s obligations under the relevant principal agreements, including the exclusive outsourcing agreement and the exclusive technology consulting and management service agreement with iSoftStone WFOE. The equity pledge agreement expires when Beijing iSoftStone fully performs its substantive obligations under the relevant principal agreements described above. Under the equity pledge agreement, each signing shareholder of Beijing iSoftStone also agreed not to transfer, dispose of or otherwise create any encumbrance on his or her equity interest in Beijing iSoftStone without prior written consent of iSoftStone WFOE. If Beijing iSoftStone fails to perform its contractual obligations, iSoftStone WFOE, as pledgee, will be entitled to dispose of the pledged equity interests. In addition, these shareholders of Beijing iSoftStone agreed that iSoftStone WFOE may purchase part or all of the pledged equity interests in Beijing iSoftStone when and to the extent that applicable PRC law permits.
Irrevocable Proxy. In connection with the execution of the equity pledge agreement, the shareholders of Beijing iSoftStone executed an irrevocable proxy to appoint iSoftStone WFOE or iSoftStone WFOE’s designee as his or her attorney-in-fact to attend shareholder meetings of Beijing iSoftStone and to vote on his or her behalf. The proxy granted by the shareholders of Beijing iSoftStone remains valid until the earlier of (a) the dissolution of Beijing iSoftStone and (b) the related shareholder ceasing to be the shareholder of Beijing iSoftStone.
In the opinion of Han Kun Law Offices, our PRC legal counsel:
| | • | | the ownership structures of Beijing iSoftStone and our wholly owned PRC subsidiary iSoftStone WFOE are in compliance with PRC laws and regulations currently in effect; and |
| | • | | each of the contractual documents among iSoftStone WFOE, Beijing iSoftStone and its shareholders governed by PRC law is valid, binding and enforceable, and does not result in any violation of PRC laws or regulations currently in effect. |
We have been advised by our PRC legal counsel, however, that there are substantial uncertainties regarding the interpretation and application of current and future PRC laws and regulations. Accordingly, there can be no assurance that the PRC regulatory authorities will not in the future take a view that is contrary to the above opinion of our PRC legal counsel. We have been further advised by our PRC counsel that if the PRC government finds that the foregoing agreements that establish the structure for operating part of our PRC business do not comply with PRC laws, we could be subject to severe penalties. See “Item 3.D. Key Information—Risk Factors—Risk Related to Doing Business in China—Uncertainties with respect to the PRC legal system could have a material adverse effect on us.”
Convertible Notes Financing
On December 23, 2009, April 21, 2010 and April 22, 2010 we issued and sold notes convertible into our ordinary shares in the aggregate principal amount of $38 million in a series of private placements to CSOF Technology Investments Limited, SeaBright China Special Opportunities Fund II, L.P., FIL Limited, AsiaVest Opportunities Fund IV, Infotech Pacific Ventures L.P., Mitsui Ventures Global Fund, Jinyuan and Hua Ying. These convertible notes bore interest on the principal amount at a rate of 1% per annum until the initial maturity date of December 22, 2012, provided they were not previously redeemed or converted. In connection with our initial public offering, which closed in December 2010, $18.0 million of the $38.0 million principal amount of convertible notes, together with accrued interest thereon, were converted into our ordinary shares. In March 2011, the holders of the remaining $20.0 million principal amount of convertible notes converted all their convertible notes plus accrued interest thereon into 20,406,720 of our ordinary shares.
90
Investors’ Rights Agreement and Right of First Refusal and Co-Sale Agreement
In connection with our convertible notes private placements, we, the holders of our preference shares and convertible notes, and Tianwen Liu and Yong Feng and their personal holding companies Tekventure Limited and United Innovation (China) Limited entered into a Second Amended and Restated Investors’ Rights Agreement on December 23, 2009, which was subsequently amended on April 22, 2010 and November 26, 2010. Pursuant to this Investors’ Rights Agreement, we have granted certain registration rights to holders of our registrable securities. Registrable securities include (1) our ordinary shares issuable or issued upon conversion of our preference shares or convertible notes, (2) any other ordinary shares owned or acquired by any holders of our preference shares or convertible notes, excluding, among others, shares sold in a public offering, and (3) any of our ordinary shares issued as a dividend or other distribution with respect to, in exchange for, or in replacement of, the shares referenced in (1) and (2) above.
Under the terms of the Investors’ Rights Agreement, from the date that is six months after the closing of our initial public offering, (i) holders of 30% or more of our then outstanding registrable securities or (ii) holders of 45% or more of the registrable securities with respect to series A preference shares, series B preference shares or convertible notes, each separately as a class, may require us to effect a registration under the Securities Act for the sale of their registrable securities. We are obliged to effect up to two such demand registrations with respect to the series A preference shares, up to two with respect to the series B preference shares and one with respect to the convertible notes. We have the right to defer filing the registration statement for a period of no more than 90 days if our board of directors in good faith determines that filing of such registration will be materially detrimental to us and our shareholders, but we cannot utilize this right more than once in any twelve-month period, nor can we file any registration statement pertaining to the public offering of any securities of us during such 90 day period.
Holders of registrable securities also have “piggyback” registration rights, pursuant to which they may require us to register all or any part of the registrable securities then held by such holders when we file any registration statements for purposes of effecting a public offering of our securities.
Holders of registrable securities may also require us to effect a registration on Form S-3 or Form F-3 and any related qualification or compliance, as applicable, for a public offering of all or a part of their registrable securities so long as we are entitled to use Form S-3 or Form F-3 for such offering. However, we are not obliged to effect any such registration when (1) the aggregate price to the public of such offering is less than $1,000,000, or (2) we have already effected a registration other than the registration from which the registrable securities of such holders have been excluded within the six-month period preceding the date of such request. We have the right to defer such filing for a period of no more than 90 days if our board of directors in good faith determines that filing of such registration will be materially detrimental to us and our shareholders, but we cannot utilize this right more than once during any twelve-month period, nor can we file any registration statement pertaining to the public offering of any securities of us during such 90 days period.
We are generally required to pay all expenses relating to any demand, piggyback or F-3 or S-3 registration other than underwriters’ and brokers’ discounts and commissions relating to the registrable securities sold by the holders, if applicable.
We will have no obligations to effect any demand, piggyback or F-3 or S-3 registration with respect to any registrable securities more than five years following the consummation of our initial public offering.
The Investors’ Rights Agreement also provides for other rights enjoyed by the holders of our preference shares and convertible notes, all of which rights automatically terminated upon the closing of our initial public offering in December 2010.
Acquisition Related Shares Issuance
In recent years, we have issued our ordinary shares as partial consideration for certain of our acquisitions of businesses, assets and key employees and consultants.
On April 18, 2010 and June 30, 2010, we issued an aggregate of 4,500,000 ordinary shares to Fair Honest Technology Limited in connection with the hiring of certain key employees. We may need to issue up to additional 1,000,000 ordinary shares to such employees or their designees based on the performance of these key employees.
In November 2010, we acquired Shanghai Kangshi. In connection with the acquisition, we agreed to issue 970,215 ordinary shares, determined by dividing $1,198,215 by a per ordinary share price equal to 95% of the per share equivalent of our initial public offering price.
On December 23, 2010, we issued an aggregate of 823,846 ordinary shares to six former shareholders of Ascend, in connection with our acquisition of Ascend.
91
On March 14, 2011, we issued 324,849 ordinary shares to Fox Legend Limited for its introducing business to Beijing iSoftStone Data Technology Service Co., Ltd., a subsidiary of ours.
Transactions with Certain Related Parties
Among the holders of our shares, the Fidelity Entities are affiliates of Fidelity Technology (Dalian) Limited, CSOF Technology Investments Limited and SeaBright China Special Opportunities Fund II, L.P. are affiliates of China Everbright Bank, and Hua Ying Management Co., Limited is an affiliate of Huawei, all of which are our existing clients. Our transactions with Fidelity Technology (Dalian) Limited, China Everbright Bank and Huawei are arm’s-length transactions.
Since 2007, we have, from time to time, provided IT services to, and paid certain expenses on behalf of, Beijing iSoftStone Boxin Technology Co., Ltd., or Boxin, a Chinese company in which iSoftStone WFOE owns 20% equity interest until August 2011 when iSoftStone WFOE sold such equity interest. As of December 31, 2010, 2011 and 2012, the total amount of services fees and expenses payment due to us from Boxin were $1.4 million, nil and nil, respectively.
Since 2007, Boxin has from time to time paid certain operating expenses on our behalf until we sold the equity interest in Boxin in August 2011, with the total amount due from us to Boxin being $0.4 million, nil and nil as of December 31, 2010, 2011 and 2012, respectively.
In 2007, we extended a loan to iSoftStone Technologies Co., Ltd., a Japanese company in which iSoftStone Japan Limited owns a 32.25% equity interest. As of December 31, 2010, 2011 and 2012, the outstanding loan principal and interest due to us from iSoftStone Technologies Co., Ltd. were $86,000, $91,000 and $83,000, respectively. The loan we extended to iSoftStone Technologies Co., Ltd. is unsecured, bears interest at a rate of 2.5% per annum.
In 2010, we extended an unsecured loan with a principal amount of $0.5 million and interest rate of 4.86% per annum to Wuxi iCarnegie Enterprise Management Co., Ltd., or Wuxi iCarnegie, a company in which we own 20% equity interest. Since 2010, we have from time to time, paid certain fees and expenses on behalf of Wuxi iCarnegie, including a course license fee of $1.7 million. As of December 31, 2010, 2011 and 2012, the total amount of outstanding loan principal and interest and fees and expenses payment due to us from Wuxi iCarnegie were $1.1 million, $1.5 million and $2.5 million, respectively.
Since 2010, Wuxi iCarnegie has from time to time paid certain operating expenses on our behalf, with the total amount due from us to Wuxi iCarnegie being $0.6 million, $94,000 and $8,000 as of December 31, 2010, 2011 and 2012, respectively.
As of December 31, 2012, the total amount of payment due to us from Guangdong IoT iSoftStone Information Technology Co., Ltd., a Chinese company established in 2012 in which we own 49% equity interest, was $1.1 million, mainly representing project receivables.
In August 2010, our existing shareholders Tekventure Limited and United Innovation (China) Ltd. transferred an aggregate of $5 million of our ordinary shares to our wholly owned subsidiary, iSoftStone Hong Kong Limited. These shares were purchased for $2 million in cash and are being held on our behalf and treated by us as treasury shares for accounting purposes. In October 2010, 461,000 and 700,000 of these ordinary shares were transferred by iSoftStone Hong Kong Limited to a former employee at a per share price of $0.51 and $0.30, respectively, or $445,110 in the aggregate. These shares were transferred as partial consideration for our hiring and terminating that employee. Also in October 2010, 553,389 and 178,047 of these ordinary shares were transferred by iSoftStone Hong Kong Limited to designees of several key employees at par value as partial consideration for our hiring of those employees. On March 29, 2011, 674,109 of these ordinary shares were transferred by iSoftStone Hong Kong Limited to ESFB Asia Investment Limited as partial consideration for our acquisition of Beijing Kebao. On June 2, 2011, 500,000 of these ordinary shares were transferred by iSoftStone Hong Kong Limited to Morinaga Technology Limited as partial consideration for our acquisition of the IT services business of Dalian Zhendan Science and Technology Co., Ltd.
Employment Agreements
See “Item 6.B. Directors, Senior Management and Employees—Employment Agreements.”
Share Options
See “Item 6.B. Directors, Senior Management and Employees—Share Option Plan.”
C. Interests of Experts and Counsel
Not applicable.
ITEM 8. FINANCIAL INFORMATION
A. Consolidated statements and other financial information.
We have appended consolidated financial statements filed as part of this annual report. See “Item 18. Financial Statements.”
92
Legal Proceedings
In October 2012, iCarnegie Inc. submitted a demand for arbitration to American Arbitration Association against us claiming for approximately $5.9 million plus interest (at a contractual rate of 18% per annum) that was allegedly due and owing by us to iCarnegie Inc. pursuant to a license agreement dated June 10, 2009. The arbitration remains at its preliminary stage. We intend to vigorously defend our position in the arbitration.
In November 2012, a former officer filed a case with Beijing Labor Dispute Arbitration Committee against us claiming $4.0 million to compensate him for the loss of shares, stock options, salary and bonus. On February 6, 2013, a ruling was made by Beijing Labor Dispute Arbitration Committee. According to the ruling, all of the claims raised by the former officer were rejected by the arbitrator.
In December 2012, the same individual filed a lawsuit against us in the Grand Court of the Cayman Islands, alleging that we failed to issue shares to him upon his exercise of options and make his shares tradable after issuance. The complaint seeks monetary damages of approximately $2.9 million. The action remains at its preliminary stage. We intend to defend the action vigorously.
Following the initial dismissal by the Beijing Labor Dispute Arbitration Committee, in March 2013, the same officer filed a lawsuit against us in Beijing Haidian District People’s Court claiming $4.0 million in total to compensate his loss of shares, stock options, salary and bonus. The action remains at its preliminary stage. We intend to defend the action vigorously.
In July 2012, Kodak (China) Investment Company Limited Shenzhen Branch, or Kodak, filed a request for arbitration with Beijing Arbitration Committee against us claiming a service fee of $0.9 million. In September 2012, we submitted the statement of defense and counterclaim to Beijing Arbitration Committee, requesting Kodak to pay $0.9 million as compensation for damages and legal fee. The arbitration and litigation remains at its preliminary stage. We intend to vigorously defend the arbitration.
Other than as described above, we are not currently a party to any material legal or administrative proceedings and we are not aware of threatened material legal or administrative proceedings against us. We may from time to time become party to various legal or administrative proceedings arising in the ordinary course of our business.
Any adverse determination against us or unfavorable settlement of currently pending or future dispute could harm our reputation, subject us to significant liabilities, require significant cash payments by us or otherwise adversely impact our results of operations and financial condition. For risks and uncertainties relating to the pending cases against us, please see “Item 3. Key Information—D. Risk Factors—Risks Related to Our Business—We have an existing dispute with iCarnegie Inc. regarding certain licensing arrangements. If we do not win the related legal proceedings or settle such dispute on commercially acceptable terms, we may be exposed to monetary or other liabilities, which may harm our reputation, involve significant cash payments and adversely impact the market price of our ADSs.”
Dividend Policy
We have never declared or paid dividends, nor do we have any present plan to pay any cash dividends on our ordinary shares in the foreseeable future. We currently intend to retain most, if not all, of our available funds and any future earnings to operate and expand our business.
Payment of cash dividends, if any, will be at the discretion of our board of directors, and will depend upon our future results of operations and earnings, capital requirements and surplus, general financial conditions, shareholders’ interests, contractual restrictions and other factors our board of directors may deem relevant. We can pay dividends only out of profits or other distributable reserves. Cash dividends on our ordinary shares will be paid in U.S. dollars.
We are a holding company incorporated in the Cayman Islands. In order to pay dividends, if any, to our shareholders, we rely on dividends from our PRC subsidiaries (including ISST). Each of our PRC subsidiaries may pay dividends only out of its accumulated distributable profits, if any, determined in accordance with its articles of association and the accounting standards and regulations in the PRC. We are not required to publicly release financial statements for our PRC subsidiaries prepared in accordance with PRC accounting standards. Based on our understanding of U.S. GAAP and PRC accounting standards, we are not aware of any significant differences between accumulated profits as calculated under PRC accounting standards and those accounting standards used in preparing our U.S. GAAP financial statements. Moreover, pursuant to applicable PRC laws and regulations, 10% of the after-tax profits of each of our PRC subsidiaries are required to be set aside in a statutory surplus reserve fund each year until the reserve balance reaches 50% of such PRC subsidiary’s registered capital. Allocations to these statutory reserves may only be used for specific purposes and are not distributable to us in the form of loans, advances or cash dividends. In connection with the formation of ISST, we agreed that ISST will not pay dividends for the first three years after its inception. Furthermore, if any of our PRC subsidiaries incurs debt on its own behalf in the future, the instruments governing the debt may restrict its ability to pay dividends or make other payments to us. As a result of these PRC regulatory and contractual restrictions, our PRC subsidiaries and consolidated affiliated entity are restricted in their ability to transfer a portion of their net assets to our Cayman Islands holding company in the form of dividends.
93
The Enterprise Income Tax Law and its implementing rules provide that an income tax rate of 10% will be applicable to dividends payable to non-PRC resident enterprise shareholders to the extent such dividends are derived from sources within the PRC. If we are determined to be a PRC resident enterprise by the PRC tax authorities, it is unclear whether dividends declared and distributed by us to our non-PRC resident enterprise shareholders will be deemed to be derived from sources within the PRC under the Enterprise Income Tax Law and its implementing rules and therefore be subject to the 10% withholding tax (or potentially a 20% income tax withholding will be imposed on dividends received from us by our non-PRC individual shareholders under the applicable PRC tax laws). See “Item 10.E. Additional Information—Taxation—People’s Republic of China Taxation.”
If we pay any dividends, we will pay our ADS holders to the same extent as holders of our ordinary shares, subject to the terms of the deposit agreement, including the fees and expenses payable thereunder. See “Item 12.D. American Depositary Shares.”
B. Significant Changes
Except as disclosed elsewhere in this annual report, we have not experienced any significant changes since the date of our audited financial statements included in this report.
ITEM 9. THE OFFER AND LISTING
A. Offering and listing details.
Price Range of Our ADSs
Our ADSs are listed for trading on the NYSE under the symbol “ISS” and have been listed since December 14, 2010. The following table sets forth the high and low trading prices of our ADSs on the NYSE for the periods indicated:
| | | | | | | | |
| | | High | | | Low | |
Annual | | | | | | | | |
2010(1) | | $ | 19.00 | | | $ | 15.30 | |
2011 | | $ | 22.63 | | | $ | 5.66 | |
2012 | | $ | 11.04 | | | $ | 3.68 | |
Quarterly | | | | | | | | |
Fourth Quarter 2010(1) | | $ | 19.00 | | | $ | 15.30 | |
First Quarter 2011 | | $ | 21.35 | | | $ | 16.8 | |
Second Quarter 2011 | | $ | 22.63 | | | $ | 9.8 | |
Third Quarter 2011 | | $ | 16.00 | | | $ | 6.49 | |
Fourth Quarter 2011 | | $ | 11.14 | | | $ | 5.66 | |
First Quarter 2012 | | $ | 11.04 | | | $ | 8.4 | |
Second Quarter 2012 | | $ | 9.14 | | | $ | 5.11 | |
Third Quarter 2012 | | $ | 7.09 | | | $ | 4.16 | |
Fourth Quarter 2012 | | $ | 5.50 | | | $ | 3.68 | |
First Quarter 2013 | | $ | 6.08 | | | $ | 3.99 | |
Monthly | | | | | | | | |
2012 | | | | | | | | |
October | | $ | 5.50 | | | $ | 4.42 | |
November | | $ | 4.98 | | | $ | 3.71 | |
December | | $ | 4.68 | | | $ | 3.68 | |
2013 | | | | | | | | |
January | | $ | 6.08 | | | $ | 3.99 | |
February | | $ | 5.44 | | | $ | 4.85 | |
March | | $ | 5.75 | | | $ | 4.50 | |
April (through April 19, 2013) | | $ | 4.97 | | | $ | 4.32 | |
| (1) | Our ADSs began trading on the NYSE on December 14, 2010. |
B. Plan of Distribution
Not applicable.
94
C. Markets
See Item 9.A. above.
D. Selling Shareholders
Not applicable.
E. Dilution
Not applicable.
F. Expenses of the Issue
Not applicable.
ITEM 10. ADDITIONAL INFORMATION
A. Share capital
Not applicable.
B. Memorandum of Association and Articles of Association
We incorporate by reference into this annual report the description of our fourth amended and restated memorandum of association and fifth amended and restated articles of association contained in “Description of Share Capital” of our F-1 registration statement (File No. 333-170785) originally filed with the Securities and Exchange Commission on November 23, 2010, as amended.
C. Material Contracts
We have not entered into any material contracts other than in the ordinary course of business and other than those described in “Item 4. Information on the Company” and in “Item 7. Major Shareholders and Related Party Transactions” or elsewhere in this annual report on Form 20-F.
D. Exchange Controls
Regulations on Foreign Currency Exchange
Under the PRC Foreign Exchange Administrative Regulations and various rules and regulations promulgated by SAFE, the Renminbi is freely convertible under current account transactions, including the distribution of dividends, interest payments, trade and service-related foreign exchange transactions. For foreign exchange transactions under capital account items, such as making inbound and outbound direct investment, borrowing foreign loans, repatriating investment and investment in securities outside of China, prior approval of or registration with SAFE or its local branches is required.
Foreign-invested enterprises may only buy, sell and remit foreign currencies at those banks authorized to conduct foreign exchange business after providing valid commercial documents and, in the case of capital account transactions, after obtaining approval from SAFE or its local branches. Capital investments by foreign-invested enterprises outside of China are also subject to limitations, which include approvals by the Ministry of Commerce, SAFE and the National Development and Reform Commission or their local counterparts.
Regulation of Foreign Exchange in Certain Onshore and Offshore Transactions
In 2005, SAFE issued the Notice on Relevant Issues Concerning Foreign Exchange Administration for PRC Residents to Engage in Financing and Return Investments via Overseas Special Purpose Vehicles, or Circular 75. Circular 75 requires PRC residents, including both legal persons and natural persons, to register with an appropriate local SAFE branch before establishing or controlling any company outside of China, referred to as an “offshore special purpose company,” for the purpose of acquiring any assets of or equity interest in PRC companies and raising fund from overseas. When a PRC resident contributes the assets or equity interests it holds in a PRC company into the offshore special purpose company, or engages in overseas financing after contributing such assets or equity interests to the offshore special purpose company, such PRC resident must modify its SAFE registration in light of its interest in the offshore special purpose company and any change thereof. In addition, any PRC resident that is the shareholder of an offshore special purpose company is required to amend its SAFE registration with the local SAFE branch with respect to that offshore special purpose company in connection with any increase or decrease of capital, transfer of shares, merger, division, long-term equity investment or creation of any security interest. If these shareholders fail to comply, the PRC subsidiaries of the offshore special purpose company may be prohibited from distributing their profits and proceeds from any reduction in capital, share transfer or liquidation to their offshore parent company and the offshore parent company may be restricted in its ability to contribute additional capital into its PRC subsidiaries. Moreover, failure to comply with the above SAFE registration requirements could result in liability under PRC laws for evasion of foreign exchange restrictions.
95
Dividend Distributions
See “Item 8.A. Financial Information—Dividend Policy” in connection with our policy regarding dividend distributions. See also “Item 3.D. Key Information—Risk Factors—Risks Relating to Our ADS—You may not receive distributions on our ordinary shares or any value for them if such distribution is illegal or if any required government approval cannot be obtained in order to make such distribution available to you.”
E. Taxation
The following is a general summary of the material Cayman Islands, U.S. federal and People’s Republic of China income tax consequences relevant to an investment in our ADSs and ordinary shares. The discussion is not intended to be, nor should it be construed as, legal or tax advice to any particular prospective purchaser or current holders of our ADSs. The discussion is based on laws and relevant interpretations thereof in effect as of the date of this annual report, all of which are subject to change or different interpretations, possibly with retroactive effect. The discussion does not address United States state or local tax laws, or tax laws of jurisdictions other than the Cayman Islands, the People’s Republic of China and the United States.
Cayman Islands Taxation
The Cayman Islands currently levies no taxes on individuals or corporations based upon profits, income, gains or appreciations and there is no taxation in the nature of inheritance tax or estate duty or withholding tax applicable to us or to any holder of ADSs or ordinary shares. There are no other taxes likely to be material to us levied by the Government of the Cayman Islands except for stamp duties which may be applicable on instruments executed in, or after execution brought within the jurisdiction of the Cayman Islands. No stamp duty is payable in the Cayman Islands on transfers of shares of Cayman Islands companies except those which hold interests in land in the Cayman Islands. The Cayman Islands is not party to any double tax treaties. There are no exchange control regulations or currency restrictions in the Cayman Islands.
Pursuant to Section 6 of the Tax Concessions Law (1999 Revision) of the Cayman Islands, we have obtained an undertaking from the Governor-in-Cabinet:
| | • | | that no law which is enacted in the Cayman Islands imposing any tax to be levied on profits or income or gains or appreciations shall apply to iSoftStone Holdings Limited or its operations; and |
| | • | | that the aforesaid tax or any tax in the nature of estate duty or inheritance tax shall not be payable on the shares, debentures or other obligations of iSoftStone Holdings Limited. |
The undertaking for iSoftStone Holdings Limited is for a period of twenty years from August 24, 2010.
People’s Republic of China Taxation
China promulgated a new Enterprise Income Tax Law effective on January 1, 2008. The Enterprise Income Tax Law created a new “resident enterprise” classification which if applied could treat our Cayman Islands holding company in a manner similar to a Chinese enterprise for enterprise income tax purposes. While we do not currently consider our Cayman Islands holding company to be a PRC “resident enterprise”, there is a risk that the PRC tax authorities may deem our company as a PRC “resident enterprise”. If the PRC tax authorities determine that our Cayman Islands holding company is a “resident enterprise” for PRC enterprise income tax purposes, a 10% or potentially 20% withholding tax may be imposed on dividends we pay to our non-PRC enterprise or individual shareholders respectively and with respect to gains derived by our non-PRC shareholders from transferring our shares or ADSs. Currently, neither we nor our PRC counsel can be certain as to whether our Cayman Islands holding company will be regarded as a PRC “resident enterprise” or not. In addition, it is unclear whether, if our Cayman Islands holding company is considered a PRC “resident enterprise,” holders of our shares or ADSs would be able to claim the benefit of income tax treaties or agreements entered into between China and other jurisdictions. See “Item 3.D. Key Information—Risk Factors—Risks Related to Doing Business in China—We may be classified as a “resident enterprise” for PRC enterprise income tax purposes; such classification could result in unfavorable tax consequences to us and our non-PRC shareholders.”
United States Federal Income Taxation
This discussion describes the material U.S. federal income tax consequences of the purchase, ownership and disposition of our ADSs or ordinary shares. This discussion does not address any aspect of U.S. federal gift or estate tax, or the state, local or non-U.S. tax consequences of an investment in our ADSs or ordinary shares. This discussion applies to U.S. Holders (as defined below) who beneficially own our ADSs or ordinary shares as capital assets for U.S. federal income tax purposes. This discussion does not apply to you if you are a member of a class of holders subject to special rules, such as:
| | • | | dealers in securities or currencies; |
| | • | | traders in securities that elect to use a mark-to-market method of accounting for securities holdings; |
| | • | | banks or certain financial institutions; |
96
| | • | | tax-exempt organizations; |
| | • | | partnerships or other entities treated as partnerships or other pass-through entities for U.S. federal income tax purposes or persons holding ADSs or ordinary shares through any such entities; |
| | • | | regulated investments companies or real estate investment trusts; |
| | • | | persons that hold ADSs or ordinary shares as part of a hedge, straddle, constructive sale, conversion transaction or other integrated investment; |
| | • | | persons whose functional currency for tax purposes is not the U.S. dollar; |
| | • | | persons liable for alternative minimum tax; or |
| | • | | persons who actually or constructively own 10% or more of the total combined voting power of all classes of our shares entitled to vote (including ADSs and ordinary shares). |
This discussion is based on the U.S. Internal Revenue Code of 1986, as amended, or the Code, its legislative history, existing and proposed regulations promulgated thereunder, published rulings and court decisions, all as of the date hereof. These laws are subject to change, possibly on a retroactive basis. In addition, this discussion is based in part, upon representations of the depositary and the assumption that each obligation in the deposit agreement and any related agreement will be performed in accordance with its terms.
The actual tax consequences of investing in our ADSs or ordinary shares will vary depending on each prospective purchaser’s circumstances. Prospective purchasers are urged to consult their own tax advisors concerning the particular U.S. federal income tax consequences to them of the purchase, ownership and disposition of our ADSs or ordinary shares, as well as the consequences to them arising under the laws of any other taxing jurisdiction.
For purposes of the U.S. federal income tax discussion below, you are a “U.S. Holder” if you beneficially own ADSs or ordinary shares as capital assets and are:
| | • | | an individual citizen or resident of the United States for U.S. federal income tax purposes; |
| | • | | a corporation, or other entity taxable as a corporation for U.S. federal income tax purposes, that was created or organized in or under the laws of the United States or any state thereof or the District of Columbia; |
| | • | | an estate the income of which is subject to U.S. federal income tax regardless of its source; or |
| | • | | a trust if (a) a court within the United States is able to exercise primary supervision over its administration and one or more U.S. persons have the authority to control all substantial decisions of the trust, or (b) the trust has a valid election in effect to be treated as a U.S. person. |
For U.S. federal income tax purposes, income earned through a U.S. or non-U.S. partnership (including any entity treated as a partnership for U.S. federal income tax purposes) is attributed to its owners. Accordingly, if a partnership holds ADSs or ordinary shares, the tax treatment of its owners will generally depend on their specific status and the activities of the partnership.
If you hold our ADSs, you should be treated as the beneficial owner of the underlying ordinary shares represented by those ADSs for U.S. federal income tax purposes.
Dividends on ADSs or Ordinary Shares
Subject to the “Passive Foreign Investment Company” discussion below, the gross amount of any distributions you receive on your ADSs and ordinary shares will generally be includible in your gross income on the day you actually or constructively receive such income as dividend income if the distributions are made from our current or accumulated earnings and profits, calculated according to U.S. federal income tax principles. We do not intend to determine our earnings and profits on the basis of U.S. federal income tax purposes. Accordingly, distributions paid on our ADSs or ordinary shares, if any, will be treated as dividend distributions for U.S. federal income tax purposes. With respect to non-corporate U.S. Holders, certain dividends from a qualified foreign corporation may be subject to reduced capital gains rate of taxation. A non-U.S. corporation (other than a passive foreign investment company) is treated as a qualified foreign corporation with respect to dividends from that corporation on shares (or ADSs backed by such shares) that are readily tradable on an established securities market in the United States. U.S. Treasury Department guidance indicates that our ADSs, which are listed on the NYSE, are readily tradable on an established securities market in the United States. However, based on existing guidance, it is not entirely clear whether dividends you receive with respect to the ordinary shares will be taxed as qualified dividend income, because the ordinary shares are not themselves listed on a U.S. exchange. You should consult your own tax advisor as to the rate of tax that will apply to you with respect to dividend distributions, if any, you receive from us.
97
If you are a corporation, you will not be entitled to claim a dividends-received deduction with respect to distributions made by us. Dividends will generally constitute foreign source passive income for purposes of the U.S. foreign tax credit rules. You should consult your own advisor as to your ability, and the various limitations on your ability, to claim foreign tax credits in connection with the receipt of dividends.
Sale or other Dispositions of ADSs or Ordinary Shares
Subject to the “Passive Foreign Investment Company” discussion below, when you sell or otherwise dispose of ADSs or ordinary shares, you will recognize capital gain or loss in an amount equal to the difference between the amount realized on the sale or other disposition and your adjusted tax basis in the ADSs or ordinary shares. Your adjusted tax basis will equal the amount you paid for the ADSs or ordinary shares. Any gain or loss you recognize will be long-term capital gain or loss if your holding period in our ADSs or ordinary shares is more than one year at the time of disposition. If you are a non-corporate U.S. Holder, including an individual, any such long-term capital gain will be taxed at preferential rates. Your ability to deduct capital losses will be subject to various limitations.
Any gain or loss you recognize on a disposition of ADSs or ordinary shares will generally be U.S. source gain or loss for U.S. foreign tax credit purposes. You should consult your own tax advisor as to your ability, and the various limitations on your ability, to claim foreign tax credits in connection with a disposition of ADSs or ordinary shares.
Passive Foreign Investment Company
In general, we will be classified as a passive foreign investment company, or PFIC in any taxable year if either: (a) the average quarterly value of our gross assets that produce passive income or are held for the production of passive income is at least 50% of the average quarterly value of our total gross assets (the “asset test”) or (b) 75% or more of our gross income for the taxable year is passive income (such as certain dividends, interest or royalties). For this purpose, we will be treated as owning our proportionate share of the assets and earning our proportionate share of the income of any other corporation in which we own, directly or indirectly, at least 25% (by value) of the stock. For this purpose, we will be treated as owning our proportionate share of the assets and earning our proportionate share of the income of any other corporation in which we own, directly or indirectly, at least 25% (by value) of the stock. For purposes of the asset test: (a) any cash and cash invested in short-term, interest bearing, debt instruments, or bank deposits that are readily convertible into cash will count as producing passive income or held for the production of passive income, and (b) the total value of our assets is calculated based on our market capitalization.
We believe that we were not a PFIC for U.S. federal income tax purposes for our taxable year ended December 31, 2012, and we do not expect to be a PFIC in any future taxable year. However, PFIC status is tested each year and depends on the composition of our assets and income and the value of our assets from time to time. Since we currently hold, and expect to continue to hold, a substantial amount of cash and other passive assets and, since the value of our assets is to be determined in large part by reference to the market prices of our ADSs and ordinary shares, which is likely to fluctuate over time, there can be no assurance that we will not be a PFIC in 2013 or for any future taxable year.
If we were a PFIC for any taxable year during which you held ADSs or ordinary shares, certain adverse U.S. federal income tax rules would apply. You would be subject to additional taxes and interest charges on certain “excess” distributions we make and on any gain recognized on the disposition or deemed disposition of your ADSs or ordinary shares, regardless of whether we continue to be a PFIC in the year in which you receive an “excess” distribution or dispose of or are deemed to dispose of your ADSs or ordinary shares. Distributions in respect of your ADSs or ordinary shares during a taxable year would constitute “excess” distributions if, in the aggregate, they exceed 125% of the average amount of distributions in respect of your ADSs or ordinary shares over the three preceding taxable years or, if shorter, the portion of your holding period before such taxable year.
To compute the tax on “excess” distributions or any gain, (a) the “excess” distribution or the gain would be allocated ratably to each day in your holding period, (b) the amount allocated to the current year and any tax year prior to the first taxable year in which we were a PFIC would be taxed as ordinary income in the current year, (c) the amount allocated to other taxable years would be taxable at the highest applicable marginal rate in effect for that year, and the interest charge generally applicable to underpayments of tax will be imposed on the resulting tax attributable to each such year. In addition, if we were a PFIC, no distribution that you receive from us would qualify for taxation at the preferential rate discussed in the “—Dividends on ADSs or Ordinary Shares” section above.
If we were a PFIC in any taxable year during which your held our ADSs or ordinary shares, under certain attribution rules, you will be deemed to own your proportionate share of lower-tier PFICs, and will be subject to U.S. federal income tax on (a) a distribution on the shares of a lower-tier PFIC and (b) a disposition of shares of a lower-tier PFIC, both as if you directly held the shares of such lower-tier PFIC.
You would generally be able to avoid the PFIC rules regarding “excess” distribution and gain described above by making a timely so-called “mark-to-market” election with respect to your ADSs provided our ADSs are “marketable.” Our ADSs will be “marketable” as long as they remain “regularly traded” on a national securities exchange, such as the NYSE. If you made this election in a timely fashion, you would generally include in income each year an amount equal to the excess, if any, of the fair market value of the ADSs or ordinary shares as of the close of your taxable year over your adjusted basis in such ADSs or ordinary shares. Any ordinary income resulting from this election would generally be taxed at ordinary income rates and would not be eligible for the reduced rate of tax applicable to qualified dividend income. Any ordinary losses would be limited to the extent of the net amount of previously included income as a result of the mark-to-market election, if any.
98
Your basis in the ADSs would be adjusted to reflect any such income or loss. Gain on the sale or other disposition of the ADSs would be treated as ordinary income, and loss on the sale or other disposition of the ADSs or ordinary shares would be treated as ordinary loss, but only to the extent of the net amount previously included in income as a result of the mark-to-market election. You should consult your own tax advisor regarding potential advantages and disadvantages to you of making a “mark-to-market” election with respect to your ADSs. The mark-to-market election will not be available for any lower tier PFIC that is deemed owned pursuant to the attribution rules discussed above.
Alternatively, a U.S. Holder of stock in a PFIC may make a so-called “Qualified Electing Fund” election to avoid the PFIC rules regarding “excess” distribution and gain described above. A U.S. Holder that makes such an election would include in income for a taxable year its pro rata share of the corporation’s income for the taxable year. However, we do not intend to provide you with the information you would need to make or maintain a “Qualified Electing Fund” election and you will, therefore, not be able to make or maintain such an election with respect to your ADSs or ordinary shares.
Each U.S. Holder of a PFIC is required to file an annual report containing such information as the U.S. Treasury may require and may be required to file Internal Revenue Service Form 8621 regarding distributions received on the ADSs or ordinary shares and any gain realized on the disposition of the ADSs or ordinary shares. If we are or become a PFIC, you should consult your tax advisor regarding any reporting requirements that may apply to you.
Information Reporting and Backup Withholding
In general, dividend payments with respect to the ADSs or ordinary shares and the proceeds received on the sale or other disposition of ADSs or ordinary shares may be subject to information reporting to the IRS and to backup withholding. Backup withholding will not apply, however, if you provide a taxpayer identification number, certify as to no loss of exemption from backup withholding and otherwise comply with the applicable backup withholding rules. To establish your status as an exempt person, you will be required to provide certification on IRS Form W-9. U.S. Holders should consult their tax advisors regarding the application of the United States information reporting and backup withholding rules. Any amounts withheld from payments to you under the backup withholding rules that exceed your U.S. federal income tax liability will be allowed as a refund or a credit against your U.S. federal income tax liability, provided that you timely furnish the required information to the IRS. Certain individuals holding the ADSs or ordinary shares other than in an account at a U.S. financial institution may be subject to additional information reporting requirements.
F. Dividends and Paying Agents
Not applicable.
G. Statement by Experts.
Not applicable.
H. Documents on Display
We previously filed with the Securities and Exchange Commission our registration statement on Form F-1 (File No. 333-170785) as amended.
We have filed this annual report on Form 20-F with the Securities and Exchange Commission under the Exchange Act. Statements made in this annual report as to the contents of any document referred to are not necessarily complete. With respect to each such document filed as an exhibit to this annual report, reference is made to the exhibit for a more complete description of the matter involved, and each such statement shall be deemed qualified in its entirety by such reference.
We are subject to the informational requirements of the Exchange Act and file reports and other information with the Securities and Exchange Commission. Reports and other information which we filed with the Securities and Exchange Commission, including this annual report on Form 20-F, may be inspected and copied at the public reference room of the Securities and Exchange Commission at 100 F Street, N.E., Washington D.C. 20549.
You can also obtain copies of this annual report on Form 20-F by mail from the Public Reference Section of the Securities and Exchange Commission, 100 F Street, N.E., Washington D.C. 20549, at prescribed rates. Additionally, copies of this material may be obtained from the Securities and Exchange Commission’s Internet site athttp://www.sec.gov. The Commission’s telephone number is 1-800-SEC-0330.
I. Subsidiary Information
Not applicable.
99
ITEM 11. QUANTITATIVE AND QUALITATIVE DISCLOSURES ABOUT MARKET RISK
Quantitative and Qualitative Disclosures about Market Risk
Interest Rate Risk
Our exposure to interest rate risk primarily relates to interest income generated by excess cash invested in demand deposits with remaining maturities of three months or less when purchased. Interest earning instruments carry a degree of interest rate risk. We have not used derivative financial instruments to manage our interest rate risk exposure.
We have not been exposed to material risks due to changes in market interest rates. However, our future interest expense may increase and interest income may fall due to changes in market interest rates.
Inflation
Inflation in China has not materially impacted our results of operations in recent years. According to the National Bureau of Statistics of China, the consumer price index in China increased by 3.3%, 5.4% and 2.6% in 2010, 2011 and 2012, respectively. If inflation rates continue to rise, we may experience greater increases in the wages of our professionals as a result of the increasing inflation levels in China or otherwise. See “Item 3.D. Key Information—Risk Factors—Risks Related to Our Business and Our Industry—Increases in wages for professionals in China could prevent us from sustaining our competitive advantage and could reduce our profit margins.”
Foreign Currency Risk
Our financial statements are expressed in U.S. dollars. However, a majority of our revenues and expenses are denominated in Renminbi. Our exposure to foreign exchange risk primarily relates to the limited cash denominated in currencies other than the functional currencies of each entity and limited revenue contracts denominated in Japanese Yen in certain PRC operating entities. We do not believe that we currently have any significant direct foreign exchange risk and have not hedged exposures denominated in foreign currencies or any other derivative financial instruments. However, the value of your investment in our ADSs will be affected by the foreign exchange rate between U.S. dollars and Renminbi because the primary value of our business is effectively denominated in Renminbi, while the ADSs will be traded in U.S. dollars. See “Item 3.D. Key Information—Risk Factors—Risks Related to Our Business and Our Industry—Fluctuation in the value of the Renminbi and other currencies may have a material adverse effect on the value of your investment.”
To the extent that we need to convert our U.S. dollar denominated cash balance into Renminbi for our operations, appreciation of the Renminbi against the U.S. dollar would have an adverse effect on the Renminbi amount we receive from the conversion. Assuming we had converted the U.S. dollar denominated cash balance of $26.7 million as of December 31, 2012 into Renminbi at the exchange rate of $1.00 for RMB6.2301 as of December 31, 2012, this cash balance would have been RMB166.3 million. Assuming a further 1.0% appreciation of the Renminbi against the U.S. dollar, this cash balance would have decreased to RMB164.6 million as of December 31, 2012.
To date, we have not entered into any hedging transactions in an effort to reduce our exposure to foreign currency exchange risk. While we may decide to enter into hedging transactions in the future, the availability and effectiveness of these hedging transactions may be limited and we may not be able to successfully hedge our exposure at all. In addition, our currency exchange losses may be magnified by PRC exchange control regulations that restrict our ability to convert Renminbi into foreign currency.
Newly Adopted Accounting Pronouncements
In May 2011, the FASB issued an authoritative pronouncement on fair value measurement. The guidance is the result of joint efforts by the FASB and International Accounting Standards Board to develop a single, converged fair value framework. The guidance is largely consistent with existing fair value measurement principles in US GAAP. The guidance expands the existing disclosure requirements for fair value measurements and makes other amendments, mainly including:
| | • | | Highest-and-best-use and valuation-premise concepts for nonfinancial assets—the guidance indicates that the highest-and-best- use and valuation-premise concepts only apply to measuring the fair value of nonfinancial assets. |
| | • | | Application to financial assets and financial liabilities with offsetting positions in market risks or counterparty credit risk—the guidance permits an exception to fair value measurement principles for financial assets and financial liabilities (and derivatives) with offsetting positions in market risks or counterparty credit risk when several criteria are met. When the criteria are met, an entity can measure the fair value of the net risk position. |
| | • | | Premiums or discounts in fair value measure—the guidance provides that premiums or discounts that reflect size as a characteristic of the reporting entity’s holding (specifically, a blockage factor that adjusts the quoted price of an asset or a liability because the market’s normal daily trading volume is not sufficient to absorb the quantity held by the entity) rather than as a characteristic of the asset or liability (for example, a control premium when measuring the fair value of a controlling interest) are not permitted in a fair value measurement. |
| | • | | Fair value of an instrument classified in a reporting entity’s stockholders’ equity—the guidance prescribes a model for measuring the fair value of an instrument classified in stockholders’ equity; this model is consistent with the guidance on measuring the fair value of liabilities. |
100
| | • | | Disclosures about fair value measurements—the guidance expands disclosure requirements, particularly for Level 3 inputs. Required disclosures include: |
(i) For fair value measurements categorized in Level 3 of the fair value hierarchy: (1) a quantitative disclosure of the unobservable inputs and assumptions used in the measurement, (2) a description of the valuation process in place (e.g., how the entity decides its valuation policies and procedures, as well as changes in its analyses of fair value measurements, from period to period), and (3) a narrative description of the sensitivity of the fair value to changes in unobservable inputs and interrelationships between those inputs.
(ii) The level in the fair value hierarchy of items that are not measured at fair value in the statement of financial position but whose fair value must be disclosed.
The guidance is to be applied prospectively and is effective for interim and annual periods beginning after December 15, 2011, for public entities. Early application by public entities is not permitted. The adoption of this guidance did not have a significant effect on our consolidated financial statements.
In June 2011, the FASB issued an authoritative pronouncement to require an entity to present the total of comprehensive income, the components of net income, and the components of other comprehensive income either in a single continuous statement of comprehensive income or in two separate but consecutive statements. In both choices, an entity is required to present each component of net income along with total net income, each component of other comprehensive income along with a total for other comprehensive income, and a total amount for comprehensive income. The guidance eliminates the option to present the components of other comprehensive income as part of the statement of changes in stockholders’ equity. The guidance does not change the items that must be reported in other comprehensive income or when an item of other comprehensive income must be reclassified to net income. The guidance should be applied retrospectively. For public entities, the guidance is effective for fiscal years and interim periods within those years, beginning after December 15, 2011. Early adoption is permitted. In December 2011, the FASB issued an authoritative pronouncement related to deferral of the effective date for amendments to the presentation of reclassifications of items out of accumulated other comprehensive income. This guidance allows the FASB to redeliberate whether to present on the face of the financial statements the effects of reclassifications out of accumulated other comprehensive income on the components of net income and other comprehensive income for all periods presented. While the FASB is considering the operational concerns about the presentation requirements for reclassification adjustments and the needs of financial statement users for additional information about reclassification adjustments, entities should continue to report reclassifications out of accumulated other comprehensive income consistent with the presentation requirements in effect before update the pronouncement issued in June 2011. We adopted this guidance on January 1, 2012 and has separately presented the consolidated statements of comprehensive income since that date.
In September 2011, the FASB issued an authoritative pronouncement related to testing goodwill for impairment. The guidance is intended to simplify how entities, both public and nonpublic, test goodwill for impairment. The guidance permits an entity to first assess qualitative factors to determine whether it is “more likely than not” that the fair value of a reporting unit is less than its carrying amount as a basis for determining whether it is necessary to perform the two-step goodwill impairment test. The guidance is effective for annual and interim goodwill impairment tests performed for fiscal years beginning after December 15, 2011. Early adoption is permitted, including for annual and interim goodwill impairment tests performed as of a date before September 15, 2011, if a public entity’s financial statements for the most recent annual or interim period have not yet been issued. The adoption of this pronouncement did not have a significant effect on our consolidated financial statements for our annual impairment test.
In July 2012, the FASB issued an authoritative pronouncement related to testing indefinite-lived intangible assets, other than goodwill, for impairment. Under the guidance, an entity testing an indefinite-lived intangible asset for impairment has the option of performing a qualitative assessment before calculating the fair value of the asset. If the entity determines, on the basis of qualitative factors, that the fair value of the indefinite-lived intangible asset is not more likely than not (i.e., a likelihood of more than 50 percent) impaired, the entity would not need to calculate the fair value of the asset. The guidance does not revise the requirement to test indefinite-lived intangible assets annually for impairment. In addition, the guidance does not amend the requirement to test these assets for impairment between annual tests if there is a change in events or circumstances; however, it does revise the examples of events and circumstances that an entity should consider in interim periods. The guidance was effective for annual and interim impairment tests performed for fiscal years beginning after September 15, 2012. Early adoption is permitted. The adoption of this guidance did not have a significant effect on our consolidated financial statements.
Recent Accounting Pronouncements Not Yet Adopted
In December 2011, the FASB has issued an authoritative pronouncement related to Disclosures about Offsetting Assets and Liabilities. The guidance requires an entity to disclose information about offsetting and related arrangements to enable users of its financial statements to understand the effect of those arrangements on its financial position. An entity is required to apply the amendments for annual reporting periods beginning on or after January 1, 2013, and interim periods within those annual periods. An entity should provide the disclosures required by those amendments retrospectively for all comparative periods presented. We are in the process of evaluating the effect of adoption of this guidance on our consolidated financial statements.
101
ITEM 12. DESCRIPTION OF SECURITIES OTHER THAN EQUITY SECURITIES
A. Debt Securities
Not applicable.
B. Warrants and Rights
Not applicable.
C. Other Securities
Not applicable.
D. American Depositary Shares.
Fees and Charges Payable by a Holder of American Depositary Receipts
JPMorgan Chase Bank, N.A., or our depositary, may charge each person to whom ADSs are issued, including, without limitation, issuances against deposits of shares, issuances in respect of share distributions, rights and other distributions, issuances pursuant to a stock dividend or stock split declared by us or issuances pursuant to a merger, exchange of securities or any other transaction or event affecting the ADSs or deposited securities, and each person surrendering ADSs for withdrawal of deposited securities or whose ADRs are cancelled or reduced for any other reason, $5.00 for each 100 ADSs (or any portion thereof) issued, delivered, reduced, cancelled or surrendered, as the case may be. The depositary may sell (by public or private sale) sufficient securities and property received in respect of a share distribution, rights and/or other distribution prior to such deposit to pay such charge.
The following additional charges shall be incurred by the ADR holders, by any party depositing or withdrawing shares or by any party surrendering ADSs or to whom ADSs are issued (including, without limitation, issuance pursuant to a stock dividend or stock split declared by us or an exchange of stock regarding the ADRs or the deposited securities or a distribution of ADSs), whichever is applicable:
| | • | | a fee of $1.50 per ADR or ADRs for transfers of certificated or direct registration ADRs; |
| | • | | a fee of up to $0.05 per ADS for any cash distribution made pursuant to the deposit agreement; |
| | • | | a fee $0.05 per ADS per calendar year (or portion thereof) for services performed by the depositary in administering the ADRs (which fee may be charged on a periodic basis during each calendar year and shall be assessed against holders of ADRs as of the record date or record dates set by the depositary during each calendar year and shall be payable in the manner described in the next succeeding provision); |
| | • | | reimbursement of such fees, charges and expenses as are incurred by the depositary and/or any of the depositary’s agents (including, without limitation, the custodian and expenses incurred on behalf of holders in connection with compliance with foreign exchange control regulations or any law or regulation relating to foreign investment) in connection with the servicing of the shares or other deposited securities, the delivery of deposited securities or otherwise in connection with the depositary’s or its custodian’s compliance with applicable law, rule or regulation (which charge shall be assessed on a proportionate basis against holders as of the record date or dates set by the depositary and shall be payable at the sole discretion of the depositary by billing such holders or by deducting such charge from one or more cash dividends or other cash distributions); |
| | • | | a fee for the distribution of securities (or the sale of securities in connection with a distribution), such fee being in an amount equal to the fee for the execution and delivery of ADSs which would have been charged as a result of the deposit of such securities (treating all such securities as if they were shares) but which securities or the net cash proceeds from the sale thereof are instead distributed by the depositary to those holders entitled thereto; |
| | • | | stock transfer or other taxes and other governmental charges; |
| | • | | cable, telex and facsimile transmission and delivery charges incurred at your request in connection with the deposit or delivery of shares; |
| | • | | transfer or registration fees for the registration of transfer of deposited securities on any applicable register in connection with the deposit or withdrawal of deposited securities; and |
| | • | | expenses of the depositary in connection with the conversion of foreign currency into U.S. dollars. |
We will pay all other charges and expenses of the depositary and any agent of the depositary (except the custodian) pursuant to agreements from time to time between us and the depositary. The charges described above may be amended from time to time by agreement between us and the depositary.
The depositary collects its fees for issuance and cancellation of ADSs directly from investors depositing shares or surrendering ADSs for the purpose of withdrawal or from intermediaries acting for them. The depositary collects fees for making distributions to investors by deducting those fees from the amounts distributed or by selling a portion of distributable property to pay the fees. The depositary may collect its annual fee for depositary services by deduction from cash distributions, or by directly billing investors, or by charging the book-entry system accounts of participants acting for them. The depositary may generally refuse to provide services to any holder until the fees and expenses owing by such holder for those services or otherwise are paid.
102
Fees Payable by the Depositary to the Issuer
Our depositary has agreed to reimburse us for certain reasonable fees and expenses we incur that are directly related to establishment and ongoing maintenance of the ADR program, including (a) initial and ongoing listing fees, underwriting fees and fees paid in conjunction with the preparation and execution of any offering of ADRs to be issued under the ADR program, including our initial public offering; (b) investor relations activities related to the ADR program, including, but not limited to, road shows, investor conference participation expenses, prospectus printing, related advertising and public relations in those jurisdictions in which the ADRs trade; (c) reasonable legal, audit and accounting fees and expenses, including, but not limited to, those related to reporting and corporate governance requirements of the SEC and/or any stock exchanges upon which the ADRs are listed for trading; (d) shareholder identification and perception studies and other investor relations expenses, in each case as arranged by or through the depositary; (e) broker reimbursements; and (f) any out-of-pocket expenses and fees we might otherwise owe the depository and other bona fide ADR program related third party expenses. There are limits on the amount of expenses for which the depositary will reimburse us, but the amount of reimbursement available to us is not perforce related to the amounts of fees the depositary collects from investors. In the year ended December 31, 2012, we received from the depositary reimbursement payment in the amount of $0.86 million, net of tax, for expenses incurred by use relating to the establishment and ongoing maintenance of the ADR program.
PART II
ITEM 13. DEFAULTS, DIVIDEND ARREARAGES AND DELINQUENCIES
None.
ITEM 14. MATERIAL MODIFICATIONS TO THE RIGHTS OF SECURITY HOLDERS AND USE OF PROCEEDS
On January 11, 2012, we entered into a restricted issuance agreement with JPMorgan Chase Bank, N.A., as depositary, pursuant to which the depositary may issue restricted American depositary shares upon a deposit of restricted securities by a depositor. Other than the foregoing, the rights of securities holders have not been materially modified.
ITEM 15. CONTROLS AND PROCEDURES
Evaluation of Disclosure Controls and Procedures
Our management, with the participation of our chief executive officer and chief financial officer, has performed an evaluation of the effectiveness of our disclosure controls and procedures (as defined in Rule 13a-15(e) under the Exchange Act) as of the end of the period covered by this report, as required by Rule 13a-15(b) under the Exchange Act. Based on that evaluation, our chief executive officer and chief financial offer has concluded that, as of December 31, 2012, our disclosure controls and procedures were effective to ensure that the information required to be disclosed by us in reports that we file or submit under the Exchange Act is recorded, processed, summarized and reported within the time periods specified in the SEC’s rules and forms, and that the information required to be disclosed in the reports that we file or submit under the Exchange Act is accumulated and communicated to our management, including our chief executive officer and chief financial officer, to allow timely decisions regarding required disclosure.
Management’s Report on Internal Control over Financial Reporting
Our management is responsible for establishing and maintaining adequate internal control over financial reporting, as defined in Rule 13a-15(f) under the Exchange Act. Internal control over financial reporting is a process designed to provide reasonable assurance regarding the reliability of financial reporting and the preparation of consolidated financial statements in accordance with generally accepted accounting principles, and includes those policies and procedures that (1) pertain to the maintenance of records that, in reasonable detail, accurately and fairly reflect the transactions and dispositions of a company’s assets, (2) provide reasonable assurance that transactions are recorded as necessary to permit preparation of consolidated financial statements in accordance with generally accepted accounting principles, and that a company’s receipts and expenditures are being made only in accordance with authorizations of a company’s management and directors, and (3) provide reasonable assurance regarding prevention or timely detection of unauthorized acquisition, use or disposition of a company’s assets that could have a material effect on the consolidated financial statements.
Because of its inherent limitations, internal control over financial reporting may not prevent or detect misstatements. Also, projections of any evaluation of effectiveness to future periods are subject to the risk that controls may become inadequate because of changes in conditions, or that the degree of compliance with the policies and procedures may deteriorate.
103
As required by Section 404 of the Sarbanes-Oxley Act and related rules as promulgated by the SEC, our management, with the participation of our chief executive officer and our chief financial officer, evaluated the effectiveness of our internal control over financial reporting based on criteria established in the framework in Internal Control—Integrated Framework issued by the Committee of Sponsoring Organizations of the Treadway Commission. Based on this evaluation, our management has concluded that our internal control over financial reporting was effective as of December 31, 2012.
Our independent registered public accounting firm has audited our internal control over financial reporting as of December 31, 2012 and has issued an attestation report set forth below.
REPORT OF INDEPENDENT REGISTERED PUBLIC ACCOUNTING FIRM
To the Board of Directors and Stockholders of iSoftStone Holdings Limited
We have audited the internal control over financial reporting of iSoftStone Holdings Limited (the “Company”), its subsidiaries and variable interest entity (collectively, the “Group”) as of December 31, 2012, based on criteria established in Internal Control—Integrated Framework issued by the Committee of Sponsoring Organizations of the Treadway Commission. The Group’s management is responsible for maintaining effective internal control over financial reporting and for its assessment of the effectiveness of internal control over financial reporting, included in the accompanying Management’s Annual Report on Internal Control Over Financial Reporting. Our responsibility is to express an opinion on the Group’s internal control over financial reporting based on our audit.
We conducted our audit in accordance with the standards of the Public Company Accounting Oversight Board (United States). Those standards require that we plan and perform the audit to obtain reasonable assurance about whether effective internal control over financial reporting was maintained in all material respects. Our audit included obtaining an understanding of internal control over financial reporting, assessing the risk that a material weakness exists, testing and evaluating the design and operating effectiveness of internal control based on the assessed risk, and performing such other procedures as we considered necessary in the circumstances. We believe that our audit provides a reasonable basis for our opinion.
A company’s internal control over financial reporting is a process designed by, or under the supervision of, the company’s principal executive and principal financial officers, or persons performing similar functions, and effected by the company’s board of directors, management, and other personnel to provide reasonable assurance regarding the reliability of financial reporting and the preparation of financial statements for external purposes in accordance with generally accepted accounting principles. A company’s internal control over financial reporting includes those policies and procedures that (1) pertain to the maintenance of records that, in reasonable detail, accurately and fairly reflect the transactions and dispositions of the assets of the company; (2) provide reasonable assurance that transactions are recorded as necessary to permit preparation of financial statements in accordance with generally accepted accounting principles, and that receipts and expenditures of the company are being made only in accordance with authorizations of management and directors of the company; and (3) provide reasonable assurance regarding prevention or timely detection of unauthorized acquisition, use, or disposition of the company’s assets that could have a material effect on the financial statements.
Because of the inherent limitations of internal control over financial reporting, including the possibility of collusion or improper management override of controls, material misstatements due to error or fraud may not be prevented or detected on a timely basis. Also, projections of any evaluation of the effectiveness of the internal control over financial reporting to future periods are subject to the risk that the controls may become inadequate because of changes in conditions, or that the degree of compliance with the policies or procedures may deteriorate.
In our opinion, the Group maintained, in all material respects, effective internal control over financial reporting as of December 31, 2012, based on the criteria established in Internal Control—Integrated Framework issued by the Committee of Sponsoring Organizations of the Treadway Commission.
We have also audited, in accordance with the standards of the Public Company Accounting Oversight Board (United States), the consolidated financial statements and financial statement schedule as of and for the year ended December 31, 2012 of the Group and our report dated April 24, 2013 expressed an unqualified opinion on those consolidated financial statements and financial statement schedule, and included an explanatory paragraph regarding the Group’s adoption of the authoritative guidance on the presentation of comprehensive income.
Deloitte Touche Tohmatsu Certified Public Accountants LLP
Beijing, the People’s Republic of China
April 24, 2013
Changes in Internal Control over Financial Reporting
There have been no significant changes in our internal controls over financial reporting that occurred during the year ended December 31, 2012 that have materially affected, or are reasonably likely to materially affect, our internal control over financial reporting.
104
ITEM 16A. AUDIT COMMITTEE FINANCIAL EXPERT
Our audit committee consists of Al-Noor Gulamali Abdulla Ramji, Tom Manning and Benson Tam. Mr. Manning is the chairman of our audit committee, and Mr. Tam meets the criteria of an audit committee financial expert as set forth under the applicable rules of the SEC. Each of Mr. Ramji, Mr. Manning and Mr. Tam satisfies the “independence” requirements within the meaning of Section 303A of the Corporate Governance Rules of the NYSE and satisfies the “independence” requirements under Rule 10A-3 under the Exchange Act. The audit committee oversees our accounting and financial reporting processes and the audits of the financial statements of our company.
ITEM 16B. CODE OF ETHICS
Our board of directors has adopted a code of ethics that is applicable to our senior executive and financial officers. In addition, our board of directors adopted a code of conduct that is applicable to all of our directors, officers and employees. Our code of ethics and our code of conduct are publicly available on our website,http://www.isoftstone.com.
ITEM 16C. PRINCIPAL ACCOUNTANT FEES AND SERVICES
At the direction of the government of the PRC in accordance with the Scheme of the Localization Restructuring of Chinese-Foreign Cooperative Accounting Firms, Deloitte Touche Tohmatsu CPA Limited has restructured to a new partnership and changed its name to Deloitte Touche Tohmatsu Certified Public Accountants LLP, effective from January 1, 2013. Deloitte Touche Tohmatsu Certified Public Accountants LLP has succeeded Deloitte Touche Tohmatsu CPA Limited for all purposes and assumed all of the obligations and rights of Deloitte Touche Tohmatsu CPA Limited with effect from January 1, 2013. Deloitte Touche Tohmatsu CPA Limited and Deloitte Touche Tohmatsu Certified Public Accountants LLP are hereinafter referred to as “Deloitte”.
The following table sets forth the aggregate fees by categories specified below in connection with certain professional services rendered by Deloitte Touche Tohmatsu Certified Public Accountants LLP, or Deloitte, our principal external auditors, in the fiscal year ended December 31, 2011 and 2012, respectively.
| | | | | | | | | | | | | | | | |
| | | Fiscal Year ended December 31, | |
| | | 2011 | | | 2012 | |
| | | (In thousands) | |
| | | RMB | | | US$ | | | RMB | | | US$ | |
Audit fees (1) | | | 7,626 | | | | 1,180 | | | | 6,556 | | | | 1,050 | |
Audit-related fees (2) | | | — | | | | — | | | | — | | | | — | |
Tax fees(3) | | | 478 | | | | 74 | | | | 500 | | | | 80 | |
All other fees(4) | | | — | | | | — | | | | — | | | | — | |
| (1) | “Audit fees” means the aggregate fees billed or payable for professional services rendered by our independent auditors in connection with the audit of our consolidated financial statements or the review of our interim consolidated financial statements required for statutory or regulatory filings. |
| (2) | “Audit-related fees” means the aggregate fees billed or payable for professional services rendered by our independent auditors in connection with the review of our interim consolidated financial statements not required for statutory or regulatory filings. |
| (3) | “Tax fees” means the aggregate fees billed or payable for tax compliance services, transfer pricing and requests for rulings or technical advice from taxing authorities and tax planning services. |
| (4) | “All other fees” means the aggregate fees billed for all other services provided by Deloitte, other than those services covered in footnotes (1) to (3) above. |
It is the policy of the audit committee or our board of directors to pre-approve all auditing services and permitted non-audit services to be performed for us by our independent registered public accounting firm, Deloitte, including the fees and terms thereof (subject to the de minimums exceptions for non-audit services described in Section 10A(i)(l)(B) of the Exchange Act which are approved by the audit committee or our board of directors prior to the completion of the audit).
ITEM 16D. EXEMPTIONS FROM THE LISTING STANDARDS FOR AUDIT COMMITTEES
None.
ITEM 16E. PURCHASES OF EQUITY SECURITIES BY THE ISSUER AND AFFILIATED PURCHASERS
None.
105
ITEM 16F. CHANGE IN REGISTRANT’S CERTIFYING ACCOUNTANT
(a) Dismissal of Principal Accountant
Not applicable.
(b) Engagement of New Principal Accountant
Not applicable.
ITEM 16G. CORPORATE GOVERNANCE
As a foreign private issuer with ADSs listed on the NYSE, we are subject to corporate governance requirements imposed by the NYSE. Under Section 303A of the NYSE Listed Company Manual, in general NYSE-listed non-U.S. companies may follow their home-country corporate governance practices in lieu of some of the NYSE corporate governance requirements. We are committed to a high standard of corporate governance. As such, we strive to comply with most of the NYSE corporate governance practices. The standards applicable to us are considerably different than the standards applied to U.S. domestic issuers. The significantly different standards applicable to us do not require us to:
| | • | | have a majority of the board be independent; |
| | • | | have a minimum of three members or a person with accounting or related financial management expertise in our audit committee; |
| | • | | have a compensation committee or a nominating and corporate governance committee; |
| | • | | provide an annual certification by our chief executive officer that he or she is not aware of any non-compliance with any corporate governance rules of the NYSE; |
| | • | | have regularly scheduled executive sessions with only non-management directors; |
| | • | | have at least one executive session of solely independent directors each year; |
| | • | | seek shareholder approval for (i) the implementation and material revisions of the terms of share incentive plans, (ii) the issuance of more than 1% of our outstanding ordinary shares or more than 1% of our outstanding voting power to a related party, (iii) the issuance of more than 20% of our outstanding ordinary shares, and (iv) an issuance that would result in a change of control; |
| | • | | adopt and disclose corporate governance guidelines; or |
| | • | | adopt and disclose a code of business conduct and ethics for directors, officers and employees. |
We do not intend to rely on any of the exemptions provided by the NYSE to foreign private issuers, except that we will not provide an annual certification by our chief executive officer that he or she is not aware of any non-compliance with any corporate governance rules of the NYSE, and we will not seek shareholder approval for (i) the issuance of more than 1% of our outstanding ordinary shares or more than 1% of our outstanding voting power to a related party, (ii) the issuance of more than 20% of our outstanding ordinary shares, and (iii) an issuance that would result in a change of control. As a result, you may not be provided with the benefits of certain corporate governance requirements of the NYSE.
ITEM 16H. MINE SAFETY DISCLOSURE
Not applicable.
PART III
ITEM 17. FINANCIAL STATEMENTS
We have elected to provide our financial statements pursuant to Item 18.
ITEM 18. FINANCIAL STATEMENTS
Our consolidated financial statements are included at the end of this annual report.
106
ITEM 19. EXHIBITS
Index to Exhibits
| | |
| |
| 1.1* | | Form of Fourth Amended and Restated Memorandum of Association and Fifth Amended and Restated Articles of Association of the Registrant |
| |
| 2.1* | | Form of Registrant’s American Depository Receipt (included in Exhibit 2.3) |
| |
| 2.2* | | Specimen Certificate for Ordinary Shares of the Registrant |
| |
| 2.3* | | Form of Deposit Agreement among the Registrant, the Depositary and Owners and Beneficial Owners of the American Depositary Shares |
| |
| 2.6** | | Restricted Issuance Agreement dated as of January 11, 2012 among the Registrant, the Depositary and Owners and Beneficial Owners of the Restricted American Depositary Shares |
| |
| 2.7* | | Second Amended and Restated Investors’ Rights Agreement, dated as of December 23, 2009, among AsiaVest Opportunities Fund IV, Infotech Ventures Cayman Company Limited, Fidelity Asia Ventures Fund L.P., Fidelity Asia Principals Fund L.P., Mitsui Ventures Global Fund, Infotech Pacific Ventures, L.P., CSOF Technology Investments Limited, SeaBright China Special Opportunities Fund II, LP, FIL Limited, Tekventure Limited, United Innovation (China) Limited, iSoftStone Holdings Limited and certain other persons named therein |
| |
| 2.8* | | Additional Investor Joinder Agreement to Investors’ Rights Agreement, dated as of April 21, 2010, between Jinyuan Development (Hong Kong) Company Limited and iSoftStone Holdings Limited |
| |
| 2.9* | | Amendment to Investors’ Rights Agreement, dated as of April 22, 2010, among AsiaVest Opportunities Fund IV, Infotech Ventures Cayman Company Limited, Fidelity Asia Ventures Fund L.P., Fidelity Asia Principals Fund L.P., Mitsui Ventures Global Fund, Infotech Pacific Ventures, L.P., CSOF Technology Investments Limited, SeaBright China Special Opportunities Fund II, LP, Asia Ventures II L.P., Jinyuan Development (Hong Kong) Company Limited, Hua Ying Management Co., Limited, Tekventure Limited, United Innovation (China) Limited, iSoftStone Holdings Limited and certain other persons named therein |
| |
| 2.10* | | Second Amended and Restated Right of First Refusal and Co-Sale Agreement, dated as of December 23, 2009, among AsiaVest Opportunities Fund IV, Infotech Ventures Cayman Company Limited, Fidelity Asia Ventures Fund L.P., Fidelity Asia Principals Fund L.P., Mitsui Ventures Global Fund, Infotech Pacific Ventures, L.P., CSOF Technology Investments Limited, SeaBright China Special Opportunities Fund II, LP, FIL Limited, Tekventure Limited, United Innovation (China) Limited, iSoftStone Holdings Limited and certain other persons named therein |
| |
| 2.11* | | Additional Investor Joinder Agreement to Right of First Refusal and Co-Sale Agreement, dated as of April 21, 2010, between Jinyuan Development (Hong Kong) Company Limited and iSoftStone Holdings Limited |
| |
| 2.12* | | Amendment to Right of First Refusal and Co-Sale Agreement, dated as of April 22, 2010, among AsiaVest Opportunities Fund IV, Infotech Ventures Cayman Company Limited, Fidelity Asia Ventures Fund L.P., Fidelity Asia Principals Fund L.P., Mitsui Ventures Global Fund, Infotech Pacific Ventures, L.P., CSOF Technology Investments Limited, SeaBright China Special Opportunities Fund II, LP, Asia Ventures II L.P., Jinyuan Development (Hong Kong) Company Limited, Hua Ying Management Co., Limited, Tekventure Limited, United Innovation (China) Limited, iSoftStone Holdings Limited and certain other persons named therein |
| |
| 2.13* | | Amendment No. 2 to Investors’ Rights Agreement, dated as of November 26, 2010, among AsiaVest Opportunities Fund IV, Infotech Ventures Cayman Company Limited, Fidelity Asia Ventures Fund L.P., Fidelity Asia Principals Fund L.P., Mitsui Ventures Global Fund, Infotech Pacific Ventures, L.P., CSOF Technology Investments Limited, SeaBright China Special Opportunities Fund II, LP, Asia Ventures II L.P., Jinyuan Development (Hong Kong) Company Limited, Hua Ying Management Co., Limited, Tekventure Limited, United Innovation (China) Limited, iSoftStone Holdings Limited and certain other persons named therein. |
| |
| 4.1* | | 2008 Share Incentive Plan |
| |
| 4.2* | | 2009 Share Incentive Plan |
| |
| 4.3* | | 2010 Performance Incentive Plan |
| |
| 4.4* | | Form of Employment Agreement with the Registrant’s officers |
| |
| 4.5* | | Form of Indemnification Agreement with the Registrant’s directors and officers |
| |
| 4.6*** | | Investment Agreement dated September 4, 2012, among iSoftStone Information Technology (Group) Co., Ltd., iSoftStone Holdings Limited and Huawei Technologies Co., Ltd. |
| |
| 8.1 | | Subsidiaries of the Registrant |
107
| | |
| |
| 11.1* | | Code of Business Conduct and Ethics |
| |
| 12.1 | | CEO Certification Pursuant to Section 302 of the Sarbanes-Oxley Act of 2002 |
| |
| 12.2 | | CFO Certification Pursuant to Section 302 of the Sarbanes-Oxley Act of 2002 |
| |
| 13.1 | | CEO Certification Pursuant to Section 906 of the Sarbanes-Oxley Act of 2002 |
| |
| 13.2 | | CFO Certification Pursuant to Section 906 of the Sarbanes-Oxley Act of 2002 |
| |
| 15.1 | | Consent of Deloitte Touche Tohmatsu Certified Public Accountants LLP, Independent Registered Public Accounting Firm. |
| |
| 15.2 | | Consent of Han Kun Law Offices |
XBRL Interactive Data File will be filed by amendment to this Form 20-F within 30 days of the filing date of this Form 20-F, as permitted by Rule 405(a)(2)(ii) of Regulation S-T.
| * | Previously filed with the Registrant’s registration statement on Form F-1 (File No. 333-170785), as amended, initially filed with the Securities and Exchange Commission on November 23, 2010. |
| ** | Previously filed with the Registrant’s annual report on Form 20-F for the year ended December 31, 2011 filed with the Securities and Exchange Commission on April 27, 2012. |
| *** | Previously furnished with the Registrant’s report on Form 6-K filed with the Securities and Exchange Commission on September 4, 2012. |
108
SIGNATURE
The registrant hereby certifies that it meets all of the requirements for filing on Form 20-F and that it has duly caused and authorized the undersigned to sign this annual report on its behalf.
| | |
| iSoftStone Holdings Limited |
| |
| | /s/ Tianwen Liu |
| Name: | | Tianwen Liu |
| Title: | | Chief Executive Officer |
|
| Date: April 24, 2013 |
109
ISOFTSTONE HOLDINGS LIMITED
INDEX TO CONSOLIDATED FINANCIAL STATEMENTS
F-1
REPORT OF INDEPENDENT REGISTERED PUBLIC ACCOUNTING FIRM
TO THE BOARD OF DIRECTORS AND STOCKHOLDERS OF ISOFTSTONE HOLDINGS LIMITED
We have audited the accompanying consolidated balance sheets of iSoftStone Holdings Limited (the “Company”), its subsidiaries, and variable interest entity (collectively, the “Group”) as of December 31, 2011 and 2012, and the related consolidated statements of operations, comprehensive income (loss), changes in equity, and cash flows for each of the three years in the period ended December 31, 2012, and the related financial statement schedule included in Schedule I. These financial statements and the related financial statement schedule are the responsibility of the Group’s management. Our responsibility is to express an opinion on these financial statements based on our audits.
We conducted our audits in accordance with the standards of the Public Company Accounting Oversight Board (United States). Those standards require that we plan and perform the audit to obtain reasonable assurance about whether the financial statements are free of material misstatement. An audit includes examining, on a test basis, evidence supporting the amounts and disclosures in the financial statements. An audit also includes assessing the accounting principles used and significant estimates made by management, as well as evaluating the overall financial statement presentation. We believe that our audits provide a reasonable basis for our opinion.
In our opinion, such consolidated financial statements present fairly, in all material respects, the financial position of the Group as of December 31, 2011 and 2012, and the results of its operations and its cash flows for each of the three years in the period ended December 31, 2012, in conformity with accounting principles generally accepted in the United States of America. Also in our opinion, the related financial statement schedule, when considered in relation to the basic consolidated financial statements taken as a whole, present fairly in all material respects, the information set forth therein.
As discussed in Note 2 to the consolidated financial statements, such statements have been adjusted for the retrospective application of the authoritative guidance regarding the presentation of comprehensive income, which was adopted by the Group on January 1, 2012.
We have also audited, in accordance with the standards of the Public Company Accounting Oversight Board (United States), the Group’s internal control over financial reporting as of December 31, 2012, based on the criteria established in Internal Control—Integrated Framework issued by the Committee of Sponsoring Organizations of the Treadway Commission and our report dated April 24, 2013 expressed an unqualified opinion on the Group’s internal control over financial reporting.
Deloitte Touche Tohmatsu Certified Public Accountants LLP
Beijing, the People’s Republic of China
April 24, 2013
F-2
ISOFTSTONE HOLDINGS LIMITED
CONSOLIDATED BALANCE SHEETS
(In U.S. dollars in thousands, except share and per share data, or otherwise noted)
| | | | | | | | |
| | | December 31,
2011 | | | December 31,
2012 | |
Assets | | | | | | | | |
Current assets: | | | | | | | | |
Cash | | $ | 101,196 | | | $ | 116,597 | |
Restricted cash | | | 1,581 | | | | 8,743 | |
Accounts receivable, net of allowance for doubtful accounts of $4,219 and $1,653 as of December 31, 2011 and 2012, respectively | | | 152,663 | | | | 202,202 | |
Prepaid expenses and other current assets | | | 18,994 | | | | 14,019 | |
Amounts due from related parties | | | 1,591 | | | | 3,838 | |
Deferred tax assets, current | | | 2,467 | | | | 1,915 | |
| | | | | | | | |
Total current assets | | | 278,492 | | | | 347,314 | |
| | | | | | | | |
Long term investments | | | 9,351 | | | | 8,779 | |
Property and equipment, net | | | 55,791 | | | | 67,768 | |
Land use right, net | | | 3,242 | | | | 3,202 | |
Intangible assets, net | | | 4,688 | | | | 5,945 | |
Goodwill | | | 24,597 | | | | 26,983 | |
Other non-current assets | | | 1,895 | | | | 5,993 | |
Deferred tax assets, non-current | | | — | | | | 526 | |
| | | | | | | | |
Total assets | | $ | 378,056 | | | $ | 466,510 | |
| | | | | | | | |
Liabilities | | | | | | | | |
Current liabilities: | | | | | | | | |
Accounts payable | | $ | 15,924 | | | $ | 21,895 | |
Deferred revenue | | | 8,387 | | | | 9,693 | |
Accrued expenses and other current liabilities | | | 31,372 | | | | 32,839 | |
Income tax payable | | | 3,102 | | | | 7,519 | |
Amounts due to related parties | | | 94 | | | | 8 | |
Short term borrowings | | | 15,094 | | | | 54,012 | |
Deferred consideration in connection with business acquisitions, current | | | 3,488 | | | | 2,480 | |
Contingent consideration payable in connection with business acquisitions, current | | | 2,398 | | | | 1,032 | |
| | | | | | | | |
Total current liabilities | | | 79,859 | | | | 129,478 | |
| | | | | | | | |
Deferred consideration in connection with business acquisitions, non-current | | | — | | | | 1,462 | |
Contingent consideration payable in connection with business acquisitions, non-current | | | 1,678 | | | | 1,248 | |
Deferred tax liabilities, non-current | | | 1,158 | | | | 937 | |
Other liabilities, non-current | | | 602 | | | | 401 | |
| | | | | | | | |
Total liabilities | | $ | 83,297 | | | $ | 133,526 | |
| | | | | | | | |
Commitments (Note 27) | | | | | | | | |
| | |
Equity | | | | | | | | |
iSoftStone Holdings Limited shareholders’ equity: | | | | | | | | |
Ordinary shares ($0.0001 par value, 1,000,000,000 and 1,000,000,000 shares authorized as of December 31, 2011 and 2012, respectively; 557,682,406 and 569,206,989 shares issued and outstanding as of December 31, 2011 and 2012, respectively) | | | 56 | | | | 57 | |
Treasury shares | | | (773 | ) | | | (773 | ) |
Shares to be issued | | | 1,262 | | | | 1,262 | |
Additional paid-in capital | | | 282,134 | | | | 294,909 | |
Statutory reserves | | | 9,664 | | | | 11,459 | |
Accumulated other comprehensive income | | | 15,719 | | | | 17,747 | |
(Accumulated deficit) retained earnings | | | (14,902 | ) | | | 5,412 | |
| | | | | | | | |
Total iSoftStone Holdings Limited shareholders’ equity | | | 293,160 | | | | 330,073 | |
Noncontrolling interest | | | 1,599 | | | | 2,911 | |
| | | | | | | | |
Total equity | | | 294,759 | | | | 332,984 | |
| | | | | | | | |
Total liabilities and equity | | $ | 378,056 | | | $ | 466,510 | |
| | | | | | | | |
The accompanying notes are an integral part of these consolidated financial statements.
F-3
ISOFTSTONE HOLDINGS LIMITED
CONSOLIDATED STATEMENTS OF OPERATIONS
(In U.S. dollars in thousands, except share and per share data, or otherwise noted)
| | | | | | | | | | | | |
| | | For the year ended December 31, | |
| | | 2010 | | | 2011 | | | 2012 | |
Revenues | | $ | 200,783 | | | $ | 288,384 | | | $ | 385,666 | |
Business tax | | | (3,808 | ) | | | (4,967 | ) | | | (4,522 | ) |
| | | | | | | | | | | | |
Net revenues | | | 196,975 | | | | 283,417 | | | | 381,144 | |
Cost of revenues | | | (125,689 | ) | | | (181,121 | ) | | | (251,540 | ) |
| | | | | | | | | | | | |
Gross profit | | | 71,286 | | | | 102,296 | | | | 129,604 | |
| | | | | | | | | | | | |
Operating expenses: | | | | | | | | | | | | |
General and administrative expenses | | | (44,277 | ) | | | (50,768 | ) | | | (63,279 | ) |
Selling and marketing expenses | | | (17,468 | ) | | | (27,685 | ) | | | (32,855 | ) |
Research and development expenses | | | (3,852 | ) | | | (3,684 | ) | | | (4,951 | ) |
| | | | | | | | | | | | |
Total operating expenses | | | (65,597 | ) | | | (82,137 | ) | | | (101,085 | ) |
| | | | | | | | | | | | |
Changes in fair value of contingent consideration in connection with business combination | | | 28 | | | | (4,969 | ) | | | (1,118 | ) |
Other income (expense) | | | 262 | | | | 324 | | | | (231 | ) |
Government subsidies | | | 3,269 | | | | 1,840 | | | | 1,110 | |
Gain on deconsolidation of Wuxi iCarnegie | | | 1,079 | | | | — | | | | — | |
| | | | | | | | | | | | |
Income from operations | | | 10,327 | | | | 17,354 | | | | 28,280 | |
| | | | | | | | | | | | |
Interest income | | | 180 | | | | 1,118 | | | | 775 | |
Interest expense | | | (5,742 | ) | | | (1,424 | ) | | | (1,966 | ) |
Change in fair value of convertible note derivatives | | | (8,428 | ) | | | 2,832 | | | | — | |
| | | | | | | | | | | | |
(Loss) income before provision for income taxes and loss in equity method investments, net of income taxes | | | (3,663 | ) | | | 19,880 | | | | 27,089 | |
Income taxes benefit (expense) | | | 288 | | | | (319 | ) | | | (4,370 | ) |
| | | | | | | | | | | | |
(Loss) income after income taxes before loss in equity method investments, net of income taxes | | | (3,375 | ) | | | 19,561 | | | | 22,719 | |
Loss on equity method investments, net of income taxes | | | (245 | ) | | | (565 | ) | | | (637 | ) |
| | | | | | | | | | | | |
Net (loss) income | | | (3,620 | ) | | | 18,996 | | | | 22,082 | |
Less: Net (loss) income attributable to noncontrolling interest | | | (438 | ) | | | 151 | | | | (27 | ) |
| | | | | | | | | | | | |
Net (loss) income attributable to iSoftStone Holdings Limited | | $ | (3,182 | ) | | $ | 18,845 | | | $ | 22,109 | |
| | | | | | | | | | | | |
Net (loss) income per share attributable to ordinary shareholders of iSoftStone Holdings Limited: | | | | | | | | | | | | |
Basic | | $ | (0.05 | ) | | $ | 0.03 | | | $ | 0.04 | |
| | | | | | | | | | | | |
Diluted | | $ | (0.05 | ) | | $ | 0.03 | | | $ | 0.04 | |
| | | | | | | | | | | | |
Weighted average shares used in calculating net income (loss) per ordinary share | | | | | | | | | | | | |
Basic | | | 149,341,325 | | | | 547,143,620 | | | | 564,069,512 | |
| | | | | | | | | | | | |
Diluted | | | 149,341,325 | | | | 592,082,213 | | | | 582,402,472 | |
| | | | | | | | | | | | |
The accompanying notes are an integral part of these consolidated financial statements.
F-4
ISOFTSTONE HOLDINGS LIMITED
CONSOLIDATED STATEMENTS OF COMPREHENSIVE INCOME (LOSS)
(In U.S. dollars in thousands, except share and per share data, or otherwise noted)
| | | | | | | | | | | | |
| | | Year Ended December 31, | |
| | | 2010 | | | 2011 | | | 2012 | |
Net (loss) income | | $ | (3,620 | ) | | $ | 18,996 | | | $ | 22,082 | |
Other comprehensive income, net of tax of nil:
Change in cumulative foreign currency translation adjustment | | | 3,157 | | | | 8,865 | | | | 2,050 | |
| | | | | | | | | | | | |
Comprehensive (loss) income | | | (463 | ) | | | 27,861 | | | | 24,132 | |
| | | | | | | | | | | | |
Less: comprehensive (loss) income attributed to the noncontrolling interest | | | (399 | ) | | | 211 | | | | (5 | ) |
Comprehensive (loss) income attributed to iSoftStone Holdings Limited | | $ | (64 | ) | | $ | 27,650 | | | $ | 24,137 | |
| | | | | | | | | | | | |
The accompanying notes are an integral part of these consolidated financial statements.
F-5
ISOFTSTONE HOLDINGS LIMITED
CONSOLIDATED STATEMENTS OF CHANGES IN EQUITY
(In U.S. dollars in thousands, except share and per share data, or otherwise noted)
| | | | | | | | | | | | | | | | | | | | | | | | | | | | | | | | | | | | | | | | | | | | | | | | | | | | |
| | | Ordinary
shares | | | Series A
convertible
preference
shares | | | Treasury
shares | | | Shares
to be
issued | | | Additional
paid-in
capital | | | Statutory
reserves | | | Retained
earnings
(Accumulated
deficit) | | | Accu-
mulated
other
compre-
hensive
income | | | Total
iSoftStone
Holdings
Limited
shareholders’
equity | | | Non
controlling
interest | | | Total
equity | |
| | | Shares | | | Amount | | | Shares | | | Amount | | | Amount | | | | | | | | | | | | | | | | | | | | | | | | | |
Balance as of January 1, 2010 | | | 130,902,853 | | | $ | 13 | | | | 95,286,195 | | | $ | 14,150 | | | $ | — | | | $ | 179 | | | $ | 18,768 | | | $ | 4,133 | | | $ | (22,449 | ) | | $ | 3,796 | | | $ | 18,590 | | | $ | 495 | | | $ | 19,085 | |
| | | | | | | | | | | | | | | | | | | | | | | | | | | | | | | | | | | | | | | | | | | | | | | | | | | | |
Accretion of series B convertible redeemable preference shares | | | — | | | | — | | | | — | | | | — | | | | — | | | | — | | | | — | | | | — | | | | (2,585 | ) | | | — | | | | (2,585 | ) | | | — | | | | (2,585 | ) |
Investment by a subsidiary in parent company | | | — | | | | — | | | | — | | | | — | | | | (2,000 | ) | | | — | | | | — | | | | — | | | | — | | | | — | | | | (2,000 | ) | | | — | | | | (2,000 | ) |
Issuance of ordinary shares in a share-based compensation arrangement (Note 22) | | | 4,500,000 | | | | 1 | | | | — | | | | — | | | | — | | | | — | | | | 2,705 | | | | — | | | | — | | | | — | | | | 2,706 | | | | — | | | | 2,706 | |
Vesting of nonvested shares (to be issued) | | | — | | | | — | | | | — | | | | — | | | | — | | | | 51 | | | | (51 | ) | | | — | | | | — | | | | — | | | | — | | | | — | | | | — | |
Share-based compensation (options and nonvested shares) | | | — | | | | — | | | | — | | | | — | | | | — | | | | — | | | | 4,745 | | | | — | | | | — | | | | — | | | | 4,745 | | | | — | | | | 4,745 | |
Reclassification to liability in connection with modification of certain nonvested shares | | | — | | | | — | | | | — | | | | — | | | | — | | | | — | | | | (40 | ) | | | — | | | | — | | | | — | | | | (40 | ) | | | — | | | | (40 | ) |
Issuance of ordinary shares in connection with exercise of options | | | 80,000 | | | | — | | | | — | | | | — | | | | — | | | | — | | | | 29 | | | | — | | | | — | | | | — | | | | 29 | | | | — | | | | 29 | |
Transfer of ordinary shares in connection with the employment of certain employees | | | — | | | | — | | | | — | | | | — | | | | 293 | | | | (75 | ) | | | (218 | ) | | | — | | | | — | | | | — | | | | — | | | | — | | | | — | |
Sale of ordinary shares to a former employee (Note 22) | | | — | | | | — | | | | — | | | | — | | | | 464 | | | | — | | | | 843 | | | | — | | | | — | | | | — | | | | 1,307 | | | | — | | | | 1,307 | |
Issuance of ordinary shares upon Initial Public Offering (“IPO”), net of offering cost of $4,241 | | | 104,856,845 | | | | 10 | | | | — | | | | — | | | | — | | | | — | | | | 123,435 | | | | — | | | | — | | | | — | | | | 123,445 | | | | — | | | | 123,445 | |
Conversion of convertible preference shares to ordinary shares | | | 264,166,235 | | | | 26 | | | | (95,286,195 | ) | | | (14,150 | ) | | | — | | | | — | | | | 68,869 | | | | — | | | | — | | | | — | | | | 54,745 | | | | — | | | | 54,745 | |
F-6
ISOFTSTONE HOLDINGS LIMITED
CONSOLIDATED STATEMENTS OF CHANGES IN EQUITY—(Continued)
(In U.S. dollars in thousands, except share and per share data, or otherwise noted)
| | | | | | | | | | | | | | | | | | | | | | | | | | | | | | | | | | | | | | | | | | | | | | | | | | | | |
| | | Ordinary
shares | | | Series A
convertible
preference
shares | | | Treasury
shares | | | Shares
to be
issued | | | Additional
paid-in
capital | | | Statutory
reserves | | | Retained
earnings
(Accumulated
deficit) | | | Accu-
mulated
other
compre-
hensive
income | | | Total
iSoftStone
Holdings
Limited
shareholders’
equity | | | Non
controlling
interest | | | Total
equity | |
| | | Shares | | | Amount | | | Shares | | | Amount | | | Amount | | | | | | | | | | | | | | | | | | | | | | | | | |
Conversion of convertible notes to ordinary shares | | | 18,381,991 | | | | 2 | | | | — | | | | — | | | | — | | | | — | | | | 20,926 | | | | — | | | | — | | | | — | | | | 20,928 | | | | — | | | | 20,928 | |
Settlement of contingent consideration of acquisition of MDCL (Note 3) | | | 242,059 | | | | — | | | | — | | | | — | | | | — | | | | — | | | | 131 | | | | — | | | | — | | | | — | | | | 131 | | | | — | | | | 131 | |
Issuance of ordinary shares in connection with business acquisition of Ascend (Note 3) | | | 823,846 | | | | — | | | | — | | | | — | | | | — | | | | — | | | | 1,071 | | | | — | | | | — | | | | — | | | | 1,071 | | | | — | | | | 1,071 | |
Ordinary shares to be issued in connection with business acquisition of Shanghai Kangshi (Note 3) | | | — | | | | — | | | | — | | | | — | | | | — | | | | 1,262 | | | | — | | | | — | | | | — | | | | — | | | | 1,262 | | | | — | | | | 1,262 | |
Ordinary shares to be issued to a consultant | | | — | | | | — | | | | — | | | | — | | | | — | | | | 154 | | | | — | | | | — | | | | — | | | | — | | | | 154 | | | | — | | | | 154 | |
Capital contribution from noncontrolling interest shareholder of Guodian | | | — | | | | — | | | | — | | | | — | | | | — | | | | — | | | | — | | | | — | | | | — | | | | — | | | | — | | | | 586 | | | | 586 | |
Capital contribution from noncontrolling interest shareholder of Jiewen | | | — | | | | — | | | | — | | | | — | | | | — | | | | — | | | | — | | | | — | | | | — | | | | — | | | | — | | | | 242 | | | | 242 | |
Acquisition of noncontrolling interest iSoftStone Korea | | | — | | | | — | | | | — | | | | — | | | | — | | | | — | | | | — | | | | — | | | | — | | | | — | | | | — | | | | 15 | | | | 15 | |
Deconsolidation of Wuxi iCarnegie | | | — | | | | — | | | | — | | | | — | | | | — | | | | — | | | | — | | | | — | | | | — | | | | — | | | | — | | | | 67 | | | | 67 | |
Provision for statutory reserves | | | — | | | | — | | | | — | | | | — | | | | — | | | | — | | | | — | | | | 1,570 | | | | (1,570 | ) | | | — | | | | — | | | | — | | | | — | |
Comprehensive income (loss): | | | | | | | | | | | | | | | | | | | | | | | | | | | | | | | | | | | | | | | | | | | | | | | | | | | | |
Net loss | | | — | | | | — | | | | — | | | | — | | | | — | | | | — | | | | — | | | | — | | | | (3,182 | ) | | | — | | | | (3,182 | ) | | | (438 | ) | | | (3,620 | ) |
Foreign currency translation adjustment | | | — | | | | — | | | | — | | | | — | | | | — | | | | — | | | | — | | | | — | | | | — | | | | 3,118 | | | | 3,118 | | | | 39 | | | | 3,157 | |
| | | | | | | | | | | | | | | | | | | | | | | | | | | | | | | | | | | | | | | | | | | | | | | | | | | | |
Balance as of December 31, 2010 | | | 523,953,829 | | | $ | 52 | | | | — | | | $ | — | | | $ | (1,243 | ) | | $ | 1,571 | | | $ | 241,213 | | | $ | 5,703 | | | $ | (29,786 | ) | | $ | 6,914 | | | $ | 224,424 | | | $ | 1,006 | | | $ | 225,430 | |
| | | | | | | | | | | | | | | | | | | | | | | | | | | | | | | | | | | | | | | | | | | | | | | | | | | | |
F-7
ISOFTSTONE HOLDINGS LIMITED
CONSOLIDATED STATEMENTS OF CHANGES IN EQUITY—(Continued)
(In U.S. dollars in thousands, except share and per share data, or otherwise noted)
| | | | | | | | | | | | | | | | | | | | | | | | | | | | | | | | | | | | | | | | | | | | | | | | | | | | |
| | | Ordinary
shares | | | Series A
convertible
preference
shares | | | Treasury
shares | | | Shares
to be
issued | | | Additional
paid-in
capital | | | Statutory
reserves | | | Retained
earnings
(Accumulated
deficit) | | | Accu-
mulated
other
compre-
hensive
income | | | Total
iSoftStone
Holdings
Limited
shareholders’
equity | | | Non
controlling
interest | | | Total
equity | |
| | | Shares | | | Amount | | | Shares | | | Amount | | | Amount | | | | | | | | | | | | | | | | | | | | | | | | | |
Balance as of December 31, 2010 | | | 523,953,829 | | | $ | 52 | | | | — | | | $ | — | | | $ | (1,243 | ) | | $ | 1,571 | | | $ | 241,213 | | | $ | 5,703 | | | $ | (29,786 | ) | | $ | 6,914 | | | $ | 224,424 | | | $ | 1,006 | | | $ | 225,430 | |
| | | | | | | | | | | | | | | | | | | | | | | | | | | | | | | | | | | | | | | | | | | | | | | | | | | | |
Share-based compensation | | | — | | | | — | | | | — | | | | — | | | | — | | | | — | | | | 9,322 | | | | — | | | | — | | | | — | | | | 9,322 | | | | — | | | | 9,322 | |
Issuance of ordinary shares in connection with share-based compensation arrangement | | | 665,999 | | | | — | | | | — | | | | — | | | | — | | | | — | | | | — | | | | — | | | | — | | | | — | | | | — | | | | — | | | | — | |
Issuance of ordinary shares in connection with exercise of options and vesting of share units | | | 12,178,146 | | | | 1 | | | | — | | | | — | | | | — | | | | — | | | | 4,247 | | | | — | | | | — | | | | — | | | | 4,248 | | | | — | | | | 4,248 | |
Transfer of ordinary shares in connection with the settlement of acquisition of Jiefeng | | | — | | | | — | | | | — | | | | — | | | | 200 | | | | (55 | ) | | | (145 | ) | | | — | | | | — | | | | — | | | | — | | | | — | | | | — | |
Issuance and transfer of ordinary shares in connection with the settlement of acquisition of Kebao | | | — | | | | — | | | | — | | | | — | | | | 270 | | | | (80 | ) | | | (190 | ) | | | — | | | | — | | | | — | | | | — | | | | — | | | | — | |
Conversion of convertible notes to ordinary shares | | | 20,406,720 | | | | 2 | | | | — | | | | — | | | | — | | | | — | | | | 27,235 | | | | — | | | | — | | | | — | | | | 27,237 | | | | — | | | | 27,237 | |
Transfer of ordinary shares in connection with the settlement acquisition of MDCL | | | 152,863 | | | | — | | | | — | | | | — | | | | — | | | | (20 | ) | | | 88 | | | | — | | | | — | | | | — | | | | 68 | | | | — | | | | 68 | |
Issuance of ordinary shares to a consultant | | | 324,849 | | | | 1 | | | | — | | | | — | | | | — | | | | (154 | ) | | | 364 | | | | — | | | | — | | | | — | | | | 211 | | | | — | | | | 211 | |
Noncontrolling interest acquired in connection with the acquisition of iHealthStone | | | — | | | | — | | | | — | | | | — | | | | — | | | | — | | | | — | | | | — | | | | — | | | | — | | | | — | | | | (14 | ) | | | (14 | ) |
Capital contribution from noncontrolling interest shareholder of iHealthStone | | | — | | | | — | | | | — | | | | — | | | | — | | | | — | | | | — | | | | — | | | | — | | | | — | | | | — | | | | 46 | | | | 46 | |
Capital contribution from noncontrolling interest shareholder of iSS-iSYS | | | — | | | | — | | | | — | | | | — | | | | — | | | | — | | | | — | | | | — | | | | — | | | | — | | | | — | | | | 350 | | | | 350 | |
Provision for statutory reserves | | | — | | | | — | | | | — | | | | — | | | | — | | | | — | | | | — | | | | 3,961 | | | | (3,961 | ) | | | — | | | | — | | | | — | | | | — | |
Comprehensive income: | | | | | | | | | | | | | | | | | | | | | | | | | | | | | | | | | | | | | | | | | | | | | | | | | | | | |
Net income | | | — | | | | — | | | | — | | | | — | | | | — | | | | — | | | | — | | | | — | | | | 18,845 | | | | — | | | | 18,845 | | | | 151 | | | | 18,996 | |
Foreign currency translation adjustment | | | — | | | | — | | | | — | | | | — | | | | — | | | | — | | | | — | | | | — | | | | — | | | | 8,805 | | | | 8,805 | | | | 60 | | | | 8,865 | |
| | | | | | | | | | | | | | | | | | | | | | | | | | | | | | | | | | | | | | | | | | | | | | | | | | | | |
Balance of December 31, 2011 | | | 557,682,406 | | | $ | 56 | | | | — | | | $ | — | | | $ | (773 | ) | | $ | 1,262 | | | $ | 282,134 | | | $ | 9,664 | | | $ | (14,902 | ) | | $ | 15,719 | | | $ | 293,160 | | | $ | 1,599 | | | $ | 294,759 | |
| | | | | | | | | | | | | | | | | | | | | | | | | | | | | | | | | | | | | | | | | | | | | | | | | | | | |
F-8
ISOFTSTONE HOLDINGS LIMITED
CONSOLIDATED STATEMENTS OF CHANGES IN EQUITY—(Continued)
(In U.S. dollars in thousands, except share and per share data, or otherwise noted)
| | | | | | | | | | | | | | | | | | | | | | | | | | | | | | | | | | | | | | | | | | | | | | | | | | | | |
| | | Ordinary
shares | | | Series A
convertible
preference
shares | | | Treasury
shares | | | Shares
to be
issued | | | Additional
paid-in
capital | | | Statutory
reserves | | | Retained
earnings
(Accumulated
deficit) | | | Accu-
mulated
other
compre-
hensive
income | | | Total
iSoftStone
Holdings
Limited
shareholders’
equity | | | Non
controlling
interest | | | Total
equity | |
| | | Shares | | | Amount | | | Shares | | | Amount | | | Amount | | | | | | | | | | | | | | | | | | | | | | | | | |
Balance as of December 31, 2011 | | | 557,682,406 | | | $ | 56 | | | | — | | | $ | — | | | $ | (773 | ) | | $ | 1,262 | | | $ | 282,134 | | | $ | 9,664 | | | $ | (14,902 | ) | | $ | 15,719 | | | $ | 293,160 | | | $ | 1,599 | | | $ | 294,759 | |
| | | | | | | | | | | | | | | | | | | | | | | | | | | | | | | | | | | | | | | | | | | | | | | | | | | | |
Share-based compensation | | | — | | | | — | | | | — | | | | — | | | | — | | | | — | | | | 11,120 | | | | — | | | | — | | | | — | | | | 11,120 | | | | — | | | | 11,120 | |
Issuance of ordinary shares in connection with exercise of options and vesting of share units | | | 11,686,061 | | | | 1 | | | | — | | | | — | | | | — | | | | — | | | | 1,655 | | | | — | | | | — | | | | — | | | | 1,656 | | | | — | | | | 1,656 | |
Repurchase of ordinary shares | | | (161,478 | ) | | | — | | | | — | | | | — | | | | — | | | | — | | | | — | | | | — | | | | — | | | | — | | | | — | | | | — | | | | — | |
Acquisition of noncontrolling interest iHealthStone | | | — | | | | — | | | | — | | | | — | | | | — | | | | — | | | | — | | | | — | | | | — | | | | — | | | | — | | | | 38 | | | | 38 | |
Capital contribution from noncontrolling interest shareholder of SZ-Information | | | — | | | | — | | | | — | | | | — | | | | — | | | | — | | | | — | | | | — | | | | — | | | | — | | | | — | | | | 1,279 | | | | 1,279 | |
Provision for statutory reserves | | | — | | | | — | | | | — | | | | — | | | | — | | | | — | | | | — | | | | 1,795 | | | | (1,795 | ) | | | — | | | | — | | | | — | | | | — | |
Comprehensive income: | | | | | | | | | | | | | | | | | | | | | | | | | | | | | | | | | | | | | | | | | | | | | | | | | | | | |
Net income | | | — | | | | — | | | | — | | | | — | | | | — | | | | — | | | | — | | | | — | | | | 22,109 | | | | — | | | | 22,109 | | | | (27 | ) | | | 22,082 | |
Foreign currency translation adjustment | | | — | | | | — | | | | — | | | | — | | | | — | | | | — | | | | — | | | | — | | | | — | | | | 2,028 | | | | 2,028 | | | | 22 | | | | 2,050 | |
| | | | | | | | | | | | | | | | | | | | | | | | | | | | | | | | | | | | | | | | | | | | | | | | | | | | |
Balance as of December 31, 2012 | | | 569,206,989 | | | $ | 57 | | | | — | | | $ | — | | | $ | (773 | ) | | $ | 1,262 | | | $ | 294,909 | | | $ | 11,459 | | | $ | 5,412 | | | $ | 17,747 | | | $ | 330,073 | | | $ | 2,911 | | | $ | 332,984 | |
| | | | | | | | | | | | | | | | | | | | | | | | | | | | | | | | | | | | | | | | | | | | | | | | | | | | |
The accompanying notes are an integral part of these consolidated financial statements.
F-9
ISOFTSTONE HOLDINGS LIMITED
CONSOLIDATED STATEMENTS OF CASH FLOWS
(In U.S. dollars in thousands, except share and per share data, or otherwise noted)
| | | | | | | | | | | | |
| | | For the year ended December 31, | |
| | | 2010 | | | 2011 | | | 2012 | |
Cash flows from operating activities: | | | | | | | | | | | | |
Net (loss) income | | $ | (3,620 | ) | | $ | 18,996 | | | $ | 22,082 | |
Adjustments to reconcile net (loss) income to net cash provided by (used in) operating activities: | | | | | | | | | | | | |
Share-based compensation | | | 8,546 | | | | 9,331 | | | | 11,120 | |
Depreciation and amortization of property and equipment | | | 4,674 | | | | 7,012 | | | | 9,168 | |
Amortization of intangible assets | | | 1,965 | | | | 3,432 | | | | 3,448 | |
Amortization of land use right | | | — | | | | 30 | | | | 72 | |
Provision of allowance for doubtful accounts | | | 2,515 | | | | 2,438 | | | | 209 | |
Loss on equity method investments | | | 245 | | | | 565 | | | | 637 | |
Gain on deconsolidation of Wuxi iCarnegie | | | (1,079 | ) | | | — | | | | — | |
Loss on disposal of property and equipment | | | 168 | | | | 313 | | | | 208 | |
Changes in fair value of contingent consideration in connection with business combinations | | | (28 | ) | | | 4,969 | | | | 1,118 | |
Changes in fair value of convertible notes derivatives | | | 8,428 | | | | (2,832 | ) | | | — | |
Imputed interest expense in connection with convertible notes | | | 4,418 | | | | 654 | | | | — | |
Changes in operating assets and liabilities: | | | | | | | | | | | | |
Accounts receivable | | | (29,631 | ) | | | (46,447 | ) | | | (47,135 | ) |
Prepaid expenses and other current assets | | | (3,191 | ) | | | (7,685 | ) | | | 1,693 | |
Payment for land use right | | | — | | | | (3,273 | ) | | | — | |
Amounts due from related parties | | | (1,797 | ) | | | 1,043 | | | | (2,116 | ) |
Deferred tax assets | | | (91 | ) | | | (779 | ) | | | 51 | |
Accounts payable | | | 4,895 | | | | 1,607 | | | | 1,458 | |
Deferred revenue | | | 1,508 | | | | 3,137 | | | | 1,028 | |
Accrued expenses and other current liabilities | | | 2,969 | | | | 7,419 | | | | 3,395 | |
Income tax payable | | | 251 | | | | 1,368 | | | | 4,242 | |
Amounts due to related parties | | | 846 | | | | (899 | ) | | | (86 | ) |
Deferred tax liabilities | | | (492 | ) | | | (862 | ) | | | (655 | ) |
| | | | | | | | | | | | |
Net cash provided by (used in) operating activities | | | 1,499 | | | | (463 | ) | | | 9,937 | |
| | | | | | | | | | | | |
Cash flows from investing activities: | | | | | | | | | | | | |
Purchase of property and equipment | | | (11,662 | ) | | | (44,312 | ) | | | (20,560 | ) |
Purchase of intangible assets | | | — | | | | (107 | ) | | | — | |
Deferred and contingent consideration paid for business acquisitions (i) | | | (3,793 | ) | | | (5,022 | ) | | | (2,155 | ) |
Proceeds from sales of long term investment | | | — | | | | 270 | | | | 2,413 | |
Payments for long term investments | | | (18 | ) | | | (12,036 | ) | | | (1,532 | ) |
Proceeds from deconsolidation of Wuxi iCarnegie (net of cash in Wuxi iCarnegie of $488) | | | 176 | | | | — | | | | — | |
Consideration paid for acquiring of noncontrolling interest | | | (30 | ) | | | — | | | | (9 | ) |
Restricted cash | | | (1,683 | ) | | | 1,374 | | | | (7,161 | ) |
| | | | | | | | | | | | |
Net cash used in investing activities | | | (17,010 | ) | | | (59,833 | ) | | | (29,004 | ) |
| | | | | | | | | | | | |
F-10
ISOFTSTONE HOLDINGS LIMITED
CONSOLIDATED STATEMENTS OF CASH FLOWS—(Continued)
(In U.S. dollars in thousands, except share and per share data, or otherwise noted)
| | | | | | | | | | | | |
| | | For the year ended December 31, | |
| | | 2010 | | | 2011 | | | 2012 | |
Cash flows from financing activities: | | | | | | | | | | | | |
Proceeds from issuance of convertible notes, net of issuance cost of $367, nil and nil, for the year ended December 31, 2010, 2011 and 2012, respectively | | | 8,633 | | | | — | | | | — | |
Proceeds from issuance of ordinary shares during IPO | | | 127,686 | | | | — | | | | — | |
Payment of offering cost in connection with the issuance of ordinary shares | | | (2,580 | ) | | | (1,485 | ) | | | — | |
Proceeds from exercise of options | | | 29 | | | | 4,031 | | | | 1,874 | |
Proceeds from sale of ordinary shares | | | 445 | | | | 211 | | | | — | |
Proceeds from short term borrowings | | | 40,772 | | | | 14,941 | | | | 53,486 | |
Payment of short term borrowings | | | (32,498 | ) | | | (37,627 | ) | | | (15,199 | ) |
Deferred and contingent consideration paid for business acquisitions (i) | | | (891 | ) | | | (2,184 | ) | | | (5,677 | ) |
Capital contribution from noncontrolling interest shareholder | | | 242 | | | | 350 | | | | 436 | |
Payment for the investment by a subsidiary in parent company | | | (2,000 | ) | | | — | | | | — | |
| | | | | | | | | | | | |
Net cash provided by (used in) financing activities | | | 139,838 | | | | (21,763 | ) | | | 34,920 | |
| | | | | | | | | | | | |
Effect of exchange rate changes | | | 1,615 | | | | 2,175 | | | | (452 | ) |
| | | | | | | | | | | | |
Net increase (decrease) in cash | | | 125,942 | | | | (79,884 | ) | | | 15,401 | |
Cash at beginning of year | | | 55,138 | | | | 181,080 | | | | 101,196 | |
| | | | | | | | | | | | |
Cash at end of year | | $ | 181,080 | | | $ | 101,196 | | | $ | 116,597 | |
| | | | | | | | | | | | |
Supplemental disclosure of cash flow information: | | | | | | | | | | | | |
Income taxes paid | | $ | 359 | | | $ | 235 | | | $ | 749 | |
Interest paid | | $ | 1,337 | | | $ | 889 | | | $ | 1,885 | |
Supplemental schedule of non-cash activities: | | | | | | | | | | | | |
Conversion of preference shares to ordinary shares | | $ | 54,745 | | | $ | — | | | $ | — | |
Conversion of convertible notes to ordinary shares | | $ | 20,928 | | | $ | 27,237 | | | $ | — | |
Accrued offering cost | | $ | 1,661 | | | $ | — | | | $ | — | |
Settlement of contingent consideration of acquisition of MDCL by shares (Note 3) | | $ | 131 | | | $ | — | | | $ | — | |
Capital contribution in the form of software copyright from noncontrolling interest shareholder of Guodian (Note 9) | | $ | 586 | | | $ | — | | | $ | — | |
| | | | | | | | | | | | |
| (i) | Deferred and contingent considerations relating to business acquisitions which were paid within three months or less from the acquisition date were included in the investing activities; payments made after three months from the acquisition date were included in the financing activities. |
The accompanying notes are an integral part of these consolidated financial statements.
F-11
ISOFTSTONE HOLDINGS LIMITED
NOTES TO THE CONSOLIDATED FINANCIAL STATEMENTS
FOR THE YEARS ENDED DECEMBER 31, 2010, 2011 AND 2012
(In U.S. dollars in thousands, except share and per share data, or otherwise noted)
1. ORGANIZATION AND PRINCIPAL ACTIVITIES
iSoftStone Holdings Limited (the “Company”), incorporated in the Cayman Islands, is the holding company for a group of companies. The Company, its subsidiaries and one consolidated variable interest entity (the “VIE”) (collectively the “Group”) are principally engaged in providing an integrated suite of IT services and solutions, including IT services, Consulting and Solution services, and Business Process Outsourcing services (“BPO services”).
The Group commenced its operations in October 2001 through Beijing iSoftStone Technologies Limited (“Beijing iSoftStone”), a limited liability company established in China and owned by Mr. Tianwen Liu and other individuals (the “founders”).
In November 2005, the corporate structure of the Group was reorganized by establishing the Company and transferring substantially all the operating assets and operations of Beijing iSoftStone into iSoftStone Information Technology (Group) Company Limited (“iSoftStone WFOE”), a wholly owned subsidiary of the Company, in exchange of issuance of ordinary shares of the Company to the founders.
The ultimate beneficial shareholders of the Company and Beijing iSoftStone were identical with no shareholder having, before or after the reorganization, a controlling interest. The Company has therefore accounted for this transaction as a recapitalization with no change in the basis of the assets and liabilities of Beijing iSoftStone.
Currently, the Group conducts its business primarily through the following subsidiaries:
| | • | | iSoftStone WFOE, which is a primary operating entity and hosts the Group’s headquarters in Beijing, China. iSoftStone WFOE operates China-based delivery platform and holds China-based subsidiaries, mainly including: iSoftStone Information Technology Co., Ltd. located in Tianjin, iSoftStone Information System Service Co., Ltd. located in Wuxi, and Guangzhou iSoftStone Information Technology Co., Ltd. located in Guangzhou and iSoftstone Technology Service Company Limited in Wuhan. |
| | • | | iSoftStone Inc., the Company’s wholly owned subsidiary incorporated in the State of Delaware, United States. |
| | • | | iSoftStone Japan Limited, the Company’s wholly owned subsidiary incorporated in Japan. |
The Group completed a number of acquisitions in the years presented:
| | • | | In October 2010, the Group acquired Ascend Technologies, Inc. (“Ascend”). |
| | • | | In November 2010, the Group acquired Shanghai Kangshi Information System Co., Ltd. (“Shanghai Kangshi”). |
| | • | | In January 2011, the Group acquired iHealthStone Co., Limited (“iHealthStone”). |
| | • | | In July 2011, the Group acquired Adventier Consulting Group, Inc. (“Adventier”). |
| | • | | In April 2012, the Group acquired the power distribution solution business of Nanjing Jiangchen Science & Technology Co., LTD. (“Jiangchen”). |
| | • | | In June 2012, the Group acquired Abovenet International Inc. (“Abovenet”). |
F-12
ISOFTSTONE HOLDINGS LIMITED
NOTES TO THE CONSOLIDATED FINANCIAL STATEMENTS—(Continued)
FOR THE YEARS ENDED DECEMBER 31, 2010, 2011 AND 2012
(In U.S. dollars in thousands, except share and per share data, or otherwise noted)
1. ORGANIZATION AND PRINCIPAL ACTIVITIES – (Continued)
As of December 31, 2012, the Group’s subsidiaries and VIE were as follows:
| | | | | | | | |
| | | Later Date of
Incorporation/
Acquisition | | Place of
Incorporation | | Percentage
of economic
ownership | |
Subsidiaries | | | | | | | | |
iSoftStone Information Technology (Group) Company Limited (“iSoftStone WFOE”) | | November 4, 2005 | | PRC | | | 100 | % |
iSoftStone Korea Inc. (“iSoftStone Korea”) | | April 20, 2006 | | Korea | | | 100 | % |
iSoftStone Japan Limited (“iSoftStone Japan”) | | August 31, 2006 | | Japan | | | 100 | % |
iSoftStone Information Technology Company Limited ( “iSoftStone Tianjin”) | | December 6, 2006 | | PRC | | | 100 | % |
iSoftStone Information System Service Company Limited ( “iSoftStone Wuxi”) | | December 12, 2006 | | PRC | | | 100 | % |
iSoftStone Inc. | | July 18, 2007 | | USA | | | 100 | % |
Tianjin Saisi Information Technology Company Limited (“Saisi”) | | August 24, 2007 | | PRC | | | 100 | % |
Beijing iSoftStone Data Technology Service Company Limited (“iSoftStone Data”) | | May 23, 2008 | | PRC | | | 100 | % |
iSoftStone Hong Kong Limited ( “iSoftStone HK”) | | October 15, 2008 | | Hong Kong | | | 100 | % |
Guangzhou iSoftStone Information Technology Company Limited ( “iSoftStone Guangzhou”) | | February 17, 2009 | | PRC | | | 100 | % |
Beijing Guodian Ruantong Technology Company Limited (“Guodian”) | | December 28, 2009 | | PRC | | | 87 | % |
Nanjing iSoftStone Information Technology Company Limited (“iSoftStone Nanjing”) | | June 22, 2010 | | PRC | | | 100 | % |
iSoftStone Information Technology Group (Dalian) Company Limited (“iSS-Dalian”) | | July 30, 2010 | | PRC | | | 100 | % |
Hangzhou iSoftStone Information Services Company Limited ( “iSoftStone Hangzhou”) | | August 16, 2010 | | PRC | | | 100 | % |
Shanghai Kangshi Information System Company Limited ( “Shanghai Kangshi”) | | November 10, 2010 | | PRC | | | 100 | % |
Beijing iSoftStone Jiewen Information Technology Company Limited (“Jiewen”) | | November 12, 2010 | | PRC | | | 67 | % |
iHealthStone Co., Limited (“iHealthStone”) | | January 21, 2011 | | PRC | | | 100 | % |
iSoftStone Information Technology Group Chengdu Technology Company Limited (“iSS-Chengdu”) | | January 21, 2011 | | PRC | | | 100 | % |
Xi’an iSoftStone Information Technology Company Limited (“TJ-Xian”) | | March 23, 2011 | | PRC | | | 100 | % |
Shenzhen iSoftStone Technology Company Limited (“iSS-Shenzhen”) | | April 27, 2011 | | PRC | | | 100 | % |
Zhenjiang iSoftStone Information Technology Company Limited (“WX-Zhenjiang”) | | May 18, 2011 | | PRC | | | 100 | % |
iSoftStone Information Technology (Dalian) Company Limited (“iSoftStone Dalian”) | | May 31, 2011 | | PRC | | | 100 | % |
Tianjin Intime Information Technology Company Limited (“Tianjin Intime”) | | June 21, 2011 | | PRC | | | 100 | % |
iSoftStone Limited (“iSS-UK”) | | June 24, 2011 | | UK | | | 100 | % |
iSoftStone UG (“iSS-Germany”) | | June 28, 2011 | | Germany | | | 100 | % |
iSoftStone Information Technology Group (Wuhan) Company Limited (“iSS-Wuhan”) | | July 13, 2011 | | PRC | | | 100 | % |
F-13
ISOFTSTONE HOLDINGS LIMITED
NOTES TO THE CONSOLIDATED FINANCIAL STATEMENTS—(Continued)
FOR THE YEARS ENDED DECEMBER 31, 2010, 2011 AND 2012
(In U.S. dollars in thousands, except share and per share data, or otherwise noted)
1. ORGANIZATION AND PRINCIPAL ACTIVITIES – (Continued)
| | | | | | | | |
iSYS Information Technology Co., Ltd. (“iSS-iSYS”) | | July 14, 2011 | | PRC | | | 65 | % |
iSoftStone Information System Service Yancheng Company Limited (“WX-Yancheng”) | | September 30, 2011 | | PRC | | | 100 | % |
iSoftStone LLC (“iSS-LLC”) | | November 2, 2011 | | USA | | | 100 | % |
Shenzhen iSoftStone Information Technology Company Limited (“SZ- Information”) | | February 21, 2012 | | PRC | | | 60 | % |
Suzhou iSoftStone Information Technology Company Limited (“SZ-Suzhou”) | | March 21, 2012 | | PRC | | | 60 | % |
Beijing Guodian Ruantong Jiangsu Technology Company Limited (“GD-Nanjing”) | | April 23, 2012 | | PRC | | | 87 | % |
iSoftStone Technology Corporation (“iSoftStone-Canada”) | | June 15, 2012 | | Canada | | | 100 | % |
Abovenet International Inc. (“Abovenet”) | | June 23, 2012 | | Canada | | | 100 | % |
Liaoyuan iSoftStone Information Technology Company Limited (“DL WFOE-Liaoyuan”) | | June 27, 2012 | | PRC | | | 100 | % |
Shanghai iSoftStone Industrial Company Limited (“WX-Shanghai”) | | June 29, 2012 | | PRC | | | 100 | % |
iSoftStone Technology Service Company Limited (“iSST”) | | September 7, 2012 | | PRC | | | 100 | % |
Tianjin iSoftStone Technology Service Company Limited (“iSST-Tianjin”) | | September 26, 2012 | | PRC | | | 100 | % |
Nanjing iSoftStone Technology Service Company Limited (“iSST-Nanjing”) | | September 27, 2012 | | PRC | | | 100 | % |
iSoftStone Technology Service Wuxi Company Limited (“iSST-Wuxi”) | | September 29, 2012 | | PRC | | | 100 | % |
Xi’an iSoftStone Technology Service Company Limited (“iSST-Xi’an”) | | October 15, 2012 | | PRC | | | 100 | % |
Foshan iSoftStone Information Technology Company Limited (“GZ-Foshan”) | | October 29, 2012 | | PRC | | | 100 | % |
iSoftStone Technology Development (Yancheng) Company Limited (“iSoftStone-Yancheng”) | | November 12, 2012 | | PRC | | | 100 | % |
| | | |
Variable Interest Entity | | | | | | | | |
Beijing iSoftStone Technologies Limited ( “Beijing iSoftStone”) | | November 18, 2005 | | PRC | | | 100 | % |
F-14
ISOFTSTONE HOLDINGS LIMITED
NOTES TO THE CONSOLIDATED FINANCIAL STATEMENTS—(Continued)
FOR THE YEARS ENDED DECEMBER 31, 2010, 2011 AND 2012
(In U.S. dollars in thousands, except share and per share data, or otherwise noted)
2. SUMMARY OF SIGNIFICANT ACCOUNTING POLICIES
Basis of presentation
The consolidated financial statements of the Group are prepared in accordance with accounting principles generally accepted in the United States of America (“U.S. GAAP”).
Basis of consolidation
The consolidated financial statements include the financial statements of the Company, all its wholly owned and majority owned subsidiaries and the VIE in which the Group is deemed to be the primary beneficiary. All inter-company transactions and balances have been eliminated upon consolidation.
Variable interest entity
In June 2009, the Financial Accounting Standards Board (“FASB”) issued an authoritative pronouncement to amend the accounting rules for VIEs. The amendments effectively replace the quantitative-based risks-and-rewards calculation for determining which reporting entity, if any, has a controlling financial interest in a variable interest entity with an approach focused on identifying which reporting entity has (1) the power to direct the activities of a variable interest entity that most significantly affect the entity’s economic performance and (2) the obligation to absorb losses of, or the right to receive benefits from, the entity. Additionally, an enterprise is required to assess whether it has an implicit financial responsibility to ensure that a variable interest entity operates as designed when determining whether it has the power to direct the activities of the variable interest entity that most significantly impact the entity’s economic performance. The guidance also requires additional disclosures about a reporting entity’s involvement with variable interest entities and about any significant changes in risk exposure as a result of that involvement.
The guidance is effective at the start of a reporting entity’s first fiscal year beginning after November 15, 2009, and all interim and annual periods thereafter. The new VIE model requires that, upon adoption, a reporting entity should determine whether an entity is a VIE, and whether the reporting entity is the VIE’s primary beneficiary, as of the date that the reporting entity first became involved with the entity, unless an event requiring reconsideration of those initial conclusions occurred after that date. When making this determination, a reporting entity must assume that guidance had been effective from the date of its first involvement with the entity. The Group adopted the guidance on January 1, 2010.
Certain of clients of the Group, primarily PRC state-owned entities, are not permitted to receive certain services from foreign owned entities. As a Cayman Islands corporation, the Company is deemed a foreign legal person under PRC laws. Accordingly, iSoftStone WFOE, the Company’s wholly owned subsidiary in PRC, as a foreign invested company, is restricted from engaging in related business with these clients. The Group therefore conducts such business through its VIE, Beijing iSoftStone. iSoftStone WFOE entered into a series of agreements with Beijing iSoftStone and its shareholders in November 2005 through which iSoftStone WFOE enjoys substantially all of the risks of ownership of the VIE and controls it. The agreements comprise:
Exclusive Outsourcing Agreement: Pursuant to the exclusive outsourcing agreement between iSoftStone WFOE and Beijing iSoftStone, Beijing iSoftStone agreed to exclusively subcontract its business contracts, to the extent that subcontracting is permitted by such business contracts, to iSoftStone WFOE and pay the revenue collected under such business contracts to iSoftStone WFOE. The exclusive subcontracting agreement is currently effective and will only terminate upon written agreement by the parties.
Exclusive Technology Consulting and Management Service Agreement: Pursuant to the exclusive technology consulting and management service agreement between iSoftStone WFOE and Beijing iSoftStone, iSoftStone WFOE agreed to provide exclusive technology consulting and management service to Beijing iSoftStone for service fees equal to the revenue realizable under the business contracts of Beijing iSoftStone that are not subcontracted to iSoftStone WFOE. The exclusive technology consulting and management service agreement is currently effective and has a term of three years from its signing date and is renewable for an unlimited number of times for three years unless terminated upon written agreement by the parties.
F-15
ISOFTSTONE HOLDINGS LIMITED
NOTES TO THE CONSOLIDATED FINANCIAL STATEMENTS—(Continued)
FOR THE YEARS ENDED DECEMBER 31, 2010, 2011 AND 2012
(In U.S. dollars in thousands, except share and per share data, or otherwise noted)
2. SUMMARY OF SIGNIFICANT ACCOUNTING POLICIES – (Continued)
Variable interest entity – (Continued)
Trademark and Software Licensing Agreement: Pursuant to the trademark and software licensing agreement between iSoftStone WFOE and Beijing iSoftStone, iSoftStone WFOE agreed to license its trademarks, software copyrights and domain names to Beijing iSoftStone on a non-exclusive basis. Beijing iSoftStone would pay licensing fees in a lump sum equal to the revenue realizable under the business contracts of Beijing iSoftStone that are not subcontracted to iSoftStone WFOE and that are not otherwise paid to iSoftStone WFOE pursuant to the aforesaid exclusive technology consulting and management service agreement. The trademark and software licensing agreement is currently effective and has a term of three years from its signing date and is renewable for an unlimited number of times for three years unless terminated upon written agreement by the parties.
Irrevocable Power of Attorney: The shareholders of Beijing iSoftStone executed an irrevocable power of attorney to appoint iSoftStone WFOE or iSoftStone WFOE’s designee as their attorney-in-fact to attend shareholders’ meeting of Beijing iSoftStone and to vote on their behalf. The power of attorney granted by the shareholders of Beijing iSoftStone remains valid until the earlier of (a) the dissolution of Beijing iSoftStone, and (b) the related shareholders ceasing to be the shareholders of Beijing iSoftStone.
Through a series of contractual arrangements, iSoftStone WFOE is the primary beneficiary of the VIE and the Company has consolidated the financial results of the VIE in its consolidated financial statements since the date of inception of Beijing iSoftStone.
The VIE generated limited net revenues from providing services to primarily PRC state-owned entities which are not permitted to receive certain services from foreign owned entities such as the Company and iSoftStone WFOE.
The following financial statements amounts and balances of the VIE were included in the accompanying consolidated financial statements as of and for the years ended December 31:
| | | | | | | | |
| | | As of December 31, | |
| | | 2011 | | | 2012 | |
Total current assets | | $ | 126 | | | $ | 136 | |
| | | | | | | | |
Total assets | | | 126 | | | | 136 | |
| | | | | | | | |
Total current liabilities | | | (60 | ) | | | (61 | ) |
| | | | | | | | |
Total liabilities | | $ | (60 | ) | | $ | (61 | ) |
| | | | | | | | |
| | | | | | | | | | | | |
| | | Years ended December 31, | |
| | | 2010 | | | 2011 | | | 2012 | |
Net revenues | | $ | 123 | | | $ | 30 | | | $ | 9 | |
Net loss | | $ | (15 | ) | | $ | (142 | ) | | $ | (109 | ) |
| | | | | | | | | | | | |
| | | | | | | | | | | | |
| | | Years ended December 31, | |
| | | 2010 | | | 2011 | | | 2012 | |
Net cash provided by (used in) operating activities | | $ | 131 | | | $ | (37 | ) | | $ | (2 | ) |
Net cash used in investing activities | | $ | — | | | $ | — | | | $ | — | |
Net cash provided by financing activities | | $ | — | | | $ | — | | | $ | — | |
| | | | | | | | | | | | |
No assets of the VIE are collateral for VIE’s obligations. There are no restrictions on the use of the VIE’s assets to settle the Company’s obligations. As of December 31, 2011 and 2012, none of the VIE’s liabilities have recourse to the Company.
F-16
ISOFTSTONE HOLDINGS LIMITED
NOTES TO THE CONSOLIDATED FINANCIAL STATEMENTS—(Continued)
FOR THE YEARS ENDED DECEMBER 31, 2010, 2011 AND 2012
(In U.S. dollars in thousands, except share and per share data, or otherwise noted)
2. SUMMARY OF SIGNIFICANT ACCOUNTING POLICIES – (Continued)
Use of estimates
The preparation of consolidated financial statements in conformity with U.S. GAAP requires management to make estimates and assumptions that affect the reported amounts of assets and liabilities, revenue and expenses in the financial statements and accompanying notes. Actual results could differ from those estimates. Significant accounting estimates reflected in the Group’s consolidated financial statements include, but are not limited to, revenue recognition, income taxes, collectability of accounts receivable, impairment of goodwill, estimated useful lives and impairment of property and equipment and intangible assets, contingent consideration in relation to business combinations, share-based compensation and fair value of ordinary shares.
Cash and cash equivalents
Cash and cash equivalents consist of cash on hand and highly liquid investments, which are unrestricted as to withdrawal or use, and which have remaining maturities of three months or less when purchased.
Restricted cash
Restricted cash represents the security deposits with certain Chinese banks who issue bank accepted drafts for the purpose of settlement of trading purchases with the Company’s suppliers. The restriction normally lasts for a period of three to six months.
Fair value
Fair value is the price that would be received from selling an asset or paid to transfer a liability in an orderly transaction between market participants at the measurement date. When determining the fair value measurements for assets and liabilities required or permitted to be recorded at fair value, the Group considers the principal or most advantageous market in which it would transact and it considers assumptions that market participants would use when pricing the asset or liability. Authoritative literature provides a fair value hierarchy which prioritizes the inputs to valuation techniques used to measure fair value into three broad levels.
The level in the hierarchy within which the fair value measurement in its entirety falls is based upon the lowest level of input that is significant to the fair value measurement as follows:
Level 1
Level 1 applies to assets or liabilities for which there are quoted prices in active markets for identical assets or liabilities.
Level 2
Level 2 applies to assets or liabilities for which there are inputs other than quoted prices included within Level 1 that are observable for the asset or liability such as quoted prices for similar assets or liabilities in active markets; quoted prices for identical assets or liabilities in markets with insufficient volume or infrequent transactions (less active markets); or model-derived valuations in which significant inputs are observable or can be derived principally from, or corroborated by, observable market data.
Level 3
Level 3 applies to assets or liabilities for which there are unobservable inputs to the valuation methodology that are significant to the measurement of the fair value of the assets or liabilities.
F-17
ISOFTSTONE HOLDINGS LIMITED
NOTES TO THE CONSOLIDATED FINANCIAL STATEMENTS—(Continued)
FOR THE YEARS ENDED DECEMBER 31, 2010, 2011 AND 2012
(In U.S. dollars in thousands, except share and per share data, or otherwise noted)
2. SUMMARY OF SIGNIFICANT ACCOUNTING POLICIES – (Continued)
Financial instruments
The Group’s financial instruments mainly include cash, restricted cash, accounts receivable, accounts payable, amounts due from/and to related parties, short term borrowings, long term investments, contingent consideration payable in connection with business acquisitions, warrants and convertible notes.
The carrying values of cash, restricted cash, accounts receivable, accounts payable, and amounts due from/and to related parties approximate their fair values due to short-term maturities.
The carrying amounts of short term borrowings approximate their fair values as the borrowings bear variable interest rates which approximate the market interest rate.
Long-term investments have been written down to their fair value, as discussed in Note 6.
Contingent consideration payable in connection with business acquisitions, the warrants to issue series B convertible redeemable shares and return rate reset and conversion right derivatives embedded in the convertible notes were carried at fair value.
Allowance for doubtful accounts
Accounts receivable represents those receivables derived in the ordinary course of business. The Group conducts credit evaluations of clients and generally do not require collateral or other security from their clients. The Group establishes an allowance for doubtful accounts based upon estimates, historical experience and other factors surrounding the credit risk of specific clients.
Property and equipment, net
Property and equipment, net, are stated at cost less accumulated depreciation and amortization. Depreciation and amortization are provided using the straight-line method over the following estimated useful lives:
| | | | |
Building | | | 45 years | |
Computers and software | | | 3 – 5 years | |
Furniture and office equipment | | | 5 – 17 years | |
Motor vehicles | | | 5 years | |
Leasehold improvements | |
| the shorter of lease terms or the
estimated useful lives |
|
Depreciation and amortization of these assets, on the same basis as other property assets, commences when the assets are ready for their intended use.
F-18
ISOFTSTONE HOLDINGS LIMITED
NOTES TO THE CONSOLIDATED FINANCIAL STATEMENTS—(Continued)
FOR THE YEARS ENDED DECEMBER 31, 2010, 2011 AND 2012
(In U.S. dollars in thousands, except share and per share data, or otherwise noted)
2. SUMMARY OF SIGNIFICANT ACCOUNTING POLICIES – (Continued)
Long term investments
Investee companies over which the Group has the ability to exercise significant influence, but does not have a controlling interest are accounted for using the equity method. Significant influence is generally considered to exist when the Group has an ownership interest in the voting shares of the investee between 20% and 50%, and other factors, such as representation in the investee’s Board of Directors, voting rights and the impact of commercial arrangements, are considered in determining whether the equity method of accounting is appropriate.
Investee companies over which the Group has no ability to exercise significant influence, nor has a controlling interest are accounted for using the cost method. No significant influence is generally considered to exist when the Group has an ownership interest in the voting stock of the investee less than 20% are considered in determining whether the cost method of accounting is appropriate.
An impairment charge is recorded when the carrying amount of the investment exceeds its fair value and this condition is determined to be other-than-temporary.
Business combination
Business combinations are recorded using the purchase method of accounting.
The assets acquired, the liabilities assumed, and any noncontrolling interest of the acquiree at the acquisition date, if any, are measured at their fair values as of that date. Goodwill is recognized and measured as the excess of the total consideration transferred plus the fair value of any noncontrolling interest of the acquiree, if any, at the acquisition date over the fair values of the identifiable net assets acquired.
Common forms of the consideration made in acquisitions include cash and common equity instruments. Consideration transferred in a business acquisition is measured at the fair value as at the date of acquisition. For shares issued in a business combination, the Group had estimated the fair value as of the date of acquisition before the Company’s shares became publicly traded.
Where the consideration in an acquisition includes contingent consideration, the payment of which depends on the achievement of certain specified conditions post-acquisition, the contingent consideration is recognized and measured at its fair value at the acquisition date, and if recorded as a liability, it is subsequently carried at fair value with changes in fair value reflected in earnings.
Acquired intangible assets with finite lives
The Group measured the fair value of the purchased intangible assets arising from acquisitions using the “cost,” “income approach-excess earnings” and “with & without” valuation method. In performing the purchase price allocation, the Group considered, among other factors, forecasted financial performance of the acquired business, market performance, and the market potential of the acquired business. These purchased intangible assets and contingent consideration are considered Level 3 assets and liabilities because the Group used unobservable inputs, reflecting the Group’s assessment of the assumptions market participants would use in valuing these assets and liabilities.
Customer base and part of software copyright is amortized using the estimated attrition pattern of the acquired intangible assets. The weighted average amortization period in total is 4.5 years. Contract backlog, non-compete agreements and trademark are amortized using the straight-line method over the following estimated economic lives:
| | | | |
Customer base | | | 1.8 – 6 years | |
Contract backlog | | | 0.3 – 1.3 years | |
Non-compete agreements | | | 3 – 5 years | |
Trademark | | | 4.4 years | |
Software copyright | | | 1 – 5 years | |
F-19
ISOFTSTONE HOLDINGS LIMITED
NOTES TO THE CONSOLIDATED FINANCIAL STATEMENTS—(Continued)
FOR THE YEARS ENDED DECEMBER 31, 2010, 2011 AND 2012
(In U.S. dollars in thousands, except share and per share data, or otherwise noted)
2. SUMMARY OF SIGNIFICANT ACCOUNTING POLICIES – (Continued)
Land use right
All land in the PRC is owned by the PRC government, which, according to the relevant PRC law, may grant the right to use the land for a specified period of time. Payment for acquiring land use right is stated at cost less accumulated amortization and any recognized impairment loss. Amortization is provided on a straight-line basis over the term of the land use right.
Impairment of long-lived assets with finite lives
The Group evaluates its long-lived assets or asset group including intangibles with definite lives for impairment whenever events or changes in circumstances (such as a significant adverse change to market conditions that will impact the future use of the assets) indicate that the carrying amount of a group of long-lived assets may not be fully recoverable. When these events occur, the Group evaluates the impairment by comparing the carrying amount of the assets to future undiscounted net cash flows expected to result from the use of the assets and their eventual disposition. If the sum of the expected undiscounted cash flows is less than the carrying amount of the assets, the Group recognizes an impairment loss based on the excess of the carrying amount of the asset group over its fair value, generally based upon discounted cash flows.
There were no impairment losses during the years ended December 31, 2010, 2011 and 2012.
Goodwill and impairment of goodwill
The excess of the purchase price over the fair value of net assets acquired is recorded on the consolidated balance sheet as goodwill. Goodwill is not amortized but is tested for impairment annually or more frequently if events or changes in circumstances indicate that it might be impaired.
Goodwill is tested for impairment at the reporting unit level on an annual basis and between annual tests if an event occurs or circumstances change that would more likely than not reduce the fair value of a reporting unit below its carrying value. These events or circumstances could include a significant change in the stock prices, business climate, legal factors, operating performance indicators, competition, or sale or disposition of a significant portion of a reporting unit.
Application of the goodwill impairment test requires judgment, including the identification of reporting units, assignment of assets and liabilities to reporting units, assignment of goodwill to reporting units, and determination of the fair value of each reporting unit. The estimation of fair value of each reporting unit using a discounted cash flow methodology also requires significant judgments, including estimation of future cash flows, which is dependent on internal forecasts, estimation of the long-term rate of growth for the Group’s business, estimation of the useful life over which cash flows will occur, and determination of the Group’s weighted average cost of capital. The estimates used to calculate the fair value of a reporting unit change from year to year based on operating results and market conditions. Changes in these estimates and assumptions could materially affect the determination of fair value and goodwill impairment for the reporting unit.
In September 2011, the FASB issued an authoritative pronouncement related to testing goodwill for impairment. The guidance permits to first assess qualitative factors to determine whether it is “more likely than not” that the fair value of a reporting unit is less than its carrying amount as a basis for determining whether it is necessary to perform the two-step goodwill impairment test. The Group adopted this pronouncement in 2012. If it is more likely than not that the fair value of a reporting unit is less than its carrying amount, goodwill is then tested following a two-step process. The first step compares the fair value of each reporting unit to its carrying amount, including goodwill. If the fair value of each reporting unit exceeds its carrying amount, goodwill is not considered to be impaired and the second step will not be required. If the carrying amount of a reporting unit exceeds its fair value, the second step compares the implied fair value of goodwill to the carrying value of a reporting unit’s goodwill. The implied fair value of goodwill is determined in a manner similar to accounting for a business combination with the allocation of the assessed fair value determined in the first step to the assets and liabilities of the reporting unit. The excess of the fair value of the reporting unit over the amounts assigned to the assets and liabilities is the implied fair value of goodwill. An impairment loss is recognized for any excess in the carrying value of goodwill over the implied fair value of goodwill. The Group recognized no impairment loss on goodwill in 2010, 2011 and 2012.
F-20
ISOFTSTONE HOLDINGS LIMITED
NOTES TO THE CONSOLIDATED FINANCIAL STATEMENTS—(Continued)
FOR THE YEARS ENDED DECEMBER 31, 2010, 2011 AND 2012
(In U.S. dollars in thousands, except share and per share data, or otherwise noted)
2. SUMMARY OF SIGNIFICANT ACCOUNTING POLICIES – (Continued)
Research and development expenses
Research and development costs are expensed as incurred unless technical and commercial feasibility of the project is demonstrated, future economic benefits are probable. To date, costs incurred after technological feasibility was established and prior to completion of software development have not been material, and accordingly, the Group has expensed all research and development expenses when incurred. Research and development costs and software development costs incurred under contractual arrangements with customers are accounted for as cost of revenues.
Revenue recognition
The Group provides a comprehensive range of IT services and solutions, categorized into three business lines: (i) IT services; (ii) Consulting and Solution services; and (iii) BPO services. The rights to software developed by the Group on behalf of its clients belong to the clients and the Group does not have the option to acquire such rights from its clients. The Group provided services on a time-and-expense basis, a fixed-price basis or, with respect to some BPO services, on a volume basis.
Revenue is considered realizable and earned when all of the following criteria are met: persuasive evidence of a sales arrangement exists; delivery has occurred or services have been rendered; the price is fixed or determinable; and collectability is reasonably assured.
Time-and-expense basis contracts
Revenues from time-and-expense basis contracts are recognized as the related services are rendered assuming all other basic revenue recognition criteria are met. Under time-and-expense basis contracts, the Group is reimbursed for actual hours incurred at negotiated hourly billing rates. Clients may terminate the contracts at any time before the work is completed but are obligated to pay the actual service hours incurred through the termination date at the contract billing rate. Net revenues recognized for time-and-expense basis contracts totaled $79,366, $107,261 and $142,474 for the years ended December 31, 2010, 2011 and 2012, respectively.
F-21
ISOFTSTONE HOLDINGS LIMITED
NOTES TO THE CONSOLIDATED FINANCIAL STATEMENTS—(Continued)
FOR THE YEARS ENDED DECEMBER 31, 2010, 2011 AND 2012
(In U.S. dollars in thousands, except share and per share data, or otherwise noted)
2. SUMMARY OF SIGNIFICANT ACCOUNTING POLICIES – (Continued)
Revenue recognition – (Continued)
Fixed-price basis contracts
Revenues from fixed-price basis contracts require the Group to perform services throughout the contractual period, which are generally less than two years. Revenues from this type of arrangements are generally recognized using the proportional performance method based on the proportion of direct labor costs incurred to the budgeted direct labor costs. The Group recognizes cost of revenues for labor and other costs on actual basis with no deferral of project costs. The Group believes it can reasonably estimate the service hours expected to be incurred on each project and there is no retention provisions based on the Group’s historic experience. To date, the Group has not incurred a material loss on any contracts. However, as a policy, provisions for estimated losses on such engagements will be made during the period in which a loss becomes probable and can be reasonably estimated.
Net revenues recognized for fixed-price basis contracts totaled $115,835, $172,695 and $235,877 for the years ended December 31, 2010, 2011 and 2012, respectively.
Volume basis contracts
For volume basis contracts, the Group recognizes service revenues based on the volume of the transactions processed for the clients and a pre-agreed unit price for each type of process. Net revenues recognized for volume basis contracts totaled $1,774, $3,461 and $2,793 for the years ended December 31, 2010, 2011 and 2012, respectively.
Business tax and value added taxes
The Group’s PRC subsidiaries are subject to business tax at rate of 5% and related surcharges of total revenues for certain type of contracts. Certain services contracts are exempted from business tax in accordance with the PRC tax laws. Business tax is recorded as a reduction in revenues when incurred.
In November 2011, the Ministry of Finance and the State Administration of Taxation jointly issued circulars No. 110 and No. 111 regarding the pilot collection of VAT in lieu of business tax in certain industries in Shanghai. In July 2012, China’s State Council that the VAT reform pilot program in Shanghai will be expanded to eight provinces/cities. The Ministry of Finance and the State Administration of Taxation jointly issued a circular No. 71 in July 2012 that formally sets out the timetable for, and scope of, the expanded program. Such VAT pilot program was phased in Beijing, Jiangsu, Anhui, Fujian, Guangdong, Tianjin, Zhejiang, and Hubei between September and December 2012. Effective from January 1, 2012, Shanghai Kangshi became subject to VAT at the rate of 6%, on certain service revenues which were previously subject to business tax. From September 1 to December 31 2012, WOFE, iSoftstone Wuxi, iSoftstone Guangzhou, iSoftstone Tianjin and WX-Shanghai also became subject to the VAT at the rate of 6% on certain service revenues which were previously subject to business tax.
Value added taxes rebate revenues
The Group receives value added taxes (“VAT”) rebates from tax authority as an incentive to encourage certain high-tech industries. VAT rebates are recorded as revenue when the Group pays the relevant VAT and properly files the rebate application to tax authority when the related rebates become receivable. The Group has recorded $240, $77 and $16 of VAT rebate in revenue for the years ended December 31, 2010, 2011 and 2012, respectively. The VAT rebate revenues are classified into the relevant revenue categories.
F-22
ISOFTSTONE HOLDINGS LIMITED
NOTES TO THE CONSOLIDATED FINANCIAL STATEMENTS—(Continued)
FOR THE YEARS ENDED DECEMBER 31, 2010, 2011 AND 2012
(In U.S. dollars in thousands, except share and per share data, or otherwise noted)
2. SUMMARY OF SIGNIFICANT ACCOUNTING POLICIES – (Continued)
Government subsidies
Government subsidies include amounts granted by local government authorities to encourage the employment of new college graduates and other purposes. Government subsidies are recorded as receivables when the approval is obtained from the local government authorities and the Group has the right to receive the subsidies, when historically the expenses that the subsidies intended to compensate normally have incurred by the Company. Subsidies to encourage employment of new college graduates are recognized in the statement of operations as deductions to the cost of revenues and related expenses, primarily costs of revenues. Subsidies for other purposes are recognized as other operating income because the subsidies are not intended to compensate for specific expenditure. For the years ended December 31, 2010, 2011 and 2012, the Group recognized government subsidies as a reduction to costs of revenues of $6,133, $9,277 and $13,845, respectively, as a reduction to operating expenses of $1,569, $3,054 and $3,192, respectively, and as other operating income of $3,269, $1,840 and $1,110, respectively.
Operating leases
Leases where substantially all the rewards and risks of ownership of assets remain with the lessor are accounted for as operating lease. Payments made under operating leases are charged to the consolidated statements of operations on a straight-line basis over the lease periods.
Advertising costs
Advertising costs are expensed as incurred and such expenses were minimal for the periods presented. Advertising costs have been included as part of selling and marketing expenses.
Income taxes
Current income taxes are provided for in accordance with the laws of the relevant tax authorities. Deferred income taxes are recognized for temporary differences between the tax bases of assets and liabilities and their reported amounts in the financial statements. Net operating loss carry forwards and credits are applied using enacted statutory tax rates applicable to future years. Deferred tax assets are reduced by a valuation allowance when, in the opinion of management, it is more likely than not that some portion or all of the deferred tax assets will not be realized. The components of the deferred tax assets and liabilities are individually classified as current and non-current based on their characteristics.
The impact of an uncertain income tax position on the income tax return is recognized at the largest amount that is more-likely-than-not to be sustained upon audit by the relevant tax authority. An uncertain income tax position will not be recognized if it has less than a 50% likelihood of being sustained. Interest and penalties on income taxes are classified as a component of the provisions for income taxes.
Foreign currency translation
The functional and reporting currency of the Company is the United States dollar (“U.S. dollar”). The financial records of the Group’s subsidiaries and VIE located in the PRC, Japan, Hong Kong, Taiwan, Korea, Canada and the United States are maintained in their local currencies, the Renminbi (“RMB”), Japanese Yen (“Yen”), Hong Kong Dollars (“HK$”), Taiwan Dollars (“NT$”), Korea Won (“WON”), Canadian Dollars (“CAD”) and U.S. Dollars (“US$”), respectively, which are also the functional currencies of these entities.
Monetary assets and liabilities denominated in currencies other than the functional currency are translated into the functional currency at the prevailing rates of exchange on the balance sheet date. Transactions in currencies other than the functional currency during the year are converted into functional currency at the applicable rates of exchange prevailing when the transactions occurred. Transaction gains and losses are recognized in the statements of operations.
The Group’s entities with functional currency of RMB, Yen, HK$, NT$, WON and CAD translate their operating results and financial position into the U.S. dollar, the Group’s reporting currency, based on the exchange rates quoted by the Federal Reserve Bank of New York. Assets and liabilities are translated using the exchange rates in effect on the balance sheet date. Revenues, expenses, gains and losses are translated using the average rate for the year. Translation adjustments are report as cumulative translation adjustments and are shown as a separate component of the other comprehensive income.
F-23
ISOFTSTONE HOLDINGS LIMITED
NOTES TO THE CONSOLIDATED FINANCIAL STATEMENTS—(Continued)
FOR THE YEARS ENDED DECEMBER 31, 2010, 2011 AND 2012
(In U.S. dollars in thousands, except share and per share data, or otherwise noted)
2. SUMMARY OF SIGNIFICANT ACCOUNTING POLICIES – (Continued)
Comprehensive income (loss)
Comprehensive income (loss) is defined as the change in equity of a business enterprise during a period from transactions and other events and circumstances from non-owner sources and is presented in our Consolidated Statements of Comprehensive Income. Accumulated other comprehensive income (net of tax) at fiscal 2011 and fiscal 2012 year-ends are substantially comprised of accumulated foreign currency translation adjustments.
Share-based compensation
The Group grants share options to its employees for retention and incentive purposes. The value of the share options is measured based on the fair value on the grant date. The Group recognizes compensation costs, net of a forfeiture rate, on a straight-line basis over the requisite service period, which is generally the vesting period of the award in accordance with the graded vesting schedule. The amount of compensation expenses recognized for any period is not less than the portion of the fair value of the options vested during that period. The estimate of forfeiture rate is adjusted over the requisite service period to the extent that actual forfeiture rate differs, or are expected to differ, from such estimates. Changes in estimated forfeiture rate are recognized through a cumulative true-up adjustment in the period of change and will impact the amount of share-based compensation expense to be recognized in future periods.
Shares awards issued to non-employees, such as consultants, are measured at fair value at the earlier of the commitment date or the date the service is completed, and are recognized over the period the service is provided in accordance with the graded vesting schedule.
Net income per share
Basic net income per ordinary share is computed by dividing net income attributable to ordinary shareholders by the weighted average number of ordinary shares outstanding during the period.
Diluted net income per ordinary share reflects the potential dilution that could occur if securities or other contracts to issue ordinary shares were exercised or converted into ordinary shares.
The Group’s convertible preference shares and certain nonvested shares were participating securities, as the preference shares participated in undistributed earnings on an as-if-converted basis and certain nonvested shares were entitled to dividend right before vesting. Accordingly, the Group used the two-class method whereby undistributed net income was allocated on a pro rata basis to the ordinary, preference shares and certain nonvested shares to the extent that each class might share income for the period, whereas the undistributed net loss was allocated to ordinary shares and certain nonvested shares because preference shares were not contractually obligated to share the loss.
The Group has convertible preference shares, convertible redeemable preference shares, share options, nonvested shares, warrants, convertible notes, and potentially issuable ordinary shares whose issuance is contingent upon the satisfaction of certain conditions in connection with business acquisitions, which could potentially dilute basic earnings per share in the future. To calculate the number of shares for diluted income per share, the effect of the convertible preference shares and convertible redeemable preference shares is computed using the as-if-converted method; the effect of the warrants and share options is computed using the treasury stock method.
F-24
ISOFTSTONE HOLDINGS LIMITED
NOTES TO THE CONSOLIDATED FINANCIAL STATEMENTS—(Continued)
FOR THE YEARS ENDED DECEMBER 31, 2010, 2011 AND 2012
(In U.S. dollars in thousands, except share and per share data, or otherwise noted)
2. SUMMARY OF SIGNIFICANT ACCOUNTING POLICIES – (Continued)
Significant risks and uncertainties
Foreign currency risk
RMB is not freely convertible into other currencies. All foreign exchange transactions involving RMB must take place through the People’s Bank of China or other institutions authorized to buy and sell foreign currency. The exchange rate adopted for the foreign exchange transactions are the rates of exchange quoted by the People’s Bank of China that are determined largely by supply and demand. The Group’s cash balances in RMB as of December 31, 2010, 2011 and 2012 were RMB350,501,290, RMB473,192,669 and RMB531,962,381 respectively.
During the periods, the Group incurred foreign currency risk mainly on sales denominated in US$, and Japanese Yen. The Group did not enter into any foreign exchange forward contracts to hedge against exchange rate fluctuations.
Concentration of credit risk
Financial instruments that potentially expose the Group to concentration of credit risk consist primarily of cash and accounts receivable.
The Group places its cash with financial institutions with high credit ratings and quality.
The Group has relatively high concentration of revenues with certain clients. Clients accounting for 10% or more of total net revenues are as follows:
| | | | | | | | | | | | | | | | | | | | | | | | |
| | | For the year ended December 31, | |
| | | 2010 | | | 2011 | | | 2012 | |
| | | Amount | | | % | | | Amount | | | % | | | Amount | | | % | |
Client A | | $ | 48,670 | | | | 25 | | | $ | 65,406 | | | | 23 | | | $ | 98,774 | | | | 26 | |
| | | | | | |
Client B | | $ | 24,739 | | | | 13 | | | $ | 24,907 | | | | 9 | | | $ | 30,432 | | | | 8 | |
Clients accounting for 10% or more of accounts receivable are as follows:
| | | | | | | | | | | | | | | | |
| | | As of December 31, | |
| | | 2011 | | | 2012 | |
| | | Amount | | | % | | | Amount | | | % | |
Client A | | $ | 45,131 | | | | 30 | | | $ | 59,734 | | | | 30 | |
Contingencies
Certain conditions may exist as of the date the financial statements are issued, which may result in a loss to the Group but which will only be resolved when one or more future events occur or fail to occur. The Group’s management and its legal counsel assess such contingent liabilities, and such assessment inherently involves an exercise of judgment. In assessing loss contingencies related to legal proceedings that are pending against the Group or unasserted claims that may result in such proceedings, the Group’s legal counsel evaluates the perceived merits of any legal proceedings or unasserted claims as well as the perceived merits of the amount of relief sought or expected to be sought therein.
If the assessment of a contingency indicates that it is probable that a material loss has been incurred and the amount of the liability can be estimated, then the estimated liability would be accrued in the Group’s financial statements. If the assessment indicates that a potentially material loss contingency is not probable, but is reasonably possible, or is probable but cannot be estimated, then the nature of the contingent liability, together with an estimate of the range of possible loss if determinable and material, would be disclosed.
Loss contingencies considered remote are generally not disclosed unless they involve guarantees, in which case the nature of the guarantee would be disclosed.
F-25
ISOFTSTONE HOLDINGS LIMITED
NOTES TO THE CONSOLIDATED FINANCIAL STATEMENTS—(Continued)
FOR THE YEARS ENDED DECEMBER 31, 2010, 2011 AND 2012
(In U.S. dollars in thousands, except share and per share data, or otherwise noted)
2. SUMMARY OF SIGNIFICANT ACCOUNTING POLICIES – (Continued)
Newly adopted accounting pronouncements
In May 2011, the FASB issued an authoritative pronouncement on fair value measurement. The guidance is the result of joint efforts by the FASB and International Accounting Standards Board to develop a single, converged fair value framework. The guidance is largely consistent with existing fair value measurement principles in US GAAP. The guidance expands the existing disclosure requirements for fair value measurements and makes other amendments, mainly including:
| | • | | Highest-and-best-use and valuation-premise concepts for nonfinancial assets—the guidance indicates that the highest-and-best-use and valuation-premise concepts only apply to measuring the fair value of nonfinancial assets. |
| | • | | Application to financial assets and financial liabilities with offsetting positions in market risks or counterparty credit risk—the guidance permits an exception to fair value measurement principles for financial assets and financial liabilities (and derivatives) with offsetting positions in market risks or counterparty credit risk when several criteria are met. When the criteria are met, an entity can measure the fair value of the net risk position. |
| | • | | Premiums or discounts in fair value measure—the guidance provides that premiums or discounts that reflect size as a characteristic of the reporting entity’s holding (specifically, a blockage factor that adjusts the quoted price of an asset or a liability because the market’s normal daily trading volume is not sufficient to absorb the quantity held by the entity) rather than as a characteristic of the asset or liability (for example, a control premium when measuring the fair value of a controlling interest) are not permitted in a fair value measurement. |
| | • | | Fair value of an instrument classified in a reporting entity’s stockholders’ equity—the guidance prescribes a model for measuring the fair value of an instrument classified in stockholders’ equity; this model is consistent with the guidance on measuring the fair value of liabilities. |
| | • | | Disclosures about fair value measurements—the guidance expands disclosure requirements, particularly for Level 3 inputs. Required disclosures include: |
| | (i) | For fair value measurements categorized in Level 3 of the fair value hierarchy: (1) a quantitative disclosure of the unobservable inputs and assumptions used in the measurement, (2) a description of the valuation process in place (e.g., how the entity decides its valuation policies and procedures, as well as changes in its analyses of fair value measurements, from period to period), and (3) a narrative description of the sensitivity of the fair value to changes in unobservable inputs and interrelationships between those inputs. |
| | (ii) | The level in the fair value hierarchy of items that are not measured at fair value in the statement of financial position but whose fair value must be disclosed. |
The guidance is to be applied prospectively and is effective for interim and annual periods beginning after December 15, 2011, for public entities. Early application by public entities is not permitted. The adoption of this guidance did not have a significant effect on the Company’s consolidated financial statements.
In June 2011, the FASB issued an authoritative pronouncement to require an entity to present the total of comprehensive income, the components of net income, and the components of other comprehensive income either in a single continuous statement of comprehensive income or in two separate but consecutive statements. In both choices, an entity is required to present each component of net income along with total net income, each component of other comprehensive income along with a total for other comprehensive income, and a total amount for comprehensive income. The guidance eliminates the option to present the components of other comprehensive income as part of the statement of changes in stockholders’ equity. The guidance does not change the items that must be reported in other comprehensive income or when an item of other comprehensive income must be reclassified to net income. The guidance should be applied retrospectively. For public entities, the guidance is effective for fiscal years and interim periods within those years, beginning after December 15, 2011. Early adoption is permitted. In December 2011, the FASB issued an authoritative pronouncement related to deferral of the effective date for amendments to the presentation of reclassifications of items out of accumulated other comprehensive income. This guidance allows the FASB to redeliberate whether to present on the face of the financial statements the effects of reclassifications out of accumulated other comprehensive income on the components of net income and other comprehensive income for all periods presented. While the FASB is considering the operational concerns about the presentation requirements for reclassification adjustments and the needs of financial statement users for additional information about reclassification adjustments, entities should continue to report reclassifications out of accumulated other comprehensive income consistent with the presentation requirements in effect before update the pronouncement issued in June 2011. The Group has adopted this guidance on January 1, 2012 and has separately presented the consolidated statements of comprehensive income since that date.
F-26
ISOFTSTONE HOLDINGS LIMITED
NOTES TO THE CONSOLIDATED FINANCIAL STATEMENTS—(Continued)
FOR THE YEARS ENDED DECEMBER 31, 2010, 2011 AND 2012
(In U.S. dollars in thousands, except share and per share data, or otherwise noted)
2. SUMMARY OF SIGNIFICANT ACCOUNTING POLICIES – (Continued)
Newly adopted accounting pronouncements – (Continued)
In September 2011, the FASB issued an authoritative pronouncement related to testing goodwill for impairment. The guidance is intended to simplify how entities, both public and nonpublic, test goodwill for impairment. The guidance permits an entity to first assess qualitative factors to determine whether it is “more likely than not” that the fair value of a reporting unit is less than its carrying amount as a basis for determining whether it is necessary to perform the two-step goodwill impairment test. The guidance is effective for annual and interim goodwill impairment tests performed for fiscal years beginning after December 15, 2011. Early adoption is permitted, including for annual and interim goodwill impairment tests performed as of a date before September 15, 2011, if a public entity’s financial statements for the most recent annual or interim period have not yet been issued. The adoption of this pronouncement did not have a significant effect on the Group’s consolidated financial statements for their annual impairment test.
In July 2012, the FASB issued an authoritative pronouncement related to testing indefinite-lived intangible assets, other than goodwill, for impairment. Under the guidance, an entity testing an indefinite-lived intangible asset for impairment has the option of performing a qualitative assessment before calculating the fair value of the asset. If the entity determines, on the basis of qualitative factors, that the fair value of the indefinite-lived intangible asset is not more likely than not (i.e., a likelihood of more than 50 percent) impaired, the entity would not need to calculate the fair value of the asset. The guidance does not revise the requirement to test indefinite-lived intangible assets annually for impairment. In addition, the guidance does not amend the requirement to test these assets for impairment between annual tests if there is a change in events or circumstances; however, it does revise the examples of events and circumstances that an entity should consider in interim periods. The guidance was effective for annual and interim impairment tests performed for fiscal years beginning after September 15, 2012. Early adoption is permitted. The adoption of this guidance did not have a significant effect on the Group’s consolidated financial statements.
Recent accounting pronouncements not yet adopted
In December 2011, the FASB has issued an authoritative pronouncement related to Disclosures about Offsetting Assets and Liabilities. The guidance requires an entity to disclose information about offsetting and related arrangements to enable users of its financial statements to understand the effect of those arrangements on its financial position. An entity is required to apply the amendments for annual reporting periods beginning on or after January 1, 2013, and interim periods within those annual periods. An entity should provide the disclosures required by those amendments retrospectively for all comparative periods presented. The Group is in the process of evaluating the effect of adoption of this guidance on its consolidated financial statements.
F-27
ISOFTSTONE HOLDINGS LIMITED
NOTES TO THE CONSOLIDATED FINANCIAL STATEMENTS—(Continued)
FOR THE YEARS ENDED DECEMBER 31, 2010, 2011 AND 2012
(In U.S. dollars in thousands, except share and per share data, or otherwise noted)
3. ACQUISITIONS
(a) Acquisition of business of Wuxi Huayang
On July 1, 2007, the Group acquired the operating assets and liabilities of Wuxi Huayang, including a 49% noncontrolling interest in Wuxi iSoftStone for the purpose of establishing a service delivery center in Wuxi, with an initial cash consideration of $779, which was paid in 2007.
The transaction was accounted for as a business combination using the purchase method of accounting. The purchase price allocation of the transaction, based on the initial consideration, was determined by the Group with the assistance of American Appraisal China Limited, an independent valuation firm, and the purchase price allocation to assets acquired and liabilities assumed as of the date of acquisition is as follows:
| | | | | | | | |
| | | | | | Estimated
useful lives | |
Intangible assets acquired: | | | | | | | | |
Customer base | | $ | 213 | | | | 3.5 years | |
Contract backlog | | | 74 | | | | 1.3 years | |
Non-compete agreement | | | 15 | | | | 5 years | |
Goodwill | | | 401 | | | | | |
Deferred tax liabilities | | | (36 | ) | | | | |
Noncontrolling interest | | | 112 | | | | | |
| | | | | | | | |
Total consideration | | $ | 779 | | | | | |
| | | | | | | | |
An additional cash consideration, based on the performance of the acquired business in 2007 and 2008 was subsequently determined to be $1,107, which was paid in 2009. The additional consideration was recorded as an addition to the goodwill in 2009.
The Group is also obligated to pay additional performance-based cash consideration at twice the audited net income of the acquired business for the period from July 1, 2007 to June 30, 2010, plus $134 and less previously paid cash consideration of $1,886. In October 2010, the Group entered into a settlement agreement with the selling shareholders and fixed the additional cash consideration at $674, of which, $629 and $45 were paid in December 2010 and August 2011, and was recorded as an addition to the goodwill in 2010 and 2011.
The goodwill is mainly attributable to intangible assets that cannot be recognized separately as identifiable assets under U.S. GAAP, and comprise (a) the assembled work force, and (b) the expected but unidentifiable business growth as a result of the synergy resulting from the acquisition.
F-28
ISOFTSTONE HOLDINGS LIMITED
NOTES TO THE CONSOLIDATED FINANCIAL STATEMENTS—(Continued)
FOR THE YEARS ENDED DECEMBER 31, 2010, 2011 AND 2012
(In U.S. dollars in thousands, except share and per share data, or otherwise noted)
3. ACQUISITIONS – (Continued)
(b) Acquisition of business of Star
On March 1, 2009, the Group acquired the IT services business of Star, an information technology outsourcing service provider based in Shenzhen, China for the purpose of enhancing the market presence and share with a long-term service provider for Huawei.
The Group agreed to pay cash contingent consideration, primarily based on the performance of Star for the period from March 1, 2009 to February 28, 2010. The fair value of the contingent consideration of $1,596 on the acquisition date was determined by the Group with the assistance of American Appraisal China Limited, an independent valuation firm.
The transaction was accounted for as a business combination using the purchase method of accounting. The purchase price allocation of the transaction were determined by the Group with the assistance of American Appraisal China Limited, an independent valuation firm, and the purchase price allocation to assets acquired and liabilities assumed as of the date of acquisition is as follows:
| | | | | | | | |
| | | | | | Estimated
useful lives | |
Net tangible assets: | | | | | | | | |
Non-current assets | | $ | 256 | | | | | |
Intangible assets acquired: | | | | | | | | |
Customer base | | | 254 | | | | 3 years | |
Contract backlog | | | 13 | | | | 0.5 years | |
Non-compete agreements | | | 15 | | | | 5 years | |
Goodwill | | | 1,083 | | | | | |
Deferred tax liabilities | | | (25 | ) | | | | |
| | | | | | | | |
Total consideration | | $ | 1,596 | | | | | |
| | | | | | | | |
The goodwill is mainly attributable to intangible assets that cannot be recognized separately as identifiable assets under U.S. GAAP, and comprise (a) the assembled work force and (b) the expected but unidentifiable business growth as a result of the synergy resulting from the acquisition.
On December 31, 2009, the Group entered into a supplementary purchase agreement with the selling shareholders to revise the contingent consideration provision and determine the total consideration will be up to $1,528 in cash, consisting of $836 payable unconditionally, which was reclassified as deferred consideration as of December 31, 2009 and paid in 2010, and up to $692 payable upon the attainment to certain performance targets for the twelve months period ended February 28, 2010, of which $257 was paid in 2010. The fair value of the contingent consideration as of December 31, 2009 was determined as $670. The decrease in the fair value of contingent consideration payable excluding the effect of amount reclassified to deferred consideration, which was $90, was recorded as a gain of changes in fair value of contingent consideration in the consolidated statements of operations in 2009. As of December 31, 2010, there was $436 unpaid cash consideration which was paid in 2011. The increase in the fair value of contingent consideration payable, excluding the $23 payment in 2010 was recorded as a loss of changes in fair value of contingent consideration in the consolidated statements of operations in 2010. In April 2011, cash consideration of $439 was paid. The decrease in the fair value of contingent consideration payable of $2 in 2011 was recorded as a gain of changes in fair value of contingent consideration in the consolidated statements of operation in 2011.
F-29
ISOFTSTONE HOLDINGS LIMITED
NOTES TO THE CONSOLIDATED FINANCIAL STATEMENTS—(Continued)
FOR THE YEARS ENDED DECEMBER 31, 2010, 2011 AND 2012
(In U.S. dollars in thousands, except share and per share data, or otherwise noted)
3. ACQUISITIONS – (Continued)
(c) Acquisition of business of MDCL
On March 6, 2009, the Group acquired the IT services operations of MDCL for the purpose to enhance the service capability to clients located in Hong Kong and Taiwan.
The consideration consisted of an initial cash consideration of $700, which was paid in 2009, and contingent consideration up to $500 in cash and $400 in shares of the Company, primarily based on the certain performance conditions of the acquired business for the 24 months period following the date of acquisition. The contingent consideration was valued at $549 by the Group with the assistance of American Appraisal China Limited, an independent valuation firm.
The transaction was accounted for as a business combination using the purchase method of accounting. The purchase price allocation of the transaction were determined by the Group with the assistance of American Appraisal China Limited, an independent valuation firm, and the purchase price allocation to assets acquired and liabilities assumed as of the date of acquisition is as follows:
| | | | | | | | |
| | | | | | Estimated
useful lives | |
Net tangible assets: | | | | | | | | |
Current assets | | $ | 1,199 | | | | | |
Intangible assets acquired: | | | | | | | | |
Customer base | | | 78 | | | | 3 years | |
Contract backlog | | | 42 | | | | 1 year | |
Non-compete agreements | | | 7 | | | | 4 years | |
Deferred tax liabilities | | | (11 | ) | | | | |
Gain on bargain purchase | | | (66 | ) | | | | |
| | | | | | | | |
Total consideration | | $ | 1,249 | | | | | |
| | | | | | | | |
The excess of the fair value of acquired net assets over fair value of the consideration as of acquisition was at $66, which was recognized as a gain on bargain purchase in the consolidated statement of operations in 2009.
The changes in fair value of the contingent consideration from date of acquisition to December 31, 2009 was determined to be an increase in liability of $93, which was recognized in the consolidated statement of operations in 2009.
In 2010, the Group settled the contingent consideration with the selling shareholders of MDCL at $266 in cash, which was paid in May and October 2010, and 242,059 ordinary shares were issued on July 30, 2010 and valued at $0.54 per share, which was estimated by the Group with the assistance of American Appraisal China Limited, an independent valuation firm. The decrease in the fair value of contingent consideration payable of $245 in 2010 was recorded as changes in fair value of contingent consideration in connection with business combination in the consolidated statements of operations in 2010.
F-30
ISOFTSTONE HOLDINGS LIMITED
NOTES TO THE CONSOLIDATED FINANCIAL STATEMENTS—(Continued)
FOR THE YEARS ENDED DECEMBER 31, 2010, 2011 AND 2012
(In U.S. dollars in thousands, except share and per share data, or otherwise noted)
3. ACQUISITIONS – (Continued)
(d) Acquisition of Ascend
On October 7, 2010, the Group acquired a 100% equity interest of Ascend, which has offices in Boston and New York City and provides IT consulting services to global banking and financial services (including insurance) clients in the U.S.
The consideration consists of cash consideration of $1,928, which was paid in 2010, and 823,846 ordinary shares of the Company which were issued on December 23, 2010 valued at $1.15 per share. In addition, the transaction also contains a contingent cash consideration arrangement based primarily on performance of the acquired business for the period from October 1, 2010 to September 30, 2011 at the minimum of $394 and maximum of $3,394. The share consideration and the contingent consideration were valued at $951 and $310, respectively, by the Group with the assistance of American Appraisal China Limited, an independent valuation firm as follows:
| | | | |
Cash consideration | | $ | 1,928 | |
Value of ordinary shares | | | 951 | |
Contingent consideration | | | 310 | |
| | | | |
Total consideration | | $ | 3,189 | |
| | | | |
The transaction was accounted for as a business combination using the purchase method of accounting. The purchase price allocation of the transaction were determined by the Group with the assistance of American Appraisal China Limited, an independent valuation firm, and the purchase price allocation to assets acquired and liabilities assumed as of the date of acquisition is as follows:
| | | | | | | | |
| | | | | | Estimated
useful lives | |
Net tangible assets: | | | | | | | | |
Cash | | $ | 312 | | | | | |
Current assets | | | 1,675 | | | | | |
Current liabilities | | | (1,344 | ) | | | | |
Non-current assets | | | 74 | | | | | |
Intangible assets acquired: | | | | | | | | |
Customer base | | | 854 | | | | 4.3 years | |
Contract backlog | | | 190 | | | | 0.3 years | |
Trademark | | | 4 | | | | 4.4 years | |
Goodwill | | | 1,801 | | | | | |
Deferred tax liabilities | | | (377 | ) | | | | |
| | | | | | | | |
Total consideration | | $ | 3,189 | | | | | |
| | | | | | | | |
The goodwill is mainly attributable to intangible assets that cannot be recognized separately as identifiable assets under U.S. GAAP, and comprise (a) the assembled work force and (b) the expected but unidentifiable business growth as a result of the synergy resulting from the acquisition.
The changes in fair value of the contingent consideration from date of acquisition to December 31, 2010 was determined to be an increase in liability of $132, which was recognized as a loss in the consolidated statement of operations in 2010.
Pursuant to the purchase agreement, the contingent consideration in cash was determined at $3,394 based on performance of the acquired business for the period from October 1, 2010 to September 30, 2011. Compared to the initial estimated contingent consideration of $310, the increase of $2,966 was recorded as a loss of changes in fair value of contingent consideration in the consolidated statements of operations in 2011. Out of the total contingent consideration of $3,394, $1,697 was paid in December 2011 and $1,697 was paid in 2012.
F-31
ISOFTSTONE HOLDINGS LIMITED
NOTES TO THE CONSOLIDATED FINANCIAL STATEMENTS—(Continued)
FOR THE YEARS ENDED DECEMBER 31, 2010, 2011 AND 2012
(In U.S. dollars in thousands, except share and per share data, or otherwise noted)
3. ACQUISITIONS – (Continued)
(e) Acquisition of Shanghai Kangshi
On November 10, 2010, the Group acquired 100% equity interest of Shanghai Kangshi, an information technology outsourcing service provider based in Shanghai, China for the purpose to enhance capability in providing business intelligence services to China and global customers.
The consideration consists of an initial cash consideration of $6,373, and 970,215 ordinary shares of the Company valued at $1.235 per share. There was $1,867 cash consideration paid in 2010. A portion of these shares will be subject to repurchase at a nominal price if the performance of the acquired business for each of the year 2010, 2011 and 2012 fails to achieve that year’s performance target. The repurchase right for the ordinary shares issued was accounted for as a contingent receivable, which was valued at $225 by the Group at the acquisition date. The contingent share consideration was valued by the Group with the assistance of American Appraisal China Limited, an independent valuation firm as follows:
| | | | |
Cash consideration | | $ | 6,373 | |
Value of ordinary shares | | | 1,198 | |
Contingent receivable | | | (225 | ) |
| | | | |
Total consideration | | $ | 7,346 | |
| | | | |
The transaction was accounted for as a business combination using the purchase method of accounting. The purchase price allocation of the transaction were determined by the Group with the assistance of American Appraisal China Limited, an independent valuation firm, and the purchase price allocation to assets acquired and liabilities assumed as of the date of acquisition is as follows:
| | | | | | | | |
| | | | | | Estimated
useful lives | |
Net tangible assets: | | | | | | | | |
Cash | | $ | 929 | | | | | |
Current assets | | | 1,151 | | | | | |
Current liabilities | | | (443 | ) | | | | |
Non-current assets | | | 35 | | | | | |
Intangible assets acquired: | | | | | | | | |
Customer base | | | 1,970 | | | | 3.2 – 5.2 years | |
Contract backlog | | | 318 | | | | 0.9 years | |
Non-compete agreement | | | 155 | | | | 5.0 years | |
Goodwill | | | 3,597 | | | | | |
Deferred tax liabilities | | | (366 | ) | | | | |
| | | | | | | | |
Total consideration | | $ | 7,346 | | | | | |
| | | | | | | | |
The goodwill is mainly attributable to intangible assets that cannot be recognized separately as identifiable assets under U.S. GAAP, and comprise (a) the assembled work force and (b) the expected but unidentifiable business growth as a result of the synergy resulting from the acquisition.
The change in fair value of the contingent consideration from the date of acquisition to December 31, 2010 was determined to be an increase in liability of $62, which was recognized as a loss of changes in fair value of contingent consideration in the consolidated statement of operations in 2010.
As of December 31, 2011 and 2012, the fair value of the contingent consideration was determined as nil based on the performance of the acquired business for each of the year 2011 and 2012. The increase in fair value of contingent consideration receivable of $167 was recorded as a loss of changes in fair value of contingent consideration in the consolidated statements of operations in 2011. There was $2,620 and $1,440 cash consideration paid in 2011 and 2012, respectively and the balance of cash consideration payable as of December 31, 2012 was $565 which is to be paid in 2013.
F-32
ISOFTSTONE HOLDINGS LIMITED
NOTES TO THE CONSOLIDATED FINANCIAL STATEMENTS—(Continued)
FOR THE YEARS ENDED DECEMBER 31, 2010, 2011 AND 2012
(In U.S. dollars in thousands, except share and per share data, or otherwise noted)
3. ACQUISITIONS – (Continued)
(f) Acquisition of Adventier
On July 31, 2011, the Group acquired 100% equity interest of Adventier, which has headquarter in Minnesota and provides ERP consulting and solution services. The purpose of the acquisition is to further enhance the end-to-end service offerings, including ERP consulting and delivery capabilities, to both the global and Chinese clients.
The consideration consists of an initial cash consideration of $3,555, which was paid in 2011. In addition, the transaction also contains a contingent cash consideration arrangement based primarily on performance of the acquired business for the period from January 1, 2011 to December 31, 2011 with the maximum of $8,000. The contingent consideration was estimated to be $2,076 by the Group with the assistance of American Appraisal China Limited, an independent valuation firm as follows:
| | | | |
Cash consideration | | $ | 3,555 | |
Contingent consideration | | | 2,076 | |
| | | | |
Total consideration | | $ | 5,631 | |
| | | | |
The transaction was accounted for as a business combination using the purchase method of accounting. The purchase price allocation of the transaction were determined by the Group with the assistance of American Appraisal China Limited, an independent valuation firm, and the purchase price allocation to assets acquired and liabilities assumed as of the date of acquisition is as follows:
| | | | | | | | |
| | | | | | Estimated
useful lives | |
Net tangible assets: | | | | | | | | |
Cash | | $ | 675 | | | | | |
Current assets | | | 1,163 | | | | | |
Current liabilities | | | (1,838 | ) | | | | |
Intangible assets acquired: | | | | | | | | |
Customer base | | | 1,080 | | | | 3.4 years | |
Contract backlog | | | 690 | | | | 0.5 years | |
Trademark | | | 330 | | | | 4.5 years | |
Goodwill | | | 4,287 | | | | | |
Deferred tax liabilities | | | (756 | ) | | | | |
| | | | | | | | |
Total consideration | | $ | 5,631 | | | | | |
| | | | | | | | |
The goodwill is mainly attributable to intangible assets that cannot be recognized separately as identifiable assets under U.S. GAAP, and comprise (a) the assembled work force and (b) the expected but unidentifiable business growth as a result of the synergy resulting from the acquisition.
Pursuant to the purchase agreement, the estimate of contingent cash consideration was updated to $4,130 in 2011. The increase of the fair value of contingent consideration payable of $1,838 was recorded as a loss of changes in fair value of contingent consideration in the consolidated statements of operations in 2011.
By the end of March 31, 2012, the contingent consideration of $4,130 was determined to be $4,451 according to the actual performance in 2011. The increase in the fair value of contingent consideration payable of $460 was recorded as a loss of changes in fair value of contingent consideration in the consolidated statements of operations in 2012. Out of the contingent consideration of $4,451, $2,540 was paid in 2012 and as of December 31 2012 the remaining $1,911 was recorded at its present value of $1,833 as deferred consideration payable, which is to be paid in 2013 and 2014.
F-33
ISOFTSTONE HOLDINGS LIMITED
NOTES TO THE CONSOLIDATED FINANCIAL STATEMENTS—(Continued)
FOR THE YEARS ENDED DECEMBER 31, 2010, 2011 AND 2012
(In U.S. dollars in thousands, except share and per share data, or otherwise noted)
3. ACQUISITIONS – (Continued)
(g) Acquisition of Jiangchen
On April 1, 2012, the Group acquired Nanjing Jiangchen Science &Technology Co., Ltd.’s power distribution solution business to broaden the Group’s existing electric power generation IT services business.
The consideration consists of an initial cash consideration of $1,390, which was paid in June 2012. In addition, the transaction also contains a contingent cash consideration arrangement based primarily on performance of the acquired business for the period from April 1, 2012 to March 31, 2013 at the maximum of $3,970. The contingent consideration was estimated to be $1,811 by the Group with the assistance of American Appraisal China Limited, an independent valuation firm as follows:
| | | | |
Cash consideration | | $ | 1,390 | |
Contingent consideration | | | 1,811 | |
| | | | |
Total consideration | | $ | 3,201 | |
| | | | |
The transaction was accounted for as a business combination using the purchase method of accounting. The purchase price allocation of the transaction were determined by the Group with the assistance of American Appraisal China Limited, an independent valuation firm, and the purchase price allocation to assets acquired and liabilities assumed as of the date of acquisition is as follows:
| | | | | | | | |
| | | | | | Estimated
useful lives | |
Intangible assets acquired: | | | | | | | | |
Customer base | | $ | 1,572 | | | | 6.0 years | |
Contract backlog | | | 302 | | | | 1.25 years | |
Non-compete agreement | | | 32 | | | | 3.0 years | |
Non-current assets | | | 63 | | | | | |
Goodwill | | | 1,536 | | | | | |
Deferred tax liabilities | | | (304 | ) | | | | |
| | | | | | | | |
Total consideration | | $ | 3,201 | | | | | |
| | | | | | | | |
The goodwill is mainly attributable to intangible assets that cannot be recognized separately as identifiable assets under U.S. GAAP, and comprise (a) the assembled work force and (b) the expected but unidentifiable business growth as a result of the synergy resulting from the acquisition.
From the date of acquisition to December 31, 2012, the increase in the fair value of contingent consideration payable of $155 was recorded as a loss of changes in fair value of contingent consideration in the consolidated statements of operations in 2012. As of December 31 2012, $1,987 was recorded as deferred consideration payable, which is to be paid from 2013 to 2015.
F-34
ISOFTSTONE HOLDINGS LIMITED
NOTES TO THE CONSOLIDATED FINANCIAL STATEMENTS—(Continued)
FOR THE YEARS ENDED DECEMBER 31, 2010, 2011 AND 2012
(In U.S. dollars in thousands, except share and per share data, or otherwise noted)
3. ACQUISITIONS – (Continued)
(h) Acquisition of Abovenet
On June 23, 2012, the Group acquired 100% equity interest of Abovenet, which has headquarter in Ontario, Canada to further strengthen the Group’s strategy and capabilities in business intelligence and big data business.
The consideration consists of an initial cash consideration of $929, which was paid in 2012. In addition, the transaction also contains a contingent cash consideration arrangement based primarily on performance of the acquired business for the period from January 1, 2012 to December 31, 2012 at the maximum of $3,113. The contingent consideration was estimated to be $907 by the Group with the assistance of American Appraisal China Limited, an independent valuation firm as follows:
| | | | |
Cash consideration | | $ | 929 | |
Contingent consideration | | | 907 | |
| | | | |
Total consideration | | $ | 1,836 | |
| | | | |
The transaction was accounted for as a business combination using the purchase method of accounting. The purchase price allocation of the transaction were determined by the Group with the assistance of American Appraisal China Limited, an independent valuation firm, and the purchase price allocation to assets acquired and liabilities assumed as of the date of acquisition is as follows:
| | | | | | | | |
| | | | | | Estimated
useful lives | |
Net tangible assets: | | | | | | | | |
Cash | | $ | 278 | | | | | |
Current assets | | | 440 | | | | | |
Current liabilities | | | (439 | ) | | | | |
Intangible assets acquired: | | | | | | | | |
Customer base | | | 550 | | | | 5.5 years | |
Contract backlog | | | 128 | | | | 0.5 years | |
Non-compete agreement | | | 265 | | | | 5.0 years | |
Non-current asset | | | 4 | | | | | |
Goodwill | | | 714 | | | | | |
Deferred tax liabilities | | | (104 | ) | | | | |
| | | | | | | | |
Total consideration | | $ | 1,836 | | | | | |
| | | | | | | | |
The goodwill is mainly attributable to intangible assets that cannot be recognized separately as identifiable assets under U.S. GAAP, and comprise (a) the assembled work force and (b) the expected but unidentifiable business growth as a result of the synergy resulting from the acquisition.
Pursuant to the purchase agreement, the contingent consideration of $1,412 in cash was determined based on the actual performance of the acquired business in 2012, which is to be paid from 2013 to 2015. The increase in the fair value of contingent consideration payable of $387 was recorded as a loss of changes in fair value of contingent consideration in the consolidated statements of operations in 2012.
(i) Other acquisitions
The Group made insignificant acquisitions for cash consideration of $306 and $334, restricted share units with fair value of nil and $80, for the year ended December 31, 2011 and 2012, respectively.
No goodwill recognized in those transactions. The Group’s consolidated Financial Statements includes the operating results of each business acquisition from the date of acquisitions.
The Group believed these above acquisitions did not have a significant impact on the financial position and operating results of the Group. Therefore, no pro forma financial information was presented.
F-35
ISOFTSTONE HOLDINGS LIMITED
NOTES TO THE CONSOLIDATED FINANCIAL STATEMENTS—(Continued)
FOR THE YEARS ENDED DECEMBER 31, 2010, 2011 AND 2012
(In U.S. dollars in thousands, except share and per share data, or otherwise noted)
3. ACQUISITIONS – (Continued)
(j) Pro forma information of acquisitions
The following unaudited pro forma information summarizes the results of operations of the Group for the years ended December 31, 2009 and 2010 assuming that the acquisitions of Ascend and Shanghai Kangshi which were completed in 2010, occurred as of January 1, 2009 and 2010, respectively. The following pro forma financial information is not necessarily indicative of the results that would have occurred had the acquisitions been completed at the beginning of the periods as indicated, nor is it indicative of future operating results:
| | | | | | | | |
| | | For the year ended
December 31, | |
| | | 2009 | | | 2010 | |
| | | (Unaudited) | | | (Unaudited) | |
Pro forma net revenue | | $ | 145,729 | | | $ | 204,054 | |
Pro forma net loss attributable to ordinary shareholders of iSoftStone Holdings Limited | | $ | (729 | ) | | $ | (7,479 | ) |
Pro forma net loss per ordinary share—basic | | $ | (0.01 | ) | | $ | (0.05 | ) |
Pro forma net loss per ordinary share—diluted | | $ | (0.01 | ) | | $ | (0.05 | ) |
The following unaudited pro forma information summarizes the results of operations of the Group for the years ended December 31, 2010 and 2011 assuming that the acquisition of Adventier and other insignificant acquistions which were completed in 2011, occurred as of January 1, 2010 and 2011, respectively. The following pro forma financial information is not necessarily indicative of the results that would have occurred had the acquisitions been completed at the beginning of the periods as indicated, nor is it indicative of future operating results:
| | | | | | | | |
| | | For the year ended
December 31, | |
| | | 2010 | | | 2011 | |
| | | (Unaudited) | | | (Unaudited) | |
Pro forma net revenue | | $ | 199,407 | | | $ | 286,974 | |
Pro forma net income (loss) attributable to ordinary shareholders of iSoftStone Holdings Limited | | $ | (3,145 | ) | | $ | 19,704 | |
Pro forma net income (loss) per ordinary share—basic | | $ | (0.02 | ) | | $ | 0.04 | |
Pro forma net income (loss) per ordinary share—diluted | | $ | (0.02 | ) | | $ | 0.03 | |
The following unaudited pro forma information summarizes the results of operations of the Group for the years ended December 31, 2011 and 2012 assuming that the acquisitions of Abovenet and Jiangchen which were completed in 2012, occurred as of January 1, 2011 and 2012, respectively. The following pro forma financial information is not necessarily indicative of the results that would have occurred had the acquisitions been completed at the beginning of the periods as indicated, nor is it indicative of future operating results:
| | | | | | | | |
| | | For the year ended
December 31, | |
| | | 2011 | | | 2012 | |
| | | (Unaudited) | | | (Unaudited) | |
Pro forma net revenue | | $ | 287,300 | | | $ | 382,435 | |
Pro forma net income attributable to ordinary shareholders of iSoftStone Holdings Limited | | $ | 19,113 | | | $ | 21,959 | |
Pro forma net income per ordinary share—basic | | $ | 0.03 | | | $ | 0.04 | |
Pro forma net income per ordinary share—diluted | | $ | 0.03 | | | $ | 0.04 | |
F-36
ISOFTSTONE HOLDINGS LIMITED
NOTES TO THE CONSOLIDATED FINANCIAL STATEMENTS—(Continued)
FOR THE YEARS ENDED DECEMBER 31, 2010, 2011 AND 2012
(In U.S. dollars in thousands, except share and per share data, or otherwise noted)
4. ACCOUNTS RECEIVABLE
Accounts receivable consisted of the following:
| | | | | | | | |
| | | As of December 31, | |
| | | 2011 | | | 2012 | |
Billed accounts receivable | | $ | 52,119 | | | $ | 52,334 | |
Unbilled accounts receivable | | | 104,763 | | | | 151,521 | |
Less: Allowance for doubtful accounts | | | (4,219 | ) | | | (1,653 | ) |
| | | | | | | | |
Total accounts receivable | | $ | 152,663 | | | $ | 202,202 | |
| | | | | | | | |
Unbilled accounts receivable represents revenue that has been recognized in advance of billing. The Group generally uses the proportional performance method to recognize revenue from fixed-price basis contracts. Under this accounting method, revenue may be recognized in advance of billing the customer, which results in the recording of accounts receivable, unbilled. Once the Group meets the billing criteria under such contract, it bills the customer and reclassifies the unbilled accounts receivable to billed accounts receivable. Billing requirements vary by contract, but are generally structured around completion of certain implementation milestones or the completion of the project.
As of December 31, 2011 and 2012, billed accounts receivable with a carrying value of $10,833 and $10,919 respectively were pledged as collateral, for short term bank loans. The bank loans will expire at December 31, 2013.
An analysis of the allowance for doubtful accounts is as follows:
| | | | | | | | | | | | |
| | | As of December 31, | |
| | | 2010 | | | 2011 | | | 2012 | |
Balance at beginning of year | | $ | 423 | | | $ | 2,320 | | | $ | 4,219 | |
Charge to expenses | | | 2,515 | | | | 2,438 | | | | 209 | |
Write-offs | | | (688 | ) | | | (727 | ) | | | (2,769 | ) |
Exchange rate differences | | | 70 | | | | 188 | | | | (6 | ) |
| | | | | | | | | | | | |
Balance at end of year | | $ | 2,320 | | | $ | 4,219 | | | $ | 1,653 | |
| | | | | | | | | | | | |
F-37
ISOFTSTONE HOLDINGS LIMITED
NOTES TO THE CONSOLIDATED FINANCIAL STATEMENTS—(Continued)
FOR THE YEARS ENDED DECEMBER 31, 2010, 2011 AND 2012
(In U.S. dollars in thousands, except share and per share data, or otherwise noted)
5. PREPAID EXPENSES AND OTHER CURRENT ASSETS
| | | | | | | | |
| | | As of December, 31 | |
| | | 2011 | | | 2012 | |
Contracts in progress (i) | | $ | 7,267 | | | $ | 5,815 | |
Government subsidies receivable (ii) | | | 1,841 | | | | 1,205 | |
Advance to employees (iii) | | | 1,718 | | | | 1,100 | |
Advance to suppliers | | | 873 | | | | 870 | |
Rental deposits | | | 1,305 | | | | 907 | |
Prepaid rental and renovation & other prepaid expenses (iv) | | | 342 | | | | 2,107 | |
Receivable from MDCL (v) | | | 2,409 | | | | — | |
Other operating receivable | | | 1,774 | | | | 867 | |
Others | | | 1,465 | | | | 1,148 | |
| | | | | | | | |
Total | | $ | 18,994 | | | $ | 14,019 | |
| | | | | | | | |
| (i) | Contracts in progress comprise: |
Deposits paid by the Group to certain clients to guarantee fulfillment of the terms of contracts which will be returned when the contract terms are fulfilled and deferred contract costs representing contract costs incurred in advance of revenue recognition arising from:
| | • | | hardware or software purchased and delivered to the customers prior to services being provided and revenue recognized. |
| | • | | direct and incremental staff costs in respect of one BPO contract to hire and train its service delivery personnel according to the customer’s requirements prior the delivery of the billable services, and such deferred costs will be recognized over the billable service period. |
| | • | | the cost of providing services as requested by certain significant and recurring customers in advance of a formal works contract or purchase order being received. |
| (ii) | Government subsidies receivable represented employment incentive subsidies that are recorded when the approval is obtained from the local government authorities and the Group has the right to receive the subsidies. The balance as of December 31, 2012 was subsequently received by February 2013. |
| (iii) | Advances to employees represented cash advances to employees for business operations and are recognized as operating expenses when incurred. |
| (iv) | Prepaid rental and renovation mainly represented renovation cost for office buildings. |
| (v) | In April 2011, the Group entered into an agreement to acquire 19.9% equity interest in MDCL and paid $2,409 as part of the consideration in June 2011. The Group terminated the agreement subsequently in 2011 and collected $2,409 from MDCL in 2012. |
F-38
ISOFTSTONE HOLDINGS LIMITED
NOTES TO THE CONSOLIDATED FINANCIAL STATEMENTS—(Continued)
FOR THE YEARS ENDED DECEMBER 31, 2010, 2011 AND 2012
(In U.S. dollars in thousands, except share and per share data, or otherwise noted)
6. LONG TERM INVESTMENTS
| | | | | | | | |
| | | As of December 31, | |
| | | 2011 | | | 2012 | |
Equity method: | | | | | | | | |
iSoftStone Technologies Co., Ltd. (i) | | $ | 32 | | | $ | 36 | |
Hubei Shenke Information Technology Company Limited (ii) | | | 41 | | | | 10 | |
Chengdu Medicine & Health Network Management Company Limited (iii) | | | 7,690 | | | | 5,909 | |
Dalian iSoftStone iCarnegie Information Technology Company Limited (iv) | | | 30 | | | | 17 | |
Wuxi iSoftStone IoT Innovation Application Technology Company Limited (v) | | | 28 | | | | — | |
Guangdong IoT iSoftStone Information Technology Company Limited (vi) | | | — | | | | 1,175 | |
JT Information Services Company Limited (vii) | | | — | | | | 102 | |
Wuxi iCarnegie Enterprise Management Company Limited and its subsidiary, Wuxi iCarnegie Training School (viii) | | | — | | | | — | |
Cost method: | | | | | | | | |
Dynomedia, Inc. (ix) | | | 1,530 | | | | 1,530 | |
| | | | | | | | |
Total | | $ | 9,351 | | | $ | 8,779 | |
| | | | | | | | |
| (i) | In August 2006, iSoftStone Japan and other third party investors set up iSoftStone Technologies Co., Ltd., a Japan-based company providing IT outsourcing services to multinational financial institutions, with a total cash capital contribution of $100. iSoftStone Japan holds 32.25% interest in iSoftStone Technologies Co., Ltd., and accounts for the investment using equity method. The Group recognized share of loss in iSoftStone Technologies Co., Ltd. of $9, $3 and $14 during the years ended December 31, 2010, 2011 and 2012, respectively. |
| (ii) | In June 2010, iSoftStone Tianjin invested $18 in Hubei Shenke Information Technology Company Limited (“Shenke”) for a 20% equity interest with other three shareholders. In May 2011, the Group injected additional capital of $48 to Shenke. In August 2012, Shenke reduced its registered capital and one of the other three shareholders quitted from the company, and as a result the percentage of equity interest held by iSoftStone Tianjin increased to 23.08%. As the Group has the ability to exercise significant influence over the operating and financial decisions of Shenke, the Group has adopted the equity method to account for its investment in Shenke. The Group recognized share of loss in Shenke of $4, $21 and $31 during the year ended December 31, 2010, 2011and 2012, respectively. |
| (iii) | In September 2011, iSoftStone WOFE and Chengdu Investment Holding Group Ltd., a government investment group, jointly established Chengdu Medicine & Health Network Management Company Limited (“Chengdu-Medical”) in Chengdu to design, build, and operate a healthcare data exchange network. The Group invested $7,785 to hold 49% of the equity of Chengdu-Medical and accounts for the investment using equity method. In January 2012, the Group transferred 9.8% of its equity interest in Chengdu-Medical to an unrelated Chengdu company, for an exchange of certain intellectual property rights relating to cloud computing. After the completion of the exchange, the Group holds 39.2% equity interest in Chengdu-Medical. The Group recognized share of loss of $95 and $303 during the year ended December 31, 2011 and 2012, respectively. |
| (iv) | In October 2011, iSoftStone Dalian invested $32 to hold 20% of equity interest in setting up Dalian iSoftStone iCarnegie Information Technology Company Limited (“Dalian iCarnegie”) with other third party investors. The Group adopted equity method to account for the investment and recognized share of loss of $2 and $13 during the year ended December 31, 2011 and 2012, respectively. |
| (v) | In January 2011, iSoftStone Wuxi and other third party investors set up Wuxi iSoftStone IoT Innovation Application Technology Company Limited (“Wuxi IoT”), in which the Group invested $79 to hold 20% equity interest. As the Group has the ability to exercise significant influence over the operating and financial decisions, equity method is used to account for the investment. During the year ended December 31, 2011 and 2012, the Group recognized share of loss in Wuxi IoT of $51 and $28, respectively. |
| (vi) | In September 2012, iSoftStone WOFE and another two third party investors established Guangdong IoT iSoftStone Information Technology Company Limited (“iSS-Foshan”). The Group invested $1,429 to hold 49% of the equity of iSS-Foshan. As the Group has the ability to exercise significant influence over the operating and financial decisions, equity method is used to account for the investment. During the year ended December 31 2012, the Group recognized share of loss in iSS-Foshan at $200. |
| (vii) | In November 2012, iSoftStone HK invested $103 in JT Information Services Company Limited (“HK-JT”) for a 46% equity interest. As the Group has the ability to exercise significant influence over the operating and financial decisions of HK-JT, the Group has adopted the equity method to account for its investment in HK-JT. The Group recognized share of loss in HK-JT of $1 during the year ended December 31 2012. |
F-39
ISOFTSTONE HOLDINGS LIMITED
NOTES TO THE CONSOLIDATED FINANCIAL STATEMENTS—(Continued)
FOR THE YEARS ENDED DECEMBER 31, 2010, 2011 AND 2012
(In U.S. dollars in thousands, except share and per share data, or otherwise noted)
6. LONG TERM INVESTMENTS – (Continued)
| (viii) | In August 2010, iSoftStone Wuxi sold 45% of its equity interest in Wuxi iCarnegie Enterprise Management Company Limited and its subsidiary, Wuxi iCarnegie Training School (“Wuxi iCarnegie”) to a third party investor at a cash consideration of $664. After the completion of the sale, the Group holds 20% equity interest in Wuxi iCarnegie. As a result, the Group has deconsolidated Wuxi iCarnegie from the date of disposal. As the Group continues to have the ability to exercise significant influence over the operating and financial decisions of Wuxi iCarnegie, the Group has adopted the equity method to account for its investment in Wuxi iCarnegie. The gain on deconsolidation of Wuxi iCarnegie is computed as follows: |
| | | | |
| | | Amounts | |
Fair value of consideration received (cash proceeds) | | $ | 664 | |
Fair value of retained noncontrolling interest in Wuxi iCarnegie | | | 288 | |
Carrying value of noncontrolling interest in Wuxi iCarnegie | | | (67 | ) |
Carrying value of Wuxi iCarnegie at the date of disposal | | | 194 | |
| | | | |
Gain on deconsolidation of Wuxi iCarnegie | | $ | 1,079 | |
| | | | |
| | The initial carrying amount the equity method investment as of the date of deconsolidation was $288. From the date of deconsolidation to December 31, 2010, the Group recognized share of loss in Wuxi iCarnegie at $202, together with the impact of exchange loss amount of $4, resulted in a carrying amount of $82 as of December 31, 2010. In April 2011, the Group injected additional capital of $311 to Wuxi iCarnegie. During the year ended December 31, 2011 and 2012, the Group recognized share of loss in Wuxi iCarnegie of $393 and nil, respectively. |
| (ix) | In June 2011, iSoftStone Holding invested a total of $1,530 to acquire 23.4% of total equity in the form of series B preferred shares of Dynomedia to expand its service lines to e-Publishing market for both domestic Chinese and global clients. The Group determined and applied the cost method to account for the investment as the investment in preferred shares is not in-substance common stock. |
The management has performed the impairment analysis on these investments and determined that there was no impairment on such investments as of December 31, 2011 and 2012.
The summarized financial information of the equity method investments as shown in their financial statements as of and for the years ended December 31 was as follows:
| | | | | | | | |
| | | As of December 31, | |
| | | 2011 | | | 2012 | |
Total assets | | $ | 21,407 | | | $ | 29,154 | |
Total liabilities | | $ | (7,306 | ) | | $ | (14,450 | ) |
| | | | | | | | | | | | |
| | | For the year ended December 31, | |
| | | 2010 | | | 2011 | | | 2012 | |
Net revenues | | $ | 2,023 | | | $ | 6,160 | | | $ | 1,623 | |
Gross profits | | $ | 82 | | | $ | 1,354 | | | $ | 1,439 | |
Net loss | | $ | (1,087 | ) | | $ | (2,660 | ) | | $ | (3,413 | ) |
7. PROPERTY AND EQUIPMENT, NET
| | | | | | | | |
| | | As of December 31, | |
| | | 2011 | | | 2012 | |
Buildings | | $ | 32,178 | | | $ | 32,507 | |
Computers and software | | | 21,426 | | | | 30,140 | |
Furniture and office equipment | | | 5,087 | | | | 6,853 | |
Leasehold improvements | | | 15,089 | | | | 24,225 | |
Motor vehicles | | | 309 | | | | 454 | |
| | | | | | | | |
| | | 74,089 | | | | 94,179 | |
Less: Accumulated depreciation and amortization | | | (18,298 | ) | | | (26,411 | ) |
| | | | | | | | |
Property and equipment, net | | $ | 55,791 | | | $ | 67,768 | |
| | | | | | | | |
Depreciation and amortization expenses for the years ended December 31, 2010, 2011 and 2012 were $4,674, $7,012 and $9,168, respectively.
F-40
ISOFTSTONE HOLDINGS LIMITED
NOTES TO THE CONSOLIDATED FINANCIAL STATEMENTS—(Continued)
FOR THE YEARS ENDED DECEMBER 31, 2010, 2011 AND 2012
(In U.S. dollars in thousands, except share and per share data, or otherwise noted)
8. LAND USE RIGHTS, NET
| | | | | | | | |
| | | As of December 31, | |
| | | 2011 | | | 2012 | |
Land use rights | | $ | 3,273 | | | $ | 3,306 | |
Less: accumulated amortization | | | (30 | ) | | | (102 | ) |
Exchange differences | | | (1 | ) | | | (2 | ) |
| | | | | | | | |
Land use rights, net | | $ | 3,242 | | | $ | 3,202 | |
| | | | | | | | |
In 2011, the Group acquired a land use rights in Wuxi, China, with the total payment of $3,273. The land use right was record at cost less accumulated amortization using a straight-line basis over the remaining 45-year term of the land use right certification.
Future amortization expense is US$72 per year for each of the next five years through December 31, 2017 and after.
9. INTANGIBLE ASSETS
The intangible assets and their accumulated amortization were as follows:
| | | | | | | | |
| | | As of December 31, | |
| | | 2011 | | | 2012 | |
Intangible assets subject to amortization: | | | | | | | | |
Customer base | | $ | 12,156 | | | $ | 14,360 | |
Contract backlog | | | 1,942 | | | | 2,462 | |
Non-compete agreements | | | 738 | | | | 1,158 | |
Software copyright | | | 925 | | | | 2,552 | |
Trademark | | | 4 | | | | 4 | |
| | | | | | | | |
| | | 15,765 | | | | 20,536 | |
| | | | | | | | |
Less: Accumulated amortization | | | | | | | | |
Customer base | | | (8,688 | ) | | | (10,864 | ) |
Contract backlog | | | (1,827 | ) | | | (2,319 | ) |
Non-compete agreements | | | (205 | ) | | | (398 | ) |
Software copyright | | | (356 | ) | | | (1,008 | ) |
Trademark | | | (1 | ) | | | (2 | ) |
| | | | | | | | |
| | | (11,077 | ) | | | (14,591 | ) |
| | | | | | | | |
Intangible assets, net | | $ | 4,688 | | | $ | 5,945 | |
| | | | | | | | |
Amortization expenses were $1,965, $3,432 and $3,448 for the years ended December 31, 2010, 2011 and 2012, respectively. The Group expects to record amortization expenses of $2,820, $1,511, $936, $457 and $191 for each of the year 2013, 2014, 2015, 2016 and 2017, respectively.
In January 2010, the Group incorporated a subsidiary, Guodian, with a third party who, in return for its 40% of the equity, contributed the copyright of certain software. The software copyright was initially recorded at $586, which was determined based on the estimated future benefit to be generated from the use of this software copyright. The software copyright was amortized into the statement of operations based on the estimated benefit of the copyright to be generated by the Group over the 5 years of estimated useful life.
The Group did not incur costs to renew or extend the term of acquired intangible assets during any of the periods presented.
F-41
ISOFTSTONE HOLDINGS LIMITED
NOTES TO THE CONSOLIDATED FINANCIAL STATEMENTS—(Continued)
FOR THE YEARS ENDED DECEMBER 31, 2010, 2011 AND 2012
(In U.S. dollars in thousands, except share and per share data, or otherwise noted)
10. GOODWILL
The changes in the carrying amount of goodwill by reporting units for the years ended December 31, 2010, 2011 and 2012, consisted of the following:
| | | | | | | | | | | | | | | | |
| | | China | | | Japan | | | U.S. and
Canada | | | Total | |
Balance, as of January 1, 2011 | | $ | 8,835 | | | $ | 195 | | | $ | 10,341 | | | $ | 19,371 | |
Acquisition of iHealthStone (Note 3) | | | 451 | | | | — | | | | — | | | | 451 | |
Acquisition of Adventier (Note 3) | | | — | | | | — | | | | 4,287 | | | | 4,287 | |
Settlement of contingent consideration for the acquisition of Wuxi Huayang (Note 3) | | | 45 | | | | — | | | | — | | | | 45 | |
Foreign exchange differences | | | 434 | | | | 9 | | | | — | | | | 443 | |
| | | | | | | | | | | | | | | | |
Balance, as of December 31, 2011 | | $ | 9,765 | | | $ | 204 | | | $ | 14,628 | | | $ | 24,597 | |
Acquisition of Abovenet (Note 3) | | | — | | | | — | | | | 714 | | | | 714 | |
Acquisition of Jiangchen (Note 3) | | | 1,536 | | | | — | | | | — | | | | 1,536 | |
Foreign exchange differences | | | 116 | | | | 2 | | | | 18 | | | | 136 | |
| | | | | | | | | | | | | | | | |
Balance, as of December 31, 2012 | | $ | 11,417 | | | $ | 206 | | | $ | 15,360 | | | $ | 26,983 | |
| | | | | | | | | | | | | | | | |
The Group performed its annual goodwill impairment tests on December 31 of each year. In the goodwill impairment test, the Group used the income approach, which it believed to be more reliable than the market approach in determining the fair value of the Group’s reporting unit. Accordingly, it adopted a discounted cashflow (“DCF”) method under the income approach, which considered a number of factors that include expected future cash flows, growth rates and discount rates and requires the Group to make certain assumptions and estimates regarding industry economic factors and future profitability of its business unit. The assumptions were inherently uncertain and subjective.
When applying the DCF method for the reporting unit, the Group incorporated the use of projected financial information and a discount rate that was developed using market participant based assumptions. The cash flow projections were based on six-year financial forecasts developed by management that included revenue projections, capital spending trends, and investments in working capital to support anticipated revenue growth. The discount rates selected were 21%, 21.5% and 23% for China, Japan and U.S. respectively with the consideration of the risk and nature of the reporting unit’s cash flows and the rates of return market participants would require investing their capital in the reporting unit.
The Group evaluated the situation as of December 31, 2011 and 2012 based on the performance results and future operation projections with the assistance of American Appraisal China Limited, an independent valuation firm and concluded that there was no goodwill impairment as of December 31, 2011 and 2012.
Based on impairment test performed, no impairment of goodwill was recorded during the years ended December 31, 2010, 2011 and 2012, respectively.
11. ACCRUED EXPENSES AND OTHER CURRENT LIABILITIES
| | | | | | | | |
| | | As of December 31, | |
| | | 2011 | | | 2012 | |
Employee payroll and welfare payable | | $ | 16,686 | | | $ | 18,931 | |
Other taxes payable (i) | | | 2,344 | | | | 4,036 | |
Accrued reimbursable operating costs (ii) | | | 3,185 | | | | 3,951 | |
Accrued rental | | | 1,677 | | | | 1,192 | |
Accrued professional fee | | | 1,760 | | | | 2,694 | |
Payable for purchase of property and equipment | | | 2,680 | | | | 831 | |
Other payable | | | 3,040 | | | | 1,204 | |
| | | | | | | | |
Total | | $ | 31,372 | | | $ | 32,839 | |
| | | | | | | | |
| (i): | Other taxes payable included payable of VAT, business tax, and withholding individual income tax. |
| (ii): | Accrued reimbursable operating costs represent the outstanding amounts claimed by employees for business operations. |
F-42
ISOFTSTONE HOLDINGS LIMITED
NOTES TO THE CONSOLIDATED FINANCIAL STATEMENTS—(Continued)
FOR THE YEARS ENDED DECEMBER 31, 2010, 2011 AND 2012
(In U.S. dollars in thousands, except share and per share data, or otherwise noted)
12. SHORT TERM BORROWINGS
| | | | | | | | |
| | | As of December 31, | |
| | | 2011 | | | 2012 | |
Bank borrowings | | $ | 15,094 | | | $ | 54,012 | |
| | | | | | | | |
The balance as of December 31, 2011 represented short term bank loans from various domestic commercial banks with fixed or floating interest rates ranging from 7.22% to 7.88% per annum. Out of the $15,094 balance, $8,739 was without any collateral, and the remaining $6,355 were guaranteed by a director of the Company and pledged with accounts receivable of iSoftStone WOFE.
The balance as of December 31, 2012 represented short term bank loans from various domestic commercial banks with fixed or floating interest rates ranging from 6.00% to 7.22% per annum. Out of the $54,012 balance, $31,540 were without any collateral, and the remaining $22,472 were guaranteed by a director of the Company and pledged with accounts receivable of iSoftStone WOFE and iSoftStone Wuxi.
As of December 31, 2012, the Company had short-term credit facilities totaling $84,127 expiring at various days before December 2013. Out of the total credit facilities, $54,012 was utilized for bank borrowings and unused facilities were $30,115.
13. INCOME TAXES
The current and deferred components of income tax (benefit) expense were as follows:
| | | | | | | | | | | | |
| | | For the year ended December 31, | |
| | | 2010 | | | 2011 | | | 2012 | |
Current | | | | | | | | | | | | |
—PRC | | $ | 289 | | | $ | 808 | | | $ | 3,865 | |
—Others | | | 174 | | | | 1,151 | | | | 1,112 | |
| | | | | | | | | | | | |
—Total current income taxes | | | 463 | | | | 1,959 | | | | 4,977 | |
| | | | | | | | | | | | |
Deferred | | | | | | | | | | | | |
—PRC | | | (349 | ) | | | (983 | ) | | | (122 | ) |
—Others | | | (402 | ) | | | (657 | ) | | | (485 | ) |
| | | | | | | | | | | | |
—Total deferred income taxes | | | (751 | ) | | | (1,640 | ) | | | (607 | ) |
| | | | | | | | | | | | |
Total income tax (benefit) expense | | $ | (288 | ) | | $ | 319 | | | $ | 4,370 | |
| | | | | | | | | | | | |
Cayman Islands
The Company is incorporated in the Cayman Islands and is not subject to taxation in its country of incorporation.
United States
iSoftStone Inc. and iSS-LLC are incorporated in the United States and are subject to the U.S. federal income taxes at gradual tax rates from 15% to 35%.
Germany
iSS-Germany is incorporated in Germany and is subject to Germany income taxes at 15%.
United Kingdom
iSS-UK is incorporated in United Kingdom and is subject to United Kingdom income taxes at gradual tax rates from 20% to 26%.
Canada
iSoftStone-Canada and Abovenet are incorporated in Canada and are subject to Canadian income taxes at gradual tax rates at 26.5%.
Japan
iSoftStone Japan is incorporated in Japan and is subject to Japanese income taxes around 42%.
F-43
ISOFTSTONE HOLDINGS LIMITED
NOTES TO THE CONSOLIDATED FINANCIAL STATEMENTS—(Continued)
FOR THE YEARS ENDED DECEMBER 31, 2010, 2011 AND 2012
(In U.S. dollars in thousands, except share and per share data, or otherwise noted)
13. INCOME TAXES – (Continued)
Korea
iSoftStone Korea is established in Korea and is subject to Korea income taxes at 10%, 13%, and 13% for the years ended December 31, 2010, 2011 and 2012, respectively.
Hong Kong
iSoftStone HK is established in Hong Kong and is subject to Hong Kong profit taxes at 16.5%.
Taiwan
iSoftStone Hong Kong Limited Taiwan Branch is established in Taiwan, and is subject to Taiwan income taxes at 17%.
PRC
The Group’s PRC entities are subject to the Enterprise Income Tax (“EIT”) Law effective on January 1, 2008 which adopted a uniform EIT rate of 25% for all PRC enterprises including foreign-invested enterprises. Under the law, an enterprise qualified as a high and new technology enterprise (“HNTE”) is entitled to a preferential income tax rate of 15%.
Various entities of the Group enjoyed certain preferential tax rates as follows:
iSoftStone WFOE was qualified as HNTE in 2008 and entitled to a three-year exemption starting from 2006 to 2008 followed by a reduced income tax rate of 7.5% for the subsequent three years from 2009 to 2011. iSoftStone WFOE has renewed its qualification certificate of HNTE in 2011 and is eligible to an income tax rate of 15% for the next three years from 2012. The Group believes it is highly likely that its qualifying entities will continue to obtain the renewal in the future. Accordingly, in calculating deferred tax assets and liabilities, the Group has assumed its qualifying entities will continue to renew the new HNTE status at the conclusion of the initial three-year period. If the Group’s qualifying entities failed to obtain such renewals, then the net deferred tax assets balance would increase by $848 as of December 31, 2012, which would be an increase to the income tax benefit.
Shanghai Kangshi obtained the qualification certificate of HNTE and was eligible to enjoy a preferential tax rate of 15% as long as it maintain its qualification as a high-tech enterprise.
iSoftStone Wuxi qualified as “software enterprise” and enjoyed two-year income tax exemption started from 2008 to 2009, followed by a reduced income tax rate of 12.5% for the subsequent three years from 2010 to 2012. In addition, iSoftStone Wuxi was approved as a key software enterprise in 2010 and was entitled to a preferential income tax rate of 10% for 2010. The qualification of key software enterprise should be renewed every year going forward and iSoftStone Wuxi is eligible to enjoy the income tax rate of 10% as long as it maintains the qualification as a key software enterprise.
iSoftStone Tianjin qualified as “software enterprise” and enjoyed two-year income tax exemptions starting from 2010 to 2011, followed by a reduced income tax rate of 12.5% for the subsequent three years from 2012 to 2014.
iSoftStone Guangzhou qualified as “software enterprise” and enjoyed two-year income tax exemptions starting from 2012 to 2013, followed by a reduced income tax rate of 12.5% for the subsequent three years from 2014 to 2016.
iSS-Chengdu, iSS-Shenzhen, iSS-Wuhan, WX-Yancheng, SZ-Suzhou, iSST have qualified as “software enterprise”, and will enjoy two-year income tax exemption starting from their first profitable year, followed by a reduced income tax rate of 12.5% for the subsequent three years.
F-44
ISOFTSTONE HOLDINGS LIMITED
NOTES TO THE CONSOLIDATED FINANCIAL STATEMENTS—(Continued)
FOR THE YEARS ENDED DECEMBER 31, 2010, 2011 AND 2012
(In U.S. dollars in thousands, except share and per share data, or otherwise noted)
13. INCOME TAXES – (Continued)
The principal components of the Group’s deferred income tax assets and liabilities are as follows:
| | | | | | | | |
| | | As of December 31, | |
| | | 2011 | | | 2012 | |
Current deferred tax assets: | | | | | | | | |
Accrued payroll | | $ | 2,666 | | | $ | 1,881 | |
Provision for doubtful accounts | | | 630 | | | | 246 | |
Net operating loss carry forwards | | | 482 | | | | — | |
Less: Valuation allowance | | | (1,311 | ) | | | (212 | ) |
| | | | | | | | |
Current deferred tax assets, net | | | 2,467 | | | | 1,915 | |
| | | | | | | | |
Non-current deferred tax asset: | | | | | | | | |
Net operating loss carry forwards | | | 4,141 | | | | 2,537 | |
Less: Valuation allowance | | | (4,141 | ) | | | (2,011 | ) |
| | | | | | | | |
Non-current deferred tax asset, net | | | — | | | | 526 | |
| | | | | | | | |
Non-current deferred tax liabilities: | | | | | | | | |
Intangible assets acquired | | | (1,158 | ) | | | (937 | ) |
| | | | | | | | |
Net deferred tax liabilities, net | | $ | (1,158 | ) | | $ | (937 | ) |
| | | | | | | | |
The Group had net operating losses of $19,690 and $14,537 from the Company’s subsidiaries and VIE as of December 31, 2011 and December 31, 2012, respectively. The net operating loss carry forwards generated by a particular entity in the Group cannot be transferred or utilized by other entities within the Group. As of December 31, 2011 and 2012, the valuation allowance was $5,452 and $2,223, respectively, which were provided against deferred tax assets of certain subsidiaries. Where a valuation allowance was not recorded, the Group believes that it was more likely than not that the deferred tax assets will be realized as it expects to generate sufficient taxable income in the future.
The net operating loss carry forwards for the Company’s subsidiaries other than Hong Kong as of December 31, 2012 will expire on various dates through 2022. For Hong Kong, the net operating loss will be carried forward indefinitely.
Reconciliation between the statutory PRC enterprise income tax rate of 25% to the effective tax rate is as follows:
| | | | | | | | | | | | |
| | | For the year ended December 31, | |
| | | 2010 | | | 2011 | | | 2012 | |
(Loss) income before provision of income tax | | $ | (3,663 | ) | | $ | 19,880 | | | $ | 27,089 | |
Statutory tax rate in the PRC | | | 25 | % | | | 25 | % | | | 25 | % |
Income tax (benefit) expense at statutory tax rate | | $ | (916 | ) | | $ | 4,970 | | | $ | 6,772 | |
Effect of income tax rate differences in jurisdictions other than the PRC | | | 826 | | | | 1,944 | | | | 861 | |
Effect of tax holidays and preferential tax rates | | | (6,466 | ) | | | (10,603 | ) | | | (2,619 | ) |
Permanent differences: | | | | | | | | | | | | |
Research and development expenses super deduction | | | (144 | ) | | | (112 | ) | | | (362 | ) |
Shared-based compensation | | | 2,136 | | | | 2,333 | | | | 2,780 | |
Changes in fair value of convertible notes | | | 2,107 | | | | (708 | ) | | | — | |
Others | | | 192 | | | | 323 | | | | 167 | |
Changes in valuation allowances | | | 1,977 | | | | 2,172 | | | | (3,229 | ) |
| | | | | | | | | | | | |
Income tax (benefit) expense | | $ | (288 | ) | | $ | 319 | | | $ | 4,370 | |
| | | | | | | | | | | | |
If the tax holidays including tax exemption and preferential tax rates granted to iSoftStone WFOE, iSoftStone Tianjin, iSoftStone Wuxi, iSoftStone Guangzhou, Guodian and Shanghai Kangshi were not available, provisions for income taxes and net income per share would have been as follows:
| | | | | | | | | | | | |
| | | For the year ended December 31, | |
| | | 2010 | | | 2011 | | | 2012 | |
Provision for income taxes expense | | $ | 6,178 | | | $ | 10,726 | | | $ | 6,989 | |
Net (loss) income per share— basic | | $ | (0.07 | ) | | $ | 0.01 | | | $ | 0.03 | |
Net (loss) income per share— diluted | | $ | (0.07 | ) | | $ | 0.01 | | | $ | 0.03 | |
| | | | | | | | | | | | |
F-45
ISOFTSTONE HOLDINGS LIMITED
NOTES TO THE CONSOLIDATED FINANCIAL STATEMENTS—(Continued)
FOR THE YEARS ENDED DECEMBER 31, 2010, 2011 AND 2012
(In U.S. dollars in thousands, except share and per share data, or otherwise noted)
13. INCOME TAXES – (Continued)
The Group did not identify significant unrecognized tax benefits for years ended December 31, 2010, 2011 and 2012. The Group did not incur any interest and penalties related to potential underpaid income tax expenses and also believed that the adoption of pronouncement issued by FASB regarding accounting for uncertainty in income taxes did not have a significant impact on the unrecognized tax benefits within the next 12 months from December 31, 2012.
Since January 1, 2007, the relevant tax authorities of the Group’s subsidiaries have not conducted a tax examination on the Group’s subsidiaries. In accordance with relevant PRC tax administration laws, tax years from 2007 to 2012 of the Group’s PRC subsidiaries and VIE remain subject to tax audits, at the tax authority’s discretion.
Uncertainties exist with respect to how the current income tax law in the PRC applies to the Group’s overall operations, and more specifically, with regard to tax residency status. The New EIT Law includes a provision specifying that legal entities organized outside of the PRC will be considered residents for Chinese Income tax purposes if the place of effective management or control is within the PRC. The implementation rules to the New EIT Law provide that non-resident legal entities will be considered China residents if substantial and overall management and control over the manufacturing and business operations, personnel, accounting, properties, etc., occurs within the PRC. Despite the present uncertainties resulting from the limited PRC tax guidance on the issue, the Group does not believe that the legal entities organized outside of the PRC within the Group should be treated as residents for EIT law purposes. If the PRC tax authorities subsequently determine that the Company and its subsidiaries registered outside the PRC should be deemed resident enterprises, the Company and its subsidiaries registered outside the PRC will be subject to the PRC income taxes, at a rate of 25%.
If the Company were to be non-resident for the PRC tax purpose, dividends paid to it by its PRC subsidiaries out of profits earned after January 1, 2008 would be subject to a PRC withholding tax at 10%.
Aggregate undistributed earnings of the Company’s subsidiaries located in the PRC that are available for distribution to the Company of approximately $81,219 at December 31, 2012 are considered to be indefinitely reinvested, and accordingly, no provision has been made for the Chinese dividend withholding taxes that would be payable upon the distribution of those amounts to the Company. The Chinese tax authorities have also clarified that distributions made out of pre-January 1, 2008 retained earnings will not be subject to the withholding tax. Determination of the amount of any unrecognized deferred income tax liabilities on those earnings is not practicable.
F-46
ISOFTSTONE HOLDINGS LIMITED
NOTES TO THE CONSOLIDATED FINANCIAL STATEMENTS—(Continued)
FOR THE YEARS ENDED DECEMBER 31, 2010, 2011 AND 2012
(In U.S. dollars in thousands, except share and per share data, or otherwise noted)
14. NET INCOME PER SHARE
The calculation of the earnings per share is as follows:
| | | | | | | | | | | | |
| | | For the year ended December 31, | |
| | | 2010 | | | 2011 | | | 2012 | |
Net (loss) income attributable to iSoftStone shareholders | | $ | (3,182 | ) | | $ | 18,845 | | | $ | 22,109 | |
| | | | | | | | | | | | |
Less: Net (loss) income allocated to other participating securities: | | | | | | | | | | | | |
Deemed dividend on series A convertible preference shares | | | (1,086 | ) | | | N/A | | | | N/A | |
| | | | | | | | | | | | |
Net loss allocated to series A convertible preference shares | | | (1,086 | ) | | | N/A | | | | N/A | |
| | | | | | | | | | | | |
Accretion on series B convertible redeemable preference shares | | | (2,585 | ) | | | N/A | | | | N/A | |
| | | | | | | | | | | | |
Net loss allocated to series B convertible redeemable preference shares | | | (2,585 | ) | | | N/A | | | | N/A | |
| | | | | | | | | | | | |
Net (loss) income attributable to iSoftStone shareholders allocated for computing net income per ordinary share-basic and diluted | | $ | (6,853 | ) | | $ | 18,845 | | | $ | 22,109 | |
| | | | | | | | | | | | |
Weighted average ordinary shares outstanding used in computing net income per ordinary share-basic (i) | | | 149,341,325 | | | | 547,143,620 | | | | 564,069,512 | |
| | | | | | | | | | | | |
Weighted average ordinary shares outstanding used in computing net income per ordinary share-diluted | | | 149,341,325 | (ii) | | | 592,082,213 | (ii) | | | 582,402,472 | (ii) |
| | | | | | | | | | | | |
Net (loss) income per ordinary share-basic | | $ | (0.05 | ) | | $ | 0.03 | | | $ | 0.04 | |
| | | | | | | | | | | | |
Net (loss) income per ordinary share-diluted | | $ | (0.05 | ) | | $ | 0.03 | | | $ | 0.04 | |
| | | | | | | | | | | | |
| (i) | The calculation of weighted average number of shares used in computing basic net income per ordinary share included certain shares to be issued unconditionally. For year 2010, such shares included 500,000 ordinary shares to be issued unconditionally in connection with a 2006 acquisition, a weighted average number of 45,188 ordinary shares to be issued in connection with a 2010 acquisition and a weighted average number of 1,325,715 vested nonvested shares to be issued unconditionally (see Note 22). For year 2011, such shares included a weighted average number of 467,369 vested nonvested shares issued in 2011 and a weighted average number of 970,215 ordinary shares to be issued in connection with a 2010 acquisition (see Note 22). For year 2012, such shares included a weighted average number of 970,215 ordinary shares to be issued in connection with a 2010 acquisition (see Note 22). |
| (ii) | The calculation of the weighted average number of ordinary shares for the purpose of diluted net income per share has considered the effect of certain potentially dilutive securities. |
For the year 2010, 95,286,195, 168,880,040 and 38,788,711 ordinary shares resulting from the assumed conversion of the series A shares, series B shares, convertible notes and all of the share options and nonvested shares were excluded as they were anti-dilutive due to the fact that the Group was in the loss position.
For the year 2011, an incremental weighted average number of 44,881,186 ordinary shares from the assumed exercise of share options and share units, and an incremental weighted average number of 57,408 nonvested shares using the treasury stock method, and 3,457,805 ordinary shares resulting from the assumed conversion of convertible notes were included. 8,125,954 share options were excluded as their effect was anti-dilutive.
For the year 2012, an incremental weighted average number of 18,332,960 ordinary shares from the assumed exercise of share options and share units was included. 40,125,864 share options and share units were excluded as their effect was anti-dilutive.
F-47
ISOFTSTONE HOLDINGS LIMITED
NOTES TO THE CONSOLIDATED FINANCIAL STATEMENTS—(Continued)
FOR THE YEARS ENDED DECEMBER 31, 2010, 2011 AND 2012
(In U.S. dollars in thousands, except share and per share data, or otherwise noted)
15. INVESTMENT BY A SUBSIDIARY IN PARENT COMPANY
In August 2010, the Group’s subsidiary, iSoftstone HK, purchased 2,500,000 and 2,500,000 ordinary shares from certain shareholders of the Company, Tekventure Limited and United Innovation (China) Limited, at the purchase price of $0.40 per share, respectively. The consideration was fully paid in October 2010. The ordinary shares of the Company held by the subsidiary are treated in a manner a kin to treasury shares as a contra-equity account.
In October 2010, the Group sold 461,000 and 700,000 of the treasury shares at the purchase price of $0.51 and $0.30 per share, respectively, to a former employee. The total 1,161,000 treasury shares were transferred to ordinary shares in October 2010 at the purchase price of $0.40 per share.
In October 2010, the Group transferred 731,436 treasury shares to ordinary shares in connection with the employment of certain employees, at the purchase price of $0.40 per share.
In March 2011, the Group transferred 674,109 treasury shares to ordinary shares in connection with the acquisition of Kebao, at the purchase price of $0.40 per share.
In June 2011, the Group transferred 500,000 treasury shares to ordinary shares in connection with the acquisition of Dalian Zhendan Science and Technology Co., Ltd. (“Zhendan”), at the purchase price of $0.40 per share.
16. ORDINARY SHARES
As of January 1, 2010, there were 130,902,853 ordinary shares outstanding.
In April 2010 and June 2010, 4,500,000 ordinary shares were issued in connection with the hiring of certain key employees.
In July 2010, 242,059 ordinary shares were issued as a part of contingent consideration for the acquisition of MDCL (see Note 3).
In October 2010, 80,000 ordinary shares were issued in connection with the exercise of options previously granted to employees under the Company’s share incentive plans (see Note 22).
In December 2010, the Company completed its IPO of American Depositary Shares (“ADS”) at New York Stock Exchange. Each ADS represents ten ordinary shares of the Company. 104,856,845 ordinary shares were issued. In addition, all Series A convertible preference shares and Series B convertible redeemable preference shares were automatically converted into 264,166,235 ordinary shares upon the IPO. In addition, there were 18,381,991 ordinary shares issued in connection with the conversion of principal amount of $18,000 convertible notes (see Note 19) upon the IPO.
In December 2010, there were 823,846 ordinary shares issued as part of consideration for the acquisition of Ascend (see Note 3).
In March 2011, 20,406,720 ordinary shares were issued in connection with the conversion of principal amount of $20,000 convertible notes (see Note 19).
In March 2011, 324,849 ordinary shares were issued to a consultant who introduced business to iSoftStone Data, a subsidiary of the Group.
In April 2011, 665,999 nonvested shares were issued under the Company’s share incentive plans (see Note 22).
In August 2011, 152,863 ordinary shares were issued to certain selling shareholders in MDCL who became employees of the Group (see Note 22).
In 2011, 12,178,146 ordinary shares were issued in connection with the exercise of options and share units previously granted to employees under the Company’s share incentive plans (see Note 22).
In 2012, 11,686,061 ordinary shares were issued in connection with the exercise of options and share units previously granted to employees under the Company’s share incentive plans (see Note 22).
In 2012, 161,478 ordinary shares were connected to forfeiture of restricted shares granted previously under the Company’s share incentive plans (see Note 22).
F-48
ISOFTSTONE HOLDINGS LIMITED
NOTES TO THE CONSOLIDATED FINANCIAL STATEMENTS—(Continued)
FOR THE YEARS ENDED DECEMBER 31, 2010, 2011 AND 2012
(In U.S. dollars in thousands, except share and per share data, or otherwise noted)
17. SHARES TO BE ISSUED
The Group agreed to issue 970,215 ordinary shares in connection with the acquisition of Shanghai Kangshi (see Note 3) in 2010, and these shares remained unissued as of December 31, 2011 and 2012 due to legal and administrative reasons. The shares to be issued were recorded at the acquisition date at its fair value of $1.30 per share.
18. CONVERTIBLE PREFERENCE SHARES
Series A Convertible Preference Shares
On November 16, 2005, the Company issued 64,983,166 series A convertible preference shares (“series A shares”) and warrants to purchase 16,835,017 series A shares at exercise price of $0.1485 per share to third party investors for cash proceeds of $9,650, at an issuance price of $0.1485 per series A share.
Both the series A shares and the warrants were determined as equity instruments by the Company and the Company applied the relative-fair-value method to allocate the proceeds between the series A shares and the warrants. Accordingly, the warrants were recorded at $673, and preference shares were recorded at $8,977 respectively as of the date of issuance.
On April 28, 2006, the Company issued additional 13,468,012 series A shares to a third party investor for cash proceeds of $2,000, at an issuance price of $0.1485 per series A share.
On March 13, 2007, 16,835,017 warrants were exercised, and the Company issued 16,835,017 series A shares, and received cash proceeds of $2,500.
The Company had determined that there was no beneficial conversion feature attributable to the series A shares because the initial and subsequently adjusted conversion price of series A shares was higher than the fair value of the Company’s ordinary shares on issue date of series A shares.
Series A shares were not redeemable.
Key terms of the series A shares are summarized as follows:
Dividends
The dividend rate for series A shares was 8% per annum. The dividend should be payable when, as and if declared by the Board of Directors, and prior and in preference to any declaration or payment of any dividend on the ordinary shares. Such dividends should not be cumulative. After payment of such dividends, any additional dividends or distributions should be distributed among all holders of ordinary shares and preference shares in proportion on as-converted basis.
Liquidation preference
In the event of any liquidation, dissolution or winding up of the Company, either voluntary or involuntary, distributions to the shareholders of the Company should be made in the following manners: the holders of series A shares should be entitled to receive an amount equaled to the sum of original issuance price plus any declared but unpaid dividends, prior to and in preference to any distribution of any of the assets or surplus funds to the holders of the ordinary shares and any other class or series of shares. If there were still remaining proceeds available for distribution, it should be distributed among the holder of series A shares and ordinary shares pro rata on as-converted basis. For the remaining proceeds with respect to series A shareholders’ distribution, total distribution per share should be limited to 200% of the series A original issue price of $0.1485 per share.
As of December 31, 2009, the liquidation value of series A shares was $3,747.
F-49
ISOFTSTONE HOLDINGS LIMITED
NOTES TO THE CONSOLIDATED FINANCIAL STATEMENTS—(Continued)
FOR THE YEARS ENDED DECEMBER 31, 2010, 2011 AND 2012
(In U.S. dollars in thousands, except share and per share data, or otherwise noted)
18. CONVERTIBLE PREFERENCE SHARES – (Continued)
Series A Convertible Preference Shares – (Continued)
Voting rights
Each series A shareholder had a number of voting rights equivalent to the number of ordinary shareholders’ voting rights, upon series A share’s conversion into ordinary shares at the record date for determination of the shareholders entitled to vote on related matters.
Conversion
Each series A share should be convertible, at the option of the holder thereof, at any time after the series A share’s original date of issuance, into such number of fully paid and nonassessable ordinary shares as determined by dividing the series A share’s original issue price by series A share conversion price.
The initial conversion ratio should be on a one for one basis, which is subject to certain anti-dilution adjustments and adjustments for future issuances of shares at a price lower than the issuance price of the series A shares.
Each series A share would automatically be converted into ordinary share at the then effective series A conversion price, upon the earlier, of (i) the date specified by vote or written consent or agreement of holders of at least a majority of the shares of each such series then outstanding, or (ii) immediately prior to but contingent upon the closing of a Qualified IPO.
In December 2010, all Series A shares were automatically converted into 95,286,195 ordinary shares upon the IPO of the Company.
Series B Convertible Redeemable Preference Shares
On March 16, 2007, the Company issued 84,440,020 series B convertible redeemable preference shares (“series B shares”) and warrants to purchase 84,440,020 series B shares to third party investors for cash proceeds of $19,425, net of issuance costs of $575, at an issuance price of $0.2369 per series B share (“series B Original Issue Price”) and exercise price of $0.2961 per warrant of series B share, respectively.
The warrants were determined by the Company as liabilities because the exercise of the warrants will result in the delivery of redeemable preference shares. The warrants were initially recorded at fair value of $2,246 on the date of grant, and were subsequently re-measured at fair value as of each reporting date. As of December 31, 2007, the fair value of the warrants was $3,665 and the change in fair value of $1,419 was recognized in the consolidated statements of operations in 2007. On February 22, 2008, 84,440,020 warrants were exercised and the Company issued 84,440,020 series B shares, for cash proceeds of $24,500, net of issuance costs of $500. The carrying amount and fair value of the warrants was $4,341 as of February 22, 2008 and was recorded in series B shares at that date. The change in fair value of $676 was recognized in the consolidated statements of operations in 2008.
The series B shares were initially recorded at $17,179 using residual method.
F-50
ISOFTSTONE HOLDINGS LIMITED
NOTES TO THE CONSOLIDATED FINANCIAL STATEMENTS—(Continued)
FOR THE YEARS ENDED DECEMBER 31, 2010, 2011 AND 2012
(In U.S. dollars in thousands, except share and per share data, or otherwise noted)
18. CONVERTIBLE PREFERENCE SHARES – (Continued)
Series B Convertible Redeemable Preference Shares– (Continued)
The Company had determined that there was no beneficial conversion feature attributable to the series B shares because the initial conversion price of series B shares was higher than the fair value of the Company’s ordinary shares on issue date of series B shares.
Key terms of the series B shares are summarized as follows:
Voting rights
Series B shareholders were entitled to the number of votes equaled to the number of ordinary shares into which such preference shares could be converted at the record date.
Dividends
No dividend should be paid on the ordinary shares at a rate higher than the rate at which dividends were paid on the series A shares and series B shares (based on the number of ordinary shares into which the series A shares and the series B shares were convertible on the date the dividend is declared).
Liquidation preference
In the event of any liquidation, dissolution or winding up of the Company, either voluntary or involuntary, distributions to the shareholders of the Company should be made in the following manners: the holders of series B shares should be entitled to receive, prior to and in preference to any distribution to the holders of the ordinary shares or any other class or series of shares, the amount equaled to 150% of the Series B Original Issue Price (as adjusted for share dividends, share combination, share splits reorganizations, reclassifications, consolidations, or mergers and the like with respect to such shares) and in addition, an amount equaled to all declared but unpaid dividends thereon.
As of December 31, 2009, the liquidation value of the series B shares was $67,497.
Redemption
Upon the occurrence of any of the following events at the request of any holders of series B shares, the Company should redeem all or a part the series B shares, at a redemption price equal to 100% of the series B Original Issue Price per share plus an rate of return of 6% per annum, less all declared dividends (whether paid or unpaid) thereon up to the redemption date, proportionally adjusted for share subdivisions, share dividends, reorganizations, reclassifications, consolidations, or mergers:
| | (i) | A Qualified IPO was not completed by the 5th anniversary of the series B original issue date; |
| | (ii) | Prior to the 5th anniversary of the series B original issue date, the founder, Mr. Tianwen Liu terminated his employment with the Group for any reason, or was no longer employed full time by the Group, or in the good-faith determination of the Board, no longer effectively carried out his responsibilities as the Chief Executive Office (“CEO”) of the Group (other than due to unilateral termination of the employment relationship by the Board without cause); or |
| | (iii) | Prior to the 5th anniversary of the series B original issue date, four or more of the senior management members left employment of the Group for any reason (other than due to unilateral termination of the employment relationship by the Board without cause) within any twelve consecutive month period. |
F-51
ISOFTSTONE HOLDINGS LIMITED
NOTES TO THE CONSOLIDATED FINANCIAL STATEMENTS—(Continued)
FOR THE YEARS ENDED DECEMBER 31, 2010, 2011 AND 2012
(In U.S. dollars in thousands, except share and per share data, or otherwise noted)
18. CONVERTIBLE PREFERENCE SHARES – (Continued)
Series B Convertible Redeemable Preference Shares – (Continued)
Conversion
Each series B share should be convertible, at the option of the holder thereof, at any time after the series B share’s original date of issuance, into such number of fully paid and nonassessable ordinary shares as determined by dividing the series B shares original issue price by series B shares conversion price.
The initial conversion ratio should be on a one for one basis, which is subject to certain anti-dilution adjustments and adjustments for future issuances of shares at a price lower than the issuance price of the series B shares.
Each series B shares would automatically be converted into ordinary shares at the then effective series B conversion price, upon the earlier, of (i) the date specified by vote or written consent, or agreement of holders of at least a majority of the shares of each such series then outstanding, or (ii) immediately prior to but contingent upon the closing of a Qualified IPO.
In December 2010, all Series B shares were automatically converted into 168,880,040 ordinary shares upon the IPO of the Company.
19. CONVERTIBLE NOTES
On December 23, 2009, the Company issued Convertible Notes (the “Notes”) at the principal amount of $29,000. As of December 31, 2009, the Company received proceeds of $28,802 after deduction of $198 issuance cost. On April 21, 2010 and April 22, 2010, the Company issued additional Notes at the principal amount of $9,000 with an issuance cost of $367.
The key terms of the Notes are summarized as follows:
Maturity date
| | • | | Initial Maturity Date—December 23, 2012; |
| | • | | Extended Maturity Date—In the event that no IPO or Company Sale (defined as transactions through which the equity holders of the Company will lose control of the Company or iSoftStone WFOE) has occurred prior to the Initial Maturity Date, a majority of the Notes holders may extend the maturity date to a date on or prior to December 23, 2015. |
Interest rate and interest payment
| | • | | Interest rate is at 1% per annum, due and payable in cash in arrears on each anniversary of December 23, 2009 until the earlier of (i) the Initial Maturity Date, (ii) the date these Notes are otherwise redeemed, or (iii) such date on which these Notes are converted in full. |
| | • | | If the Initial Maturity Date of these notes is extended, these Notes bear no interest between the Initial Maturity Date and the Extended Maturity Date. |
F-52
ISOFTSTONE HOLDINGS LIMITED
NOTES TO THE CONSOLIDATED FINANCIAL STATEMENTS—(Continued)
FOR THE YEARS ENDED DECEMBER 31, 2010, 2011 AND 2012
(In U.S. dollars in thousands, except share and per share data, or otherwise noted)
19. CONVERTIBLE NOTES – (Continued)
Redemption and price
The Company and Notes holders may redeem the Notes on the following basis:
| | • | | Redemption on maturity date by the Company: The Company shall redeem the outstanding principal amount of these Notes that has not been converted or redeemed on the Initial Maturity Date or the Extended Maturity Date, by payment of the redemption price that gives the Notes holders an annual return of 10% in cash. If the Initial Maturity Date or the Extended Maturity Date falls after the completion of an IPO, the Company shall redeem the outstanding principal amount as of the first anniversary following the completion of an IPO by payment of a price that gives the Notes holders an annual rate of return of 18% in cash plus any accrued and unpaid interest. |
| | • | | Post-IPO redemption at the option of the Notes holders: At any time during twelve months following the completion of an IPO, the holders of these Notes shall have the right to require the Company to redeem for cash all of the total outstanding principal amount at a price that gives the Notes holders an annual rate of return of 18% plus any accrued and unpaid interest in priority to any payment on or with respect to the Company equity securities. |
| | • | | Accelerated redemption upon default at option of the Notes holders: Upon the occurrence of an event of default as listed below, the Notes holders shall have the right to require the Company to redeem for cash all of the total outstanding principal amount of the Notes at a price equal to the then applicable redemption price: |
Events of default:
| | (a) | Failure to pay principal or any other amount under these Notes when and as due; |
| | (b) | Breach of covenants, such as punctually paying the interest and principal according to the agreements, giving notice upon the events of default, and no dividend or redemption to the equity securities until earlier of IPO or full repayment of the Notes; |
| | (c) | Except as approved by the Board of Directors, any key managers sold his or her company equity securities at the Original Note Issuance Date; |
| | (d) | Either the founder, Mr. Tianwen Liu, or three out of the other seven key managers have ceased to perform management responsibilities; or |
Conversion and price
| | • | | Mandatory conversion upon Company Sale: Immediately prior to and subject to the completion of a Company Sale, all of the then outstanding principal amount of these Notes and the accrued and unpaid interest thereon shall be automatically converted into such number of ordinary shares at the conversion price set out below. |
| | • | | Optional Conversion upon IPO: At any time during the 12 months after the completion of an IPO, the Notes holders of these Notes shall have the right to convert these Notes in whole, into such number of duly authorized, fully paid and non-assessable Ordinary Shares at the conversion price set out below. |
| | • | | Conversion price is computed with following formula: |
| | • | | Conversion Price = IPO Price or Company Sale Price / ((1+ 0.082254247%) (number of days lapsed between the date of the Notes and the IPO or Company Sale date)) 0.082254247% is the daily compound rate based on a 365-day year that would result in an annual return of 35%. |
| | • | | If the Company issues additional equity securities other than ordinary shares that are convertible into ordinary shares at a price based on a discount of the IPO price or Company Sale price where the Company guarantees the purchaser of such convertible equity securities at an annual return of more than 35%, the above compound rate used for calculating conversion rice shall be adjusted according to the higher rate of return. |
F-53
ISOFTSTONE HOLDINGS LIMITED
NOTES TO THE CONSOLIDATED FINANCIAL STATEMENTS—(Continued)
FOR THE YEARS ENDED DECEMBER 31, 2010, 2011 AND 2012
(In U.S. dollars in thousands, except share and per share data, or otherwise noted)
19. CONVERTIBLE NOTES – (Continued)
Conversion and price – (Continued)
| | • | | The conversion price has a standard anti-dilution adjustment term. It also has a down-round provision. If the Company, after the completion of an IPO, issues any additional ordinary shares or equity security at a price per share that is lower than the conversion price per share then in effect, then the conversion price per share is adjusted down. |
The return rate reset feature, which increases the redemption price of the Notes to give the Notes holders an annual rate of return of 18% rather than 10% if an IPO is completed before Initial Maturity Date or the Extended Maturity Date, were determined to be an embedded derivate and was bifurcated for measurement purposes and is presented on a combined basis with the Notes. The initial fair value of the embedded derivative was $1,706 as of December 23, 2009. And the fair value change from December 23, 2009 to December 31, 2009 was insignificant.
The fair value of the embedded derivative of $1,706 as of December 23, 2009, determined with the assistance of American Appraisal China Limited, an independent valuation firm, and the issuance costs of $198 resulted in a debt discount of $1,904. The debt discount was amortized into interest expenses over the term of the Notes using effective interest method. For the year ended December 31, 2009, the Group incurred $63 interest expense relating to the Notes, of which $62 represented the amortization of the debt discount and $1 represented the coupon interest.
Upon the issuance of additional Notes in April 2010, the initial embedded derivative attached to the second tranche of the Notes was $488 at the issuance date. Upon the Company’s IPO on December 14, 2010, the return rate of the Notes was reset to 18%, and accordingly, the fair value of the two tranches of embedded derivative totaled $8,904. A loss of $2,365 was recorded as the change in fair value of the return rate reset in the statement of operations for the year ended December 31, 2010.
A debt discount of $2,759 was recorded to account for the initial fair value of the two tranches of the embedded derivate and the total issuance cost. The debt discount was amortized into interest expenses over the term of the Notes using effective interest method. For the year ended December 31, 2010, the Group incurred $4,418 interest expense relating to the Notes, of which $133 represented the amortization of the debt discount and $4,285 represented the coupon interest.
In December 2010, Notes at the principal amount of $18,000 were converted into 18,381,991 ordinary shares upon the IPO of the Company. For the remaining Notes at the principal amount of $20,000, the Note holders have the right to convert it into ordinary shares during the twelve months after the completion of an IPO. As a consequence, when the shares were readily convertible into cash upon the completion of the IPO, the conversion right met the definition of a derivative which required to be bifurcated for measurement purposes. As of December 14, 2010, the fair values of the conversion right and the debt host for the remaining Notes of $20,000 were $2,841 and $17,159, respectively. As of December 31, 2010, the fair values of the conversion right and the debt host were $8,904 and $20,511, respectively. The fair value of the conversion right was determined by the Group with the assistance of American Appraisal, and the fair value change from December 14, 2010 to December 31, 2010 was $6,063, and recorded as a loss in the consolidated statement of operations for the year ended December 31, 2010.
On March 3, 2011, Notes at the principal amount of $20,000 were converted into 20,406,720 ordinary shares. The fair value change from January 1, 2011 to March 3, 2011 was $2,832, and recorded as an income in the consolidated statement of operations for the year ended December 31, 2011. From January 1, 2011 to March 3, 2011, the Group incurred $654 interest expense relating to the Notes, of which $19 represented the amortization of the debt discount and $635 represented the coupon interest.
20. EMPLOYEE BENEFIT PLAN
Full time employees of the Group located in the PRC (mainland), Hong Kong, Taiwan, and Japan participate in a government-mandated defined contribution plan pursuant to which certain pension benefits, medical care, unemployment insurance, employee housing fund and other welfare benefits are provided to employees. The Group accrues for these benefits based on certain percentages of the employees’ salaries.
The total provisions for such employee benefits were $13,644, $20,188 and $26,687 for the years ended December 31, 2010, 2011 and 2012, respectively.
F-54
ISOFTSTONE HOLDINGS LIMITED
NOTES TO THE CONSOLIDATED FINANCIAL STATEMENTS—(Continued)
FOR THE YEARS ENDED DECEMBER 31, 2010, 2011 AND 2012
(In U.S. dollars in thousands, except share and per share data, or otherwise noted)
21. STATUTORY RESERVES AND RESTRICTED NET ASSETS
In accordance with the Regulations on Enterprises with Foreign Investment of China and their articles of association, the Group’s subsidiaries and VIE located in the PRC (mainland), being foreign invested enterprises established in the PRC (mainland), are required to provide for certain statutory reserves, namely general reserve, enterprise expansion reserve, and staff welfare and bonus reserve, all of which are appropriated from net profit as reported in their PRC statutory accounts. The Group’s subsidiaries are required to allocate at least 10% of their after-tax profits to the general reserve until such reserve has reached 50% of their respective registered capital.
Appropriations to the enterprise expansion reserve and the staff welfare and bonus reserve are to be made at the discretion of the board of directors of each of the Group’s subsidiaries. The appropriations to these reserves by the Group’s PRC (mainland) subsidiaries were $1,570, $3,961 and $1,795 for the years ended December 31, 2010, 2011 and 2012, respectively.
As a result of these PRC laws and regulations and the requirement that distributions by PRC entities can only be paid out of distributable profits computed in accordance with PRC GAAP, the PRC entities are restricted from transferring a portion of their net assets to the Group. Amounts restricted include paid-in capital and the statutory reserves of the Company’s PRC subsidiaries and VIE. As of December 31, 2011 and 2012, the aggregate amounts of capital and statutory reserves restricted which represented the amount of net assets of the relevant subsidiaries and VIE in the Group not available for distribution was $131,921 and $134,264, respectively. As a result of the above restrictions, parent-only financials are presented on financial statement schedule I.
22. SHARE-BASED COMPENSATION
Share options
In November 2005, the Company’s shareholders approved to reserve an aggregate of 19,579,549 ordinary shares for the share incentive plan. Accordingly, the Group granted share options to certain employees and non-employees of the Group to purchase 11,116,500 and 8,445,500 ordinary shares in 2006 and 2007, respectively.
On March 1, 2008, the Company’s Board of Directors approved the “2008 Share Incentive Plan” (the “2008 Plan”). Under the 2008 Plan, the Company may issue share options to purchase up to 40,689,554 ordinary shares, including 19,579,549 ordinary shares previously reserved in 2005, to employees and non-employees of the Group.
On December 17, 2009, the Company’s Board of Directors approved “the 2009 Share Incentive Plan” (the “2009 Plan”). Under the 2009 Plan, the Company may issue nonvested shares and share options to purchase up to 52,324,472 ordinary shares to employees and non-employees of the Group.
On November 25, 2010, the Company’s Board of Directors approved “the 2010 Share Incentive Plan” (the “2010 Plan”). Under the 2010 Plan, the Company may issue share options, restricted shares, share units, and other types of equity incentives to employees and non-employees of the Group subject to the limit as below:
The maximum number of Ordinary Shares that may be delivered pursuant to awards granted to Eligible Persons under this Plan (the “Share Limit”) is equal to the sum of the following:
| | (1) | 7,500,000 Ordinary Shares, plus |
| | (2) | the number of any shares subject to share options granted under the Company’s 2008 Plan and the Company’s 2009 Plan, and outstanding on the date of shareholder approval of the 2010 Plan (the “Shareholder Approval Date”) which expire, or for any reason are cancelled or terminated, after the Shareholder Approval Date without being exercised. |
In addition, the Share Limit shall automatically increase on January 1 of each year during the term of this Plan, commencing from January 1, 2011, by an amount equal to the lesser of (i) two and one-half percent (2.5%) of the total number of ordinary shares issued and outstanding on December 31 of the immediately preceding calendar year, (ii) 20,000,000 ordinary shares or (iii) such number of ordinary shares as may be established by the Board.
The “2010 Plan” shall terminate at the close of business on the day before the tenth anniversary of the effective date of the plan.
F-55
ISOFTSTONE HOLDINGS LIMITED
NOTES TO THE CONSOLIDATED FINANCIAL STATEMENTS—(Continued)
FOR THE YEARS ENDED DECEMBER 31, 2010, 2011 AND 2012
(In U.S. dollars in thousands, except share and per share data, or otherwise noted)
22. SHARE-BASED COMPENSATION – (Continued)
Share options – (Continued)
Termination of option
The option may not be exercised until vested. Once vested, the option may be exercised in whole or any part, at any time. However, a vested option must be exercised, if at all, prior to the earlier of: (a) twelve months following the grantee’s termination of service because of death or disability; (b) thirty days or sixty days following the grantee’s last day of active employment or service for any reason other than death or disability; or (c) the tenth anniversary of the grant date; and if not exercised prior thereto shall terminate and no longer be exercisable.
Option exercise
The option shall be exercisable by the delivery of a written notice of exercise on any business day to the secretary of the Company, in the form approved by the Company, stating the number of ordinary shares to be purchased pursuant to the option and payment in full for the exercise price of the shares to be purchased in cash, by check or by electronic funds transfer to the Company.
Options to employees
During the years ended December 31, 2010, 2011 and 2012, the Company granted a total of 17,702,215, 10,250,672, and 6,642,000 share options to employees and directors at an exercise price of $0.65 per share, $0.50 to $1.98 per share and $0.41 per share, respectively.
Options to non-employees
The Company granted 3,978,000, 501,125 and 1,000,000 options to certain non-employees and independent directors for their services in 2010, 2011 and 2012, at an exercise price of $0.65 to $1.24 per share, $0.30 to $0.65 per share and $0.41 per share, respectively.
The options will vest in accordance with the vesting schedule set out in the option award agreement, which is (1) 100% immediately on date of grant, or (2) 1/4 on each anniversary from the date of grant or (3) 1/4 on the first anniversary from the date of grant, and the remaining 75% in 36 substantially equal monthly installments, with the first installment vesting on the last day of the month following the month in which the first anniversary of the Award Date occurs and an additional installment vesting on the last day of each of the 35 months thereafter.
On December 13, 2012, the Group’s Compensation Committee approved to amend the terms of the exercise price for 8,910,750 stock options previously granted under the 2010 Plan on and after April 29, 2011 that was outstanding and held by individuals currently employed by the Group. The exercise price was set at the greater of (i) the per-share closing price of the Company’s ordinary shares on December 13, 2012 or (ii) the average of the per-share closing prices over the period of 30 trading days ending on the date hereof. There was no change of the vesting provisions or the number of shares subject to any of the option awarded. This was accounted for as a share option modification and required the remeasurement of the fair value of these share options. The remeasurement resulted in a total incremental share-based compensation of $909, of which $330 was recognized in the year ended December 31, 2012 and the remaining is to be recognized ratably over the remaining vesting period of the award.
F-56
ISOFTSTONE HOLDINGS LIMITED
NOTES TO THE CONSOLIDATED FINANCIAL STATEMENTS—(Continued)
FOR THE YEARS ENDED DECEMBER 31, 2010, 2011 AND 2012
(In U.S. dollars in thousands, except share and per share data, or otherwise noted)
22. SHARE-BASED COMPENSATION – (Continued)
Share options – (Continued)
The following table summarizes information regarding the share options granted:
| | | | | | | | | | | | |
Grant date | | Options granted | | | Exercise price
per option | | | Intrinsic value
per option
at the grant dates | |
December 15, 2006 | | | 11,116,500 | | | $ | 0.3 | | | $ | — | |
April 1, 2007 | | | 8,445,500 | | | | 0.3 | | | | — | |
April 1, 2008 | | | 11,382,303 | | | | 0.3 | | | | — | |
December 20, 2008 | | | 9,131,962 | | | | 0.3 | | | | — | |
September 1, 2009 | | | 590,000 | | | | 0.5 | | | | — | |
December 23, 2009 | | | 26,160,702 | | | | 0.5 | | | | — | |
August 1, 2010 | | | 16,347,380 | | | | 0.65 | | | | — | |
September 15, 2010 | | | 4,932,835 | | | | 0.65 | | | | 0.48 | |
November 19, 2010 | | | 400,000 | | | | 1.24 | | | | — | |
April 29, 2011 | | | 492,500 | | | | 0.43 | (i) | | | — | |
June 27, 2011 | | | 9,218,172 | | | | 0.43 | (i) | | | — | |
June 27, 2011 | | | 1,125 | | | | 0.3 | | | | 1.06 | |
October 7, 2011 | | | 500,000 | | | | 0.65 | | | | — | |
November 11, 2011 | | | 400,000 | | | | 0.43 | (i) | | | — | |
November 22, 2011 | | | 90,000 | | | | 0.43 | (i) | | | — | |
December 31, 2011 | | | 50,000 | | | | 0.5 | | | | 0.38 | |
December 13, 2012 | | | 7,642,000 | | | | 0.41 | | | | — | |
| | | | | | | | | | | | |
Total | | | 106,900,979 | | | | | | | | | |
| | | | | | | | | | | | |
| (i) | On December 13, 2012, the Group’s Compensation Committee approved to amend the terms of the exercise price for options previously granted. The exercise price was set at $0.43 which was the greater of (i) the per-share closing price of the Company’s ordinary shares on December 13, 2012 or (ii) the average of the per-share closing prices over the period of 30 trading days ended on December 13, 2012. |
| | | | | | | | | | | | | | | | | | | | | | | | |
| | | 2010 | | | 2011 | | | 2012 | |
| | | Number of
options | | | Weighted average
exercise price per
option | | | Number of
options | | | Weighted average
exercise price per
option | | | Number of
options | | | Weighted average
exercise price
per option | |
Outstanding at beginning of year | | | 66,120,217 | | | $ | 0.4 | | | | 84,974,660 | | | $ | 0.5 | | | | 80,477,703 | | | $ | 0.5 | (ii) |
Granted | | | 21,680,215 | | | | 0.7 | | | | 10,751,797 | | | | 1.3 | | | | 7,642,000 | | | | 0.4 | |
Exercised | | | (80,000 | ) | | | 0.4 | | | | (12,078,146 | ) | | | 0.3 | | | | (4,882,420 | ) | | | 0.3 | |
Forfeited | | | (2,745,772 | ) | | | 0.4 | | | | (2,948,108 | ) | | | 0.5 | | | | (1,852,450 | ) | | | 0.7 | |
Modified(i) | | | — | | | | — | | | | (222,500 | ) | | | 2.0 | | | | — | | | | — | |
| | | | | | | | | | | | | | | | | | | | | | | | |
Outstanding at end of year | | | 84,974,660 | | | $ | 0.5 | | | | 80,477,703 | | | $ | 0.6 | (ii) | | | 81,384,833 | | | $ | 0.5 | |
| | | | | | | | | | | | | | | | | | | | | | | | |
Vested and expect to vest | | | | | | | | | | | 76,624,160 | | | | | | | | 78,510,449 | | | | | |
| | | | | | | | | | | | | | | | | | | | | | | | |
| (i) | On November 15, 2011, 222,500 share options granted to certain employees on April 29, 2011 were modified to restricted share units. The incremental cost is $0.67 per share. |
| (ii) | On December 13, 2012, the Group’s Compensation Committee approved to amend the terms of the exercise price for options previously granted in 2011, and as a result, the weighted average exercise price per option was recalculated as $0.5 as of December 31, 2011, compared to $0.6 before the remeasurement. |
F-57
ISOFTSTONE HOLDINGS LIMITED
NOTES TO THE CONSOLIDATED FINANCIAL STATEMENTS—(Continued)
FOR THE YEARS ENDED DECEMBER 31, 2010, 2011 AND 2012
(In U.S. dollars in thousands, except share and per share data, or otherwise noted)
22. SHARE-BASED COMPENSATION – (Continued)
Share options – (Continued)
The following table summarizes information with respect to share options outstanding as of December 31, 2012:
| | | | | | | | | | | | | | | | | | | | | | | | | | | | | | | | |
| | | Options outstanding | | | Options exercisable | |
| | | Number
outstanding | | | Weighted
average
remaining
contractual
term | | | Exercise price
per option | | | Aggregate
intrinsic
value as of
December 31,
2012 | | | Number
exercisable | | | Weighted
average
remaining
contractual
term | | | Exercise
price
per
option | | | Aggregate
intrinsic
value as of
December 31,
2012 | |
December 15, 2006 | | | 6,529,500 | | | | 4.00 | | | $ | 0.30 | | | $ | 823 | | | | 6,529,500 | | | | 4.00 | | | $ | 0.30 | | | $ | 823 | |
April 1, 2007 | | | 6,246,270 | | | | 4.33 | | | | 0.30 | | | | 787 | | | | 6,246,270 | | | | 4.33 | | | | 0.30 | | | | 787 | |
April 1, 2008 | | | 7,194,000 | | | | 5.33 | | | | 0.30 | | | | 906 | | | | 7,194,000 | | | | 5.33 | | | | 0.30 | | | | 906 | |
December 20, 2008 | | | 3,381,250 | | | | 6.00 | | | | 0.30 | | | | 426 | | | | 3,381,250 | | | | 6.00 | | | | 0.30 | | | | 426 | |
September 1, 2009 | | | 537,500 | | | | 6.75 | | | | 0.50 | | | | — | | | | 430,000 | | | | 6.75 | | | | 0.50 | | | | — | |
December 23, 2009 | | | 21,307,727 | | | | 7.00 | | | | 0.50 | | | | — | | | | 16,391,357 | | | | 7.00 | | | | 0.50 | | | | — | |
August 1, 2010 | | | 13,802,998 | | | | 7.75 | | | | 0.65 | | | | — | | | | 8,467,514 | | | | 7.75 | | | | 0.65 | | | | — | |
September 15, 2010 | | | 4,932,835 | | | | 7.75 | | | | 0.65 | | | | — | | | | 2,959,701 | | | | 7.75 | | | | 0.65 | | | | — | |
November 19, 2010 | | | 400,000 | | | | 7.88 | | | | 1.24 | | | | — | | | | 200,000 | | | | 7.88 | | | | 1.24 | | | | — | |
April 29, 2011 | | | 200,000 | | | | 8.33 | | | | 0.43 | | | | — | | | | 83,333 | | | | 8.33 | | | | 0.43 | | | | — | |
June 27, 2011 | | | 8,240,753 | | | | 8.49 | | | | 0.43 | | | | — | | | | 3,090,282 | | | | 8.49 | | | | 0.43 | | | | — | |
October 7, 2011 | | | 500,000 | | | | 8.77 | | | | 0.65 | | | | — | | | | 500,000 | | | | 8.77 | | | | 0.65 | | | | — | |
November 11, 2011 | | | 400,000 | | | | 8.84 | | | | 0.43 | | | | — | | | | 108,333 | | | | 8.84 | | | | 0.43 | | | | — | |
November 22, 2011 | | | 70,000 | | | | 8.89 | | | | 0.43 | | | | — | | | | 20,093 | | | | 8.89 | | | | 0.43 | | | | — | |
December 13, 2012 | | | 7,642,000 | | | | 9.95 | | | | 0.41 | | | | 145 | | | | — | | | | 9.95 | | | | 0.41 | | | | — | |
| | | | | | | | | | | | | | | | | | | | | | | | | | | | | | | | |
| | | 81,384,833 | | | | | | | | | | | $ | 3,087 | | | | 55,601,634 | | | | | | | | | | | $ | 2,942 | |
| | | | | | | | | | | | | | | | | | | | | | | | | | | | | | | | |
The range of fair value of the options as of their respective grant dates is as follows:
| | | | | | | | | | | | |
| | | For the year ended December 31, | |
| | | 2010 | | | 2011 | | | 2012 | |
Options | | $ | 0.36 – 0.76 | | | $ | 0.43 – 1.18 | | | $ | 0.19 | |
80,000, 12,078,146 and 4,882,420 share options were exercised in 2010, 2011 and 2012 respectively. Total intrinsic value of options exercised in 2010, 2011 and 2012 was $116, $12,369 and $524 respectively, as the fair value of the options exercised exceeded its exercise price at the date of exercise.
The fair value of each option granted was estimated on the date of grant using the Black-Scholes option pricing model with the following assumptions used for grants during the applicable periods:
| | | | | | | | | | | | |
| | | For the year ended December 31, | |
| | | 2010 | | | 2011 | | | 2012 | |
Risk-free interest rate of return | | | 1.94 | % | | | 1.09% – 1.43 | % | | | 0.89 | % |
Expected term | | | 5.3 – 10 years | | | | 5 – 10 years | | | | 6.1 years | |
Volatility | | | 57.0% – 61.2 | % | | | 55.3% – 58.9 | % | | | 57.4 | % |
Dividend yield | | | — | | | | — | | | | — | |
F-58
ISOFTSTONE HOLDINGS LIMITED
NOTES TO THE CONSOLIDATED FINANCIAL STATEMENTS—(Continued)
FOR THE YEARS ENDED DECEMBER 31, 2010, 2011 AND 2012
(In U.S. dollars in thousands, except share and per share data, or otherwise noted)
22. SHARE-BASED COMPENSATION – (Continued)
Share options – (Continued)
(1) Volatility
The volatility of the underlying ordinary shares during the life of the options was estimated based on the historical stock price volatility of listed comparable companies over a period comparable to the expected term of the options.
(2) Risk-free interest rate
Risk-free interest rate was estimated based on the yield to maturity of China international government bonds with a maturity period close to the expected term of the options.
(3) Expected term
For the options granted to employees, it estimated the expected term based on a consideration of factors including contractual term and vesting period.
For the options granted to non-employees, the Company estimated the expected term as the original contractual term.
(4) Dividend yield
The dividend yield was estimated by the Group based on its expected dividend policy over the expected term of the options.
(5) Exercise price
The exercise price of the options was determined by the Group’s board of directors.
(6) Fair value of underlying ordinary shares
Before the IPO, the estimated fair value of the ordinary shares underlying the options as of the respective grant dates was determined based on a retrospective valuation. When estimating the fair value of the ordinary shares on the grant dates, management has considered a number of factors, including the result of a third-party appraisal by American Appraisal China Limited and equity transactions of the Company, while taking into account standard valuation methods and the achievement of certain events. The determination of fair value of the ordinary shares was also with the assistance of American Appraisal China Limited, an independent third party valuation specialist. After the IPO, the fair value of the ordinary shares is determined as the closing sales price of the shares.
For employee share options, the Group recorded share-based compensation of $3,077, $4,778 and $5,061 during the years ended December 31, 2010, 2011 and 2012, respectively, based on the fair value on the grant dates over the requisite service period of award using the straight-line method. In 2012, the incremental share-based compensation resulting from the modification of repricing at $909 has been included in the aforementioned amount in 2012.
For non-employee share options the Group recorded share-based compensation of $999, $2,015 and $355 during the years ended December 31, 2010, 2011 and 2012, respectively, based on the fair value on the grant dates over the requisite service period of award using the straight-line method.
As of December 31, 2012, total unrecognized compensation expense relating to unvested share options was $7,798. The amount is expected to be recognized over a weighted average period of 1.30 years using the straight-line method.
Nonvested shares
The Group agreed to grant certain ordinary shares to certain employees of the Group in connection with the acquisition of Kebao in 2006, the acquisition of MDCL in 2009 and the employment of certain other employees. The Group has the right to repurchase these shares for free if the grantees terminate their continuous employment within a period of 24-36 months from the date of grant. The arrangements were considered a share-based compensation arrangement and the shares were treated as nonvested shares.
F-59
ISOFTSTONE HOLDINGS LIMITED
NOTES TO THE CONSOLIDATED FINANCIAL STATEMENTS—(Continued)
FOR THE YEARS ENDED DECEMBER 31, 2010, 2011 AND 2012
(In U.S. dollars in thousands, except share and per share data, or otherwise noted)
22. SHARE-BASED COMPENSATION – (Continued)
Nonvested Shares – (Continued)
On April 29, 2011, the Company issued 665,999 nonvested shares to employees under the 2010 Plan.
These shares vest 25% on each anniversary of the grant date over four years.
The following table summarizes information regarding the nonvested shares granted:
| | | | |
| | | Average
nonvested
ordinary
shares granted | |
Outstanding at January 1, 2010 | | | 425,447 | |
Modification to certain share-based compensation arrangement(i) | | | (143,822 | ) |
Vested | | | (281,625 | ) |
| | | | |
Outstanding at December 31, 2010 , 2011 and 2012 | | | — | |
| | | | |
| (i) | At the time of the acquisition of MDCL in March 2009, the Group entered into arrangements with certain selling shareholders in MDCL who became employees whereby such employees were to receive 180,031 shares which vested at the end of a service period of 24 months from the date of the acquisition. |
In April 2010, the Group entered into revised agreements with those employees to modify the previous terms of the award. Under the terms of the modification:
| | • | | 36,209 shares vested immediately and $8 unrecognized share-based compensation expense was immediately recognized as of the modification date, the 36,209 shares were issued by using treasury shares in 2011; |
| | • | | the Group replaced the remaining fixed number of unvested shares with an obligation to issue a variable number of ordinary shares at the end of the 24 month service period. The variable number of shares is to be determined by dividing $68 by the fair value of the ordinary shares upon the vesting date. This resulted in the award being reclassified from an equity award into a liability award under which the fair value of the award is remeasured at each reporting date. As a result, $40 previously recorded share-based compensation within equity was re-classified as a liability on the date of modification and remeasured at each period end by the Group, with the assistance of American Appraisal China Limited, an independent valuation firm. As of December 31, 2010, the share-based compensation liability was carried at $62. In 2011, the shares related to acquisition of MDCL were determined to be 152,863 shares and were issued in August 2011. |
The fair value of the nonvested shares was determined at the grant dates by the Group with the assistance of American Appraisal China Limited, an independent valuation firm. The Group recognized $50, $7 and nil shares based compensation expense for the years ended December 31, 2010, 2011 and 2012, respectively, by amortizing the award based on the fair value at the grant date by using straight-line method over the requisite service period.
As of December 31, 2012, total unrecognized compensation expense relating to unvested nonvested shares was nil.
F-60
ISOFTSTONE HOLDINGS LIMITED
NOTES TO THE CONSOLIDATED FINANCIAL STATEMENTS—(Continued)
FOR THE YEARS ENDED DECEMBER 31, 2010, 2011 AND 2012
(In U.S. dollars in thousands, except share and per share data, or otherwise noted)
22. SHARE-BASED COMPENSATION – (Continued)
Share Units
Under the 2010 Plan, the Company granted a total of 5,803,607 and 4,947,730 share units to employees and directors during the year ended December 31, 2011 and 2012 respectively, and 2,353,974 and 5,333,110 share units to non-employees during the year ended December 31, 2011 and 2012 respectively.
The share units will vest in accordance with the vesting schedule set out in the option award agreement, which is (1) 1/4 on each anniversary from the date of grant or (3)1/3 on each anniversary from the date of grant or (4) 1/2 on each anniversary from the date of grant or (5) 100% on the first anniversary from the date of grant or (6) 1/4 on each end of quarter from the date of grant.
The fair value of these share units is measured on the grant date based on the market price of the share on the grant date. The following table summarizes information regarding the share units granted:
| | | | | | | | | | | | | | | | |
| | | 2011 | | | 2012 | |
| | | Number of share
units | | | Weighted average grant date
fair value | | | Number of share
units | | | Weighted average grant date
fair value | |
Outstanding at beginning of year | | | — | | | $ | — | | | | 8,149,498 | | | $ | 1.01 | |
Granted | | | 8,157,581 | | | | 1.01 | | | | 10,280,840 | | | | 0.55 | |
Vested | | | (100,000 | ) | | | 1.54 | | | | (6,803,641 | ) | | | 0.98 | |
Forfeited | | | (130,583 | ) | | | 1.10 | | | | (531,641 | ) | | | 0.95 | |
Modified | | | 222,500 | | | | 1.06 | | | | — | | | | — | |
| | | | | | | | | | | | | | | | |
Outstanding at end of year | | | 8,149,498 | | | | 1.01 | | | | 11,095,056 | | | | 0.61 | |
| | | | | | | | | | | | | | | | |
Expect to vest at end of year | | | 7,444,097 | | | | | | | | 10,635,646 | | | | | |
| | | | | | | | | | | | | | | | |
The intrinsic value of share units vested was nil for the year ended December 31, 2011 and 2012.
The Group recorded share-based compensation of $2,159 and $3,365 for employee share units during the year ended December 31, 2011 and 2012 respectively, and $175 and $2,094 for non-employee share units during the year ended December 31, 2011 and 2012 respectively, based on the fair value on the grant dates over the requisite service period of award using the straight-line method.
As of December 31, 2012, total unrecognized compensation expense relating to unvested share units was $5,672. The amount is expected to be recognized over a weighted average period of 2.73 years using the straight-line method.
Restricted Shares
On April 29, 2011, the Company issued 665,999 restricted shares (nonvested shares) to employees under the 2010 Plan. These shares vest 25% on each anniversary of the grant date over four years. The fair value of these shares is measured on the grant date based on the market price of the stock on the grant date. The following table summarizes information regarding the restricted share granted:
| | | | | | | | | | | | | | | | |
| | | 2011 | | | 2012 | |
| | | Number of share | | | Weighted average grant
date
fair value | | | Number of share | | | Weighted average grant
date
fair value | |
Outstanding at beginning of year | | | — | | | $ | — | | | | 665,999 | | | $ | 1.98 | |
Granted | | | 665,999 | | | | 1.98 | | | | — | | | | — | |
Forfeited | | | — | | | | — | | | | (206,893 | ) | | | 1.98 | |
Vested | | | — | | | | — | | | | (163,870 | ) | | | 1.98 | |
| | | | | | | | | | | | | | | | |
Outstanding at end of year | | | 665,999 | | | | 1.98 | | | | 295,236 | | | | 1.98 | |
| | | | | | | | | | | | | | | | |
Expect to vest at end of year | | | 586,079 | | | | | | | | 259,808 | | | | | |
| | | | | | | | | | | | | | | | |
The Group recorded share-based compensation of $245 during the years ended December 31, 2012 , based on the fair value on the grant dates over the requisite service period of award using the straight-line method.
F-61
ISOFTSTONE HOLDINGS LIMITED
NOTES TO THE CONSOLIDATED FINANCIAL STATEMENTS—(Continued)
FOR THE YEARS ENDED DECEMBER 31, 2010, 2011 AND 2012
(In U.S. dollars in thousands, except share and per share data, or otherwise noted)
22. SHARE-BASED COMPENSATION – (Continued)
Other share-based compensation arrangements
In April 2010, the Company entered into a performance-based share incentive agreement with certain employees to compensate their performance-based services for the period from year 2007 to 2010.
Pursuant to such agreement, 1,739,130 ordinary shares, valued at $0.54 per share, were issued on April 18, 2010 to compensate these employees’ past services. The ordinary shares were valued by the Group, with the assistance of American Appraisal China Limited, an independent valuation firm.
On June 30, 2010, 2,760,870 ordinary shares, valued at $0.64 per share, were further issued, to compensate these employees’ past services. The ordinary shares were valued by the Group, with the assistance of American Appraisal China Limited, an independent valuation firm.
The total 4,500,000 shares issued were considered as share-based compensations and $2,706, the fair value of the ordinary shares as of the grant dates, were charged into the consolidated statement of operations immediately. In addition, the Group also agreed to issue up to 1,000,000 of the Company’s shares to these employees based on their performance in the year 2010. The Group recognized $640 compensation expenses for the year ended December 31, 2010 relating to this share-based compensation arrangement.
In October 2010, the Group sold 461,000 and 700,000 of the treasury shares at the price of $0.51 and $0.30 per share, respectively, to a former employee. The $861 excess of the fair value of the ordinary shares, which is determined as $1.125 at the selling date by the Company, over the purchase price were treated as share-based compensation expense and reflected in the statements of operations.
In November 2010, the Group agreed to issue 324,849 ordinary shares to a consultant who introduced business to iSoftStone Data and recognized $191 share-based compensation expense for the year ended December 31, 2010. The shares were issued in March 2011.
The amount of stock-based compensation attributable to cost of revenues, general and administrative expenses, selling and marketing expenses, and research and development expenses is included in those line items in the accompanying consolidated statements of operations. Stock-based compensation expense related to the stock options and stock units are as follows:
| | | | | | | | | | | | |
| | | For the year ended December 31, | |
| | | 2010 | | | 2011 | | | 2012 | |
Cost of revenues | | $ | 175 | | | $ | 307 | | | $ | 509 | |
Operating expenses: | | | | | | | | | | | | |
General and administrative expenses | | | 8,091 | | | | 7,611 | | | | 8,972 | |
Selling and marketing expenses | | | 273 | | | | 1,225 | | | | 1,441 | |
Research and development expenses | | | 7 | | | | 188 | | | | 198 | |
| | | | | | | | | | | | |
Total stock-based compensation expenses | | $ | 8,546 | | | $ | 9,331 | | | $ | 11,120 | |
| | | | | | | | | | | | |
F-62
ISOFTSTONE HOLDINGS LIMITED
NOTES TO THE CONSOLIDATED FINANCIAL STATEMENTS—(Continued)
FOR THE YEARS ENDED DECEMBER 31, 2010, 2011 AND 2012
(In U.S. dollars in thousands, except share and per share data, or otherwise noted)
23. FAIR VALUE MEASUREMENTS
Measured on recurring basis
The Group measured the cash and cash equivalents at fair value on a recurring basis as of December 31, 2011 and 2012, which were classified within Level 1 of the fair value hierarchy because they were valued based on the quoted market price in an active market.
The Group did not have Level 2 investments as of December 31, 2011 and 2012.
Contingent consideration payables in connection with business acquisition was classified within Level 3 of the fair value hierarchy because the Group used unobservable inputs reflecting the Group’s assessment of the assumptions market participants would use in valuing these assets and liabilities. The Group measured the fair value of the contingent considerations considering, among other factors, forecasted financial performance of the acquired businesses.
The contingent consideration payables in Level 3 as of December 31, 2011 and 2012 were as follows:
| | | | | | | | | | | | | | | | |
| | | December 31, | | | Quoted Prices in
Active Market for
Identical Liabilities | | | Significant
Other
Observable
Inputs | | | Significant
Unobservable
Inputs | |
| | | 2011 | | | | | | | | | | |
Contingent consideration | | $ | 4,076 | | | $ | — | | | $ | — | | | $ | 4,076 | |
| | | | | | | | | | | | | | | | |
Total | | $ | 4,076 | | | $ | — | | | $ | — | | | $ | 4,076 | |
| | | | | | | | | | | | | | | | |
| | | | |
| | | 2012 | | | | | | | | | | |
Contingent consideration | | $ | 2,280 | | | $ | — | | | $ | — | | | $ | 2,280 | |
| | | | | | | | | | | | | | | | |
Total | | $ | 2,280 | | | $ | — | | | $ | — | | | $ | 2,280 | |
| | | | | | | | | | | | | | | | |
The following table summarized the movement of the balances of the Group’s contingent consideration payables in Level 3 for the year ended December 31, 2011 and 2012
| | | | |
| | | Amounts | |
Balance as of December 31, 2010 | | $ | 9,564 | |
Initial recognition of contingent consideration in connection with acquisitions | | | 2,238 | |
Realized loss included in earnings | | | 4,969 | |
Settlement of contingent consideration of acquisitions | | | (3,729 | ) |
Settlement of share-based compensation liability | | | (62 | ) |
Settlement of conversion right feature of convertible notes | | | (8,904 | ) |
| | | | |
Balance as of December 31, 2011 | | $ | 4,076 | |
Initial recognition of contingent consideration in connection with acquisitions | | | 2,963 | |
Realized loss included in earnings | | | 911 | |
Settlement of contingent consideration of acquisitions | | | (2,471 | ) |
Transfers out to deferred consideration | | | (3,252 | ) |
Foreign exchange differences | | | 53 | |
| | | | |
Balance as of December 31, 2012 | | $ | 2,280 | |
| | | | |
F-63
ISOFTSTONE HOLDINGS LIMITED
NOTES TO THE CONSOLIDATED FINANCIAL STATEMENTS—(Continued)
FOR THE YEARS ENDED DECEMBER 31, 2010, 2011 AND 2012
(In U.S. dollars in thousands, except share and per share data, or otherwise noted)
23. FAIR VALUE MEASUREMENTS – (Continued)
Measured on recurring basis – (Continued)
The Group measured the fair value of the contingent considerations considering, among other factors, forecasted financial performance of the acquired businesses, market performance, and the market potential of the acquired businesses. These contingent considerations are considered Level 3 liabilities because the Group used unobservable inputs, reflecting the Group’s assessment of the assumptions market participants would use in valuing these assets and liabilities.
The Group measures the return rate reset feature of the convertible notes using “with & without” valuation method. The derivative was considered a Level 3 liability because the Group used unobservable inputs, such as the estimation of the probability return rate reset occurring and appropriate discount rate, to determine the fair value of the derivatives.
The fair value of the conversion right feature of convertible notes was determined by the Group with the assistance of American Appraisal China Limited, an independent valuation firm, using the Binomial option pricing model with assumptions as follows:
| | | | | | | | |
| | | For the year ended December 31, | |
| | | As of
Initial Measurement
Date (December 14,
2010) | | | As of
December 31,
2010 | |
Risk-fee rate of return | | | 1.17 | % | | | 1.20 | % |
Expected remaining contractual life of the warrants | | | 1.0 years | | | | 0.95 years | |
Volatility | | | 42 | % | | | 41 | % |
Expected dividend yield | | | — | | | | — | |
Measured on non-recurring basis
The Group’s financial assets and liabilities measured at fair value on a non-recurring basis include acquired assets and liabilities at initial recognition based on Level 3 inputs in connection with business acquisitions.
The Group measured the fair value of the purchased intangible assets using the “cost”, “income approach-excess earnings” and “with & without” valuation methods. These purchased intangible assets are considered Level 3 assets and liabilities because the Group used unobservable inputs, such as forecasted financial performance of the acquired business and discount rates, to determine the fair value of these purchased assets/liabilities.
F-64
ISOFTSTONE HOLDINGS LIMITED
NOTES TO THE CONSOLIDATED FINANCIAL STATEMENTS—(Continued)
FOR THE YEARS ENDED DECEMBER 31, 2010, 2011 AND 2012
(In U.S. dollars in thousands, except share and per share data, or otherwise noted)
24. NONCONTROLLING INTEREST
| | | | | | | | | | | | | | | | | | | | | | | | | | | | | | | | |
| | | Jiewen | | | Guodian | | | iSoftStone
Korea | | | Wuxi
iCarnegie | | | iHealthStone | | | iSS-iSYS | | | SZ-
Information | | | Total | |
Balance as of January 1, 2010 | | $ | — | | | $ | — | | | $ | (18 | ) | | $ | 513 | | | $ | — | | | $ | — | | | $ | — | | | $ | 495 | |
Net income (loss) | | | 37 | | | | 110 | | | | (1 | ) | | | (584 | ) | | | — | | | | — | | | | — | | | | (438 | ) |
Capital contribution from noncontrolling shareholder of Guodian (Note 9) | | | — | | | | 586 | | | | — | | | | — | | | | — | | | | — | | | | — | | | | 586 | |
Capital contribution from noncontrolling shareholder of Jiewen | | | 242 | | | | — | | | | — | | | | — | | | | — | | | | — | | | | — | | | | 242 | |
Deconsolidation of Wuxi iCarnegie | | | — | | | | — | | | | — | | | | 67 | | | | — | | | | — | | | | — | | | | 67 | |
Acquisition of noncontrolling interest of iSoftStone Korea (i) | | | — | | | | — | | | | 15 | | | | — | | | | — | | | | — | | | | — | | | | 15 | |
Foreign currency translation adjustment | | | 8 | | | | 23 | | | | 4 | | | | 4 | | | | — | | | | — | | | | — | | | | 39 | |
| | | | | | | | | | | | | | | | | | | | | | | | | | | | | | | | |
Balance as of December 31, 2010 | | | 287 | | | | 719 | | | | — | | | | — | | | | — | | | | — | | | | — | | | | 1,006 | |
Net (loss) income | | | (40 | ) | | | 225 | | | | — | | | | — | | | | (32 | ) | | | (2 | ) | | | — | | | | 151 | |
Noncontrolling interest acquired in connection with the acquisitions of iHealthStone | | | — | | | | — | | | | — | | | | — | | | | (14 | ) | | | — | | | | — | | | | (14 | ) |
Capital contribution from noncontrolling shareholder of iHealthStone | | | — | | | | — | | | | — | | | | — | | | | 46 | | | | — | | | | — | | | | 46 | |
Capital contribution from noncontrolling shareholder of iSS-iSYS | | | — | | | | — | | | | — | | | | — | | | | — | | | | 350 | | | | — | | | | 350 | |
Foreign currency translation adjustment | | | 12 | | | | 42 | | | | — | | | | — | | | | — | | | | 6 | | | | — | | | | 60 | |
| | | | | | | | | | | | | | | | | | | | | | | | | | | | | | | | |
Balance as of December 31, 2011 | | | 259 | | | | 986 | | | | — | | | | — | | | | — | | | | 354 | | | | — | | | | 1,599 | |
Net (loss) income | | | (6 | ) | | | 123 | | | | — | | | | — | | | | (38 | ) | | | (28 | ) | | | (78 | ) | | | (27 | ) |
Capital contribution from noncontrolling shareholder of SZ- Information | | | — | | | | — | | | | — | | | | — | | | | — | | | | — | | | | 1,279 | | | | 1,279 | |
Acquisition of noncontrolling interest of iHealthStone (ii) | | | — | | | | — | | | | — | | | | — | | | | 38 | | | | — | | | | — | | | | 38 | |
Foreign currency translation adjustment | | | 5 | | | | 10 | | | | — | | | | — | | | | — | | | | 3 | | | | 4 | | | | 22 | |
| | | | | | | | | | | | | | | | | | | | | | | | | | | | | | | | |
Balance as of December 31, 2012 | | $ | 258 | | | $ | 1,119 | | | $ | — | | | $ | — | | | $ | — | | | $ | 329 | | | $ | 1,205 | | | $ | 2,911 | |
| | | | | | | | | | | | | | | | | | | | | | | | | | | | | | | | |
| (i) | In July 2010, the Company paid $30 to acquire the noncontrolling interest in iSoftStone Korea. After the acquisition, iSoftStone Korea becomes a wholly owned subsidiary of the Company. |
| (ii) | In July 2012, the Company paid $9 to acquire the noncontrolling interest in iHealthStone. After the acquisition, iHealthStone becomes a wholly owned subsidiary of the Company. |
F-65
ISOFTSTONE HOLDINGS LIMITED
NOTES TO THE CONSOLIDATED FINANCIAL STATEMENTS—(Continued)
FOR THE YEARS ENDED DECEMBER 31, 2010, 2011 AND 2012
(In U.S. dollars in thousands, except share and per share data, or otherwise noted)
25. RELATED PARTY BALANCES AND TRANSACTIONS
| | |
Name of the related party | | Relationship with the Group |
iSoftStone Technologies Co., Ltd. | | Equity method investment |
Wuxi iCarnegie | | Equity method investment |
Shenke | | Equity method investment |
Chengdu-Medical | | Equity method investment |
Dalian iCarnegie | | Equity method investment |
Wuxi IoT | | Equity method investment |
iSS-Foshan | | Equity method investment |
Dynomedia, Inc. | | Cost method investment |
Details of related party balances as of December 31, 2011 and 2012 and transactions for the years ended December 31, 2010, 2011 and 2012 are as follows:
| (1) | Amounts due from related parties: |
| | | | | | | | |
| | | As of December 31, | |
| | | 2011 | | | 2012 | |
iSoftStone Technologies Co., Ltd. (i) | | $ | 91 | | | $ | 83 | |
Wuxi iCarnegie (ii) | | | 1,470 | | | | 2,521 | |
Shenke | | | 7 | | | | 7 | |
Wuxi IoT | | | 23 | | | | 156 | |
iSS-Foshan (iii) | | | — | | | | 1,071 | |
| | | | | | | | |
Total | | $ | 1,591 | | | $ | 3,838 | |
| | | | | | | | |
| (i) | Amount due from iSoftStone Technologies Co., Ltd. represented a loan extended to iSoftStone Technologies Co., Ltd. by the Group. The loan amount is unsecured and bearing interest at 2.5% per annum. |
| (ii) | Amount due from Wuxi iCarnegie as of December 31, 2012 represented an unsecured loan of $520 extended to Wuxi iCarnegie by the Group with interest of 4.86% per annum and the course and training fee of $1,707 paid by the Group on behalf of Wuxi iCarnegie, and other prepayment on behalf of Wuxi iCarnegie of $294. |
| (iii) | Amount due from iSS-Foshan mainly represented project receivables. |
| (2) | Amounts due to related parties |
| | | | | | | | |
| | | As of December 31, | |
| | | 2011 | | | 2012 | |
Wuxi iCarnegie | | $ | 94 | | | $ | 8 | |
| (3) | Sales to related parties |
| | | | | | | | | | | | |
| | | For the year ended December 31, | |
| | | 2010 | | | 2011 | | | 2012 | |
Boxin | | $ | 225 | | | $ | 520 | | | $ | — | |
Wuxi iCarnegie | | | 28 | | | | — | | | | 43 | |
Wuxi IoT | | | — | | | | 23 | | | | 51 | |
Shenke | | | — | | | | 20 | | | | — | |
iSS-Foshan | | | — | | | | — | | | | 1,586 | |
Chengdu-Medical | | | — | | | | — | | | | 15 | |
| | | | | | | | | | | | |
Total | | $ | 253 | | | $ | 563 | | | $ | 1,695 | |
| | | | | | | | | | | | |
F-66
ISOFTSTONE HOLDINGS LIMITED
NOTES TO THE CONSOLIDATED FINANCIAL STATEMENTS—(Continued)
FOR THE YEARS ENDED DECEMBER 31, 2010, 2011 AND 2012
(In U.S. dollars in thousands, except share and per share data, or otherwise noted)
25. RELATED PARTY BALANCES AND TRANSACTIONS – (Continued)
| (4) | Purchase from related parties |
| | | | | | | | | | | | |
| | | For the year ended December 31, | |
| | | 2010 | | | 2011 | | | 2012 | |
Wuxi iCarnegie (i) | | $ | 357 | | | $ | 1,159 | | | $ | 292 | |
iSoftStone Technologies Co., Ltd. | | | — | | | | 153 | | | | — | |
| | | | | | | | | | | | |
Total | | $ | 357 | | | $ | 1,312 | | | $ | 292 | |
| | | | | | | | | | | | |
| (i) | The purchase from Wuxi iCarnegie in 2012 is mainly related to subcontracting cost. |
| (5) | Guarantee by the related parties |
As of December 31, 2011 and 2012, certain short-term loans of the Group were guaranteed by a director of the Company as described in Note 12.
26. SEGMENT INFORMATION
The Group’s chief operating decision maker has been identified as the Chief Executive Officer, who reviews consolidated results when making decisions about allocating resources and assessing performance of the Group. The Group has one operating segment.
The following table summarizes the Group’s net revenues and long-lived assets in different geographic locations in U.S. dollars:
| | | | | | | | | | | | | | | | | | | | | | | | |
| | | For the year ended December 31, | |
| | | 2010 | | | 2011 | | | 2012 | |
| | | Net
revenues(i) | | | Long-lived
assets(ii) | | | Net
revenues(i) | | | Long-lived
assets(ii) | | | Net
revenues(i) | | | Long-lived
assets(ii) | |
China (Mainland, Hong Kong and Taiwan) | | $ | 110,077 | | | $ | 28,660 | | | $ | 165,525 | | | $ | 80,388 | | | $ | 243,969 | | | $ | 98,638 | |
United States | | | 53,588 | | | | 16,306 | | | | 71,371 | | | | 18,985 | | | | 86,367 | | | | 17,422 | |
Japan | | | 20,409 | | | | 226 | | | | 24,328 | | | | 191 | | | | 23,315 | | | | 159 | |
Europe | | | 12,742 | | | | — | | | | 21,370 | | | | — | | | | 25,048 | | | | — | |
Others | | | 159 | | | | — | | | | 823 | | | | — | | | | 2,445 | | | | 2,977 | |
| | | | | | | | | | | | | | | | | | | | | | | | |
Total | | $ | 196,975 | | | $ | 45,192 | | | $ | 283,417 | | | $ | 99,564 | | | $ | 381,144 | | | $ | 119,196 | |
| | | | | | | | | | | | | | | | | | | | | | | | |
| (i) | Net revenues are presented by headquarters location of the Group’s clients. |
| (ii) | Long-lived assets are presented by the operating location of the subsidiaries of the Group. |
The following table summarizes the Group’s net revenue by service lines:
| | | | | | | | | | | | |
| | | For the year ended December 31, | |
| | | 2010 | | | 2011 | | | 2012 | |
IT Services | | $ | 134,872 | | | $ | 195,142 | | | $ | 240,753 | |
Consulting and Solution services | | | 54,327 | | | | 76,039 | | | | 127,227 | |
Business process outsourcing services | | | 7,776 | | | | 12,236 | | | | 13,164 | |
| | | | | | | | | | | | |
Total net revenues | | $ | 196,975 | | | $ | 283,417 | | | $ | 381,144 | |
| | | | | | | | | | | | |
F-67
ISOFTSTONE HOLDINGS LIMITED
NOTES TO THE CONSOLIDATED FINANCIAL STATEMENTS—(Continued)
FOR THE YEARS ENDED DECEMBER 31, 2010, 2011 AND 2012
(In U.S. dollars in thousands, except share and per share data, or otherwise noted)
27. COMMITMENTS
The Group follows the authoritative pronouncement issued by FASB regarding accounting for leases, in determining the criteria for capital leases. Leases that do not meet such criteria are classified as operating leases and related rentals are charged to expenses in the periods incurred.
Operating lease commitments
The Group has entered into operating lease agreements principally for its office spaces. These leases expire through 2022 and are renewable upon negotiation. Rental expense under operating leases was$8,309, $12,350 and $16,699 for the years ended December 31, 2010, 2011 and 2012, respectively.
Future minimum lease payments under such non-cancelable leases as of December 31, 2012 are as follows:
| | | | |
2013 | | $ | 14,359 | |
2014 | | | 12,274 | |
2015 | | | 10,413 | |
2016 | | | 9,369 | |
2017 | | | 9,178 | |
Thereafter | | | 56,169 | |
| | | | |
| | $ | 111,762 | |
| | | | |
28. CONTINGENCIES
Dispute with iCarnegie Inc. regarding certain licensing arrangements
In 2009, in cooperation with the Wuxi City government, the Group established the iCarnegie-iSoftStone training center (currently owned 20% by the Group). Some programs provided at the iCarnegie-iSoftStone training center in 2009 utilized the technical curriculum and professional certifications developed and maintained by iCarnegie Inc. and licensed to us pursuant to course licensing arrangements first entered into in 2009. The Group had been negotiating with iCarnegie Inc. new cooperation arrangements, which were expected to replace existing licensing arrangements which include a minimum enrollment fee requirement. In October 2012, iCarnegie Inc. submitted a demand for arbitration to the American Arbitration Association against the Group claiming approximately $5,889 that was alleged due from the Group to iCarnegie Inc. pursuant to the course licensing arrangements. As of December 31, 2012, the Group has not recorded a provision for this matter because the arbitration remains at its preliminary stage, the Group intends to vigorously defend the arbitration and the ultimate outcome of this arbitration cannot presently be determined.
F-68
ISOFTSTONE HOLDINGS LIMITED
NOTES TO THE CONSOLIDATED FINANCIAL STATEMENTS—(Continued)
FOR THE YEARS ENDED DECEMBER 31, 2010, 2011 AND 2012
(In U.S. dollars in thousands, except share and per share data, or otherwise noted)
28. CONTINGENCIES – (Continued)
Dispute with a vender regarding service fees
In July 2012, Kodak (China) Investment Company Limited Shenzhen Branch (“Kodak”) filed a request for arbitration with Beijing Arbitration Committee against the Group to claim a service fee of $900.
In September, 2012, the Group submitted the statement of defence and counterclaim to Beijing Arbitration Committee, requesting Kodak to pay $869 as compensation for damages and legal fee.
As of December 31, 2012, the Group has not recorded a provision for this matter because the arbitration and litigation remains at its preliminary stage, the Group intends to vigorously defend the arbitration and the ultimate outcome of this arbitration cannot presently be determined.
29. SUBSEQUENT EVENTS
Completion of formation of joint venture with Huawei Technologies Co., Ltd (“Huawei”)
In September 2012, the Group entered into an agreement with Huawei to establish an entity to provided IT service in the global technology & communication industry. The total capital contributed to the entity would be $16,051 whereby the Group and Huawei will own a 75% and 25% equity interest respectively. The entity became effective on January 2013.
Payment for the acquisition of Shanghai Kangshi
In January 2013, the Group paid a consideration of $565 in cash relating to the acquisition of Shanghai Kangshi.
Payment for the acquisition of Abovenet
In March 2013, the Group paid a consideration of $554 in cash relating to the acquisition of Abovenet.
Payment for the acquisition of Adventier
In April 2013, the Group paid a consideration of $1,124 in cash relating to the acquisition of Adventier.
F-69
ISOFTSTONE HOLDINGS LIMITED
ADDITIONAL INFORMATION—FINANCIAL STATEMENT SCHEDULE I
FINANCIAL INFORMATION OF PARENT COMPANY
BALANCE SHEETS
(In U.S. dollars in thousands, except share and per share data)
| | | | | | | | |
| | | As of December 31, | |
| | | 2011 | | | 2012 | |
Assets | | | | | | | | |
Current assets: | | | | | | | | |
Cash | | $ | 12,323 | | | $ | 7,226 | |
Prepaid expenses and other current assets | | | 2,450 | | | | 162 | |
Amounts due from related parties | | | 43,688 | | | | 37,933 | |
| | | | | | | | |
Total current assets | | | 58,461 | | | | 45,321 | |
| | | | | | | | |
Investment in subsidiaries and VIE | | | 241,769 | | | | 288,603 | |
| | | | | | | | |
Total assets | | $ | 300,230 | | | $ | 333,924 | |
| | | | | | | | |
Liabilities | | | | | | | | |
Current liabilities: | | | | | | | | |
Accrued expenses and other current liabilities | | $ | 930 | | | $ | 1,069 | |
Amounts due to related parties | | | 5,435 | | | | 2,278 | |
Deferred consideration in connection with business acquisitions | | | 103 | | | | 103 | |
| | | | | | | | |
Total current liabilities | | | 6,468 | | | | 3,450 | |
| | | | | | | | |
Other non-current liabilities | | | 602 | | | | 401 | |
Total liabilities | | $ | 7,070 | | | $ | 3,851 | |
| | | | | | | | |
Equity: | | | | | | | | |
iSoftStone Holdings Limited shareholders’ equity: | | | | | | | | |
Ordinary shares ($0.0001 par value, 1,000,000,000 and 1,000,000,000 shares authorized as of December 31, 2011 and 2012, respectively; 557,682,406 and 569,206,989 shares issued and outstanding as of December 31, 2011 and 2012, respectively) | | | 56 | | | | 57 | |
Treasury shares | | | (773 | ) | | | (773 | ) |
Shares to be issued | | | 1,262 | | | | 1,262 | |
Additional paid-in capital | | | 282,134 | | | | 294,909 | |
Accumulated other comprehensive income | | | 15,719 | | | | 17,747 | |
(Accumulated deficit) Retained earnings | | | (5,238 | ) | | | 16,871 | |
| | | | | | | | |
Total equity | | | 293,160 | | | | 330,073 | |
| | | | | | | | |
Total liabilities and equity | | $ | 300,230 | | | $ | 333,924 | |
| | | | | | | | |
F-70
ISOFTSTONE HOLDINGS LIMITED
ADDITIONAL INFORMATION—FINANCIAL STATEMENT SCHEDULE I
FINANCIAL INFORMATION OF PARENT COMPANY
STATEMENTS OF OPERATIONS
(In thousands of U.S. dollars, except share data and per share data)
| | | | | | | | | | | | |
| | | For the year ended December 31, | |
| | | 2010 | | | 2011 | | | 2012 | |
Cost of revenues | | $ | (175 | ) | | $ | (307 | ) | | $ | (509 | ) |
Operating expenses: | | | | | | | | | | | | |
General and administrative expenses | | | (8,581 | ) | | | (9,263 | ) | | | (11,491 | ) |
Selling and marketing expenses | | | (273 | ) | | | (1,225 | ) | | | (1,442 | ) |
Research and development expenses | | | (7 | ) | | | (188 | ) | | | (198 | ) |
| | | | | | | | | | | | |
Total operating expenses | | | (8,861 | ) | | | (10,676 | ) | | | (13,131 | ) |
| | | | | | | | | | | | |
Changes in fair value of contingent consideration in connection with business combination | | | (49 | ) | | | — | | | | — | |
Other operating income | | | — | | | | 193 | | | | 1,068 | |
| | | | | | | | | | | | |
Loss from operations | | | (9,085 | ) | | | (10,790 | ) | | | (12,572 | ) |
| | | | | | | | | | | | |
Interest income | | | 62 | | | | 430 | | | | 175 | |
Interest expense | | | (4,418 | ) | | | (654 | ) | | | — | |
Changes in fair value of convertible notes derivatives | | | (8,428 | ) | | | 2,832 | | | | — | |
| | | | | | | | | | | | |
Net loss before income from subsidiaries and VIE | | | (21,869 | ) | | | (8,182 | ) | | | (12,397 | ) |
Income from subsidiaries and VIE | | | 18,687 | | | | 27,027 | | | | 34,506 | |
| | | | | | | | | | | | |
Net (loss) income | | $ | (3,182 | ) | | $ | 18,845 | | | $ | 22,109 | |
| | | | | | | | | | | | |
F-71
ISOFTSTONE HOLDINGS LIMITED
ADDITIONAL INFORMATION—FINANCIAL STATEMENT SCHEDULE I
STATEMENTS OF COMPREHENSIVE INCOME (LOSS)
(In U.S. dollars in thousands, except share and per share data)
| | | | | | | | | | | | |
| | | For the year Ended December 31, | |
| | | 2010 | | | 2011 | | | 2012 | |
Net (loss) income | | $ | (3,182 | ) | | $ | 18,845 | | | $ | 22,109 | |
Other comprehensive income, net of tax of nil:
Change in cumulative foreign currency translation adjustment | | | 3,118 | | | | 8,805 | | | | 2,028 | |
| | | | | | | | | | | | |
Comprehensive (loss) income | | | (64 | ) | | | 27,650 | | | | 24,137 | |
| | | | | | | | | | | | |
Less: comprehensive (loss) income attributed to the noncontrolling interest | | | — | | | | — | | | | — | |
Comprehensive (loss) income attributed to iSoftStone Holdings Limited | | $ | (64 | ) | | $ | 27,650 | | | $ | 24,137 | |
| | | | | | | | | | | | |
F-72
ISOFTSTONE HOLDINGS LIMITED
ADDITIONAL INFORMATION—FINANCIAL STATEMENT SCHEDULE I
FINANCIAL INFORMATION OF PARENT COMPANY
STATEMENTS OF CHANGES IN EQUITY
(In U.S. dollars in thousands, except share and per share data)
| | | | | | | | | | | | | | | | | | | | | | | | | | | | | | | | | | | | | | | | |
| | | Ordinary Shares | | | Series A
convertible
preference shares | | | Treasury
shares | | | Shares
to be
issued | | | Additional
paid-in
capital | | | Retained
earnings
(Accumulated
deficit) | | | Accumulated
other
comprehensive
income | | | Total
iSoftStone
Holdings
Limited
shareholders’
equity | |
| | | Shares | | | Amount | | | Shares | | | Amount | | | Amount | | | | | | | | | | | | | | | | |
Balance as of January 1, 2010 | | | 130,902,853 | | | $ | 13 | | | | 95,286,195 | | | $ | 14,150 | | | $ | — | | | $ | 179 | | | $ | 18,768 | | | $ | (18,316 | ) | | $ | 3,796 | | | $ | 18,590 | |
Accretion of series B convertible redeemable preference shares | | | — | | | | — | | | | — | | | | — | | | | — | | | | — | | | | — | | | | (2,585 | ) | | | — | | | | (2,585 | ) |
Investment by a subsidiary in parent company | | | — | | �� | | — | | | | — | | | | — | | | | (2,000 | ) | | | — | | | | — | | | | — | | | | — | | | | (2,000 | ) |
Issuance of ordinary shares in a share-based compensation arrangement (Note 22) | | | 4,500,000 | | | | 1 | | | | — | | | | — | | | | — | | | | — | | | | 2,705 | | | | — | | | | — | | | | 2,706 | |
Vesting of nonvested shares (to be issued) | | | — | | | | — | | | | — | | | | — | | | | — | | | | 51 | | | | (51 | ) | | | — | | | | — | | | | — | |
Share-based compensation (options and nonvested shares) | | | — | | | | — | | | | — | | | | — | | | | — | | | | — | | | | 4,745 | | | | — | | | | — | | | | 4,745 | |
Reclassification to liability in connection with modification of certain nonvested shares | | | — | | | | — | | | | — | | | | — | | | | — | | | | — | | | | (40 | ) | | | — | | | | — | | | | (40 | ) |
Issuance of ordinary shares in connection with exercise of options | | | 80,000 | | | | — | | | | — | | | | — | | | | — | | | | — | | | | 29 | | | | — | | | | — | | | | 29 | |
Transfer of ordinary shares in connection with the employment of certain employees | | | — | | | | — | | | | — | | | | — | | | | 293 | | | | (75 | ) | | | (218 | ) | | | — | | | | — | | | | — | |
Sale of ordinary shares to a former employee (Note 22) | | | — | | | | — | | | | — | | | | — | | | | 464 | | | | — | | | | 843 | | | | — | | | | — | | | | 1,307 | |
Issuance of ordinary shares upon IPO net of offering cost of $4,241 | | | 104,856,845 | | | | 10 | | | | — | | | | — | | | | — | | | | — | | | | 123,435 | | | | — | | | | — | | | | 123,445 | |
Conversion of convertible preference shares to ordinary shares | | | 264,166,235 | | | | 26 | | | | (95,286,195 | ) | | | (14,150 | ) | | | — | | | | — | | | | 68,869 | | | | — | | | | — | | | | 54,745 | |
Conversion of convertible notes to ordinary shares | | | 18,381,991 | | | | 2 | | | | — | | | | — | | | | — | | | | — | | | | 20,926 | | | | — | | | | — | | | | 20,928 | |
Settlement of contingent consideration of acquisition of MDCL (Note 3) | | | 242,059 | | | | — | | | | — | | | | — | | | | — | | | | — | | | | 131 | | | | — | | | | — | | | | 131 | |
F-73
ISOFTSTONE HOLDINGS LIMITED
ADDITIONAL INFORMATION—FINANCIAL STATEMENT SCHEDULE I
FINANCIAL INFORMATION OF PARENT COMPANY
STATEMENTS OF CHANGES IN EQUITY—(Continued)
(In U.S. dollars in thousands, except share and per share data)
| | | | | | | | | | | | | | | | | | | | | | | | | | | | | | | | | | | | | | | | |
| | | Ordinary
Shares | | | Series A
convertible
preference
shares | | | Treasury
shares | | | Shares
to be
issued | | | Additional
paid-in
capital | | | Retained
earnings
(Accumulated
deficit) | | | Accumulated
other
comprehensive
income | | | Total
iSoftStone
Holdings
Limited
shareholders’
equity | |
| | | Shares | | | Amount | | | Shares | | | Amount | | | Amount | | | | | | | | | | | | | | | | |
Issuance of ordinary shares in connection with business acquisition of Ascend (Note 3) | | | 823,846 | | | | — | | | | — | | | | — | | | | — | | | | — | | | | 1,071 | | | | — | | | | — | | | | 1,071 | |
Ordinary shares to be issued in connection with business acquisition of Shanghai Kangshi (Note 3) | | | — | | | | — | | | | — | | | | — | | | | — | | | | 1,262 | | | | — | | | | — | | | | — | | | | 1,262 | |
Ordinary shares to be issued to a consultant | | | — | | | | — | | | | — | | | | — | | | | — | | | | 154 | | | | — | | | | — | | | | — | | | | 154 | |
Comprehensive income (loss): | | | | | | | | | | | | | | | | | | | | | | | | | | | | | | | | | | | | | | | | |
Net loss | | | — | | | | — | | | | — | | | | — | | | | — | | | | — | | | | — | | | | (3,182 | ) | | | — | | | | (3,182 | ) |
Foreign currency translation adjustment | | | — | | | | — | | | | — | | | | — | | | | — | | | | — | | | | — | | | | | | | | 3,118 | | | | 3,118 | |
| | | | | | | | | | | | | | | | | | | | | | | | | | | | | | | | | | | | | | | | |
Balance as of December 31, 2010 | | | 523,953,829 | | | $ | 52 | | | | — | | | $ | — | | | | (1,243 | ) | | $ | 1,571 | | | $ | 241,213 | | | $ | (24,083 | ) | | $ | 6,914 | | | $ | 224,424 | |
| | | | | | | | | | | | | | | | | | | | | | | | | | | | | | | | | | | | | | | | |
F-74
ISOFTSTONE HOLDINGS LIMITED
ADDITIONAL INFORMATION—FINANCIAL STATEMENT SCHEDULE I
FINANCIAL INFORMATION OF PARENT COMPANY
STATEMENTS OF CHANGES IN EQUITY—(Continued)
(In U.S. dollars in thousands, except share and per share data)
| | | | | | | | | | | | | | | | | | | | | | | | | | | | | | | | | | | | | | | | |
| | | Ordinary
Shares | | | Series A
convertible
preference
shares | | | Treasury
shares | | | Shares
to be
issued | | | Additional
paid-in
capital | | | Retained
earnings
(Accumulated
deficit) | | | Accumulated
other
comprehensive
income | | | Total
iSoftStone
Holdings
Limited
shareholders’
equity | |
| | | Shares | | | Amount | | | Shares | | | Amount | | | Amount | | | | | | | | | | | | | | | | |
Balance as of December 31, 2010 | | | 523,953,829 | | | $ | 52 | | | | — | | | $ | — | | | | (1,243 | ) | | $ | 1,571 | | | $ | 241,213 | | | $ | (24,083 | ) | | $ | 6,914 | | | $ | 224,424 | |
| | | | | | | | | | | | | | | | | | | | | | | | | | | | | | | | | | | | | | | | |
Issuance of ordinary shares in connection with share-based compensation arrangement | | | 665,999 | | | | — | | | | — | | | | — | | | | — | | | | — | | | | — | | | | — | | | | — | | | | — | |
Share-based compensation | | | — | | | | — | | | | — | | | | — | | | | — | | | | — | | | | 9,322 | | | | — | | | | — | | | | 9,322 | |
Issuance of ordinary shares in connection with exercise of options and vesting of share units | | | 12,178,146 | | | | 1 | | | | — | | | | — | | | | — | | | | — | | | | 4,247 | | | | — | | | | — | | | | 4,248 | |
Transfer of ordinary shares in connection with the settlement of acquisition of Jiefeng | | | — | | | | — | | | | — | | | | — | | | | 200 | | | | (55 | ) | | | (145 | ) | | | — | | | | — | | | | — | |
Issuance and transfer of ordinary shares in connection with the settlement of acquisition of Kebao | | | — | | | | — | | | | — | | | | — | | | | 270 | | | | (80 | ) | | | (190 | ) | | | — | | | | — | | | | — | |
Conversion of convertible notes to ordinary shares | | | 20,406,720 | | | | 2 | | | | — | | | | — | | | | — | | | | — | | | | 27,235 | | | | — | | | | — | | | | 27,237 | |
Transfer of ordinary shares in connection with the settlement acquisition of MDCL | | | 152,863 | | | | — | | | | — | | | | — | | | | — | | | | (20 | ) | | | 88 | | | | — | | | | — | | | | 68 | |
Issuance of ordinary shares to a consultant | | | 324,849 | | | | 1 | | | | — | | | | — | | | | — | | | | (154 | ) | | | 364 | | | | — | | | | — | | | | 211 | |
Comprehensive income: | | | | | | | | | | | | | | | | | | | | | | | | | | | | | | | | |
Net income | | | — | | | | — | | | | — | | | | — | | | | — | | | | — | | | | — | | | | 18,845 | | | | — | | | | 18,845 | |
Foreign currency translation adjustment | | | — | | | | — | | | | — | | | | — | | | | — | | | | — | | | | — | | | | | | | | 8,805 | | | | 8,805 | |
| | | | | | | | | | | | | | | | | | | | | | | | | | | | | | | | | | | | | | | | |
Balance as of December 31, 2011 | | | 557,682,406 | | | $ | 56 | | | | — | | | | — | | | $ | (773 | ) | | $ | 1,262 | | | $ | 228,134 | | | $ | (5,238 | ) | | $ | 15,719 | | | $ | 293,160 | |
| | | | | | | | | | | | | | | | | | | | | | | | | | | | | | | | | | | | | | | | |
F-75
ISOFTSTONE HOLDINGS LIMITED
ADDITIONAL INFORMATION—FINANCIAL STATEMENT SCHEDULE I
FINANCIAL INFORMATION OF PARENT COMPANY
STATEMENTS OF CHANGES IN EQUITY—(Continued)
(In U.S. dollars in thousands, except share and per share data)
| | | | | | | | | | | | | | | | | | | | | | | | | | | | | | | | | | | | | | | | |
| | | Ordinary
Shares | | | Series A
convertible
preference
shares | | | Treasury
shares | | | Shares
to be
issued | | | Additional
paid-in
capital | | | Retained
earnings
(Accumulated
deficit) | | | Accumulated
other
comprehensive
income | | | Total
iSoftStone
Holdings
Limited
shareholders’
equity | |
| | | Shares | | | Amount | | | Shares | | | Amount | | | Amount | | | | | | | | | | | | | | | | |
Balance as of December 31, 2011 | | | 557,682,406 | | | $ | 56 | | | | — | | | $ | — | | | $ | (773 | ) | | $ | 1,262 | | | $ | 282,134 | | | $ | (5,238 | ) | | $ | 15,719 | | | $ | 293,160 | |
| | | | | | | | | | | | | | | | | | | | | | | | | | | | | | | | | | | | | | | | |
Share-based compensation | | | — | | | | — | | | | — | | | | — | | | | — | | | | — | | | | 11,120 | | | | — | | | | — | | | | 11,120 | |
Issuance of ordinary shares in connection with exercise of options and vesting of share units | | | 11,686,061 | | | | 1 | | | | — | | | | — | | | | — | | | | — | | | | 1,655 | | | | — | | | | — | | | | 1,656 | |
Repurchase of ordinary shares | | | (161,478 | ) | | | — | | | | — | | | | — | | | | — | | | | — | | | | — | | | | — | | | | — | | | | — | |
Comprehensive income: | | | | | | | | | | | | | | | | | | | | | | | | | | | | | | | | | | | | | | | | |
Net income | | | — | | | | — | | | | — | | | | — | | | | — | | | | — | | | | — | | | | 22,109 | | | | — | | | | 22,109 | |
Foreign currency translation adjustment | | | — | | | | — | | | | — | | | | — | | | | — | | | | — | | | | — | | | | | | | | 2,028 | | | | 2,028 | |
| | | | | | | | | | | | | | | | | | | | | | | | | | | | | | | | | | | | | | | | |
Balance as of December 31, 2012 | | | 569,206,989 | | | $ | 57 | | | | — | | | $ | — | | | $ | (773 | ) | | $ | 1,262 | | | $ | 294,909 | | | $ | 16,871 | | | $ | 17,747 | | | $ | 330,073 | |
| | | | | | | | | | | | | | | | | | | | | | | | | | | | | | | | | | | | | | | | |
F-76
ISOFTSTONE HOLDINGS LIMITED
ADDITIONAL INFORMATION—FINANCIAL STATEMENT SCHEDULE I
FINANCIAL INFORMATION OF PARENT COMPANY
STATEMENTS OF CASH FLOWS
(In U.S. dollars in thousands, except share and per share data)
| | | | | | | | | | | | |
| | | For the year ended December 31, | |
| | | 2010 | | | 2011 | | | 2012 | |
Cash flows from operating activities: | | | | | | | | | | | | |
Net (loss) income | | $ | (3,182 | ) | | $ | 18,845 | | | $ | 22,109 | |
Adjustments to reconcile net income (loss) to net cash provided by (used in) operating activities: | | | | | | | | | | | | |
Gain from investments in subsidiaries and VIE | | | (18,687 | ) | | | (27,027 | ) | | | (34,506 | ) |
Share-based compensation | | | 8,546 | | | | 9,331 | | | | 11,120 | |
Changes in fair value for contingent consideration in connection with business combination | | | 28 | | | | — | | | | — | |
Changes in fair value of convertible notes derivatives | | | 8,428 | | | | (2,832 | ) | | | — | |
Imputed interest expense in connection with convertible notes-interest | | | 4,418 | | | | 654 | | | | — | |
Changes in operating assets and liabilities: | | | | | | | | | | | | |
Amounts due from related parties | | | (28,942 | ) | | | 889 | | | | 5,755 | |
Prepaid expenses and other current assets | | | 21 | | | | 173 | | | | (343 | ) |
Amounts due to related parties | | | 2,690 | | | | 2,751 | | | | (3,158 | ) |
Accrued expenses and other current liabilities | | | (501 | ) | | | 1,127 | | | | (62 | ) |
| | | | | | | | | | | | |
Net cash (used in) provided by operating activities | | | (27,181 | ) | | | 3,911 | | | | 915 | |
| | | | | | | | | | | | |
Cash flows from investing activities: | | | | | | | | | | | | |
Deferred and contingent consideration paid for business acquisitions | | | (197 | ) | | | (3,939 | ) | | | — | |
Cash paid for investment in subsidiaries | | | (10,030 | ) | | | (111,816 | ) | | | (10,299 | ) |
Proceeds from sales of long term investment | | | — | | | | — | | | | 2,413 | |
| | | | | | | | | | | | |
Net cash used in investing activities | | | (10,227 | ) | | | (115,755 | ) | | | (7,886 | ) |
| | | | | | | | | | | | |
Cash flows from financing activities: | | | | | | | | | | | | |
Proceeds from issuance of convertible notes, net of issuance cost of $367, nil and nil for the year ended December 31, 2010, 2011 and 2012, respectively | | | 8,633 | | | | — | | | | — | |
Proceeds from issuance of ordinary shares during IPO | | | 127,686 | | | | — | | | | — | |
Payment of offering cost in connection with the issuance of ordinary shares | | | (2,580 | ) | | | (1,485 | ) | | | — | |
Proceeds from exercise of options | | | 29 | | | | 4,032 | | | | 1,874 | |
Proceeds from sale of ordinary shares | | | 445 | | | | 211 | | | | — | |
| | | | | | | | | | | | |
Net cash provided by financing activities | | | 134,213 | | | | 2,758 | | | | 1,874 | |
| | | | | | | | | | | | |
Net increase (decrease) in cash | | | 96,805 | | | | (109,086 | ) | | | (5,097 | ) |
| | | | | | | | | | | | |
Cash at beginning of year | | | 24,604 | | | | 121,409 | | | | 12,323 | |
Cash at end of year | | $ | 121,409 | | | $ | 12,323 | | | $ | 7,226 | |
| | | | | | | | | | | | |
F-77
ISOFTSTONE HOLDINGS LIMITED
ADDITIONAL INFORMATION—FINANCIAL STATEMENT SCHEDULE I
FINANCIAL INFORMATION OF PARENT COMPANY
NOTES TO THE FINANCIAL STATEMENTS
1. BASIS FOR PREPARATION
The condensed financial information of the Company has been prepared using the same accounting policies as set out in the Group’s consolidated financial statement except that the Company used the equity method to account for investments in its subsidiaries and VIE.
2. INVESTMENTS IN SUBSIDIARIES
The Company and its subsidiaries and VIE were included in the consolidated financial statements where inter-company balances and transactions were eliminated upon consolidation. For purpose of the Company’s stand-alone financial statements, its investments in subsidiaries and VIE were reported using the equity method of accounting. The Company’s share of income and losses from its subsidiaries and VIE were reported as equity in earnings of subsidiaries and VIE in the accompanying parent company financial statements.
F-78