Exhibit (c)-(2)
STRICTLY CONFIDENTIAL AND PRELIMINARY DRAFT
Goldman Sachs INVESTMENT BANKING DIVISION Project Iris Special Committee Discussion Materials Goldman Sachs (Asia) L.L.C. April 18, 2014
Goldman Sachs INVESTMENT BANKING DIVISION Disclaimer Goldman Sachs (Asia) L.L.C. (“Goldman Sachs”) has prepared and provided these materials and Goldman Sachs’ related presentation (the “Confidential Information”) solely for the information and assistance of the Special Committee of the Board of Directors (the “Special Committee”) of Iris (the “Company”) in connection with its consideration of the matters referred to herein. Without Goldman Sachs’ prior written consent, the Confidential Information may not be circulated or referred to publicly, disclosed to or relied upon by any other person, or used or relied upon for any other purpose. Notwithstanding anything herein to the contrary, the Company may disclose to any person the US federal income and state income tax treatment and tax structure of any transaction described herein and all materials of any kind (including tax opinions and other tax analyses) that are provided to the Company relating to such tax treatment and tax structure, without Goldman Sachs imposing any limitation of any kind. The Confidential Information, including this disclaimer, is subject to, and governed by, any written agreement between the Company, the Board and/or any committee thereof, on the one hand, and Goldman Sachs, on the other hand. Goldman Sachs and its affiliates are engaged in advisory, underwriting and financing, principal investing, sales and trading, research, investment management and other financial and non-financial activities and services for various persons and entities. Goldman Sachs and its affiliates and employees, and funds or other entities in which they invest or with which they co-invest, may at any time purchase, sell, hold or vote long or short positions and investments in securities, derivatives, loans, commodities, currencies, credit default swaps and other financial instruments of the Company, any other party to any transaction and any of their respective affiliates or any currency or commodity that may be involved in any transaction for the accounts of Goldman Sachs and its affiliates and employees and their customers. The Confidential Information has been prepared and based on information obtained by Goldman Sachs from publicly available sources. In preparing the Confidential Information, Goldman Sachs has relied upon and assumed, without assuming any responsibility for independent verification, the accuracy and completeness of all of the financial, legal, regulatory, tax, accounting and other information provided to, discussed with or reviewed by, Goldman Sachs. Goldman Sachs does not provide accounting, tax, legal or regulatory advice. Goldman Sachs’ role in any due diligence review is limited solely to performing such a review as it shall deem necessary to support its own advice and analysis and shall not be on behalf of the Company. Analyses based upon forecasts of future results are not necessarily indicative of actual future results, which may be significantly more or less favorable than suggested by these analyses, and Goldman Sachs does not assume responsibility if future results are materially different from those forecast. Goldman Sachs has not made an independent evaluation or appraisal of the assets and liabilities of the Company (including any contingent, derivative or other off-balance-sheet assets and liabilities) or any other person and has no obligation to evaluate the solvency of the Company or any person under any law. The analyses in the Confidential Information are not appraisals nor do they necessarily reflect the prices at which businesses or securities actually may be sold or purchased. The Confidential Information does not address the underlying business decision of the Company to engage in any transaction, or the relative merits of any strategic alternative referred to herein as compared to any other alternative that may be available to the Company. The Confidential Information is necessarily based on economic, monetary, market and other conditions as in effect on, and the information made available to Goldman Sachs as of, the date of such Confidential Information and Goldman Sachs assumes no responsibility for updating or revising the Confidential Information. 1 STRICTLY CONFIDENTIAL AND PRELIMINARY DRAFT
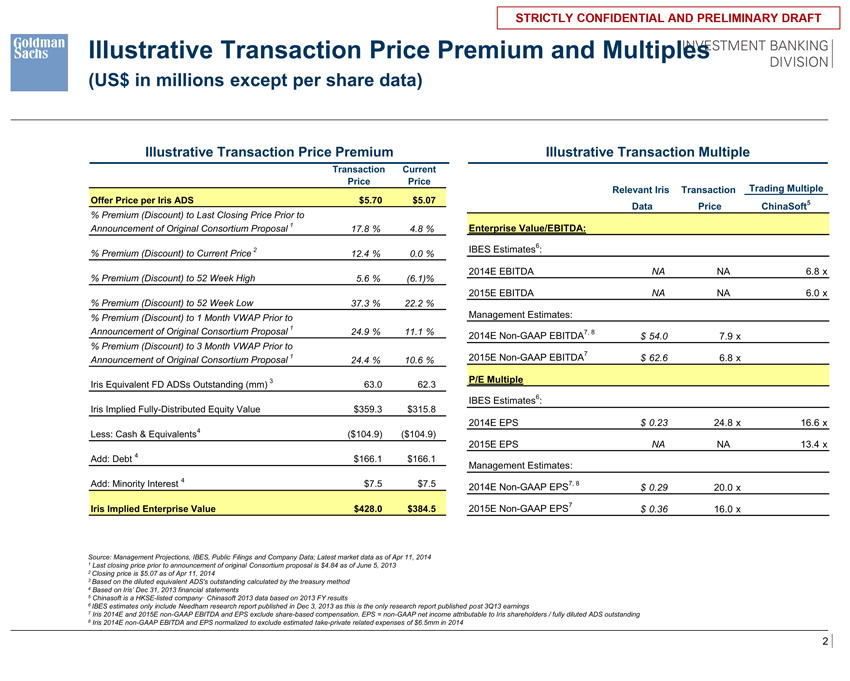
Goldman Sachs INVESTMENT BANKING DIVISION Illustrative Transaction Price Premium and Multiples (US$ in millions except per share data) Illustrative Transaction Price Premium Transaction Current Price Price Offer Price per Iris ADS $5.70 $5.07 % Premium (Discount) to Last Closing Price Prior to Announcement of Original Consortium Proposal 1 17.8 % 4.8 % % Premium (Discount) to Current Price 2 12.4 % 0.0 % % Premium (Discount) to 52 Week High 5.6 % (6.1)% % Premium (Discount) to 52 Week Low 37.3 % 22.2 % % Premium (Discount) to 1 Month VWAP Prior to Announcement of Original Consortium Proposal 1 24.9 % 11.1 % % Premium (Discount) to 3 Month VWAP Prior to Announcement of Original Consortium Proposal 1 24.4 % 10.6 % Iris Equivalent FD ADSs Outstanding (mm) 3 63.0 62.3 Iris Implied Fully-Distributed Equity Value $359.3 $315.8 Less: Cash & Equivalents4 ($104.9) ($104.9) Add: Debt 4 $166.1 $166.1 Add: Minority Interest 4 $7.5 $7.5 Iris Implied Enterprise Value $428.0 $384.5 Illustrative Transaction Multiple Relevant Iris Transaction Trading Multiple Data Price ChinaSoft5 Enterprise Value/EBITDA: IBES Estimates6: 2014E EBITDA NA NA 6.8 x 2015E EBITDA NA NA 6.0 x Management Estimates: 2014E Non-GAAP EBITDA7, 8 $ 54.0 7.9 x 2015E Non-GAAP EBITDA7 $ 62.6 6.8 x P/E Multiple IBES Estimates6: 2014E EPS $ 0.23 24.8 x 16.6 x 2015E EPS NA NA 13.4 x Management Estimates: 2014E Non-GAAP EPS7, 8 $ 0.29 20.0 x 2015E Non-GAAP EPS7 $ 0.36 16.0 x Source: Management Projections, IBES, Public Filings and Company Data; Latest market data as of Apr 11, 2014 1 Last closing price prior to announcement of original Consortium proposal is $4.84 as of June 5, 2013 2 Closing price is $5.07 as of Apr 11, 2014 3 Based on the diluted equivalent ADS’s outstanding calculated by the treasury method 4 Based on Iris’ Dec 31, 2013 financial statements 5 Chinasoft is a HKSE-listed company. Chinasoft 2013 data based on 2013 FY results 6 IBES estimates only include Needham research report published in Dec 3, 2013 as this is the only research report published post 3Q13 earnings 7 Iris 2014E and 2015E non-GAAP EBITDA and EPS exclude share-based compensation. EPS = non-GAAP net income attributable to Iris shareholders / fully diluted ADS outstanding 8 Iris 2014E non-GAAP EBITDA and EPS normalized to exclude estimated take-private related expenses of $6.5mm in 2014 2 STRICTLY CONFIDENTIAL AND PRELIMINARY DRAFT
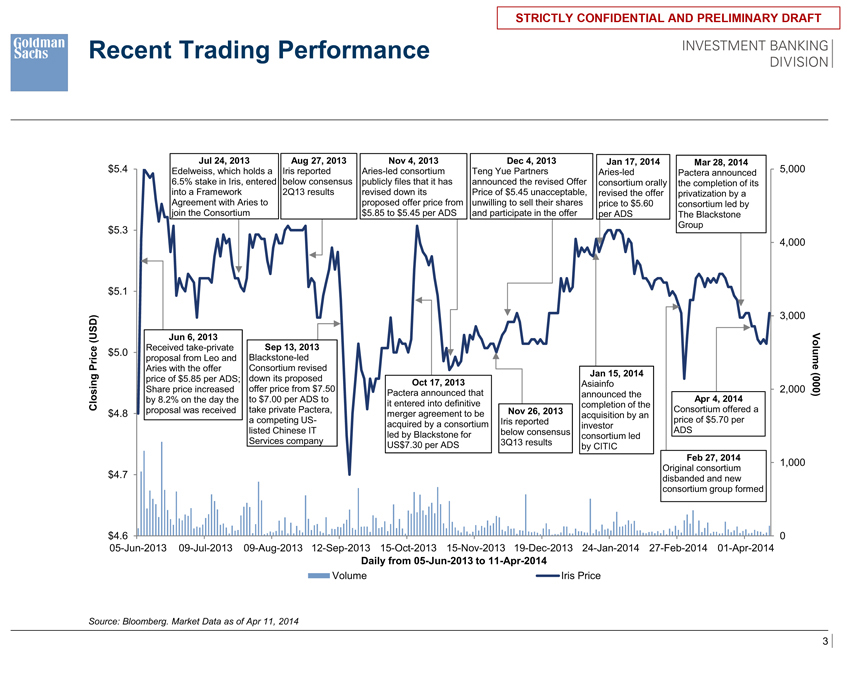
Goldman Sachs INVESTMENT BANKING DIVISION Recent Trading Performance $5.4 Jul 24, 2013 Aug 27, 2013 Nov 4, 2013 Dec 4, 2013 Jan 17, 2014 Mar 28, 2014 5,000 Edelweiss, which holds a Iris reported Aries-led consortium Teng Yue Partners Aries-led Pactera announced 6.5% stake in Iris, entered below consensus publicly files that it has announced the revised Offer consortium orally the completion of its into a Framework 2Q13 results revised down its Price of $5.45 unacceptable, revised the offer privatization by a Agreement with Aries to proposed offer price from unwilling to sell their shares price to $5.60 consortium led by join the Consortium $5.85 to $5.45 per ADS and participate in the offer per ADS The Blackstone Group $5.3 4,000 $5.1 3,000 (USD) Jun 6, 2013 e Received take-private Sep 13, 2013 $5.0 proposal from Leo and Blackstone-led Volum Pric Aries with the offer Consortium revised e g down its proposed Jan 15, 2014 in price of $5.85 per ADS; Oct 17, 2013 Asiainfo 00(0 Share price increased offer price from $7.50 2,000 Pactera announced that announced the ) by 8.2% on the day the to $7.00 per ADS to Apr 4, 2014 Clos it entered into definitive completion of the proposal was received take private Pactera, Nov 26, 2013 Consortium offered a $4.8 merger agreement to be acquisition by an a competing US- Iris reported price of $5.70 per acquired by a consortium investor listed Chinese IT below consensus ADS led by Blackstone for consortium led Services company 3Q13 results US$7.30 per ADS by CITIC Feb 27, 2014 1,000 Original consortium $4.7 disbanded and new consortium group formed $4.6 0 05-Jun-2013 09-Jul-2013 09-Aug-2013 12-Sep-2013 15-Oct-2013 15-Nov-2013 19-Dec-2013 24-Jan-2014 27-Feb-2014 01-Apr-2014 Daily from 05-Jun-2013 to 11-Apr-2014 Volume Iris Price Source: Bloomberg. Market Data as of Apr 11, 2014 3 STRICTLY CONFIDENTIAL AND PRELIMINARY DRAFT
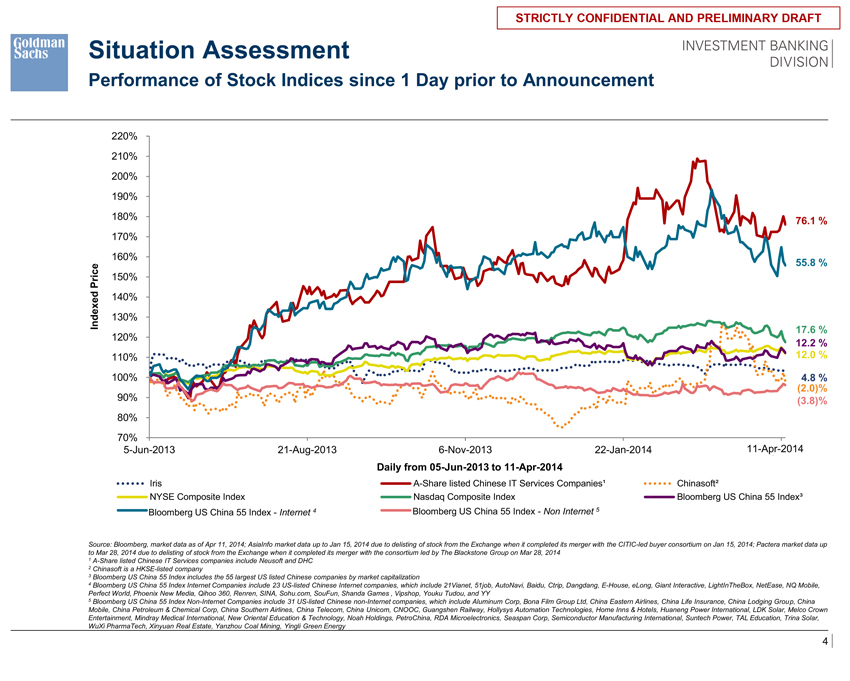
Goldman Sachs INVESTMENT BANKING DIVISION Situation Assessment Performance of Stock Indices since 1 Day prior to Announcement 220% 210% 200% 190% 180% 76.1 % 170% 160% 55.8 % Price 150% 140% Index 130% 17.6 % 120% 12.2 % 110% 12.0 % 100% 4.8 % 90% (2.0)% (3.8)% 80% 70% 5-Jun-2013 21-Aug-2013 6-Nov-2013 22-Jan-2014 11-Apr-2014 9- r- 4 Daily from 05-Jun-2013 to 11-Apr-2014 Iris A-Share listed Chinese IT Services Companies1 Chinasoft2 Iris NYSE Composite Index A-Share Nasdaq listed Chinese Composite IT Services Index Companies1 Chinasoft2 Bloomberg US China 55 Index3 NYSE Composite Index Nasdaq Composite Index Bloomberg US China 55 Index3 B Bloomberg US China 55 Index - Internet 4 Bloomb loombe Bloomberg US China 55 Index - Non Internet 5 Source: Bloomberg, market data as of Apr 11, 2014; AsiaInfo market data up to Jan 15, 2014 due to delisting of stock from the Exchange when it completed its merger with the CITIC-led buyer consortium on Jan 15, 2014; Pactera market data up to Mar 28, 2014 due to delisting of stock from the Exchange when it completed its merger with the consortium led by The Blackstone Group on Mar 28, 2014 1 A-Share listed Chinese IT Services companies include Neusoft and DHC 2 Chinasoft is a HKSE-listed company 3 Bloomberg US China 55 Index includes the 55 largest US listed Chinese companies by market capitalization 4 Bloomberg US China 55 Index Internet Companies include 23 US-listed Chinese Internet companies, which include 21Vianet, 51job, AutoNavi, Baidu, Ctrip, Dangdang, E-House, eLong, Giant Interactive, LightInTheBox, NetEase, NQ Mobile, Perfect World, Phoenix New Media, Qihoo 360, Renren, SINA, Sohu.com, SouFun, Shanda Games , Vipshop, Youku Tudou, and YY 5 Bloomberg US China 55 Index Non-Internet Companies include 31 US-listed Chinese non-Internet companies, which include Aluminum Corp, Bona Film Group Ltd, China Eastern Airlines, China Life Insurance, China Lodging Group, China Mobile, China Petroleum & Chemical Corp, China Southern Airlines, China Telecom, China Unicom, CNOOC, Guangshen Railway, Hollysys Automation Technologies, Home Inns & Hotels, Huaneng Power International, LDK Solar, Melco Crown Entertainment, Mindray Medical International, New Oriental Education & Technology, Noah Holdings, PetroChina, RDA Microelectronics, Seaspan Corp, Semiconductor Manufacturing International, Suntech Power, TAL Education, Trina Solar, WuXi PharmaTech, Xinyuan Real Estate, Yanzhou Coal Mining, Yingli Green Energy 4 STRICTLY CONFIDENTIAL AND PRELIMINARY DRAFT
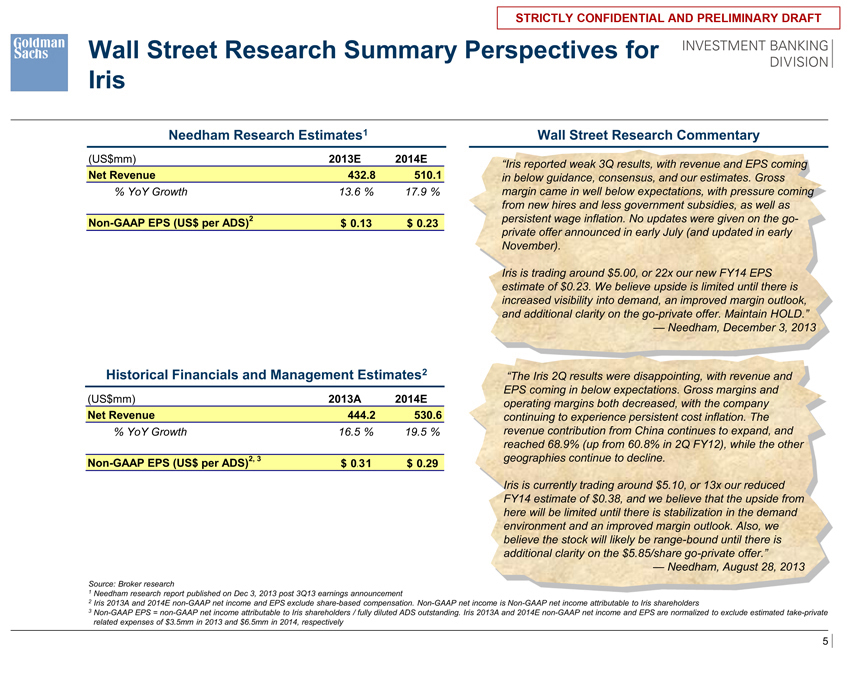
Goldman Sachs INVESTMENT BANKING DIVISION Wall Street Research Summary Perspectives for Iris Needham Research Estimates1 (US$mm) 2013E 2014E Net Revenue 432.8 510.1 % YoY Growth 13.6 % 17.9 % Non-GAAP EPS (US$ per ADS)2 $ 0.13 $ 0.23 Historical Financials and Management Estimates2 (US$mm) 2013A 2014E Net Revenue 444.2 530.6 % YoY Growth 16.5 % 19.5 % Non-GAAP EPS (US$ per ADS)2, 3 $ 0.31 $ 0.29 Wall Street Research Commentary “Iris reported weak 3Q results, with revenue and EPS coming in below guidance, consensus, and our estimates. Gross margin came in well below expectations, with pressure coming from new hires and less government subsidies, as well as persistent wage inflation. No updates were given on the go-private offer announced in early July (and updated in early November). Iris is trading around $5.00, or 22x our new FY14 EPS estimate of $0.23. We believe upside is limited until there is increased visibility into demand, an improved margin outlook, and additional clarity on the go-private offer. Maintain HOLD.” Needham, December 3, 2013 “The Iris 2Q results were disappointing, with revenue and EPS coming in below expectations. Gross margins and operating margins both decreased, with the company continuing to experience persistent cost inflation. The revenue contribution from China continues to expand, and reached 68.9% (up from 60.8% in 2Q FY12), while the other geographies continue to decline. Iris is currently trading around $5.10, or 13x our reduced FY14 estimate of $0.38, and we believe that the upside from here will be limited until there is stabilization in the demand environment and an improved margin outlook. Also, we believe the stock will likely be range-bound until there is additional clarity on the $5.85/share go-private offer.” Needham, August 28, 2013 Source: Broker research 1 Needham research report published on Dec 3, 2013 post 3Q13 earnings announcement 2 Iris 2013A and 2014E non-GAAP net income and EPS exclude share-based compensation. Non-GAAP net income is Non-GAAP net income attributable to Iris shareholders 3 Non-GAAP EPS = non-GAAP net income attributable to Iris shareholders / fully diluted ADS outstanding. Iris 2013A and 2014E non-GAAP net income and EPS are normalized to exclude estimated take-private related expenses of $3.5mm in 2013 and $6.5mm in 2014, respectively 5 STRICTLY CONFIDENTIAL AND PRELIMINARY DRAFT
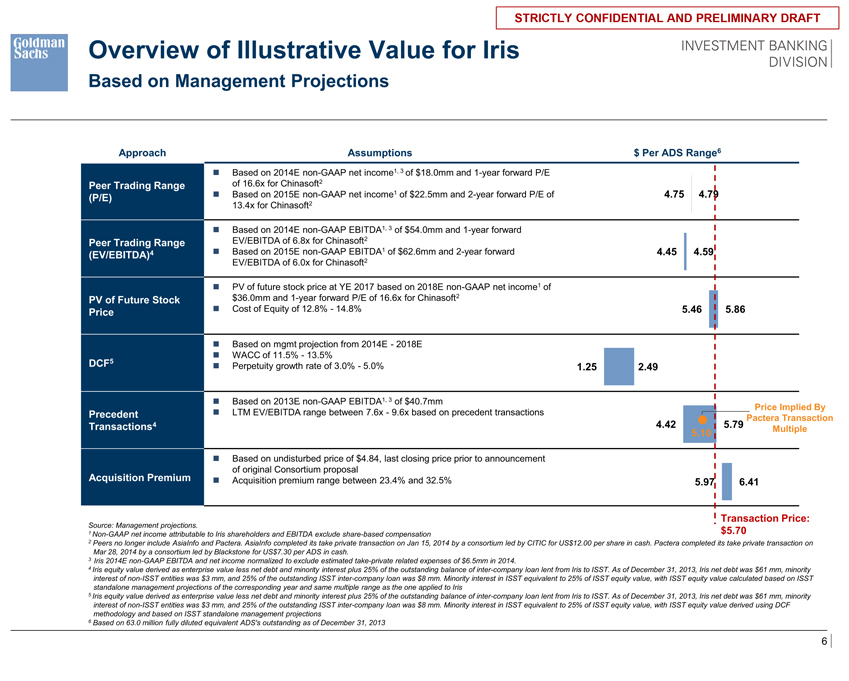
Goldman Sachs INVESTMENT BANKING DIVISION Overview of Illustrative Value for Iris Based on Management Projections Approach Peer Trading Range (P/E) Peer Trading Range (EV/EBITDA)4 PV of Future Stock Price DCF5 Precedent Transactions4 Acquisition Premium Assumptions Based on 2014E non-GAAP net income1, 3 of $18.0mm and 1-year forward P/E of 16.6x for Chinasoft2 Based on 2015E non-GAAP net income1 of $22.5mm and 2-year forward P/E of 13.4x for Chinasoft2 Based on 2014E non-GAAP EBITDA1, 3 of $54.0mm and 1-year forward EV/EBITDA of 6.8x for Chinasoft2 Based on 2015E non-GAAP EBITDA1 of $62.6mm and 2-year forward EV/EBITDA of 6.0x for Chinasoft2 PV of future stock price at YE 2017 based on 2018E non-GAAP net income1 of $36.0mm and 1-year forward P/E of 16.6x for Chinasoft2 Cost of Equity of 12.8% - 14.8% Based on mgmt projection from 2014E - 2018E WACC of 11.5% - 13.5% Perpetuity growth rate of 3.0% - 5.0% Based on 2013A non-GAAP EBITDA1, 3 of $40.7mm LTM EV/EBITDA range between 7.6x - 9.6x based on precedent transactions Based on undisturbed price of $4.84, last closing price prior to announcement of original Consortium proposal Acquisition premium range between 23.4% and 32.5% $ Per ADS Range6 4.75 4.79 4.45 4.59 5.46 5.86 1.25 2.49 Price Implied By Pactera Transaction 4.42 5.79 5.10 Multiple 5.97 6.41 Transaction Price: Source: Management projections. 1 Non-GAAP net income attributable to Iris shareholders and EBITDA exclude share-based compensation 2 Peers no longer include AsiaInfo and Pactera. AsiaInfo completed its take private transaction on Jan 15, 2014 by a consortium led by CITIC for US$12.00 per share in cash. Pactera completed its take private transaction on Mar 28, 2014 by a consortium led by Blackstone for US$7.30 per ADS in cash. 3 Iris 2014E non-GAAP EBITDA and net income normalized to exclude estimated take-private related expenses of $6.5mm in 2014. 4 Iris equity value derived as enterprise value less net debt and minority interest plus 25% of the outstanding balance of inter-company loan lent from Iris to ISST. As of December 31, 2013, Iris net debt was $61 mm, minority interest of non-ISST entities was $3 mm, and 25% of the outstanding ISST inter-company loan was $8 mm. Minority interest in ISST equivalent to 25% of ISST equity value, with ISST equity value calculated based on ISST standalone management projections of the corresponding year and same multiple range as the one applied to Iris 5 Iris equity value derived as enterprise value less net debt and minority interest plus 25% of the outstanding balance of inter-company loan lent from Iris to ISST. As of December 31, 2013, Iris net debt was $61 mm, minority interest of non-ISST entities was $3 mm, and 25% of the outstanding ISST inter-company loan was $8 mm. Minority interest in ISST equivalent to 25% of ISST equity value, with ISST equity value derived using DCF methodology and based on ISST standalone management projections 6 Based on 63.0 million fully diluted equivalent ADS’s outstanding as of December 31, 2013 6 STRICTLY CONFIDENTIAL AND PRELIMINARY DRAFT 2013E
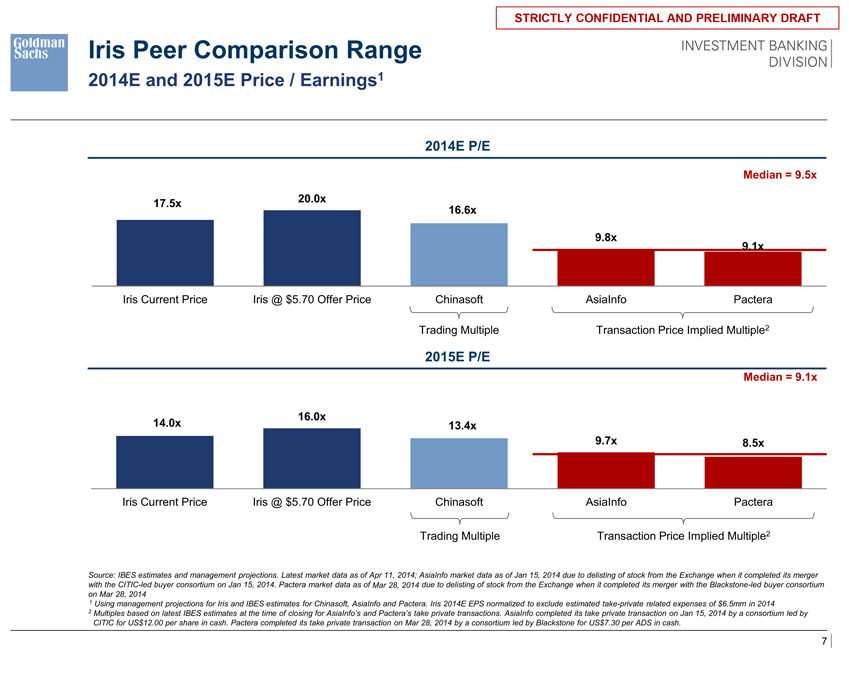
Goldman Sachs INVESTMENT BANKING DIVISION Iris Peer Comparison Range 2014E and 2015E Price / Earnings1 2014E P/E Median = 9.5x 17.5x 20.0x 16.6x 9.8x 9.1x Iris Current Price Iris @ $5.70 Offer Price Chinasoft AsiaInfo Pactera Trading Multiple Transaction Price Implied Multiple2 2015E P/E Median = 9.1x 16.0x 14.0x 13.4x 9.7x 8.5x Iris Current Price Iris @ $5.70 Offer Price Chinasoft AsiaInfo Pactera Trading Multiple Transaction Price Implied Multiple2 Source: IBES estimates and management projections. Latest market data as of Apr 11, 2014; AsiaInfo market data as of March 28, 2014 due to delisting of stock from the Exchange when it completed its merger with the CITIC-led buyer consortium on Jan 15, 2014. Pactera market data as of Jan 15, 2014 due to delisting of stock from the Exchange when it completed its merger with the Blackstone-led buyer consortium on Mar 28, 2014 1 Using management projections for Iris and IBES estimates for Chinasoft, AsiaInfo and Pactera. Iris 2014E EPS normalized to exclude estimated take-private related expenses of $6.5mm in 2014 2 Multiples based on latest IBES estimates at the time of closing for AsiaInfo’s and Pactera’s take private transactions. AsiaInfo completed its take private transaction on Jan 15, 2014 by a consortium led by CITIC for US$12.00 per share in cash. Pactera completed its take private transaction on Mar 28, 2014 by a consortium led by Blackstone for US$7.30 per ADS in cash. 7 STRICTLY CONFIDENTIAL AND PRELIMINARY DRAFT
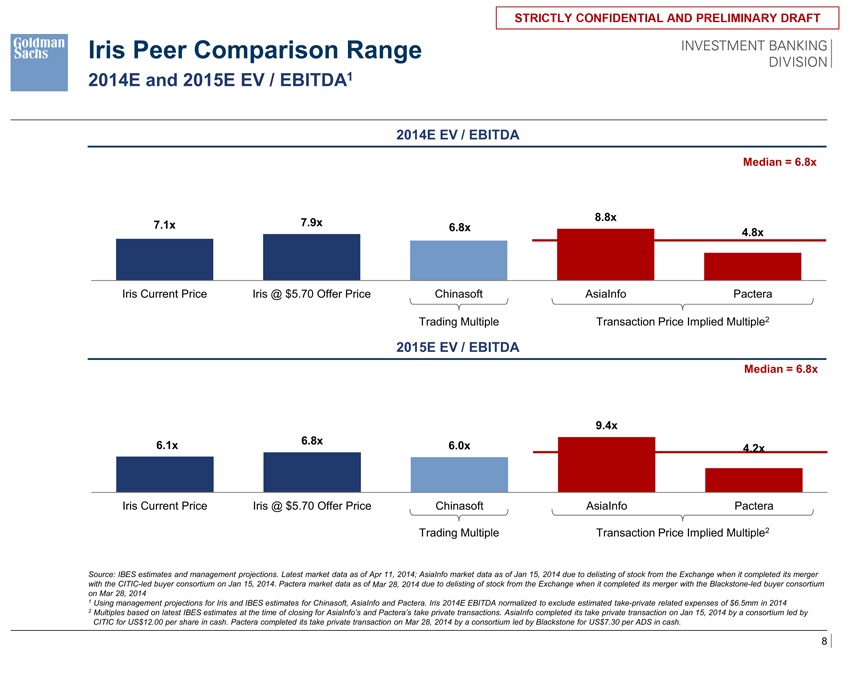
Goldman Sachs INVESTMENT BANKING DIVISION Iris Peer Comparison Range 2014E and 2015E EV / EBITDA1 2014E EV / EBITDA Median = 6.8x 8.8x 7.1x 7.9x 6.8x 4.8x Iris Current Price Iris @ $5.70 Offer Price Chinasoft AsiaInfo Pactera Trading Multiple Transaction Price Implied Multiple2 2015E EV / EBITDA Median = 6.8x 9.4x 6.1x 6.8x 6.0x 4.2x Iris Current Price Iris @ $5.70 Offer Price Chinasoft AsiaInfo Pactera Trading Multiple Transaction Price Implied Multiple2 Source: IBES estimates and management projections. Latest market data as of Apr 11, 2014; AsiaInfo market data as of Jan 15, 2014 due to delisting of stock from the Exchange when it completed its merger with the CITIC-led buyer consortium on March 28, 2014. Pactera market data as of Jan 15, 2014 due to delisting of stock from the Exchange when it completed its merger with the Blackstone-led buyer consortium on Mar 28, 2014 1 Using management projections for Iris and IBES estimates for Chinasoft, AsiaInfo and Pactera. Iris 2014E EBITDA normalized to exclude estimated take-private related expenses of $6.5mm in 2014 2 Multiples based on latest IBES estimates at the time of closing for AsiaInfo’s and Pactera’s take private transactions. AsiaInfo completed its take private transaction on Jan 15, 2014 by a consortium led by CITIC for US$12.00 per share in cash. Pactera completed its take private transaction on Mar 28, 2014 by a consortium led by Blackstone for US$7.30 per ADS in cash. 8 STRICTLY CONFIDENTIAL AND PRELIMINARY DRAFT
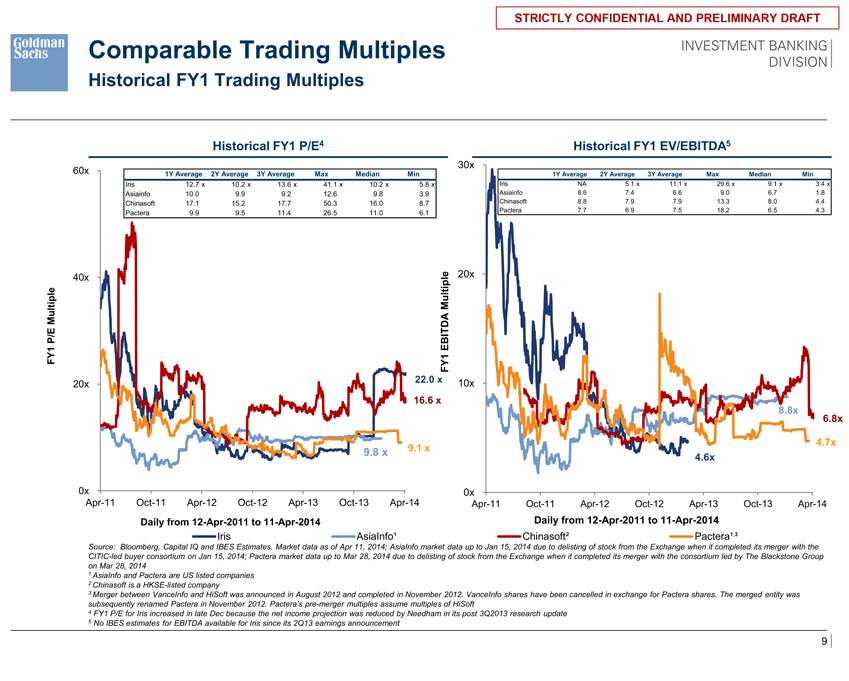
Goldman Sachs INVESTMENT BANKING DIVISION Comparable Trading Multiples Historical FY1 Trading Multiples Historical FY1 P/E4 60x 1Y Average 2Y Average 3Y Average Max Median Min Iris 12.7 x 10.2 x 13.6 x 41.1 x 10.2 x 5.8 x Asiainfo 10.0 9.9 9.2 12.6 9.8 3.9 Chinasoft 17.1 15.2 17.7 50.3 16.0 8.7 Pactera 9.9 9.5 11.4 26.5 11.0 6.1 40x Multiple P/E EBITDA FY1 FY1 22.0 x 20x 16.6 x 9.8 x 9.1 x 0x Apr-11 Oct-11 Apr-12 Oct-12 Apr-13 Oct-13 Apr-14 Daily from 12-Apr-2011 to 11-Apr-2014 Iris AsiaInfo1 Historical FY1 EV/EBITDA5 30x 1Y Average 2Y Average 3Y Average Max Median Min Iris NA 5.1 x 11.1 x 29.6 x 9.1 x 3.4 x Asiainfo 8.6 7.4 6.6 9.0 6.7 1.8 Chinasoft 8.8 7.9 7.9 13.3 8.0 4.4 Pactera 7.7 6.9 7.5 18.2 6.5 4.3 20x 10x 8.8x 6.8x 4.7x 4.6x 0x Apr-11 Oct-11 Apr-12 Oct-12 Apr-13 Oct-13 Apr-14 Daily from 12-Apr-2011 to 11-Apr-2014 Chinasoft2 Pactera1,3 Source: Bloomberg, Capital IQ and IBES Estimates. Market data as of Apr 11, 2014; AsiaInfo market data up to Jan 15, 2014 due to delisting of stock from the Exchange when it completed its merger with the CITIC-led buyer consortium on Jan 15, 2014; Pactera market data up to Mar 28, 2014 due to delisting of stock from the Exchange when it completed its merger with the consortium led by The Blackstone Group on Mar 28, 2014 1 AsiaInfo and Pactera are US listed companies 2 Chinasoft is a HKSE-listed company 3 Merger between VanceInfo and HiSoft was announced in August 2012 and completed in November 2012. VanceInfo shares have been cancelled in exchange for Pactera shares. The merged entity was subsequently renamed Pactera in November 2012. Pactera’s pre-merger multiples assume multiples of HiSoft 4 FY1 P/E for Iris increased in late Dec because the net income projection was reduced by Needham in its post 3Q2013 research update 5 No IBES estimates for EBITDA available for Iris since its 2Q13 earnings announcement 9 STRICTLY CONFIDENTIAL AND PRELIMINARY DRAFT
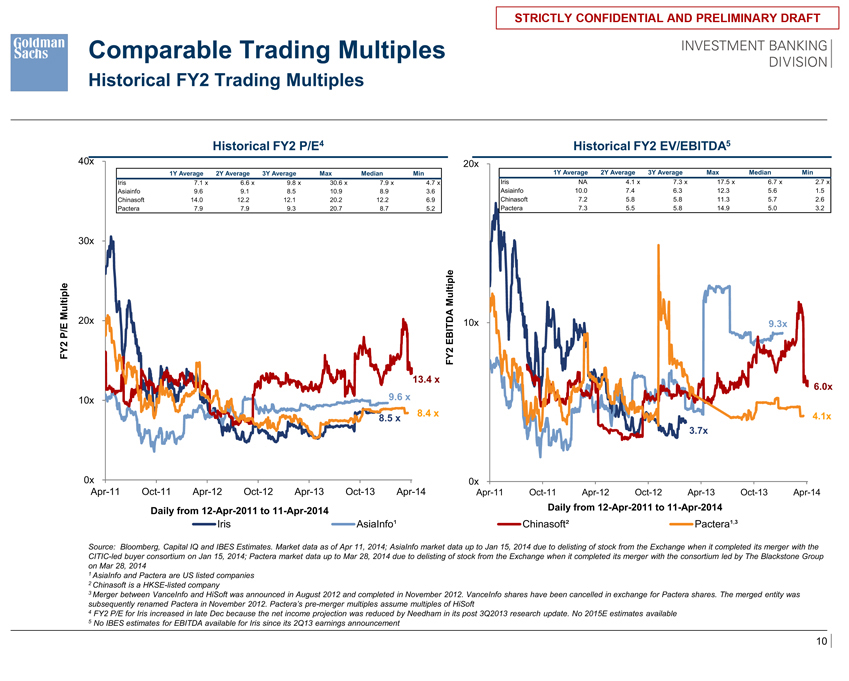
Goldman Sachs INVESTMENT BANKING DIVISION Comparable Trading Multiples Historical FY2 Trading Multiples Historical FY2 P/E4 40x 1Y Average 2Y Average 3Y Average Max Median Min Iris 7.1 x 6.6 x 9.8 x 30.6 x 7.9 x 4.7 x Asiainfo 9.6 9.1 8.5 10.9 8.9 3.6 Chinasoft 14.0 12.2 12.1 20.2 12.2 6.9 Pactera 7.9 7.9 9.3 20.7 8.7 5.2 30x Multiple M P/E 20x EBITDA FY2 FY2 13.4 x 10x 9.6 x 8.4 x 8.5 x 0x Apr-11 Oct-11 Apr-12 Oct-12 Apr-13 Oct-13 Apr-14 Daily from 12-Apr-2011 to 11-Apr-2014 Iris AsiaInfo1 Historical FY2 EV/EBITDA5 20x 1Y Average 2Y Average 3Y Average Max Median Min Iris NA 4.1 x 7.3 x 17.5 x 6.7 x 2.7 x Asiainfo 10.0 7.4 6.3 12.3 5.6 1.5 Chinasoft 7.2 5.8 5.8 11.3 5.7 2.6 Pactera 7.3 5.5 5.8 14.9 5.0 3.2 10x 9.3x 6.0x 4.1x 3.7x 0x Apr-11 Oct-11 Apr-12 Oct-12 Apr-13 Oct-13 Apr-14 Daily from 12-Apr-2011 to 11-Apr-2014 Chinasoft2 Pactera1,3 Source: Bloomberg, Capital IQ and IBES Estimates. Market data as of Apr 11, 2014; AsiaInfo market data up to Jan 15, 2014 due to delisting of stock from the Exchange when it completed its merger with the CITIC-led buyer consortium on Jan 15, 2014; Pactera market data up to Mar 28, 2014 due to delisting of stock from the Exchange when it completed its merger with the consortium led by The Blackstone Group on Mar 28, 2014 1 AsiaInfo and Pactera are US listed companies 2 Chinasoft is a HKSE-listed company 3 Merger between VanceInfo and HiSoft was announced in August 2012 and completed in November 2012. VanceInfo shares have been cancelled in exchange for Pactera shares. The merged entity was subsequently renamed Pactera in November 2012. Pactera’s pre-merger multiples assume multiples of HiSoft 4 FY2 P/E for Iris increased in late Dec because the net income projection was reduced by Needham in its post 3Q2013 research update. No 2015E estimates available 5 No IBES estimates for EBITDA available for Iris since its 2Q13 earnings announcement 10 STRICTLY CONFIDENTIAL AND PRELIMINARY DRAFT
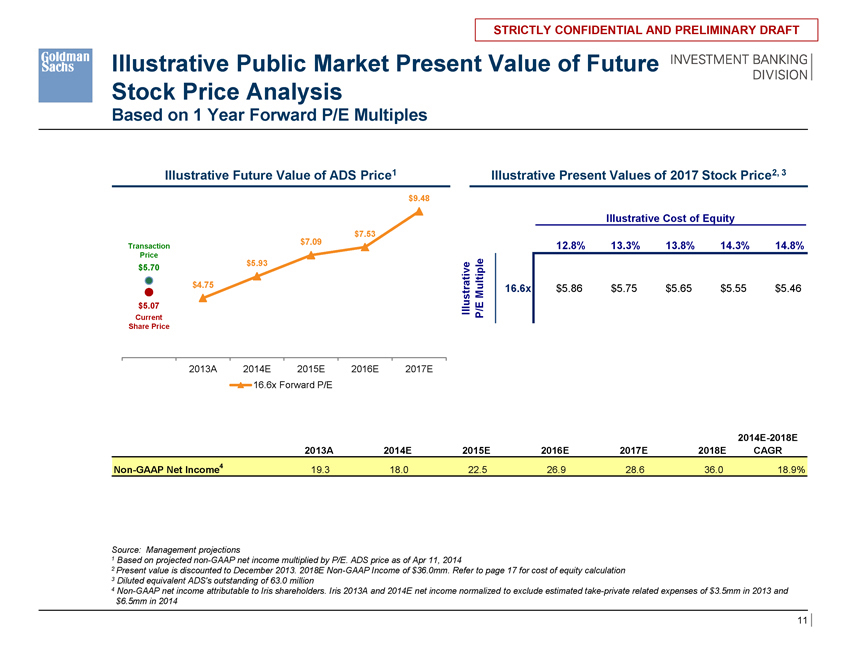
Goldman Sachs INVESTMENT BANKING DIVISION Illustrative Public Market Present Value of Future Stock Price Analysis Based on 1 Year Forward P/E Multiples Illustrative Future Value of ADS Price1 $9.48 $7.53 $7.09 Transaction Price $5.93 $5.70 $4.75 $5.07 Current Share Price 2013A 2014E 2015E 2016E 2017E 16.6x Forward P/E Illustrative Present Values of 2017 Stock Price2, 3 Illustrative Cost of Equity $5.65 12.8% 13.3% 13.8% 14.3% 14.8% Illustrative Multiple 16.6x $5.86 $5.75 $5.65 $5.55 $5.46 P/E 2014E-2018E 2013A 2014E 2015E 2016E 2017E 2018E CAGR Non-GAAP Net Income4 19.3 18.0 22.5 26.9 28.6 36.0 18.9% Source: Management projections 1 Based on projected non-GAAP net income multiplied by P/E. ADS price as of Apr 11, 2014 2 Present value is discounted to December 2013. 2018E Non-GAAP Income of $36.0mm. Refer to page 17 for cost of equity calculation 3 Diluted equivalent ADS’s outstanding of 63.0 million 4 Non-GAAP net income attributable to Iris shareholders. Iris 2013A and 2014E net income normalized to exclude estimated take-private related expenses of $3.5mm in 2013 and $6.5mm in 2014 11 STRICTLY CONFIDENTIAL AND PRELIMINARY DRAFT
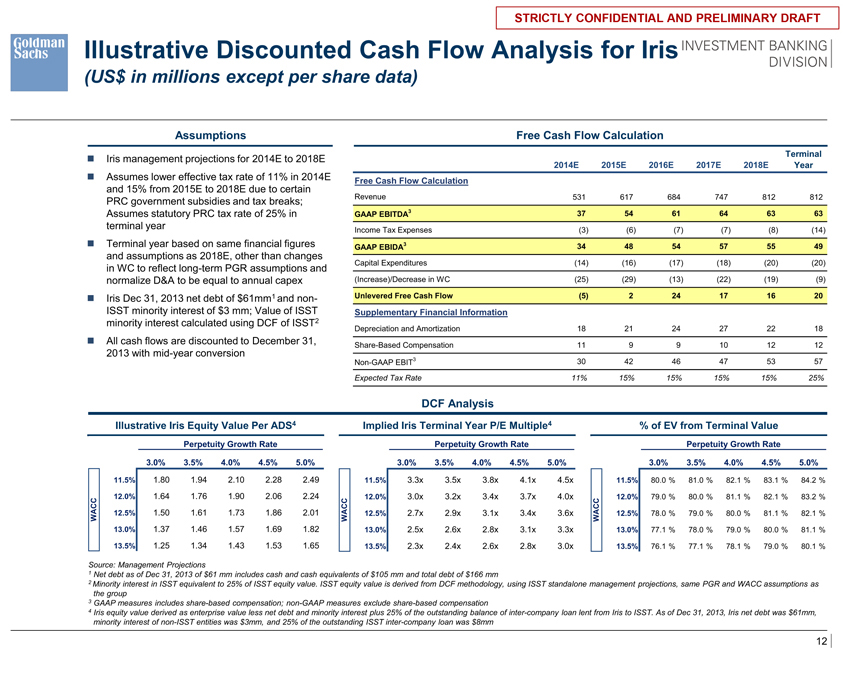
Goldman Sachs INVESTMENT BANKING DIVISION Illustrative Discounted Cash Flow Analysis for Iris (US$ in millions except per share data) Assumptions Iris management projections for 2014E to 2018E Assumes lower effective tax rate of 11% in 2014E and 15% from 2015E to 2018E due to certain PRC government subsidies and tax breaks; Assumes statutory PRC tax rate of 25% in terminal year Terminal year based on same financial figures and assumptions as 2018E, other than changes in WC to reflect long-term PGR assumptions and normalize D&A to be equal to annual capex Iris Dec 31, 2013 net debt of $61mm1 and non-ISST minority interest of $3 mm; Value of ISST minority interest calculated using DCF of ISST2 All cash flows are discounted to December 31, 2013 with mid-year conversion Free Cash Flow Calculation Terminal 2014E 2015E 2016E 2017E 2018E Year Free Cash Flow Calculation Revenue 531 617 684 747 812 812 GAAP EBITDA3 37 54 61 64 63 63 Income Tax Expenses (3) (6) (7) (7) (8) (14) GAAP EBIDA3 34 48 54 57 55 49 Capital Expenditures (14) (16) (17) (18) (20) (20) (Increase)/Decrease in WC (25) (29) (13) (22) (19) (9) Unlevered Free Cash Flow (5) 2 24 17 16 20 Supplementary Financial Information Depreciation and Amortization 18 21 24 27 22 18 Share-Based Compensation 11 9 9 10 12 12 Non-GAAP EBIT3 30 42 46 47 53 57 Expected Tax Rate 11% 15% 15% 15% 15% 25% DCF Analysis Illustrative Iris Equity Value Per ADS4 Perpetuity Growth Rate $1.725 3.0% 3.5% 4.0% 4.5% 5.0% 11.5% 1.80 1.94 2.10 2.28 2.49 12.0% 1.64 1.76 1.90 2.06 2.24 WACC 12.5% 1.50 1.61 1.73 1.86 2.01 13.0% 1.37 1.46 1.57 1.69 1.82 13.5% 1.25 1.34 1.43 1.53 1.65 Implied Iris Terminal Year P/E Multiple4 Perpetuity Growth Rate 312.0% 3.0% 3.5% 4.0% 4.5% 5.0% 11.5% 3.3x 3.5x 3.8x 4.1x 4.5x 12.0% 3.0x 3.2x 3.4x 3.7x 4.0x WACC 12.5% 2.7x 2.9x 3.1x 3.4x 3.6x 13.0% 2.5x 2.6x 2.8x 3.1x 3.3x 13.5% 2.3x 2.4x 2.6x 2.8x 3.0x % of EV from Terminal Value Perpetuity Growth Rate 80% 3.0% 3.5% 4.0% 4.5% 5.0% 11.5% 80.0 % 81.0 % 82.1 % 83.1 % 84.2 % 12.0% 79.0 % 80.0 % 81.1 % 82.1 % 83.2 % WACC 12.5% 78.0 % 79.0 % 80.0 % 81.1 % 82.1 % 13.0% 77.1 % 78.0 % 79.0 % 80.0 % 81.1 % 13.5% 76.1 % 77.1 % 78.1 % 79.0 % 80.1 % Source: Management Projections 1 Net debt as of Dec 31, 2013 of $61 mm includes cash and cash equivalents of $105 mm and total debt of $166 mm 2 Minority interest in ISST equivalent to 25% of ISST equity value. ISST equity value is derived from DCF methodology, using ISST standalone management projections, same PGR and WACC assumptions as the group 3 GAAP measures includes share-based compensation; non-GAAP measures exclude share-based compensation 4 Iris equity value derived as enterprise value less net debt and minority interest plus 25% of the outstanding balance of inter-company loan lent from Iris to ISST. As of Dec 31, 2013, Iris net debt was $61mm, minority interest of non-ISST entities was $3mm, and 25% of the outstanding ISST inter-company loan was $8mm 12 STRICTLY CONFIDENTIAL AND PRELIMINARY DRAFT
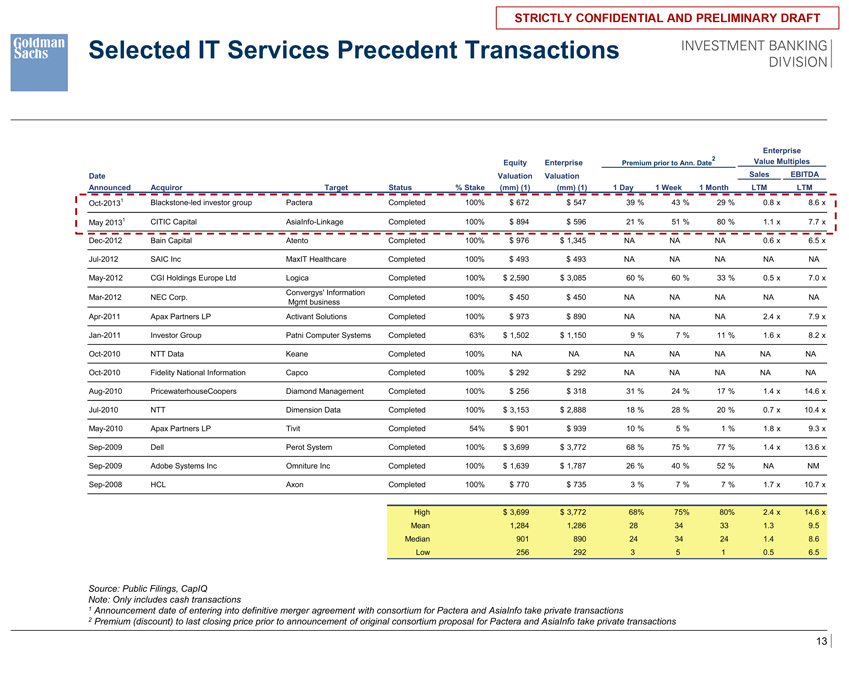
Goldman Sachs INVESTMENT BANKING DIVISION Selected IT Services Precedent Transactions Enterprise 2 Value Multiples Equity Enterprise Premium prior to Ann. Date Date Valuation Valuation Sales EBITDA Announced Acquiror Target Status % Stake (mm) (1) (mm) (1) 1 Day 1 Week 1 Month LTM LTM Oct-20131 Blackstone-led investor group Pactera Completed 100% $ 672 $ 547 39 % 43 % 29 % 0.8 x 8.6 x May 20131 CITIC Capital AsiaInfo-Linkage Completed 100% $ 894 $ 596 21 % 51 % 80 % 1.1 x 7.7 x Dec-2012 Bain Capital Atento Completed 100% $ 976 $ 1,345 NA NA NA 0.6 x 6.5 x Jul-2012 SAIC Inc MaxIT Healthcare Completed 100% $ 493 $ 493 NA NA NA NA NA May-2012 CGI Holdings Europe Ltd Logica Completed 100% $ 2,590 $ 3,085 60 % 60 % 33 % 0.5 x 7.0 x Convergys’ Information Mar-2012 NEC Corp. Completed 100% $ 450 $ 450 NA NA NA NA NA Mgmt business Apr-2011 Apax Partners LP Activant Solutions Completed 100% $ 973 $ 890 NA NA NA 2.4 x 7.9 x Jan-2011 Investor Group Patni Computer Systems Completed 63% $ 1,502 $ 1,150 9 % 7 % 11 % 1.6 x 8.2 x Oct-2010 NTT Data Keane Completed 100% NA NA NA NA NA NA NA Oct-2010 Fidelity National Information Capco Completed 100% $ 292 $ 292 NA NA NA NA NA Aug-2010 PricewaterhouseCoopers Diamond Management Completed 100% $ 256 $ 318 31 % 24 % 17 % 1.4 x 14.6 x Jul-2010 NTT Dimension Data Completed 100% $ 3,153 $ 2,888 18 % 28 % 20 % 0.7 x 10.4 x May-2010 Apax Partners LP Tivit Completed 54% $ 901 $ 939 10 % 5 % 1 % 1.8 x 9.3 x Sep-2009 Dell Perot System Completed 100% $ 3,699 $ 3,772 68 % 75 % 77 % 1.4 x 13.6 x Sep-2009 Adobe Systems Inc Omniture Inc Completed 100% $ 1,639 $ 1,787 26 % 40 % 52 % NA NM Sep-2008 HCL Axon Completed 100% $ 770 $ 735 3 % 7 % 7 % 1.7 x 10.7 x High $ 3,699 $ 3,772 68% 75% 80% 2.4 x 14.6 x Mean 1,284 1,286 28 34 33 1.3 9.5 Median 901 890 24 34 24 1.4 8.6 Low 256 292 3 5 1 0.5 6.5 Source: Public Filings, CapIQ Note: Only includes cash transactions 1 Announcement date of entering into definitive merger agreement with consortium for Pactera and AsiaInfo take private transactions 2 Premium (discount) to last closing price prior to announcement of original consortium proposal for Pactera and AsiaInfo take private transactions 13 STRICTLY CONFIDENTIAL AND PRELIMINARY DRAFT
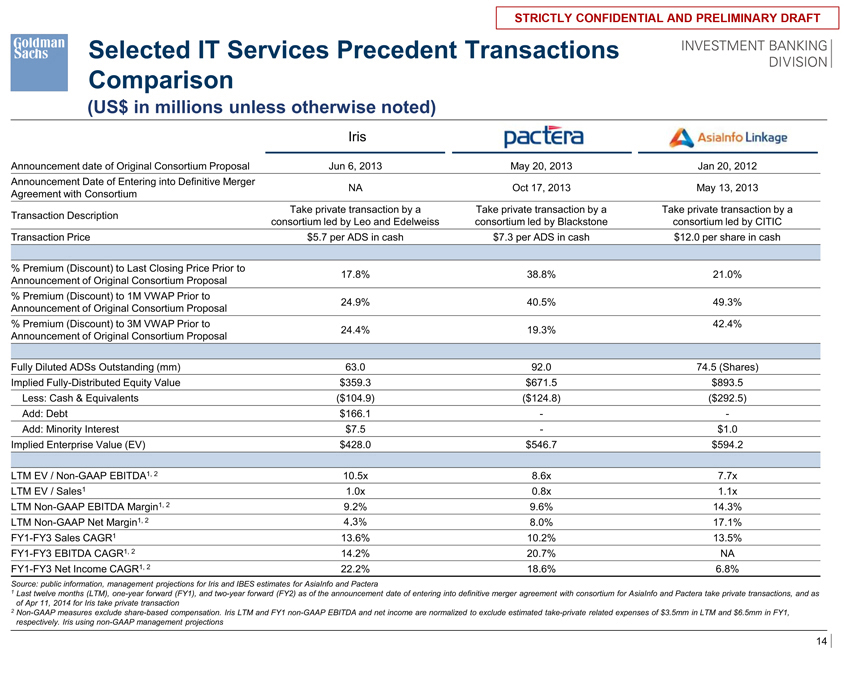
Goldman Sachs INVESTMENT BANKING DIVISION Selected IT Services Precedent Transactions Comparison (US$ in millions unless otherwise noted) Iris Announcement date of Original Consortium Proposal Jun 6, 2013 May 20, 2013 Jan 20, 2012 Announcement Date of Entering into Definitive Merger NA Oct 17, 2013 May 13, 2013 Agreement with Consortium Take private transaction by a Take private transaction by a Take private transaction by a Transaction Description consortium led by Leo and Edelweiss consortium led by Blackstone consortium led by CITIC Transaction Price $5.7 per ADS in cash $7.3 per ADS in cash $12.0 per share in cash % Premium (Discount) to Last Closing Price Prior to 17.8% 38.8% 21.0% Announcement of Original Consortium Proposal % Premium (Discount) to 1M VWAP Prior to 24.9% 40.5% 49.3% Announcement of Original Consortium Proposal % Premium (Discount) to 3M VWAP Prior to 42.4% 24.4% 19.3% Announcement of Original Consortium Proposal Fully Diluted ADSs Outstanding (mm) 63.0 92.0 74.5 (Shares) Implied Fully-Distributed Equity Value $359.3 $671.5 $893.5 Less: Cash & Equivalents ($104.9) ($124.8) ($292.5) Add: Debt $166.1 — Add: Minority Interest $7.5—$1.0 Implied Enterprise Value (EV) $428.0 $546.7 $594.2 LTM EV / Non-GAAP EBITDA1, 2 10.5x 8.6x 7.7x LTM EV / Sales1 1.0x 0.8x 1.1x LTM Non-GAAP EBITDA Margin1, 2 9.2% 9.6% 14.3% LTM Non-GAAP Net Margin1, 2 4.3% 8.0% 17.1% FY1-FY3 Sales CAGR1 13.6% 10.2% 13.5% FY1-FY3 EBITDA CAGR1, 2 14.2% 20.7% NA FY1-FY3 Net Income CAGR1, 2 22.2% 18.6% 6.8% Source: public information, management projections for Iris and IBES estimates for AsiaInfo and Pactera 1 Last twelve months (LTM), one-year forward (FY1), and two-year forward (FY2) as of the announcement date of entering into definitive merger agreement with consortium for AsiaInfo and Pactera take private transactions, and as of Apr 11, 2014 for Iris take private transaction 2 Non-GAAP measures exclude share-based compensation. Iris LTM and FY1 non-GAAP EBITDA and net income are normalized to exclude estimated take-private related expenses of $3.5mm in LTM and $6.5mm in FY1, respectively. Iris using non-GAAP management projections AsiaInfo Linkage Pactera 14 STRICTLY CONFIDENTIAL AND PRELIMINARY DRAFT
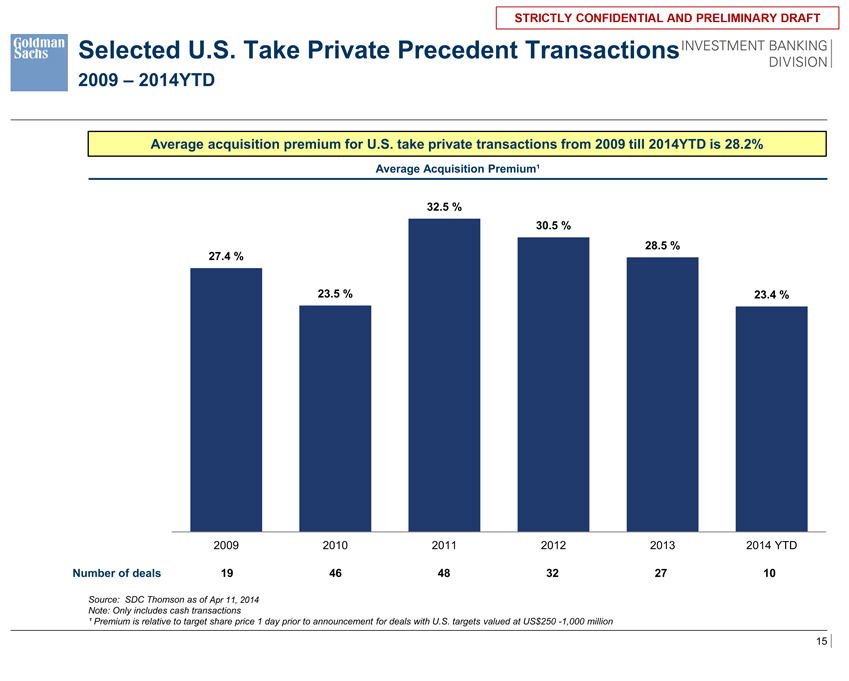
Goldman Sachs INVESTMENT BANKING DIVISION Selected U.S. Take Private Precedent Transactions 2009 – 2014YTD Average acquisition premium for U.S. take private transactions from 2009 till 2014YTD is 28.2% Average Acquisition Premium1 32.5 % 30.5 % 28.5 % 27.4 % 23.5 % 23.4 % 2009 2010 2011 2012 2013 2014 YTD Number of deals 19 46 48 32 27 10 Source: SDC Thomson as of 11-Apr-2014 Note: Only includes cash transactions1 Premium is relative to target share price 1 day prior to announcement for deals with U.S. targets valued at US$250 -1,000 million 15 STRICTLY CONFIDENTIAL AND PRELIMINARY DRAFT
Goldman Sachs INVESTMENT BANKING DIVISION Appendix A: Illustrative Weighted Average Cost of Capital Calculation STRICTLY CONFIDENTIAL AND PRELIMINARY DRAFT

Goldman Sachs INVESTMENT BANKING DIVISION WACC Calculation Overview of WACC Calculation DC E WACCKd 1t LYc 1t LKe L KeRfeERP) Kd = Pre-tax cost of debt Yc = Pre-tax yield on free cash Ke = Cost of Equity t = Tax rate L = Levered value (Equity + Debt Cash) at market value D L = Debt percentage in target capital structure C = Permanent excess cash percentage in target capital structure L E = Equity percentage in target capital structure L Rf = Risk-free rate e = Equity beta ERP = Equity risk premium WACC Calculation Cost of Debt Target Capital Structure Pre-Tax Cost of Debt 10.0% D / (D+E) 20.0% Marginal Tax Rate 25.0% E / (D+E) 80.0% Post-Tax Cost of Debt 7.5% Total 100.0% Cost of Equity WACC Calculations Risk Free Rate 3.3% Cost of Debt 7.5% Risk Premium 6.7% Cost of Equity 13.8% Beta 1.57 WACC 12.5% Cost of Equity 13.8% Target Capital Structure Cost of Debt Cost of Equity Assumptions Management estimate considering market conditions D/(D+E) 20.0% and future strategic expansion alternatives E/(D+E) 80.0% 1 D/(D+E) Long-term cost of unsecured debt considering Kd 10.0% Companys capital structure and financial conditions T 25.0% Management projection 30 year US government bond yield maturing in Feb Rf 3.28% 2036 (in c. 20 years) Two-year historical beta of Ciber from the last two e 1.57 years Ibbotsons U.S. equity risk premium from 1926— ERP 6.70% 2012 WACC Sensitivity Analysis WACC Beta $0.13 1.37 1.47 1.57 1.67 1.77 10.0% 12.0% 12.6% 13.2% 13.8% 14.4% (D+E) 15.0% 11.7% 12.3% 12.9% 13.4% 14.0% / 20.0% 11.5% 12.0% 12.5% 13.1% 13.6% D 25.0% 11.2% 11.7% 12.2% 12.7% 13.2% 30.0% 11.0% 11.4% 11.9% 12.4% 12.8% Sources: Ibbotson Associates, Axioma, Bloomberg and latest publicly available financial statements Illustrative Weighted Average Cost of Capital Calculation 17 STRICTLY CONFIDENTIAL AND PRELIMINARY DRAFT
Goldman Sachs INVESTMENT BANKING DIVISION Appendix B: Comparison of Selected Companies STRICTLY CONFIDENTIAL AND PRELIMINARY DRAFT
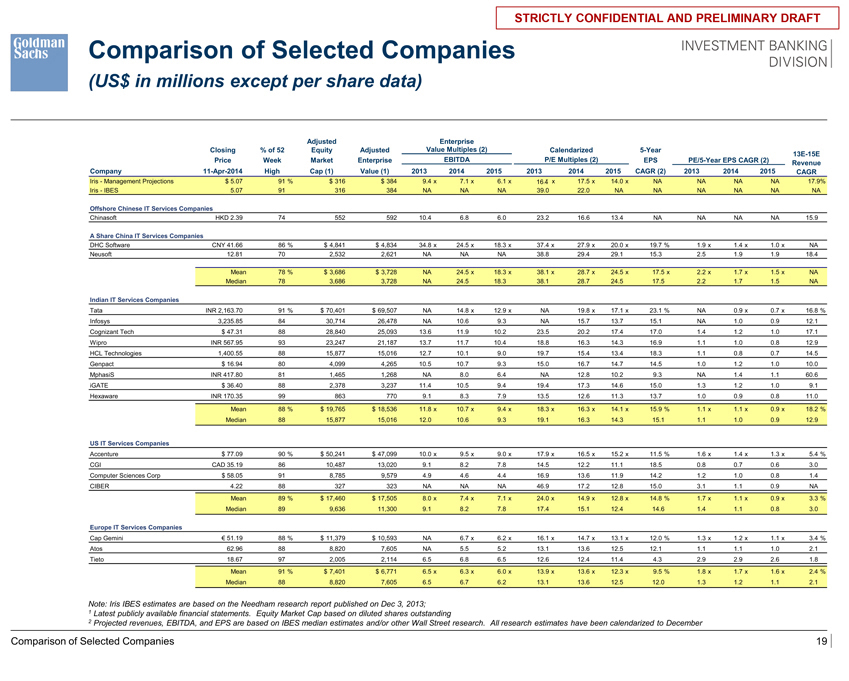
Goldman Sachs INVESTMENT BANKING DIVISION Comparison of Selected Companies (US$ in millions except per share data) Adjusted Enterprise Closing % of 52 Equity Adjusted Value Multiples (2) Calendarized 5-Year Price Week Market Enterprise EBITDA P/E Multiples (2) EPS PE/5-Year EPS CAGR (2) 13E-15E Revenue Company 11-Apr-2014 High Cap (1) Value (1) 2013 2014 2015 2013 2014 2015 CAGR (2) 2013 2014 2015 CAGR Iris—Management Projections $ 5.07 91 % $ 316 $ 384 9.4 x 7.1 x 6.1 x 16.4 x 17.5 x 14.0 x NA NA NA NA 17.9% Iris—IBES 5.07 91 316 384 NA NA NA 39.0 22.0 NA NA NA NA NA NA Offshore Chinese IT Services Companies Chinasoft HKD 2.39 74 552 592 10.4 6.8 6.0 23.2 16.6 13.4 NA NA NA NA 15.9 A Share China IT Services Companies DHC Software CNY 41.66 86 % $ 4,841 $ 4,834 34.8 x 24.5 x 18.3 x 37.4 x 27.9 x 20.0 x 19.7 % 1.9 x 1.4 x 1.0 x NA Neusoft 12.81 70 2,532 2,621 NA NA NA 38.8 29.4 29.1 15.3 2.5 1.9 1.9 18.4 Mean 78 % $ 3,686 $ 3,728 NA 24.5 x 18.3 x 38.1 x 28.7 x 24.5 x 17.5 x 2.2 x 1.7 x 1.5 x NA Median 78 3,686 3,728 NA 24.5 18.3 38.1 28.7 24.5 17.5 2.2 1.7 1.5 NA Indian IT Services Companies Tata INR 2,163.70 91 % $ 70,401 $ 69,507 NA 14.8 x 12.9 x NA 19.8 x 17.1 x 23.1 % NA 0.9 x 0.7 x 16.8 % Infosys 3,235.85 84 30,714 26,478 NA 10.6 9.3 NA 15.7 13.7 15.1 NA 1.0 0.9 12.1 Cognizant Tech $ 47.31 88 28,840 25,093 13.6 11.9 10.2 23.5 20.2 17.4 17.0 1.4 1.2 1.0 17.1 Wipro INR 567.95 93 23,247 21,187 13.7 11.7 10.4 18.8 16.3 14.3 16.9 1.1 1.0 0.8 12.9 HCL Technologies 1,400.55 88 15,877 15,016 12.7 10.1 9.0 19.7 15.4 13.4 18.3 1.1 0.8 0.7 14.5 Genpact $ 16.94 80 4,099 4,265 10.5 10.7 9.3 15.0 16.7 14.7 14.5 1.0 1.2 1.0 10.0 MphasiS INR 417.80 81 1,465 1,268 NA 8.0 6.4 NA 12.8 10.2 9.3 NA 1.4 1.1 60.6 iGATE $ 36.40 88 2,378 3,237 11.4 10.5 9.4 19.4 17.3 14.6 15.0 1.3 1.2 1.0 9.1 Hexaware INR 170.35 99 863 770 9.1 8.3 7.9 13.5 12.6 11.3 13.7 1.0 0.9 0.8 11.0 Mean 88 % $ 19,765 $ 18,536 11.8 x 10.7 x 9.4 x 18.3 x 16.3 x 14.1 x 15.9 % 1.1 x 1.1 x 0.9 x 18.2 % Median 88 15,877 15,016 12.0 10.6 9.3 19.1 16.3 14.3 15.1 1.1 1.0 0.9 12.9 US IT Services Companies Accenture $ 77.09 90 % $ 50,241 $ 47,099 10.0 x 9.5 x 9.0 x 17.9 x 16.5 x 15.2 x 11.5 % 1.6 x 1.4 x 1.3 x 5.4 % CGI CAD 35.19 86 10,487 13,020 9.1 8.2 7.8 14.5 12.2 11.1 18.5 0.8 0.7 0.6 3.0 Computer Sciences Corp $ 58.05 91 8,785 9,579 4.9 4.6 4.4 16.9 13.6 11.9 14.2 1.2 1.0 0.8 1.4 CIBER 4.22 88 327 323 NA NA NA 46.9 17.2 12.8 15.0 3.1 1.1 0.9 NA Mean 89 % $ 17,460 $ 17,505 8.0 x 7.4 x 7.1 x 24.0 x 14.9 x 12.8 x 14.8 % 1.7 x 1.1 x 0.9 x 3.3 % Median 89 9,636 11,300 9.1 8.2 7.8 17.4 15.1 12.4 14.6 1.4 1.1 0.8 3.0 Europe IT Services Companies Cap Gemini € 51.19 88 % $ 11,379 $ 10,593 NA 6.7 x 6.2 x 16.1 x 14.7 x 13.1 x 12.0 % 1.3 x 1.2 x 1.1 x 3.4 % Atos 62.96 88 8,820 7,605 NA 5.5 5.2 13.1 13.6 12.5 12.1 1.1 1.1 1.0 2.1 Tieto 18.67 97 2,005 2,114 6.5 6.8 6.5 12.6 12.4 11.4 4.3 2.9 2.9 2.6 1.8 Mean 91 % $ 7,401 $ 6,771 6.5 x 6.3 x 6.0 x 13.9 x 13.6 x 12.3 x 9.5 % 1.8 x 1.7 x 1.6 x 2.4 % Median 88 8,820 7,605 6.5 6.7 6.2 13.1 13.6 12.5 12.0 1.3 1.2 1.1 2.1 Note: Iris IBES estimates are based on the Needham research report published on Dec 3, 2013; 1 Latest publicly available financial statements. Equity Market Cap based on diluted shares outstanding 2 Projected revenues, EBITDA, and EPS are based on IBES median estimates and/or other Wall Street research. All research estimates have been calendarized to December Comparison of Selected Companies 19 STRICTLY CONFIDENTIAL AND PRELIMINARY DRAFT