Exhibit 99.1
THIS IS NEITHER AN OFFER TO SELL NOR A SOLICITATION OF AN OFFER TO BUY THE SECURITIES DESCRIBED HEREIN . AN OFFERING IS MADE ONLY BY A PROSPECTUS . THIS LITERATURE MUST BE PRECEDED OR ACCOMPANIED BY A CURRENT PROSPECTUS . AS SUCH, A COPY OF THE CURRENT PROSPECTUS MUST BE MADE AVAILABLE TO YOU IN CONNECTION WITH THIS OFFERING . YOU SHOULD READ THE CURRENT PROSPECTUS IN ORDER TO UNDERSTAND FULLY ALL OF THE IMPLICATIONS AND RISKS OF THE OFFERING OF SECURITIES TO WHICH IT RELATES . AN INVESTMENT IN ARC - RCA SHOULD BE MADE ONLY AFTER A CAREFUL REVIEW OF THE PROSPECTUS . No offering is made except by a prospectus filed with the Department of Law of the State of New York . Neither the Attorney - General of the State of New York nor any other state or federal regulator has passed on or endorsed the merits of this offering or these securities or confirmed the adequacy or accuracy of the prospectus . Any representation to the contrary is unlawful . All information contained in this material is qualified in its entirety by the terms of the current prospectus . A Public Non - Traded Real Estate Investment Trust* American Realty Capital – Retail Centers of America Publicly Registered Non - Traded Real Estate Investment Trust
RISK FACTORS American Realty Capital – Retail Centers of America 2 Risk Factors Investing in our common stock involves a high degree of risk . You should purchase these securities only if you can afford a complete loss of your investment . See the section entitled “Risk Factors” in the prospectus for a discussion of the risks which should be considered in connection with your investment in our common stock . Forward - Looking Statements This presentation may contain forward - looking statements . You can identify forward - looking statements by the use of forward looking terminology such as “believes,” “expects,” “may,” “will,” “would,” “could,” “should,” “seeks,” “intends,” “plans,” “projects,” “estimates,” “anticipates,” “predicts,” or “potential” or the negative of these words and phrases or similar words or phrases . Please review the end of this presentation and the fund’s prospectus for a more complete list of risk factors, as well as a discussion of forward - looking statements and other offering details.
INVESTMENT THESIS American Realty Capital – Retail Centers of America 3 Focused on acquiring existing anchored, stabilized core retail properties; including power centers, lifestyle centers, grocery - anchored shopping centers ( with a purchase price in excess of $20.0 million) that are at least 80.0% leased at the time of acquisition. 3 Primary Objectives*: □ Preserve and protect investors’ capital; □ Pay monthly distributions; and □ Increase the value of assets in order to generate capital appreciation. * There is no guarantee these objectives will be met.
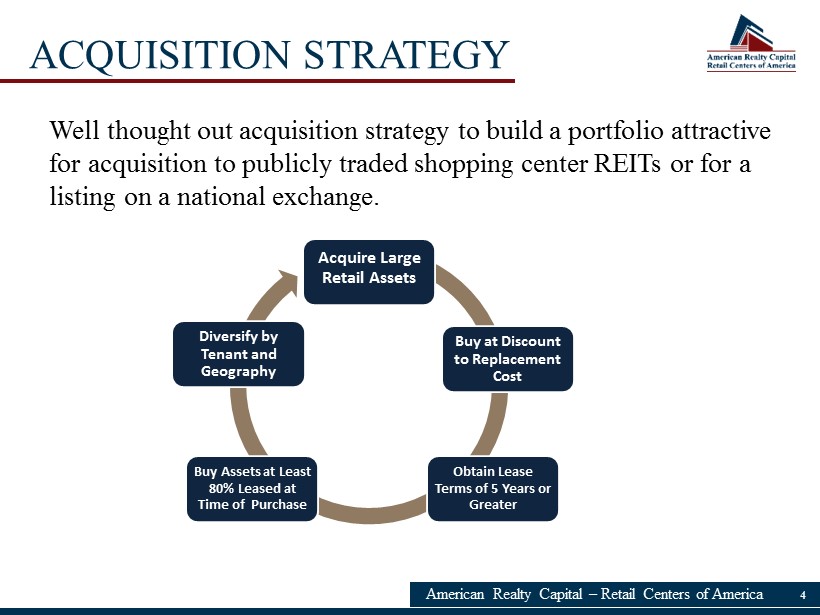
ACQUISITION STRATEGY American Realty Capital – Retail Centers of America 4 Acquire Large Retail Assets Diversify by Tenant and Geography Obtain Lease Terms of 5 Years or Greater Buy Assets at Least 80% Leased at Time of Purchase Buy at Discount to Replacement Cost Well thought out acquisition strategy to build a portfolio attractive for acquisition to publicly traded shopping center REITs or for a listing on a national exchange.
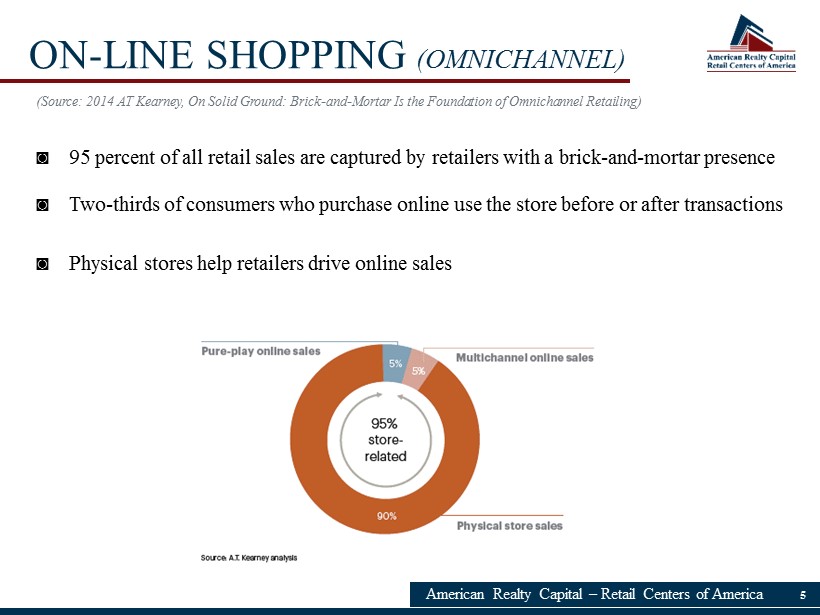
American Realty Capital – Retail Centers of America 5 ON - LINE SHOPPING ( OMNICHANNEL ) (Source: 2014 AT Kearney, On Solid Ground: Brick - and - Mortar Is the Foundation of Omnichannel Retailing) ◙ 95 percent of all retail sales are captured by retailers with a brick - and - mortar presence ◙ Two - thirds of consumers who purchase online use the store before or after transactions ◙ Physical stores help retailers drive online sales
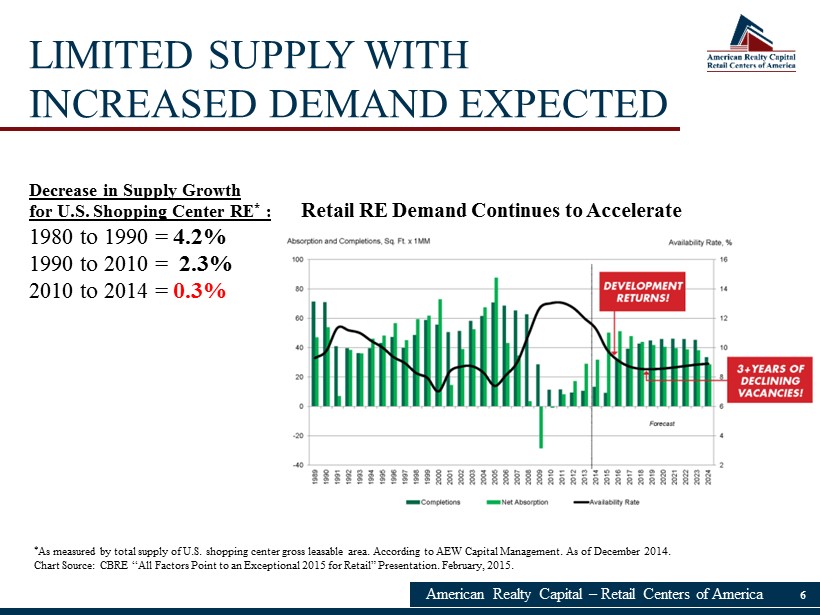
6 American Realty Capital – Retail Centers of America Decrease in Supply Growth for U . S . Shopping Center RE * : 1980 to 1990 = 4 . 2 % 1990 to 2010 = 2 . 3 % 2010 to 2014 = 0 . 3 % * As measured by total supply of U . S . shopping center gross leasable area . According to AEW Capital Management . As of December 2014 . Chart Source : CBRE “All Factors Point to an Exceptional 2015 for Retail” Presentation . February, 2015 . LIMITED SUPPLY WITH INCREASED DEMAND EXPECTED Retail RE Demand Continues to Accelerate
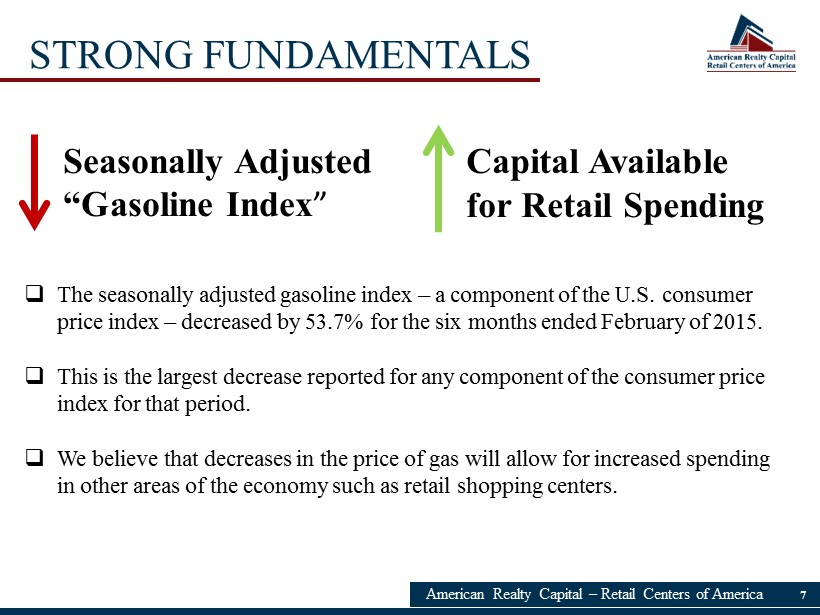
7 STRONG FUNDAMENTALS American Realty Capital – Retail Centers of America Seasonally Adjusted “Gasoline Index ” Capital Available for Retail Spending □ The seasonally adjusted gasoline index – a component of the U.S. consumer price index – decreased by 53.7% for the six months ended February of 2015. □ This is the largest decrease reported for any component of the consumer price index for that period. □ We believe that decreases in the price of gas will allow for increased spending in other areas of the economy such as retail shopping centers.
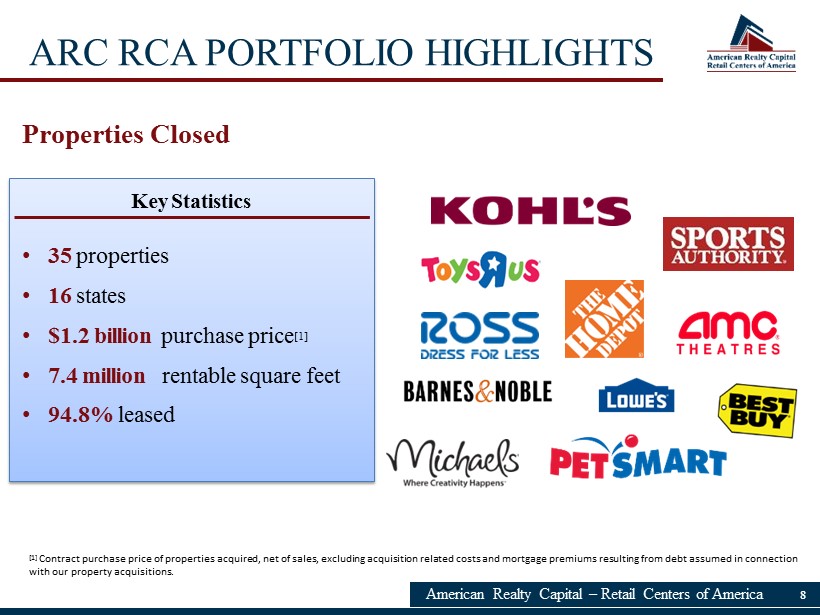
ARC RCA PORTFOLIO HIGHLIGHTS American Realty Capital – Retail Centers of America 8 Properties Closed Key Statistics [ 1] Contract purchase price of properties acquired, net of sales, excluding acquisition related costs and mortgage premiums resul tin g from debt assumed in connection with our property acquisitions. • 35 properties • 16 states • $1.2 billion purchase price [1] • 7.4 million rentable square feet • 94.8% leased
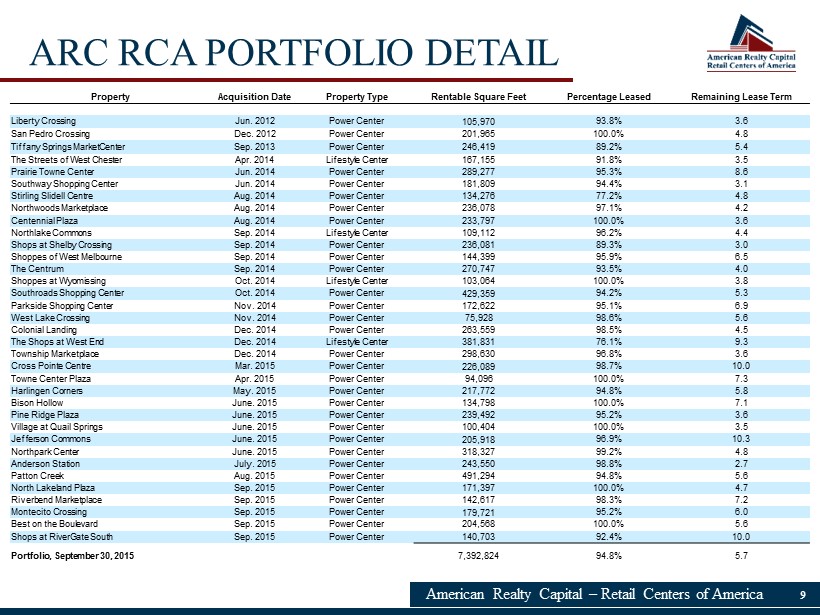
ARC RCA PORTFOLIO DETAIL American Realty Capital – Retail Centers of America 9 Property Acquisition Date Property Type Rentable Square Feet Percentage Leased Remaining Lease Term Liberty Crossing Jun. 2012 Power Center 105,970 93.8% 3.6 San Pedro Crossing Dec. 2012 Power Center 201,965 100.0% 4.8 Tiffany Springs MarketCenter Sep. 2013 Power Center 246,419 89.2% 5.4 The Streets of West Chester Apr. 2014 Lifestyle Center 167,155 91.8% 3.5 Prairie Towne Center Jun. 2014 Power Center 289,277 95.3% 8.6 Southway Shopping Center Jun. 2014 Power Center 181,809 94.4% 3.1 Stirling Slidell Centre Aug. 2014 Power Center 134,276 77.2% 4.8 Northwoods Marketplace Aug. 2014 Power Center 236,078 97.1% 4.2 Centennial Plaza Aug. 2014 Power Center 233,797 100.0% 3.6 Northlake Commons Sep. 2014 Lifestyle Center 109,112 96.2% 4.4 Shops at Shelby Crossing Sep. 2014 Power Center 236,081 89.3% 3.0 Shoppes of West Melbourne Sep. 2014 Power Center 144,399 95.9% 6.5 The Centrum Sep. 2014 Power Center 270,747 93.5% 4.0 Shoppes at Wyomissing Oct. 2014 Lifestyle Center 103,064 100.0% 3.8 Southroads Shopping Center Oct. 2014 Power Center 429,359 94.2% 5.3 Parkside Shopping Center Nov. 2014 Power Center 172,622 95.1% 6.9 West Lake Crossing Nov. 2014 Power Center 75,928 98.6% 5.6 Colonial Landing Dec. 2014 Power Center 263,559 98.5% 4.5 The Shops at West End Dec. 2014 Lifestyle Center 381,831 76.1% 9.3 Township Marketplace Dec. 2014 Power Center 298,630 96.8% 3.6 Cross Pointe Centre Mar. 2015 Power Center 226,089 98.7% 10.0 Towne Center Plaza Apr. 2015 Power Center 94,096 100.0% 7.3 Harlingen Corners May. 2015 Power Center 217,772 94.8% 5.8 Bison Hollow June. 2015 Power Center 134,798 100.0% 7.1 Pine Ridge Plaza June. 2015 Power Center 239,492 95.2% 3.6 Village at Quail Springs June. 2015 Power Center 100,404 100.0% 3.5 Jefferson Commons June. 2015 Power Center 205,918 96.9% 10.3 Northpark Center June. 2015 Power Center 318,327 99.2% 4.8 Anderson Station July. 2015 Power Center 243,550 98.8% 2.7 Patton Creek Aug. 2015 Power Center 491,294 94.8% 5.6 North Lakeland Plaza Sep. 2015 Power Center 171,397 100.0% 4.7 Riverbend Marketplace Sep. 2015 Power Center 142,617 98.3% 7.2 Montecito Crossing Sep. 2015 Power Center 179,721 95.2% 6.0 Best on the Boulevard Sep. 2015 Power Center 204,568 100.0% 5.6 Shops at RiverGate South Sep. 2015 Power Center 140,703 92.4% 10.0 Portfolio, September 30, 2015 7,392,824 94.8% 5.7
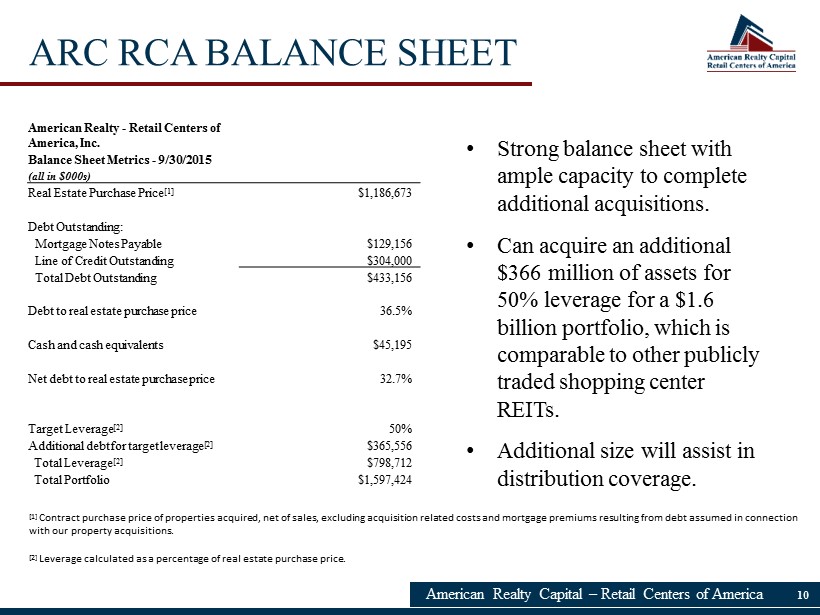
ARC RCA BALANCE SHEET American Realty Capital – Retail Centers of America 10 American Realty - Retail Centers of America, Inc. Balance Sheet Metrics - 9/30/2015 (all in $000s) Real Estate Purchase Price [1] $1,186,673 Debt Outstanding: Mortgage Notes Payable $ 129,156 Line of Credit Outstanding $304,000 Total Debt Outstanding $433,156 Debt to real estate purchase price 36.5% Cash and cash equivalents $ 45,195 Net debt to real estate purchase price 32.7% Target Leverage [2] 50% Additional debt for target leverage [2] $365,556 Total Leverage [2] $798,712 Total Portfolio $ 1,597,424 • Strong balance sheet with ample capacity to complete additional acquisitions. • Can acquire an additional $366 million of assets for 50% leverage for a $1.6 billion portfolio, which is comparable to other publicly traded shopping center REITs. • Additional size will assist in distribution coverage. [ 1] Contract purchase price of properties acquired, net of sales, excluding acquisition related costs and mortgage premiums resul tin g from debt assumed in connection with our property acquisitions. [2] Leverage calculated as a percentage of real estate purchase price.
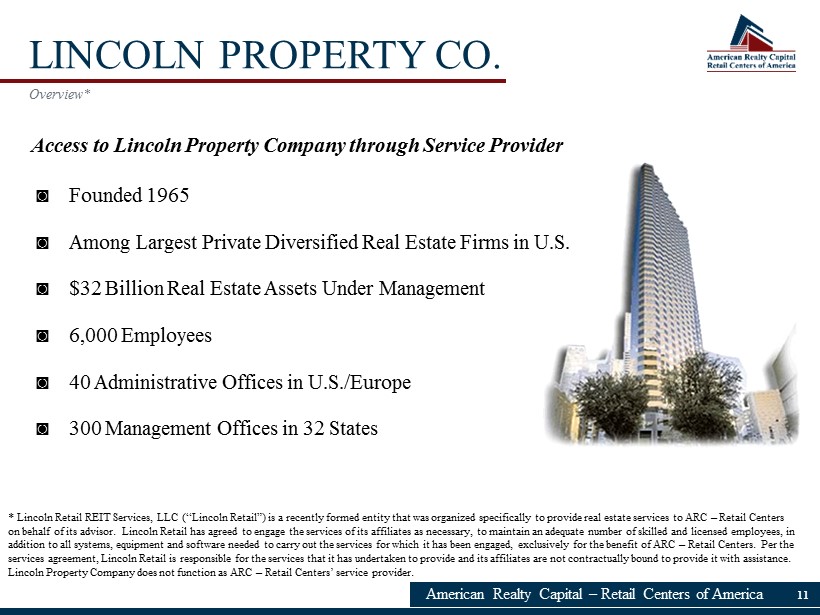
LINCOLN PROPERTY CO. American Realty Capital – Retail Centers of America 11 Overview* ◙ Founded 1965 ◙ Among Largest Private Diversified Real Estate Firms in U.S. ◙ $32 Billion Real Estate Assets Under Management ◙ 6 ,000 Employees ◙ 40 Administrative Offices in U.S./Europe ◙ 300 Management Offices in 32 States Access to Lincoln Property Company through Service Provider * Lincoln Retail REIT Services, LLC (“Lincoln Retail”) is a recently formed entity that was organized specifically to provide real esta te services to ARC – Retail Centers on behalf of its advisor. Lincoln Retail has agreed to engage the services of its affiliates as necessary, to maintain an ad equ ate number of skilled and licensed employees, in addition to all systems, equipment and software needed to carry out the services for which it has been engaged, exclusively f or the benefit of ARC – Retail Centers. Per the services agreement, Lincoln Retail is responsible for the services that it has undertaken to provide and its affiliates are n ot contractually bound to provide it with assistance. Lincoln Property Company does not function as ARC – Retail Centers’ service provider.
KEY INITIATIVES American Realty Capital – Retail Centers of America 12 □ Continue to deploy available cash and complete acquisitions under contract. □ Review opportunities to increase NOI at existing properties. □ Assess capacity on the line of credit and consider additional leverage. □ Evaluate current portfolio for dispositions and/or joint venture opportunities. □ Establish NAV in compliance with FINRA 15 - 02 during 1Q16. □ Monitor the publicly traded REIT market and evaluate liquidity options.
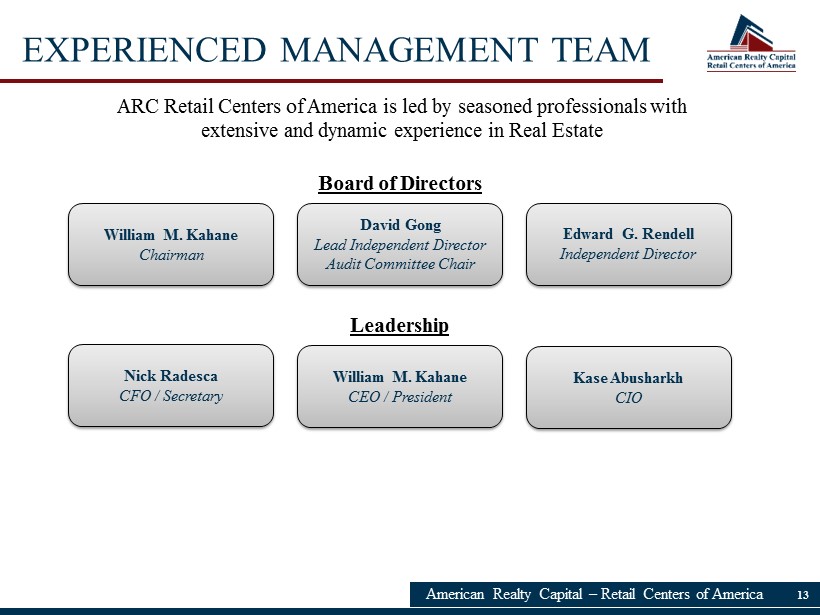
EXPERIENCED MANAGEMENT TEAM American Realty Capital – Retail Centers of America 13 Nick Radesca CFO / Secretary William M. Kahane CEO / President Kase Abusharkh CIO ARC Retail Centers of America is led by seasoned professionals with extensive and dynamic experience in Real Estate David Gong Lead Independent Director Audit Committee Chair Edward G. Rendell Independent Director William M. Kahane Chairman Board of Directors Leadership
RISK FACTORS Investing in our common stock involves a high degree of risk. You should purchase these securities only if you can afford a complete loss of your investment. Please carefully read the section entitled “Risk Factors” on pages 23 through 55 of the prospectus for a discussion of the risks which should be considered in connection with your investment in our common stock, including: • The amount of the distributions paid may decrease at any time . Due to the risks involved in the ownership of real estate, there is no guarantee of any return on your investment, and you may lose all or a portion of your investment . • We are depending on our advisor and, subject to our advisor’s oversight, our advisor is relying on the service provider and its affiliates, to select our investments and conduct our real estate operations . Adverse changes in the financial condition of our advisor or the service provider or its affiliates or our relationship with our advisor or our advisor’s relationship with the service provider and its affiliates could adversely affect us . • There are substantial conflicts among the interests of our investors, our interests and the interests of our advisor, our sponsor, our dealer manager, the service provider and their respective affiliates regarding compensation, investment opportunities and management resources . The fees payable to our advisor are substantial and may result in our advisor recommending riskier investments . American Realty Capital – Retail Centers of America 14
RISK FACTORS • We may incur substantial debt, which could hinder our ability to pay distributions to our stockholders or could decrease the value of your investment if income on, or the value of, the property securing the debt falls . • Our failure to qualify or remain qualified as a REIT would result in higher taxes, may adversely affect or operations, would reduce the amount of income available for distribution and would limit our ability to make distributions to our stockholders . • There are limitations on ownership and transferability of our shares . Please see “Description of Securities — Restrictions on Ownership and Transfer . ” • Our investment objectives and strategies may be changed without stockholder consent . • Our organizational documents permit us to pay distributions from unlimited amounts of any source . Until substantially all the proceeds from this initial public offering are invested, we may use proceeds from this initial public offering to fund distributions until we have sufficient cash flow . There are no established limits on the amounts of net proceeds and borrowings that we may use to fund these distribution payments . Any of these distributions may reduce the amount of capital we ultimately invest in properties and other permitted investments and negatively impact the value of your investment . • Distributions are not guaranteed . Due to the risks involved in the ownership of real estate, there is no guarantee of any return on your investment, and you may lose all or a portion of your investment . American Realty Capital – Retail Centers of America 15
▪ For account information, including balances and the status of submitted paperwork, please call us at (844) 276 - 1077 ▪ Financial Advisors may view client accounts, statements and tax forms at www.dstvision.com ▪ Shareholders may access their accounts at www.americanrealtycap.com American Realty Capital – Retail Centers of America www.RetailCentersofAmerica.com