UNITED STATES
SECURITIES AND EXCHANGE COMMISSION
Washington, D.C. 20549
FORM N-CSR
CERTIFIED SHAREHOLDER REPORT OF REGISTERED
MANAGEMENT INVESTMENT COMPANIES
Investment Company Act file number: 811-23112
JANUS DETROIT STREET TRUST
(Exact name of registrant as specified in charter)
151 Detroit Street, Denver, Colorado 80206-4805
(Address of principal executive offices)(Zip code)
| | |
| (Name and Address of Agent for Service) | | Copy to: |
| |
Byron D. Hittle 151 Detroit Street
Denver, Colorado 80206-4805 | | Eric S. Purple
Stradley Ronon Stevens & Young, LLP 2000 K Street, N.W., Suite 700
Washington, D.C. 20006 |
Registrant’s telephone number, including area code: 303-333-3863
Date of fiscal year end: October 31
Date of reporting period: April 30, 2021
| Item 1. | Report to Shareholders. |
(a)
SEMIANNUAL REPORT
April 30, 2021
Janus Henderson Small/Mid Cap Growth Alpha ETF
Janus Detroit Street Trust

Table of Contents
Janus Henderson Small/Mid Cap Growth Alpha ETF (unaudited)
Fund At A Glance
April 30, 2021
INVESTMENT OBJECTIVE
Janus Henderson Small/Mid Cap Growth Alpha ETF seeks investment results that correspond generally, before fees and expenses, to the performance of the Janus Henderson Small/Mid Cap Growth Alpha Index.
| | | | |
| 5 Largest Equity Holdings – (% of Net Assets) | |
Amedisys, Inc. | | | | |
Health Care Providers & Services | | | 3.1% | |
Entegris, Inc. | | | | |
Semiconductors & Semiconductor Equipment | | | 2.7% | |
Scotts Miracle-Gro Co. | | | | |
Chemicals | | | 2.7% | |
Ubiquiti, Inc. | | | | |
Communications Equipment | | | 2.6% | |
Chemed Corp. | | | | |
Health Care Providers & Services | | | 2.6% | |
| | | | |
| | | 13.7% | |
| | | | |
| Sector Allocation – (% of Net Assets) | |
Consumer, Non-cyclical | | | 35.1% | |
Technology | | | 18.5% | |
Industrial | | | 15.4% | |
Consumer, Cyclical | | | 15.0% | |
Communications | | | 7.9% | |
Financial | | | 5.2% | |
Basic Materials | | | 1.8% | |
Investments Purchased with Cash Collateral from Securities Lending | | | 1.4% | |
Utilities | | | 0.8% | |
Energy | | | 0.3% | |
| | | | |
| | | 101.4% | |
Holdings are subject to change without notice.
| | |
| | Janus Detroit Street Trust ½ 1 |
Janus Henderson Small/Mid Cap Growth Alpha ETF (unaudited)
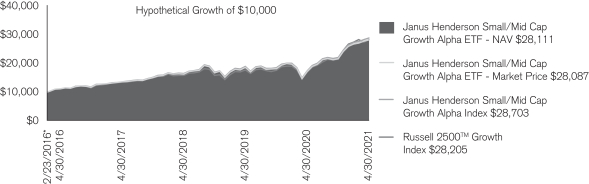
Performance
| | | | | | | | |
| Average Annual Total Return for the periods ended April 30, 2021 |
| | | Fiscal
Year-to-Date | | One
Year | | Five
Year | | Since
Inception* |
Janus Henderson Small/Mid Cap Growth Alpha ETF – NAV | | 30.71% | | 65.22% | | 20.57% | | 22.07% |
Janus Henderson Small/Mid Cap Growth Alpha ETF – Market Price | | 30.49% | | 64.79% | | 20.55% | | 22.05% |
Janus Henderson Small/Mid Cap Growth Alpha Index | | 30.92% | | 65.73% | | 21.06% | | 22.56% |
Russell 2500TM Growth Index | | 32.00% | | 67.27% | | 20.51% | | 22.15% |
| * | The Fund commenced operations on February 23, 2016. |
Total annual expense ratio as stated in the prospectus: 0.30%. See Financial Highlights for actual expense ratios during the reporting period.
Returns quoted are past performance and do not guarantee future results; current performance may be lower or higher. Investment returns and principal value will vary; there may be a gain or loss when shares are sold. For the most recent month-end performance call 800.668.0434 or visit janushenderson.com/performance.
Shares of ETFs are bought and sold at market price (not NAV) and are not individually redeemed from the Fund. Market returns are based upon the midpoint of the bid/ask spread at 4:00 p.m. Eastern time (when NAV is normally determined for most ETFs), and do not represent the returns you would receive if you traded shares at other times. Ordinary brokerage commissions apply and will reduce returns.
Investing involves risk, including the possible loss of principal and fluctuation of value.
Performance depends on that of the underlying index.
See the prospectus for a more complete discussion of objectives, risks and expenses.
Returns include reinvestment of dividends and capital gains. Returns do not reflect the deduction of taxes that a shareholder would pay on Fund distributions, Sales or redemptions of Fund shares.
There is no assurance the stated objective(s) will be met.
See Notes to Schedule of Investments and Other Information for index definitions
Index performance does not reflect the expenses of managing a portfolio as an index is unmanaged and not available for direct investment.
The index provider is Janus Henderson Indices LLC (“JH Indices”). JH Indices maintains the indices and calculates the index levels and performance shown or discussed but does not manage actual assets. JH Indices receives compensation in connection with licensing its indices to third parties including the provision of any related data. JH Indices does not receive compensation for licensing the index to Janus Capital Management LLC with respect to the Fund.
Janus Henderson Small/Mid Cap Growth Alpha ETF (unaudited)
Disclosure of Fund Expenses
As a shareholder of the Fund, you incur two types of costs: (1) transaction costs, which may include creation and redemption fees or brokerage charges and (2) ongoing costs, including management fees and other Fund expenses. This example is intended to help you understand your ongoing costs (in dollars) of investing in the Fund and to compare these costs with the ongoing costs of investing in other ETFs. To do so, compare this 5% hypothetical example with the 5% hypothetical examples that appear in the shareholder reports of the other funds. The example is based upon an investment of $1,000 invested at the beginning of the period and held for the six-months indicated, unless noted otherwise in the table and footnotes below.
Actual Expenses
The information in the table under the heading “Actual” provides information about actual account values and actual expenses. You may use the information in these columns, together with the amount you invested, to estimate the expenses that you paid over the period. Simply divide your account value by $1,000 (for example, an $8,600 account value divided by $1,000 = 8.6), then multiply the result by the number under the heading entitled “Expenses Paid During Period” to estimate the expenses you paid on your account during the period.
Hypothetical Example for Comparison Purposes
The information in the table under the heading “Hypothetical (5% return before expenses)” provides information about hypothetical account values and hypothetical expenses based upon the Fund’s actual expense ratio and an assumed rate of return of 5% per year before expenses, which is not the Fund’s actual return. The hypothetical account values and expenses may not be used to determine the actual ending account balance or expenses you paid for the period. You may use this information to compare the ongoing costs of investing in the Fund and other funds. To do so, compare this 5% hypothetical example with the 5% hypothetical examples that appear in the shareholder reports of the other funds. Additionally, for an analysis of the fees associated with an investment or other similar funds, please visit www.finra.org/fundanalyzer.
Please note that the expenses shown in the table are meant to highlight your ongoing costs only and do not reflect any transaction costs, such as creation and redemption fees, or brokerage charges. These fees are fully described in the Fund’s prospectus. Therefore, the hypothetical examples are useful in comparing ongoing costs only and will not help you determine the relative total costs of owning different funds. In addition, if these transaction costs were included, your costs would have been higher.
| | | | | | | | | | | | | | | | | | | | | | | | |
Actual | | | Hypothetical
(5% return before expenses) | | | | |
Beginning
Account
Value
(11/1/20) | | Ending
Account
Value
(4/30/21) | | | Expenses
Paid During
Period
(11/1/20 - 4/30/21)† | | | Beginning
Account
Value
(11/1/20) | | | Ending
Account
Value
(4/30/21) | | | Expenses
Paid During
Period
(11/1/20 - 4/30/21)† | | | Net Annualized
Expense Ratio
(11/1/20 - 4/30/21) | |
| $1,000.00 | | $ | 1,307.10 | | | $ | 1.72 | | | $ | 1,000.00 | | | $ | 1,023.31 | | | $ | 1.51 | | | | 0.30% | |
| † | Expenses Paid During Period is equal to the Net Annualized Expense Ratio multiplied by the average account value over the period, multiplied by 181/365 (to reflect the one-half year period). |
| | |
| | Janus Detroit Street Trust ½ 3 |
Janus Henderson Small/Mid Cap Growth Alpha ETF
Schedule of Investments (unaudited)
April 30, 2021
| | | | | | | | |
| | | Shares/ Principal Amounts | | | Value | |
| Common Stocks – 100.0% | |
| Aerospace & Defense – 1.8% | |
Aerojet Rocketdyne Holdings, Inc. | | | 11,859 | | | | $554,053 | |
HEICO Corp. | | | 19,704 | | | | 2,774,323 | |
| | | | | | | | |
| | | | | | | 3,328,376 | |
| Air Freight & Logistics – 0.2% | |
Atlas Air Worldwide Holdings, Inc.* | | | 4,405 | | | | 299,144 | |
| Auto Components – 1.2% | |
Fox Factory Holding Corp.* | | | 6,781 | | | | 1,039,053 | |
LCI Industries | | | 4,081 | | | | 597,866 | |
Patrick Industries, Inc. | | | 3,790 | | | | 339,584 | |
XPEL, Inc.* | | | 4,480 | | | | 287,168 | |
| | | | | | | | |
| | | | | | | 2,263,671 | |
| Beverages – 1.7% | |
Boston Beer Co., Inc. - Class A* | | | 1,621 | | | | 1,971,930 | |
Coca-Cola Consolidated, Inc. | | | 1,158 | | | | 339,584 | |
MGP Ingredients, Inc. | | | 2,741 | | | | 164,734 | |
National Beverage Corp. | | | 15,115 | | | | 734,438 | |
| | | | | | | | |
| | | | | | | 3,210,686 | |
| Biotechnology – 1.4% | |
Emergent BioSolutions, Inc.* | | | 33,867 | | | | 2,065,209 | |
Inhibrx, Inc.* | | | 23,963 | | | | 511,131 | |
| | | | | | | | |
| | | | | | | 2,576,340 | |
| Building Products – 3.2% | |
AAON, Inc. | | | 7,998 | | | | 523,149 | |
American Woodmark Corp.* | | | 2,600 | | | | 258,596 | |
Builders FirstSource, Inc.* | | | 31,380 | | | | 1,527,265 | |
PGT Innovations, Inc.* | | | 9,019 | | | | 237,470 | |
Simpson Manufacturing Co., Inc. | | | 6,656 | | | | 750,131 | |
Trex Co., Inc.* | | | 17,714 | | | | 1,912,935 | |
UFP Industries, Inc. | | | 9,360 | | | | 786,614 | |
| | | | | | | | |
| | | | | | | 5,996,160 | |
| Capital Markets – 1.1% | |
B Riley Financial, Inc. | | | 988 | | | | 70,434 | |
Evercore, Inc. - Class A | | | 1,546 | | | | 216,641 | |
Federated Hermes, Inc. | | | 3,657 | | | | 105,322 | |
Focus Financial Partners, Inc. - Class A* | | | 1,885 | | | | 88,708 | |
Hamilton Lane, Inc. - Class A | | | 1,285 | | | | 116,228 | |
Houlihan Lokey, Inc. | | | 1,896 | | | | 125,648 | |
LPL Financial Holdings, Inc. | | | 2,938 | | | | 460,385 | |
PJT Partners, Inc. - Class A | | | 877 | | | | 64,486 | |
Safeguard Scientifics, Inc.* | | | 770 | | | | 4,743 | |
SEI Investments Co. | | | 5,283 | | | | 324,587 | |
StepStone Group, Inc. - Class A | | | 1,079 | | | | 35,931 | |
Stifel Financial Corp. | | | 3,864 | | | | 267,350 | |
Victory Capital Holdings, Inc. - Class A | | | 597 | | | | 16,567 | |
Virtu Financial, Inc. - Class A | | | 4,497 | | | | 133,246 | |
| | | | | | | | |
| | | | | | | 2,030,276 | |
| Chemicals – 4.5% | |
Ingevity Corp.* | | | 15,751 | | | | 1,229,838 | |
Scotts Miracle-Gro Co. | | | 21,681 | | | | 5,011,780 | |
Valvoline, Inc. | | | 70,617 | | | | 2,217,374 | |
| | | | | | | | |
| | | | | | | 8,458,992 | |
| Commercial Banks – 1.5% | | | | | | |
1st Constitution Bancorp | | | 377 | | | | 7,231 | |
Ameris Bancorp | | | 2,567 | | | | 138,849 | |
Bancorp, Inc.* | | | 2,122 | | | | 47,119 | |
See Notes to Schedule of Investments and Other Information and Notes to Financial Statements.
Janus Henderson Small/Mid Cap Growth Alpha ETF
Schedule of Investments (unaudited)
April 30, 2021
| | | | | | | | |
| | | Shares/ Principal Amounts | | | Value | |
| Common Stocks – (continued) | |
| Commercial Banks – (continued) | | | | | | |
Bank First Corp.# | | | 285 | | | | $ 20,611 | |
Business First Bancshares, Inc. | | | 759 | | | | 18,041 | |
Byline Bancorp, Inc. | | | 1,422 | | | | 32,279 | |
Coastal Financial Corp.* | | | 440 | | | | 13,099 | |
Eagle Bancorp Montana, Inc. | | | 249 | | | | 5,824 | |
Esquire Financial Holdings, Inc.* | | | 287 | | | | 6,587 | |
Farmers National Banc Corp. | | | 1,037 | | | | 17,194 | |
First Bancshares, Inc. | | | 777 | | | | 30,396 | |
First Bank/Hamilton | | | 722 | | | | 9,162 | |
First Choice Bancorp | | | 431 | | | | 13,801 | |
First Financial Bankshares, Inc. | | | 5,249 | | | | 257,621 | |
First Foundation, Inc. | | | 1,644 | | | | 39,127 | |
First Horizon Corp. | | | 20,446 | | | | 373,957 | |
First Northwest Bancorp | | | 377 | | | | 6,326 | |
First Western Financial, Inc.* | | | 293 | | | | 7,521 | |
Glacier Bancorp, Inc. | | | 3,531 | | | | 208,152 | |
Guaranty Bancshares, Inc. | | | 444 | | | | 17,272 | |
Harborone Bancorp, Inc. | | | 2,113 | | | | 30,237 | |
Hilltop Holdings, Inc. | | | 3,025 | | | | 106,480 | |
Independent Bank Corp. | | | 805 | | | | 18,966 | |
Independent Bank Group, Inc. | | | 1,588 | | | | 119,910 | |
Live Oak Bancshares, Inc. | | | 1,540 | | | | 98,498 | |
MainStreet Bancshares, Inc.* | | | 268 | | | | 5,682 | |
Metropolitan Bank Holding Corp.* | | | 306 | | | | 19,232 | |
Mid Penn Bancorp, Inc. | | | 310 | | | | 8,367 | |
MVB Financial Corp. | | | 424 | | | | 17,079 | |
Nicolet Bankshares, Inc.* | | | 369 | | | | 29,431 | |
Northeast Bank | | | 331 | | | | 9,324 | |
Northrim BanCorp, Inc. | | | 230 | | | | 9,810 | |
Orrstown Financial Services, Inc. | | | 412 | | | | 9,769 | |
Peoples Financial Services Corp. | | | 266 | | | | 11,345 | |
Plumas Bancorp | | | 191 | | | | 5,071 | |
QCR Holdings, Inc. | | | 583 | | | | 28,112 | |
Red River Bancshares, Inc. | | | 270 | | | | 15,023 | |
Reliant Bancorp, Inc. | | | 600 | | | | 16,578 | |
ServisFirst Bancshares, Inc. | | | 1,992 | | | | 125,974 | |
Silvergate Capital Corp. - Class A* | | | 860 | | | | 92,209 | |
SmartFinancial, Inc. | | | 557 | | | | 13,195 | |
Spirit of Texas Bancshares, Inc. | | | 631 | | | | 14,620 | |
Triumph Bancorp, Inc.* | | | 916 | | | | 81,185 | |
UMB Financial Corp. | | | 1,767 | | | | 171,452 | |
Western Alliance Bancorp | | | 3,721 | | | | 390,966 | |
| | | | | | | | |
| | | | | | | 2,718,684 | |
| Commercial Services & Supplies – 2.5% | |
IAA, Inc.* | | | 20,583 | | | | 1,292,818 | |
McGrath RentCorp. | | | 3,711 | | | | 304,228 | |
Rollins, Inc. | | | 75,207 | | | | 2,803,717 | |
Steelcase, Inc. - Class A | | | 13,612 | | | | 187,846 | |
| | | | | | | | |
| | | | | | | 4,588,609 | |
| Communications Equipment – 4.0% | |
Ciena Corp.* | | | 51,736 | | | | 2,611,116 | |
Ubiquiti, Inc. | | | 17,126 | | | | 4,886,561 | |
| | | | | | | | |
| | | | | | | 7,497,677 | |
| Computers & Peripherals – 0.5% | |
Corsair Gaming, Inc.*,# | | | 30,654 | | | | 1,017,100 | |
| Construction & Engineering – 0.6% | |
Comfort Systems USA, Inc. | | | 5,535 | | | | 455,862 | |
Construction Partners, Inc. - Class A* | | | 5,205 | | | | 165,155 | |
See Notes to Schedule of Investments and Other Information and Notes to Financial Statements.
| | |
| | Janus Detroit Street Trust ½ 5 |
Janus Henderson Small/Mid Cap Growth Alpha ETF
Schedule of Investments (unaudited)
April 30, 2021
| | | | | | | | |
| | | Shares/ Principal Amounts | | | Value | |
| Common Stocks – (continued) | |
| Construction & Engineering – (continued) | |
IES Holdings, Inc.* | | | 3,177 | | | | $ 167,714 | |
NV5 Global, Inc.* | | | 2,026 | | | | 182,603 | |
Primoris Services Corp. | | | 7,533 | | | | 246,028 | |
| | | | | | | | |
| | | | | | | 1,217,362 | |
| Consumer Finance – 0.2% | |
Credit Acceptance Corp.*,# | | | 619 | | | | 244,375 | |
Enova International, Inc.* | | | 1,317 | | | | 45,094 | |
| | | | | | | | |
| | | | | | | 289,469 | |
| Containers & Packaging – 1.9% | |
Berry Global Group, Inc.* | | | 52,159 | | | | 3,318,356 | |
UFP Technologies, Inc.* | | | 2,917 | | | | 146,025 | |
| | | | | | | | |
| | | | | | | 3,464,381 | |
| Distributors – 0.0% | |
Educational Development Corp. | | | 1,355 | | | | 24,092 | |
| Diversified Consumer Services – 1.2% | | | | | | |
frontdoor, Inc.* | | | 13,873 | | | | 742,622 | |
Service Corp. International | | | 27,487 | | | | 1,468,905 | |
| | | | | | | | |
| | | | | | | 2,211,527 | |
| Diversified Financial Services – 0.5% | |
Alerus Financial Corp. | | | 633 | | | | 18,199 | |
Cboe Global Markets, Inc. | | | 3,947 | | | | 411,948 | |
Morningstar, Inc. | | | 1,579 | | | | 418,451 | |
| | | | | | | | |
| | | | | | | 848,598 | |
| Electric Utilities – 0.0% | |
Spark Energy, Inc. - Class A# | | | 1,860 | | | | 19,679 | |
| Electrical Equipment – 0.6% | |
Array Technologies, Inc.* | | | 19,426 | | | | 547,036 | |
Atkore, Inc.* | | | 7,132 | | | | 558,293 | |
| | | | | | | | |
| | | | | | | 1,105,329 | |
| Electronic Equipment & Instruments – 1.9% | |
Insight Enterprises, Inc.* | | | 11,704 | | | | 1,174,730 | |
Napco Security Technologies, Inc.* | | | 6,117 | | | | 203,757 | |
SYNNEX Corp. | | | 17,233 | | | | 2,088,640 | |
| | | | | | | | |
| | | | | | | 3,467,127 | |
| Entertainment – 0.4% | |
Akazoo S.A.*,¢ | | | 851 | | | | — | |
Sciplay Corp. - Class A* | | | 2,300 | | | | 40,595 | |
Shutterstock, Inc. | | | 5,881 | | | | 512,706 | |
World Wrestling Entertainment, Inc. - Class A | | | 4,704 | | | | 259,237 | |
| | | | | | | | |
| | | | | | | 812,538 | |
| Equity Real Estate Investment Trusts (REITs) – 0.7% | |
American Homes 4 Rent - Class A | | | 5,755 | | | | 213,165 | |
CareTrust REIT, Inc. | | | 1,768 | | | | 42,750 | |
CubeSmart | | | 3,592 | | | | 152,085 | |
CyrusOne, Inc. | | | 2,213 | | | | 161,173 | |
EastGroup Properties, Inc. | | | 727 | | | | 115,346 | |
Essential Properties Realty Trust, Inc. | | | 1,970 | | | | 51,594 | |
Gaming and Leisure Properties, Inc. | | | 4,245 | | | | 197,350 | |
Innovative Industrial Properties, Inc. | | | 439 | | | | 80,394 | |
National Storage Affiliates Trust | | | 1,300 | | | | 59,072 | |
Physicians Realty Trust | | | 3,846 | | | | 72,036 | |
Safehold, Inc. | | | 973 | | | | 68,801 | |
STAG Industrial, Inc. | | | 2,899 | | | | 105,843 | |
Terreno Realty Corp. | | | 1,258 | | | | 81,166 | |
| | | | | | | | |
| | | | | | | 1,400,775 | |
See Notes to Schedule of Investments and Other Information and Notes to Financial Statements.
Janus Henderson Small/Mid Cap Growth Alpha ETF
Schedule of Investments (unaudited)
April 30, 2021
| | | | | | | | |
| | | Shares/ Principal Amounts | | | Value | |
| Common Stocks – (continued) | |
| Food & Staples Retailing – 0.3% | |
Sprouts Farmers Market, Inc.* | | | 19,111 | | | | $ 489,433 | |
| Food Products – 0.1% | |
Vital Farms, Inc.* | | | 6,389 | | | | 155,380 | |
| Gas Utilities – 0.3% | |
Southwest Gas Holdings, Inc. | | | 7,278 | | | | 507,422 | |
| Health Care Equipment & Supplies – 4.7% | |
LeMaitre Vascular, Inc. | | | 12,925 | | | | 678,175 | |
Neogen Corp.* | | | 33,831 | | | | 3,248,114 | |
Outset Medical, Inc.* | | | 27,132 | | | | 1,625,750 | |
Quidel Corp.* | | | 26,889 | | | | 2,817,698 | |
Zynex, Inc.*,# | | | 22,143 | | | | 327,052 | |
| | | | | | | | |
| | | | | | | 8,696,789 | |
| Health Care Providers & Services – 14.6% | |
Addus HomeCare Corp.* | | | 10,045 | | | | 1,062,761 | |
Amedisys, Inc.* | | | 20,871 | | | | 5,632,039 | |
Castle Biosciences, Inc.* | | | 15,730 | | | | 1,085,842 | |
Chemed Corp. | | | 10,135 | | | | 4,830,442 | |
CorVel Corp.* | | | 11,358 | | | | 1,329,000 | |
Ensign Group, Inc. | | | 34,775 | | | | 2,985,434 | |
HealthEquity, Inc.* | | | 52,210 | | | | 3,966,394 | |
Joint Corp.* | | | 8,921 | | | | 494,937 | |
LHC Group, Inc.* | | | 20,074 | | | | 4,180,812 | |
National Research Corp. | | | 16,175 | | | | 829,778 | |
Pennant Group, Inc.* | | | 17,958 | | | | 725,862 | |
| | | | | | | | |
| | | | | | | 27,123,301 | |
| Health Care Technology – 1.0% | |
GoodRx Holdings, Inc. - Class A*,# | | | 27,910 | | | | 1,116,679 | |
Simulations Plus, Inc.# | | | 12,685 | | | | 800,931 | |
| | | | | | | | |
| | | | | | | 1,917,610 | |
| Hotels, Restaurants & Leisure – 0.8% | |
Bally’s Corp. | | | 4,945 | | | | 286,612 | |
Dave & Buster’s Entertainment, Inc.* | | | 7,729 | | | | 352,906 | |
Ruth’s Hospitality Group, Inc. | | | 5,661 | | | | 147,809 | |
Wingstop, Inc. | | | 4,816 | | | | 762,903 | |
| | | | | | | | |
| | | | | | | 1,550,230 | |
| Household Durables – 3.8% | |
Cavco Industries, Inc.* | | | 1,491 | | | | 312,260 | |
Century Communities, Inc.* | | | 5,410 | | | | 400,015 | |
Installed Building Products, Inc. | | | 4,805 | | | | 646,993 | |
iRobot Corp.* | | | 4,575 | | | | 497,760 | |
Legacy Housing Corp.* | | | 3,925 | | | | 70,101 | |
LGI Homes, Inc.* | | | 4,053 | | | | 671,906 | |
M.D.C. Holdings, Inc. | | | 11,362 | | | | 666,495 | |
M/I Homes, Inc.* | | | 4,723 | | | | 329,288 | |
Meritage Homes Corp.* | | | 6,086 | | | | 647,490 | |
Skyline Champion Corp.* | | | 9,188 | | | | 408,223 | |
Tempur Sealy International, Inc. | | | 33,315 | | | | 1,270,634 | |
TopBuild Corp.* | | | 5,356 | | | | 1,191,067 | |
| | | | | | | | |
| | | | | | | 7,112,232 | |
| Household Products – 0.5% | |
Reynolds Consumer Products, Inc. | | | 33,977 | | | | 996,206 | |
| Insurance – 0.7% | | | | | | |
eHealth, Inc.* | | | 954 | | | | 67,486 | |
Enstar Group, Ltd.* | | | 683 | | | | 171,556 | |
First American Financial Corp. | | | 4,043 | | | | 260,774 | |
Investors Title Co. | | | 70 | | | | 12,350 | |
See Notes to Schedule of Investments and Other Information and Notes to Financial Statements.
| | |
| | Janus Detroit Street Trust ½ 7 |
Janus Henderson Small/Mid Cap Growth Alpha ETF
Schedule of Investments (unaudited)
April 30, 2021
| | | | | | | | |
| | | Shares/ Principal Amounts | | | Value | |
| Common Stocks – (continued) | |
| Insurance – (continued) | | | | | | |
Kinsale Capital Group, Inc. | | | 838 | | | | $ 145,820 | |
Mercury General Corp. | | | 2,058 | | | | 128,152 | |
NI Holdings, Inc.* | | | 784 | | | | 15,014 | |
Palomar Holdings, Inc.* | | | 939 | | | | 66,068 | |
Primerica, Inc. | | | 1,447 | | | | 231,187 | |
Selectquote, Inc.* | | | 5,995 | | | | 186,624 | |
| | | | | | | | |
| | | | | | | 1,285,031 | |
| Interactive Media & Services – 0.2% | |
Cargurus, Inc.* | | | 9,837 | | | | 242,777 | |
MediaAlpha, Inc. - Class A* | | | 3,338 | | | | 147,707 | |
| | | | | | | | |
| | | | | | | 390,484 | |
| Internet & Catalog Retail – 1.3% | | | | | | |
1-800-Flowers.com, Inc. - Class A*,# | | | 5,953 | | | | 190,347 | |
Chewy, Inc. - Class A*,# | | | 15,462 | | | | 1,232,631 | |
PubMatic, Inc. - Class A*,# | | | 1,101 | | | | 56,669 | |
Revolve Group, Inc.* | | | 5,374 | | | | 260,585 | |
Stamps.com, Inc.* | | | 2,958 | | | | 607,484 | |
| | | | | | | | |
| | | | | | | 2,347,716 | |
| IT Services – 1.6% | |
Concentrix Corp.* | | | 17,331 | | | | 2,692,891 | |
GreenSky, Inc. - Class A* | | | 25,480 | | | | 155,173 | |
Paysign, Inc.* | | | 16,620 | | | | 63,488 | |
| | | | | | | | |
| | | | | | | 2,911,552 | |
| Leisure Equipment & Products – 0.9% | |
Escalade, Inc. | | | 2,268 | | | | 49,941 | |
Johnson Outdoors, Inc. - Class A | | | 1,446 | | | | 205,057 | |
Malibu Boats, Inc. - Class A* | | | 3,368 | | | | 280,757 | |
YETI Holdings, Inc.* | | | 14,135 | | | | 1,207,412 | |
| | | | | | | | |
| | | | | | | 1,743,167 | |
| Life Sciences Tools & Services – 2.1% | |
Medpace Holdings, Inc.* | | | 22,705 | | | | 3,852,584 | |
| Machinery – 2.3% | |
Middleby Corp.* | | | 8,507 | | | | 1,542,489 | |
Miller Industries, Inc. | | | 1,744 | | | | 75,027 | |
RBC Bearings, Inc.* | | | 3,845 | | | | 766,808 | |
Toro Co. | | | 16,568 | | | | 1,898,693 | |
| | | | | | | | |
| | | | | | | 4,283,017 | |
| Media – 1.5% | |
Fox Corp. - Class A | | | 58,378 | | | | 2,184,504 | |
Nexstar Media Group, Inc. - Class A | | | 4,358 | | | | 642,413 | |
| | | | | | | | |
| | | | | | | 2,826,917 | |
| Mortgage Real Estate Investment Trusts (REITs) – 0.1% | |
Dynex Capital, Inc. | | | 986 | | | | 19,917 | |
Granite Point Mortgage Trust, Inc. | | | 2,073 | | | | 27,447 | |
Hannon Armstrong Sustainable Infrastructure Capital, Inc. | | | 2,895 | | | | 151,698 | |
| | | | | | | | |
| | | | | | | 199,062 | |
| Multi-Utilities – 0.3% | |
Black Hills Corp. | | | 7,979 | | | | 550,391 | |
| Multiline Retail – 0.5% | |
Ollie’s Bargain Outlet Holdings, Inc.* | | | 10,613 | | | | 979,261 | |
| Paper & Forest Products – 0.2% | |
Boise Cascade Co. | | | 5,996 | | | | 400,053 | |
| Personal Products – 0.3% | |
BellRing Brands, Inc. - Class A* | | | 6,401 | | | | 165,082 | |
See Notes to Schedule of Investments and Other Information and Notes to Financial Statements.
Janus Henderson Small/Mid Cap Growth Alpha ETF
Schedule of Investments (unaudited)
April 30, 2021
| | | | | | | | |
| | | Shares/ Principal Amounts | | | Value | |
| Common Stocks – (continued) | |
| Personal Products – (continued) | |
Medifast, Inc. | | | 1,919 | | | | $ 435,785 | |
| | | | | | | | |
| | | | | | | 600,867 | |
| Pharmaceuticals – 2.8% | |
Corcept Therapeutics, Inc.* | | | 74,542 | | | | 1,698,812 | |
Innoviva, Inc.* | | | 64,426 | | | | 737,678 | |
Pacira BioSciences, Inc.* | | | 27,604 | | | | 1,744,021 | |
Supernus Pharmaceuticals, Inc.* | | | 33,476 | | | | 1,019,344 | |
| | | | | | | | |
| | | | | | | 5,199,855 | |
| Professional Services – 1.6% | |
ASGN, Inc.* | | | 8,092 | | | | 851,116 | |
Barrett Business Services, Inc. | | | 1,175 | | | | 86,163 | |
BGSF, Inc. | | | 1,578 | | | | 22,108 | |
FTI Consulting, Inc.* | | | 5,238 | | | | 727,296 | |
Insperity, Inc. | | | 5,845 | | | | 511,671 | |
TriNet Group, Inc.* | | | 10,094 | | | | 794,499 | |
| | | | | | | | |
| | | | | | | 2,992,853 | |
| Road & Rail – 0.6% | |
Marten Transport, Ltd. | | | 12,681 | | | | 212,026 | |
Saia, Inc.* | | | 4,027 | | | | 944,332 | |
| | | | | | | | |
| | | | | | | 1,156,358 | |
| Semiconductors & Semiconductor Equipment – 10.3% | |
ACM Research, Inc. - Class A* | | | 5,633 | | | | 444,725 | |
Amkor Technology, Inc. | | | 81,141 | | | | 1,640,671 | |
CMC Materials, Inc. | | | 9,751 | | | | 1,788,626 | |
Entegris, Inc. | | | 44,993 | | | | 5,065,312 | |
FormFactor, Inc.* | | | 25,924 | | | | 1,014,925 | |
MKS Instruments, Inc. | | | 18,413 | | | | 3,297,952 | |
Power Integrations, Inc. | | | 20,024 | | | | 1,658,188 | |
Ultra Clean Holdings, Inc.* | | | 13,541 | | | | 691,539 | |
Universal Display Corp. | | | 15,722 | | | | 3,516,854 | |
| | | | | | | | |
| | | | | | | 19,118,792 | |
| Software – 8.9% | |
Alarm.com Holdings, Inc.* | | | 16,534 | | | | 1,484,092 | |
Appfolio, Inc. - Class A* | | | 6,034 | | | | 872,697 | |
Aspen Technology, Inc.* | | | 22,617 | | | | 2,959,208 | |
Bentley Systems, Inc. - Class B | | | 86,688 | | | | 4,438,426 | |
Ebix, Inc. | | | 10,323 | | | | 310,826 | |
Intelligent Systems Corp.*,# | | | 2,963 | | | | 113,542 | |
Mitek Systems, Inc.* | | | 14,233 | | | | 230,717 | |
Paylocity Holding Corp.* | | | 18,129 | | | | 3,503,248 | |
Qualys, Inc.* | | | 13,073 | | | | 1,325,079 | |
ShotSpotter, Inc.* | | | 3,836 | | | | 134,030 | |
SPS Commerce, Inc.* | | | 11,864 | | | | 1,215,348 | |
| | | | | | | | |
| | | | | | | 16,587,213 | |
| Specialty Retail – 4.6% | |
Asbury Automotive Group, Inc.* | | | 3,128 | | | | 621,252 | |
Boot Barn Holdings, Inc.* | | | 4,706 | | | | 331,961 | |
Five Below, Inc.* | | | 9,065 | | | | 1,824,513 | |
Floor & Decor Holdings, Inc. - Class A* | | | 16,937 | | | | 1,878,652 | |
Leslie’s, Inc.* | | | 30,319 | | | | 861,666 | |
Lithia Motors, Inc. - Class A | | | 4,288 | | | | 1,648,221 | |
MarineMax, Inc.* | | | 3,591 | | | | 203,969 | |
National Vision Holdings, Inc.* | | | 13,144 | | | | 662,589 | |
OneWater Marine, Inc. - Class A* | | | 1,763 | | | | 90,319 | |
Sleep Number Corp.* | | | 4,119 | | | | 460,875 | |
| | | | | | | | |
| | | | | | | 8,584,017 | |
See Notes to Schedule of Investments and Other Information and Notes to Financial Statements.
| | |
| | Janus Detroit Street Trust ½ 9 |
Janus Henderson Small/Mid Cap Growth Alpha ETF
Schedule of Investments (unaudited)
April 30, 2021
| | | | | | | | |
| | | Shares/ Principal Amounts | | | Value | |
| Common Stocks – (continued) | |
| Thrifts & Mortgage Finance – 0.5% | |
Axos Financial, Inc.* | | | 2,173 | | | | $ 98,111 | |
Bridgewater Bancshares, Inc.* | | | 1,035 | | | | 17,502 | |
Essent Group, Ltd. | | | 4,138 | | | | 217,576 | |
FS Bancorp, Inc. | | | 156 | | | | 10,663 | |
Hingham Institution For Savings | | | 78 | | | | 23,723 | |
Kearny Financial Corp. | | | 3,130 | | | | 40,001 | |
Merchants Bancorp | | | 1,059 | | | | 43,197 | |
Meta Financial Group, Inc. | | | 1,187 | | | | 58,472 | |
NMI Holdings, Inc. - Class A* | | | 3,140 | | | | 81,137 | |
PCSB Financial Corp. | | | 590 | | | | 10,319 | |
PennyMac Financial Services, Inc. | | | 2,548 | | | | 153,415 | |
Timberland Bancorp, Inc. | | | 307 | | | | 8,639 | |
Walker & Dunlop, Inc. | | | 1,150 | | | | 127,477 | |
| | | | | | | | |
| | | | | | | 890,232 | |
| Trading Companies & Distributors – 0.8% | |
GMS, Inc.* | | | 6,528 | | | | 285,339 | |
SiteOne Landscape Supply, Inc.* | | | 6,773 | | | | 1,214,941 | |
Transcat, Inc.* | | | 1,139 | | | | 56,950 | |
| | | | | | | | |
| | | | | | | 1,557,230 | |
| Water Utilities – 0.2% | |
California Water Service Group | | | 6,403 | | | | 376,176 | |
Pure Cycle Corp.* | | | 3,035 | | | | 46,345 | |
| | | | | | | | |
| | | | | | | | 422,521 | |
Total Common Stocks (cost $156,401,827) | | | | | | | 186,274,368 | |
| Investments Purchased with Cash Collateral from Securities Lending – 1.4% | | | | | | |
| Investment Companies – 1.1% | |
Janus Henderson Cash Collateral Fund LLC, 0.0011%ºº,£ | | | 2,118,125 | | | | 2,118,125 | |
| Time Deposits – 0.3% | | | | | | |
Royal Bank of Canada, 0.0100%, 5/3/21 | | | $529,531 | | | | 529,531 | |
Total Investments Purchased with Cash Collateral from Securities Lending
(total cost $2,647,656) | | | | | | | 2,647,656 | |
Total Investments (total cost $159,049,483) – 101.4% | | | | | | | 188,922,024 | |
Liabilities, net of Cash, Receivables and Other Assets – (1.4%) | | | | | | | (2,679,027) | |
Net Assets – 100% | | | | | | | $186,242,997 | |
Summary of Investments by Country – (Long Positions) (unaudited)
| | | | | | | | |
| Country | | Value | | | % of
Investment
Securities | |
United States | | | $188,750,468 | | | | 99.9% | |
Bermuda | | | 171,556 | | | | 0.1 | |
Total | | | $188,922,024 | | | | 100.0% | |
See Notes to Schedule of Investments and Other Information and Notes to Financial Statements.
Janus Henderson Small/Mid Cap Growth Alpha ETF
Schedule of Investments (unaudited)
April 30, 2021
Schedules of Affiliated Investments – (% of Net Assets)
| | | | | | | | | | | | | | | | |
| | | Dividend Income | | | Realized
Gain/(Loss) | | | Change in
Unrealized
Appreciation/
(Depreciation) | | | Value at
4/30/21 | |
| Investments Purchased with Cash Collateral from Securities Lending – 1.4% | | | | | | | | | | | | |
| Investment Companies – 1.1% | | | | | | | |
Janus Henderson Cash Collateral Fund LLC, 0.0011%ºº | | | $5,563 | D | | | $ — | | | | $ — | | | | $2,118,125 | |
| | | | |
| | | Market Value
at 10/31/20 | | | Purchases | | | Sales | | | Market Value
at 4/30/21 | |
| Investments Purchased with Cash Collateral from Securities Lending – 1.4% | | | | | | | | | | | | |
| Investment Companies – 1.1% | | | | | | | |
Janus Henderson Cash Collateral Fund LLC, 0.0011%ºº | | | $2,759,156 | | | | $29,929,093 | | | | $(30,570,124) | | | | $2,118,125 | |
See Notes to Schedule of Investments and Other Information and Notes to Financial Statements.
| | |
| | Janus Detroit Street Trust ½ 11 |
Janus Henderson Small/Mid Cap Growth Alpha ETF
Notes to Schedule of Investments and Other Information (unaudited)
April 30, 2021
| | |
| Janus Henderson Small/Mid Cap Growth Alpha Index | | Janus Henderson Small/Mid Cap Growth Alpha Index is designed to systematically identify small- and mid-capitalization stocks that are poised for sustainable growth (Smart Growth®) by evaluating each company’s performance in three critical areas: growth, profitability, and capital efficiency. A proprietary methodology is used to score stocks based on a wide range of fundamental measures and select the top 10% (“top-tier”) of such eligible stocks. Stocks are market cap-weighted within sectors with a 3% maximum position size; sectors are weighted to align with the Janus Henderson Triton Fund. |
| |
| Russell 2500™ Growth Index | | Russell 2500™ Growth Index reflects the performance of U.S. small to mid-cap equities with higher price-to-book ratios and higher forecasted growth values. |
| |
| LLC | | Limited Liability Company |
| * | Non-income producing security. |
| ¢ | Security is valued using significant unobservable inputs. |
| # | Loaned security; a portion of the security is on loan at April 30, 2021. |
| ºº | Rate reflects 7 day yield as of April 30, 2021. |
| £ | The Fund may invest in certain securities that are considered affiliated companies. As defined by the Investment Company Act of 1940, as amended, an affiliated company is one in which the Fund owns 5% or more of the outstanding voting securities, or a company which is under common ownership or control. |
| D | Net of income paid to the securities lending agent and rebates paid to the borrowing counterparties. |
The following is a summary of the inputs that were used to value the Fund’s investments in securities and other financial instruments as of April 30, 2021. See Notes to Financial Statements for more information.
Valuation Inputs Summary
| | | | | | | | | | | | |
| | | Level 1 -
Quoted Prices | | | Level 2 -
Other Significant
Observable Inputs | | | Level 3 -
Significant
Unobservable Inputs | |
| | | |
Assets | | | | | | | | | | | | |
| | | |
Investments in Securities: | | | | | | | | | | | | |
| | | |
Common Stocks | | | | | | | | | | | | |
| | | |
Entertainment(a) | | $ | 812,538 | | | $ | — | | | $ | 0 | |
| | | |
All Other | | | 185,461,830 | | | | — | | | | — | |
| | | |
Investments Purchased with Cash Collateral from Securities Lending | | | — | | | | 2,647,656 | | | | — | |
| | | | |
| | | |
Total Assets | | $ | 186,274,368 | | | $ | 2,647,656 | | | $ | 0 | |
| (a) | There is a security in this category that has a market value of zero. |
Janus Henderson Small/Mid Cap Growth Alpha ETF
Statement of Assets and Liabilities (unaudited)
April 30, 2021
| | | | |
Assets: | | | | |
Unaffiliated investments, at value(1)(2) | | $ | 186,803,899 | |
Affiliated investments, at value(3) | | | 2,118,125 | |
Cash | | | 3,060 | |
Receivables: | | | | |
Dividends | | | 12,667 | |
Affiliated securities lending income, net | | | 864 | |
Total Assets | | | 188,938,615 | |
Liabilities: | | | | |
Collateral on securities loaned (Note 2) | | | 2,647,656 | |
Payables: | | | | |
Management fees | | | 47,962 | |
Total Liabilities | | | 2,695,618 | |
Net Assets | | $ | 186,242,997 | |
Net Assets Consists of: | | | | |
Capital (par value and paid-in surplus) | | $ | 141,478,977 | |
Total distributable earnings (loss) | | | 44,764,020 | |
Total Net Assets | | $ | 186,242,997 | |
Net Assets | | $ | 186,242,997 | |
Shares outstanding, $0.001 Par Value (unlimited shares authorized) | | | 2,727,000 | |
Net Asset Value Per Share | | $ | 68.30 | |
| (1) | Includes cost of $156,931,358. |
| (2) | Includes $2,592,990 of securities on loan. See Note 2 in Notes to Financial Statements. |
| (3) | Includes cost of $2,118,125. |
See Notes to Financial Statements.
| | |
| | Janus Detroit Street Trust ½ 13 |
Janus Henderson Small/Mid Cap Growth Alpha ETF
Statement of Operations (unaudited)
For the period ended April 30, 2021
| | | | |
Investment Income: | |
Dividends | | $ | 495,724 | |
Affiliated securities lending income, net | | | 5,563 | |
Unaffiliated securities lending income, net | | | 321 | |
Total Investment Income | | | 501,608 | |
Expenses: | |
Management Fees | | | 236,892 | |
Total Expenses | | | 236,892 | |
Net Investment Income/(Loss) | | | 264,716 | |
Net Realized Gain/(Loss) on Investments: | |
Investments | | $ | 26,650,316 | |
Total Net Realized Gain/(Loss) on Investments | | $ | 26,650,316 | |
Change in Unrealized Net Appreciation/Depreciation: | |
Investments | | $ | 10,977,837 | |
Total Change in Unrealized Net Appreciation/Depreciation | | $ | 10,977,837 | |
Net Increase/(Decrease) in Net Assets Resulting from Operations | | $ | 37,892,869 | |
See Notes to Financial Statements.
Janus Henderson Small/Mid Cap Growth Alpha ETF
Statements of Changes in Net Assets
| | | | | | | | |
| | | Period Ended April 30, 2021 (unaudited) | | | Year Ended
October 31, 2020 | |
Operations: | |
Net investment income/(loss) | | $ | 264,716 | | | $ | 240,423 | |
Net realized gain/(loss) on investments | | | 26,650,316 | | | | 1,646,467 | |
Change in unrealized net appreciation/depreciation | | | 10,977,837 | | | | 16,329,095 | |
Net Increase/(Decrease) in Net Assets Resulting from Operations | | | 37,892,869 | | | | 18,215,985 | |
Dividends and Distributions to Shareholders: | |
Dividends and Distributions | | | (282,818) | | | | (278,608) | |
Net Decrease from Dividends and Distributions to Shareholders | | | (282,818) | | | | (278,608) | |
Capital Share Transactions | | | 33,364,763 | | | | 209,758 | |
Net Increase/(Decrease) in Net Assets | | | 70,974,814 | | | | 18,147,135 | |
Net Assets: | |
Beginning of period | | | 115,268,183 | | | | 97,121,048 | |
End of period | | $ | 186,242,997 | | | $ | 115,268,183 | |
See Notes to Financial Statements.
| | |
| | Janus Detroit Street Trust ½ 15 |
Janus Henderson Small/Mid Cap Growth Alpha ETF
Financial Highlights
| | | | | | | | | | | | | | | | | | | | | | | | | | |
For a share outstanding during the period ended April 30,
2021 (unaudited) and each year or period ended October 31 | | 2021 | | | 2020 | | | 2019 | | | 2018 | | | 2017 | | | 2016(1) | |
| | Net Asset Value, Beginning of Period | | | $52.35 | | | | $44.11 | | | | $40.81 | | | | $36.77 | | | | $28.82 | | | | $24.75 | |
| | Income/(Loss) from Investment Operations: | |
| | Net investment income/(loss)(2) | | | 0.11 | | | | 0.11 | | | | 0.19 | | | | 0.15 | | | | 0.10 | | | | 0.18 | |
| | Net realized and unrealized gain/(loss) | | | 15.96 | | | | 8.26 | | | | 3.30 | | | | 4.03 | | | | 7.99 | | | | 3.93 | |
| | Total from Investment Operations | | | 16.07 | | | | 8.37 | | | | 3.49 | | | | 4.18 | | | | 8.09 | | | | 4.11 | |
| | Less Dividends and Distributions: | |
| | Dividends (from net investment income) | | | (0.12) | | | | (0.13) | | | | (0.19) | | | | (0.14) | | | | (0.14) | | | | (0.04) | |
| | Total Dividends and Distributions | | | (0.12) | | | | (0.13) | | | | (0.19) | | | | (0.14) | | | | (0.14) | | | | (0.04) | |
| | Net Asset Value, End of Period | | | $68.30 | | | | $52.35 | | | | $44.11 | | | | $40.81 | | | | $36.77 | | | | $28.82 | |
| | Total Return* | | | 30.71% | | | | 19.01% | | | | 8.60% | | | | 11.37% | | | | 28.14% | | | | 16.60% | |
| | Net assets, End of Period (in thousands) | | | $186,243 | | | | $115,268 | | | | $97,121 | | | | $51,099 | | | | $22,138 | | | | $10,146 | |
| | Average Net Assets for the Period (in thousands) | | | $157,791 | | | | $105,905 | | | | $71,903 | | | | $36,173 | | | | $16,594 | | | | $5,482 | |
| | Ratios to Average Net Assets**: | |
| | Ratio of Gross Expenses | | | 0.30% | | | | 0.32% | | | | 0.35% | | | | 0.50% | | | | 0.50% | | | | 0.50% | |
| | Ratio of Net Investment Income/(Loss) | | | 0.34% | | | | 0.23% | | | | 0.43% | | | | 0.37% | | | | 0.31% | | | | 0.93% | |
| | Portfolio Turnover Rate(3) | | | 58% | | | | 83% | | | | 80% | | | | 79% | | | | 76% | | | | 65% | |
| * | Total return not annualized for periods of less than one full year. |
| ** | Annualized for periods of less than one full year. |
| (1) | Period from February 23, 2016 (commencement of operations) through October 31, 2016. |
| (2) | Per share amounts are calculated based on average shares outstanding during the year or period. |
| (3) | Portfolio turnover rate excludes securities received or delivered from in-kind processing of creation or redemptions. |
See Notes to Financial Statements.
Janus Henderson Small/Mid Cap Growth Alpha ETF
Notes to Financial Statements (unaudited)
1. Organization and Significant Accounting Policies
Janus Henderson Small/Mid Cap Growth Alpha ETF (the “Fund”) is a series fund. The Fund is part of Janus Detroit Street Trust (the “Trust”), which is organized as a Delaware statutory trust and is registered under the Investment Company Act of 1940, as amended (the “1940 Act”), as an open-end management investment company, and therefore has applied the specialized accounting and reporting guidance in Financial Accounting Standards Board (“FASB”) Accounting Standards Codification (“ASC”) Topic 946. As of the date of this report, the Trust offers six Funds each of which represent shares of beneficial interest in a separate portfolio of securities and other assets with its own objective and policies. The Fund seeks investment results that correspond generally, before fees and expenses, to the performance of its underlying index, the Janus Henderson Small/Mid Cap Growth Alpha Index (the “Underlying Index”). The Fund is classified as diversified, as defined in the 1940 Act.
Unlike shares of traditional mutual funds, shares of the Fund are not individually redeemable and may only be purchased or redeemed directly from the Fund at net asset value (“NAV”) in large increments called “Creation Units” by certain participants, known as “Authorized Participants.” The size of a Creation Unit to purchase shares of the Fund may differ from the size of a Creation Unit to redeem shares of the Fund. The Fund will issue or redeem Creation Units in exchange for portfolio securities and/or cash. Except when aggregated in Creation Units, Fund shares are not redeemable securities of the Fund. Shares of the Fund are listed and trade on The NASDAQ Stock Market LLC (“NASDAQ”) and individual investors can purchase or sell shares in much smaller increments and for cash in the secondary market through a broker. These transactions, which do not involve the Fund, are made at market prices that may vary throughout the day and differ from the Fund’s NAV. As a result, you may pay more than NAV (a premium) when you purchase shares and receive less than NAV (a discount) when you sell shares, in the secondary market.
An Authorized Participant (or other broker-dealers making markets in shares of the Fund) may hold of record more than 25% of the outstanding shares of the Fund. From time to time, Authorized Participants (or other broker-dealers making markets in shares of the Fund) may be a beneficial and/or legal owner of the Fund, may be affiliated with an index provider, may be deemed to have control of the Fund and/or may be able to affect the outcome of matters presented for a vote of the shareholders of the Fund. Authorized Participants (or other broker-dealers making markets in shares of the Fund) may execute an irrevocable proxy granting the Distributor, Janus Capital Management LLC (“Janus Capital” or “Janus”) or an affiliate of Janus Capital power to vote or abstain from voting such Authorized Participant’s beneficially or legally owned shares of the Fund. In such cases, the agent shall mirror vote (or abstain from voting) such shares in the same proportion as all other beneficial owners of the Fund.
The following accounting policies have been followed by the Fund and are in conformity with United States of America generally accepted accounting principles (“US GAAP”).
Investment Valuation
Securities held by the Fund are valued in accordance with policies and procedures established by and under the supervision of the Trustees (the “Valuation Procedures”). Equity securities, including shares of exchange-traded funds, traded on a domestic securities exchange are generally valued at the closing prices on the primary market or exchange on which they trade. If such price is lacking for the trading period immediately preceding the time of determination, such securities are valued at their current bid price. Equity securities that are traded on a foreign exchange are generally valued at the closing prices on such markets. In the event that there is no current trading volume on a particular security in such foreign exchange, the bid price from the primary exchange is generally used to value the security. Securities that are traded on the over-the-counter (“OTC”) markets are generally valued at their closing or latest bid prices as available. Foreign securities and currencies are converted to U.S. dollars using the applicable exchange rate in effect at the close of the London Stock Exchange. The Fund will determine the market value of individual securities held by it by using prices provided by one or more approved professional pricing services or, as needed, by obtaining market quotations from independent broker-dealers. Most debt securities are valued in accordance with the evaluated bid price supplied by the pricing service that is intended to reflect market value. The evaluated bid price supplied by the pricing service is an evaluation that may consider factors such as security prices, yields, maturities and ratings. Certain short-term securities maturing within 60 days or less may be evaluated and valued on an amortized cost basis provided that the amortized cost determined approximates market value. Securities for which market quotations or evaluated prices are not readily available or are deemed unreliable, are valued at fair value determined in good faith under the Valuation Procedures. Circumstances in which fair value pricing may be utilized include, but are not limited to: (i) a significant event that may affect the securities of a single issuer, such as a merger, bankruptcy, or significant issuer-specific development; (ii) an event that may affect an entire market, such as a natural disaster or significant governmental action; (iii) a nonsignificant event such as a market closing early or not opening, or a security trading halt; and (iv) pricing of a nonvalued security and a restricted or nonpublic security. Special valuation considerations may apply with respect to “odd-lot” fixed-income
| | |
| | Janus Detroit Street Trust ½ 17 |
Janus Henderson Small/Mid Cap Growth Alpha ETF
Notes to Financial Statements (unaudited)
transactions which, due to their small size, may receive evaluated prices by pricing services which reflect a large block trade and not what actually could be obtained for the odd-lot position.
Valuation Inputs Summary
FASB ASC 820, Fair Value Measurements and Disclosures (“ASC 820”), defines fair value, establishes a framework for measuring fair value, and expands disclosure requirements regarding fair value measurements. This standard emphasizes that fair value is a market-based measurement that should be determined based on the assumptions that market participants would use in pricing an asset or liability and establishes a hierarchy that prioritizes inputs to valuation techniques used to measure fair value. These inputs are summarized into three broad levels:
Level 1 – Unadjusted quoted prices in active markets the Fund has the ability to access for identical assets or liabilities.
Level 2 – Observable inputs other than unadjusted quoted prices included in Level 1 that are observable for the asset or liability either directly or indirectly. These inputs may include quoted prices for the identical instrument on an inactive market, prices for similar instruments, interest rates, prepayment speeds, credit risk, yield curves, default rates and similar data.
Assets or liabilities categorized as Level 2 in the hierarchy generally include: debt securities fair valued in accordance with the evaluated bid or ask prices supplied by a pricing service; securities traded on OTC markets and listed securities for which no sales are reported that are fair valued at the latest bid price (or yield equivalent thereof) obtained from one or more dealers transacting in a market for such securities or by a pricing service approved by the Fund’s Trustees; and certain short-term debt securities with maturities of 60 days or less that are fair valued at amortized cost. Other securities that may be categorized as Level 2 in the hierarchy include, but are not limited to, preferred stocks, bank loans, swaps, investments in unregistered investment companies, options, and forward contracts.
Level 3 – Unobservable inputs for the asset or liability to the extent that relevant observable inputs are not available, representing the Fund’s own assumptions about the assumptions that a market participant would use in valuing the asset or liability, and that would be based on the best information available.
There have been no significant changes in valuation techniques used in valuing any such positions held by the Fund since the beginning of the fiscal year.
The inputs or methodology used for fair valuing securities are not necessarily an indication of the risk associated with investing in those securities. The summary of inputs used as of April 30, 2021 to fair value the Fund’s investments in securities and other financial instruments is included in the “Valuation Inputs Summary” in the Notes to Schedule of Investments and Other Information.
Investment Transactions and Investment Income
Investment transactions are accounted for as of the date purchased or sold (trade date). Dividend income is recorded on the ex-dividend date. Certain dividends from foreign securities will be recorded as soon as the Fund is informed of the dividend, if such information is obtained subsequent to the ex-dividend date. Dividends from foreign securities may be subject to withholding taxes in foreign jurisdictions. Interest income is recorded daily on an accrual basis and includes amortization of premiums and accretion of discounts. The Fund classifies gains and losses on prepayments received as an adjustment to interest income. Debt securities may be placed in non-accrual status and related interest income may be reduced by stopping current accruals and writing off interest receivables when collection of all or a portion of interest has become doubtful. Gains and losses are determined on the identified cost basis, which is the same basis used for federal income tax purposes.
Estimates
The preparation of financial statements in conformity with US GAAP requires management to make estimates and assumptions that affect the reported amount of assets and liabilities and disclosure of contingent assets and liabilities at the date of the financial statements and the reported amounts of income and expenses during the reporting period. Actual results could differ from those estimates.
Indemnifications
In the normal course of business, the Fund may enter into contracts that contain provisions for indemnification of other parties against certain potential liabilities. The Fund’s maximum exposure under these arrangements is unknown and
Janus Henderson Small/Mid Cap Growth Alpha ETF
Notes to Financial Statements (unaudited)
would involve future claims that may be made against the Fund that have not yet occurred. Currently, the risk of material loss from such claims is considered remote.
Dividends and Distributions
The Fund generally declares and distributes dividends of net investment income quarterly. Net realized capital gains (if any) are distributed annually. The Fund may treat a portion of the amount paid to redeem shares as a distribution of investment company taxable income and realized capital gains that are reflected in the NAV. This practice, commonly referred to as “equalization,” has no effect on the redeeming shareholder or a Fund’s total return but may reduce the amounts that would otherwise be required to be paid as taxable dividends to the remaining shareholders. It is possible that the Internal Revenue Service (IRS) could challenge the Fund’s equalization methodology or calculations, and any such challenge could result in additional tax, interest, or penalties to be paid by the Fund.
The Fund may make certain investments in real estate investment trusts (“REITs”) which pay dividends to their shareholders based upon funds available from operations. It is quite common for these dividends to exceed the REITs’ taxable earnings and profits, resulting in the excess portion of such dividends being designated as a return of capital. If the Fund distributes such amounts, such distributions could constitute a return of capital to shareholders for federal income tax purposes.
Federal Income Taxes
The Fund intends to continue to qualify as a regulated investment company and distribute all of its taxable income in accordance with the requirements of Subchapter M of the Internal Revenue Code. Management has analyzed the Fund’s tax positions taken for all open federal income tax years, generally a three-year period, and has concluded that no provision for federal income tax is required in the Fund’s financial statements. The Fund is not aware of any tax positions for which it is reasonably possible that the total amounts of unrecognized tax benefits will significantly change in the next twelve months.
2. Other Investments and Strategies
Additional Investment Risk
In response to the COVID-19 pandemic, the U.S. government and the Federal Reserve, as well as certain foreign governments and central banks, have taken extraordinary actions to support local and global economies and the financial markets, including reducing interest rates to record low levels. Extremely low or negative interest rates may become more prevalent or may not work as intended. As there is little precedent for this situation, the impact on various markets that interest rate or other significant policy changes may have is unknown. The withdrawal of this support, a failure of measures put in place in response to such economic uncertainty, or investor perception that such efforts were not sufficient could each negatively affect financial markets generally, and the value and liquidity of specific securities. In addition, policy and legislative changes in the United States and in other countries continue to impact many aspects of financial regulation.
Widespread disease, including pandemics and epidemics, and natural or environmental disasters, including those which may be attributable to global climate change, such as earthquakes, fires, floods, hurricanes, tsunamis and weather-related phenomena generally, have been and can be highly disruptive to economies and markets, adversely impacting individual companies, sectors, industries, markets, currencies, interest and inflation rates, credit ratings, investor sentiment, and other factors affecting the value of a Fund’s investments. Economies and financial markets throughout the world have become increasingly interconnected, which increases the likelihood that events or conditions in one region or country will adversely affect markets or issuers in other regions or countries, including the United States. These disruptions could prevent a Fund from executing advantageous investment decisions in a timely manner and negatively impact a Fund’s ability to achieve its investment objective(s). Any such event(s) could have a significant adverse impact on the value of a Fund. In addition, these disruptions could also impair the information technology and other operational systems upon which the Fund’s service providers, including Janus Capital, rely, and could otherwise disrupt the ability of employees of the Fund’s service providers to perform essential tasks on behalf of the Fund. Adverse weather conditions may also have a particularly significant negative effect on issuers in the agricultural sector and on insurance and reinsurance companies that insure or reinsure against the impact of natural disasters.
A number of countries in the European Union (the “EU”) have experienced, and may continue to experience, severe economic and financial difficulties. In particular, many EU nations are susceptible to economic risks associated with high levels of debt. Many non-governmental issuers, and even certain governments, have defaulted on, or been forced to restructure, their debts. Many other issuers have faced difficulties obtaining credit or refinancing existing obligations. Financial institutions have in many cases required government or central bank support, have needed to raise capital, and/or have been impaired in their ability to extend credit. As a result, financial markets in the EU have experienced extreme volatility and declines in asset values and liquidity. These difficulties may continue, worsen, or spread further within the
| | |
| | Janus Detroit Street Trust ½ 19 |
Janus Henderson Small/Mid Cap Growth Alpha ETF
Notes to Financial Statements (unaudited)
EU. Responses to these financial problems by European governments, central banks, and others, including austerity measures and reforms, may not work, may result in social unrest, and may limit future growth and economic recovery or have other unintended consequences. The risk of investing in securities in the European markets may also be heightened due to the referendum in which the United Kingdom voted to exit the EU commonly known as “Brexit,” which immediately led to significant market volatility around the world, as well as political, economic and legal uncertainty. The United Kingdom formally left the EU on January 31, 2020 and entered into an eleven-month transition period, which expired on December 31, 2020. The negative impact on not only the United Kingdom and European economies could be significant, potentially resulting in increased volatility and illiquidity and lower economic growth for companies that rely significantly on the United Kingdom and/or Europe for their business activities and revenues. Any further exits from the EU, or an increase in the belief that such exits are likely or possible, would likely cause additional market disruption globally and introduce new legal and regulatory uncertainties.
Passive Investment Risk
The Fund is not actively managed and therefore the Fund might not sell shares of a security due to current or projected underperformance of a security, industry or sector, unless that security is removed from the Underlying Index or the selling of shares is otherwise required upon a rebalancing of the Underlying Index.
Small-Sized Companies Risk
The Fund’s investments in securities issued by small-sized companies, which can include smaller, start-up companies offering emerging products or services, may involve greater risks than are customarily associated with larger, more established companies. Securities issued by small-sized companies tend to be more volatile and somewhat more speculative than securities issued by larger or more established companies and may underperform as compared to the securities of larger companies. Securities issued by micro-capitalization companies tend to be significantly more volatile, and more vulnerable to adverse business and economic developments, than those of larger companies. For example, small- and micro-capitalization companies may be more likely to merge with or be acquired by another company, resulting in de-listing of the securities held by the Fund.
Counterparties
Fund transactions involving a counterparty are subject to the risk that the counterparty or a third party will not fulfill its obligation to the Fund (“counterparty risk”). Counterparty risk may arise because of the counterparty’s financial condition (i.e., financial difficulties, bankruptcy, or insolvency), market activities and developments, or other reasons, whether foreseen or not. A counterparty’s inability to fulfill its obligation may result in significant financial loss to the Fund. The Fund may be unable to recover its investment from the counterparty or may obtain a limited recovery, and/or recovery may be delayed. The extent of the Fund’s exposure to counterparty risk with respect to financial assets and liabilities approximates its carrying value. See the “Offsetting Assets and Liabilities” section of this Note for further details.
The Fund may be exposed to counterparty risk through participation in various programs, including, but not limited to, lending its securities to third parties, cash sweep arrangements whereby the Fund’s cash balance is invested in one or more types of cash management vehicles, as well as investments in, but not limited to, repurchase agreements, and derivatives, including various types of swaps, futures and options. The Fund intends to enter into financial transactions with counterparties that Janus Capital believes to be creditworthy at the time of the transaction. There is always the risk that Janus Capital’s analysis of a counterparty’s creditworthiness is incorrect or may change due to market conditions. To the extent that the Fund focuses its transactions with a limited number of counterparties, it will have greater exposure to the risks associated with one or more counterparties.
Offsetting Assets and Liabilities
The Fund presents gross and net information about transactions that are either offset in the financial statements or subject to an enforceable master netting arrangement or similar agreement with a designated counterparty, regardless of whether the transactions are actually offset in the Statement of Assets and Liabilities.
JPMorgan Chase Bank, National Association acts as securities lending agent and a limited purpose custodian or subcustodian to receive and disburse cash balances and cash collateral, hold short-term investments, hold collateral, and perform other custodial functions in accordance with the Non-Custodial Securities Lending Agreement. For financial reporting purposes, the Fund does not offset financial instruments’ payables and receivables and related collateral on the Statement of Assets and Liabilities. Securities on loan will be continuously secured by collateral which may consist of cash, U.S. Government securities, domestic and foreign short-term debt instruments, letters of credit, time deposits, repurchase agreements, money market mutual funds or other money market accounts, or such other collateral as permitted by the Securities and Exchange Commission (the “SEC”). See “Securities Lending” in the “Notes to Financial Statements” for additional information.
Janus Henderson Small/Mid Cap Growth Alpha ETF
Notes to Financial Statements (unaudited)
The following table presents gross amounts of recognized assets and/or liabilities and the net amounts after deducting collateral that has been pledged by counterparties or has been pledged to counterparties (if applicable). For corresponding information grouped by type of instrument, see the Fund’s Schedule of Investments.
Offsetting of Financial Assets and Derivative Assets
| | | | | | | | | | | | | | | | |
| Counterparty | | Gross Amounts
of Recognized
Assets | | | Offsetting Asset
or Liability(a) | | | Collateral
Pledged(b) | | | Net Amount | |
| JPMorgan Chase Bank NA | | $ | 2,592,990 | | | $ | — | | | $ | (2,592,990) | | | $ | — | |
| (a) | Represents the amount of assets or liabilities that could be offset with the same counterparty under master netting or similar agreements that management elects not to offset on the Statement of Assets and Liabilities. |
| (b) | Collateral pledged is limited to the net outstanding amount due to/from an individual counterparty. The actual collateral amounts pledged may exceed these amounts and may fluctuate in value. |
Real Estate Investing
The Fund may invest in equity securities of real estate-related companies to the extent such securities are included in the Underlying Index. Such companies may include those in the real estate industry or real estate-related industries. These securities may include common stocks, preferred stocks, and other equity securities, including, but not limited to, mortgage-backed securities, real estate-backed securities, securities of REITs and similar REIT-like entities. A REIT is a trust that invests in real estate-related projects, such as properties, mortgage loans, and construction loans. REITs are generally categorized as equity, mortgage, or hybrid REITs. A REIT may be listed on an exchange or traded OTC.
Securities Lending
Under procedures adopted by the Trustees, the Fund may seek to earn additional income by lending securities to certain qualified broker-dealers and institutions. JP Morgan Chase Bank, National Association acts as securities lending agent and a limited purpose custodian or subcustodian to receive and disburse cash balances and cash collateral, hold short-term investments, hold collateral, and perform other custodial functions in accordance with the Non-Custodial Securities Lending Agreement. The Fund may lend fund securities in an amount equal to up to 1/3 of its total assets as determined at the time of the loan origination. There is the risk of delay in recovering a loaned security or the risk of loss in collateral rights if the borrower fails financially. In addition, Janus Capital makes efforts to balance the benefits and risks from granting such loans. All loans will be continuously secured by collateral which may consist of cash, U.S. Government securities, domestic and foreign short-term debt instruments, letters of credit, time deposits, repurchase agreements, money market mutual funds or other money market accounts, or such other collateral as permitted by the SEC. If the Fund is unable to recover a security on loan, the Fund may use the collateral to purchase replacement securities in the market. There is a risk that the value of the collateral could decrease below the cost of the replacement security by the time the replacement investment is made, resulting in a loss to the Fund. In certain circumstances individual loan transactions could yield negative returns.
Upon receipt of cash collateral, Janus Capital may invest it in affiliated or non-affiliated cash management vehicles, whether registered or unregistered entities, as permitted by the 1940 Act and rules promulgated thereunder. Janus Capital currently intends to invest the cash collateral in a cash management vehicle for which Janus Capital serves as investment adviser, Janus Henderson Cash Collateral Fund LLC, or in time deposits. An investment in Janus Henderson Cash Collateral Fund LLC is generally subject to the same risks that shareholders experience when investing in similarly structured vehicles, such as the potential for significant fluctuations in assets as a result of the purchase and redemption activity of the securities lending program, a decline in the value of the collateral, and possible liquidity issues. Such risks may delay the return of the cash collateral and cause the Fund to violate its agreement to return the cash collateral to a borrower in a timely manner. As adviser to the Fund and Janus Henderson Cash Collateral Fund LLC, Janus Capital has an inherent conflict of interest as a result of its fiduciary duties to both the Fund and Janus Henderson Cash Collateral Fund LLC. Additionally, Janus Capital receives an investment advisory fee of 0.05% for managing Janus Henderson Cash Collateral Fund LLC, therefore may have an incentive to allocate collateral to the Janus Henderson Cash Collateral Fund LLC, rather than to other collateral management options for which Janus Capital does not receive compensation.
The value of the collateral must be at least 102% of the market value of the loaned securities that are denominated in U.S. dollars and 105% of the market value of the loaned securities that are not denominated in U.S. dollars. Loaned securities and related collateral are marked-to-market each business day based upon the market value of the loaned securities at the close of business, employing the most recent available pricing information. Collateral levels are then adjusted based on this mark-to-market evaluation.
| | |
| | Janus Detroit Street Trust ½ 21 |
Janus Henderson Small/Mid Cap Growth Alpha ETF
Notes to Financial Statements (unaudited)
The cash collateral invested by Janus Capital is disclosed in the Schedule of Investments (if applicable). Income earned from the investment of the cash collateral, net of rebates paid to, or fees paid by, borrowers and less the fees paid to the lending agent are included as “Affiliated securities lending income, net” on the Statement of Operations. As of April 30, 2021, securities lending transactions accounted for as secured borrowings with an overnight and continuous contractual maturity are $2,592,990 for equity securities. Gross amounts of recognized liabilities for securities lending (collateral received) as of April 30, 2021 is $2,647,656, resulting in the net amount due to the counterparty of $54,666.
3. Investment Advisory Agreements and Other Transactions with Affiliates
Under its unitary fee structure, the Fund pays Janus Capital a management fee in return for providing certain investment advisory, supervisory, and administrative services to the Fund, including the costs of transfer agency, custody, fund administration, legal, audit, and other services. Janus Capital’s fee structure is designed to pay substantially all of the Fund’s expenses. However, the Fund bears other expenses which are not covered under the management fee which may vary and affect the total level of expenses paid by shareholders, such as distribution fees (if any), brokerage expenses or commissions, interest, dividends, taxes, litigation expenses, acquired fund fees and expenses (if any), and extraordinary expenses. The Fund’s unitary management fee provides for reductions in the fee rate as the Fund’s assets grow. As of the date of this report the Fund’s management fee was calculated daily and paid monthly according to the following schedule:
| | | | |
| Daily Net Assets | | Fee Rate | |
| $0-$500 million | | | 0.30% | |
| Next $500 million | | | 0.25% | |
| Over $1 billion | | | 0.20% | |
For the period ended April 30, 2021, the Fund’s contractual management fee rate (expressed as an annual rate) was 0.30% of the Fund’s average daily net assets.
As of the date of this report, State Street Bank and Trust Company (“State Street”) provides certain fund administration services to the Fund, including services related to the Fund’s accounting, including calculating the daily NAV, audit coordination, tax, and reporting obligations, pursuant to an agreement with Janus Capital, on behalf of the Fund. As compensation for such services, Janus Capital pays State Street a fee based on a percentage of the Fund’s assets, with a minimum flat fee, for certain services. Janus Capital serves as administrator to the Fund, providing oversight and coordination of the Fund’s service providers, recordkeeping and other administrative services. Janus Capital does not receive any additional compensation, beyond the unitary fee, for serving as administrator. State Street also serves as transfer agent for the shares of the Fund. Pursuant to agreements with Janus Capital on behalf of the Fund, State Street Global Markets, an affiliate of State Street, may execute portfolio transactions for the Fund, including but not limited to, transactions in connection with cash in lieu transactions.
The Fund’s Board of Trustees (“Board”) has approved a Distribution and Servicing Plan for shares of the Fund pursuant to Rule 12b-1 under the 1940 Act (the “Plan”). The Plan permits compensation in connection with the distribution and marketing of Fund shares and/or the provision of certain shareholder services. The Plan permits the Fund to pay ALPS Distributors, Inc. (the “Distributor”) or its designee, a fee for the sale and distribution and/or shareholder servicing of the shares at an annual rate of up to 0.25% of average daily net assets of the Fund. Under the terms of the Plan, the Fund would be authorized to make payments to the Distributor or its designee for remittance to retirement plan service providers, broker-dealers, bank trust departments, financial advisors, and other financial intermediaries, as compensation for distribution and/or shareholder services performed by such entities for their customers who are investors in the Fund. The 12b-1 fee may only be imposed or increased when (i) the Trustees determine that it is in the best interests of shareholders to do so, and (ii) the imposition of or increase in the 12b-1 fee is first approved by the Fund’s shareholders. Because these fees are paid out of the Fund’s assets on an ongoing basis, to the extent that a fee is authorized by shareholders in the future, over time they will increase the cost of an investment in the Fund. The Plan fee may cost an investor more than other types of sales charges. At this time, Janus Capital does not intend to seek shareholder approval for implementation of the Plan.
As of April 30, 2021, Janus Capital owned 2,000 shares or 0.07% of the Fund.
The Fund is permitted to purchase or sell securities (“cross-trade”) between itself and other funds or accounts managed by Janus Capital in accordance with Rule 17a-7 under the Investment Company Act of 1940 (“Rule 17a-7”), when the transaction is consistent with the investment objectives and policies of the Fund and in accordance with the Internal Cross Trade Procedures adopted by the Trust’s Board of Trustees. These procedures have been designed to ensure that
Janus Henderson Small/Mid Cap Growth Alpha ETF
Notes to Financial Statements (unaudited)
any cross-trade of securities by the Fund from or to another fund or account that is or could be considered an affiliate of the Fund under certain limited circumstances by virtue of having a common investment adviser, common Officer, or common Trustee complies with Rule 17a-7. Under these procedures, each cross-trade is effected at the current market price to save costs where allowed. During the period ended April 30, 2021, the Fund engaged in cross trades amounting to $6,213,979 in purchases and $387,892 in sales, resulting in a net realized gain of $45,337. The net realized gain is included within the “Net Realized Gain/(Loss) on Investments” section of the Fund’s Statement of Operations.
Any purchases and sales, realized gains/losses and recorded dividends from affiliated investments during the period ended April 30, 2021 can be found in a table located in the Schedule of Investments.
4. Federal Income Tax
Income and capital gains distributions are determined in accordance with income tax regulations that may differ from US GAAP. These differences are due to differing treatments for items such as net short-term gains, deferral of wash sale losses, foreign currency transactions, passive foreign investment companies, net investment losses, in-kind transactions and capital loss carryovers.
The Fund has elected to treat gains and losses on forward foreign currency contracts as capital gains and losses, if applicable. Other foreign currency gains and losses on debt instruments are treated as ordinary income for federal income tax purposes pursuant to Section 988 of the Internal Revenue Code.
Accumulated capital losses noted below represent net capital loss carryovers, as of October 31, 2020, that may be
available to offset future realized capital gains and thereby reduce future taxable gains distributions. The following table shows these capital loss carryovers.
| | | | | | | | | | |
Capital Loss Carryover Schedule
For the year ended October 31, 2020
No Expiration | | | Accumulated Capital Losses | |
| Short-Term | | | Long-Term | |
| $ | (9,188,520) | | | $ | (2,493,876) | | | $ | (11,682,396) | |
The aggregate cost of investments and the composition of unrealized appreciation and depreciation of investment securities for federal income tax purposes as of April 30, 2021 are noted below. The primary differences between
book and tax appreciation or depreciation of investments are wash sale loss deferrals.
| | | | | | | | | | | | | | |
| Federal Tax Cost | | | Unrealized
Appreciation | | | Unrealized
(Depreciation) | | | Net Tax Appreciation/
(Depreciation) | |
| $ | 159,107,119 | | | $ | 33,820,144 | | | $ | (4,005,239) | | | $ | 29,814,905 | |
5. Capital Share Transactions
| | | | | | | | | | | | | | | | |
| | | Period ended April 30, 2021 | | | Year ended October 31, 2020 | |
| | | Shares | | | Amount | | | Shares | | | Amount | |
| Shares sold | | | 1,500,000 | | | $ | 96,196,296 | | | | 900,000 | | | $ | 39,977,929 | |
| Shares repurchased | | | (975,000) | | | | (62,831,533) | | | | (900,000) | | | | (39,768,171) | |
Net Increase/(Decrease) | | | 525,000 | | | $ | 33,364,763 | | | | — | | | $ | 209,758 | |
6. Purchases and Sales of Investment Securities
For the period ended April 30, 2021, the aggregate cost of purchases and proceeds from sales of investment securities (excluding any short-term securities, short-term options contracts, and in-kind transactions) was as follows:
| | | | | | | | | | | | |
Purchases of Securities | | Proceeds from Sales of Securities | | | Purchases of Long- Term U.S. Government Obligations | | | Proceeds from Sales of Long-Term U.S. Government Obligations | |
| $90,728,100 | | $ | 89,823,673 | | | $ | — | | | $ | — | |
| | |
| | Janus Detroit Street Trust ½ 23 |
Janus Henderson Small/Mid Cap Growth Alpha ETF
Notes to Financial Statements (unaudited)
For the period ended April 30, 2021, the cost of in-kind purchases and proceeds from in-kind sales, were as follows:
| | | | | | | | | | | | |
Purchases of Securities | | Proceeds from Sales of Securities | | | Purchases of Long- Term U.S. Government Obligations | | | Proceeds from Sales of Long-Term U.S. Government Obligations | |
| $96,206,933 | | $ | 63,010,791 | | | $ | — | | | $ | — | |
During the period ended April 30, 2021, the Fund had net realized gain/(loss) of $24,153,188 from in-kind redemptions. Gains on in-kind transactions are not considered taxable for federal income tax purposes.
7. Subsequent Events
Management has evaluated whether any events or transactions occurred subsequent to April 30, 2021 and through
the date of the issuance of the Fund’s financial statements and determined that there were no material events or
transactions that would require recognition or disclosure in the Fund’s financial statements.
Janus Henderson Small/Mid Cap Growth Alpha ETF
Additional Information (unaudited)
Proxy Voting Policies and Voting Record
A description of the policies and procedures that the Fund uses to determine how to vote proxies relating to its portfolio securities is available without charge: (i) upon request, by calling 1-800-668-0434 (toll free); (ii) on the Fund’s website at janushenderson.com/proxyvoting; and (iii) on the SEC’s website at http://www.sec.gov.
Quarterly Portfolio Holdings
The Fund files its complete portfolio holdings (schedule of investments) with the SEC for the first and third quarters each fiscal year as an exhibit to Form N-PORT within 60 days of the end of such fiscal quarter. The Fund’s Form N-PORT filings: are available on the SEC’s website at http://www.sec.gov; (ii) may be reviewed and copied at the SEC’s Public Reference Room in Washington, D.C. (information on the Public Reference Room may be obtained by calling 1-800-SEC-0330); and (iii) are available without charge, upon request, by calling Janus Henderson at 1-800-668-0434 (toll free).
Licensing Agreements
Janus Henderson Indices LLC (“JH Indices”) is the Index Provider for the Underlying Index. Janus Capital has entered into a license agreement with JH Indices to use the Underlying Index. JH Indices is affiliated with the Fund and Janus Capital. This affiliation may create potential conflicts for JH Indices as it may have an interest in the performance of the Fund, which could motivate it to alter the Underlying Index methodology for the Underlying Index. JH Indices has adopted procedures that it believes are reasonably designed to mitigate these and other potential conflicts.
JH Indices is the licensor of certain trademarks, service marks, and trade names. Neither JH Indices nor any of its affiliates make any representation or warranty, express or implied, to the owners of the Fund or any member of the public regarding the advisability of investing in securities generally or in the Fund particularly or the ability of the Underlying Index to track general market performance. The Underlying Index is determined, composed, and calculated by JH Indices without regard to Janus Capital or the Fund. JH Indices has no obligation to take the needs of Janus Capital or the owners of the Fund into consideration in determining, composing, or calculating the Underlying Index. JH Indices is not responsible for and has not participated in the determination of the timing of, prices at, or quantities of the Fund to be issued or in the determination or calculation of the equation by which the Fund is to be converted into cash.
ALTHOUGH JH INDICES SHALL OBTAIN INFORMATION FOR INCLUSION IN OR FOR USE IN THE CALCULATION OF THE UNDERLYING INDEX FROM SOURCES WHICH IT CONSIDERS RELIABLE, IT DOES NOT GUARANTEE THE QUALITY, ACCURACY AND/OR THE COMPLETENESS OF THE UNDERLYING INDEX OR ANY DATA INCLUDED THEREIN AND SHALL HAVE NO LIABILITY FOR ERRORS OR OMISSIONS OF ANY KIND RELATED TO THE UNDERLYING INDEX OR DATA. JH INDICES MAKES NO WARRANTY, EXPRESS OR IMPLIED, AS TO RESULTS TO BE OBTAINED BY JANUS CAPITAL, OWNERS OF THE FUND, OR ANY OTHER PERSON OR ENTITY FROM THE USE OF THE UNDERLYING INDEX OR ANY DATA INCLUDED THEREIN IN CONNECTION WITH THE RIGHTS LICENSED TO JANUS CAPITAL FOR ANY OTHER USE. JH INDICES MAKES NO EXPRESS OR IMPLIED WARRANTIES, AND HEREBY EXPRESSLY DISCLAIMS ALL WARRANTIES OF MERCHANTABILITY OR FITNESS FOR A PARTICULAR PURPOSE OR USE WITH RESPECT TO THE UNDERLYING INDEX OR ANY DATA INCLUDED THEREIN. WITHOUT LIMITING ANY OF THE FOREGOING, IN NO EVENT SHALL IT HAVE ANY LIABILITY FOR ANY SPECIAL, PUNITIVE, INDIRECT, OR CONSEQUENTIAL DAMAGES (INCLUDING LOST PROFITS), EVEN IF NOTIFIED OF THE POSSIBILITY OF SUCH DAMAGES.
Janus Capital does not guarantee the accuracy and/or the completeness of the Underlying Index or any data included therein, and Janus Capital shall have no liability for any errors, omissions or interruptions therein. Janus Capital makes no warranty, express or implied, as to results to be obtained by the Fund, owners of the shares of the Fund or any other person or entity from the use of the Underlying Index or any data included therein. Janus Capital makes no express or implied warranties, and expressly disclaims all warranties of merchantability or fitness for a particular purpose or use with respect to the Underlying Index or any data included therein. Without limiting any of the foregoing, in no event shall Janus Capital have any liability for any special, punitive, direct, indirect or consequential damages (including lost profits) arising out of matters relating to the use of the Underlying Index even if notified of the possibility of such damages.
| | |
| | Janus Detroit Street Trust ½ 25 |
Janus Henderson Small/Mid Cap Growth Alpha ETF
Board Considerations Regarding Approval of Investment Advisory Agreements (unaudited)
The Board of Trustees (the “Board”) of Janus Detroit Street Trust (the “Trust”), including a majority of the Trustees who are not “interested persons” as that term is defined in the Investment Company Act of 1940, as amended (the “Independent Trustees”), met on April 21-22, 2021 to consider the proposed renewal of the investment management agreement between Janus Capital Management LLC (the “Adviser”) and the Trust (the “Investment Management Agreement”), on behalf of Janus Henderson Short Duration Income ETF (“VNLA”), Janus Henderson Small Cap Growth Alpha ETF (“JSML”), Janus Henderson Small/Mid Cap Growth Alpha ETF (“JSMD”), Janus Henderson Mortgage-Backed Securities ETF (“JMBS”) and The Long Term Care ETF (“OLD” and, together with VNLA, JSML, JSMD and JMBS, the “Funds”). In the course of their consideration of the renewal of the Investment Management Agreement, the Independent Trustees met in executive session and were advised by their independent counsel. In this regard, the Independent Trustees evaluated the terms of the Investment Management Agreement and reviewed the duties and responsibilities of trustees in evaluating and approving such agreements. In considering renewal of the Investment Management Agreement, the Board and the Independent Trustees, as applicable, reviewed the materials provided to them relating to the consideration of the renewal of the Investment Management Agreement for the Funds and other information provided by counsel and the Adviser, including: (i) information regarding the nature, quality and extent of the services provided to the Funds by the Adviser, and the fees charged to each Fund therefor; (ii) information concerning the Adviser’s financial condition, business, operations, portfolio management personnel, compliance programs, and profitability with respect to the Trust and each Fund; (iii) comparative information describing each Fund’s advisory fee structures, operating expenses, and performance information as compared to peer fund groups selected and reported to the Board by an independent third party; (iv) a copy of the Adviser’s current Form ADV; and (v) a memorandum from counsel to the Independent Trustees on the responsibilities of trustees in considering investment advisory arrangements under the 1940 Act. The Board also considered presentations made by, and discussions held with, representatives of the Adviser over the previous year and since the inception of the Funds. The Trustees previously met via telephone on March 15, 2021 to discuss certain information provided by the Adviser related to the Trustees’ consideration of the renewal of the Investment Management Agreement.
During its review of this information, the Board focused on and analyzed the factors that it deemed relevant, including, among other factors: (i) the nature, extent and quality of the services provided to the Funds by the Adviser; (ii) the Adviser’s personnel and operations; (iii) each Fund’s expense level; (iv) the profitability to the Adviser under the Investment Management Agreement with respect to each Fund; (v) any “fall-out” benefits to the Adviser and its affiliates (i.e., the ancillary benefits realized by the Adviser and its affiliates from the Adviser’s relationship with the Trust); (vi) the effect of asset growth on each Fund’s expenses; and (vii) potential conflicts of interest.
The Trustees also considered benefits that accrue to the Adviser and its affiliates from their relationships with the Trust and each Fund. The Trustees also considered that, other than the services provided by the Adviser and its affiliates pursuant to agreements with the Funds and the fees paid by the Funds therefor, the Funds and the Adviser may potentially benefit from their relationship with each other in other ways. The Trustees considered that the success of the Funds could attract other business to the Adviser or other Janus Henderson funds, and that the success of the Adviser could enhance the Adviser’s ability to serve the Funds.
The Board, including the Independent Trustees, considered the following in respect of the Funds:
(a) The nature, extent and quality of services provided by the Adviser; personnel and operations of the Adviser.
The Board reviewed the services that the Adviser provides to the Funds. In connection with the investment advisory services provided by the Adviser, the Board noted the responsibilities that the Adviser has as the Funds’ investment adviser, including: the overall supervisory responsibility for the general management and investment of each Fund’s securities portfolio; providing oversight of the investment performance and processes and compliance with each Fund’s investment objectives, policies and limitations; the implementation of the investment management program of each Fund; the management of the day-to-day investment and reinvestment of the assets of each Fund; determining daily baskets of securities and cash components in connection with creation and redemption transactions in each Fund’s shares; executing portfolio security trades for purchases and redemptions of each Fund’s shares conducted on a cash-in-lieu basis; the review of brokerage matters; the oversight of general portfolio compliance with relevant law; and the implementation of Board directives as they relate to the Funds.
The Board reviewed the Adviser’s experience, resources and strengths in managing the Funds and other pooled investment vehicles, including an assessment of the Adviser’s personnel. Based on its consideration and review of the foregoing information, the Board determined that each Fund was likely to continue to benefit from the nature, quality and extent of these services, as well as the Adviser’s ability to render such services based on the Adviser’s experience, personnel, operations and resources.
Janus Henderson Small/Mid Cap Growth Alpha ETF
Board Considerations Regarding Approval of Investment Advisory Agreements (unaudited)
(b) Comparison of services rendered and fees paid under other investment advisory contracts, and the cost of the services to be provided and profits to be realized by the Adviser from the relationship with the Funds; “fall-out” benefits.
The Board then compared both the services rendered and the fees paid under other contracts of the Adviser and under contracts of other investment advisers with respect to similar mutual funds and ETFs. In particular, the Board reviewed a report compiled by an independent third party to compare each Fund’s management fee and expense ratio to other investment companies within each Fund’s respective peer grouping, as determined by the independent third party.
The comparative reporting indicated that total expense ratios for JSMD, VNLA, JMBS and OLD were in the 1st, 2nd, 1st and 1st quintiles, respectively, as compared to each Fund’s respective peer grouping. The comparative reporting indicated that the total expense ratio for JMSL was ranked third in the peer group assigned by the independent third party, which contained five peers. The Board also noted that the Adviser had reduced the management fees charged to the Funds at the April 22-23, 2020 Meeting by implementing reductions in each Fund’s breakpoint schedule. The Board further considered that the Adviser had voluntarily agreed to cap the expenses of VNLA and JMBS to the extent that the Funds’ total expense ratio exceeded 0.23% and 0.29%, respectively, for at least the period February 28, 2021 through February 28, 2022.
The Board also discussed the costs incurred by the Adviser in connection with its serving as investment adviser to the Funds, including operational costs. After comparing each Fund’s fees and expenses with those of other ETFs and mutual funds (as applicable) in the Funds’ respective peer groups, and in light of the nature, extent and quality of services provided by the Adviser and the costs incurred by the Adviser in rendering those services, as well as the profitability of the Adviser in providing these services, the Board concluded that the level of fees paid to the Adviser and the profitability with respect to each Fund was fair and reasonable.
The Board also considered that the Adviser may experience reputational “fall-out” benefits based on the success of the Funds, but that such benefits are not easily quantifiable.
(c) The extent to which economies of scale would be realized as the Fund grows and whether fee levels would reflect such economies of scale.
The Board next discussed potential economies of scale. In its review, the Board considered that the Funds were positioned to realize economies of scale as assets grow over time, given the inclusion of management fee breakpoints for each Fund in the current investment advisory agreement at various asset levels.
(d) Investment performance of the Fund and the Adviser.
The Board next discussed the performance of the Funds on both an absolute basis and relative to the performance of funds comprising a peer group compiled by an independent third party for each Fund for the one-year period, two-year period, r three-year period, and/or four-year period, as applicable. The Board noted that for the one-, two-, three-, and four year periods, respectively, OLD was reported to be in the 5th, 5th, 5th and 5th quintiles, JSMD was reported to be in the 3rd, 3rd, 2nd and 3rd quintiles and JSML was reported to be in the 4th, 3rd, 3rd and 3rd quintiles. VNLA was reported to be in the 3rd, 4th and 2nd quintiles for the one-, two- and three-year periods, respectively. JMBS was reported to be in the 1st quintile for both the one- and two-year periods. The Board considered the Adviser’s explanation of performance provided as part of the consideration of the renewal of the Investment Advisory Agreement, and during the course of the previous year.
With respect to OLD, JSML and JSMD, the Board noted that these Funds are index-based and, as a result, passively managed to seek to track the returns of specified indices. For this reason, the Board also considered the performance of these Funds in relation to the performance of each Fund’s respective underlying index (i.e. “tracking error”), and considered that the tracking error was within anticipated ranges.
Conclusion.
No single factor was determinative to the decision of the Board. Based on the foregoing and such other matters as were deemed relevant, the Board concluded that the management fee rates and total expense ratios of each Fund are reasonable in relation to the services provided by the Adviser to such Fund, as well as the costs incurred and benefits gained by the Adviser in providing such services. The Board also found the management fees to be reasonable in comparison to the fees charged by advisers to other comparable ETFs and mutual funds (as applicable). As a result, the Board concluded that the renewal of the Investment Management Agreement for an additional one-year period was in the best interests of each Fund.
After full consideration of the above factors, as well as other factors, the Trustees, including all of the Independent Trustees voting separately, determined to approve the renewal of the Investment Management Agreement for each Fund.
| | |
| | Janus Detroit Street Trust ½ 27 |
Janus Henderson Small/Mid Cap Growth Alpha ETF
Liquidity Risk Management Program (unaudited)
Rule 22e-4 under the Investment Company Act of 1940, as amended (the “Liquidity Rule”), requires open-end funds (but not money market funds) to adopt and implement a written liquidity risk management program (the “LRMP”) that is reasonably designed to assess and manage liquidity risk.. In compliance with the Liquidity Rule, the Fund has implemented a LRMP, which incorporates the following elements: (i) assessment, management, and periodic review of liquidity risk; (ii) classification of portfolio holdings, as applicable; (iii) the establishment and monitoring of a highly liquid investment minimum, as applicable; (iv) a 15% limitation on a Fund’s illiquid investments; (v) redemptions in-kind; and (vi) board oversight. In light of the fact that the Fund operates as an exchange-traded fund (“ETF”), the LRMP also takes into account considerations unique to ETFs, including the relationship between the ETF’s portfolio liquidity and the way in which, and the prices and spreads at which, ETF shares trade, including: (i) the efficiency of the arbitrage function and the level of active participation by market participants (including authorized participants); and (ii) the effect of the composition of baskets on the overall liquidity of the ETF’s portfolio. The LRMP also considers whether the ETF meets redemptions through in-kind transfers of securities, positions, and assets other than a de minimis amount of cash.
The Trustees of the Fund (the “Trustees”) have designated Janus Capital Management LLC, the Fund’s investment adviser (“Janus Capital”), as the Program Administrator for the LRMP. A working group comprised of various groups within Janus Capital’s business is responsible for administering different aspects of the LRMP (the “Liquidity Risk Working Group”).
The Liquidity Rule requires the Trustees to review at least annually a written report provided by the Janus Capital that addresses the operation of the LRMP and assesses its adequacy and the effectiveness of its implementation, including, if applicable, the operation of the highly liquid investment minimum and any material changes to the LRMP (the “Program Administrator Report”). At a meeting held April 22, 2021, Janus Capital provided the Program Administrator Report to the Trustees which covered the operation of the LRMP from January 1, 2020 through December 31, 2020 (the “Reporting Period”).
The Program Administrator Report discussed the operation and effectiveness of the LRMP during the Reporting Period. It noted that the Fund was able to meet redemptions during the normal course of business during the Reporting Period, and discussed the additional actions that the Liquidity Risk Working Group took during the period of market volatility in the spring of 2020, in light of the impact of the coronavirus outbreak, to monitor the Fund’s liquidity. The Program Administrator Report also stated that the Fund did not exceed the 15% limit on illiquid assets during the Reporting Period, that the Fund held primarily highly liquid assets, and was considered to be a primarily highly liquid fund during the Reporting Period. In addition, Janus Capital expressed its belief in the Program Administrator Report that the LRMP is reasonably designed and adequate to assess and manage the Fund’s liquidity risk, taking into account the Fund’s particular risks and circumstances, and includes policies and procedures reasonably designed to implement each required component of the Liquidity Rule.
There can be no assurance that the LRMP will achieve its objectives in the future. Please refer to your Fund’s prospectus for more information regarding the risks to which an investment in the Fund may be subject.
Janus Henderson Small/Mid Cap Growth Alpha ETF
Notes
| | |
| | Janus Detroit Street Trust ½ 29 |
This report is submitted for the general information of shareholders of the Fund. It is not an offer or solicitation for the Fund and is not authorized for distribution to prospective investors unless preceded or accompanied by an effective prospectus.
Janus Henderson is a trademark of Janus Henderson Group plc or one of its subsidiaries. © Janus Henderson Group plc.
Janus Capital Management LLC is the investment adviser and ALPS Distributors, Inc. is the distributor. ALPS is not affiliated with Janus Henderson or any of its subsidiaries.
SEMIANNUAL REPORT
April 30, 2021
Janus Henderson Small Cap Growth Alpha ETF
Janus Detroit Street Trust

Table of Contents
Janus Henderson Small Cap Growth Alpha ETF (unaudited)
Fund At A Glance
April 30, 2021
INVESTMENT OBJECTIVE
Janus Henderson Small Cap Growth Alpha ETF seeks investment results that correspond generally, before fees and expenses, to the performance of the Janus Henderson Small Cap Growth Alpha Index.
| | | | |
| 5 Largest Equity Holdings – (% of Net Assets) | |
Bentley Systems, Inc. | | | | |
Software | | | 3.5% | |
Ensign Group, Inc. | | | | |
Health Care Providers & Services | | | 3.2% | |
Medpace Holdings, Inc. | | | | |
Life Sciences Tools & Services | | | 3.1% | |
Alarm.com Holdings, Inc. | | | | |
Software | | | 3.1% | |
Corcept Therapeutics, Inc. | | | | |
Pharmaceuticals | | | 2.7% | |
| | | | |
| | | 15.6% | |
| | | | |
| Sector Allocation – (% of Net Assets) | |
Consumer, Non-cyclical | | | 35.4% | |
Technology | | | 25.9% | |
Consumer, Cyclical | | | 10.0% | |
Industrial | | | 8.9% | |
Financial | | | 8.1% | |
Communications | | | 6.0% | |
Basic Materials | | | 4.1% | |
Investments Purchased with Cash Collateral from Securities Lending | | | 4.0% | |
Energy | | | 0.8% | |
Utilities | | | 0.8% | |
Investment Companies | | | 0.0% | |
| | | | |
| | | 104.0% | |
Holdings are subject to change without notice.
| | |
| | Janus Detroit Street Trust ½ 1 |
Janus Henderson Small Cap Growth Alpha ETF (unaudited)
Performance
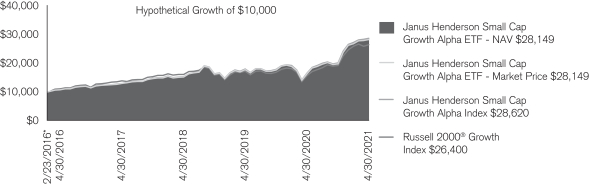
| | | | | | | | |
| Average Annual Total Return for the periods ended April 30, 2021 |
| | | Fiscal
Year-to-Date | | One
Year | | Five
Year | | Since
Inception* |
Janus Henderson Small Cap Growth Alpha ETF – NAV | | 42.35% | | 72.97% | | 21.35% | | 22.10% |
Janus Henderson Small Cap Growth Alpha ETF – Market Price | | 42.91% | | 72.88% | | 21.35% | | 22.10% |
Janus Henderson Small Cap Growth Alpha Index | | 42.55% | | 73.47% | | 21.73% | | 22.49% |
Russell 2000® Growth Index | | 37.84% | | 69.15% | | 18.89% | | 20.60% |
| * | The Fund commenced operations on February 23, 2016. |
Total annual expense ratio as stated in the prospectus: 0.30%. See Financial Highlights for actual expense ratios during the reporting period.
Returns quoted are past performance and do not guarantee future results; current performance may be lower or higher. Investment returns and principal value will vary; there may be a gain or loss when shares are sold. For the most recent month-end performance call 800.668.0434 or visit janushenderson.com/performance.
Shares of ETFs are bought and sold at market price (not NAV) and are not individually redeemed from the Fund. Market returns are based upon the midpoint of the bid/ask spread at 4:00 p.m. Eastern time (when NAV is normally determined for most ETFs), and do not represent the returns you would receive if you traded shares at other times. Ordinary brokerage commissions apply and will reduce returns.
Investing involves risk, including the possible loss of principal and fluctuation of value.
Performance depends on that of the underlying index.
See the prospectus for a more complete discussion of objectives, risks and expenses.
Returns include reinvestment of dividends and capital gains. Returns do not reflect the deduction of taxes that a shareholder would pay on Fund distributions, sales or redemptions of Fund shares.
There is no assurance the stated objective(s) will be met.
See Notes to Schedule of Investments and Other Information for index definitions.
Index performance does not reflect the expenses of managing a portfolio as an index is unmanaged and not available for direct investment.
The index provider is Janus Henderson Indices LLC (“JH Indices”). JH Indices maintains the indices and calculates the index levels and performance shown or discussed but does not manage actual assets. JH Indices receives compensation in connection with licensing its indices to third parties including the provision of any related data. JH Indices does not receive compensation for licensing the index to Janus Capital Management LLC with respect to the Fund.
Janus Henderson Small Cap Growth Alpha ETF (unaudited)
Disclosure of Fund Expenses
As a shareholder of the Fund, you incur two types of costs: (1) transaction costs, which may include creation and redemption fees or brokerage charges and (2) ongoing costs, including management fees and other Fund expenses. This example is intended to help you understand your ongoing costs (in dollars) of investing in the Fund and to compare these costs with the ongoing costs of investing in other ETFs. To do so, compare this 5% hypothetical example with the 5% hypothetical examples that appear in the shareholder reports of the other funds. The example is based upon an investment of $1,000 invested at the beginning of the period and held for the six-months indicated, unless noted otherwise in the table and footnotes below.
Actual Expenses
The information in the table under the heading “Actual” provides information about actual account values and actual expenses. You may use the information in these columns, together with the amount you invested, to estimate the expenses that you paid over the period. Simply divide your account value by $1,000 (for example, an $8,600 account value divided by $1,000 = 8.6), then multiply the result by the number under the heading entitled “Expenses Paid During Period” to estimate the expenses you paid on your account during the period.
Hypothetical Example for Comparison Purposes
The information in the table under the heading “Hypothetical (5% return before expenses)” provides information about hypothetical account values and hypothetical expenses based upon the Fund’s actual expense ratio and an assumed rate of return of 5% per year before expenses, which is not the Fund’s actual return. The hypothetical account values and expenses may not be used to determine the actual ending account balance or expenses you paid for the period. You may use this information to compare the ongoing costs of investing in the Fund and other funds. To do so, compare this 5% hypothetical example with the 5% hypothetical examples that appear in the shareholder reports of the other funds. Additionally, for an analysis of the fees associated with an investment or other similar funds, please visit www.finra.org/fundanalyzer.
Please note that the expenses shown in the table are meant to highlight your ongoing costs only and do not reflect any transaction costs, such as creation and redemption fees, or brokerage charges. These fees are fully described in the Fund’s prospectus. Therefore, the hypothetical examples are useful in comparing ongoing costs only and will not help you determine the relative total costs of owning different funds. In addition, if these transaction costs were included, your costs would have been higher.
| | | | | | | | | | | | | | | | | | | | | | | | |
Actual | | | Hypothetical
(5% return before expenses) | | | | |
Beginning
Account
Value
(11/1/20) | | Ending
Account
Value
(4/30/21) | | | Expenses
Paid During
Period
(11/1/20 - 4/30/21)† | | | Beginning
Account
Value
(11/1/20) | | | Ending
Account
Value
(4/30/21) | | | Expenses
Paid During
Period
(11/1/20 - 4/30/21)† | | | Net Annualized
Expense Ratio
(11/1/20 - 4/30/21) | |
| $1,000.00 | | $ | 1,423.50 | | | $ | 1.80 | | | $ | 1,000.00 | | | $ | 1,023.31 | | | $ | 1.51 | | | | 0.30% | |
| † | Expenses Paid During Period is equal to the Net Annualized Expense Ratio multiplied by the average account value over the period, multiplied by 181/365 (to reflect the one-half year period). |
| | |
| | Janus Detroit Street Trust ½ 3 |
Janus Henderson Small Cap Growth Alpha ETF
Schedule of Investments (unaudited)
April 30, 2021
| | | | | | | | |
| | | Shares/ Principal Amounts | | | Value | |
| Common Stocks – 100.0% | |
| Aerospace & Defense – 0.8% | |
Aerojet Rocketdyne Holdings, Inc. | | | 25,580 | | | | $1,195,098 | |
| Air Freight & Logistics – 0.5% | |
Atlas Air Worldwide Holdings, Inc.* | | | 9,502 | | | | 645,281 | |
| Auto Components – 1.4% | |
LCI Industries | | | 6,642 | | | | 973,053 | |
Patrick Industries, Inc. | | | 6,168 | | | | 552,653 | |
XPEL, Inc.* | | | 7,291 | | | | 467,353 | |
| | | | | | | | |
| | | | | | | 1,993,059 | |
| Beverages – 0.6% | |
Celsius Holdings, Inc.* | | | 5,283 | | | | 302,716 | |
Coca-Cola Consolidated, Inc. | | | 519 | | | | 152,197 | |
MGP Ingredients, Inc. | | | 1,233 | | | | 74,103 | |
National Beverage Corp. | | | 6,797 | | | | 330,266 | |
| | | | | | | | |
| | | | | | | 859,282 | |
| Biotechnology – 0.8% | |
Inhibrx, Inc.* | | | 53,840 | | | | 1,148,407 | |
| Building Products – 1.6% | |
AAON, Inc. | | | 17,251 | | | | 1,128,388 | |
American Woodmark Corp.* | | | 5,608 | | | | 557,772 | |
PGT Innovations, Inc.* | | | 19,455 | | | | 512,250 | |
| | | | | | | | |
| | | | | | | 2,198,410 | |
| Capital Markets – 0.9% | |
B Riley Financial, Inc. | | | 1,433 | | | | 102,159 | |
Cowen, Inc. - Class A | | | 1,406 | | | | 55,523 | |
Evercore, Inc. - Class A | | | 2,245 | | | | 314,592 | |
Federated Hermes, Inc. | | | 5,310 | | | | 152,928 | |
Focus Financial Partners, Inc. - Class A* | | | 2,735 | | | | 128,709 | |
Hamilton Lane, Inc. - Class A | | | 1,866 | | | | 168,780 | |
PJT Partners, Inc. - Class A | | | 1,272 | | | | 93,530 | |
Safeguard Scientifics, Inc.* | | | 1,117 | | | | 6,881 | |
Silvercrest Asset Management Group, Inc. - Class A | | | 509 | | | | 7,080 | |
StepStone Group, Inc. - Class A | | | 1,565 | | | | 52,114 | |
Victory Capital Holdings, Inc. - Class A | | | 866 | | | | 24,031 | |
Virtu Financial, Inc. - Class A | | | 6,528 | | | | 193,425 | |
| | | | | | | | |
| | | | | | | 1,299,752 | |
| Chemicals – 3.7% | |
Ingevity Corp.* | | | 25,977 | | | | 2,028,284 | |
PQ Group Holdings, Inc. | | | 87,519 | | | | 1,225,266 | |
Tronox Holdings PLC - Class A | | | 92,154 | | | | 1,953,665 | |
| | | | | | | | |
| | | | | | | 5,207,215 | |
| Commercial Banks – 1.8% | | | | | | |
1st Constitution Bancorp | | | 548 | | | | 10,511 | |
Ameris Bancorp | | | 3,726 | | | | 201,539 | |
Bancorp, Inc.* | | | 3,080 | | | | 68,391 | |
Bank First Corp.# | | | 405 | | | | 29,290 | |
Business First Bancshares, Inc. | | | 1,081 | | | | 25,695 | |
Byline Bancorp, Inc. | | | 2,063 | | | | 46,830 | |
Cambridge Bancorp | | | 362 | | | | 31,693 | |
Camden National Corp. | | | 786 | | | | 37,508 | |
Central Valley Community Bancorp | | | 656 | | | | 12,884 | |
Coastal Financial Corp.* | | | 630 | | | | 18,755 | |
Eagle Bancorp Montana, Inc. | | | 361 | | | | 8,444 | |
Enterprise Bancorp, Inc. | | | 629 | | | | 21,908 | |
Esquire Financial Holdings, Inc.* | | | 409 | | | | 9,387 | |
Farmers National Banc Corp. | | | 1,505 | | | | 24,953 | |
First Bancorp/Southern Pines | | | 1,496 | | | | 63,430 | |
See Notes to Schedule of Investments and Other Information and Notes to Financial Statements.
Janus Henderson Small Cap Growth Alpha ETF
Schedule of Investments (unaudited)
April 30, 2021
| | | | | | | | |
| | | Shares/ Principal Amounts | | | Value | |
| Common Stocks – (continued) | |
| Commercial Banks – (continued) | | | | | | |
First Bancshares, Inc. | | | 1,128 | | | | $ 44,127 | |
First Bank/Hamilton NJ | | | 1,049 | | | | 13,312 | |
First Choice Bancorp | | | 611 | | | | 19,564 | |
First Foundation, Inc. | | | 2,386 | | | | 56,787 | |
First Western Financial, Inc.* | | | 417 | | | | 10,704 | |
German American Bancorp, Inc. | | | 1,392 | | | | 60,315 | |
Guaranty Bancshares, Inc. | | | 646 | | | | 25,129 | |
Harborone Bancorp, Inc. | | | 3,067 | | | | 43,889 | |
Hilltop Holdings, Inc. | | | 4,390 | | | | 154,528 | |
Horizon Bancorp, Inc. | | | 2,361 | | | | 43,301 | |
Independent Bank Corp. | | | 1,167 | | | | 27,494 | |
Independent Bank Group, Inc. | | | 2,305 | | | | 174,051 | |
Live Oak Bancshares, Inc. | | | 2,234 | | | | 142,887 | |
MainStreet Bancshares, Inc.* | | | 390 | | | | 8,268 | |
Metropolitan Bank Holding Corp.* | | | 433 | | | | 27,214 | |
Mid Penn Bancorp, Inc. | | | 438 | | | | 11,822 | |
MVB Financial Corp. | | | 601 | | | | 24,208 | |
Nicolet Bankshares, Inc.* | | | 536 | | | | 42,751 | |
Northeast Bank | | | 474 | | | | 13,353 | |
Northrim BanCorp, Inc. | | | 328 | | | | 13,989 | |
Parke Bancorp, Inc. | | | 625 | | | | 13,200 | |
Peoples Financial Services Corp. | | | 386 | | | | 16,463 | |
Plumas Bancorp# | | | 269 | | | | 7,142 | |
Preferred Bank | | | 786 | | | | 51,514 | |
QCR Holdings, Inc. | | | 845 | | | | 40,746 | |
RBB Bancorp | | | 1,031 | | | | 21,733 | |
Red River Bancshares, Inc. | | | 391 | | | | 21,755 | |
Reliant Bancorp, Inc. | | | 871 | | | | 24,066 | |
SB Financial Group, Inc.# | | | 389 | | | | 6,948 | |
Seacoast Banking Corp. of Florida* | | | 2,900 | | | | 105,415 | |
ServisFirst Bancshares, Inc. | | | 2,892 | | | | 182,890 | |
Silvergate Capital Corp. - Class A* | | | 1,226 | | | | 131,452 | |
SmartFinancial, Inc. | | | 807 | | | | 19,118 | |
Spirit of Texas Bancshares, Inc. | | | 916 | | | | 21,224 | |
UMB Financial Corp. | | | 2,564 | | | | 248,785 | |
Union Bankshares, Inc./Morrisville VT# | | | 236 | | | | 7,788 | |
Unity Bancorp, Inc. | | | 551 | | | | 12,150 | |
| | | | | | | | |
| | | | | | | 2,501,300 | |
| Commercial Services & Supplies – 0.9% | |
Interface, Inc. | | | 19,374 | | | | 248,762 | |
McGrath RentCorp. | | | 8,003 | | | | 656,086 | |
Steelcase, Inc. - Class A | | | 29,358 | | | | 405,141 | |
| | | | | | | | |
| | | | | | | 1,309,989 | |
| Communications Equipment – 2.7% | |
Ubiquiti, Inc. | | | 13,209 | | | | 3,768,924 | |
| Computers & Peripherals – 2.3% | |
Corsair Gaming, Inc. *,# | | | 95,942 | | | | 3,183,356 | |
| Construction & Engineering – 1.9% | |
Comfort Systems USA, Inc. | | | 11,938 | | | | 983,214 | |
Construction Partners, Inc. - Class A* | | | 11,230 | | | | 356,328 | |
IES Holdings, Inc.* | | | 6,852 | | | | 361,717 | |
NV5 Global, Inc.* | | | 4,370 | | | | 393,868 | |
Primoris Services Corp. | | | 16,247 | | | | 530,627 | |
| | | | | | | | |
| | | | | | | 2,625,754 | |
| Construction Materials – 0.4% | |
United States Lime & Minerals, Inc. | | | 3,614 | | | | 499,383 | |
See Notes to Schedule of Investments and Other Information and Notes to Financial Statements.
| | |
| | Janus Detroit Street Trust ½ 5 |
Janus Henderson Small Cap Growth Alpha ETF
Schedule of Investments (unaudited)
April 30, 2021
| | | | | | | | |
| | | Shares/ Principal Amounts | | | Value | |
| Common Stocks – (continued) | |
| Consumer Finance – 0.0% | |
Enova International, Inc.* | | | 1,910 | | | | $ 65,398 | |
| Containers & Packaging – 0.2% | |
UFP Technologies, Inc.* | | | 4,811 | | | | 240,839 | |
| Distributors – 0.0% | |
Educational Development Corp. | | | 2,204 | | | | 39,187 | |
| Diversified Financial Services – 0.0% | |
Alerus Financial Corp. | | | 919 | | | | 26,421 | |
| Electrical Equipment – 1.7% | |
Array Technologies, Inc.* | | | 41,902 | | | | 1,179,961 | |
Atkore, Inc.* | | | 15,383 | | | | 1,204,181 | |
| | | | | | | | |
| | | | | | | 2,384,142 | |
| Electronic Equipment & Instruments – 3.1% | |
Insight Enterprises, Inc.* | | | 36,633 | | | | 3,676,854 | |
Napco Security Technologies, Inc.* | | | 19,146 | | | | 637,753 | |
| | | | | | | | |
| | | | | | | 4,314,607 | |
| Entertainment – 1.0% | |
Akazoo S.A.*,¢ | | | 2,421 | | | | — | |
Sciplay Corp. - Class A* | | | 4,666 | | | | 82,355 | |
Shutterstock, Inc. | | | 9,574 | | | | 834,662 | |
World Wrestling Entertainment, Inc. - Class A | | | 9,539 | | | | 525,694 | |
| | | | | | | | |
| | | | | | | 1,442,711 | |
| Equity Real Estate Investment Trusts (REITs) – 3.0% | |
CareTrust REIT, Inc. | | | 24,496 | | | | 592,313 | |
Essential Properties Realty Trust, Inc. | | | 27,294 | | | | 714,830 | |
Innovative Industrial Properties, Inc. | | | 6,089 | | | | 1,115,079 | |
National Storage Affiliates Trust | | | 18,008 | | | | 818,283 | |
Safehold, Inc. | | | 13,482 | | | | 953,312 | |
| | | | | | | | |
| | | | | | | 4,193,817 | |
| Food & Staples Retailing – 0.6% | |
Albertsons Cos., Inc. - Class A# | | | 33,925 | | | | 629,987 | |
Sprouts Farmers Market, Inc.* | | | 8,595 | | | | 220,118 | |
| | | | | | | | |
| | | | | | | 850,105 | |
| Food Products – 0.0% | |
Vital Farms, Inc.*,# | | | 2,873 | | | | 69,871 | |
| Health Care Equipment & Supplies – 4.2% | |
LeMaitre Vascular, Inc. | | | 29,040 | | | | 1,523,729 | |
Outset Medical, Inc.* | | | 60,963 | | | | 3,652,903 | |
Zynex, Inc.*,# | | | 49,754 | | | | 734,866 | |
| | | | | | | | |
| | | | | | | 5,911,498 | |
| Health Care Providers & Services – 12.0% | |
Addus HomeCare Corp.* | | | 22,570 | | | | 2,387,906 | |
Castle Biosciences, Inc.* | | | 35,342 | | | | 2,439,658 | |
CorVel Corp.* | | | 25,523 | | | | 2,986,446 | |
Ensign Group, Inc. | | | 51,390 | | | | 4,411,831 | |
Joint Corp.* | | | 20,045 | | | | 1,112,097 | |
National Research Corp. | | | 36,342 | | | | 1,864,345 | |
Pennant Group, Inc.* | | | 40,349 | | | | 1,630,907 | |
| | | | | | | | |
| | | | | | | 16,833,190 | |
| Health Care Technology – 3.1% | |
GoodRx Holdings, Inc. - Class A*,# | | | 62,710 | | | | 2,509,027 | |
Simulations Plus, Inc.# | | | 28,502 | | | | 1,799,616 | |
| | | | | | | | |
| | | | | | | 4,308,643 | |
| Hotels, Restaurants & Leisure – 0.6% | |
Dave & Buster’s Entertainment, Inc.* | | | 12,579 | | | | 574,357 | |
See Notes to Schedule of Investments and Other Information and Notes to Financial Statements.
Janus Henderson Small Cap Growth Alpha ETF
Schedule of Investments (unaudited)
April 30, 2021
| | | | | | | | |
| | | Shares/ Principal Amounts | | | Value | |
| Common Stocks – (continued) | |
| Hotels, Restaurants & Leisure – (continued) | |
Ruth’s Hospitality Group, Inc. | | | 9,214 | | | | $ 240,578 | |
| | | | | | | | |
| | | | | | | 814,935 | |
| Household Durables – 4.7% | |
Cavco Industries, Inc.* | | | 2,428 | | | | 508,496 | |
Century Communities, Inc.* | | | 8,806 | | | | 651,115 | |
Installed Building Products, Inc. | | | 7,821 | | | | 1,053,098 | |
iRobot Corp.* | | | 7,446 | | | | 810,125 | |
Legacy Housing Corp.* | | | 6,388 | | | | 114,090 | |
LGI Homes, Inc.* | | | 6,596 | | | | 1,093,485 | |
M.D.C. Holdings, Inc. | | | 18,493 | | | | 1,084,799 | |
M/I Homes, Inc.* | | | 7,687 | | | | 535,937 | |
Skyline Champion Corp.* | | | 14,955 | | | | 664,451 | |
| | | | | | | | |
| | | | | | | 6,515,596 | |
| Household Products – 0.3% | |
Reynolds Consumer Products, Inc. | | | 15,279 | | | | 447,980 | |
| Insurance – 0.7% | | | | | | |
eHealth, Inc.* | | | 1,365 | | | | 96,560 | |
Enstar Group, Ltd.* | | | 991 | | | | 248,919 | |
Investors Title Co. | | | 97 | | | | 17,114 | |
Mercury General Corp. | | | 2,988 | | | | 186,063 | |
NI Holdings, Inc.* | | | 1,138 | | | | 21,793 | |
Palomar Holdings, Inc.* | | | 1,365 | | | | 96,041 | |
Selectquote, Inc.* | | | 8,705 | | | | 270,987 | |
| | | | | | | | |
| | | | | | | 937,477 | |
| Interactive Media & Services – 0.6% | |
Cargurus, Inc.* | | | 19,949 | | | | 492,341 | |
MediaAlpha, Inc. - Class A* | | | 6,770 | | | | 299,573 | |
| | | | | | | | |
| | | | | | | 791,914 | |
| Internet & Catalog Retail – 0.6% | | | | | | |
1-800-Flowers.com, Inc. - Class A*,# | | | 9,688 | | | | 309,774 | |
PubMatic, Inc. - Class A*,# | | | 1,792 | | | | 92,234 | |
Revolve Group, Inc.* | | | 8,746 | | | | 424,094 | |
| | | | | | | | |
| | | | | | | 826,102 | |
| IT Services – 0.5% | |
GreenSky, Inc. - Class A* | | | 79,749 | | | | 485,671 | |
Paysign, Inc.* | | | 52,017 | | | | 198,705 | |
| | | | | | | | |
| | | | | | | 684,376 | |
| Leisure Equipment & Products – 0.6% | |
Escalade, Inc. | | | 3,691 | | | | 81,276 | |
Johnson Outdoors, Inc. - Class A | | | 2,354 | | | | 333,821 | |
Malibu Boats, Inc. - Class A* | | | 5,482 | | | | 456,979 | |
| | | | | | | | |
| | | | | | | 872,076 | |
| Life Sciences Tools & Services – 3.1% | |
Medpace Holdings, Inc.* | | | 25,935 | | | | 4,400,651 | |
| Machinery – 2.3% | |
Energy Recovery, Inc.* | | | 18,510 | | | | 392,412 | |
Evoqua Water Technologies Corp.* | | | 38,828 | | | | 1,109,704 | |
John Bean Technologies Corp. | | | 10,468 | | | | 1,521,838 | |
Miller Industries, Inc. | | | 3,763 | | | | 161,884 | |
| | | | | | | | |
| | | | | | | 3,185,838 | |
| Media – 0.2% | |
Sinclair Broadcast Group, Inc. - Class A | | | 9,894 | | | | 321,258 | |
| Mortgage Real Estate Investment Trusts (REITs) – 0.2% | |
Dynex Capital, Inc. | | | 1,431 | | | | 28,906 | |
See Notes to Schedule of Investments and Other Information and Notes to Financial Statements.
| | |
| | Janus Detroit Street Trust ½ 7 |
Janus Henderson Small Cap Growth Alpha ETF
Schedule of Investments (unaudited)
April 30, 2021
| | | | | | | | |
| | | Shares/ Principal Amounts | | | Value | |
| Common Stocks – (continued) | |
| Mortgage Real Estate Investment Trusts (REITs) – (continued) | |
Granite Point Mortgage Trust, Inc. | | | 3,010 | | | | $ 39,852 | |
Great Ajax Corp. | | | 1,212 | | | | 14,799 | |
Hannon Armstrong Sustainable Infrastructure Capital, Inc. | | | 4,202 | | | | 220,185 | |
| | | | | | | | |
| | | | | | | 303,742 | |
| Paper & Forest Products – 0.6% | |
Boise Cascade Co. | | | 12,934 | | | | 862,957 | |
| Personal Products – 0.3% | |
BellRing Brands, Inc. - Class A* | | | 2,878 | | | | 74,223 | |
elf Beauty, Inc.* | | | 3,732 | | | | 112,893 | |
Medifast, Inc. | | | 864 | | | | 196,206 | |
| | | | | | | | |
| | | | | | | 383,322 | |
| Pharmaceuticals – 8.1% | |
Corcept Therapeutics, Inc.* | | | 167,482 | | | | 3,816,915 | |
Innoviva, Inc.* | | | 144,754 | | | | 1,657,433 | |
Pacira BioSciences, Inc.* | | | 57,315 | | | | 3,621,162 | |
Supernus Pharmaceuticals, Inc.* | | | 75,216 | | | | 2,290,327 | |
| | | | | | | | |
| | | | | | | 11,385,837 | |
| Professional Services – 2.2% | |
Barrett Business Services, Inc. | | | 2,534 | | | | 185,818 | |
BGSF, Inc. | | | 3,403 | | | | 47,676 | |
Insperity, Inc. | | | 12,607 | | | | 1,103,617 | |
TriNet Group, Inc.* | | | 21,773 | | | | 1,713,753 | |
| | | | | | | | |
| | | | | | | 3,050,864 | |
| Road & Rail – 0.3% | |
Marten Transport, Ltd. | | | 27,353 | | | | 457,342 | |
| Semiconductors & Semiconductor Equipment – 7.4% | |
ACM Research, Inc. - Class A* | | | 17,634 | | | | 1,392,204 | |
Amkor Technology, Inc. | | | 176,334 | | | | 3,565,473 | |
FormFactor, Inc.* | | | 81,139 | | | | 3,176,592 | |
Ultra Clean Holdings, Inc.* | | | 42,383 | | | | 2,164,500 | |
| | | | | | | | |
| | | | | | | 10,298,769 | |
| Software – 13.0% | |
Alarm.com Holdings, Inc.* | | | 47,935 | | | | 4,302,645 | |
Appfolio, Inc. - Class A* | | | 18,887 | | | | 2,731,627 | |
Bentley Systems, Inc. - Class B | | | 94,964 | | | | 4,862,157 | |
Ebix, Inc. | | | 32,311 | | | | 972,884 | |
Intelligent Systems Corp.*,# | | | 9,273 | | | | 355,341 | |
Mitek Systems, Inc.*,# | | | 44,548 | | | | 722,123 | |
ShotSpotter, Inc.* | | | 12,006 | | | | 419,490 | |
SPS Commerce, Inc.* | | | 37,134 | | | | 3,804,007 | |
| | | | | | | | |
| | | | | | | 18,170,274 | |
| Specialty Retail – 3.2% | |
America’s Car-Mart, Inc.* | | | 1,717 | | | | 258,975 | |
Asbury Automotive Group, Inc.* | | | 5,092 | | | | 1,011,322 | |
Boot Barn Holdings, Inc.* | | | 7,657 | | | | 540,125 | |
Leslie’s, Inc.* | | | 49,344 | | | | 1,402,357 | |
MarineMax, Inc.* | | | 5,844 | | | | 331,939 | |
OneWater Marine, Inc. - Class A* | | | 2,869 | | | | 146,979 | |
Sleep Number Corp.* | | | 6,705 | | | | 750,222 | |
| | | | | | | | |
| | | | | | | 4,441,919 | |
| Thrifts & Mortgage Finance – 0.8% | |
Axos Financial, Inc.* | | | 3,154 | | | | 142,403 | |
Bridgewater Bancshares, Inc.* | | | 1,503 | | | | 25,416 | |
FS Bancorp, Inc. | | | 227 | | | | 15,515 | |
Hingham Institution For Savings | | | 107 | | | | 32,543 | |
Merchants Bancorp | | | 1,508 | | | | 61,511 | |
See Notes to Schedule of Investments and Other Information and Notes to Financial Statements.
Janus Henderson Small Cap Growth Alpha ETF
Schedule of Investments (unaudited)
April 30, 2021
| | | | | | | | |
| | | Shares/ Principal Amounts | | | Value | |
| Common Stocks – (continued) | |
| Thrifts & Mortgage Finance – (continued) | |
Meta Financial Group, Inc. | | | 1,697 | | | | $ 83,594 | |
NMI Holdings, Inc. - Class A* | | | 4,557 | | | | 117,753 | |
PennyMac Financial Services, Inc. | | | 3,700 | | | | 222,777 | |
Rocket Cos., Inc. - Class A# | | | 6,165 | | | | 138,404 | |
Southern Missouri Bancorp, Inc. | | | 475 | | | | 19,898 | |
Timberland Bancorp, Inc. | | | 434 | | | | 12,213 | |
Walker & Dunlop, Inc. | | | 1,668 | | | | 184,898 | |
| | | | | | | | |
| | | | | | | 1,056,925 | |
| Trading Companies & Distributors – 0.5% | |
GMS, Inc.* | | | 14,082 | | | | 615,524 | |
Transcat, Inc.* | | | 2,457 | | | | 122,850 | |
| | | | | | | | |
| | | | | | | | 738,374 | |
Total Common Stocks (cost $129,020,571) | | | | | | | 140,064,167 | |
| Investment Companies – 0.0% | |
| Money Markets – 0.0% | |
State Street Institutional U.S. Government Money Market Fund, 0.0259%ºº
(Cost $1) | | | 1 | | | | 1 | |
| Investments Purchased with Cash Collateral from Securities Lending – 4.0% | |
| Investment Companies – 3.2% | |
Janus Henderson Cash Collateral Fund LLC, 0.0011%ºº,£ | | | 4,453,033 | | | | 4,453,033 | |
| Time Deposits – 0.8% | |
Royal Bank of Canada, 0.0100%, 5/3/2021 | | | $1,113,258 | | | | 1,113,258 | |
Total Investments Purchased with Cash Collateral from Securities Lending
(cost $5,566,291) | | | | | | | 5,566,291 | |
Total Investments (total cost $134,586,863) – 104.0% | | | | | | | 145,630,459 | |
Liabilities, net of Cash, Receivables and Other Assets – (4.0%) | | | | | | | (5,657,190) | |
Net Assets – 100% | | | | | | | $139,973,269 | |
Summary of Investments by Country – (Long Positions) (unaudited)
| | | | | | | | |
| Country | | Value | | | % of
Investment
Securities | |
United States | | | $143,427,875 | | | | 98.5% | |
United Kingdom | | | 1,953,665 | | | | 1.3 | |
Bermuda | | | 248,919 | | | | 0.2 | |
Total | | | $145,630,459 | | | | 100.0% | |
Schedules of Affiliated Investments – (% of Net Assets)
| | | | | | | | | | | | | | | | |
| | | Dividend Income | | | Realized
Gain/(Loss) | | | Change in
Unrealized
Appreciation/
(Depreciation) | | | Value at
4/30/21 | |
| Investments Purchased with Cash Collateral from Securities Lending – 4.0% | | | | | | | |
| Investment Companies – 3.2% | | | | | | | |
Janus Henderson Cash Collateral Fund LLC, 0.0011%ºº | | | $6,875 | D | | | $ — | | | | $ — | | | | $4,453,033 | |
| | | | |
| | | Market Value
at 10/31/20 | | | Purchases | | | Sales | | | Market Value
at 4/30/21 | |
| Investments Purchased with Cash Collateral from Securities Lending – 4.0% | | | | | | | |
| Investment Companies – 3.2% | | | | | | | |
Janus Henderson Cash Collateral Fund LLC, 0.0011%ºº | | | $1,270,759 | | | | $24,116,552 | | | | $(20,934,278) | | | | $4,453,033 | |
See Notes to Schedule of Investments and Other Information and Notes to Financial Statements.
| | |
| | Janus Detroit Street Trust ½ 9 |
Janus Henderson Small Cap Growth Alpha ETF
Notes to Schedule of Investments and Other Information (unaudited)
April 30, 2021
| | |
Janus Henderson Small Cap
Growth Alpha Index | | Janus Henderson Small Cap Growth Alpha Index is designed to systematically identify small-capitalization stocks that are poised for sustainable growth (Smart Growth®) by evaluating each company’s performance in three critical areas: growth, profitability, and capital efficiency. A proprietary methodology is used to score stocks based on a wide range of fundamental measures and select the top 10% (“top-tier”) of such eligible stocks. Stocks are market cap-weighted within sectors with a 3% maximum position size; sectors are weighted to align with the Janus Henderson Venture Fund. |
| |
| Russell 2000® Growth Index | | Russell 2000® Growth Index reflects the performance of U.S. small-cap equities with higher price-to-book ratios and higher forecasted growth values. |
| |
| LLC | | Limited Liability Company |
| * | Non-income producing security. |
| ¢ | Security is valued using significant unobservable inputs. |
| # | Loaned security; a portion of the security is on loan at April 30, 2021. |
| ºº | Rate shown is the 7-day yield as of April 30, 2021. |
| £ | The Fund may invest in certain securities that are considered affiliated companies. As defined by the Investment Company Act of 1940, as amended, an affiliated company is one in which the Fund owns 5% or more of the outstanding voting securities, or a company which is under common ownership or control. |
| D | Net of income paid to the securities lending agent and rebates paid to the borrowing counterparties. |
The following is a summary of the inputs that were used to value the Fund’s investments in securities and other financial instruments as of April 30, 2021. See Notes to Financial Statements for more information.
Valuation Inputs Summary
| | | | | | | | | | | | |
| | | Level 1 -
Quoted Prices | | | Level 2 -
Other Significant
Observable Inputs | | | Level 3 -
Significant
Unobservable Inputs | |
| | | |
Assets | | | | | | | | | | | | |
| | | |
Investments in Securities: | | | | | | | | | | | | |
| | | |
Common Stocks | | | | | | | | | | | | |
| | | |
Entertainment(a) | | $ | 1,442,711 | | | $ | — | | | $ | 0 | |
| | | |
All Other | | | 138,621,456 | | | | — | | | | — | |
| | | |
Investment Companies | | | 1 | | | | — | | | | — | |
| | | |
Investments Purchased with Cash Collateral from Securities Lending | | | — | | | | 5,566,291 | | | | — | |
| | | | |
| | | |
Total Assets | | $ | 140,064,168 | | | $ | 5,566,291 | | | $ | 0 | |
| (a) | There is a security in this category that has a market value of zero. |
Janus Henderson Small Cap Growth Alpha ETF
Statement of Assets and Liabilities (unaudited)
April 30, 2021
| | | | |
Assets: | | | | |
Unaffiliated investments, at value(1)(2) | | $ | 141,177,426 | |
Affiliated investments, at value(3) | | | 4,453,033 | |
Receivables: | | | | |
Dividends | | | 7,292 | |
Affiliated securities lending income, net | | | 2,361 | |
Total Assets | | | 145,640,112 | |
Liabilities: | | | | |
Collateral on securities loaned (Note 2) | | | 5,566,291 | |
Payables: | | | | |
Due to custodian | | | 65,206 | |
Management fees | | | 35,346 | |
Total Liabilities | | | 5,666,843 | |
Net Assets | | $ | 139,973,269 | |
Net Assets Consists of: | | | | |
Capital (par value and paid-in surplus) | | $ | 121,003,567 | |
Total distributable earnings (loss) | | | 18,969,702 | |
Total Net Assets | | $ | 139,973,269 | |
Net Assets | | $ | 139,973,269 | |
Shares outstanding, $0.001 Par Value (unlimited shares authorized) | | | 2,052,000 | |
Net Asset Value Per Share | | $ | 68.21 | |
| (1) | Includes cost of $130,133,830. |
| (2) | Includes $5,441,246 of securities on loan. See Note 2 in Notes to Financial Statements. |
| (3) | Includes cost of $4,453,033. |
See Notes to Financial Statements.
| | |
| | Janus Detroit Street Trust ½ 11 |
Janus Henderson Small Cap Growth Alpha ETF
Statement of Operations (unaudited)
For the period ended April 30, 2021
| | | | |
Investment Income: | |
Dividends | | $ | 423,362 | |
Affiliated securities lending income, net | | | 6,875 | |
Unaffiliated securities lending income, net | | | 326 | |
Total Investment Income | | | 430,563 | |
Expenses: | |
Management Fees | | | 154,404 | |
Total Expenses | | | 154,404 | |
Net Investment Income/(Loss) | | | 276,159 | |
Net Realized Gain/(Loss) on Investments: | |
Investments | | $ | 16,492,615 | |
Total Net Realized Gain/(Loss) on Investments | | $ | 16,492,615 | |
Change in Unrealized Net Appreciation/Depreciation: | |
Investments | | $ | 6,989,143 | |
Total Change in Unrealized Net Appreciation/Depreciation | | $ | 6,989,143 | |
Net Increase/(Decrease) in Net Assets Resulting from Operations | | $ | 23,757,917 | |
See Notes to Financial Statements.
Janus Henderson Small Cap Growth Alpha ETF
Statements of Changes in Net Assets
| | | | | | | | |
| | | Period Ended April 30, 2021 (unaudited) | | | Year Ended
October 31, 2020 | |
Operations: | |
Net investment income/(loss) | | $ | 276,159 | | | $ | 105,154 | |
Net realized gain/(loss) on investments | | | 16,492,615 | | | | 1,153,996 | |
Change in unrealized net appreciation/depreciation | | | 6,989,143 | | | | 3,334,623 | |
Net Increase/(Decrease) in Net Assets Resulting from Operations | | | 23,757,917 | | | | 4,593,773 | |
Dividends and Distributions to Shareholders: | |
Dividends and Distributions | | | (260,026) | | | | (106,543) | |
Net Decrease from Dividends and Distributions to Shareholders | | | (260,026) | | | | (106,543) | |
Capital Share Transactions | | | 63,517,797 | | | | 13,907,055 | |
Net Increase/(Decrease) in Net Assets | | | 87,015,688 | | | | 18,394,285 | |
Net Assets: | |
Beginning of period | | | 52,957,581 | | | | 34,563,296 | |
End of period | | $ | 139,973,269 | | | $ | 52,957,581 | |
See Notes to Financial Statements.
| | |
| | Janus Detroit Street Trust ½ 13 |
Janus Henderson Small Cap Growth Alpha ETF
Financial Highlights
| | | | | | | | | | | | | | | | | | | | | | | | | | |
For a share outstanding during the period ended April 30, 2021
(unaudited) and each year or period ended October 31 | | 2021 | | | 2020 | | | 2019 | | | 2018 | | | 2017 | | | 2016(1) | |
| | Net Asset Value, Beginning of Period | | | $48.06 | | | | $43.10 | | | | $39.59 | | | | $36.05 | | | | $28.17 | | | | $24.83 | |
| | Income/(Loss) from Investment Operations: | |
| | Net investment income/(loss)(2) | | | 0.18 | | | | 0.10 | | | | 0.20 | | | | 0.20 | | | | 0.13 | | | | 0.26 | |
| | Net realized and unrealized gain/(loss) | | | 20.16 | | | | 4.97 | | | | 3.51 | | | | 3.57 | | | | 7.97 | | | | 3.10 | |
| | Total from Investment Operations | | | 20.34 | | | | 5.07 | | | | 3.71 | | | | 3.77 | | | | 8.10 | | | | 3.36 | |
| | Less Dividends and Distributions: | |
| | Dividends (from net investment income) | | | (0.19) | | | | (0.11) | | | | (0.20) | | | | (0.23) | | | | (0.22) | | | | (0.02) | |
| | Total Dividends and Distributions | | | (0.19) | | | | (0.11) | | | | (0.20) | | | | (0.23) | | | | (0.22) | | | | (0.02) | |
| | Net Asset Value, End of Period | | | $68.21 | | | | $48.06 | | | | $43.10 | | | | $39.59 | | | | $36.05 | | | | $28.17 | |
| | Total Return* | | | 42.35% | | | | 11.79% | | | | 9.43% | | | | 10.49%(3) | | | | 28.86% | | | | 13.54% | |
| | Net assets, End of Period (in thousands) | | | $139,973 | | | | $52,958 | | | | $34,563 | | | | $25,816 | | | | $9,083 | | | | $4,282 | |
| | Average Net Assets for the Period (in thousands) | | | $102,520 | | | | $45,900 | | | | $30,102 | | | | $17,444 | | | | $7,068 | | | | $3,247 | |
| | Ratios to Average Net Assets**: | |
| | Ratio of Gross Expenses | | | 0.30% | | | | 0.32% | | | | 0.35% | | | | 0.50% | | | | 0.50% | | | | 0.50% | |
| | Ratio of Net Investment Income/(Loss) | | | 0.54% | | | | 0.23% | | | | 0.49% | | | | 0.50% | | | | 0.41% | | | | 1.37% | |
| | Portfolio Turnover Rate(4) | | | 69% | | | | 78% | | | | 104% | | | | 84% | | | | 117% | | | | 86% | |
| * | Total return not annualized for periods of less than one full year. |
| ** | Annualized for periods of less than one full year. |
| (1) | Period from February 23, 2016 (commencement of operations) through October 31, 2016. |
| (2) | Per share amounts are calculated based on average shares outstanding during the year or period. |
| (3) | The return includes adjustments in accordance with generally accepted accounting principles required at period end date. |
| (4) | Portfolio turnover rate excludes securities received or delivered from in-kind processing of creation or redemptions. |
See Notes to Financial Statements.
Janus Henderson Small Cap Growth Alpha ETF
Notes to Financial Statements (unaudited)
1. Organization and Significant Accounting Policies
Janus Henderson Small Cap Growth Alpha ETF (the “Fund”) is a series fund. The Fund is part of Janus Detroit Street Trust (the “Trust”), which is organized as a Delaware statutory trust and is registered under the Investment Company Act of 1940, as amended (the “1940 Act”), as an open-end management investment company, and therefore has applied the specialized accounting and reporting guidance in Financial Accounting Standards Board (“FASB”) Accounting Standards Codification (“ASC”) Topic 946. As of the date of this report, the Trust offers six Funds each of which represent shares of beneficial interest in a separate portfolio of securities and other assets with its own objective and policies. The Fund seeks investment results that correspond generally, before fees and expenses, to the performance of its underlying index, the Janus Henderson Small Cap Growth Alpha Index (the “Underlying Index”). The Fund is classified as diversified, as defined in the 1940 Act.
Unlike shares of traditional mutual funds, shares of the Fund are not individually redeemable and may only be purchased or redeemed directly from the Fund at net asset value (“NAV”) in large increments called “Creation Units” by certain participants, known as “Authorized Participants.” The size of a Creation Unit to purchase shares of the Fund may differ from the size of a Creation Unit to redeem shares of the Fund. The Fund will issue or redeem Creation Units in exchange for portfolio securities and/or cash. Except when aggregated in Creation Units, Fund shares are not redeemable securities of the Fund. Shares of the Fund are listed and trade on The NASDAQ Stock Market LLC (“NASDAQ”) and individual investors can purchase or sell shares in much smaller increments and for cash in the secondary market through a broker. These transactions, which do not involve the Fund, are made at market prices that may vary throughout the day and differ from the Fund’s NAV. As a result, you may pay more than NAV (a premium) when you purchase shares and receive less than NAV (a discount) when you sell shares, in the secondary market.
An Authorized Participant (or other broker-dealers making markets in shares of the Fund) may hold of record more than 25% of the outstanding shares of the Fund. From time to time, Authorized Participants (or other broker-dealers making markets in shares of the Fund) may be a beneficial and/or legal owner of the Fund, may be affiliated with an index provider, may be deemed to have control of the Fund and/or may be able to affect the outcome of matters presented for a vote of the shareholders of the Fund. Authorized Participants (or other broker-dealers making markets in shares of the Fund) may execute an irrevocable proxy granting the Distributor, Janus Capital Management LLC (“Janus Capital” or “Janus”) or an affiliate of Janus Capital power to vote or abstain from voting such Authorized Participant’s beneficially or legally owned shares of the Fund. In such cases, the agent shall mirror vote (or abstain from voting) such shares in the same proportion as all other beneficial owners of the Fund.
The following accounting policies have been followed by the Fund and are in conformity with United States of America generally accepted accounting principles (“US GAAP”).
Investment Valuation
Securities held by the Fund are valued in accordance with policies and procedures established by and under the supervision of the Trustees (the “Valuation Procedures”). Equity securities, including shares of exchange-traded funds, traded on a domestic securities exchange are generally valued at the closing prices on the primary market or exchange on which they trade. If such price is lacking for the trading period immediately preceding the time of determination, such securities are valued at their current bid price. Equity securities that are traded on a foreign exchange are generally valued at the closing prices on such markets. In the event that there is no current trading volume on a particular security in such foreign exchange, the bid price from the primary exchange is generally used to value the security. Securities that are traded on the over-the-counter (“OTC”) markets are generally valued at their closing or latest bid prices as available. Foreign securities and currencies are converted to U.S. dollars using the applicable exchange rate in effect at the close of the London Stock Exchange. The Fund will determine the market value of individual securities held by it by using prices provided by one or more approved professional pricing services or, as needed, by obtaining market quotations from independent broker-dealers. Most debt securities are valued in accordance with the evaluated bid price supplied by the pricing service that is intended to reflect market value. The evaluated bid price supplied by the pricing service is an evaluation that may consider factors such as security prices, yields, maturities and ratings. Certain short-term securities maturing within 60 days or less may be evaluated and valued on an amortized cost basis provided that the amortized cost determined approximates market value. Securities for which market quotations or evaluated prices are not readily available or are deemed unreliable, are valued at fair value determined in good faith under the Valuation Procedures. Circumstances in which fair value pricing may be utilized include, but are not limited to: (i) a significant event that may affect the securities of a single issuer, such as a merger, bankruptcy, or significant issuer-specific development; (ii) an event that may affect an entire market, such as a natural disaster or significant governmental action; (iii) a nonsignificant event such as a market closing early or not opening, or a security trading halt; and (iv) pricing of a nonvalued security and a restricted or nonpublic security. Special valuation considerations may apply with respect to “odd-lot” fixed-income
| | |
| | Janus Detroit Street Trust ½ 15 |
Janus Henderson Small Cap Growth Alpha ETF
Notes to Financial Statements (unaudited)
transactions which, due to their small size, may receive evaluated prices by pricing services which reflect a large block trade and not what actually could be obtained for the odd-lot position.
Valuation Inputs Summary
FASB ASC 820, Fair Value Measurements and Disclosures (“ASC 820”), defines fair value, establishes a framework for measuring fair value, and expands disclosure requirements regarding fair value measurements. This standard emphasizes that fair value is a market-based measurement that should be determined based on the assumptions that market participants would use in pricing an asset or liability and establishes a hierarchy that prioritizes inputs to valuation techniques used to measure fair value. These inputs are summarized into three broad levels:
Level 1 – Unadjusted quoted prices in active markets the Fund has the ability to access for identical assets or liabilities.
Level 2 – Observable inputs other than unadjusted quoted prices included in Level 1 that are observable for the asset or liability either directly or indirectly. These inputs may include quoted prices for the identical instrument on an inactive market, prices for similar instruments, interest rates, prepayment speeds, credit risk, yield curves, default rates and similar data.
Assets or liabilities categorized as Level 2 in the hierarchy generally include: debt securities fair valued in accordance with the evaluated bid or ask prices supplied by a pricing service; securities traded on OTC markets and listed securities for which no sales are reported that are fair valued at the latest bid price (or yield equivalent thereof) obtained from one or more dealers transacting in a market for such securities or by a pricing service approved by the Fund’s Trustees; and certain short-term debt securities with maturities of 60 days or less that are fair valued at amortized cost. Other securities that may be categorized as Level 2 in the hierarchy include, but are not limited to, preferred stocks, bank loans, swaps, investments in unregistered investment companies, options, and forward contracts.
Level 3 – Unobservable inputs for the asset or liability to the extent that relevant observable inputs are not available, representing the Fund’s own assumptions about the assumptions that a market participant would use in valuing the asset or liability, and that would be based on the best information available.
There have been no significant changes in valuation techniques used in valuing any such positions held by the Fund since the beginning of the fiscal year.
The inputs or methodology used for fair valuing securities are not necessarily an indication of the risk associated with investing in those securities. The summary of inputs used as of April 30, 2021 to fair value the Fund’s investments in securities and other financial instruments is included in the “Valuation Inputs Summary” in the Notes to Schedule of Investments and Other Information.
Investment Transactions and Investment Income
Investment transactions are accounted for as of the date purchased or sold (trade date). Dividend income is recorded on the ex-dividend date. Certain dividends from foreign securities will be recorded as soon as the Fund is informed of the dividend, if such information is obtained subsequent to the ex-dividend date. Dividends from foreign securities may be subject to withholding taxes in foreign jurisdictions. Interest income is recorded daily on an accrual basis and includes amortization of premiums and accretion of discounts. The Fund classifies gains and losses on prepayments received as an adjustment to interest income. Debt securities may be placed in non-accrual status and related interest income may be reduced by stopping current accruals and writing off interest receivables when collection of all or a portion of interest has become doubtful. Gains and losses are determined on the identified cost basis, which is the same basis used for federal income tax purposes.
Estimates
The preparation of financial statements in conformity with US GAAP requires management to make estimates and assumptions that affect the reported amount of assets and liabilities and disclosure of contingent assets and liabilities at the date of the financial statements, and the reported amounts of income and expenses during the reporting period. Actual results could differ from those estimates.
Indemnifications
In the normal course of business, the Fund may enter into contracts that contain provisions for indemnification of other parties against certain potential liabilities. The Fund’s maximum exposure under these arrangements is unknown and would involve future claims that may be made against the Fund that have not yet occurred. Currently, the risk of material loss from such claims is considered remote.
Janus Henderson Small Cap Growth Alpha ETF
Notes to Financial Statements (unaudited)
Dividends and Distributions
The Fund generally declares and distributes dividends of net investment income quarterly. Net realized capital gains (if any) are distributed annually. The Fund may treat a portion of the amount paid to redeem shares as a distribution of investment company taxable income and realized capital gains that are reflected in the NAV. This practice, commonly referred to as “equalization,” has no effect on the redeeming shareholder or a Fund’s total return but may reduce the amounts that would otherwise be required to be paid as taxable dividends to the remaining shareholders. It is possible that the Internal Revenue Service (IRS) could challenge the Fund’s equalization methodology or calculations, and any such challenge could result in additional tax, interest, or penalties to be paid by the Fund.
The Fund may make certain investments in real estate investment trusts (“REITs”) which pay dividends to their shareholders based upon funds available from operations. It is quite common for these dividends to exceed the REITs’ taxable earnings and profits, resulting in the excess portion of such dividends being designated as a return of capital. If the Fund distributes such amounts, such distributions could constitute a return of capital to shareholders for federal income tax purposes.
Federal Income Taxes
The Fund intends to continue to qualify as a regulated investment company and distribute all of its taxable income in accordance with the requirements of Subchapter M of the Internal Revenue Code. Management has analyzed the Fund’s tax positions taken for all open federal income tax years, generally a three-year period, and has concluded that no provision for federal income tax is required in the Fund’s financial statements. The Fund is not aware of any tax positions for which it is reasonably possible that the total amounts of unrecognized tax benefits will significantly change in the next twelve months.
2. Other Investments and Strategies
Additional Investment Risk
In response to the COVID-19 pandemic, the U.S. government and the Federal Reserve, as well as certain foreign governments and central banks, have taken extraordinary actions to support local and global economies and the financial markets, including reducing interest rates to record low levels. Extremely low or negative interest rates may become more prevalent or may not work as intended. As there is little precedent for this situation, the impact on various markets that interest rate or other significant policy changes may have is unknown. The withdrawal of this support, a failure of measures put in place in response to such economic uncertainty, or investor perception that such efforts were not sufficient could each negatively affect financial markets generally, and the value and liquidity of specific securities. In addition, policy and legislative changes in the United States and in other countries continue to impact many aspects of financial regulation.
Widespread disease, including pandemics and epidemics, and natural or environmental disasters, including those which may be attributable to global climate change, such as earthquakes, fires, floods, hurricanes, tsunamis and weather-related phenomena generally, have been and can be highly disruptive to economies and markets, adversely impacting individual companies, sectors, industries, markets, currencies, interest and inflation rates, credit ratings, investor sentiment, and other factors affecting the value of a Fund’s investments. Economies and financial markets throughout the world have become increasingly interconnected, which increases the likelihood that events or conditions in one region or country will adversely affect markets or issuers in other regions or countries, including the United States. These disruptions could prevent a Fund from executing advantageous investment decisions in a timely manner and negatively impact a Fund’s ability to achieve its investment objective(s). Any such event(s) could have a significant adverse impact on the value of a Fund. In addition, these disruptions could also impair the information technology and other operational systems upon which the Fund’s service providers, including Janus Capital, rely, and could otherwise disrupt the ability of employees of the Fund’s service providers to perform essential tasks on behalf of the Fund. Adverse weather conditions may also have a particularly significant negative effect on issuers in the agricultural sector and on insurance and reinsurance companies that insure or reinsure against the impact of natural disasters.
A number of countries in the European Union (the “EU”) have experienced, and may continue to experience, severe economic and financial difficulties. In particular, many EU nations are susceptible to economic risks associated with high levels of debt. Many non-governmental issuers, and even certain governments, have defaulted on, or been forced to restructure, their debts. Many other issuers have faced difficulties obtaining credit or refinancing existing obligations. Financial institutions have in many cases required government or central bank support, have needed to raise capital, and/or have been impaired in their ability to extend credit. As a result, financial markets in the EU have experienced extreme volatility and declines in asset values and liquidity. These difficulties may continue, worsen, or spread further within the EU. Responses to these financial problems by European governments, central banks, and others, including austerity
| | |
| | Janus Detroit Street Trust ½ 17 |
Janus Henderson Small Cap Growth Alpha ETF
Notes to Financial Statements (unaudited)
measures and reforms, may not work, may result in social unrest, and may limit future growth and economic recovery or have other unintended consequences. The risk of investing in securities in the European markets may also be heightened due to the referendum in which the United Kingdom voted to exit the EU commonly known as “Brexit,” which immediately led to significant market volatility around the world, as well as political, economic and legal uncertainty. The United Kingdom formally left the EU on January 31, 2020 and entered into an eleven-month transition period, which expired on December 31, 2020. The negative impact on not only the United Kingdom and European economies could be significant, potentially resulting in increased volatility and illiquidity and lower economic growth for companies that rely significantly on the United Kingdom and/or Europe for their business activities and revenues. Any further exits from the EU, or an increase in the belief that such exits are likely or possible, would likely cause additional market disruption globally and introduce new legal and regulatory uncertainties.
Passive Investment Risk
The Fund is not actively managed and therefore the Fund might not sell shares of a security due to current or projected underperformance of a security, industry or sector, unless that security is removed from the Underlying Index or the selling of shares is otherwise required upon a rebalancing of the Underlying Index.
Small-Sized Companies Risk
The Fund’s investments in securities issued by small-sized companies, which can include smaller, start-up companies offering emerging products or services, may involve greater risks than are customarily associated with larger, more established companies. Securities issued by small-sized companies tend to be more volatile and somewhat more speculative than securities issued by larger or more established companies and may underperform as compared to the securities of larger companies. Securities issued by micro-capitalization companies tend to be significantly more volatile, and more vulnerable to adverse business and economic developments, than those of larger companies. For example, small- and micro-capitalization companies may be more likely to merge with or be acquired by another company, resulting in de-listing of the securities held by the Fund.
Counterparties
Fund transactions involving a counterparty are subject to the risk that the counterparty or a third party will not fulfill its obligation to the Fund (“counterparty risk”). Counterparty risk may arise because of the counterparty’s financial condition (i.e., financial difficulties, bankruptcy, or insolvency), market activities and developments, or other reasons, whether foreseen or not. A counterparty’s inability to fulfill its obligation may result in significant financial loss to the Fund. The Fund may be unable to recover its investment from the counterparty or may obtain a limited recovery, and/or recovery may be delayed. The extent of the Fund’s exposure to counterparty risk with respect to financial assets and liabilities approximates its carrying value. See the “Offsetting Assets and Liabilities” section of this Note for further details.
The Fund may be exposed to counterparty risk through participation in various programs, including, but not limited to, lending its securities to third parties, cash sweep arrangements whereby the Fund’s cash balance is invested in one or more types of cash management vehicles, as well as investments in, but not limited to, repurchase agreements, and derivatives, including various types of swaps, futures and options. The Fund intends to enter into financial transactions with counterparties that Janus Capital believes to be creditworthy at the time of the transaction. There is always the risk that Janus Capital’s analysis of a counterparty’s creditworthiness is incorrect or may change due to market conditions. To the extent that the Fund focuses its transactions with a limited number of counterparties, it will have greater exposure to the risks associated with one or more counterparties.
Offsetting Assets and Liabilities
The Fund presents gross and net information about transactions that are either offset in the financial statements or subject to an enforceable master netting arrangement or similar agreement with a designated counterparty, regardless of whether the transactions are actually offset in the Statement of Assets and Liabilities.
JPMorgan Chase Bank, National Association acts as securities lending agent and a limited purpose custodian or subcustodian to receive and disburse cash balances and cash collateral, hold short-term investments, hold collateral, and perform other custodial functions in accordance with the Non-Custodial Securities Lending Agreement. For financial reporting purposes, the Fund does not offset financial instruments’ payables and receivables and related collateral on the Statement of Assets and Liabilities. Securities on loan will be continuously secured by collateral which may consist of cash, U.S. Government securities, domestic and foreign short-term debt instruments, letters of credit, time deposits, repurchase agreements, money market mutual funds or other money market accounts, or such other collateral as permitted by the Securities and Exchange Commission (the “SEC”). See “Securities Lending” in the “Notes to Financial Statements” for additional information.
Janus Henderson Small Cap Growth Alpha ETF
Notes to Financial Statements (unaudited)
The following table presents gross amounts of recognized assets and/or liabilities and the net amounts after deducting collateral that has been pledged by counterparties or has been pledged to counterparties (if applicable). For corresponding information grouped by type of instrument, see the Fund’s Schedule of Investments.
Offsetting of Financial Assets and Derivative Assets
| | | | | | | | | | | | | | | | | | |
| Counterparty | | | Gross Amounts of
Recognized Assets | | | Offsetting Asset
or Liability(a) | | | Collateral
Pledged(b) | | | Net Amount | |
| | JPMorgan Chase Bank NA | | | $ | 5,441,246 | | | $ | — | | | $ | (5,441,246) | | | $ | — | |
| (a) | Represents the amount of assets or liabilities that could be offset with the same counterparty under master netting or similar agreements that management elects not to offset on the Statement of Assets and Liabilities. |
| (b) | Collateral pledged is limited to the net outstanding amount due to/from an individual counterparty. The actual collateral amounts pledged may exceed these amounts and may fluctuate in value. |
Real Estate Investing
The Fund may invest in equity securities of real estate-related companies to the extent such securities are included in the Underlying Index. Such companies may include those in the real estate industry or real estate-related industries. These securities may include common stocks, preferred stocks, and other equity securities, including, but not limited to, mortgage-backed securities, real estate-backed securities, securities of REITs and similar REIT-like entities. A REIT is a trust that invests in real estate-related projects, such as properties, mortgage loans, and construction loans. REITs are generally categorized as equity, mortgage, or hybrid REITs. A REIT may be listed on an exchange or traded OTC.
Securities Lending
Under procedures adopted by the Trustees, the Fund may seek to earn additional income by lending securities to certain qualified broker-dealers and institutions. JP Morgan Chase Bank, National Association acts as securities lending agent and a limited purpose custodian or subcustodian to receive and disburse cash balances and cash collateral, hold short-term investments, hold collateral, and perform other custodial functions in accordance with the Non-Custodial Securities Lending Agreement. The Fund may lend fund securities in an amount equal to up to 1/3 of its total assets as determined at the time of the loan origination. There is the risk of delay in recovering a loaned security or the risk of loss in collateral rights if the borrower fails financially. In addition, Janus Capital makes efforts to balance the benefits and risks from granting such loans. All loans will be continuously secured by collateral which may consist of cash, U.S. Government securities, domestic and foreign short-term debt instruments, letters of credit, time deposits, repurchase agreements, money market mutual funds or other money market accounts, or such other collateral as permitted by the SEC. If the Fund is unable to recover a security on loan, the Fund may use the collateral to purchase replacement securities in the market. There is a risk that the value of the collateral could decrease below the cost of the replacement security by the time the replacement investment is made, resulting in a loss to the Fund. In certain circumstances individual loan transactions could yield negative returns.
Upon receipt of cash collateral, Janus Capital may invest it in affiliated or non-affiliated cash management vehicles, whether registered or unregistered entities, as permitted by the 1940 Act and rules promulgated thereunder. Janus Capital currently intends to invest the cash collateral in a cash management vehicle for which Janus Capital serves as investment adviser, Janus Henderson Cash Collateral Fund LLC, or in time deposits. An investment in Janus Henderson Cash Collateral Fund LLC is generally subject to the same risks that shareholders experience when investing in similarly structured vehicles, such as the potential for significant fluctuations in assets as a result of the purchase and redemption activity of the securities lending program, a decline in the value of the collateral, and possible liquidity issues. Such risks may delay the return of the cash collateral and cause the Fund to violate its agreement to return the cash collateral to a borrower in a timely manner. As adviser to the Fund and Janus Henderson Cash Collateral Fund LLC, Janus Capital has an inherent conflict of interest as a result of its fiduciary duties to both the Fund and Janus Henderson Cash Collateral Fund LLC. Additionally, Janus Capital receives an investment advisory fee of 0.05% for managing Janus Henderson Cash Collateral Fund LLC and therefore may have an incentive to allocate collateral to the Janus Henderson Cash Collateral Fund LLC, rather than to other collateral management options for which Janus Capital does not receive compensation.
The value of the collateral must be at least 102% of the market value of the loaned securities that are denominated in U.S. dollars and 105% of the market value of the loaned securities that are not denominated in U.S. dollars. Loaned securities and related collateral are marked-to-market each business day based upon the market value of the loaned securities at the close of business, employing the most recent available pricing information. Collateral levels are then adjusted based on this mark-to-market evaluation.
| | |
| | Janus Detroit Street Trust ½ 19 |
Janus Henderson Small Cap Growth Alpha ETF
Notes to Financial Statements (unaudited)
The cash collateral invested by Janus Capital is disclosed in the Schedule of Investments (if applicable). Income earned from the investment of the cash collateral, net of rebates paid to, or fees paid by, borrowers and less the fees paid to the lending agent are included as “Affiliated securities lending income, net” on the Statement of Operations. As of April 30, 2021, securities lending transactions accounted for as secured borrowings with an overnight and continuous contractual maturity are $5,441,246 for equity securities. Gross amounts of recognized liabilities for securities lending (collateral received) as of April 30, 2021 is $5,566,291, resulting in the net amount due to the counterparty of $125,045.
3. Investment Advisory Agreements and Other Transactions with Affiliates
Under its unitary fee structure, the Fund pays Janus Capital a management fee in return for providing certain investment advisory, supervisory, and administrative services to the Fund, including the costs of transfer agency, custody, fund administration, legal, audit, and other services. Janus Capital’s fee structure is designed to pay substantially all of the Fund’s expenses. However, the Fund bears other expenses which are not covered under the management fee which may vary and affect the total level of expenses paid by shareholders, such as distribution fees (if any), brokerage expenses or commissions, interest, dividends, taxes, litigation expenses, acquired fund fees and expenses (if any), and extraordinary expenses. The Fund’s unitary management fee provides for reductions in the fee rate as the Fund’s assets grow. As of the date of this report, the Fund’s management fee was calculated daily and paid monthly according to the following schedule:
| | | | |
| Daily Net Assets | | Fee Rate | |
| $0-$500 million | | | 0.30% | |
| Next $500 million | | | 0.25% | |
| Over $1 billion | | | 0.20% | |
For the period ended April 30, 2021, the Fund’s contractual management fee rate (expressed as an annual rate) was 0.30% of the Fund’s average daily net assets.
As of the date of this report, State Street Bank and Trust Company (“State Street”) provides certain fund administration services to the Fund, including services related to the Fund’s accounting, including calculating the daily NAV, audit coordination, tax, and reporting obligations, pursuant to an agreement with Janus Capital, on behalf of the Fund. As compensation for such services, Janus Capital pays State Street a fee based on a percentage of the Fund’s assets, with a minimum flat fee, for certain services. Janus Capital serves as administrator to the Fund, providing oversight and coordination of the Fund’s service providers, recordkeeping and other administrative services. Janus Capital does not receive any additional compensation, beyond the unitary fee, for serving as administrator. State Street also serves as transfer agent for the shares of the Fund. Pursuant to agreements with Janus Capital on behalf of the Fund, State Street Global Markets, an affiliate of State Street, may execute portfolio transactions for the Fund, including but not limited to, transactions in connection with cash in lieu transactions.
The Fund’s Board of Trustees (“Board”) has approved a Distribution and Servicing Plan for shares of the Fund pursuant to Rule 12b-1 under the 1940 Act (the “Plan”). The Plan permits compensation in connection with the distribution and marketing of Fund shares and/or the provision of certain shareholder services. The Plan permits the Fund to pay ALPS Distributors, Inc. (the “Distributor”) or its designee, a fee for the sale and distribution and/or shareholder servicing of the shares at an annual rate of up to 0.25% of average daily net assets of the Fund. Under the terms of the Plan, the Fund would be authorized to make payments to the Distributor or its designee for remittance to retirement plan service providers, broker-dealers, bank trust departments, financial advisors, and other financial intermediaries, as compensation for distribution and/or shareholder services performed by such entities for their customers who are investors in the Fund. The 12b-1 fee may only be imposed or increased when (i) the Trustees determine that it is in the best interests of shareholders to do so, and (ii) the imposition of or increase in the 12b-1 fee is first approved by the Fund’s shareholders. Because these fees are paid out of the Fund’s assets on an ongoing basis, to the extent that a fee is authorized by
shareholders in the future, over time they will increase the cost of an investment in the Fund. The Plan fee may cost an investor more than other types of sales charges. At this time, Janus Capital does not intend to seek shareholder approval for implementation of the Plan.
As of April 30, 2021, Janus Capital owned 2,000 shares or 0.10% of the Fund.
The Fund is permitted to purchase or sell securities (“cross-trade”) between itself and other funds or accounts managed by Janus Capital in accordance with Rule 17a-7 under the Investment Company Act of 1940 (“Rule 17a-7”), when the transaction is consistent with the investment objectives and policies of the Fund and in accordance with the Internal
Janus Henderson Small Cap Growth Alpha ETF
Notes to Financial Statements (unaudited)
Cross Trade Procedures adopted by the Trust’s Board of Trustees. These procedures have been designed to ensure that any cross-trade of securities by the Fund from or to another fund or account that is or could be considered an affiliate of the Fund under certain limited circumstances by virtue of having a common investment adviser, common Officer, or common Trustee complies with Rule 17a-7. Under these procedures, each cross-trade is effected at the current market price to save costs where allowed. During the period ended April 30, 2021, the Fund engaged in cross trades amounting to $387,898 in purchases and $6,213,926 in sales, resulting in a net realized gain of $235,850. The net realized gain is included within the “Net Realized Gain/(Loss) on Investments” section of the Fund’s Statement of Operations.
Any purchases and sales, realized gains/losses and recorded dividends from affiliated investments during the period ended April 30, 2021 can be found in a table located in the Schedule of Investments.
4. Federal Income Tax
Income and capital gains distributions are determined in accordance with income tax regulations that may differ from US GAAP. These differences are due to differing treatments for items such as net short-term gains, deferral of wash sale losses, foreign currency transactions, passive foreign investment companies, net investment losses, in-kind transactions and capital loss carryovers.
The Fund has elected to treat gains and losses on forward foreign currency contracts as capital gains and losses, if applicable. Other foreign currency gains and losses on debt instruments are treated as ordinary income for federal income tax purposes pursuant to Section 988 of the Internal Revenue Code.
Accumulated capital losses noted below represent net capital loss carryovers, as of October 31, 2020, that may be available to offset future realized capital gains and thereby reduce future taxable gains distributions. The following table shows these capital loss carryovers.
| | | | | | | | | | |
Capital Loss Carryover Schedule
For the year ended October 31, 2020
No Expiration | | | Accumulated Capital Losses | |
| Short-Term | | | Long-Term | |
| $ | (6,852,077) | | | $ | (1,622,764) | | | $ | (8,474,841) | |
The aggregate cost of investments and the composition of unrealized appreciation and depreciation of investment securities for federal income tax purposes as of April 30, 2021 are noted below. The primary difference between book and tax appreciation or depreciation of investments is wash sale loss deferrals.
| | | | | | | | | | | | | | |
| Federal Tax Cost | | | Unrealized Appreciation | | | Unrealized (Depreciation) | | | Net Tax Appreciation/
(Depreciation) | |
| $ | 134,684,403 | | | $ | 15,462,330 | | | $ | (4,516,274) | | | $ | 10,946,056 | |
5. Capital Share Transactions
| | | | | | | | | | | | | | | | |
| | | Period ended April 30, 2021 | | | Year ended October 31, 2020 | |
| | | Shares | | | Amount | | | Shares | | | Amount | |
| Shares sold | | | 1,550,000 | | | $ | 102,846,019 | | | | 900,000 | | | $ | 40,563,154 | |
| Shares repurchased | | | (600,000) | | | | (39,328,222) | | | | (600,000) | | | | (26,656,099) | |
Net Increase/(Decrease) | | | 950,000 | | | $ | 63,517,797 | | | | 300,000 | | | $ | 13,907,055 | |
6. Purchases and Sales of Investment Securities
For the period ended April 30, 2021, the aggregate cost of purchases and proceeds from sales of investment securities (excluding any short-term securities, short-term options contracts, and in-kind transactions) was as follows:
| | | | | | | | | | | | | | |
Purchases of
Securities | | | Proceeds from Sales
of Securities | | | Purchases of Long-
Term U.S. Government
Obligations | | | Proceeds from Sales of Long-Term U.S.
Government Obligations | |
| $ | 69,777,504 | | | $ | 69,544,419 | | | $ | — | | | $ | — | |
| | |
| | Janus Detroit Street Trust ½ 21 |
Janus Henderson Small Cap Growth Alpha ETF
Notes to Financial Statements (unaudited)
For the period ended April 30, 2021, the cost of in-kind purchases and proceeds from in-kind sales, were as follows:
| | | | | | | | | | | | | | |
Purchases of Securities | | | Proceeds from Sales of Securities | | | Purchases of Long-
Term U.S. Government
Obligations | | | Proceeds from Sales of Long-Term U.S.
Government Obligations | |
| $ | 102,831,776 | | | $ | 39,455,271 | | | $ | — | | | $ | — | |
During the period ended April 30, 2021, the Fund had net realized gain/(loss) of $15,886,399 from in-kind redemptions. Gains on in-kind transactions are not considered taxable for federal income tax purposes.
7. Subsequent Events
Management has evaluated whether any events or transactions occurred subsequent to April 30, 2021 and through the date of issuance of the Fund’s financial statements and determined that there were no material events or transactions that would require recognition or disclosure in the Fund’s financial statements.
Janus Henderson Small Cap Growth Alpha ETF
Additional Information (unaudited)
Proxy Voting Policies and Voting Record
A description of the policies and procedures that the Fund uses to determine how to vote proxies relating to its portfolio securities is available without charge: (i) upon request, by calling 1-800-668-0434 (toll free); (ii) on the Fund’s website at janushenderson.com/proxyvoting; and (iii) on the SEC’s website at http://www.sec.gov.
Quarterly Portfolio Holdings
The Fund files its complete portfolio holdings (schedule of investments) with the SEC for the first and third quarters each fiscal year as an exhibit to Form N-PORT within 60 days of the end of such fiscal quarter. The Fund’s Form N-PORT filings: are available on the SEC’s website at http://www.sec.gov; (ii) may be reviewed and copied at the SEC’s Public Reference Room in Washington, D.C. (information on the Public Reference Room may be obtained by calling 1-800-SEC-0330); and (iii) are available without charge, upon request, by calling Janus Henderson at 1-800-668-0434 (toll free).
Licensing Agreements
Janus Henderson Indices LLC (“JH Indices”) is the Index Provider for the Underlying Index. Janus Capital has entered into a license agreement with JH Indices to use the Underlying Index. JH Indices is affiliated with the Fund and Janus Capital. This affiliation may create potential conflicts for JH Indices as it may have an interest in the performance of the Fund, which could motivate it to alter the Underlying Index methodology for the Underlying Index. JH Indices has adopted procedures that it believes are reasonably designed to mitigate these and other potential conflicts.
JH Indices is the licensor of certain trademarks, service marks, and trade names. Neither JH Indices nor any of its affiliates make any representation or warranty, express or implied, to the owners of the Fund or any member of the public regarding the advisability of investing in securities generally or in the Fund particularly or the ability of the Underlying Index to track general market performance. The Underlying Index is determined, composed, and calculated by JH Indices without regard to Janus Capital or the Fund. JH Indices has no obligation to take the needs of Janus Capital or the owners of the Fund into consideration in determining, composing, or calculating the Underlying Index. JH Indices is not responsible for and has not participated in the determination of the timing of, prices at, or quantities of the Fund to be issued or in the determination or calculation of the equation by which the Fund is to be converted into cash.
ALTHOUGH JH INDICES SHALL OBTAIN INFORMATION FOR INCLUSION IN OR FOR USE IN THE CALCULATION OF THE UNDERLYING INDEX FROM SOURCES WHICH IT CONSIDERS RELIABLE, IT DOES NOT GUARANTEE THE QUALITY, ACCURACY AND/OR THE COMPLETENESS OF THE UNDERLYING INDEX OR ANY DATA INCLUDED THEREIN AND SHALL HAVE NO LIABILITY FOR ERRORS OR OMISSIONS OF ANY KIND RELATED TO THE UNDERLYING INDEX OR DATA. JH INDICES MAKES NO WARRANTY, EXPRESS OR IMPLIED, AS TO RESULTS TO BE OBTAINED BY JANUS CAPITAL, OWNERS OF THE FUND, OR ANY OTHER PERSON OR ENTITY FROM THE USE OF THE UNDERLYING INDEX OR ANY DATA INCLUDED THEREIN IN CONNECTION WITH THE RIGHTS LICENSED TO JANUS CAPITAL FOR ANY OTHER USE. JH INDICES MAKES NO EXPRESS OR IMPLIED WARRANTIES, AND HEREBY EXPRESSLY DISCLAIMS ALL WARRANTIES OF MERCHANTABILITY OR FITNESS FOR A PARTICULAR PURPOSE OR USE WITH RESPECT TO THE UNDERLYING INDEX OR ANY DATA INCLUDED THEREIN. WITHOUT LIMITING ANY OF THE FOREGOING, IN NO EVENT SHALL IT HAVE ANY LIABILITY FOR ANY SPECIAL, PUNITIVE, INDIRECT, OR CONSEQUENTIAL DAMAGES (INCLUDING LOST PROFITS), EVEN IF NOTIFIED OF THE POSSIBILITY OF SUCH DAMAGES.
Janus Capital does not guarantee the accuracy and/or the completeness of the Underlying Index or any data included therein, and Janus Capital shall have no liability for any errors, omissions or interruptions therein. Janus Capital makes no warranty, express or implied, as to results to be obtained by the Fund, owners of the shares of the Fund or any other person or entity from the use of the Underlying Index or any data included therein. Janus Capital makes no express or implied warranties, and expressly disclaims all warranties of merchantability or fitness for a particular purpose or use with respect to the Underlying Index or any data included therein. Without limiting any of the foregoing, in no event shall Janus Capital have any liability for any special, punitive, direct, indirect or consequential damages (including lost profits) arising out of matters relating to the use of the Underlying Index even if notified of the possibility of such damages.
| | |
| | Janus Detroit Street Trust ½ 23 |
Janus Henderson Small Cap Growth Alpha ETF
Board Considerations Regarding Approval of Investment Advisory Agreements (unaudited)
The Board of Trustees (the “Board”) of Janus Detroit Street Trust (the “Trust”), including a majority of the Trustees who are not “interested persons” as that term is defined in the Investment Company Act of 1940, as amended (the “Independent Trustees”), met on April 21-22, 2021 to consider the proposed renewal of the investment management agreement between Janus Capital Management LLC (the “Adviser”) and the Trust (the “Investment Management Agreement”), on behalf of Janus Henderson Short Duration Income ETF (“VNLA”), Janus Henderson Small Cap Growth Alpha ETF (“JSML”), Janus Henderson Small/Mid Cap Growth Alpha ETF (“JSMD”), Janus Henderson Mortgage-Backed Securities ETF (“JMBS”) and The Long Term Care ETF (“OLD” and, together with VNLA, JSML, JSMD and JMBS, the “Funds”). In the course of their consideration of the renewal of the Investment Management Agreement, the Independent Trustees met in executive session and were advised by their independent counsel. In this regard, the Independent Trustees evaluated the terms of the Investment Management Agreement and reviewed the duties and responsibilities of trustees in evaluating and approving such agreements. In considering renewal of the Investment Management Agreement, the Board and the Independent Trustees, as applicable, reviewed the materials provided to them relating to the consideration of the renewal of the Investment Management Agreement for the Funds and other information provided by counsel and the Adviser, including: (i) information regarding the nature, quality and extent of the services provided to the Funds by the Adviser, and the fees charged to each Fund therefor; (ii) information concerning the Adviser’s financial condition, business, operations, portfolio management personnel, compliance programs, and profitability with respect to the Trust and each Fund; (iii) comparative information describing each Fund’s advisory fee structures, operating expenses, and performance information as compared to peer fund groups selected and reported to the Board by an independent third party; (iv) a copy of the Adviser’s current Form ADV; and (v) a memorandum from counsel to the Independent Trustees on the responsibilities of trustees in considering investment advisory arrangements under the 1940 Act. The Board also considered presentations made by, and discussions held with, representatives of the Adviser over the previous year and since the inception of the Funds. The Trustees previously met via telephone on March 15, 2021 to discuss certain information provided by the Adviser related to the Trustees’ consideration of the renewal of the Investment Management Agreement.
During its review of this information, the Board focused on and analyzed the factors that it deemed relevant, including, among other factors: (i) the nature, extent and quality of the services provided to the Funds by the Adviser; (ii) the Adviser’s personnel and operations; (iii) each Fund’s expense level; (iv) the profitability to the Adviser under the Investment Management Agreement with respect to each Fund; (v) any “fall-out” benefits to the Adviser and its affiliates (i.e., the ancillary benefits realized by the Adviser and its affiliates from the Adviser’s relationship with the Trust); (vi) the effect of asset growth on each Fund’s expenses; and (vii) potential conflicts of interest.
The Trustees also considered benefits that accrue to the Adviser and its affiliates from their relationships with the Trust and each Fund. The Trustees also considered that, other than the services provided by the Adviser and its affiliates pursuant to agreements with the Funds and the fees paid by the Funds therefor, the Funds and the Adviser may potentially benefit from their relationship with each other in other ways. The Trustees considered that the success of the Funds could attract other business to the Adviser or other Janus Henderson funds, and that the success of the Adviser could enhance the Adviser’s ability to serve the Funds.
The Board, including the Independent Trustees, considered the following in respect of the Funds:
(a) The nature, extent and quality of services provided by the Adviser; personnel and operations of the Adviser.
The Board reviewed the services that the Adviser provides to the Funds. In connection with the investment advisory services provided by the Adviser, the Board noted the responsibilities that the Adviser has as the Funds’ investment adviser, including: the overall supervisory responsibility for the general management and investment of each Fund’s securities portfolio; providing oversight of the investment performance and processes and compliance with each Fund’s investment objectives, policies and limitations; the implementation of the investment management program of each Fund; the management of the day-to-day investment and reinvestment of the assets of each Fund; determining daily baskets of securities and cash components in connection with creation and redemption transactions in each Fund’s shares; executing portfolio security trades for purchases and redemptions of each Fund’s shares conducted on a cash-in-lieu basis; the review of brokerage matters; the oversight of general portfolio compliance with relevant law; and the implementation of Board directives as they relate to the Funds.
The Board reviewed the Adviser’s experience, resources and strengths in managing the Funds and other pooled investment vehicles, including an assessment of the Adviser’s personnel. Based on its consideration and review of the foregoing information, the Board determined that each Fund was likely to continue to benefit from the nature, quality and extent of these services, as well as the Adviser’s ability to render such services based on the Adviser’s experience, personnel, operations and resources.
Janus Henderson Small Cap Growth Alpha ETF
Board Considerations Regarding Approval of Investment Advisory Agreements (unaudited)
(b) Comparison of services rendered and fees paid under other investment advisory contracts, and the cost of the services to be provided and profits to be realized by the Adviser from the relationship with the Funds; “fall-out” benefits.
The Board then compared both the services rendered and the fees paid under other contracts of the Adviser and under contracts of other investment advisers with respect to similar mutual funds and ETFs. In particular, the Board reviewed a report compiled by an independent third party to compare each Fund’s management fee and expense ratio to other investment companies within each Fund’s respective peer grouping, as determined by the independent third party.
The comparative reporting indicated that total expense ratios for JSMD, VNLA, JMBS and OLD were in the 1st, 2nd, 1st and 1st quintiles, respectively, as compared to each Fund’s respective peer grouping. The comparative reporting indicated that the total expense ratio for JMSL was ranked third in the peer group assigned by the independent third party, which contained five peers. The Board also noted that the Adviser had reduced the management fees charged to the Funds at the April 22-23, 2020 Meeting by implementing reductions in each Fund’s breakpoint schedule. The Board further considered that the Adviser had voluntarily agreed to cap the expenses of VNLA and JMBS to the extent that the Funds’ total expense ratio exceeded 0.23% and 0.29%, respectively, for at least the period February 28, 2021 through February 28, 2022.
The Board also discussed the costs incurred by the Adviser in connection with its serving as investment adviser to the Funds, including operational costs. After comparing each Fund’s fees and expenses with those of other ETFs and mutual funds (as applicable) in the Funds’ respective peer groups, and in light of the nature, extent and quality of services provided by the Adviser and the costs incurred by the Adviser in rendering those services, as well as the profitability of the Adviser in providing these services, the Board concluded that the level of fees paid to the Adviser and the profitability with respect to each Fund was fair and reasonable.
The Board also considered that the Adviser may experience reputational “fall-out” benefits based on the success of the Funds, but that such benefits are not easily quantifiable.
(c) The extent to which economies of scale would be realized as the Fund grows and whether fee levels would reflect such economies of scale.
The Board next discussed potential economies of scale. In its review, the Board considered that the Funds were positioned to realize economies of scale as assets grow over time, given the inclusion of management fee breakpoints for each Fund in the current investment advisory agreement at various asset levels.
(d) Investment performance of the Fund and the Adviser.
The Board next discussed the performance of the Funds on both an absolute basis and relative to the performance of funds comprising a peer group compiled by an independent third party for each Fund for the one-year period, two-year period, r three-year period, and/or four-year period, as applicable. The Board noted that for the one-, two-, three-, and four year periods, respectively, OLD was reported to be in the 5th, 5th, 5th and 5th quintiles, JSMD was reported to be in the 3rd, 3rd, 2nd and 3rd quintiles and JSML was reported to be in the 4th, 3rd, 3rd and 3rd quintiles. VNLA was reported to be in the 3rd, 4th and 2nd quintiles for the one-, two- and three-year periods, respectively. JMBS was reported to be in the 1st quintile for both the one- and two-year periods. The Board considered the Adviser’s explanation of performance provided as part of the consideration of the renewal of the Investment Advisory Agreement, and during the course of the previous year.
With respect to OLD, JSML and JSMD, the Board noted that these Funds are index-based and, as a result, passively managed to seek to track the returns of specified indices. For this reason, the Board also considered the performance of these Funds in relation to the performance of each Fund’s respective underlying index (i.e. “tracking error”), and considered that the tracking error was within anticipated ranges.
Conclusion.
No single factor was determinative to the decision of the Board. Based on the foregoing and such other matters as were deemed relevant, the Board concluded that the management fee rates and total expense ratios of each Fund are reasonable in relation to the services provided by the Adviser to such Fund, as well as the costs incurred and benefits gained by the Adviser in providing such services. The Board also found the management fees to be reasonable in comparison to the fees charged by advisers to other comparable ETFs and mutual funds (as applicable). As a result, the Board concluded that the renewal of the Investment Management Agreement for an additional one-year period was in the best interests of each Fund.
After full consideration of the above factors, as well as other factors, the Trustees, including all of the Independent Trustees voting separately, determined to approve the renewal of the Investment Management Agreement for each Fund.
| | |
| | Janus Detroit Street Trust ½ 25 |
Janus Henderson Small Cap Growth Alpha ETF
Liquidity Risk Management Program (unaudited)
Rule 22e-4 under the Investment Company Act of 1940, as amended (the “Liquidity Rule”), requires open-end funds (but not money market funds) to adopt and implement a written liquidity risk management program (the “LRMP”) that is reasonably designed to assess and manage liquidity risk.. In compliance with the Liquidity Rule, the Fund has implemented a LRMP, which incorporates the following elements: (i) assessment, management, and periodic review of liquidity risk; (ii) classification of portfolio holdings, as applicable; (iii) the establishment and monitoring of a highly liquid investment minimum, as applicable; (iv) a 15% limitation on a Fund’s illiquid investments; (v) redemptions in-kind; and (vi) board oversight. In light of the fact that the Fund operates as an exchange-traded fund (“ETF”), the LRMP also takes into account considerations unique to ETFs, including the relationship between the ETF’s portfolio liquidity and the way in which, and the prices and spreads at which, ETF shares trade, including: (i) the efficiency of the arbitrage function and the level of active participation by market participants (including authorized participants); and (ii) the effect of the composition of baskets on the overall liquidity of the ETF’s portfolio. The LRMP also considers whether the ETF meets redemptions through in-kind transfers of securities, positions, and assets other than a de minimis amount of cash.
The Trustees of the Fund (the “Trustees”) have designated Janus Capital Management LLC, the Fund’s investment adviser (“Janus Capital”), as the Program Administrator for the LRMP. A working group comprised of various groups within Janus Capital’s business is responsible for administering different aspects of the LRMP (the “Liquidity Risk Working Group”).
The Liquidity Rule requires the Trustees to review at least annually a written report provided by the Janus Capital that addresses the operation of the LRMP and assesses its adequacy and the effectiveness of its implementation, including, if applicable, the operation of the highly liquid investment minimum and any material changes to the LRMP (the “Program Administrator Report”). At a meeting held April 22, 2021, Janus Capital provided the Program Administrator Report to the Trustees which covered the operation of the LRMP from January 1, 2020 through December 31, 2020 (the “Reporting Period”).
The Program Administrator Report discussed the operation and effectiveness of the LRMP during the Reporting Period. It noted that the Fund was able to meet redemptions during the normal course of business during the Reporting Period, and discussed the additional actions that the Liquidity Risk Working Group took during the period of market volatility in the spring of 2020, in light of the impact of the coronavirus outbreak, to monitor the Fund’s liquidity. The Program Administrator Report also stated that the Fund did not exceed the 15% limit on illiquid assets during the Reporting Period, that the Fund held primarily highly liquid assets, and was considered to be a primarily highly liquid fund during the Reporting Period. In addition, Janus Capital expressed its belief in the Program Administrator Report that the LRMP is reasonably designed and adequate to assess and manage the Fund’s liquidity risk, taking into account the Fund’s particular risks and circumstances, and includes policies and procedures reasonably designed to implement each required component of the Liquidity Rule.
There can be no assurance that the LRMP will achieve its objectives in the future. Please refer to your Fund’s prospectus for more information regarding the risks to which an investment in the Fund may be subject.
Janus Henderson Small Cap Growth Alpha ETF
Notes
| | |
| | Janus Detroit Street Trust ½ 27 |
Janus Henderson Small Cap Growth Alpha ETF
Notes
Janus Henderson Small Cap Growth Alpha ETF
Notes
| | |
| | Janus Detroit Street Trust ½ 29 |
This report is submitted for the general information of shareholders of the Fund. It is not an offer or solicitation for the Fund and is not authorized for distribution to prospective investors unless preceded or accompanied by an effective prospectus.
Janus Henderson is a trademark of Janus Henderson Group plc or one of its subsidiaries. © Janus Henderson Group plc.
Janus Capital Management LLC is the investment adviser and ALPS Distributors, Inc. is the distributor. ALPS is not affiliated with Janus Henderson or any of its subsidiaries.
SEMIANNUAL REPORT
April 30, 2021
The Long-Term Care ETF
Janus Detroit Street Trust

Table of Contents
The Long-Term Care ETF (unaudited)
Fund At A Glance
April 30, 2021
INVESTMENT OBJECTIVE
The Long-Term Care ETF seeks investment results that correspond generally, before fees and expenses, to the performance of the Solactive Long-Term Care Index.
| | | | |
| 5 Largest Equity Holdings – (% of Net Assets) | |
Welltower, Inc. | |
Equity Real Estate Investment Trusts (REITs) | | | 17.6% | |
Ventas, Inc. | |
Equity Real Estate Investment Trusts (REITs) | | | 11.7% | |
Healthpeak Properties, Inc. | |
Equity Real Estate Investment Trusts (REITs) | | | 10.4% | |
Omega Healthcare Investors, Inc. | |
Equity Real Estate Investment Trusts (REITs) | | | 5.0% | |
Amedisys, Inc. | |
Health Care Providers & Services | | | 4.9% | |
| | | | |
| | | 49.6% | |
| | | | |
| Sector Allocation – (% of Net Assets) | |
Financial | | | 61.8% | |
Consumer, Non-cyclical | | | 34.0% | |
Consumer, Cyclical | | | 2.6% | |
Communications | | | 1.6% | |
Investments Purchased with Cash Collateral from Securities Lending | | | 0.4% | |
| | | | |
| | | 100.4% | |
Holdings are subject to change without notice.
| | |
| | Janus Detroit Street Trust ½ 1 |
The Long-Term Care ETF (unaudited)
Performance
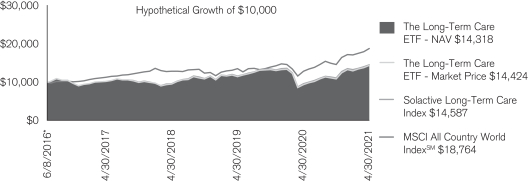
| | | | | | |
| Average Annual Total Return for the periods ended April 30, 2021 |
| | | Fiscal
Year-to-Date | | One
Year | | Since
Inception* |
The Long-Term Care ETF – NAV | | 31.07% | | 51.70% | | 7.61% |
The Long-Term Care ETF – Market Price | | 32.52% | | 54.32% | | 7.77% |
Solactive Long-Term Care Index | | 31.23% | | 52.04% | | 8.02% |
MSCI All Country World IndexSM | | 28.29% | | 45.75% | | 13.73% |
| * | The Fund commenced operations on June 8, 2016. |
Total annual expense ratio as stated in the prospectus: 0.30%. See Financial Highlights for actual expense ratios during the reporting period.
Returns quoted are past performance and do not guarantee future results; current performance may be lower or higher. Investment returns and principal value will vary; there may be a gain or loss when shares are sold. For the most recent month-end performance call 800.668.0434 or visit janushenderson.com/performance.
Shares of ETFs are bought and sold at market price (not NAV) and are not individually redeemed from the Fund. Market returns are based upon the midpoint of the bid/ask spread at 4:00 p.m. Eastern time (when NAV is normally determined for most ETFs), and do not represent the returns you would receive if you traded shares at other times. Ordinary brokerage commissions apply and will reduce returns.
Investing involves risk, including the possible loss of principal and fluctuation of value.
Performance depends on that of the underlying index.
See the prospectus for a more complete discussion of objectives, risks and expenses.
Returns include reinvestment of dividends and capital gains. Returns do not reflect the deduction of taxes that a shareholder would pay on Fund distributions, sales, or redemptions of Fund shares.
There is no assurance the stated objective(s) will be met.
See Notes to Schedule of Investments and Other Information for index definitions.
Index performance does not reflect the expenses of managing a portfolio as an index is unmanaged and not available for direct investment.
Solactive Indices were created by and are maintained by, Solactive AG. For detailed information on how stocks are selected for inclusion in the Underlying Index, see solactive.com. Solactive is not affiliated with Janus Henderson or ALPS.
The Long-Term Care ETF (unaudited)
Disclosure of Fund Expenses
As a shareholder of the Fund, you incur two types of costs: (1) transaction costs, which may include creation and redemption fees or brokerage charges and (2) ongoing costs, including management fees and other Fund expenses. This example is intended to help you understand your ongoing costs (in dollars) of investing in the Fund and to compare these costs with the ongoing costs of investing in other ETFs. To do so, compare this 5% hypothetical example with the 5% hypothetical examples that appear in the shareholder reports of the other funds. The example is based upon an investment of $1,000 invested at the beginning of the period and held for the six-months indicated, unless noted otherwise in the table and footnotes below.
Actual Expenses
The information in the table under the heading “Actual” provides information about actual account values and actual expenses. You may use the information in these columns, together with the amount you invested, to estimate the expenses that you paid over the period. Simply divide your account value by $1,000 (for example, an $8,600 account value divided by $1,000 = 8.6), then multiply the result by the number under the heading entitled “Expenses Paid During Period” to estimate the expenses you paid on your account during the period.
Hypothetical Example for Comparison Purposes
The information in the table under the heading “Hypothetical (5% return before expenses)” provides information about hypothetical account values and hypothetical expenses based upon the Fund’s actual expense ratio and an assumed rate of return of 5% per year before expenses, which is not the Fund’s actual return. The hypothetical account values and expenses may not be used to determine the actual ending account balance or expenses you paid for the period. You may use this information to compare the ongoing costs of investing in the Fund and other funds. To do so, compare this 5% hypothetical example with the 5% hypothetical examples that appear in the shareholder reports of the other funds. Additionally, for an analysis of the fees associated with an investment or other similar funds, please visit www.finra.org/fundanalyzer.
Please note that the expenses shown in the table are meant to highlight your ongoing costs only and do not reflect any transaction costs, such as creation and redemption fees, or brokerage charges. These fees are fully described in the Fund’s prospectus. Therefore, the hypothetical examples are useful in comparing ongoing costs only and will not help you determine the relative total costs of owning different funds. In addition, if these transaction costs were included, your costs would have been higher.
| | | | | | | | | | | | | | | | | | | | | | | | |
Actual | | | Hypothetical
(5% return before expenses) | | | | |
Beginning
Account
Value
(11/1/20) | | Ending
Account
Value
(4/30/21) | | | Expenses
Paid During
Period
(11/1/20 - 4/30/21)† | | | Beginning
Account
Value
(11/1/20) | | | Ending
Account
Value
(4/30/21) | | | Expenses
Paid During
Period
(11/1/20 - 4/30/21)† | | | Net Annualized
Expense Ratio
(11/1/20 - 4/30/21) | |
| $1,000.00 | | $ | 1,310.70 | | | $ | 1.72 | | | $ | 1,000.00 | | | $ | 1,023.31 | | | $ | 1.51 | | | | 0.30% | |
| † | Expenses Paid During Period is equal to the Net Annualized Expense Ratio multiplied by the average account value over the period, multiplied by 181/365 (to reflect the one-half year period). |
| | |
| | Janus Detroit Street Trust ½ 3 |
The Long-Term Care ETF
Schedule of Investments (unaudited)
April 30, 2021
| | | | | | | | |
| | | Shares/
Principal Amount | | | Value | |
| Common Stocks – 100.0% | |
| Commercial Services & Supplies – 1.9% | |
Healthcare Services Group, Inc. | | | 16,055 | | | | $480,847 | |
| Equity Real Estate Investment Trusts (REITs) – 60.0% | |
Aedifica SA | | | 7,151 | | | | 874,611 | |
Care Property Invest NV | | | 5,581 | | | | 169,304 | |
CareTrust, Inc. | | | 20,375 | | | | 492,667 | |
Diversified Healthcare Trust | | | 50,866 | | | | 224,573 | |
Healthpeak Properties, Inc. | | | 78,307 | | | | 2,689,062 | |
Ingenia Communities Group | | | 59,475 | | | | 242,571 | |
LTC Properties, Inc. | | | 8,309 | | | | 353,382 | |
National Health Investors, Inc. | | | 9,368 | | | | 687,705 | |
New Senior Investment Group, Inc. | | | 16,625 | | | | 110,058 | |
Omega Healthcare Investors, Inc. | | | 33,642 | | | | 1,278,396 | |
Sabra Health Care REIT, Inc. | | | 44,812 | | | | 814,234 | |
Ventas, Inc. | | | 54,352 | | | | 3,014,362 | |
Welltower, Inc. | | | 60,729 | | | | 4,556,497 | |
| | | | | | | | |
| | | | | | | 15,507,422 | |
| Health Care Providers & Services – 35.7% | |
Addus HomeCare Corp.* | | | 3,364 | | | | 355,911 | |
Ambea AB(144A)* | | | 16,579 | | | | 155,874 | |
Amedisys, Inc.* | | | 4,676 | | | | 1,261,819 | |
Arvida Group, Ltd. | | | 101,353 | | | | 130,897 | |
Attendo AB(144A)* | | | 21,441 | | | | 125,161 | |
Brookdale Senior Living, Inc.* | | | 38,738 | | | | 253,347 | |
Charm Care Corp. KK | | | 3,500 | | | | 39,065 | |
Chartwell Retirement Residences | | | 45,124 | | | | 458,869 | |
Elan Corp. | | | 6,100 | | | | 72,661 | |
Ensign Group, Inc. | | | 11,230 | | | | 964,095 | |
Estia Health, Ltd.* | | | 41,762 | | | | 79,357 | |
Extendicare, Inc. | | | 17,174 | | | | 109,030 | |
Five Star Senior Living, Inc.* | | | 3,892 | | | | 20,277 | |
Japara Healthcare, Ltd.* | | | 56,404 | | | | 44,005 | |
Korian SA* | | | 15,873 | | | | 636,676 | |
LHC Group, Inc.* | | | 5,713 | | | | 1,189,846 | |
Mediterranean Towers, Ltd. | | | 17,703 | | | | 54,299 | |
National HealthCare Corp. | | | 2,652 | | | | 186,462 | |
Oceania Healthcare, Ltd. | | | 99,665 | | | | 96,538 | |
Orpea* | | | 9,174 | | | | 1,182,224 | |
Pennant Group, Inc.* | | | 5,635 | | | | 227,767 | |
Regis Healthcare, Ltd. | | | 26,935 | | | | 47,854 | |
Ryman Healthcare, Ltd. | | | 82,502 | | | | 839,980 | |
Sienna Senior Living, Inc.# | | | 14,333 | | | | 170,570 | |
St-Care Holding Corp. | | | 2,400 | | | | 25,865 | |
Summerset Group Holdings, Ltd. | | | 48,848 | | | | 426,189 | |
Tsukui Holdings Corp.# | | | 1,000 | | | | 8,426 | |
Viemed Healthcare, Inc.* | | | 6,508 | | | | 65,387 | |
| | | | | | | | |
| | | | | | | 9,228,451 | |
| Hotels, Restaurants & Leisure – 0.1% | |
Silver Life Co., Ltd.* | | | 1,000 | | | | 22,506 | |
| Professional Services – 1.6% | |
SMS Co., Ltd. | | | 14,800 | | | | 404,036 | |
| Real Estate Management & Development – 0.7% | |
Lifestyle Communities, Ltd. | | | 16,411 | | | | 177,093 | |
Total Common Stocks (cost $24,819,777) | | | | | | | 25,820,355 | |
| Investments Purchased with Cash Collateral from Securities Lending – 0.4% | |
| Investment Companies – 0.3% | |
Janus Henderson Cash Collateral Fund LLC, 0.0011%¥,£ | | | 85,400 | | | | 85,400 | |
See Notes to Schedule of Investments and Other Information and Notes to Financial Statements.
The Long-Term Care ETF
Schedule of Investments (unaudited)
April 30, 2021
| | | | | | | | |
| | | Shares/
Principal Amount | | | Value | |
| Investments Purchased with Cash Collateral from Securities Lending – (continued) | |
| Time Deposits – 0.1% | |
Royal Bank of Canada, 0.0100% , 5/3/21 | | | $21,350 | | | | $ 21,350 | |
Total Investments Purchased with Cash Collateral from Securities Lending (cost $106,750) | | | | | | | 106,750 | |
Total Investments (total cost $24,926,527) – 100.4% | | | | | | | 25,927,105 | |
Liabilities, net of Cash, Receivables and Other Assets – (0.4%) | | | | | | | (103,300) | |
Net Assets – 100% | | | | | | | $25,823,805 | |
Summary of Investments by Country – (Long Positions) (unaudited)
| | | | | | | | |
| Country | | Value | | | % of
Investment
Securities | |
United States | | | $19,333,444 | | | | 74.6% | |
France | | | 1,818,900 | | | | 7.0 | |
New Zealand | | | 1,493,604 | | | | 5.8 | |
Belgium | | | 1,043,915 | | | | 4.0 | |
Canada | | | 738,469 | | | | 2.8 | |
Australia | | | 590,880 | | | | 2.3 | |
Japan | | | 572,559 | | | | 2.2 | |
Sweden | | | 281,035 | | | | 1.1 | |
Israel | | | 54,299 | | | | 0.2 | |
Total | | | $25,927,105 | | | | 100.0% | |
Schedules of Affiliated Investments – (% of Net Assets)
| | | | | | | | | | | | | | | | |
| | | Dividend Income | | | Realized
Gain/(Loss) | | | Change in
Unrealized
Appreciation/
(Depreciation) | | | Value at
4/30/21 | |
| Investments Purchased with Cash Collateral from Securities Lending – 0.4% | | | | | | | | | | | | |
| Investment Companies – 0.3% | | | | | | | | | | |
Janus Henderson Cash Collateral Fund LLC, 0.0011%¥ | | | $184D | | | | $ — | | | | $ — | | | | $85,400 | |
| | | | |
| | | Market Value
at 10/31/20 | | | Purchases | | | Sales | | | Market Value
at 4/30/21 | |
| Investments Purchased with Cash Collateral from Securities Lending – 0.4% | | | | | | | | | | | | |
| Investment Companies – 0.3% | | | | | | | | | | |
Janus Henderson Cash Collateral Fund LLC, 0.0011%¥ | | | $115,844 | | | | $281,477 | | | | $(311,921) | | | | $85,400 | |
See Notes to Schedule of Investments and Other Information and Notes to Financial Statements.
| | |
| | Janus Detroit Street Trust ½ 5 |
The Long-Term Care ETF
Notes to Schedule of Investments and Other Information (unaudited)
April 30, 2021
| | |
Solactive Long-Term Care
Index | | Solactive Long-Term Care Index is designed to track the performance of companies globally that are positioned to profit from providing long-term care to the aging population, including: companies owning or operating senior living facilities, nursing services, specialty hospitals, and senior housing, biotech companies for age-related illnesses and companies that sell products and services to such facilities. |
| |
| MSCI All Country World IndexSM | | MSCI All Country World IndexSM reflects the equity market performance of global developed and emerging markets. |
| |
| LLC | | Limited Liability Company |
| * | Non-income producing security. |
| # | Loaned security; a portion of the security is on loan at April 30, 2021. |
| ¥ | Rate shown is the 7-day yield as of April 30, 2021. |
| £ | The Fund may invest in certain securities that are considered affiliated companies. As defined by the Investment Company Act of 1940, as amended, an affiliated company is one in which the Fund owns 5% or more of the outstanding voting securities, or a company which is under common ownership or control. |
| D | Net of income paid to the securities lending agent and rebates paid to the borrowing counterparties. |
| 144A | Securities sold under Rule 144A of the Securities Act of 1933, as amended, are subject to legal and/or contractual restrictions on resale and may not be publicly sold without registration under the 1993 Act. Unless otherwise noted, these securities have been determined to be liquid in accordance with the requirements of Rule 22e-4, under the 1940 Act. The total value of 144A securities as of the period ended April 30, 2021 is $281,035 which represents 1.1% of net assets. |
The following is a summary of the inputs that were used to value the Fund’s investments in securities and other financial instruments as of April 30, 2021. See Notes to Financial Statements for more information.
Valuation Inputs Summary
| | | | | | | | | | | | |
| | | Level 1 -
Quoted Prices | | | Level 2 -
Other Significant
Observable Inputs | | | Level 3 -
Significant
Unobservable Inputs | |
| | | |
Assets | | | | | | | | | | | | |
| | | |
Investments in Securities: | | | | | | | | | | | | |
| | | |
Common Stocks | | $ | 25,820,355 | | | $ | — | | | $ | — | |
| | | |
Investments Purchased with Cash Collateral from Securities Lending | | | — | | | | 106,750 | | | | — | |
| | | | |
| | | |
Total Assets | | $ | 25,820,355 | | | $ | 106,750 | | | $ | — | |
The Long-Term Care ETF
Statement of Assets and Liabilities (unaudited)
April 30, 2021
| | | | |
Assets: | | | | |
Unaffiliated investments, at value(1)(2) | | $ | 25,841,705 | |
Affiliated investments, at value(3) | | | 85,400 | |
Cash denominated in foreign currency(4) | | | 2,437 | |
Receivables: | | | | |
Investments sold | | | 795,962 | |
Dividends | | | 50,187 | |
Affiliated securities lending income, net | | | 21 | |
Total Assets | | | 26,775,712 | |
Liabilities: | | | | |
Collateral on securities loaned (Note 2) | | | 106,750 | |
Payables: | | | | |
Due to custodian | | | 20,082 | |
Investments purchased | | | 818,315 | |
Management fees | | | 6,760 | |
Total Liabilities | | | 951,907 | |
Net Assets | | $ | 25,823,805 | |
Net Assets Consists of: | | | | |
Capital (par value and paid-in surplus) | | $ | 25,285,829 | |
Total distributable earnings (loss) | | | 537,976 | |
Total Net Assets | | $ | 25,823,805 | |
Net Assets | | $ | 25,823,805 | |
Shares outstanding, $0.001 Par Value (unlimited shares authorized) | | | 800,001 | |
Net Asset Value Per Share | | $ | 32.28 | |
| (1) | Includes cost of $24,841,127. |
| (2) | Includes $101,439 of securities on loan. See Note 2 in Notes to Financial Statements. |
| (3) | Includes cost of $85,400. |
| (4) | Includes cost of $2,398. |
See Notes to Financial Statements.
| | |
| | Janus Detroit Street Trust ½ 7 |
The Long-Term Care ETF
Statement of Operations (unaudited)
For the period ended April 30, 2021
| | | | |
Investment Income: | | | | |
Dividends | | $ | 357,352 | |
Affiliated securities lending income, net | | | 184 | |
Unaffiliated securities lending income, net | | | 12 | |
Foreign tax withheld | | | (5,427) | |
Total Investment Income | | | 352,121 | |
Expenses: | | | | |
Management Fees | | | 36,782 | |
Total Expenses | | | 36,782 | |
Net Investment Income/(Loss) | | | 315,339 | |
Net Realized Gain/(Loss) on Investments: | | | | |
Investments and foreign currency transactions | | $ | 250,274 | |
Total Net Realized Gain/(Loss) on Investments | | $ | 250,274 | |
Change in Unrealized Net Appreciation/Depreciation: | | | | |
Investments and foreign currency translations | | $ | 5,980,822 | |
Total Change in Unrealized Net Appreciation/Depreciation | | $ | 5,980,822 | |
Net Increase/(Decrease) in Net Assets Resulting from Operations | | $ | 6,546,435 | |
See Notes to Financial Statements.
The Long-Term Care ETF
Statements of Changes in Net Assets
| | | | | | | | |
| | | Period Ended
April 30, 2021
(unaudited) | | | Year Ended
October 31, 2020 | |
Operations: | | | | | | | | |
Net investment income/(loss) | | $ | 315,339 | | | $ | 583,159 | |
Net realized gain/(loss) on investments | | | 250,274 | | | | 299,931 | |
Change in unrealized net appreciation/depreciation | | | 5,980,822 | | | | (8,179,890) | |
Net Increase/(Decrease) in Net Assets Resulting from Operations | | | 6,546,435 | | | | (7,296,800) | |
Dividends and Distributions to Shareholders: | | | | | | | | |
Dividends and Distributions | | | (222,735) | | | | (652,903) | |
Net Decrease from Dividends and Distributions to Shareholders | | | (222,735) | | | | (652,903) | |
Capital Share Transactions | | | (2,877,035) | | | | (6,768,859) | |
Net Increase/(Decrease) in Net Assets | | | 3,446,665 | | | | (14,718,562) | |
Net Assets: | | | | | | | | |
Beginning of period | | | 22,377,140 | | | | 37,095,702 | |
End of period | | $ | 25,823,805 | | | $ | 22,377,140 | |
See Notes to Financial Statements.
| | |
| | Janus Detroit Street Trust ½ 9 |
The Long-Term Care ETF
Financial Highlights
| | | | | | | | | | | | | | | | | | | | | | | | | | |
For a share outstanding during the period ended April 30, 2021
(unaudited) and each year or period ended October 31 | | 2021 | | | 2020 | | | 2019 | | | 2018 | | | 2017 | | | 2016(1) | |
| | Net Asset Value, Beginning of Period | | | $24.86 | | | | $30.91 | | | | $25.83 | | | | $24.36 | | | | $24.49 | | | | $25.38 | |
| | Income/(Loss) from Investment Operations: | |
| | Net investment income/(loss)(2) | | | 0.39 | | | | 0.58 | | | | 0.73 | | | | 0.56 | | | | 0.66 | | | | 0.21 | |
| | Net realized and unrealized gain/(loss) | | | 7.31 | | | | (6.01) | | | | 4.94 | | | | 1.46 | | | | (0.01) | | | | (0.84) | |
| | Total from Investment Operations | | | 7.70 | | | | (5.43) | | | | 5.67 | | | | 2.02 | | | | 0.65 | | | | (0.63) | |
| | Less Dividends and Distributions: | |
| | Dividends (from net investment income) | | | (0.28) | | | | (0.62) | | | | (0.59) | | | | (0.55) | | | | (0.72) | | | | (0.21) | |
| | Return of Capital | | | — | | | | — | | | | — | | | | — | | | | (0.06) | | | | (0.05) | |
| | Total Dividends and Distributions | | | (0.28) | | | | (0.62) | | | | (0.59) | | | | (0.55) | | | | (0.78) | | | | (0.26) | |
| | Net Asset Value, End of Period | | | $32.28 | | | | $24.86 | | | | $30.91 | | | | $25.83 | | | | $24.36 | | | | $24.49 | |
| | Total Return* | | | 31.07% | | | | (17.62)% | | | | 22.24% | | | | 8.44% | | | | 2.66% | | | | (2.56)% | |
| | Net assets, End of Period (in thousands) | | | $25,824 | | | | $22,377 | | | | $37,096 | | | | $7,748 | | | | $9,744 | | | | $4,898 | |
| | Average Net Assets for the Period (in thousands) | | | $24,561 | | | | $26,393 | | | | $17,484 | | | | $9,702 | | | | $7,044 | | | | $2,627 | |
| | Ratios to Average Net Assets**: | |
| | Ratio of Gross Expenses | | | 0.30% | | | | 0.33% | | | | 0.35% | | | | 0.50% | | | | 0.50% | | | | 0.50% | |
| | Ratio of Net Investment Income/(Loss) | | | 2.59% | | | | 2.21% | | | | 2.56% | | | | 2.27% | | | | 2.63% | | | | 2.07% | |
| | Portfolio Turnover Rate(3) | | | 7% | | | | 18% | | | | 13% | | | | 38% | | | | 19% | | | | 5% | |
| * | Total return not annualized for periods of less than one full year. |
| ** | Annualized for periods of less than one full year. |
| (1) | Period from June 8, 2016 (commencement of operations) through October 31, 2016. |
| (2) | Per share amounts are calculated based on average shares outstanding during the year or period. |
| (3) | Portfolio turnover rate excludes securities received or delivered from in-kind processing of creation or redemptions. |
See Notes to Financial Statements.
The Long-Term Care ETF
Notes to Financial Statements (unaudited)
1. Organization and Significant Accounting Policies
The Long-Term Care ETF (the “Fund”) is a series fund. The Fund is part of Janus Detroit Street Trust (the “Trust”), which is organized as a Delaware statutory trust and is registered under the Investment Company Act of 1940, as amended (the “1940 Act”), as an open-end management investment company, and therefore has applied the specialized accounting and reporting guidance in Financial Accounting Standards Board (“FASB”) Accounting Standards Codification (“ASC”) Topic 946. As of the date of this report, the Trust offers six Funds each of which represent shares of beneficial interest in a separate portfolio of securities and other assets with its own objective and policies. The Fund seeks investment results that correspond generally to the performance, before fees and expenses, of an index (Underlying Index) which is designed to track the performance of companies globally that are positioned to profit from providing long-term care to the aging population, including companies owning or operating senior living facilities, nursing services, specialty hospitals, and senior housing, biotech companies for age-related illnesses, and companies that sell products and services to such facilities. The Fund is classified as nondiversified, as defined in the 1940 Act.
Unlike shares of traditional mutual funds, shares of the Fund are not individually redeemable and may only be purchased or redeemed directly from the Fund at net asset value (“NAV”) in large increments called “Creation Units” by certain participants, known as “Authorized Participants.” The size of a Creation Unit to purchase shares of the Fund may differ from the size of a Creation Unit to redeem shares of the Fund. The Fund will issue or redeem Creation Units in exchange for portfolio securities and/or cash. Except when aggregated in Creation Units, Fund shares are not redeemable securities of the Fund. Shares of the Fund are listed and trade on The NASDAQ Stock Market LLC (“NASDAQ”) and individual investors can purchase or sell shares in much smaller increments and for cash in the secondary market through a broker. These transactions, which do not involve the Fund, are made at market prices that may vary throughout the day and differ from the Fund’s NAV. As a result, you may pay more than NAV (a premium) when you purchase shares and receive less than NAV (a discount) when you sell shares, in the secondary market.
An Authorized Participant (or other broker-dealers making markets in shares of the Fund) may hold of record more than 25% of the outstanding shares of the Fund. From time to time, Authorized Participants (or other broker-dealers making markets in shares of the Fund) may be a beneficial and/or legal owner of the Fund, may be affiliated with an index provider, may be deemed to have control of the Fund and/or may be able to affect the outcome of matters presented for a vote of the shareholders of the Fund. Authorized Participants (or other broker-dealers making markets in shares of the Fund) may execute an irrevocable proxy granting the Distributor, Janus Capital Management LLC (“Janus Capital” or “Janus”) or an affiliate of Janus Capital power to vote or abstain from voting such Authorized Participant’s beneficially or legally owned shares of the Fund. In such cases, the agent shall mirror vote (or abstain from voting) such shares in the same proportion as all other beneficial owners of the Fund.
The following accounting policies have been followed by the Fund and are in conformity with United States of America generally accepted accounting principles (“US GAAP”).
Investment Valuation
Securities held by the Fund are valued in accordance with policies and procedures established by and under the supervision of the Trustees (the “Valuation Procedures”). Equity securities, including shares of exchange-traded funds, traded on a domestic securities exchange are generally valued at the closing prices on the primary market or exchange on which they trade. If such price is lacking for the trading period immediately preceding the time of determination, such securities are valued at their current bid price. Equity securities that are traded on a foreign exchange are generally valued at the closing prices on such markets. In the event that there is no current trading volume on a particular security in such foreign exchange, the bid price from the primary exchange is generally used to value the security. Securities that are traded on the over-the-counter (“OTC”) markets are generally valued at their closing or latest bid prices as available. Foreign securities and currencies are converted to U.S. dollars using the applicable exchange rate in effect at the close of the London Stock Exchange. The Fund will determine the market value of individual securities held by it by using prices provided by one or more approved professional pricing services or, as needed, by obtaining market quotations from independent broker-dealers. Most debt securities are valued in accordance with the evaluated bid price supplied by the pricing service that is intended to reflect market value. The evaluated bid price supplied by the pricing service is an evaluation that may consider factors such as security prices, yields, maturities and ratings. Certain short-term securities maturing within 60 days or less may be evaluated and valued on an amortized cost basis provided that the amortized cost determined approximates market value. Securities for which market quotations or evaluated prices are not readily available or are deemed unreliable, are valued at fair value determined in good faith under the Valuation Procedures. Circumstances in which fair value pricing may be utilized include, but are not limited to: (i) a significant event that may affect the securities of a single issuer, such as a merger, bankruptcy, or significant issuer-specific development; (ii) an event that may affect an entire market, such as a natural disaster or significant governmental action; (iii) a nonsignificant
| | |
| | Janus Detroit Street Trust ½ 11 |
The Long-Term Care ETF
Notes to Financial Statements (unaudited)
event such as a market closing early or not opening, or a security trading halt; and (iv) pricing of a nonvalued security and a restricted or nonpublic security. Special valuation considerations may apply with respect to “odd-lot” fixed-income transactions which, due to their small size, may receive evaluated prices by pricing services which reflect a large block trade and not what actually could be obtained for the odd-lot position.
Valuation Inputs Summary
FASB ASC 820, Fair Value Measurements and Disclosures (“ASC 820”), defines fair value, establishes a framework for measuring fair value, and expands disclosure requirements regarding fair value measurements. This standard emphasizes that fair value is a market-based measurement that should be determined based on the assumptions that market participants would use in pricing an asset or liability and establishes a hierarchy that prioritizes inputs to valuation techniques used to measure fair value. These inputs are summarized into three broad levels:
Level 1 – Unadjusted quoted prices in active markets the Fund has the ability to access for identical assets or liabilities.
Level 2 – Observable inputs other than unadjusted quoted prices included in Level 1 that are observable for the asset or liability either directly or indirectly. These inputs may include quoted prices for the identical instrument on an inactive market, prices for similar instruments, interest rates, prepayment speeds, credit risk, yield curves, default rates and similar data.
Assets or liabilities categorized as Level 2 in the hierarchy generally include: debt securities fair valued in accordance with the evaluated bid or ask prices supplied by a pricing service; securities traded on OTC markets and listed securities for which no sales are reported that are fair valued at the latest bid price (or yield equivalent thereof) obtained from one or more dealers transacting in a market for such securities or by a pricing service approved by the Fund’s Trustees; and certain short-term debt securities with maturities of 60 days or less that are fair valued at amortized cost. Other securities that may be categorized as Level 2 in the hierarchy include, but are not limited to, preferred stocks, bank loans, swaps, investments in unregistered investment companies, options, and forward contracts.
Level 3 – Unobservable inputs for the asset or liability to the extent that relevant observable inputs are not available, representing the Fund’s own assumptions about the assumptions that a market participant would use in valuing the asset or liability, and that would be based on the best information available.
There have been no significant changes in valuation techniques used in valuing any such positions held by the Fund since the beginning of the fiscal year.
The inputs or methodology used for fair valuing securities are not necessarily an indication of the risk associated with investing in those securities. The summary of inputs used as of April 30, 2021 to fair value the Fund’s investments in securities and other financial instruments is included in the “Valuation Inputs Summary” in the Notes to Schedule of Investments and Other Information.
Investment Transactions and Investment Income
Investment transactions are accounted for as of the date purchased or sold (trade date). Dividend income is recorded on the ex-dividend date. Certain dividends from foreign securities will be recorded as soon as the Fund is informed of the dividend, if such information is obtained subsequent to the ex-dividend date. Dividends from foreign securities may be subject to withholding taxes in foreign jurisdictions. Interest income is recorded daily on an accrual basis and includes amortization of premiums and accretion of discounts. The Fund classifies gains and losses on prepayments received as an adjustment to interest income. Debt securities may be placed in non-accrual status and related interest income may be reduced by stopping current accruals and writing off interest receivables when collection of all or a portion of interest has become doubtful. Gains and losses are determined on the identified cost basis, which is the same basis used for federal income tax purposes.
Estimates
The preparation of financial statements in conformity with US GAAP requires management to make estimates and assumptions that affect the reported amount of assets and liabilities and disclosure of contingent assets and liabilities at the date of the financial statements and the reported amounts of income and expenses during the reporting period. Actual results could differ from those estimates.
The Long-Term Care ETF
Notes to Financial Statements (unaudited)
Indemnifications
In the normal course of business, the Fund may enter into contracts that contain provisions for indemnification of other parties against certain potential liabilities. The Fund’s maximum exposure under these arrangements is unknown and would involve future claims that may be made against the Fund that have not yet occurred. Currently, the risk of material loss from such claims is considered remote.
Foreign Currency Translations
The Fund does not isolate that portion of the results of operations resulting from the effect of changes in foreign exchange rates on investments from the fluctuations arising from changes in market prices of securities held at the date of the financial statements. Net unrealized appreciation or depreciation of investments and foreign currency translations arise from changes in the value of assets and liabilities, including investments in securities held at the date of the financial statements, resulting from changes in the exchange rates and changes in market prices of securities held.
Currency gains and losses are also calculated on payables and receivables that are denominated in foreign currencies. The payables and receivables are generally related to foreign security transactions and income translations.
Foreign currency-denominated assets and forward currency contracts may involve more risks than domestic transactions, including currency risk, counterparty risk, political and economic risk, regulatory risk and equity risk. Risks may arise from unanticipated movements in the value of foreign currencies relative to the U.S. dollar.
Dividends and Distributions
The Fund generally declares and distributes dividends of net investment income quarterly. Net realized capital gains (if any) are distributed annually. The Fund may treat a portion of the amount paid to redeem shares as a distribution of investment company taxable income and realized capital gains that are reflected in the NAV. This practice, commonly referred to as “equalization,” has no effect on the redeeming shareholder or a Fund’s total return, but may reduce the amounts that would otherwise be required to be paid as taxable dividends to the remaining shareholders. It is possible that the Internal Revenue Service (IRS) could challenge the Fund’s equalization methodology or calculations, and any such challenge could result in additional tax, interest, or penalties to be paid by the Fund.
The Fund may make certain investments in real estate investment trusts (“REITs”) which pay dividends to their shareholders based upon funds available from operations. It is quite common for these dividends to exceed the REITs’ taxable earnings and profits, resulting in the excess portion of such dividends being designated as a return of capital. If the Fund distributes such amounts, such distributions could constitute a return of capital to shareholders for federal income tax purposes.
Federal Income Taxes
The Fund intends to continue to qualify as a regulated investment company and distribute all of its taxable income in accordance with the requirements of Subchapter M of the Internal Revenue Code. Management has analyzed the Fund’s tax positions taken for all open federal income tax years, generally a three-year period, and has concluded that no provision for federal income tax is required in the Fund’s financial statements. The Fund is not aware of any tax positions for which it is reasonably possible that the total amounts of unrecognized tax benefits will significantly change in the next twelve months.
2. Other Investments and Strategies
Additional Investment Risk
In response to the COVID-19 pandemic, the U.S. government and the Federal Reserve, as well as certain foreign governments and central banks, have taken extraordinary actions to support local and global economies and the financial markets, including reducing interest rates to record low levels. Extremely low or negative interest rates may become more prevalent or may not work as intended. As there is little precedent for this situation, the impact on various markets that interest rate or other significant policy changes may have is unknown. The withdrawal of this support, a failure of measures put in place in response to such economic uncertainty, or investor perception that such efforts were not sufficient could each negatively affect financial markets generally, and the value and liquidity of specific securities. In addition, policy and legislative changes in the United States and in other countries continue to impact many aspects of financial regulation.
Widespread disease, including pandemics and epidemics, and natural or environmental disasters, including those which may be attributable to global climate change, such as earthquakes, fires, floods, hurricanes, tsunamis and weather-related phenomena generally, have been and can be highly disruptive to economies and markets, adversely impacting individual companies, sectors, industries, markets, currencies, interest and inflation rates, credit ratings, investor sentiment, and
| | |
| | Janus Detroit Street Trust ½ 13 |
The Long-Term Care ETF
Notes to Financial Statements (unaudited)
other factors affecting the value of a Fund’s investments. Economies and financial markets throughout the world have become increasingly interconnected, which increases the likelihood that events or conditions in one region or country will adversely affect markets or issuers in other regions or countries, including the United States. These disruptions could prevent a Fund from executing advantageous investment decisions in a timely manner and negatively impact a Fund’s ability to achieve its investment objective(s). Any such event(s) could have a significant adverse impact on the value of a Fund. In addition, these disruptions could also impair the information technology and other operational systems upon which the Fund’s service providers, including Janus Capital, rely, and could otherwise disrupt the ability of employees of the Fund’s service providers to perform essential tasks on behalf of the Fund. Adverse weather conditions may also have a particularly significant negative effect on issuers in the agricultural sector and on insurance and reinsurance companies that insure or reinsure against the impact of natural disasters.
A number of countries in the European Union (the “EU”) have experienced, and may continue to experience, severe economic and financial difficulties. In particular, many EU nations are susceptible to economic risks associated with high levels of debt. Many non-governmental issuers, and even certain governments, have defaulted on, or been forced to restructure, their debts. Many other issuers have faced difficulties obtaining credit or refinancing existing obligations. Financial institutions have in many cases required government or central bank support, have needed to raise capital, and/or have been impaired in their ability to extend credit. As a result, financial markets in the EU have experienced extreme volatility and declines in asset values and liquidity. These difficulties may continue, worsen, or spread further within the EU. Responses to these financial problems by European governments, central banks, and others, including austerity measures and reforms, may not work, may result in social unrest, and may limit future growth and economic recovery or have other unintended consequences. The risk of investing in securities in the European markets may also be heightened due to the referendum in which the United Kingdom voted to exit the EU commonly known as “Brexit,” which immediately led to significant market volatility around the world, as well as political, economic and legal uncertainty. The United Kingdom formally left the EU on January 31, 2020 and entered into an eleven-month transition period, which expired on December 31, 2020. The negative impact on not only the United Kingdom and European economies could be significant, potentially resulting in increased volatility and illiquidity and lower economic growth for companies that rely significantly on the United Kingdom and/or Europe for their business activities and revenues. Any further exits from the EU, or an increase in the belief that such exits are likely or possible, would likely cause additional market disruption globally and introduce new legal and regulatory uncertainties.
Passive Investment Risk
The Fund is not actively managed and therefore the Fund might not sell shares of a security due to current or projected underperformance of a security, industry or sector, unless that security is removed from the Underlying Index or the selling of shares is otherwise required upon a rebalancing of the Underlying Index.
Concentration Risk
The Fund focuses its investments in companies that provide long-term care to the aging population, many of which are in the health care and real estate sectors. Because of this, companies in the Fund’s portfolio may share common characteristics and may be more sensitive to factors such as government regulation and cost containment measures, rapid changes in technology, and product cycles. As a result, the Fund may be subject to greater risks and the value of its investments may fluctuate more than a fund that does not focus its investments. In addition, the Fund’s assets will generally be concentrated in an industry or group of industries to the extent that the Fund’s Underlying Index concentrates in a particular industry or group of industries. To the extent the Fund invests a substantial portion of its assets in an industry or group of industries, market or economic factors impacting that industry or group of industries could have a significant effect on the value of the Fund’s investments. Companies in the same or similar industries may share common characteristics and are more likely to react similarly to industry-specific market or economic developments. Additionally, the Fund’s performance may be more volatile when the Fund’s investments are less diversified across industries. The Fund’s assets will not be concentrated if the Underlying Index does not concentrate in a particular industry or group of industries.
Real Estate Investing
The Fund may invest in equity securities of real estate-related companies to the extent such securities are included in the Underlying Index. Such companies may include those in the real estate industry or real estate-related industries. These securities may include common stocks, preferred and convertible securities of issuers in real estate-related industries. A REIT is a trust that invests in real estate-related projects, such as properties, mortgage loans, and construction loans. REITs are generally categorized as equity, mortgage, or hybrid REITs. A REIT may be listed on an exchange or traded OTC.
The Long-Term Care ETF
Notes to Financial Statements (unaudited)
Geographic Investment Risk
To the extent the Fund invests a significant portion of its assets in a particular country or geographic region, the Fund will generally have more exposure to certain risks due to possible political, economic, social, or regulatory events in that country or region. Adverse developments in certain regions could also adversely affect securities of other countries whose economies appear to be unrelated and could have a negative impact on the Fund’s performance.
Counterparties
Fund transactions involving a counterparty are subject to the risk that the counterparty or a third party will not fulfill its obligation to the Fund (“counterparty risk”). Counterparty risk may arise because of the counterparty’s financial condition (i.e., financial difficulties, bankruptcy, or insolvency), market activities and developments, or other reasons, whether foreseen or not. A counterparty’s inability to fulfill its obligation may result in significant financial loss to the Fund. The Fund may be unable to recover its investment from the counterparty or may obtain a limited recovery, and/or recovery may be delayed. The extent of the Fund’s exposure to counterparty risk with respect to financial assets and liabilities approximates its carrying value.
The Fund may be exposed to counterparty risk through participation in various programs, including, but not limited to, lending its securities to third parties, cash sweep arrangements whereby the Fund’s cash balance is invested in one or more types of cash management vehicles, as well as investments in, but not limited to, repurchase agreements, and derivatives, including various types of swaps, futures and options. The Fund intends to enter into financial transactions with counterparties that Janus Capital believes to be creditworthy at the time of the transaction. There is always the risk that Janus Capital’s analysis of a counterparty’s creditworthiness is incorrect or may change due to market conditions. To the extent that the Fund focuses its transactions with a limited number of counterparties, it will have greater exposure to the risks associated with one or more counterparties.
Offsetting Assets and Liabilities
The Fund presents gross and net information about transactions that are either offset in the financial statements or subject to an enforceable master netting arrangement or similar agreement with a designated counterparty, regardless of whether the transactions are actually offset in the Statement of Assets and Liabilities.
JPMorgan Chase Bank, National Association acts as securities lending agent and a limited purpose custodian or subcustodian to receive and disburse cash balances and cash collateral, hold short-term investments, hold collateral, and perform other custodial functions in accordance with the Non-Custodial Securities Lending Agreement. For financial reporting purposes, the Fund does not offset financial instruments’ payables and receivables and related collateral on the Statement of Assets and Liabilities. Securities on loan will be continuously secured by collateral which may consist of cash, U.S. Government securities, domestic and foreign short-term debt instruments, letters of credit, time deposits, repurchase agreements, money market mutual funds or other money market accounts, or such other collateral as permitted by the Securities and Exchange Commission (the “SEC”). See “Securities Lending” in the “Notes to Financial Statements” for additional information.
The following table presents gross amounts of recognized assets and/or liabilities and the net amounts after deducting collateral that has been pledged by counterparties or has been pledged to counterparties (if applicable). For corresponding information grouped by type of instrument, see the Fund’s Schedule of Investments.
Offsetting of Financial Assets and Derivative Assets
| | | | | | | | | | | | | | | | |
| Counterparty | | Gross Amounts
of Recognized
Assets | | | Offsetting Asset
or Liability(a) | | | Collateral
Pledged(b) | | | Net Amount | |
| JPMorgan Chase Bank NA | | $ | 101,439 | | | $ | — | | | $ | (101,439) | | | $ | — | |
| (a) | Represents the amount of assets or liabilities that could be offset with the same counterparty under master netting or similar agreements that management elects not to offset on the Statement of Assets and Liabilities. |
| (b) | Collateral pledged is limited to the net outstanding amount due to/from an individual counterparty. The actual collateral amounts pledged may exceed these amounts and may fluctuate in value. |
Securities Lending
Under procedures adopted by the Trustees, the Fund may seek to earn additional income by lending securities to certain qualified broker-dealers and institutions. JP Morgan Chase Bank, National Association acts as securities lending agent and a limited purpose custodian or subcustodian to receive and disburse cash balances and cash collateral, hold short-term investments, hold collateral, and perform other custodial functions in accordance with the Non-Custodial Securities
| | |
| | Janus Detroit Street Trust ½ 15 |
The Long-Term Care ETF
Notes to Financial Statements (unaudited)
Lending Agreement. The Fund may lend fund securities in an amount equal to up to 1/3 of its total assets as determined at the time of the loan origination. There is the risk of delay in recovering a loaned security or the risk of loss in collateral rights if the borrower fails financially. In addition, Janus Capital makes efforts to balance the benefits and risks from granting such loans. All loans will be continuously secured by collateral which may consist of cash, U.S. Government securities, domestic and foreign short-term debt instruments, letters of credit, time deposits, repurchase agreements, money market mutual funds or other money market accounts, or such other collateral as permitted by the SEC. If the Fund is unable to recover a security on loan, the Fund may use the collateral to purchase replacement securities in the market. There is a risk that the value of the collateral could decrease below the cost of the replacement security by the time the replacement investment is made, resulting in a loss to the Fund. In certain circumstances individual loan transactions could yield negative returns.
Upon receipt of cash collateral, Janus Capital may invest it in affiliated or non-affiliated cash management vehicles, whether registered or unregistered entities, as permitted by the 1940 Act and rules promulgated thereunder. Janus Capital currently intends to invest the cash collateral in a cash management vehicle for which Janus Capital serves as investment adviser, Janus Henderson Cash Collateral Fund LLC, or in time deposits. An investment in Janus Henderson Cash Collateral Fund LLC is generally subject to the same risks that shareholders experience when investing in similarly structured vehicles, such as the potential for significant fluctuations in assets as a result of the purchase and redemption activity of the securities lending program, a decline in the value of the collateral, and possible liquidity issues. Such risks may delay the return of the cash collateral and cause the Fund to violate its agreement to return the cash collateral to a borrower in a timely manner. As adviser to the Fund and Janus Henderson Cash Collateral Fund LLC, Janus Capital has an inherent conflict of interest as a result of its fiduciary duties to both the Fund and Janus Henderson Cash Collateral Fund LLC. Additionally, Janus Capital receives an investment advisory fee of 0.05% for managing Janus Henderson Cash Collateral Fund LLC and therefore may have an incentive to allocate collateral to the Janus Henderson Cash Collateral Fund LLC, rather than to other collateral management options for which Janus Capital does not receive compensation.
The value of the collateral must be at least 102% of the market value of the loaned securities that are denominated in U.S. dollars and 105% of the market value of the loaned securities that are not denominated in U.S. dollars. Loaned securities and related collateral are marked-to-market each business day based upon the market value of the loaned securities at the close of business, employing the most recent available pricing information. Collateral levels are then adjusted based on this mark-to-market evaluation.
The cash collateral invested by Janus Capital is disclosed in the Schedule of Investments (if applicable). Income earned from the investment of the cash collateral, net of rebates paid to, or fees paid by, borrowers and less the fees paid to the lending agent are included as “Affiliated securities lending income, net” on the Statement of Operations. As of April 30, 2021, securities lending transactions accounted for as secured borrowings with an overnight and continuous contractual maturity are $101,439 for equity securities. Gross amounts of recognized liabilities for securities lending (collateral received) as of April 30, 2021 is $106,750, resulting in the net amount due to the counterparty of $5,311.
3. Investment Advisory Agreements and Other Transactions with Affiliates
Under its unitary fee structure, the Fund pays Janus Capital a management fee in return for providing certain investment advisory, supervisory, and administrative services to the Fund, including the costs of transfer agency, custody, fund administration, legal, audit, and other services. Janus Capital’s fee structure is designed to pay substantially all of the Fund’s expenses. However, the Fund bears other expenses which are not covered under the management fee which may vary and affect the total level of expenses paid by shareholders, such as distribution fees (if any), brokerage expenses or commissions, interest, dividends, taxes, litigation expenses, acquired fund fees and expenses (if any), and extraordinary expenses. The Fund’s unitary management fee provides for reductions in the fee rate as the Fund’s assets grow. As of the date of this report, the Fund’s management fee was calculated daily and paid monthly according to the following schedule:
| | | | |
| Daily Net Assets | | Fee Rate | |
| $0-$500 million | | | 0.30% | |
| Next $500 million | | | 0.25% | |
| Over $1 billion | | | 0.20% | |
For the period ended April 30, 2021, the Fund’s contractual management fee rate (expressed as an annual rate) was 0.30% of the Fund’s average daily net assets.
The Long-Term Care ETF
Notes to Financial Statements (unaudited)
As of the date of this report, State Street Bank and Trust Company (“State Street”) provides certain fund administration services to the Fund, including services related to the Fund’s accounting, including calculating the daily NAV, audit coordination, tax, and reporting obligations, pursuant to an agreement with Janus Capital, on behalf of the Fund. As compensation for such services, Janus Capital pays State Street a fee based on a percentage of the Fund’s assets, with a minimum flat fee, for certain services. Janus Capital serves as administrator to the Fund, providing oversight and coordination of the Fund’s service providers, recordkeeping and other administrative services. Janus Capital does not receive any additional compensation, beyond the unitary fee, for serving as administrator. State Street also serves as transfer agent for the shares of the Fund. Pursuant to agreements with Janus Capital on behalf of the Fund, State Street Global Markets, an affiliate of State Street, may execute portfolio transactions for the Fund, including but not limited to, transactions in connection with cash in lieu transactions for non-US securities.
The Fund’s Board of Trustees (“Board”) has approved a Distribution and Servicing Plan for shares of the Fund pursuant to Rule 12b-1 under the 1940 Act (the “Plan”). The Plan permits compensation in connection with the distribution and marketing of Fund shares and/or the provision of certain shareholder services. The Plan permits the Fund to pay ALPS Distributors, Inc. (the “Distributor”) or its designee, a fee for the sale and distribution and/or shareholder servicing of the shares at an annual rate of up to 0.25% of average daily net assets of the Fund. Under the terms of the Plan, the Fund would be authorized to make payments to the Distributor or its designee for remittance to retirement plan service providers, broker-dealers, bank trust departments, financial advisors, and other financial intermediaries, as compensation for distribution and/or shareholder services performed by such entities for their customers who are investors in the Fund. The 12b-1 fee may only be imposed or increased when (i) the Trustees determine that it is in the best interests of shareholders to do so, and (ii) the imposition of or increase in the 12b-1 fee is first approved by the Fund’s shareholders. Because these fees are paid out of the Fund’s assets on an ongoing basis, to the extent that a fee is authorized by shareholders in the future, over time they will increase the cost of an investment in the Fund. The Plan fee may cost an investor more than other types of sales charges. At this time, Janus Capital does not intend to seek shareholder approval for implementation of the Plan.
As of April 30, 2021, Janus Capital owned 1 share or less than 0.0% of the Fund.
Any purchases and sales, realized gains/losses and recorded dividends from affiliated investments during the period
ended April 30, 2021 can be found in a table located in the Schedule of Investments.
4. Federal Income Tax
Income and capital gains distributions are determined in accordance with income tax regulations that may differ from US GAAP. These differences are due to differing treatments for items such as net short-term gains, deferral of wash sale losses, foreign currency transactions, passive foreign investment companies, net investment losses, in-kind transactions and capital loss carryovers.
The Fund has elected to treat gains and losses on forward foreign currency contracts as capital gains and losses, if applicable. Other foreign currency gains and losses on debt instruments are treated as ordinary income for federal income tax purposes pursuant to Section 988 of the Internal Revenue Code.
Accumulated capital losses noted below represent net capital loss carryovers, as of October 31, 2020, that may be available to offset future realized capital gains and thereby reduce future taxable gains distributions. The following table shows these capital loss carryovers.
| | | | | | | | | | |
Capital Loss Carryover Schedule
For the year ended October 31, 2020
No Expiration | | | | |
| Short-Term | | | Long-Term | | | Accumulated
Capital Losses | |
| $ | (142,402) | | | $ | (497,799) | | | $ | (640,201) | |
| | |
| | Janus Detroit Street Trust ½ 17 |
The Long-Term Care ETF
Notes to Financial Statements (unaudited)
The aggregate cost of investments and the composition of unrealized appreciation and depreciation of investment securities for federal income tax purposes as of April 30, 2021 are noted below. The primary differences between book and tax appreciation or depreciation of investments are wash sale loss deferrals and passive foreign investment companies.
| | | | | | | | | | | | | | |
| Federal Tax Cost | | | Unrealized
Appreciation | | | Unrealized
(Depreciation) | | | Net Tax Appreciation/
(Depreciation) | |
| $ | 25,006,051 | | | $ | 2,774,781 | | | $ | (1,853,727) | | | $ | 921,054 | |
5. Capital Share Transactions
| | | | | | | | | | | | | | | | |
| | | Period Ended April 30, 2021 | | | Year Ended October 31, 2020 | |
| | | Shares | | | Amount | | | Shares | | | Amount | |
| Shares sold | | | — | | | $ | — | | | | 200,000 | | | $ | 6,066,715 | |
| Shares repurchased | | | (100,000) | | | | (2,877,035) | | | | (500,000) | | | | (12,835,574) | |
Net Increase/(Decrease) | | | (100,000) | | | $ | (2,877,035) | | | | (300,000) | | | $ | (6,768,859) | |
6. Purchases and Sales of Investment Securities
For the period ended April 30, 2021, the aggregate cost of purchases and proceeds from sales of investment securities (excluding any short-term securities, short-term options contracts, and in-kind transactions) was as follows:
| | | | | | | | | | | | | | |
Purchases of
Securities | | | Proceeds from Sales
of Securities | | | Purchases of Long-
Term U.S. Government
Obligations | | | Proceeds from Sales
of Long-Term U.S.
Government Obligations | |
| $ | 1,693,149 | | | $ | 1,769,398 | | | $ | — | | | $ | — | |
For the period ended April 30, 2021, the cost of in-kind purchases and proceeds from in-kind sales, were as follows:
| | | | | | | | | | | | | | |
Purchases of
Securities | | | Proceeds from Sales
of Securities | | | Purchases of Long-
Term U.S. Government
Obligations | | | Proceeds from Sales
of Long-Term U.S.
Government Obligations | |
| $ | — | | | $ | 2,875,243 | | | $ | — | | | $ | — | |
During the period ended April 30,2021, the Fund had net realized gain/(loss) of $392,390 from in-kind redemptions. Gains on in-kind transactions are not considered taxable for federal income tax purposes.
7. Subsequent Events
Management has evaluated whether any events or transactions occurred subsequent to April 30, 2021 and through the date of the issuance of the Fund’s financial statements and determined that there were no material events or transactions that would require recognition or disclosure in the Fund’s financial statements.
The Long-Term Care ETF
Additional Information (unaudited)
Proxy Voting Policies and Voting Record
A description of the policies and procedures that the Fund uses to determine how to vote proxies relating to its portfolio securities is available without charge: (i) upon request, by calling 1-800-668-0434 (toll free); (ii) on the Fund’s website at janushenderson.com/proxyvoting; and (iii) on the SEC’s website at http://www.sec.gov.
Quarterly Portfolio Holdings
The Fund files its complete portfolio holdings (schedule of investments) with the SEC for the first and third quarters each fiscal year as an exhibit to Form N-PORT within 60 days of the end of such fiscal quarter. The Fund’s Form N-PORT filings: are available on the SEC’s website at http://www.sec.gov; (ii) may be reviewed and copied at the SEC’s Public Reference Room in Washington, D.C. (information on the Public Reference Room may be obtained by calling 1-800-SEC-0330); and (iii) are available without charge, upon request, by calling Janus Henderson at 1-800-668-0434 (toll free).
Licensing Agreements
Solactive AG (“Solactive”) is the Index Provider for the Underlying Index. Janus Capital has entered into a license agreement with Solactive to use the Underlying Index.
Neither Solactive nor any of its affiliates make any representation or warranty, express or implied, to the owners of a Fund or any member of the public regarding the advisability of investing in securities generally or in a Fund particularly or the ability of the Underlying Index to track general market performance. The Underlying Index is determined, composed, and calculated by Solactive without regard to Janus Capital or the Fund. Solactive has no obligation to take the needs of Janus Capital or the owners of the Fund into consideration in determining, composing, or calculating the Underlying Index. Solactive is not responsible for and has not participated in the determination of the timing of, prices at, or quantities of the Fund to be issued or in the determination or calculation of the equation by which the Fund is to be converted into cash.
ALTHOUGH SOLACTIVE SHALL OBTAIN INFORMATION FOR INCLUSION IN OR FOR USE IN THE CALCULATION OF THE UNDERLYING INDEX FROM SOURCES WHICH IT CONSIDERS RELIABLE, IT DOES NOT GUARANTEE THE QUALITY, ACCURACY AND/OR THE COMPLETENESS OF THE UNDERLYING INDEX OR ANY DATA INCLUDED THEREIN AND SHALL HAVE NO LIABILITY FOR ERRORS OR OMISSIONS OF ANY KIND RELATED TO THE UNDERLYING INDEX OR DATA. SOLACTIVE MAKES NO WARRANTY, EXPRESS OR IMPLIED, AS TO RESULTS TO BE OBTAINED BY JANUS CAPITAL, OWNERS OF THE FUND, OR ANY OTHER PERSON OR ENTITY FROM THE USE OF THE UNDERLYING INDEX OR ANY DATA INCLUDED THEREIN IN CONNECTION WITH THE RIGHTS LICENSED TO JANUS CAPITAL FOR ANY OTHER USE. SOLACTIVE MAKES NO EXPRESS OR IMPLIED WARRANTIES, AND HEREBY EXPRESSLY DISCLAIMS ALL WARRANTIES OF MERCHANTABILITY OR FITNESS FOR A PARTICULAR PURPOSE OR USE WITH RESPECT TO THE UNDERLYING INDEX OR ANY DATA INCLUDED THEREIN. WITHOUT LIMITING ANY OF THE FOREGOING, IN NO EVENT SHALL IT HAVE ANY LIABILITY FOR ANY SPECIAL, PUNITIVE, INDIRECT, OR CONSEQUENTIAL DAMAGES (INCLUDING LOST PROFITS), EVEN IF NOTIFIED OF THE POSSIBILITY OF SUCH DAMAGES.
Janus Capital does not guarantee the accuracy and/or the completeness of the Underlying Index or any data included therein, and Janus Capital shall have no liability for any errors, omissions or interruptions therein. Janus Capital makes no warranty, express or implied, as to results to be obtained by the Fund, owners of the shares of the Fund or any other person or entity from the use of the Underlying Index or any data included therein. Janus Capital makes no express or implied warranties, and expressly disclaims all warranties of merchantability or fitness for a particular purpose or use with respect to the Underlying Index or any data included therein. Without limiting any of the foregoing, in no event shall Janus Capital have any liability for any special, punitive, direct, indirect or consequential damages (including lost profits) arising out of matters relating to the use of the Underlying Index even if notified of the possibility of such damages.
| | |
| | Janus Detroit Street Trust ½ 19 |
The Long-Term Care ETF
Board Considerations Regarding Approval of Investment Advisory Agreements (unaudited)
The Board of Trustees (the “Board”) of Janus Detroit Street Trust (the “Trust”), including a majority of the Trustees who are not “interested persons” as that term is defined in the Investment Company Act of 1940, as amended (the “Independent Trustees”), met on April 21-22, 2021 to consider the proposed renewal of the investment management agreement between Janus Capital Management LLC (the “Adviser”) and the Trust (the “Investment Management Agreement”), on behalf of Janus Henderson Short Duration Income ETF (“VNLA”), Janus Henderson Small Cap Growth Alpha ETF (“JSML”), Janus Henderson Small/Mid Cap Growth Alpha ETF (“JSMD”), Janus Henderson Mortgage-Backed Securities ETF (“JMBS”) and The Long Term Care ETF (“OLD” and, together with VNLA, JSML, JSMD and JMBS, the “Funds”). In the course of their consideration of the renewal of the Investment Management Agreement, the Independent Trustees met in executive session and were advised by their independent counsel. In this regard, the Independent Trustees evaluated the terms of the Investment Management Agreement and reviewed the duties and responsibilities of trustees in evaluating and approving such agreements. In considering renewal of the Investment Management Agreement, the Board and the Independent Trustees, as applicable, reviewed the materials provided to them relating to the consideration of the renewal of the Investment Management Agreement for the Funds and other information provided by counsel and the Adviser, including: (i) information regarding the nature, quality and extent of the services provided to the Funds by the Adviser, and the fees charged to each Fund therefor; (ii) information concerning the Adviser’s financial condition, business, operations, portfolio management personnel, compliance programs, and profitability with respect to the Trust and each Fund; (iii) comparative information describing each Fund’s advisory fee structures, operating expenses, and performance information as compared to peer fund groups selected and reported to the Board by an independent third party; (iv) a copy of the Adviser’s current Form ADV; and (v) a memorandum from counsel to the Independent Trustees on the responsibilities of trustees in considering investment advisory arrangements under the 1940 Act. The Board also considered presentations made by, and discussions held with, representatives of the Adviser over the previous year and since the inception of the Funds. The Trustees previously met via telephone on March 15, 2021 to discuss certain information provided by the Adviser related to the Trustees’ consideration of the renewal of the Investment Management Agreement.
During its review of this information, the Board focused on and analyzed the factors that it deemed relevant, including, among other factors: (i) the nature, extent and quality of the services provided to the Funds by the Adviser; (ii) the Adviser’s personnel and operations; (iii) each Fund’s expense level; (iv) the profitability to the Adviser under the Investment Management Agreement with respect to each Fund; (v) any “fall-out” benefits to the Adviser and its affiliates (i.e., the ancillary benefits realized by the Adviser and its affiliates from the Adviser’s relationship with the Trust); (vi) the effect of asset growth on each Fund’s expenses; and (vii) potential conflicts of interest.
The Trustees also considered benefits that accrue to the Adviser and its affiliates from their relationships with the Trust and each Fund. The Trustees also considered that, other than the services provided by the Adviser and its affiliates pursuant to agreements with the Funds and the fees paid by the Funds therefor, the Funds and the Adviser may potentially benefit from their relationship with each other in other ways. The Trustees considered that the success of the Funds could attract other business to the Adviser or other Janus Henderson funds, and that the success of the Adviser could enhance the Adviser’s ability to serve the Funds.
The Board, including the Independent Trustees, considered the following in respect of the Funds:
(a) The nature, extent and quality of services provided by the Adviser; personnel and operations of the Adviser.
The Board reviewed the services that the Adviser provides to the Funds. In connection with the investment advisory services provided by the Adviser, the Board noted the responsibilities that the Adviser has as the Funds’ investment adviser, including: the overall supervisory responsibility for the general management and investment of each Fund’s securities portfolio; providing oversight of the investment performance and processes and compliance with each Fund’s investment objectives, policies and limitations; the implementation of the investment management program of each Fund; the management of the day-to-day investment and reinvestment of the assets of each Fund; determining daily baskets of securities and cash components in connection with creation and redemption transactions in each Fund’s shares; executing portfolio security trades for purchases and redemptions of each Fund’s shares conducted on a cash-in-lieu basis; the review of brokerage matters; the oversight of general portfolio compliance with relevant law; and the implementation of Board directives as they relate to the Funds.
The Board reviewed the Adviser’s experience, resources and strengths in managing the Funds and other pooled investment vehicles, including an assessment of the Adviser’s personnel. Based on its consideration and review of the foregoing information, the Board determined that each Fund was likely to continue to benefit from the nature, quality and
The Long-Term Care ETF
Board Considerations Regarding Approval of Investment Advisory Agreements (unaudited)
extent of these services, as well as the Adviser’s ability to render such services based on the Adviser’s experience, personnel, operations and resources.
(b) Comparison of services rendered and fees paid under other investment advisory contracts, and the cost of the services to be provided and profits to be realized by the Adviser from the relationship with the Funds; “fall-out” benefits.
The Board then compared both the services rendered and the fees paid under other contracts of the Adviser and under contracts of other investment advisers with respect to similar mutual funds and ETFs. In particular, the Board reviewed a report compiled by an independent third party to compare each Fund’s management fee and expense ratio to other investment companies within each Fund’s respective peer grouping, as determined by the independent third party.
The comparative reporting indicated that total expense ratios for JSMD, VNLA, JMBS and OLD were in the 1st, 2nd, 1st and 1st quintiles, respectively, as compared to each Fund’s respective peer grouping. The comparative reporting indicated that the total expense ratio for JMSL was ranked third in the peer group assigned by the independent third party, which contained five peers. The Board also noted that the Adviser had reduced the management fees charged to the Funds at the April 22-23, 2020 Meeting by implementing reductions in each Fund’s breakpoint schedule. The Board further considered that the Adviser had voluntarily agreed to cap the expenses of VNLA and JMBS to the extent that the Funds’ total expense ratio exceeded 0.23% and 0.29%, respectively, for at least the period February 28, 2021 through February 28, 2022.
The Board also discussed the costs incurred by the Adviser in connection with its serving as investment adviser to the Funds, including operational costs. After comparing each Fund’s fees and expenses with those of other ETFs and mutual funds (as applicable) in the Funds’ respective peer groups, and in light of the nature, extent and quality of services provided by the Adviser and the costs incurred by the Adviser in rendering those services, as well as the profitability of the Adviser in providing these services, the Board concluded that the level of fees paid to the Adviser and the profitability with respect to each Fund was fair and reasonable.
The Board also considered that the Adviser may experience reputational “fall-out” benefits based on the success of the Funds, but that such benefits are not easily quantifiable.
(c) The extent to which economies of scale would be realized as the Fund grows and whether fee levels would reflect such economies of scale.
The Board next discussed potential economies of scale. In its review, the Board considered that the Funds were positioned to realize economies of scale as assets grow over time, given the inclusion of management fee breakpoints for each Fund in the current investment advisory agreement at various asset levels.
(d) Investment performance of the Fund and the Adviser.
The Board next discussed the performance of the Funds on both an absolute basis and relative to the performance of funds comprising a peer group compiled by an independent third party for each Fund for the one-year period, two-year period, r three-year period, and/or four-year period, as applicable. The Board noted that for the one-, two-, three-, and four year periods, respectively, OLD was reported to be in the 5th, 5th, 5th and 5th quintiles, JSMD was reported to be in the 3rd, 3rd, 2nd and 3rd quintiles and JSML was reported to be in the 4th, 3rd, 3rd and 3rd quintiles. VNLA was reported to be in the 3rd, 4th and 2nd quintiles for the one-, two- and three-year periods, respectively. JMBS was reported to be in the 1st quintile for both the one- and two-year periods. The Board considered the Adviser’s explanation of performance provided as part of the consideration of the renewal of the Investment Advisory Agreement, and during the course of the previous year.
With respect to OLD, JSML and JSMD, the Board noted that these Funds are index-based and, as a result, passively managed to seek to track the returns of specified indices. For this reason, the Board also considered the performance of these Funds in relation to the performance of each Fund’s respective underlying index (i.e. “tracking error”), and considered that the tracking error was within anticipated ranges.
Conclusion.
No single factor was determinative to the decision of the Board. Based on the foregoing and such other matters as were deemed relevant, the Board concluded that the management fee rates and total expense ratios of each Fund are reasonable in relation to the services provided by the Adviser to such Fund, as well as the costs incurred and benefits gained by the Adviser in providing such services. The Board also found the management fees to be reasonable in comparison to the fees charged by advisers to other comparable ETFs and mutual funds (as applicable). As a result, the
| | |
| | Janus Detroit Street Trust ½ 21 |
The Long-Term Care ETF
Board Considerations Regarding Approval of Investment Advisory Agreements (unaudited)
Board concluded that the renewal of the Investment Management Agreement for an additional one-year period was in the best interests of each Fund.
After full consideration of the above factors, as well as other factors, the Trustees, including all of the Independent Trustees voting separately, determined to approve the renewal of the Investment Management Agreement for each Fund.
The Long-Term Care ETF
Liquidity Risk Management Program (unaudited)
Rule 22e-4 under the Investment Company Act of 1940, as amended (the “Liquidity Rule”), requires open-end funds (but not money market funds) to adopt and implement a written liquidity risk management program (the “LRMP”) that is reasonably designed to assess and manage liquidity risk.. In compliance with the Liquidity Rule, the Fund has implemented a LRMP, which incorporates the following elements: (i) assessment, management, and periodic review of liquidity risk; (ii) classification of portfolio holdings, as applicable; (iii) the establishment and monitoring of a highly liquid investment minimum, as applicable; (iv) a 15% limitation on a Fund’s illiquid investments; (v) redemptions in-kind; and (vi) board oversight. In light of the fact that the Fund operates as an exchange-traded fund (“ETF”), the LRMP also takes into account considerations unique to ETFs, including the relationship between the ETF’s portfolio liquidity and the way in which, and the prices and spreads at which, ETF shares trade, including: (i) the efficiency of the arbitrage function and the level of active participation by market participants (including authorized participants); and (ii) the effect of the composition of baskets on the overall liquidity of the ETF’s portfolio. The LRMP also considers whether the ETF meets redemptions through in-kind transfers of securities, positions, and assets other than a de minimis amount of cash.
The Trustees of the Fund (the “Trustees”) have designated Janus Capital Management LLC, the Fund’s investment adviser (“Janus Capital”), as the Program Administrator for the LRMP. A working group comprised of various groups within Janus Capital’s business is responsible for administering different aspects of the LRMP (the “Liquidity Risk Working Group”).
The Liquidity Rule requires the Trustees to review at least annually a written report provided by the Janus Capital that addresses the operation of the LRMP and assesses its adequacy and the effectiveness of its implementation, including, if applicable, the operation of the highly liquid investment minimum and any material changes to the LRMP (the “Program Administrator Report”). At a meeting held April 22, 2021, Janus Capital provided the Program Administrator Report to the Trustees which covered the operation of the LRMP from January 1, 2020 through December 31, 2020 (the “Reporting Period”).
The Program Administrator Report discussed the operation and effectiveness of the LRMP during the Reporting Period. It noted that the Fund was able to meet redemptions during the normal course of business during the Reporting Period, and discussed the additional actions that the Liquidity Risk Working Group took during the period of market volatility in the spring of 2020, in light of the impact of the coronavirus outbreak, to monitor the Fund’s liquidity. The Program Administrator Report also stated that the Fund did not exceed the 15% limit on illiquid assets during the Reporting Period, that the Fund held primarily highly liquid assets, and was considered to be a primarily highly liquid fund during the Reporting Period. In addition, Janus Capital expressed its belief in the Program Administrator Report that the LRMP is reasonably designed and adequate to assess and manage the Fund’s liquidity risk, taking into account the Fund’s particular risks and circumstances, and includes policies and procedures reasonably designed to implement each required component of the Liquidity Rule.
There can be no assurance that the LRMP will achieve its objectives in the future. Please refer to your Fund’s prospectus for more information regarding the risks to which an investment in the Fund may be subject.
| | |
| | Janus Detroit Street Trust ½ 23 |
The Long-Term Care ETF
Notes
The Long-Term Care ETF
Notes
| | |
| | Janus Detroit Street Trust ½ 25 |
This report is submitted for the general information of shareholders of the Fund. It is not an offer or solicitation for the Fund and is not authorized for distribution to prospective investors unless preceded or accompanied by an effective prospectus.
Janus Henderson is a trademark of Janus Henderson Group plc or one of its subsidiaries. © Janus Henderson Group plc.
Janus Capital Management LLC is the investment adviser and ALPS Distributors, Inc. is the distributor. ALPS is not affiliated with Janus Henderson or any of its subsidiaries.
SEMIANNUAL REPORT
April 30, 2021
Janus Henderson Short Duration Income ETF
Janus Detroit Street Trust

Table of Contents
Janus Henderson Short Duration Income ETF (unaudited)
Fund At A Glance
April 30, 2021
INVESTMENT OBJECTIVE
Janus Henderson Short Duration Income ETF seeks to provide a steady income stream with capital preservation across various market cycles. The Fund seeks to consistently outperform the FTSE 3-Month U.S. Treasury Bill Index by a moderate amount through various market cycles while at the same time providing low volatility.
| | | | |
| Sector Allocation – (% of Net Assets) | |
Financial | | | 43.2% | |
Consumer, Cyclical | | | 15.5% | |
Consumer, Non-cyclical | | | 7.0% | |
Industrial | | | 7.0% | |
Communications | | | 5.1% | |
Utilities | | | 5.1% | |
Technology | | | 4.9% | |
Investment Companies | | | 3.8% | |
Basic Materials | | | 3.4% | |
Energy | | | 3.3% | |
Mortgage-Backed Securities | | | 1.5% | |
Government | | | 0.6% | |
Diversified | | | 0.4% | |
| | | | |
| | | 100.8% | |
Holdings are subject to change without notice.
| | |
| | Janus Detroit Street Trust ½ 1 |
Janus Henderson Short Duration Income ETF (unaudited)
Performance
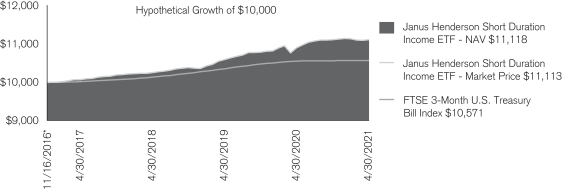
| | | | | | |
| Average Annual Total Return for the period ended April 30, 2021 |
| | | Fiscal
Year-to-Date | | One Year | | Since
Inception* |
Janus Henderson Short Duration Income ETF – NAV | | 0.08% | | 2.11% | | 2.41% |
Janus Henderson Short Duration Income ETF – Market Price | | 0.00% | | 1.95% | | 2.40% |
FTSE 3-Month U.S. Treasury Bill Index | | 0.04% | | 0.13% | | 1.26% |
| * | The Fund commenced operations on November 16, 2016. |
Total annual expense ratio as stated in the prospectus: 0.26% (gross), 0.24% (net). See Financial Highlights for actual expense ratios during the reporting period.
Returns quoted are past performance and do not guarantee future results; current performance may be lower or higher. Investment returns and principal value will vary; there may be a gain or loss when shares are sold. For the most recent month-end performance call 800.668.0434 or visit janushenderson.com/performance.
Shares of ETFs are bought and sold at market price (not NAV) and are not individually redeemed from the Fund. Market returns are based upon the midpoint of the bid/ask spread at 4:00 p.m. Eastern time (when NAV is normally determined for most ETFs), and do not represent the returns you would receive if you traded shares at other times. Ordinary brokerage commissions apply and will reduce returns.
Net expense ratios reflect the expense waiver, if any, contractually agreed to through at least February 28, 2022.
Investing involves risk, including the possible loss of principal and fluctuation of value.
The Fund is not a money market fund and does not attempt to maintain a stable net asset value.
See the prospectus for a more complete discussion of objectives, risks and expenses.
Returns include reinvestment of dividends and capital gains. Returns do not reflect the deduction of taxes that a shareholder would pay on Fund distributions, sales, or redemptions of Fund shares.
There is no assurance the stated objective(s) will be met.
See Notes to Schedule of Investments and Other Information for index definitions.
Index performance does not reflect the expenses of managing a portfolio as an index is unmanaged and not available for direct investment.
Janus Henderson Short Duration Income ETF (unaudited)
Disclosure of Fund Expenses
As a shareholder of the Fund, you incur two types of costs: (1) transaction costs, which may include creation and redemption fees or brokerage charges and (2) ongoing costs, including management fees and other Fund expenses. This example is intended to help you understand your ongoing costs (in dollars) of investing in the Fund and to compare these costs with the ongoing costs of investing in other ETFs. To do so, compare this 5% hypothetical example with the 5% hypothetical examples that appear in the shareholder reports of the other funds. The example is based upon an investment of $1,000 invested at the beginning of the period and held for the six-months indicated, unless noted otherwise in the table and footnotes below.
Actual Expenses
The information in the table under the heading “Actual” provides information about actual account values and actual expenses. You may use the information in these columns, together with the amount you invested, to estimate the expenses that you paid over the period. Simply divide your account value by $1,000 (for example, an $8,600 account value divided by $1,000 = 8.6), then multiply the result by the number under the heading entitled “Expenses Paid During Period” to estimate the expenses you paid on your account during the period.
Hypothetical Example for Comparison Purposes
The information in the table under the heading “Hypothetical (5% return before expenses)” provides information about hypothetical account values and hypothetical expenses based upon the Fund’s actual expense ratio and an assumed rate of return of 5% per year before expenses, which is not the Fund’s actual return. The hypothetical account values and expenses may not be used to determine the actual ending account balance or expenses you paid for the period. You may use this information to compare the ongoing costs of investing in the Fund and other funds. To do so, compare this 5% hypothetical example with the 5% hypothetical examples that appear in the shareholder reports of the other funds. Additionally, for an analysis of the fees associated with an investment or other similar funds, please visit www.finra.org/fundanalyzer.
Please note that the expenses shown in the table are meant to highlight your ongoing costs only and do not reflect any transaction costs, such as creation and redemption fees, or brokerage charges. These fees are fully described in the Fund’s prospectus. Therefore, the hypothetical examples are useful in comparing ongoing costs only and will not help you determine the relative total costs of owning different funds. In addition, if these transaction costs were included, your costs would have been higher.
| | | | | | | | | | | | | | | | | | | | | | | | |
Actual | | | Hypothetical
(5% return before expenses) | | | | |
Beginning
Account
Value
(11/1/20) | | Ending
Account
Value
(4/30/21) | | | Expenses
Paid During
Period
(11/1/20 - 4/30/21)† | | | Beginning
Account
Value
(11/1/20) | | | Ending
Account
Value
(4/30/21) | | | Expenses
Paid During
Period
(11/1/20 - 4/30/21)† | | | Net Annualized
Expense Ratio
(11/1/20 - 4/30/21) | |
| $1,000.00 | | $ | 1,000.80 | | | $ | 1.14 | | | $ | 1,000.00 | | | $ | 1,023.65 | | | $ | 1.15 | | | | 0.23% | |
| † | Expenses Paid During Period is equal to the Net Annualized Expense Ratio multiplied by the average account value over the period, multiplied by 181/365 (to reflect the one-half year period). |
| | |
| | Janus Detroit Street Trust ½ 3 |
Janus Henderson Short Duration Income ETF
Schedule of Investments (unaudited)
April 30, 2021
| | | | | | | | |
| | | Shares/
Principal Amounts | | | Value | |
| Corporate Bonds – 80.7% | |
| Basic Materials – 0.9% | |
Georgia-Pacific LLC, 0.6250%, 5/15/24 (144A) | | | $28,000,000 | | | | $27,927,574 | |
| | | | | | | | |
| Communications – 5.1% | |
Alphabet, Inc., 0.4500%, 8/15/25 | | | 17,000,000 | | | | 16,862,295 | |
Amazon.com, Inc., 3.3000%, 12/5/21 | | | 1,896,000 | | | | 1,920,121 | |
Amazon.com, Inc., 2.5000%, 11/29/22 | | | 6,828,000 | | | | 7,038,245 | |
Amazon.com, Inc., 2.4000%, 2/22/23 | | | 4,100,000 | �� | | | 4,252,075 | |
Amazon.com, Inc., 0.8000%, 6/3/25 | | | 8,100,000 | | | | 8,116,771 | |
AT&T, Inc., 0.9000%, 3/25/24 | | | 31,850,000 | | | | 31,924,222 | |
eBay, Inc., ICE LIBOR USD 3 Month + 0.8700%, 1.0555%, 1/30/23‡ | | | 7,733,000 | | | | 7,815,827 | |
eBay, Inc., 1.9000%, 3/11/25 | | | 9,600,000 | | | | 9,916,972 | |
Optus Finance Pty, Ltd., 4.0000%, 6/17/22 | | | AUD5,250,000 | | | | 4,218,492 | |
Optus Finance Pty, Ltd., 3.2500%, 8/23/22 | | | 4,500,000 | | | | 3,604,390 | |
Optus Finance Pty, Ltd., 3.2500%, 9/6/23 | | | 750,000 | | | | 614,685 | |
Optus Finance Pty, Ltd., 1.6000%, 7/1/25 | | | 250,000 | | | | 196,273 | |
SingTel Group Treasury Pte, Ltd., 4.5000%, 9/8/21 | | | $2,841,000 | | | | 2,880,319 | |
TD Ameritrade Holding Corp., ICE LIBOR USD 3 Month + 0.4300%, 0.6056%, 11/1/21‡ | | | 7,430,000 | | | | 7,444,014 | |
Telstra Corp., Ltd., 3.2500%, 11/15/27 | | | 690,000 | | | | 756,001 | |
TWDC Enterprises 18 Corp., ICE LIBOR USD 3 Month + 0.3900%, 0.5734%, 3/4/22‡ | | | 3,100,000 | | | | 3,109,390 | |
Verizon Communications, Inc., 90 Day Australian Bank Bill Rate + 1.2200%, 1.2301%, 2/17/23‡ | | | AUD6,830,000 | | | | 5,324,448 | |
Verizon Communications, Inc., 3.5000%, 2/17/23 | | | 2,170,000 | | | | 1,759,433 | |
Verizon Communications, Inc., 0.7500%, 3/22/24 | | | $4,700,000 | | | | 4,718,126 | |
Verizon Communications, Inc., ICE LIBOR USD 3 Month + 1.1000%, 1.2976%, 5/15/25‡ | | | 8,000,000 | | | | 8,193,890 | |
Verizon Communications, Inc., 0.8500%, 11/20/25 | | | 13,000,000 | | | | 12,827,845 | |
Verizon Communications, Inc., 1.4500%, 3/20/26 | | | 4,700,000 | | | | 4,729,417 | |
Walt Disney Co., 1.7500%, 8/30/24 | | | 3,300,000 | | | | 3,414,816 | |
| | | | | | | | |
| | | | | | | 151,638,067 | |
| Consumer, Cyclical – 9.0% | | | | | | |
7-Eleven, Inc., 0.6250%, 2/10/23 (144A) | | | 3,300,000 | | | | 3,303,405 | |
American Honda Finance Corp., 2.2000%, 6/27/22 | | | 2,300,000 | | | | 2,352,238 | |
American Honda Finance Corp., 0.4000%, 10/21/22 | | | 2,380,000 | | | | 2,383,453 | |
American Honda Finance Corp., ICE LIBOR USD 3 Month + 0.3700%, 0.5654%, 5/10/23‡ | | | 1,100,000 | | | | 1,103,683 | |
American Honda Finance Corp., 0.8750%, 7/7/23 | | | 8,700,000 | | | | 8,785,635 | |
American Honda Finance Corp., 0.6500%, 9/8/23 | | | 7,000,000 | | | | 7,040,906 | |
American Honda Finance Corp., 0.5500%, 7/12/24 | | | 8,100,000 | | | | 8,088,511 | |
CK Hutchison International 21 Ltd., 1.5000%, 4/15/26 (144A) | | | 15,550,000 | | | | 15,554,254 | |
Daimler Finance North America LLC, ICE LIBOR USD 3 Month + 0.5500%, 0.7423%, 5/4/21 (144A)‡ | | | 2,000,000 | | | | 2,000,000 | |
Daimler Finance North America LLC, 2.8500%, 1/6/22 (144A) | | | 600,000 | | | | 610,007 | |
Daimler Finance North America LLC, ICE LIBOR USD 3 Month + 0.9000%, 1.0938%, 2/15/22 (144A)‡ | | | 15,000,000 | | | | 15,086,265 | |
Daimler Finance North America LLC, 0.7500%, 3/1/24 (144A) | | | 18,800,000 | | | | 18,743,129 | |
General Motors Co., ICE LIBOR USD 3 Month + 0.9000%, 1.0825%, 9/10/21‡ | | | 3,500,000 | | | | 3,507,730 | |
General Motors Financial Co., Inc., 3.2000%, 7/6/21 | | | 750,000 | | | | 751,841 | |
General Motors Financial Co., Inc., ICE LIBOR USD 3 Month + 1.5500%, 1.7358%, 1/14/22‡ | | | 500,000 | | | | 504,208 | |
General Motors Financial Co., Inc., ICE LIBOR USD 3 Month + 0.9900%, 1.1843%, 1/5/23‡ | | | 3,300,000 | | | | 3,328,050 | |
General Motors Financial Co., Inc., 1.7000%, 8/18/23 | | | 1,000,000 | | | | 1,020,666 | |
General Motors Financial Co., Inc., 1.0500%, 3/8/24 | | | 10,125,000 | | | | 10,146,340 | |
Goodyear Tire & Rubber Co, 5.1250%, 11/15/23 | | | 5,550,000 | | | | 5,550,555 | |
Home Depot, Inc, 2.7000%, 4/1/23 | | | 9,845,000 | | | | 10,260,504 | |
Home Depot, Inc., ICE LIBOR USD 3 Month + 0.3100%, 0.5005%, 3/1/22‡ | | | 3,900,000 | | | | 3,909,048 | |
Home Depot, Inc., 0.9000%, 3/15/28 | | | 11,125,000 | | | | 10,712,684 | |
Hyundai Capital America, ICE LIBOR USD 3 Month + 0.9400%, 1.1374%, 7/8/21‡ | | | 250,000 | | | | 250,194 | |
See Notes to Schedule of Investments and Other Information and Notes to Financial Statements.
Janus Henderson Short Duration Income ETF
Schedule of Investments (unaudited)
April 30, 2021
| | | | | | | | |
| | | Shares/
Principal Amounts | | | Value | |
| Corporate Bonds – (continued) | |
| Consumer, Cyclical – (continued) | | | | | | |
Hyundai Capital America, ICE LIBOR USD 3 Month + 0.9400%, 1.1374%, 7/8/21 (144A)‡ | | | $ 3,800,000 | | | | $ 3,802,945 | |
Hyundai Capital America, 3.0000%, 6/20/22 (144A) | | | 2,700,000 | | | | 2,770,349 | |
Hyundai Capital America, 3.2500%, 9/20/22 (144A) | | | 1,088,000 | | | | 1,123,634 | |
Hyundai Capital America, 2.3750%, 2/10/23 (144A) | | | 2,900,000 | | | | 2,977,671 | |
Hyundai Capital America, 1.2500%, 9/18/23 (144A) | | | 5,670,000 | | | | 5,719,120 | |
Hyundai Capital America, 0.8000%, 1/8/24 (144A) | | | 9,050,000 | | | | 9,002,278 | |
Hyundai Capital Services, Inc., 3.0000%, 3/6/22 (144A) | | | 500,000 | | | | 509,767 | |
McDonald’s Corp., 90 Day Australian Bank Bill Rate + 1.1300%, 1.1666%, 3/8/24‡ | | | AUD1,000,000 | | | | 782,009 | |
McDonald’s Corp., 3.0000%, 3/8/24 | | | 5,700,000 | | | | 4,652,295 | |
McDonald’s Corp., 3.1250%, 3/4/25 | | | CAD17,080,000 | | | | 14,820,392 | |
Mercedes-Benz Australia/Pacific Pty, Ltd., 2.5000%, 3/20/22 | | | AUD6,870,000 | | | | 5,397,812 | |
Nissan Motor Acceptance Corp., ICE LIBOR USD 3 Month + 0.6300%, 0.8166%, 9/21/21 (144A)‡ | | | $3,500,000 | | | | 3,503,371 | |
Ralph Lauren Corp., 1.7000%, 6/15/22 | | | 5,000,000 | | | | 5,081,827 | |
Toyota Motor Corp., 0.6810%, 3/25/24 | | | 2,700,000 | | | | 2,711,426 | |
Toyota Motor Credit Corp., 0.5000%, 8/14/23 | | | 10,500,000 | | | | 10,536,601 | |
Toyota Motor Credit Corp., 0.4500%, 1/11/24 | | | 12,250,000 | | | | 12,250,376 | |
Toyota Motor Credit Corp., 1.8000%, 2/13/25 | | | 7,000,000 | | | | 7,243,226 | |
Volkswagen Financial Services Australia Pty, Ltd., 3.3000%, 2/28/22 | | | AUD400,000 | | | | 315,496 | |
Volkswagen Group of America Finance LLC, ICE LIBOR USD 3 Month + 0.9400%, 1.1409%, 11/12/21 (144A)‡ | | | $9,600,000 | | | | 9,641,266 | |
Volkswagen Group of America Finance LLC, 2.9000%, 5/13/22 (144A) | | | 2,400,000 | | | | 2,460,253 | |
Volkswagen Group of America Finance LLC, 0.8750%, 11/22/23 (144A) | | | 12,300,000 | | | | 12,354,275 | |
Walmart, Inc., ICE LIBOR USD 3 Month + 0.2300%, 0.4269%, 6/23/21‡ | | | 5,200,000 | | | | 5,202,016 | |
Walmart, Inc., 3.3000%, 4/22/24 | | | 4,287,000 | | | | 4,624,020 | |
Walmart, Inc., 2.8500%, 7/8/24 | | | 4,000,000 | | | | 4,295,781 | |
| | | | | | | | |
| | | | | | | 266,771,512 | |
| Consumer, Non-cyclical – 6.2% | |
Boston Scientific Corp., 3.4500%, 3/1/24 | | | 3,200,000 | | | | 3,432,897 | |
Cardinal Health, Inc., ICE LIBOR USD 3 Month + 0.7700%, 0.9539%, 6/15/22‡ | | | 11,965,000 | | | | 12,026,981 | |
Cardinal Health, Inc., 3.0790%, 6/15/24 | | | 8,600,000 | | | | 9,158,764 | |
ConnectEast Finance Pty, Ltd., 4.2500%, 2/25/22 | | | AUD2,200,000 | | | | 1,735,056 | |
Constellation Brands, Inc., 2.7000%, 5/9/22 | | | $2,550,000 | | | | 2,603,195 | |
Constellation Brands, Inc., 2.6500%, 11/7/22 | | | 4,600,000 | | | | 4,746,509 | |
Constellation Brands, Inc., 3.2000%, 2/15/23 | | | 3,500,000 | | | | 3,658,056 | |
CVS Health Corp., 2.1250%, 6/1/21 | | | 7,204,000 | | | | 7,207,746 | |
CVS Health Corp., 4.7500%, 12/1/22 | | | 5,300,000 | | | | 5,588,459 | |
CVS Health Corp., 3.3750%, 8/12/24 | | | 7,485,000 | | | | 8,067,765 | |
CVS Health Corp., 2.6250%, 8/15/24 | | | 3,690,000 | | | | 3,913,047 | |
Fonterra Co-operative Group, Ltd., 4.5000%, 6/30/21 | | | AUD2,200,000 | | | | 1,710,807 | |
Hershey Co, 2.3000%, 8/15/26 | | | $3,894,000 | | | | 4,122,180 | |
Hershey Co., 0.9000%, 6/1/25 | | | 7,906,000 | | | | 7,908,685 | |
Johnson & Johnson, 0.5500%, 9/1/25 | | | 23,300,000 | | | | 23,115,817 | |
Lonsdale Finance Pty, Ltd., 2.4500%, 11/20/26 | | | AUD3,300,000 | | | | 2,624,016 | |
Mars, Inc., 2.7000%, 4/1/25 (144A) | | | $4,097,000 | | | | 4,358,376 | |
Molson Coors Beverage Co., 2.1000%, 7/15/21 | | | 8,700,000 | | | | 8,719,465 | |
Mondelez International Holdings Netherlands BV, 2.0000%, 10/28/21 (144A) | | | 2,677,000 | | | | 2,695,048 | |
Mondelez International, Inc., 0.6250%, 7/1/22 | | | 18,832,000 | | | | 18,894,693 | |
Mondelez International, Inc., 3.2500%, 3/7/25 | | | CAD4,100,000 | | | | 3,555,855 | |
Nestle Holdings, Inc., 0.3750%, 1/15/24 (144A) | | | $11,800,000 | | | | 11,766,350 | |
PayPal Holdings, Inc., 1.3500%, 6/1/23 | | | 19,969,000 | | | | 20,336,323 | |
Transurban Finance Co. Pty, Ltd., 3.3750%, 3/22/27 (144A) | | | 210,000 | | | | 227,511 | |
Unilever Capital Corp., 0.3750%, 9/14/23 | | | 4,700,000 | | | | 4,708,985 | |
Utah Acquisition Sub, Inc., 3.1500%, 6/15/21 | | | 220,000 | | | | 220,469 | |
WSO Finance Pty, Ltd., 3.5000%, 7/14/23 | | | AUD3,150,000 | | | | 2,550,800 | |
WSO Finance Pty, Ltd., 4.5000%, 3/31/27 | | | 800,000 | | | | 705,122 | |
WSO Finance Pty, Ltd., 4.5000%, 9/30/27 | | | 5,000,000 | | | | 4,435,772 | |
| | | | | | | | |
| | | | | | | 184,794,749 | |
See Notes to Schedule of Investments and Other Information and Notes to Financial Statements.
| | |
| | Janus Detroit Street Trust ½ 5 |
Janus Henderson Short Duration Income ETF
Schedule of Investments (unaudited)
April 30, 2021
| | | | | | | | |
| | | Shares/
Principal Amounts | | | Value | |
| Corporate Bonds – (continued) | |
| Diversified – 0.4% | |
CK Hutchison International 16, Ltd., 1.8750%, 10/3/21 | | | $400,000 | | | | $ 402,004 | |
CK Hutchison International 16, Ltd., 1.8750%, 10/3/21 (144A) | | | 1,100,000 | | | | 1,105,511 | |
CK Hutchison International 17 II, Ltd., 2.7500%, 3/29/23 (144A) | | | 1,200,000 | | | | 1,247,676 | |
CK Hutchison International 17, Ltd., 2.8750%, 4/5/22 | | | 4,000,000 | | | | 4,087,576 | |
CK Hutchison International 19, Ltd., 3.2500%, 4/11/24 (144A) | | | 5,700,000 | | | | 6,084,554 | |
| | | | | | | | |
| | | | | | | 12,927,321 | |
| Energy – 1.8% | |
Chevron USA, Inc., ICE LIBOR USD 3 Month + 0.1100%, 0.3109%, 8/12/22‡ | | | 21,000,000 | | | | 21,011,249 | |
Enbridge, Inc., ICE LIBOR USD 3 Month + 0.4000%, 0.4134%, 2/17/23‡ | | | 6,200,000 | | | | 6,207,852 | |
Harvest Operations Corp., 4.2000%, 6/1/23 (144A) | | | 2,700,000 | | | | 2,891,484 | |
Harvest Operations Corp., 1.0000%, 4/26/24 (144A) | | | 5,950,000 | | | | 5,949,643 | |
Sinopec Group Overseas Development 2018, Ltd., 3.7500%, 9/12/23 (144A) | | | 5,000,000 | | | | 5,311,051 | |
Sinopec Group Overseas Development 2018, Ltd., 3.7500%, 9/12/23 | | | 600,000 | | | | 637,326 | |
Sinopec Group Overseas Development 2018, Ltd., 2.5000%, 8/8/24 (144A) | | | 3,300,000 | | | | 3,442,138 | |
Sinopec Group Overseas Development 2018, Ltd., 2.5000%, 11/12/24 (144A) | | | 2,100,000 | | | | 2,202,094 | |
Sinopec Group Overseas Development 2018, Ltd., 1.4500%, 1/8/26 (144A) | | | 5,500,000 | | | | 5,444,891 | |
| | | | | | | | |
| | | | | | | 53,097,728 | |
| Financial – 42.3% | |
AAI, Ltd., 90 Day Australian Bank Bill Rate + 3.2000%, 3.2351%, 10/6/42‡ | | | AUD7,170,000 | | | | 5,673,005 | |
American Express Co., ICE LIBOR USD 3 Month + 0.6200%, 0.8020%, 5/20/22‡ | | | $12,650,000 | | | | 12,710,885 | |
American Express Co., 2.7500%, 5/20/22 | | | 3,300,000 | | | | 3,379,659 | |
American Express Co., ICE LIBOR USD 3 Month + 0.6100%, 0.7856%, 8/1/22‡ | | | 2,150,000 | | | | 2,161,632 | |
American Express Co., 2.5000%, 7/30/24 | | | 2,400,000 | | | | 2,547,553 | |
American Tower Corp., 1.6000%, 4/15/26 | | | 9,950,000 | | | | 10,006,840 | |
AMP Bank, Ltd., 90 Day Australian Bank Bill Rate + 1.3500%, 1.3602%, 5/24/21‡ | | | AUD7,350,000 | | | | 5,679,462 | |
ANZ New Zealand Int’l, Ltd., ICE LIBOR USD 3 Month + 1.0100%, 1.1940%, 7/28/21 (144A)‡ | | | $1,725,000 | | | | 1,728,873 | |
ANZ New Zealand Int’l, Ltd., 3.4000%, 3/19/24 (144A) | | | 1,000,000 | | | | 1,078,558 | |
ASB Bank, Ltd., ICE LIBOR USD 3 Month + 0.9700%, 1.1539%, 6/14/23 (144A)‡ | | | 5,810,000 | | | | 5,899,375 | |
Australia & New Zealand Banking Group, Ltd., ICE LIBOR USD 3 Month + 0.4600%, 0.6515%, 5/17/21‡ | | | 750,000 | | | | 750,137 | |
Australia & New Zealand Banking Group, Ltd., ICE LIBOR USD 3 Month + 0.4600%, 0.6515%, 5/17/21 (144A)‡ | | | 6,600,000 | | | | 6,601,208 | |
Australia & New Zealand Banking Group, Ltd., ICE LIBOR USD 3 Month + 0.8700%, 1.0453%, 11/23/21 (144A)‡ | | | 500,000 | | | | 502,333 | |
Australia & New Zealand Banking Group, Ltd., 90 Day Australian Bank Bill Rate + 0.8800%, 0.8898%, 2/8/22‡ | | | AUD1,200,000 | | | | 932,519 | |
Australia & New Zealand Banking Group, Ltd., 90 Day Australian Bank Bill Rate + 1.0000%, 1.0366%, 3/7/22‡ | | | 3,000,000 | | | | 2,334,718 | |
Australia & New Zealand Banking Group, Ltd., ICE LIBOR USD 3 Month + 0.5800%, 0.7709%, 11/9/22 (144A)‡ | | | $7,535,000 | | | | 7,588,446 | |
Australia & New Zealand Banking Group, Ltd., ICE LIBOR USD 3 Month + 0.4900%, 0.6724%, 11/21/22 (144A)‡ | | | 250,000 | | | | 251,631 | |
Australia & New Zealand Banking Group, Ltd., 90 Day Australian Bank Bill Rate + 2.7000%, 2.7101%, 5/17/26‡ | | | AUD4,672,000 | | | | 3,611,756 | |
Australia & New Zealand Banking Group, Ltd., 90 Day Australian Bank Bill Rate + 1.8500%, 4.7500%, 5/13/27‡ | | | 3,170,000 | | | | 2,541,792 | |
Australia & New Zealand Banking Group, Ltd., US Treasury Yield Curve Rate + 1.2880%, 2.9500%, 7/22/30 (144A)‡ | | | $23,781,000 | | | | 24,653,763 | |
Aviation Capital Group LLC, 1.9500%, 1/30/26 (144A) | | | 12,200,000 | | | | 11,959,947 | |
Bank of America Corp., ICE LIBOR USD 3 Month + 1.4600%, 1.4860%, 5/19/24‡ | | | 14,600,000 | | | | 14,846,022 | |
Bank of America Corp., ICE LIBOR USD 3 Month + 0.9600%, 1.1329%, 7/23/24‡ | | | 7,400,000 | | | | 7,495,827 | |
Bank of America Corp., ICE LIBOR USD 3 Month + 0.9700%, 3.4580%, 3/15/25‡ | | | 2,800,000 | | | | 3,001,829 | |
Bank of America Corp., ICE LIBOR USD 3 Month + 0.9100%, 0.9810%, 9/25/25‡ | | | 18,000,000 | | | | 17,984,348 | |
Bank of America Corp., 0.6000%, 1/26/26Ç | | | 2,000,000 | | | | 1,916,783 | |
Bank of America Corp., ICE LIBOR USD 3 Month + 0.9100%, 1.6580%, 3/11/27‡ | | | 18,500,000 | | | | 18,655,544 | |
See Notes to Schedule of Investments and Other Information and Notes to Financial Statements.
Janus Henderson Short Duration Income ETF
Schedule of Investments (unaudited)
April 30, 2021
| | | | | | | | |
| | | Shares/
Principal Amounts | | | Value | |
| Corporate Bonds – (continued) | |
| Financial – (continued) | |
Bank of China, Ltd., ICE LIBOR USD 3 Month + 0.7300%, 0.9055%, 6/7/21‡ | | | $ 310,000 | | | | $ 310,074 | |
Bank of China, Ltd., 90 Day Australian Bank Bill Rate + 1.2300%, 1.2713%, 4/20/22‡ | | | AUD800,000 | | | | 623,379 | |
Bank of China, Ltd., ICE LIBOR USD 3 Month + 0.8800%, 1.0678%, 7/11/22‡ | | | $400,000 | | | | 401,150 | |
Bank of Montreal, 2.9000%, 3/26/22 | | | 3,270,000 | | | | 3,347,739 | |
Bank of Montreal, ICE LIBOR USD 3 Month + 0.6300%, 0.8073%, 9/11/22‡ | | | 500,000 | | | | 503,782 | |
Bank of Montreal, 2.0500%, 11/1/22 | | | 185,000 | | | | 189,882 | |
Bank of Montreal, ICE LIBOR USD 3 Month + 0.3500%, 0.3608%, 12/8/23‡ | | | 21,000,000 | | | | 21,011,539 | |
Bank of Montreal, 1.8500%, 5/1/25 | | | 8,100,000 | | | | 8,359,502 | |
Bank of Nova Scotia, 0.7000%, 4/15/24 | | | 6,800,000 | | | | 6,804,440 | |
Bank of Nova Scotia, 1.3000%, 6/11/25 | | | 8,000,000 | | | | 8,081,806 | |
Bank of Nova Scotia, 1.0500%, 3/2/26 | | | 16,700,000 | | | | 16,523,431 | |
Bank of Queensland, Ltd., 90 Day Australian Bank Bill Rate + 1.0200%, 1.0303%, 11/16/21‡ | | | AUD1,500,000 | | | | 1,163,927 | |
Bank of Queensland, Ltd., 90 Day Australian Bank Bill Rate + 3.4000%, 3.4108%, 5/10/26‡ | | | 13,960,000 | | | | 10,788,056 | |
Bank of Queensland, Ltd., 90 Day Australian Bank Bill Rate + 1.8500%, 1.8900%, 5/1/28‡ | | | 6,800,000 | | | | 5,298,896 | |
Barclays PLC, ICE LIBOR USD 3 Month + 1.4300%, 1.6238%, 2/15/23‡ | | | $14,700,000 | | | | 14,809,316 | |
Barclays PLC, US Treasury Yield Curve Rate + 0.0800%, 1.0070%, 12/10/24‡ | | | 8,000,000 | | | | 8,012,964 | |
Bendigo & Adelaide Bank, Ltd., 90 Day Australian Bank Bill Rate + 1.0100%, 1.0541%, 1/19/22‡ | | | AUD7,200,000 | | | | 5,594,441 | |
Bendigo & Adelaide Bank, Ltd., 90 Day Australian Bank Bill Rate + 1.0500%, 1.0900%, 1/25/23‡ | | | 1,500,000 | | | | 1,173,635 | |
Bendigo & Adelaide Bank, Ltd., 90 Day Australian Bank Bill Rate + 2.8000%, 2.8388%, 12/9/26‡ | | | 11,400,000 | | | | 8,908,450 | |
Bendigo & Adelaide Bank, Ltd., 90 Day Australian Bank Bill Rate + 2.4500%, 2.4800%, 11/30/28‡ | | | 8,800,000 | | | | 6,984,306 | |
BNZ International Funding, Ltd., ICE LIBOR USD 3 Month + 0.9800%, 1.1639%, 9/14/21 (144A)‡ | | | $1,200,000 | | | | 1,203,959 | |
Canadian Imperial Bank of Commerce, 0.9500%, 6/23/23 | | | 8,050,000 | | | | 8,129,964 | |
Canadian Imperial Bank of Commerce, ICE LIBOR USD 3 Month + 0.6600%, 0.8439%, 9/13/23‡ | | | 2,240,000 | | | | 2,271,258 | |
Capital One Financial Corp., ICE LIBOR USD 3 Month + 0.7200%, 0.9055%, 1/30/23‡ | | | 7,700,000 | | | | 7,754,092 | |
Capital One Financial Corp., 2.6000%, 5/11/23 | | | 2,600,000 | | | | 2,705,302 | |
Capital One NA, 2.1500%, 9/6/22 | | | 2,000,000 | | | | 2,044,659 | |
Capital One NA, ICE LIBOR USD 3 Month + 1.1500%, 1.3355%, 1/30/23‡ | | | 2,675,000 | | | | 2,691,924 | |
Cboe Global Markets, Inc., 3.6500%, 1/12/27 | | | 350,000 | | | | 387,443 | |
Charles Schwab Corp, 0.7500%, 3/18/24 | | | 14,200,000 | | | | 14,293,170 | |
Charter Hall Exchange Finance Pty, Ltd., 2.3170%, 9/25/30 | | | AUD3,700,000 | | | | 2,736,503 | |
Citibank NA, 90 Day Australian Bank Bill Rate + 0.7500%, 0.7627%, 5/20/22‡ | | | 16,500,000 | | | | 12,809,005 | |
Citigroup, Inc., 90 Day Australian Bank Bill Rate + 1.5500%, 1.5597%, 5/4/21‡ | | | 9,165,000 | | | | 7,079,505 | |
Citigroup, Inc., ICE LIBOR USD 3 Month + 0.8670%, 2.3120%, 11/4/22‡ | | | $1,750,000 | | | | 1,766,309 | |
Citigroup, Inc., ICE LIBOR USD 3 Month + 0.7220%, 3.1420%, 1/24/23‡ | | | 2,000,000 | | | | 2,038,180 | |
Citigroup, Inc., ICE LIBOR USD 3 Month + 0.6690%, 0.9810%, 5/1/25‡ | | | 19,760,000 | | | | 19,818,658 | |
Citigroup, Inc., ICE LIBOR USD 3 Month + 0.7650%, 1.1220%, 1/28/27‡ | | | 23,300,000 | | | | 22,917,095 | |
Commonwealth Bank of Australia, ICE LIBOR USD 3 Month + 0.8300%, 1.0055%, 9/6/21 (144A)‡ | | | 1,350,000 | | | | 1,353,797 | |
Commonwealth Bank of Australia, ICE LIBOR USD 3 Month + 0.8300%, 1.0055%, 9/6/21‡ | | | 2,400,000 | | | | 2,406,751 | |
Commonwealth Bank of Australia, ICE LIBOR USD 3 Month + 0.7000%, 0.8825%, 3/10/22 (144A)‡ | | | 850,000 | | | | 854,391 | |
Commonwealth Bank of Australia, ICE LIBOR USD 3 Month + 0.7000%, 0.8825%, 3/10/22‡ | | | 350,000 | | | | 351,808 | |
Commonwealth Bank of Australia, ICE LIBOR USD 3 Month + 0.6800%, 0.8700%, 9/18/22 (144A)‡ | | | 1,800,000 | | | | 1,814,155 | |
Commonwealth Bank of Australia, ICE LIBOR USD 3 Month + 0.7000%, 0.8895%, 3/16/23 (144A)‡ | | | 3,000,000 | | | | 3,030,831 | |
See Notes to Schedule of Investments and Other Information and Notes to Financial Statements.
| | |
| | Janus Detroit Street Trust ½ 7 |
Janus Henderson Short Duration Income ETF
Schedule of Investments (unaudited)
April 30, 2021
| | | | | | | | |
| | | Shares/
Principal Amounts | | | Value | |
| Corporate Bonds – (continued) | |
| Financial – (continued) | |
Commonwealth Bank of Australia, ICE LIBOR USD 3 Month + 0.8200%, 1.0034%, 6/4/24 (144A)‡ | | | $ 6,100,000 | | | | $ 6,220,552 | |
Commonwealth Bank of Australia, 3.3500%, 6/4/24 | | | 7,164,000 | | | | 7,767,228 | |
Commonwealth Bank of Australia, 90 Day Australian Bank Bill Rate + 2.6500%, 2.6800%, 6/3/26‡ | | | AUD13,100,000 | | | | 10,137,703 | |
Commonwealth Bank of Australia, ICE LIBOR USD 3 Month + 2.0940%, 3.3750%, 10/20/26‡ | | | $13,220,000 | | | | 13,350,349 | |
Cooperatieve Rabobank UA, ICE LIBOR USD 3 Month + 0.8300%, 1.0178%, 1/10/22‡ | | | 3,800,000 | | | | 3,821,726 | |
Cooperatieve Rabobank UA, ICE LIBOR USD 3 Month + 0.4800%, 0.6678%, 1/10/23‡ | | | 1,800,000 | | | | 1,810,375 | |
Cooperatieve Rabobank UA, ICE LIBOR USD 3 Month + 0.8600%, 1.0551%, 9/26/23 (144A)‡ | | | 3,000,000 | | | | 3,041,610 | |
Cooperatieve Rabobank UA, 0.3750%, 1/12/24 | | | 12,200,000 | | | | 12,164,270 | |
Cooperatieve Rabobank UA, 2.6250%, 7/22/24 (144A) | | | 1,000,000 | | | | 1,056,964 | |
Cooperatieve Rabobank UA, US Treasury Yield Curve Rate + 1.0000%, 1.3390%, 6/24/26 (144A)‡ | | | 5,400,000 | | | | 5,411,132 | |
Credit Union Australia, Ltd., 90 Day Australian Bank Bill Rate + 1.2500%, 1.2866%, 9/6/21‡ | | | AUD1,200,000 | | | | 930,268 | |
Credit Union Australia, Ltd., 90 Day Australian Bank Bill Rate + 1.2300%, 1.2626%, 3/4/22‡ | | | 5,300,000 | | | | 4,127,404 | |
DBS Group Holdings, Ltd., USD SWAP SEMI 30/360 5YR + 2.3900%, 3.6000%, 9/7/21‡ | | | $225,000 | | | | 226,125 | |
DBS Group Holdings, Ltd., USD SWAP SEMI 30/360 5YR + 2.3900%, 3.6000%, 9/7/21‡ | | | 1,575,000 | | | | 1,582,875 | |
DBS Group Holdings, Ltd., 2.8500%, 4/16/22 (144A) | | | 3,300,000 | | | | 3,376,131 | |
DBS Group Holdings, Ltd., 90 Day Australian Bank Bill Rate + 1.5800%, 1.6140%, 3/16/28‡ | | | AUD21,370,000 | | | | 16,671,726 | |
DBS Group Holdings, Ltd., ICE LIBOR USD 3 Month + 1.5900%, 4.5200%, 12/11/28‡ | | | $3,000,000 | | | | 3,249,118 | |
DBS Group Holdings, Ltd., ICE LIBOR USD 3 Month + 1.5900%, 4.5200%, 12/11/28 (144A)‡ | | | 3,600,000 | | | | 3,898,942 | |
DEXUS Finance Pty, Ltd., 4.2000%, 11/9/22 | | | AUD3,000,000 | | | | 2,438,040 | |
Dexus Wholesale Property Fund, 4.7500%, 6/16/25 | | | 2,400,000 | | | | 2,083,036 | |
GAIF Bond Issuer Pty, Ltd., 3.4000%, 9/30/26 (144A) | | | $3,290,000 | | | | 3,544,965 | |
GAIF Bond Issuer Pty, Ltd., 3.4000%, 9/30/26 | | | 3,289,000 | | | | 3,543,888 | |
General Property Trust, 3.6725%, 9/19/24 | | | AUD2,200,000 | | | | 1,832,777 | |
General Property Trust, 3.5910%, 11/7/23 | | | 700,000 | | | | 573,377 | |
Goldman Sachs Group, Inc., 90 Day Australian Bank Bill Rate + 1.3700%, 1.4066%, 9/8/21‡ | | | 890,000 | | | | 690,044 | |
Goldman Sachs Group, Inc., 0.4810%, 1/27/23 | | | $6,250,000 | | | | 6,253,655 | |
Goldman Sachs Group, Inc., ICE LIBOR USD 3 Month + 0.7500%, 0.9253%, 2/23/23‡ | | | 17,082,000 | | | | 17,214,192 | |
Goldman Sachs Group, Inc., ICE LIBOR USD 3 Month + 1.0500%, 1.2438%, 6/5/23‡ | | | 1,550,000 | | | | 1,561,766 | |
Goldman Sachs Group, Inc., ICE LIBOR USD 3 Month + 0.5380%, 0.6270%, 11/17/23‡ | | | 15,350,000 | | | | 15,369,229 | |
Goldman Sachs Group, Inc., ICE LIBOR USD 3 Month + 0.5720%, 0.6730%, 3/8/24‡ | | | 12,000,000 | | | | 12,016,449 | |
Goldman Sachs Group, Inc., 3.5000%, 4/1/25 | | | 6,500,000 | | | | 7,069,167 | |
Goldman Sachs Group, Inc., ICE LIBOR USD 3 Month + 1.2010%, 3.2720%, 9/29/25‡ | | | 2,475,000 | | | | 2,658,415 | |
GPT Wholesale Office Fund No. 1, 4.0000%, 5/18/22 | | | AUD1,900,000 | | | | 1,494,414 | |
GPT Wholesale Shopping Centre Fund No. 1, 3.9930%, 9/11/24 | | | 5,600,000 | | | | 4,625,100 | |
Heritage Bank, Ltd., 90 Day Australian Bank Bill Rate + 0.8200%, 0.8300%, 8/12/22‡ | | | 3,780,000 | | | | 2,934,645 | |
Horse Gallop Finance, Ltd., ICE LIBOR USD 3 Month + 1.1800%, 1.3730%, 6/28/21‡ | | | $7,587,000 | | | | 7,587,379 | |
ICBCIL Finance Co., Ltd., 3.6500%, 3/5/22 | | | 500,000 | | | | 509,700 | |
Industrial & Commercial Bank of China, Ltd., ICE LIBOR USD 3 Month + 0.7300%, 0.9139%, 6/14/21‡ | | | 6,400,000 | | | | 6,401,613 | |
See Notes to Schedule of Investments and Other Information and Notes to Financial Statements.
Janus Henderson Short Duration Income ETF
Schedule of Investments (unaudited)
April 30, 2021
| | | | | | | | |
| | | Shares/
Principal Amounts | | | Value | |
| Corporate Bonds – (continued) | |
| Financial – (continued) | |
Insurance Australia Group, Ltd., 90 Day Australian Bank Bill Rate + 2.4500%, 2.4869%, 12/15/36‡ | | | AUD6,950,000 | | | | $ 5,502,110 | |
Insurance Australia Group, Ltd., 90 Day Australian Bank Bill Rate + 2.1000%, 2.1369%, 6/15/44‡ | | | 14,800,000 | | | | 11,556,632 | |
Insurance Australia Group, Ltd., 90 Day Australian Bank Bill Rate + 2.3500%, 2.3869%, 6/15/45‡ | | | 6,730,000 | | | | 5,305,381 | |
JPMorgan Chase & Co., ICE LIBOR USD 3 Month + 0.6950%, 3.2070%, 4/1/23‡ | | | $3,900,000 | | | | 4,001,860 | |
JPMorgan Chase & Co., ICE LIBOR USD 3 Month + 0.9000%, 1.0758%, 4/25/23‡ | | | 4,550,000 | | | | 4,579,850 | |
JPMorgan Chase & Co., ICE LIBOR USD 3 Month + 1.2300%, 1.4058%, 10/24/23‡ | | | 950,000 | | | | 963,417 | |
JPMorgan Chase & Co., ICE LIBOR USD 3 Month + 0.7300%, 0.9029%, 4/23/24‡ | | | 2,649,000 | | | | 2,667,440 | |
JPMorgan Chase & Co., ICE LIBOR USD 3 Month + 1.4550%, 1.5140%, 6/1/24‡ | | | 13,500,000 | | | | 13,758,878 | |
JPMorgan Chase & Co., ICE LIBOR USD 3 Month + 0.6000%, 0.6530%, 9/16/24‡ | | | 6,400,000 | | | | 6,410,158 | |
JPMorgan Chase & Co., ICE LIBOR USD 3 Month + 0.4200%, 0.5630%, 2/16/25‡ | | | 8,000,000 | | | | 7,952,745 | |
JPMorgan Chase & Co., ICE LIBOR USD 3 Month + 0.8000%, 1.0450%, 11/19/26‡ | | | 21,000,000 | | | | 20,689,251 | |
JPMorgan Chase & Co., ICE LIBOR USD 3 Month + 0.6950%, 1.0400%, 2/4/27‡ | | | 10,000,000 | | | | 9,811,014 | |
Liberty Financial Pty, Ltd., 90 Day Australian Bank Bill Rate + 3.2500%, 3.2888%, 3/7/22‡ | | | AUD8,300,000 | | | | 6,492,824 | |
Lloyds Banking Group PLC, 90 Day Australian Bank Bill Rate + 1.3000%, 1.3305%, 3/20/23‡ | | | 3,000,000 | | | | 2,341,889 | |
Lloyds Banking Group PLC, 3.6500%, 3/20/23 | | | 1,500,000 | | | | 1,219,224 | |
Lloyds Banking Group PLC, US Treasury Yield Curve Rate + 1.1000%, 1.3260%, 6/15/23‡ | | | $9,300,000 | | | | 9,386,812 | |
Lloyds Banking Group PLC, ICE LIBOR USD 3 Month + 0.8100%, 2.9070%, 11/7/23‡ | | | 3,400,000 | | | | 3,521,226 | |
Lloyds Banking Group PLC, 3.9000%, 11/23/23 | | | AUD250,000 | | | | 206,813 | |
Lloyds Banking Group PLC, 3.9000%, 3/12/24 | | | $4,880,000 | | | | 5,295,808 | |
Lloyds Banking Group PLC, US Treasury Yield Curve Rate + 0.5500%, 0.6950%, 5/11/24‡ | | | 5,700,000 | | | | 5,706,989 | |
Macquarie Bank, Ltd., 2.1000%, 10/17/22 (144A) | | | 50,000 | | | | 51,279 | |
Macquarie Bank, Ltd., 2.3000%, 1/22/25 (144A) | | | 11,500,000 | | | | 11,978,444 | |
Macquarie Group, Ltd., 90 Day Australian Bank Bill Rate + 1.1500%, 1.1869%, 12/15/22‡ | | | AUD500,000 | | | | 387,574 | |
Macquarie Group, Ltd., ICE LIBOR USD 3 Month + 1.0200%, 1.2098%, 11/28/23‡ | | | $15,000,000 | | | | 15,142,050 | |
Macquarie Group, Ltd., ICE LIBOR USD 3 Month + 1.0200%, 1.2098%, 11/28/23 (144A)‡ | | | 6,949,000 | | | | 7,014,807 | |
Macquarie Group, Ltd., ICE LIBOR USD 3 Month + 1.0230%, 3.1890%, 11/28/23 (144A)‡ | | | 9,300,000 | | | | 9,665,955 | |
Macquarie Group, Ltd., ICE LIBOR USD 3 Month + 1.3500%, 1.5430%, 3/27/24‡ | | | 7,302,000 | | | | 7,424,136 | |
Marsh & McLennan Cos., Inc., 2.7500%, 1/30/22 | | | 4,751,000 | | | | 4,828,624 | |
Members Equity Bank, Ltd., 90 Day Australian Bank Bill Rate + 0.9800%, 1.0241%, 7/18/22‡ | | | AUD$1,300,000 | | | | 1,011,431 | |
Mitsubishi UFJ Financial Group, Inc., US Treasury Yield Curve Rate + 0.6800%, 0.8480%, 9/15/24‡ | | | $8,600,000 | | | | 8,623,363 | |
Mizuho Financial Group, Inc., ICE LIBOR USD 3 Month + 0.9400%, 1.1298%, 2/28/22‡ | | | 2,844,000 | | | | 2,862,868 | |
Mizuho Financial Group, Inc., ICE LIBOR USD 3 Month + 0.8800%, 1.0573%, 9/11/22‡ | | | 13,615,000 | | | | 13,744,902 | |
Mizuho Financial Group, Inc., ICE LIBOR USD 3 Month + 1.2516%, 1.2410%, 7/10/24‡ | | | 6,700,000 | | | | 6,778,340 | |
Mizuho Financial Group, Inc., ICE LIBOR USD 3 Month + 0.8716%, 0.8490%, 9/8/24‡ | | | 6,700,000 | | | | 6,718,508 | |
Morgan Stanley, 5.0000%, 9/30/21 | | | AUD200,000 | | | | 157,352 | |
Morgan Stanley, ICE LIBOR USD 3 Month + 0.9300%, 1.1138%, 7/22/22‡ | | | $5,000,000 | | | | 5,007,797 | |
Morgan Stanley, ICE LIBOR USD 3 Month + 0.7000%, 0.7100%, 1/20/23‡ | | | 19,949,000 | | | | 19,988,513 | |
Morgan Stanley, CDOR USD 3 Month + 0.30000%, 0.7350%, 2/3/23‡ | | | CAD8,150,000 | | | | 6,627,390 | |
Morgan Stanley, ICE LIBOR USD 3 Month + 1.4000%, 1.5758%, 10/24/23‡ | | | $10,005,000 | | | | 10,166,635 | |
Morgan Stanley, ICE LIBOR USD 3 Month + 0.4660%, 0.5600%, 11/10/23‡ | | | 5,000,000 | | | | 5,005,724 | |
Morgan Stanley, ICE LIBOR USD 3 Month + 0.4550%, 0.5290%, 1/25/24‡ | | | 7,200,000 | | | | 7,195,673 | |
Morgan Stanley, ICE LIBOR USD 3 Month + 0.8470%, 3.7370%, 4/24/24‡ | | | 3,500,000 | | | | 3,715,978 | |
Morgan Stanley, ICE LIBOR USD 3 Month + 0.8790%, 1.5930%, 5/4/27‡ | | | 1,800,000 | | | | 1,808,614 | |
See Notes to Schedule of Investments and Other Information and Notes to Financial Statements.
| | |
| | Janus Detroit Street Trust ½ 9 |
Janus Henderson Short Duration Income ETF
Schedule of Investments (unaudited)
April 30, 2021
| | | | | | | | |
| | | Shares/
Principal Amounts | | | Value | |
| Corporate Bonds – (continued) | |
| Financial – (continued) | |
National Australia Bank, Ltd., ICE LIBOR USD 3 Month + 0.5800%, 0.7666%, 9/20/21 (144A)‡ | | | $ 5,500,000 | | | | $ 5,511,177 | |
National Australia Bank, Ltd., 3.3750%, 9/20/21 | | | 2,750,000 | | | | 2,781,130 | |
National Australia Bank, Ltd., ICE LIBOR USD 3 Month + 0.7100%, 0.8856%, 11/4/21 (144A)‡ | | | 7,200,000 | | | | 7,224,356 | |
National Australia Bank, Ltd., ICE LIBOR USD 3 Month + 0.7200%, 0.9024%, 5/22/22 (144A)‡ | | | 6,000,000 | | | | 6,040,677 | |
National Australia Bank, Ltd., 90 Day Australian Bank Bill Rate + 0.9000%, 0.9351%, 7/5/22‡ | | | AUD200,000 | | | | 155,897 | |
National Australia Bank, Ltd., 90 Day Australian Bank Bill Rate + 0.8000%, 0.8108%, 2/10/23‡ | | | 2,000,000 | | | | 1,561,793 | |
National Australia Bank, Ltd., 90 Day Australian Bank Bill Rate + 2.4000%, 2.4305%, 9/21/26‡ | | | 23,266,000 | | | | 18,105,061 | |
National Australia Bank, Ltd., 90 Day Australian Bank Bill Rate + 2.1500%, 2.1601%, 5/17/29‡ | | | 600,000 | | | | 476,282 | |
National Australia Bank, Ltd., 90 Day Australian Bank Bill Rate + 1.7000%, 1.7100%, 11/18/30‡ | | | 16,000,000 | | | | 12,518,927 | |
National Australia Bank, Ltd., 90 Day Australian Bank Bill Rate + 2.0200%, 2.0300%, 11/18/31‡ | | | 300,000 | | | | 238,804 | |
Nordea Bank Abp, 1.0000%, 6/9/23 (144A) | | | $6,500,000 | | | | 6,578,639 | |
Nordea Bank Abp, ICE LIBOR USD 3 Month + 0.9400%, 1.1298%, 8/30/23 (144A)‡ | | | 5,700,000 | | | | 5,761,655 | |
Nordea Bank Abp, 0.7500%, 8/28/25 (144A) | | | 9,000,000 | | | | 8,881,203 | |
Oversea-Chinese Banking Corp., Ltd., 4.2500%, 6/19/24 (144A) | | | 616,000 | | | | 672,457 | |
Oversea-Chinese Banking Corp., Ltd., 4.2500%, 6/19/24 | | | 2,930,000 | | | | 3,198,540 | |
QIC Finance Shopping Center Fund Pty, Ltd., 90 Day Australian Bank Bill Rate + 1.2700%, 1.2800%, 8/15/25‡ | | | AUD2,620,000 | | | | 2,027,801 | |
Royal Bank of Canada, 2.3520%, 7/2/24 | | | CAD20,200,000 | | | | 17,063,762 | |
Royal Bank of Canada, 1.2000%, 4/27/26 | | | $13,500,000 | | | | 13,459,118 | |
Scentre Group Trust 1, 4.5000%, 9/8/21 | | | AUD10,500,000 | | | | 8,143,336 | |
Shopping Centres Australasia Property Retail Trust, 3.9000%, 6/7/24 | | | 4,600,000 | | | | 3,831,990 | |
Sumitomo Mitsui Financial Group, Inc., 90 Day Australian Bank Bill Rate + 1.2700%, 1.3002%, 3/29/22‡ | | | 1,136,000 | | | | 884,449 | |
Sumitomo Mitsui Financial Group, Inc., ICE LIBOR USD 3 Month + 0.7400%, 0.9298%, 1/17/23‡ | | | $5,000,000 | | | | 5,037,280 | |
Sumitomo Mitsui Financial Group, Inc., ICE LIBOR USD 3 Month + 0.8600%, 1.0498%, 7/19/23‡ | | | 5,900,000 | | | | 5,967,355 | |
Sumitomo Mitsui Financial Group, Inc., 0.5080%, 1/12/24 | | | 4,000,000 | | | | 3,991,460 | |
Sumitomo Mitsui Financial Group, Inc., 2.6960%, 7/16/24 | | | 1,200,000 | | | | 1,266,731 | |
Sumitomo Mitsui Financial Group, Inc., 90 Day Australian Bank Bill Rate + 1.2500%, 1.2924%, 10/16/24‡ | | | AUD700,000 | | | | 548,983 | |
Sumitomo Mitsui Trust Bank, Ltd., 0.8000%, 9/12/23 (144A) | | | $4,800,000 | | | | 4,821,439 | |
Sumitomo Mitsui Trust Bank, Ltd., 0.8500%, 3/25/24 (144A) | | | 8,000,000 | | | | 8,020,546 | |
Suncorp Group, Ltd., 90 Day Australian Bank Bill Rate + 2.1500%, 2.1877%, 12/5/28‡ | | | AUD15,260,000 | | | | 12,020,704 | |
Suncorp-Metway, Ltd., 3.3000%, 4/15/24 (144A) | | | $9,920,000 | | | | 10,662,667 | |
Teachers Mutual Bank, Ltd., 90 Day Australian Bank Bill Rate + 1.3700%, 1.4051%, 7/2/21‡ | | | AUD$1,470,000 | | | | 1,137,693 | |
Toronto-Dominion Bank, 0.5500%, 3/4/24 | | | $15,000,000 | | | | 14,993,123 | |
Toronto-Dominion Bank, 2.8500%, 3/8/24 | | | CAD16,810,000 | | | | 14,384,971 | |
Toronto-Dominion Bank, 1.1500%, 6/12/25 | | | $7,200,000 | | | | 7,235,536 | |
United Overseas Bank, Ltd., USD SWAP SEMI 30/360 5YR + 1.6540%, 2.8800%, 3/8/27‡ | | | 3,095,000 | | | | 3,138,887 | |
United Overseas Bank, Ltd., USD SWAP SEMI 30/360 5YR + 1.6540%, 2.8800%, 3/8/27‡ | | | 2,050,000 | | | | 2,079,069 | |
United Overseas Bank, Ltd., US Treasury Yield Curve Rate + 1.5000%, 3.7500%, 4/15/29 (144A)‡ | | | 3,100,000 | | | | 3,306,181 | |
Vicinity Centres Trust, 3.5000%, 4/26/24 | | | AUD4,210,000 | | | | 3,446,728 | |
Wells Fargo & Co., 90 Day Australian Bank Bill Rate + 1.3200%, 1.3617%, 7/27/21‡ | | | 2,197,000 | | | | 1,701,382 | |
Wells Fargo & Co., 90 Day Australian Bank Bill Rate + 1.1000%, 1.1417%, 4/27/22‡ | | | 4,000,000 | | | | 3,112,471 | |
Wells Fargo & Co., ICE LIBOR USD 3 Month + 1.6000%, 1.6540%, 6/2/24‡ | | | $23,400,000 | | | | 23,923,870 | |
See Notes to Schedule of Investments and Other Information and Notes to Financial Statements.
Janus Henderson Short Duration Income ETF
Schedule of Investments (unaudited)
April 30, 2021
| | | | | | | | |
| | | Shares/
Principal Amounts | | | Value | |
| Corporate Bonds – (continued) | |
| Financial – (continued) | |
Wells Fargo & Co., ICE LIBOR USD 3 Month + 0.7500%, 2.1640%, 2/11/26‡ | | | $ 9,020,000 | | | | $ 9,339,781 | |
Wells Fargo & Co., 3.7000%, 7/27/26 | | | AUD18,000,000 | | | | 15,198,949 | |
Westpac Banking Corp., ICE LIBOR USD 3 Month + 0.8500%, 1.0378%, 1/11/22‡ | | | $550,000 | | | | 553,034 | |
Westpac Banking Corp., 90 Day Australian Bank Bill Rate + 1.1100%, 1.1198%, 2/7/22‡ | | | AUD2,000,000 | | | | 1,556,719 | |
Westpac Banking Corp., ICE LIBOR USD 3 Month + 0.7100%, 0.9030%, 6/28/22‡ | | | $750,000 | | | | 755,917 | |
Westpac Banking Corp., ICE LIBOR USD 3 Month + 0.5700%, 0.7578%, 1/11/23‡ | | | 3,600,000 | | | | 3,626,519 | |
Westpac Banking Corp., ICE LIBOR USD 3 Month + 0.3900%, 0.5775%, 1/13/23‡ | | | 10,150,000 | | | | 10,203,830 | |
Westpac Banking Corp., ICE LIBOR USD 3 Month + 0.7200%, 0.9138%, 5/15/23‡ | | | 2,244,000 | | | | 2,269,987 | |
Westpac Banking Corp., 90 Day Australian Bank Bill Rate + 0.9500%, 0.9603%, 11/16/23‡ | | | AUD14,000,000 | | | | 11,013,582 | |
Westpac Banking Corp., ICE LIBOR USD 3 Month + 0.7700%, 0.9598%, 2/26/24‡ | | | $4,950,000 | | | | 5,027,151 | |
Westpac Banking Corp., 2.3500%, 2/19/25 | | | 950,000 | | | | 999,309 | |
Westpac Banking Corp., 90 Day Australian Bank Bill Rate + 1.9500%, 4.5000%, 3/11/27‡ | | | AUD1,648,000 | | | | 1,305,731 | |
Westpac Banking Corp., 90 Day Australian Bank Bill Rate + 1.4000%, 1.4103%, 2/16/28‡ | | | 6,100,000 | | | | 4,735,580 | |
Westpac Banking Corp., 90 Day Australian Bank Bill Rate + 1.8000%, 1.8305%, 6/22/28‡ | | | 15,800,000 | | | | 12,385,713 | |
Westpac Banking Corp., 90 Day Australian Bank Bill Rate + 1.8300%, 4.3340%, 8/16/29‡ | | | 13,322,000 | | | | 11,171,866 | |
Westpac Banking Corp., 90 Day Australian Bank Bill Rate + 1.9800%, 2.0100%, 8/27/29‡ | | | 4,400,000 | | | | 3,483,557 | |
Westpac Banking Corp., US Treasury Yield Curve Rate + 1.3500%, 2.8940%, 2/4/30‡ | | | $5,750,000 | | | | 5,950,560 | |
| | | | | | | | |
| | | | | | | 1,263,858,461 | |
| Government – 0.1% | |
Inter-American Development Bank, 5.5000%, 8/23/21 | | | INR257,500,000 | | | | 3,467,981 | |
| Industrial – 5.2% | |
Australia Pacific Airports Melbourne Pty, Ltd., 3.7500%, 11/4/26 | | | AUD500,000 | | | | 416,967 | |
Boeing Co., 1.4330%, 2/4/24 | | | $22,468,000 | | | | 22,537,853 | |
Boeing Co., 2.1960%, 2/4/26 | | | 8,319,000 | | | | 8,333,928 | |
Brisbane Airport Corp. Pty, Ltd., 3.9000%, 4/24/25 | | | AUD1,300,000 | | | | 1,081,112 | |
Caterpillar Financial Services Corp., ICE LIBOR USD 3 Month + 0.2000%, 0.4009%, 11/12/21‡ | | | $9,250,000 | | | | 9,261,817 | |
Caterpillar Financial Services Corp., ICE LIBOR USD 3 Month + 0.5900%, 0.7655%, 6/6/22‡ | | | 3,400,000 | | | | 3,419,610 | |
Caterpillar Financial Services Corp., ICE LIBOR USD 3 Month + 0.5100%, 0.7038%, 5/15/23‡ | | | 2,000,000 | | | | 2,016,580 | |
Caterpillar Financial Services Corp., 0.6500%, 7/7/23 | | | 4,600,000 | | | | 4,632,168 | |
Caterpillar Financial Services Corp., 2.1500%, 11/8/24 | | | 2,150,000 | | | | 2,258,435 | |
Caterpillar Financial Services Corp., 0.8000%, 11/13/25 | | | 13,400,000 | | | | 13,280,253 | |
Downer Group Finance Pty, Ltd., 4.5000%, 3/11/22 | | | AUD2,480,000 | | | | 1,956,854 | |
John Deere Capital Corp., 0.4000%, 10/10/23 | | | $75,000 | | | | 75,175 | |
John Deere Capital Corp., 0.4500%, 1/17/24 | | | 24,200,000 | | | | 24,207,162 | |
John Deere Capital Corp., 0.7000%, 1/15/26 | | | 6,000,000 | | | | 5,944,332 | |
New Terminal Financing Co. Pty, Ltd., 90 Day Australian Bank Bill Rate + 1.4500%, 1.4903%, 7/12/24‡ | | | AUD8,200,000 | | | | 6,253,947 | |
QPH Finance Co. Pty, Ltd., 5.0000%, 7/7/21 | | | 5,410,000 | | | | 4,213,089 | |
QPH Finance Co. Pty, Ltd., 3.7500%, 6/7/23 | | | 500,000 | | | | 404,227 | |
Siemens Financieringsmaatschappij NV, 0.4000%, 3/11/23 (144A) | | | $18,000,000 | | | | 18,038,995 | |
Sydney Airport Finance Co. Pty, Ltd., 3.9000%, 3/22/23 | | | 1,230,000 | | | | 1,299,038 | |
Sydney Airport Finance Co. Pty, Ltd., 3.9000%, 3/22/23 (144A) | | | 900,000 | | | | 950,516 | |
Sydney Airport Finance Co. Pty, Ltd., 3.3750%, 4/30/25 (144A) | | | 1,500,000 | | | | 1,603,316 | |
Sydney Airport Finance Co. Pty, Ltd., 3.3750%, 4/30/25 | | | 2,370,000 | | | | 2,533,239 | |
Sydney Airport Finance Co. Pty, Ltd., 3.6250%, 4/28/26 (144A) | | | 14,400,000 | | | | 15,651,140 | |
Trimble, Inc., 4.1500%, 6/15/23 | | | 4,000,000 | | | | 4,263,680 | |
| | | | | | | | |
| | | | | | | 154,633,433 | |
See Notes to Schedule of Investments and Other Information and Notes to Financial Statements.
| | |
| | Janus Detroit Street Trust ½ 11 |
Janus Henderson Short Duration Income ETF
Schedule of Investments (unaudited)
April 30, 2021
| | | | | | | | |
| | | Shares/
Principal Amounts | | | Value | |
| Corporate Bonds – (continued) | |
| Technology – 4.9% | |
Apple, Inc., 1.5500%, 8/4/21 | | | $ 1,100,000 | | | | $ 1,102,609 | |
Apple, Inc., 2.1000%, 9/12/22 | | | 1,400,000 | | | | 1,434,239 | |
Apple, Inc., 2.4000%, 1/13/23 | | | 5,100,000 | | | | 5,286,737 | |
Apple, Inc., 0.7500%, 5/11/23 | | | 3,600,000 | | | | 3,634,934 | |
Apple, Inc., 1.8000%, 9/11/24 | | | 6,900,000 | | | | 7,186,174 | |
Apple, Inc., 0.5500%, 8/20/25 | | | 3,600,000 | | | | 3,561,195 | |
Apple, Inc., 0.7000%, 2/8/26 | | | 9,100,000 | | | | 8,987,896 | |
Broadcom, Inc., 1.9500%, 2/15/28 (144A) | | | 19,840,000 | | | | 19,546,992 | |
Fiserv, Inc., 3.8000%, 10/1/23 | | | 14,945,000 | | | | 16,062,485 | |
Hewlett Packard Enterprise Co., 4.4000%, 10/15/22 | | | 2,000,000 | | | | 2,099,810 | |
Hewlett Packard Enterprise Co., 1.4500%, 4/1/24 | | | 21,800,000 | | | | 22,239,818 | |
International Business Machines Corp., ICE LIBOR USD 3 Month + 0.4000%, 0.5938%, 5/13/21‡ | | | 700,000 | | | | 700,074 | |
International Business Machines Corp., 2.8500%, 5/13/22 | | | 11,740,000 | | | | 12,057,800 | |
Intuit, Inc., 0.6500%, 7/15/23 | | | 13,720,000 | | | | 13,824,409 | |
Oracle Corp., 2.5000%, 5/15/22 | | | 4,000,000 | | | | 4,076,153 | |
Oracle Corp., 2.5000%, 4/1/25 | | | 10,100,000 | | | | 10,620,393 | |
Oracle Corp., 1.6500%, 3/25/26 | | | 13,500,000 | | | | 13,635,372 | |
| | | | | | | | |
| | | | | | | 146,057,090 | |
| Utilities – 4.8% | |
AGL Energy, Ltd., 5.0000%, 11/5/21 | | | AUD33,530,000 | | | | 25,983,623 | |
Ausgrid Finance Pty, Ltd., 3.8500%, 5/1/23 (144A) | | | $7,740,000 | | | | 8,112,729 | |
Ausgrid Finance Pty, Ltd., 90 Day Australian Bank Bill Rate + 1.2200%, 1.2600%, 10/30/24‡ | | | AUD21,600,000 | | | | 16,770,439 | |
Ausgrid Finance Pty, Ltd., 3.7500%, 10/30/24 | | | 17,320,000 | | | | 14,517,411 | |
AusNet Services Holdings Pty, Ltd., 5.3750%, 7/2/24 | | | 4,400,000 | | | | 3,870,627 | |
Australian Gas Networks Vic 3 Pty, Ltd., 4.5000%, 12/17/21 | | | 1,650,000 | | | | 1,306,561 | |
Australian Gas Networks, Ltd., 90 Day Australian Bank Bill Rate + 0.4200%, 0.4550%, 7/1/26‡ | | | 3,000,000 | | | | 2,238,491 | |
Energy Partnership Gas Pty, Ltd., 3.6420%, 12/11/24 | | | 2,520,000 | | | | 2,109,749 | |
ETSA Utilities Finance Pty, Ltd., 90 Day Australian Bank Bill Rate + 1.0200%, 1.0500%, 8/29/22‡ | | | 4,750,000 | | | | 3,686,433 | |
ETSA Utilities Finance Pty, Ltd., 90 Day Australian Bank Bill Rate + 1.0400%, 1.0769%, 12/13/23‡ | | | 500,000 | | | | 389,313 | |
ETSA Utilities Finance Pty, Ltd., 3.5000%, 8/29/24 | | | 5,480,000 | | | | 4,573,697 | |
Florida Power & Light Co., ICE LIBOR USD 3 Month + 0.3800%, 0.5640%, 7/28/23‡ | | | $9,400,000 | | | | 9,400,383 | |
Korea East-West Power Co., Ltd., 3.8750%, 7/19/23 (144A) | | | 3,780,000 | | | | 4,053,558 | |
Korea East-West Power Co., Ltd., 1.7500%, 5/6/25 | | | 5,854,000 | | | | 5,958,997 | |
Korea Southern Power Co., Ltd., 90 Day Australian Bank Bill Rate + 0.9700%, 1.0100%, 10/30/24‡ | | | AUD1,500,000 | | | | 1,169,439 | |
Network Finance Co. Pty, Ltd., 90 Day Australian Bank Bill Rate + 1.2300%, 1.2651%, 12/6/24‡ | | | 14,120,000 | | | | 11,053,175 | |
SGSP Australia Assets Pty, Ltd., 3.3000%, 4/9/23 | | | $13,000,000 | | | | 13,584,068 | |
United Energy Distribution Pty, Ltd., 90 Day Australian Bank Bill Rate + 0.9700%, 0.9798%, 2/7/23‡ | | | AUD3,000,000 | | | | 2,332,323 | |
United Energy Distribution Pty, Ltd., 3.8500%, 10/23/24 | | | 5,900,000 | | | | 5,013,322 | |
United Energy Distribution Pty, Ltd., 2.2000%, 10/29/26 | | | 2,700,000 | | | | 2,146,055 | |
Victoria Power Networks Finance Pty, Ltd., 90 Day Australian Bank Bill Rate + 0.2800%, 0.3204%, 1/15/22‡ | | | 2,200,000 | | | | 1,695,396 | |
Victoria Power Networks Finance Pty, Ltd., 4.0000%, 8/18/27 | | | 3,100,000 | | | | 2,678,695 | |
| | | | | | | | |
| | | | | | | | 142,644,484 | |
Total Corporate Bonds (cost $2,354,512,581) | | | | | | | 2,407,818,400 | |
| Mortgage-Backed Securities – 1.5% | |
Firstmac Mortgage Funding Trust No 4, 30 Day Australian Bank Bill Rate + 1.3000%, 1.3150%, 3/8/49‡ | | | 2,700,000 | | | | 2,106,922 | |
La Trobe Financial Capital Markets Trust, 30 Day Australian Bank Bill Rate + 1.9000%, 1.9191%, 1/12/49‡ | | | 4,003,056 | | | | 3,104,343 | |
See Notes to Schedule of Investments and Other Information and Notes to Financial Statements.
Janus Henderson Short Duration Income ETF
Schedule of Investments (unaudited)
April 30, 2021
| | | | | | | | |
| | | Shares/
Principal Amounts | | | Value | |
| Mortgage-Backed Securities – (continued) | |
La Trobe Financial Capital Markets Trust, 30 Day Australian Bank Bill Rate + 2.4000%, 2.4191%, 1/12/49‡ | | | $9,813,572 | | | | $7,616,635 | |
La Trobe Financial Capital Markets Trust, 30 Day Australian Bank Bill Rate + 2.3500%, 2.3691%, 3/12/50‡ | | | 2,300,000 | | | | 1,799,908 | |
Liberty Series, 30 Day Australian Bank Bill Rate + 1.3500%, 1.3691%, 4/10/49‡ | | | 112,621 | | | | 87,003 | |
Liberty Series, 30 Day Australian Bank Bill Rate + 1.6500%, 1.6691%, 10/10/49‡ | | | 9,290,706 | | | | 7,213,803 | |
Liberty Series, 30 Day Australian Bank Bill Rate + 1.4500%, 1.4691%, 7/10/50‡ | | | 5,548,059 | | | | 4,318,172 | |
Liberty Series, 30 Day Australian Bank Bill Rate + 1.9000%, 1.9150%, 10/25/50‡ | | | 1,656,672 | | | | 1,294,791 | |
Pepper Residential Securities, 30 Day Australian Bank Bill Rate + 1.6500%, 1.6590%, 11/23/49‡ | | | 7,149,496 | | | | 5,552,765 | |
Pepper Residential Securities, 30 Day Australian Bank Bill Rate + 1.4000%, 1.4191%, 8/12/58‡ | | | 98,086 | | | | 76,219 | |
Pepper Residential Securities, ICE LIBOR USD 1 Month + 1.0000%, 1.1159%, 6/20/60 (144A)‡ | | | $1,178,903 | | | | 1,185,749 | |
Pepper Residential Securities, 30 Day Australian Bank Bill Rate + 2.2500%, 2.2647%, 8/18/60‡ | | | AUD773,815 | | | | 610,036 | |
Pepper Residential Securities, ICE LIBOR USD 1 Month + 0.9000%, 1.0159%, 11/18/60 (144A)‡ | | | $549,400 | | | | 554,468 | |
RedZed Trust Series, 30 Day Australian Bank Bill Rate + 2.4000%, 2.4149%, 3/9/50‡ | | | AUD8,243,540 | | | | 6,444,624 | |
RESIMAC Premier, ICE LIBOR USD 1 Month + 0.9500%, 1.0605%, 9/11/48 (144A)‡ | | | $198,211 | | | | 198,261 | |
RESIMAC Premier, ICE LIBOR USD 1 Month + 0.8000%, 0.9113%, 11/10/49 (144A)‡ | | | 1,013,399 | | | | 1,015,598 | |
Total Mortgage-Backed Securities (cost $40,764,133) | | | | 43,179,297 | |
| Foreign Government Bonds – 1.1% | |
Export-Import Bank of Korea, ICE LIBOR USD 3 Month + 0.5750%, 0.7634%, 6/1/21‡ | | | 13,532,000 | | | | 13,536,641 | |
Korea Hydro & Nuclear Power Co., Ltd., 3.7500%, 7/25/23 (144A) | | | 8,050,000 | | | | 8,606,981 | |
Korea National Oil Corp., 2.0000%, 10/24/21 | | | 4,746,000 | | | | 4,782,595 | |
Korea National Oil Corp., 0.8750%, 10/5/25 (144A) | | | 6,500,000 | | | | 6,401,707 | |
Total Foreign Government Bonds (cost $32,989,346) | | | | 33,327,924 | |
| Investment Companies – 3.8% | |
| Money Markets – 3.8% | |
State Street Institutional U.S. Government Money Market Fund, 0.0259% (cost $112,953,420)¥ | | | 112,953,420 | | | | 112,953,420 | |
| Certificates of Deposit – 0.1% | | | | | | |
Agricultural Bank of China, Ltd., 90 Day Australian Bank Bill Rate + 0.8700%, 0.9000%, 9/26/22‡ (cost $1,444,336) | | | 1,930,000 | | | | 1,498,228 | |
| Commercial Paper – 13.6% | |
AutoNation, Inc., 0.2030%, 5/3/21 (Section 4(2)) | | | 31,500,000 | | | | 31,499,018 | |
Centennial Energy Holdings, Inc., 0.2530%, 5/3/21 (Section 4(2)) | | | 14,700,000 | | | | 14,699,816 | |
CNPC Finance HK, Ltd., 0.3450%, 5/20/21 (Section 4(2)) | | | 26,800,000 | | | | 26,798,913 | |
Conagra Foods, Inc., 0.2530%, 5/3/21 (Section 4(2)) | | | 43,300,000 | | | | 43,298,943 | |
Energy Transfer Partners LP, 0.4060%, 5/3/21 (Section 4(2)) | | | 10,000,000 | | | | 9,999,688 | |
General Motors Financial Co., Inc., 0.2840%, 5/3/21 (Section 4(2)) | | | 21,100,000 | | | | 21,099,466 | |
General Motors Financial Co., Inc., 0.3040%, 5/3/21 (Section 4(2)) | | | 7,300,000 | | | | 7,299,815 | |
General Motors Financial Co., Inc., 0.3240%, 5/13/21 (Section 4(2)) | | | 9,150,000 | | | | 9,148,705 | |
General Motors Financial Co., Inc., 0.3450%, 5/13/21 (Section 4(2)) | | | 10,000,000 | | | | 9,998,584 | |
Glencore Funding LLC, 0.2030%, 5/11/21 (Section 4(2)) | | | 29,700,000 | | | | 29,698,680 | |
Harley-Davidson Financial Services, Inc., 0.3040%, 5/5/21 (Section 4(2)) | | | 13,500,000 | | | | 13,499,531 | |
Intesa Funding LLC, 0.0810%, 5/3/21 (Section 4(2)) | | | 75,000,000 | | | | 74,997,125 | |
Jabil, Inc., 0.5070%, 5/3/21 (Section 4(2)) | | | 53,900,000 | | | | 53,897,332 | |
Nissan Motor Acceptance Corp., 0.3040%, 5/10/21 (Section 4(2)) | | | 27,000,000 | | | | 26,995,470 | |
Plains Midstream Canada ULC, 0.4360%, 5/3/21 (Section 4(2)) | | | 8,200,000 | | | | 8,199,816 | |
Smithfield Foods, Inc., 0.2330%, 5/3/21 (Section 4(2)) | | | 10,000,000 | | | | 9,999,688 | |
Southern California Edison Co., 0.1930%, 5/3/21 (Section 4(2)) | | | 6,100,000 | | | | 6,099,944 | |
Southern California Edison Co., 0.2330%, 5/7/21 (Section 4(2)) | | | 9,000,000 | | | | 8,999,808 | |
Total Commercial Paper (cost $406,240,439) | | | | | | | 406,230,342 | |
Total Investments (total cost $2,948,904,255) – 100.8% | | | | | | | 3,005,007,611 | |
Liabilities, net of Cash, Receivables and Other Assets – (0.8%) | | | | | | | (24,131,041) | |
Net Assets – 100% | | | | | | | $2,980,876,570 | |
See Notes to Schedule of Investments and Other Information and Notes to Financial Statements.
| | |
| | Janus Detroit Street Trust ½ 13 |
Janus Henderson Short Duration Income ETF
Schedule of Investments (unaudited)
April 30, 2021
Summary of Investments by Country – (Long Positions) (unaudited)
| | | | | | | | |
| Country | | Value | | | % of
Investment
Securities | |
United States | | | $1,804,659,894 | | | | 60.1% | |
Australia | | | 660,627,439 | | | | 22.0 | |
Canada | | | 157,408,832 | | | | 5.2 | |
Japan | | | 71,977,650 | | | | 2.4 | |
United Kingdom | | | 50,501,041 | | | | 1.7 | |
Netherlands | | | 48,040,120 | | | | 1.6 | |
South Korea | | | 45,019,685 | | | | 1.5 | |
Singapore | | | 44,280,370 | | | | 1.5 | |
Cayman Islands | | | 28,481,575 | | | | 0.9 | |
Hong Kong | | | 27,308,613 | | | | 0.9 | |
China | | | 26,271,944 | | | | 0.8 | |
Finland | | | 21,221,497 | | | | 0.7 | |
New Zealand | | | 11,621,572 | | | | 0.4 | |
British Virgin Islands | | | 7,587,379 | | | | 0.3 | |
Total | | | $3,005,007,611 | | | | 100.0% | |
Schedule of Forward Foreign Currency Exchange Contracts, Open
| | | | | | | | | | | | | | | | |
Counterparty/
Foreign Currency | | Settlement Date | | | Foreign Currency
Amount Sold/
(Purchased) | | | USD Currency
Amount Sold/
(Purchased) | | | Market Value and
Unrealized
Appreciation
(Depreciation) | |
Citibank N.A. | | | | | | | | | | | | | | | | |
Canadian Dollar | | | 5/17/21 | | | | 17,730,000 | | | | $(13,995,412) | | | | $(417,166) | |
Canadian Dollar | | | 5/17/21 | | | | 31,500,000 | | | | (24,786,638) | | | | (819,466) | |
Australian Dollar | | | 5/17/21 | | | | (2,200,000) | | | | 1,683,208 | | | | 16,292 | |
| | | | | | | | | (1,220,340) | |
J.P. Morgan Chase Bank | | | | | | | | | | | | | | | | |
Australian Dollar | | | 5/17/21 | | | | 4,900,000 | | | | (3,775,563) | | | | (9,688) | |
Canadian Dollar | | | 5/17/21 | | | | 21,100,000 | | | | (17,016,431) | | | | (135,594) | |
Australian Dollar | | | 5/17/21 | | | | (14,000,000) | | | | 10,744,370 | | | | 70,631 | |
| | | | | | | | | (74,651) | |
Morgan Stanley & Co. | | | | | | | | | | | | | | | | |
Australian Dollar | | | 5/17/21 | | | | 674,250,000 | | | | (522,557,235) | | | | 1,699,041 | |
Australian Dollar | | | 5/17/21 | | | | 14,000,000 | | | | (11,009,432) | | | | 194,431 | |
Australian Dollar | | | 5/17/21 | | | | (9,000,000) | | | | 6,835,933 | | | | 116,568 | |
Australian Dollar | | | 5/17/21 | | | | (9,610,000) | | | | 7,324,951 | | | | 98,775 | |
Australian Dollar | | | 5/17/21 | | | | (3,000,000) | | | | 2,320,217 | | | | (2,717) | |
Australian Dollar | | | 5/17/21 | | | | (9,000,000) | | | | 6,995,914 | | | | (43,413) | |
| | | | | | | | | | | | | | | | 2,062,685 | |
Total | | | | | | | | | | | | | | | $767,694 | |
See Notes to Schedule of Investments and Other Information and Notes to Financial Statements.
Janus Henderson Short Duration Income ETF
Schedule of Investments (unaudited)
April 30, 2021
Schedule of Futures Contracts
| | | | | | | | | | | | | | | | | | | | |
| Description | | Number of
Contracts | | | Expiration
Date | | | Value and
Notional
Amount | | | Unrealized
Appreciation
(Depreciation) | | | Variation Margin
Asset/(Liability) | |
Futures Bought: | |
2-Year U.S. Treasury Note | | | 235 | | | | 06/30/21 | | | | $51,878,086 | | | | $(48,092) | | | | $4,876 | |
Futures Sold: | |
10-Year U.S. Treasury Note | | | 437 | | | | 06/21/21 | | | | (57,697,656) | | | | 255,145 | | | | (25,867) | |
5-Year U.S. Treasury Note | | | 5,596 | | | | 06/30/21 | | | | (693,554,250) | | | | 2,146,168 | | | | (217,605) | |
| | | | | 2,401,313 | | | | (243,472) | |
Total | | | | $2,353,221 | | | | $(238,596) | |
Schedule of Centrally Cleared Interest Rate Swaps
| | | | | | | | | | | | | | | | | | | | | | | | | | | | |
| Payments made by Fund | | Payments
received by
Fund | | | Payment
Frequency | | | Maturity
Date | | | Notional
Amount | | | Premiums
Paid/
(Received) | | | Unrealized
Appreciation/
(Depreciation) | | | Variation Margin
Asset/(Liability) | |
0.2160% Fixed | | | 6 Month BBSW | | | | Semi-Annually | | | | 7/24/23 | | | | 135,500,000 AUD | | | | $ — | | | | $(80,291) | | | | $88,185 | |
3 Month CDOR | | | 0.7150% Fixed | | | | Semi-Annually | | | | 7/14/23 | | | | 256,300,000 CAD | | | | — | | | | (556,843) | | | | 175,064 | |
3 Month CDOR | | | 0.6910% Fixed | | | | Semi-Annually | | | | 7/14/23 | | | | 256,300,000 CAD | | | | — | | | | (606,455) | | | | 175,022 | |
6 Month BBSW | | | 0.7425% Fixed | | | | Semi-Annually | | | | 6/10/25 | | | | 117,800,000 AUD | | | | — | | | | (614,394) | | | | 76,148 | |
3 Month CDOR | | | 0.6700% Fixed | | | | Semi-Annually | | | | 8/06/23 | | | | 273,000,000 CAD | | | | — | | | | (804,449) | | | | 186,293 | |
6 Month BBSW | | | 0.5560% Fixed | | | | Semi-Annually | | | | 7/24/25 | | | | 203,200,000 AUD | | | | — | | | | (1,852,139) | | | | 130,685 | |
Total | | | | | | | | $ — | | | | $(4,514,571) | | | | $831,397 | |
The following table, grouped by derivative type, provides information about the fair value and location of derivatives within the Statement of Assets and Liabilities as of April 30, 2021
Fair Value of Derivative Instruments (not accounted for as hedging instruments) as of April 30, 2021
| | | | | | | | | | | | | | | | |
| | | Credit
Contracts | | | Interest
Rate
Contracts | | | Currency
Contracts | | | Total | |
| | | | |
Asset Derivatives: | | | | | | | | | | | | | | | | |
Forward foreign currency exchange contracts | | | $ — | | | | $— | | | | $2,195,738 | | | | $2,195,738 | |
Variation Margin Receivable on Futures Contracts | | | — | | | | 4,876 | | | | — | | | | 4,876 | |
Variation Margin Receivable on Swaps | | | — | | | | 831,397 | | | | — | | | | 831,397 | |
Total Asset Derivatives | | | $ — | | | | $836,273 | | | | $2,195,738 | | | | $3,032,011 | |
| | | | |
Liability Derivatives: | | | | | | | | | | | | | | | | |
Forward foreign currency exchange contracts | | | $ — | | | | $— | | | | $1,428,044 | | | | $1,428,044 | |
Variation Margin Payable on Futures Contracts | | | — | | | | 243,472 | | | | — | | | | 243,472 | |
Total Liability Derivatives | | | $ — | | | | $243,472 | | | | $1,428,044 | | | | $1,671,516 | |
See Notes to Schedule of Investments and Other Information and Notes to Financial Statements.
| | |
| | Janus Detroit Street Trust ½ 15 |
Janus Henderson Short Duration Income ETF
Schedule of Investments (unaudited)
April 30, 2021
The following tables provide information about the effect of derivatives and hedging activities on the Fund’s Statement of Operations for the period ended April 30, 2021.
The effect of Derivative Instruments (not accounted for as hedging instruments) on the Statement of Operations for the period ended April 30, 2021
| | | | | | | | | | | | |
Amount of Realized Gain/(Loss) Recognized on Derivatives | |
| Derivative | | Interest
Rate
Contracts | | | Currency
Contracts | | | Total | |
Forward foreign currency exchange contracts | | | $— | | | | $(50,930,458) | | | | $(50,930,458) | |
Futures contracts | | | 1,431,412 | | | | — | | | | 1,431,412 | |
Swap contracts | | | (9,386,599) | | | | — | | | | (9,386,599) | |
Purchased option contracts | | | (917,704) | | | | — | | | | (917,704) | |
Total | | | $(8,872,891) | | | | $(50,930,458) | | | | $(59,803,349) | |
| | | | | | | | | | | | |
Amount of Change in Unrealized Appreciation/(Depreciation) Recognized on Derivatives | |
| Derivative | | Interest
Rate
Contracts | | | Currency
Contracts | | | Total | |
Forward foreign currency exchange contracts | | | $— | | | | $(8,832,325) | | | | $(8,832,325) | |
Futures contracts | | | 2,097,339 | | | | — | | | | 2,097,339 | |
Swap contracts | | | (4,769,000) | | | | — | | | | (4,769,000) | |
Total | | | $(2,671,661) | | | | $(8,832,325) | | | | $(11,503,986) | |
Please see the “Net realized and change in unrealized gain/(loss) on investments” sections of the Fund’s Statement of
Operations.
Average ending Monthly Market Value of Derivative Instruments During the Period Ended April 30, 2021
| | | | |
| Derivative | | Market Value | |
Forward foreign currency exchange contracts, purchased(a) | | | $11,294,478 | |
Forward foreign currency exchange contracts, sold(a) | | | 633,445,527 | |
Futures contracts, purchased | | | 178,922,194 | |
Futures contracts, sold | | | 511,938,727 | |
Centrally Cleared Interest rate swaps, long | | | 1,268,693,616 | |
Centrally Cleared Interest rate swaps, short | | | 1,272,804,723 | |
Purchased call option | | | 67,563 | |
| (a) | Forward foreign currency exchange contracts are reported as the average ending monthly currency amount purchased or sold. |
See Notes to Schedule of Investments and Other Information and Notes to Financial Statements.
Janus Henderson Short Duration Income ETF
Notes to Schedule of Investments and Other Information (unaudited)
April 30, 2021
| | |
FTSE 3-Month U.S.
Treasury Bill Index | | FTSE 3-Month U.S. Treasury Bill Index tracks the performance of short-term U.S. government debt securities. |
| |
| BBSW | | Bank Bill Swap Reference Rate (Australia) |
| |
| CDOR | | Canadian Dollar Offered Rate |
| |
| ICE | | Intercontinental Exchange |
| |
| LIBOR | | LIBOR (London Interbank Offered Rate) is a short-term interest rate that banks offer one another and generally represents current cash rates. |
| |
| LLC | | Limited Liability Company |
| |
| LP | | Limited Partnership |
| |
| PLC | | Public Limited Company |
| |
| ¥ | | Rate reflects 7 day yield as of April 30, 2021. |
| |
| Ç | | Step Bond. The coupon rate will increase or decrease periodically based upon a predetermined schedule. The rate shown reflects the current rate. |
| |
| Section 4(2) | | Securities subject to legal and/or contractual restrictions on resale and may not be publicly sold without registration under the Securities Act of 1933, as amended. The total value of Section 4(2) securities as of the period ended April 30, 2021 is $406,230,342, which represents 13.6% of net assets. |
| |
| 144A | | Securities sold under Rule 144A of the Securities Act of 1933, as amended, are subject to legal and/or contractual restrictions on resale and may not be publicly sold without registration under the 1993 Act. Unless otherwise noted, these securities have been determined to be liquid in accordance with the requirements of Rule 22e-4, under the 1940 Act. The total value of 144A securities as of the period ended April 30, 2021 is $466,998,945 which represents 15.7% of net assets. |
| |
| ‡ | | Variable or floating rate security. Rate shown is the current rate as of April 30, 2021. Certain variable rate securities are not based on a published reference rate and spread; they are determined by the issuer or agent and current market conditions. Reference rate is as of reset date and may vary by security, which may not indicate a reference rate and/or spread in their description. |
| | |
| | Janus Detroit Street Trust ½ 17 |
Janus Henderson Short Duration Income ETF
Notes to Schedule of Investments and Other Information (unaudited)
April 30, 2021
The following is a summary of the inputs that were used to value the Fund’s investments in securities and other financial instruments as of April 30, 2021. See Notes to Financial Statements for more information.
Valuation Inputs Summary
| | | | | | | | | | | | |
| | | Level 1 -
Quoted Prices | | | Level 2 -
Other Significant
Observable Inputs | | | Level 3 -
Significant
Unobservable Inputs | |
| | | |
Assets | | | | | | | | | | | | |
|
Investments in Securities: | |
| | | |
Corporate Bonds | | $ | — | | | $ | 2,407,818,400 | | | $ | — | |
| | | |
Mortgage-Backed Securities | | | — | | | | 43,179,297 | | | | — | |
| | | |
Foreign Government Bonds | | | — | | | | 33,327,924 | | | | — | |
| | | |
Investment Companies | | | 112,953,420 | | | | — | | | | — | |
| | | |
Certificates of Deposit | | | — | | | | 1,498,228 | | | | — | |
| | | |
Commercial Paper | | | — | | | | 406,230,342 | | | | — | |
| | | | |
| | | |
Total Investments in Securities | | $ | 112,953,420 | | | $ | 2,892,054,191 | | | $ | — | |
| | | | |
|
Other Financial Instruments(a): | |
| | | |
Forward Currency Contracts | | $ | — | | | $ | 2,195,738 | | | $ | — | |
| | | |
Variation Margin Receivable on Futures Contracts | | | 4,876 | | | | — | | | | — | |
| | | |
Variation Margin Receivable on Swaps | | | — | | | | 831,397 | | | | — | |
| | | | |
| | | |
Total Other Financial Instruments | | | 4,876 | | | | 3,027,135 | | | | — | |
| | | | |
| | | |
Total Assets | | $ | 112,958,296 | | | $ | 2,895,081,326 | | | $ | — | |
| | | | |
| | | |
Liabilities | | | | | | | | | | | | |
|
Other Financial Instruments(a): | |
| | | |
Forward Currency Contracts | | $ | — | | | $ | 1,428,044 | | | $ | — | |
| | | |
Variation Margin Payable on Futures Contracts | | | 243,472 | | | | — | | | | — | |
| | | | |
| | | |
Total Liabilities | | $ | 243,472 | | | $ | 1,428,044 | | | $ | — | |
| (a) | Other financial instruments include forward foreign currency exchange, futures and swap contracts. Forward foreign currency exchange contracts are reported at their unrealized appreciation/(depreciation) at measurement date, which represents the change in the contract’s value from trade date. Futures, and centrally cleared swap contracts are reported at their variation margin at measurement date, which represents the amount due to/from the Fund at that date. |
Janus Henderson Short Duration Income ETF
Statement of Assets and Liabilities (unaudited)
April 30, 2021
| | | | |
Assets: | | | | |
Investments, at value(1) | | $ | 3,005,007,611 | |
Cash denominated in foreign currency(2) | | | 5,621,935 | |
Forward foreign currency exchange contracts | | | 2,195,738 | |
Due from broker for centrally cleared swaps | | | 4,511,495 | |
Due from broker for futures | | | 5,239,931 | |
Receivable for variation margin on swaps | | | 831,397 | |
Receivable for variation margin on futures contracts | | | 4,876 | |
Receivables: | | | | |
Interest | | | 9,588,968 | |
Total Assets | | | 3,033,001,951 | |
Liabilities: | | | | |
Payable for variation margin on futures contracts | | | 243,472 | |
Forward foreign currency exchange contracts | | | 1,428,044 | |
Payables: | | | | |
Due to custodian | | | 402,425 | |
Investments purchased | | | 49,458,680 | |
Management fees | | | 592,760 | |
Total Liabilities | | | 52,125,381 | |
Net Assets | | $ | 2,980,876,570 | |
Net Assets Consists of: | | | | |
Capital (par value and paid-in surplus) | | $ | 2,976,408,258 | |
Total distributable earnings (loss) | | | 4,468,312 | |
Total Net Assets | | $ | 2,980,876,570 | |
Net Assets | | $ | 2,980,876,570 | |
Shares outstanding, $0.001 Par Value (unlimited shares authorized) | | | 59,350,001 | |
Net Asset Value Per Share | | $ | 50.23 | |
| (1) | Includes cost of $2,948,904,255. |
| (2) | Includes cost of $5,669,066. |
See Notes to Financial Statements.
| | |
| | Janus Detroit Street Trust ½ 19 |
Janus Henderson Short Duration Income ETF
Statement of Operations (unaudited)
For the period ended April 30, 2021
| | | | |
Investment Income: | | | | |
Dividends | | $ | 7,236 | |
Interest | | | 16,463,417 | |
Foreign tax withheld | | | (4,641) | |
Total Investment Income | | | 16,466,012 | |
Expenses: | | | | |
Management Fees | | | 3,314,903 | |
Total Expenses | | | 3,314,903 | |
Net Investment Income/(Loss) | | | 13,151,109 | |
Net Realized Gain/(Loss) on Investments: | | | | |
Investments and foreign currency transactions | | $ | 23,064,974 | |
Forward foreign currency exchange contracts | | | (50,930,458) | |
Futures contracts | | | 1,431,412 | |
Swap contracts | | | (9,386,599) | |
Purchased option contracts | | | (917,704) | |
Total Net Realized Gain/(Loss) on Investments | | $ | (36,738,375) | |
Change in Unrealized Net Appreciation/Depreciation: | | | | |
Investments and foreign currency translations | | $ | 36,487,687 | |
Forward foreign currency exchange contracts | | | (8,832,325) | |
Futures contracts | | | 2,097,339 | |
Swap contracts | | | (4,769,000) | |
Total Change in Unrealized Net Appreciation/Depreciation | | $ | 24,983,701 | |
Net Increase/(Decrease) in Net Assets Resulting from Operations | | $ | 1,396,435 | |
See Notes to Financial Statements.
Janus Henderson Short Duration Income ETF
Statements of Changes in Net Assets
| | | | | | | | |
| | | Period Ended April 30, 2021 (unaudited) | | | Year Ended
October 31, 2020 | |
Operations: | |
Net investment income/(loss) | | $ | 13,151,109 | | | $ | 24,627,551 | |
Net realized gain/(loss) on investments | | | (36,738,375) | | | | (15,156,864) | |
Change in unrealized net appreciation/depreciation | | | 24,983,701 | | | | 33,231,437 | |
Net Increase/(Decrease) in Net Assets Resulting from Operations | | | 1,396,435 | | | | 42,702,124 | |
Dividends and Distributions to Shareholders: | |
Dividends and Distributions | | | (12,348,859) | | | | (25,523,117) | |
Net Decrease from Dividends and Distributions to Shareholders | | | (12,348,859) | | | | (25,523,117) | |
Capital Share Transactions | | | 265,303,326 | | | | 1,671,611,945 | |
Net Increase/(Decrease) in Net Assets | | | 254,350,902 | | | | 1,688,790,952 | |
Net Assets: | |
Beginning of period | | | 2,726,525,668 | | | | 1,037,734,716 | |
End of period | | $ | 2,980,876,570 | | | $ | 2,726,525,668 | |
See Notes to Financial Statements.
| | |
| | Janus Detroit Street Trust ½ 21 |
Janus Henderson Short Duration Income ETF
Financial Highlights
| | | | | | | | | | | | | | | | | | | | | | |
For a share outstanding during the period ended
April 30, 2021 (unaudited) and each year or period
ended October 31 | | 2021 | | | 2020 | | | 2019 | | | 2018 | | | 2017(1) | |
| | Net Asset Value, Beginning of Period | | | $50.40 | | | | $49.89 | | | | $50.04 | | | | $50.35 | | | | $50.00 | |
| | Income/(Loss) from Investment Operations: | | | | | | | | | | | | | | | | | | | | |
| | Net investment income/(loss)(2) | | | 0.22 | | | | 0.77 | | | | 1.39 | | | | 1.25 | | | | 0.82 | |
| | Net realized and unrealized gain/(loss) | | | (0.18) | | | | 0.70 | | | | 0.53 | | | | (0.33) | | | | 0.11 | |
| | Total from Investment Operations | | | 0.04 | | | | 1.47 | | | | 1.92 | | | | 0.92 | | | | 0.93 | |
| | Less Dividends and Distributions: | | | | | | | | | | | | | | | | | | | | |
| | Dividends (from net investment income) | | | (0.21) | | | | (0.96) | | | | (1.43) | | | | (1.23) | | | | (0.58) | |
| | Distributions (from capital gains) | | | — | | | | — | | | | (0.64) | | | | — | | | | — | |
| | Total Dividends and Distributions | | | (0.21) | | | | (0.96) | | | | (2.07) | | | | (1.23) | | | | (0.58) | |
| | Net Asset Value, End of Period | | | $50.23 | | | | $50.40 | | | | $49.89 | | | | $50.04 | | | | $50.35 | |
| | Total Return* | | | 0.08% | | | | 2.99% | | | | 3.95% | | | | 1.86% | | | | 1.87% | |
| | Net assets, End of Period (in thousands) | | | $2,980,877 | | | | $2,726,526 | | | | $1,037,735 | | | | $730,545 | | | | $156,084 | |
| | Average Net Assets for the Period (in thousands) | | | $2,946,952 | | | | $1,601,333 | | | | $925,572 | | | | $406,711 | | | | $66,131 | |
| | Ratios to Average Net Assets**: | | | | | | | | | | | | | | | | | | | | |
| | Ratio of Gross Expenses | | | 0.23% | | | | 0.26% | | | | 0.32% | | | | 0.35% | | | | 0.35% | |
| | Ratio of Net Investment Income/(Loss) | | | 0.90% | | | | 1.54% | | | | 2.80% | | | | 2.51% | | | | 1.71% | |
| | Portfolio Turnover Rate(3) | | | 20% | | | | 14% | | | | 23% | | | | 22% | | | | 44% | |
| * | Total return not annualized for periods of less than one full year. |
| ** | Annualized for periods of less than one full year. |
| (1) | Period from November 16, 2016 (commencement of operations) through October 31, 2017. |
| (2) | Per share amounts are calculated based on average shares outstanding during the year or period. |
| (3) | Portfolio turnover rate excludes securities received or delivered from in-kind processing of creation or redemptions. |
See Notes to Financial Statements.
Janus Henderson Short Duration Income ETF
Notes to Financial Statements (unaudited)
1. Organization and Significant Accounting Policies
Janus Henderson Short Duration Income ETF (the “Fund”) is a series fund. The Fund is part of Janus Detroit Street Trust (the “Trust”), which is organized as a Delaware statutory trust and is registered under the Investment Company Act of 1940, as amended (the “1940 Act”), as an open-end management investment company, and therefore has applied the specialized accounting and reporting guidance in Financial Accounting Standards Board (“FASB”) Accounting Standards Codification (“ASC”) Topic 946. As of the date of this report, the Trust offers six Funds each of which represent shares of beneficial interest in a separate portfolio of securities and other assets with its own objective and policies. The Fund seeks to provide a steady income stream with capital preservation across various market cycles. The Fund seeks to consistently outperform the FTSE 3-Month U.S. Treasury Bill Index by a moderate amount through various market cycles while at the same time providing low volatility. The Fund is classified as diversified, as defined in the 1940 Act.
The Fund is an actively-managed exchange-traded fund. Unlike shares of traditional mutual funds, shares of the Fund are not individually redeemable and may only be purchased or redeemed directly from the Fund at net asset value (“NAV”) in large increments called “Creation Units” by certain participants, known as “Authorized Participants.” The size of a Creation Unit to purchase shares of the Fund may differ from the size of a Creation Unit to redeem shares of the Fund. The Fund will issue or redeem Creation Units in exchange for portfolio securities and/or cash. Except when aggregated in Creation Units, Fund shares are not redeemable securities of the Fund. Shares of the Fund are listed and trade on NYSE Arca, Inc. (“NYSE Arca”), and individual investors can purchase or sell shares in much smaller increments for cash in the secondary market through a broker. These transactions, which do not involve the Fund, are made at market prices that may vary throughout the day and differ from the Fund’s NAV. As a result, you may pay more than NAV (a premium) when you purchase shares and receive less than NAV (a discount) when you sell shares, in the secondary market.
An Authorized Participant (or other broker-dealers making markets in shares of the Fund) may hold of record more than 25% of the outstanding shares of the Fund. From time to time, Authorized Participants (or other broker-dealers making markets in shares of the Fund) may be a beneficial and/or legal owner of the Fund, may be affiliated with an index provider, may be deemed to have control of the Fund and/or may be able to affect the outcome of matters presented for a vote of the shareholders of the Fund. Authorized Participants (or other broker-dealers making markets in shares of the Fund) may execute an irrevocable proxy granting the Distributor, Janus Capital Management LLC (“Janus Capital” or “Janus”) or an affiliate of Janus Capital power to vote or abstain from voting such Authorized Participant’s beneficially or legally owned shares of the Fund. In such cases, the agent shall mirror vote (or abstain from voting) such shares in the same proportion as all other beneficial owners of the Fund.
The following accounting policies have been followed by the Fund and are in conformity with United States of America generally accepted accounting principles (“US GAAP”).
Investment Valuation
Securities held by the Fund are valued in accordance with policies and procedures established by and under the supervision of the Trustees (the “Valuation Procedures”). Equity securities, including shares of exchange-traded funds, traded on a domestic securities exchange are generally valued at the closing prices on the primary market or exchange on which they trade. If such price is lacking for the trading period immediately preceding the time of determination, such securities are valued at their current bid price. Equity securities that are traded on a foreign exchange are generally valued at the closing prices on such markets. In the event that there is no current trading volume on a particular security in such foreign exchange, the bid price from the primary exchange is generally used to value the security. Securities that are traded on the over-the-counter (“OTC”) markets are generally valued at their closing or latest bid prices as available. Foreign securities and currencies are converted to U.S. dollars using the applicable exchange rate in effect at the close of the London Stock Exchange. The Fund will determine the market value of individual securities held by it by using prices provided by one or more approved professional pricing services or, as needed, by obtaining market quotations from independent broker-dealers. Most debt securities are valued in accordance with the evaluated bid price supplied by the pricing service that is intended to reflect market value. The evaluated bid price supplied by the pricing service is an evaluation that may consider factors such as security prices, yields, maturities and ratings. Certain short-term securities maturing within 60 days or less may be evaluated and valued on an amortized cost basis provided that the amortized cost determined approximates market value. Securities for which market quotations or evaluated prices are not readily available or are deemed unreliable, are valued at fair value determined in good faith under the Valuation Procedures. Circumstances in which fair value pricing may be utilized include, but are not limited to: (i) a significant event that may affect the securities of a single issuer, such as a merger, bankruptcy, or significant issuer-specific development; (ii) an event that may affect an entire market, such as a natural disaster or significant governmental action; (iii) a nonsignificant event such as a market closing early or not opening, or a security trading halt; and (iv) pricing of a nonvalued security and a restricted or nonpublic security. Special valuation considerations may apply with respect to “odd-lot” fixed-income
| | |
| | Janus Detroit Street Trust ½ 23 |
Janus Henderson Short Duration Income ETF
Notes to Financial Statements (unaudited)
transactions which, due to their small size, may receive evaluated prices by pricing services which reflect a large block trade and not what actually could be obtained for the odd-lot position.
Valuation Inputs Summary
FASB ASC 820, Fair Value Measurements and Disclosures (“ASC 820”), defines fair value, establishes a framework for measuring fair value, and expands disclosure requirements regarding fair value measurements. This standard emphasizes that fair value is a market-based measurement that should be determined based on the assumptions that market participants would use in pricing an asset or liability and establishes a hierarchy that prioritizes inputs to valuation techniques used to measure fair value. These inputs are summarized into three broad levels:
Level 1 – Unadjusted quoted prices in active markets the Fund has the ability to access for identical assets or liabilities.
Level 2 – Observable inputs other than unadjusted quoted prices included in Level 1 that are observable for the asset or liability either directly or indirectly. These inputs may include quoted prices for the identical instrument on an inactive market, prices for similar instruments, interest rates, prepayment speeds, credit risk, yield curves, default rates and similar data.
Assets or liabilities categorized as Level 2 in the hierarchy generally include: debt securities fair valued in accordance with the evaluated bid or ask prices supplied by a pricing service; securities traded on OTC markets and listed securities for which no sales are reported that are fair valued at the latest bid price (or yield equivalent thereof) obtained from one or more dealers transacting in a market for such securities or by a pricing service approved by the Fund’s Trustees; and certain short-term debt securities with maturities of 60 days or less that are fair valued at amortized cost. Other securities that may be categorized as Level 2 in the hierarchy include, but are not limited to, preferred stocks, bank loans, swaps, investments in unregistered investment companies, options, and forward contracts.
Level 3 – Unobservable inputs for the asset or liability to the extent that relevant observable inputs are not available, representing the Fund’s own assumptions about the assumptions that a market participant would use in valuing the asset or liability, and that would be based on the best information available.
There have been no significant changes in valuation techniques used in valuing any such positions held by the Fund since the beginning of the fiscal year.
The inputs or methodology used for fair valuing securities are not necessarily an indication of the risk associated with investing in those securities. The summary of inputs used as of April 30, 2021 to fair value the Fund’s investments in securities and other financial instruments is included in the “Valuation Inputs Summary” in the Notes to Schedule of Investments and Other Information.
Investment Transactions and Investment Income
Investment transactions are accounted for as of the date purchased or sold (trade date). Dividend income is recorded on the ex-dividend date. Certain dividends from foreign securities will be recorded as soon as the Fund is informed of the dividend, if such information is obtained subsequent to the ex-dividend date. Dividends from foreign securities may be subject to withholding taxes in foreign jurisdictions. Interest income is recorded daily on an accrual basis and includes amortization of premiums and accretion of discounts. The Fund classifies gains and losses on prepayments received as an adjustment to interest income. Debt securities may be placed in non-accrual status and related interest income may be reduced by stopping current accruals and writing off interest receivables when collection of all or a portion of interest has become doubtful. Gains and losses are determined on the identified cost basis, which is the same basis used for federal income tax purposes.
Estimates
The preparation of financial statements in conformity with US GAAP requires management to make estimates and assumptions that affect the reported amount of assets and liabilities and disclosure of contingent assets and liabilities at the date of the financial statements and the reported amounts of income and expenses during the reporting period. Actual results could differ from those estimates.
Indemnifications
In the normal course of business, the Fund may enter into contracts that contain provisions for indemnification of other parties against certain potential liabilities. The Fund’s maximum exposure under these arrangements is unknown and would involve future claims that may be made against the Fund that have not yet occurred. Currently, the risk of material loss from such claims is considered remote.
Janus Henderson Short Duration Income ETF
Notes to Financial Statements (unaudited)
Foreign Currency Translations
The Fund does not isolate that portion of the results of operations resulting from the effect of changes in foreign exchange rates on investments from the fluctuations arising from changes in market prices of securities held at the date of the financial statements. Net unrealized appreciation or depreciation of investments and foreign currency translations arise from changes in the value of assets and liabilities, including investments in securities held at the date of the financial statements, resulting from changes in the exchange rates and changes in market prices of securities held.
Currency gains and losses are also calculated on payables and receivables that are denominated in foreign currencies. The payables and receivables are generally related to foreign security transactions and income translations.
Foreign currency-denominated assets and forward currency contracts may involve more risks than domestic transactions, including currency risk, counterparty risk, political and economic risk, regulatory risk and equity risk. Risks may arise from unanticipated movements in the value of foreign currencies relative to the U.S. dollar.
Dividends and Distributions
Dividends from net investment income are generally declared and distributed monthly. Net realized capital gains (if any) are distributed annually. The Fund may treat a portion of the amount paid to redeem shares as a distribution of investment company taxable income and realized capital gains that are reflected in the NAV. This practice, commonly referred to as “equalization,” has no effect on the redeeming shareholder or a Fund’s total return but may reduce the amounts that would otherwise be required to be paid as taxable dividends to the remaining shareholders. It is possible that the Internal Revenue Service (IRS) could challenge the Fund’s equalization methodology or calculations, and any such challenge could result in additional tax, interest, or penalties to be paid by the Fund.
Federal Income Taxes
The Fund intends to continue to qualify as a regulated investment company and distribute all of its taxable income in accordance with the requirements of Subchapter M of the Internal Revenue Code. Management has analyzed the Fund’s tax positions taken for all open federal income tax years, generally a three-year period, and has concluded that no provision for federal income tax is required in the Fund’s financial statements. The Fund is not aware of any tax positions for which it is reasonably possible that the total amounts of unrecognized tax benefits will significantly change in the next twelve months.
2. Derivative Instruments
The Fund may invest in various types of derivatives. A derivative is a financial instrument whose performance is derived from the performance of another asset. The Fund may invest in derivative instruments including, but not limited to futures, forwards, options, and swaps. Each derivative instrument that was held by the Fund during the period ended April 30, 2021 is discussed in further detail below. A summary of derivative activity by the Fund is reflected in the tables at the end of the Schedule of Investments.
The Fund may use derivative instruments for various investment purposes, such as to manage or hedge portfolio risk, including interest rate risk, enhance return or to manage duration. The Fund’s use of derivative instruments involves risks different from, or possibly greater than, the risks associated with investing directly in securities and other traditional investments. Derivatives are subject to a number of risks including liquidity risk, market risk, credit risk, default risk, counterparty risk and management risk. They also involve the risk of mispricing or improper valuation and the risk that changes in the value of the derivative may not correlate exactly with the change in the value of the underlying asset, rate or index. Also, suitable derivative transactions may not be available in all circumstances and there can be no assurance that the Fund will engage in these transactions to reduce exposure to other risks when that would be beneficial. When used to enhance return the Fund may be fully exposed to the risk of loss of that derivative, which may sometimes be greater than the derivative’s cost. While use of derivatives to hedge can reduce or eliminate losses, it can also reduce or eliminate gains or cause losses if the market moves in a manner different from that anticipated by Janus Capital or if the cost of the derivative outweighs the benefit of the hedge. The Fund’s ability to use derivatives may also be limited by certain regulatory and tax considerations.
In pursuit of its investment objective, the Fund may seek to use derivatives to increase or decrease exposure to the following market risk factors:
| | • | | Counterparty Risk – the risk that the counterparty (the party on the other side of the transaction) on a derivative transaction will be unable to honor its financial obligation to the Fund. |
| | • | | Credit Risk – the risk an issuer will be unable to make principal and interest payments when due or will default on its obligations. |
| | |
| | Janus Detroit Street Trust ½ 25 |
Janus Henderson Short Duration Income ETF
Notes to Financial Statements (unaudited)
| | • | | Currency Risk – the risk that changes in the exchange rate between currencies will adversely affect the value (in U.S. dollar terms) of an investment. |
| | • | | Index Risk – if the derivative is linked to the performance of an index, it will be subject to the risks associated with changes in that index. If the index changes, the Fund could receive lower interest payments or experience a reduction in the value of the derivative to below what the Fund paid. Certain indexed securities, including inverse securities (which move in an opposite direction to the index), may create leverage, to the extent that they increase or decrease in value at a rate that is a multiple of the changes in the applicable index. |
| | • | | Interest Rate Risk – the risk that the value of fixed-income securities will generally decline as prevailing interest rates rise, which may cause the Fund’s NAV to likewise decrease. |
| | • | | Leverage Risk – the risk associated with certain types of leveraged investments or trading strategies pursuant to which relatively small market movements may result in large changes in the value of an investment. The Fund creates leverage by investing in instruments, including derivatives, where the investment loss can exceed the original amount invested. Certain investments or trading strategies, such as short sales, that involve leverage can result in losses that greatly exceed the amount originally invested. |
| | • | | Liquidity Risk – the risk that certain securities may be difficult or impossible to sell at the time that the seller would like or at the price that the seller believes the security is currently worth. |
Derivatives may generally be traded OTC or on an exchange. Derivatives traded OTC are agreements that are individually negotiated between parties and can be tailored to meet a purchaser’s needs. OTC derivatives are not guaranteed by a clearing agency and may be subject to increased credit risk.
In an effort to mitigate credit risk associated with derivatives traded OTC, the Fund may enter into collateral agreements with certain counterparties whereby, subject to certain minimum exposure requirements, the Fund may require the counterparty to post collateral if the Fund has a net aggregate unrealized gain on all OTC derivative contracts with a particular counterparty. Additionally, the Fund may deposit cash and/or treasuries as collateral with the counterparty and/ or custodian daily (based on the daily valuation of the financial asset) if the Fund has a net aggregate unrealized loss on OTC derivative contracts with a particular counterparty. All liquid securities and restricted cash are considered to cover in an amount at all times equal to or greater than the Fund’s commitment with respect to certain exchange-traded derivatives, centrally cleared derivatives, forward foreign currency exchange contracts, short sales, and/or securities with extended settlement dates. There is no guarantee that counterparty exposure is reduced and these arrangements are dependent on Janus Capital’s ability to establish and maintain appropriate systems and trading.
Forward Foreign Currency Exchange Contracts
A forward foreign currency exchange contract (“forward currency contract”) is an obligation to buy or sell a specified currency at a future date at a negotiated rate (which may be U.S. dollars or a foreign currency). The Fund may enter into forward currency contracts for hedging purposes, including, but not limited to, reducing exposure to changes in foreign currency exchange rates on foreign portfolio holdings and locking in the U.S. dollar cost of firm purchase and sale commitments for securities denominated in or exposed to foreign currencies. The Fund may also invest in forward currency contracts for nonhedging purposes such as seeking to enhance returns. The Fund is subject to currency risk and counterparty risk in the normal course of pursuing its investment objective through its investments in forward currency contracts.
Forward currency contracts are valued by converting the foreign value to U.S. dollars by using the current spot U.S. dollar exchange rate and/or forward rate for that currency. Exchange and forward rates as of the close of the London Stock Exchange shall be used to value the forward currency contracts. The unrealized appreciation/(depreciation) for forward currency contracts is reported in the Statement of Assets and Liabilities as a receivable or payable (if applicable) and in the Statement of Operations for the change in unrealized net appreciation/depreciation (if applicable). The gain or loss arising from the difference between the U.S. dollar cost of the original contract and the value of the foreign currency in U.S. dollars upon closing a forward currency contract is reported on the Statement of Operations (if applicable).
During the period, the Fund entered into forward currency contracts with the obligation to purchase foreign currencies in the future at an agreed upon rate in order to take a positive outlook on the related currency. These forward contracts seek to increase exposure to currency risk.
During the period, the Fund entered into forward currency contracts with the obligation to purchase foreign currencies in the future at an agreed upon rate in order to decrease exposure to currency risk associated with foreign currency denominated securities held by the Fund.
Janus Henderson Short Duration Income ETF
Notes to Financial Statements (unaudited)
During the period, the Fund entered into forward currency contracts with the obligation to sell foreign currencies in the future at an agreed upon rate in order to take a negative outlook on the related currency. These forward contracts seek to increase exposure to currency risk.
During the period, the Fund entered into forward currency contracts with the obligation to sell foreign currencies in the future at an agreed upon rate in order to decrease exposure to currency risk associated with foreign currency denominated securities held by the Fund.
Futures Contracts
A futures contract is an exchange-traded agreement to take or make delivery of an underlying asset at a specific time in the future for a specific predetermined negotiated price. The Fund may enter into futures contracts for the purchase or sale for future delivery of (i) fixed-income securities, and U.S. government securities and Treasuries, or (ii) contracts based on interest rates. The Fund is subject to interest rate risk and equity risk in the normal course of pursuing its investment objective through its investments in futures contracts. The Fund may also use such derivative instruments to hedge or protect from adverse movements in securities prices or interest rates. The use of futures contracts may involve risks such as the possibility of illiquid markets or imperfect correlation between the values of the contracts and the underlying securities, or that the counterparty will fail to perform its obligations.
Futures contracts on commodities are valued at the settlement price on valuation date on the commodities exchange as reported by an approved vendor. Mini contracts, as defined in the description of the contract, shall be valued using the Actual Settlement Price or “ASET” price type as reported by an approved vendor. Futures contracts are marked-to-market daily, and the daily variation margin is recorded as a receivable or payable on the Statement of Assets and Liabilities (if applicable). The change in unrealized net appreciation/depreciation is reported on the Statement of Operations (if applicable). When a contract is closed, a realized gain or loss is reported on the Statement of Operations (if applicable), equal to the difference between the opening and closing value of the contract.
Securities held by the Fund that are designated as collateral for market value on futures contracts are noted on the Schedule of Investments (if applicable). Such collateral is in the possession of the Fund’s futures option merchant.
With futures, there is minimal counterparty credit risk to the Fund since futures are exchange-traded and the exchange’s clearinghouse, as counterparty to all exchange-traded futures, guarantees the futures against default.
During the period, the Fund purchased interest rate futures to increase exposure to interest rate risk.
During the period, the Fund sold interest rate futures to decrease exposure to interest rate risk.
Options Contracts
An options contract provides the purchaser with the right, but not the obligation, to buy (call option) or sell (put option) a financial instrument at an agreed upon price on or before a specified date. The purchaser pays a premium to the seller for this right. The seller has the corresponding obligation to sell or buy a financial instrument if the purchaser (owner) “exercises” the option. When an option is exercised, the proceeds on sales for a written call option, the purchase cost for a written put option, or the cost of the security for a purchased put or call option are adjusted by the amount of premium received or paid. Upon expiration, or closing of the option transaction, a realized gain or loss is reported on the Statement of Operations (if applicable). The difference between the premium paid/received and the market value of the option is recorded as unrealized appreciation or depreciation. The net change in unrealized appreciation or depreciation is reported on the Statement of Operations (if applicable). Option contracts are typically valued using an approved vendor’s option valuation model. To the extent reliable market quotations are available, option contracts are valued using market quotations. In cases when an approved vendor cannot provide coverage for an option and there is no reliable market quotation, a broker quotation or an internal valuation using the Black-Scholes model, the Cox-Rubenstein Binomial Option Pricing Model, or other appropriate option pricing model is used. Certain options contracts are marked-to-market daily, and the daily variation margin is recorded as a receivable or payable on the Statement of Assets and Liabilities as “Variation margin receivable” or “Variation margin payable” (if applicable).
The Fund may use options contracts to hedge against changes in interest rates, the values of securities, or foreign currencies. The use of such instruments may involve certain additional risks as a result of unanticipated movements in the market. A lack of correlation between the value of an instrument underlying an option and the asset being hedged, or unexpected adverse price movements, could render the Fund’s hedging strategy unsuccessful. In addition, there can be no assurance that a liquid secondary market will exist for any option purchased or sold. The Fund may be subject to counterparty risk, interest rate risk, liquidity risk, equity risk, commodity risk, and currency risk in the normal course of pursuing its investment objective through its investments in options contracts.
| | |
| | Janus Detroit Street Trust ½ 27 |
Janus Henderson Short Duration Income ETF
Notes to Financial Statements (unaudited)
Options traded on an exchange are regulated and the terms of the options are standardized. Options traded OTC expose the Fund to counterparty risk in the event that the counterparty does not perform. This risk is mitigated by having a netting arrangement between the Fund and the counterparty and by having the counterparty post collateral to cover the Fund’s exposure to the counterparty.
The Fund may purchase put options to hedge against a decline in the value of its portfolio. By using put options in this way, the Fund will reduce any profit it might otherwise have realized in the underlying security by the amount of the premium paid for the put option and by transaction costs. The Fund may purchase call options to hedge against an increase in the price of securities that it may buy in the future. The premium paid for the call option plus any transaction costs will reduce the benefit, if any, realized by the Fund upon exercise of the option, and, unless the price of the underlying security rises sufficiently, the option may expire worthless to the Fund. The risk in buying options is that the Fund pays a premium whether or not the options are exercised. Options purchased are reported in the Schedule of Investments (if applicable).
During the period, the Fund purchased call options on bond futures in order to reduce interest rate risk where reducing this exposure via other markets such as the cash bond market was less attractive.
As of April 30, 2021, the Fund did not have any open purchased option contracts.
Swaps
Swap agreements are two-party contracts entered into primarily by institutional investors for periods ranging from a day to more than one year to exchange one set of cash flows for another. The most significant factor in the performance of swap agreements is the change in value of the specific index, security, or currency, or other factors that determine the amounts of payments due to and from the Fund. The use of swaps is a highly specialized activity which involves investment techniques and risks different from those associated with ordinary portfolio securities transactions. Swap agreements entail the risk that a party will default on its payment obligations to the Fund. If the other party to a swap defaults, the Fund would risk the loss of the net amount of the payments that it contractually is entitled to receive. If the Fund utilizes a swap at the wrong time or judges market conditions incorrectly, the swap may result in a loss to the Fund and reduce the Fund’s total return.
Swap agreements also bear the risk that the Fund will not be able to meet its obligation to the counterparty. Swap agreements are typically privately negotiated and entered into in the OTC market. However, certain swap agreements are required to be cleared through a clearinghouse and traded on an exchange or swap execution facility. Swaps that are required to be cleared are required to post initial and variation margins in accordance with the exchange requirements. Regulations enacted require the Fund to centrally clear certain interest rate and credit default index swaps through a clearinghouse or central counterparty (“CCP”). To clear a swap with a CCP, the Fund will submit the swap to, and post collateral with, a futures clearing merchant (“FCM”) that is a clearinghouse member.
Index swaps, interest rate swaps, and credit default swaps are valued using an approved vendor supplied price. Basket swaps are valued using a broker supplied price. Equity swaps that consist of a single underlying equity are valued either at the closing price, the latest bid price, or the last sale price on the primary market or exchange it trades. The market value of swap contracts are aggregated by positive and negative values and are disclosed separately as an asset or liability on the Fund’s Statement of Assets and Liabilities (if applicable). Realized gains and losses are reported on the Statement of Operations (if applicable). The change in unrealized net appreciation or depreciation during the period is included in the Statement of Operations (if applicable).
The Fund’s maximum risk of loss from counterparty risk or credit risk is the discounted value of the payments to be received from/paid to the counterparty over the contract’s remaining life, to the extent that the amount is positive. The risk is mitigated by having a netting arrangement between the Fund and the counterparty and by the posting of collateral by the counterparty to cover the Fund’s exposure to the counterparty.
The Fund may enter into various types of credit default swap agreements, including OTC credit default swap agreements and index credit default swaps (“CDX”), for investment purposes and to add leverage to its portfolio, or to hedge its credit exposure. Credit default swaps are a specific kind of counterparty agreement that allow the transfer of third-party credit risk from one party to the other. One party in the swap is a lender and faces credit risk from a third party, and the counterparty in the credit default swap agrees to insure this risk in exchange for regular periodic payments. Credit default swaps could result in losses if the Fund does not correctly evaluate the creditworthiness of the company or companies on which the credit default swap is based. Credit default swap agreements may involve greater risks than if the Fund had invested in the reference obligation directly since, in addition to risks relating to the reference obligation, credit default
Janus Henderson Short Duration Income ETF
Notes to Financial Statements (unaudited)
swaps are subject to liquidity risk, counterparty risk, and credit risk. The Fund will generally incur a greater degree of risk when it sells a credit default swap than when it purchases a credit default swap.
As a buyer of a credit default swap, the Fund may lose its investment and recover nothing should no credit event occur, and the swap is held to its termination date. As seller of a credit default swap, if a credit event were to occur, the value of any deliverable obligation received by the Fund, coupled with the upfront or periodic payments previously received, may be less than what it pays to the buyer, resulting in a loss of value to the Fund.
If the Fund is the seller of credit protection against a particular security, the Fund would receive an up-front or periodic payment to compensate against potential credit events. As the seller in a credit default swap contract, the Fund would be required to pay the par value (the “notional value”) (or other agreed-upon value) of a referenced debt obligation to the counterparty in the event of a default by a third party, such as a U.S. or foreign corporate issuer, on the debt obligation. In return, the Fund would receive from the counterparty a periodic stream of payments over the term of the contract provided that no event of default has occurred. If no default occurs, the Fund would keep the stream of payments and would have no payment obligations. As the seller, the Fund would effectively add leverage to its portfolio because, in addition to its total net assets, the Fund would be subject to investment exposure on the notional value of the swap. The maximum potential amount of future payments (undiscounted) that the Fund as a seller could be required to make in a credit default transaction would be the notional amount of the agreement.
As a buyer of credit protection, the Fund is entitled to receive the par (or other agreed-upon) value of a referenced debt obligation from the counterparty to the contract in the event of a default or other credit event by a third party, such as a U.S. or foreign issuer, on the debt obligation. In return, the Fund as buyer would pay to the counterparty a periodic stream of payments over the term of the contract provided that no credit event has occurred. If no credit event occurs, the Fund would have spent the stream of payments and potentially received no benefit from the contract.
The Fund may invest in single-name credit default swaps (“CDS”) to buy or sell credit protection to hedge its credit
exposure, gain issuer exposure without owning the underlying security, or increase the Fund’s total return. Single-name CDS enable the Fund to buy or sell protection against a credit event of a specific issuer. When the Fund buys a single-name CDS, the Fund will receive a return on its investment only in the event of a credit event, such as default by the issuer of the underlying obligation (as opposed to a credit downgrade or other indication of financial difficulty). If a single-name CDS transaction is particularly large, or if the relevant market is illiquid, it may not be possible for the Fund to initiate a single-name CDS transaction or to liquidate its position at an advantageous time or price, which may result in significant losses. Moreover, the Fund bears the risk of loss of the amount expected to be received under a single-name CDS in the event of the default or bankruptcy of the counterparty. The risks associated with cleared single-name CDS may be lower than that for uncleared single-name CDS because for cleared single-name CDS, the counterparty is a clearinghouse (to the extent such a trading market is available). However, there can be no assurance that a clearinghouse or its members will satisfy their obligations to the Fund.
The Fund’s use of interest rate swaps involves investment techniques and risks different from those associated with ordinary portfolio security transactions. Interest rate swaps do not involve the delivery of securities, other underlying assets, or principal. Interest rate swaps involve the exchange by two parties of their respective commitments to pay or receive interest (e.g., an exchange of floating rate payments for fixed rate payments). Interest rate swaps may result in potential losses if interest rates do not move as expected or if the counterparties are unable to satisfy their obligations. Interest rate swaps are generally entered into on a net basis. Accordingly, the risk of loss with respect to interest rate swaps is limited to the net amount of interest payments that the Fund is contractually obligated to make.
During the period, the Fund entered into interest rate swaps paying a fixed interest rate and receiving a floating interest rate in order to increase interest rate risk (duration) exposure. As interest rates rise, the Fund benefits by receiving a higher future floating rate, while paying a fixed rate that has not decreased.
During the period, the Fund entered into interest rate swaps paying a floating interest rate and receiving a fixed interest rate in order to increase interest rate risk (duration) exposure. As interest rates fall, the Fund benefits by paying a lower future floating rate, while receiving a fixed rate that has not decreased.
3. Other Investments and Strategies
Additional Investment Risk
In response to the COVID-19 pandemic, the U.S. government and the Federal Reserve, as well as certain foreign governments and central banks, have taken extraordinary actions to support local and global economies and the financial markets, including reducing interest rates to record low levels. Extremely low or negative interest rates may become more
| | |
| | Janus Detroit Street Trust ½ 29 |
Janus Henderson Short Duration Income ETF
Notes to Financial Statements (unaudited)
prevalent or may not work as intended. As there is little precedent for this situation, the impact on various markets that interest rate or other significant policy changes may have is unknown. The withdrawal of this support, a failure of measures put in place to respond to the crisis, or investor perception that such efforts were not sufficient could each negatively affect financial markets generally, and the value and liquidity of specific securities. In addition, policy and legislative changes in the United States and in other countries continue to impact many aspects of financial regulation.
Widespread disease, including pandemics and epidemics, and natural or environmental disasters, including those which may be attributable to global climate change, such as earthquakes, fires, floods, hurricanes, tsunamis and weather-related phenomena generally, have been and can be highly disruptive to economies and markets, adversely impacting individual companies, sectors, industries, markets, currencies, interest and inflation rates, credit ratings, investor sentiment, and other factors affecting the value of a Fund’s investments. Economies and financial markets throughout the world have become increasingly interconnected, which increases the likelihood that events or conditions in one region or country will adversely affect markets or issuers in other regions or countries, including the United States. These disruptions could prevent a Fund from executing advantageous investment decisions in a timely manner and negatively impact a Fund’s ability to achieve its investment objective(s). Any such event(s) could have a significant adverse impact on the value of a Fund. In addition, these disruptions could also impair the information technology and other operational systems upon which the Fund’s service providers, including Janus Capital, rely, and could otherwise disrupt the ability of employees of the Fund’s service providers to perform essential tasks on behalf of the Fund. Adverse weather conditions may also have a particularly significant negative effect on issuers in the agricultural sector and on insurance and reinsurance companies that insure or reinsure against the impact of natural disasters.
A number of countries in the European Union (the “EU”) have experienced, and may continue to experience, severe economic and financial difficulties. In particular, many EU nations are susceptible to economic risks associated with high levels of debt. Many non-governmental issuers, and even certain governments, have defaulted on, or been forced to restructure, their debts. Many other issuers have faced difficulties obtaining credit or refinancing existing obligations. Financial institutions have in many cases required government or central bank support, have needed to raise capital, and/or have been impaired in their ability to extend credit. As a result, financial markets in the EU have experienced extreme volatility and declines in asset values and liquidity. These difficulties may continue, worsen, or spread further within the EU. Responses to these financial problems by European governments, central banks, and others, including austerity measures and reforms, may not work, may result in social unrest, and may limit future growth and economic recovery or have other unintended consequences. The risk of investing in securities in the European markets may also be heightened due to the referendum in which the United Kingdom voted to exit the EU commonly known as “Brexit,” which immediately led to significant market volatility around the world, as well as political, economic and legal uncertainty. The United Kingdom formally left the EU on January 31, 2020 and entered into an eleven-month transition period, which expired on December 31, 2020. The negative impact on not only the United Kingdom and European economies could be significant, potentially resulting in increased volatility and illiquidity and lower economic growth for companies that rely significantly on the United Kingdom and/or Europe for their business activities and revenues. Any further exits from the EU, or an increase in the belief that such exits are likely or possible, would likely cause additional market disruption globally and introduce new legal and regulatory uncertainties.
Management Risk
The Fund is an actively managed investment portfolio and is therefore subject to the risk that the investment strategies employed for the Fund may fail to produce the intended results. Although the Fund seeks to provide long-term positive returns, market conditions or implementation of the Fund’s investment process may result in losses, and the Fund may not meet its investment objective. As such, there can be no assurance of positive “absolute” returns.
Floating-Rate Obligations Risk
Securities with floating or variable interest rates can be less sensitive to interest rate changes than securities with fixed interest rates, but may decline in value if their interest rates do not rise as much, or as quickly, as interest rates in general. Conversely, floating rate securities will not generally increase in value if interest rates decline. A decline in interest rates may result in a reduction of income received from floating rate securities held by the Fund and may adversely affect the value of the Fund’s shares. Generally, floating rate securities carry lower yields than fixed notes of the same maturity. The interest rate for a floating rate note resets or adjusts periodically by reference to a benchmark interest rate. The impact of interest rate changes on floating rate investments is typically mitigated by the periodic interest rate reset of the investments. Securities with longer durations tend to be more sensitive to interest rate changes, usually making them more volatile than securities with shorter durations. Benchmark interest rates, such as the London Interbank Offered Rate (“LIBOR”), may not accurately track market interest rates.
Janus Henderson Short Duration Income ETF
Notes to Financial Statements (unaudited)
LIBOR Replacement Risk
The Fund may invest in certain debt securities, derivatives or other financial instruments that utilize the London Interbank Offered Rate (“LIBOR”) as a reference rate for various rate calculations. On July 27, 2017, the U.K. Financial Conduct Authority announced that it intends to stop compelling or inducing banks to submit LIBOR rates after 2021. However, it remains unclear if LIBOR will continue to exist in its current, or a modified, form. Actions by regulators have resulted in the establishment of alternative reference rates to LIBOR in most major currencies. The U.S. Federal Reserve, based on the recommendations of the New York Federal Reserve’s Alternative Reference Rate Committee (comprised of major derivative market participants and their regulators), has begun publishing a Secured Overnight Financing Rate (SOFR), that is intended to replace U.S. dollar LIBOR. Proposals for alternative reference rates for other currencies have also been announced or have already begun publication. However, global consensus on alternative rates is lacking. The elimination of LIBOR or changes to other reference rates or any other changes or reforms to the determination or supervision of reference rates could adversely impact (i) volatility and liquidity in markets that are tied to LIBOR, (ii) the market for, or value of, specific securities or payments linked to those reference rates, (iii) availability or terms of borrowing or refinancing, or (iv) the effectiveness of hedging strategies. For these and other reasons, the elimination of LIBOR or changes to other interest rates may adversely affect the Fund’s performance and/or net asset value. Since the usefulness of LIBOR as a benchmark could deteriorate during the transition period, these effects could occur prior to the end of 2021. Markets are slowly developing in response to these new rates. Uncertainty regarding the process for amending existing contracts or instruments to transition away from LIBOR remains a concern for the Fund. The effect of any changes to, or discontinuation of, LIBOR on the Fund will vary depending, among other things, on (1) existing fallback or termination provisions in individual contracts and (2) whether, how, and when industry participants develop and adopt new reference rates and fallbacks for both legacy and new products and instruments. Accordingly, it is difficult to predict the full impact of the transition away from LIBOR on the Fund until new reference rates and fallbacks for both legacy and new products, instruments and contracts are commercially accepted.
Geographic Investment Risk
To the extent the Fund invests a significant portion of its assets in a particular country or geographic region, the Fund will generally have more exposure to certain risks due to possible political, economic, social, or regulatory events in that country or region. Adverse developments in certain regions could also adversely affect securities of other countries whose economies appear to be unrelated and could have a negative impact on the Fund’s performance.
Counterparties
Fund transactions involving a counterparty are subject to the risk that the counterparty or a third party will not fulfill its obligation to the Fund (“counterparty risk”). Counterparty risk may arise because of the counterparty’s financial condition (i.e., financial difficulties, bankruptcy, or insolvency), market activities and developments, or other reasons, whether foreseen or not. A counterparty’s inability to fulfill its obligation may result in significant financial loss to the Fund. The Fund may be unable to recover its investment from the counterparty or may obtain a limited recovery, and/or recovery may be delayed. The extent of the Fund’s exposure to counterparty risk with respect to financial assets and liabilities approximates its carrying value. See the “Offsetting Assets and Liabilities” section of this Note for further details.
The Fund may be exposed to counterparty risk through participation in various programs, including, but not limited to, lending its securities to third parties, cash sweep arrangements whereby the Fund’s cash balance is invested in one or more types of cash management vehicles, as well as investments in, but not limited to, repurchase agreements, and derivatives, including various types of swaps, futures and options. The Fund intends to enter into financial transactions with counterparties that Janus Capital believes to be creditworthy at the time of the transaction. There is always the risk that Janus Capital’s analysis of a counterparty’s creditworthiness is incorrect or may change due to market conditions. To the extent that the Fund focuses its transactions with a limited number of counterparties, it will have greater exposure to the risks associated with one or more counterparties.
Mortgage- and Asset-Backed Securities
Mortgage- and asset-backed securities represent interests in “pools” of commercial or residential mortgages or other assets, including consumer and commercial loans or receivables. The Fund may purchase fixed or variable rate commercial or residential mortgage-backed securities issued by the Government National Mortgage Association (“Ginnie Mae”), the Federal National Mortgage Association (“Fannie Mae”), the Federal Home Loan Mortgage Corporation (“Freddie Mac”), or other governmental or government-related entities. Ginnie Mae’s guarantees are backed as to the timely payment of principal and interest by the full faith and credit of the U.S. Government. Fannie Mae and Freddie Mac securities are not backed by the full faith and credit of the U.S. Government. In September 2008, the Federal Housing Finance Agency (“FHFA”), an agency of the U.S. Government, placed Fannie Mae and Freddie Mac under conservatorship. Since that time, Fannie Mae and Freddie Mac have received capital support through U.S. Treasury
| | |
| | Janus Detroit Street Trust ½ 31 |
Janus Henderson Short Duration Income ETF
Notes to Financial Statements (unaudited)
preferred stock purchases and Treasury and Federal Reserve purchases of their mortgage-backed securities. The FHFA and the U.S. Treasury have imposed strict limits on the size of these entities’ mortgage portfolios. The FHFA has the power to cancel any contract entered into by Fannie Mae and Freddie Mac prior to FHFA’s appointment as conservator or receiver, including the guarantee obligations of Fannie Mae and Freddie Mac.
The Fund may also purchase other mortgage- and asset-backed securities through single- and multi-seller conduits, collateralized debt obligations, structured investment vehicles, and other similar securities. Asset-backed securities may be backed by various consumer obligations, including automobile loans, equipment leases, credit card receivables, or other collateral. In the event the underlying loans are not paid, the securities’ issuer could be forced to sell the assets and recognize losses on such assets, which could impact your return. Unlike traditional debt instruments, payments on these securities include both interest and a partial payment of principal. Mortgage- and asset-backed securities are subject to both extension risk, where borrowers pay off their debt obligations more slowly in times of rising interest rates, and prepayment risk, where borrowers pay off their debt obligations sooner than expected in times of declining interest rates. These risks may reduce the Fund’s returns. In addition, investments in mortgage- and asset-backed securities, including those comprised of subprime mortgages, may be subject to a higher degree of credit risk, valuation risk, extension risk (if interest rates rise), and liquidity risk than various other types of fixed-income securities. Additionally, although mortgage-backed securities are generally supported by some form of government or private guarantee and/or insurance, there is no assurance that guarantors or insurers will meet their obligations.
Sovereign Debt
The Fund may invest in U.S. and non-U.S. government debt securities (“sovereign debt”). Some investments in sovereign debt, such as U.S. sovereign debt, are considered low risk. However, investments in sovereign debt, especially the debt of less developed countries, can involve a high degree of risk, including the risk that the governmental entity that controls the repayment of sovereign debt may not be willing or able to repay the principal and/or to pay the interest on its sovereign debt in a timely manner. A sovereign debtor’s willingness or ability to satisfy its debt obligation may be affected by various factors including, but not limited to, its cash flow situation, the extent of its foreign currency reserves, the availability of foreign exchange when a payment is due, the relative size of its debt position in relation to its economy as a whole, the sovereign debtor’s policy toward international lenders, and local political constraints to which the governmental entity may be subject. Sovereign debtors may also be dependent on expected disbursements from foreign governments, multilateral agencies, and other entities. The failure of a sovereign debtor to implement economic reforms, achieve specified levels of economic performance, or repay principal or interest when due may result in the cancellation of third party commitments to lend funds to the sovereign debtor, which may further impair such debtor’s ability or willingness to timely service its debts. The Fund may be requested to participate in the rescheduling of such sovereign debt and to extend further loans to governmental entities, which may adversely affect the Fund’s holdings. In the event of default, there may be limited or no legal remedies for collecting sovereign debt and there may be no bankruptcy proceedings through which the Fund may collect all or part of the sovereign debt that a governmental entity has not repaid. In addition, to the extent the Fund invests in non-U.S. sovereign debt, it may be subject to currency risk.
Offsetting Assets and Liabilities
The Fund presents gross and net information about transactions that are either offset in the financial statements or subject to an enforceable master netting arrangement or similar agreement with a designated counterparty, regardless of whether the transactions are actually offset in the Statement of Assets and Liabilities.
In order to better define its contractual rights and to secure rights that will help the Fund mitigate its counterparty risk, the Fund may enter into an International Swaps and Derivatives Association, Inc. Master Agreement (“ISDA Master Agreement”) or similar agreement with its derivative contract counterparties. An ISDA Master Agreement is a bilateral agreement between the Fund and a counterparty that governs OTC derivatives and forward foreign currency exchange contracts and typically contains, among other things, collateral posting terms and netting provisions in the event of a default and/or termination event. Under an ISDA Master Agreement, in the event of a default and/or termination event, the Fund may offset with each counterparty certain derivative financial instruments’ payables and/or receivables with collateral held and/or posted and create one single net payment. For financial reporting purposes, the Fund does not offset financial instruments’ payables and receivables and related collateral on the Statement of Assets and Liabilities.
The following tables present gross amounts of recognized assets and/or liabilities and the net amounts after deducting collateral that has been pledged by counterparties or has been pledged to counterparties (if applicable). For
Janus Henderson Short Duration Income ETF
Notes to Financial Statements (unaudited)
corresponding information grouped by type of instrument, see either the “Fair Value of Derivative Instruments as of April 30, 2021” table located in the Fund’s Schedule of Investments.
Offsetting of Financial Assets and Derivative Assets
| | | | | | | | | | | | | | | | |
| Counterparty | | Gross Amounts
of Recognized
Assets | | | Offsetting Asset
or Liability(a) | | | Collateral
Pledged(b) | | | Net Amount | |
| Citibank N.A. | | $ | 16,292 | | | $ | (16,292) | | | $ | — | | | $ | — | |
| J.P. Morgan Chase Bank | | | 70,631 | | | | (70,631) | | | | — | | | | — | |
| Morgan Stanley & Co. | | | 2,108,815 | | | | (46,130) | | | | — | | | | 2,062,685 | |
| Total | | $ | 2,195,738 | | | $ | (133,053) | | | $ | — | | | $ | 2,062,685 | |
Offsetting of Financial Liabilities and Derivative Liabilities
| | | | | | | | | | | | | | | | |
| Counterparty | | Gross Amounts
of Recognized
Liabilities | | | Offsetting Asset
or Liability(a) | | | Collateral
Pledged(b) | | | Net Amount | |
| Citibank N.A. | | $ | 1,236,632 | | | $ | (16,292) | | | $ | — | | | $ | 1,220,340 | |
| J.P. Morgan Chase Bank | | | 145,282 | | | | (70,631) | | | | — | | | | 74,651 | |
| Morgan Stanley & Co. | | | 46,130 | | | | (46,130) | | | | — | | | | — | |
| Total | | $ | 1,428,044 | | | $ | (133,053) | | | $ | — | | | $ | 1,294,991 | |
| (a) | Represents the amount of assets or liabilities that could be offset with the same counterparty under master netting or similar agreements that management elects not to offset on the Statement of Assets and Liabilities. |
| (b) | Collateral pledged is limited to the net outstanding amount due to/from an individual counterparty. The actual collateral amounts pledged may exceed these amounts and may fluctuate in value. |
The Fund generally does not exchange collateral on its forward currency contracts with its counterparties; however, all liquid securities and restricted cash are considered to cover in an amount at all times equal to or greater than the Fund’s commitment with respect to these contracts. Certain securities may be segregated at the Fund’s custodian. These segregated securities are denoted on the accompanying Schedule of Investments and are evaluated daily to ensure their cover and/or market value equals or exceeds the Fund’s corresponding forward foreign currency exchange contract’s obligation value.
The Fund may require the counterparty to pledge securities as collateral daily (based on the daily valuation of the financial asset) if the Fund has a net aggregate unrealized gain on OTC derivative contracts with a particular counterparty. The Fund may deposit cash as collateral with the counterparty and/or custodian daily (based on the daily valuation of the financial asset) if the Fund has a net aggregate unrealized loss on OTC derivative contracts with a particular counterparty. The collateral amounts are subject to minimum exposure requirements and initial margin requirements. Collateral amounts are monitored and subsequently adjusted up or down as valuations fluctuate by at least the minimum exposure requirement. Collateral may reduce the risk of loss.
4. Investment Advisory Agreements and Other Transactions with Affiliates
Under its unitary fee structure, the Fund pays Janus Capital a management fee in return for providing certain investment advisory, supervisory, and administrative services to the Fund, including the costs of transfer agency, custody, fund administration, legal, audit, and other services. Janus Capital’s fee structure is designed to pay substantially all of the Fund’s expenses. However, the Fund bears other expenses which are not covered under the management fee which may vary and affect the total level of expenses paid by shareholders, such as distribution fees (if any), brokerage expenses or commissions, interest, dividends, taxes, litigation expenses, acquired fund fees and expenses (if any), and extraordinary expenses. The Fund’s unitary management fee provides for reductions in the fee rate as the Fund’s assets grow. As of the date of this report, the Fund’s management fee was calculated daily and paid monthly according to the following schedule:
| | | | |
| Daily Net Assets | | Fee Rate | |
| $0-$500 million | | | 0.30% | |
| Next $500 million | | | 0.25% | |
| Over $1 billion | | | 0.20% | |
| | |
| | Janus Detroit Street Trust ½ 33 |
Janus Henderson Short Duration Income ETF
Notes to Financial Statements (unaudited)
Additionally, Janus Capital has contractually agreed to waive and/or reimburse the management fee payable by the Fund in an amount equal to the amount, if any, that the Fund’s total annual fund operating expenses (excluding distribution fees (if any), brokerage expenses or commissions, interest, dividends, taxes, litigation expenses, acquired fund fees and expenses (if any), and other extraordinary expenses not incurred in the ordinary course of the Fund’s business) exceed the annual rate of 0.23% of the Fund’s average daily net assets. Janus Capital has agreed to continue the waiver for at least the period from February 28, 2021 through February 28, 2022. If applicable, amounts waived and/or reimbursed to the Fund by Janus Capital are disclosed as “Excess Expense Reimbursement and Waivers” on the Statement of Operations.
For the period ended April 30, 2021, the Fund’s contractual management fee rate (expressed as an annual rate) was
0.23% of the Fund’s average daily net assets.
As of the date of this report, State Street Bank and Trust Company (“State Street”) provides certain fund administration services to the Fund, including services related to the Fund’s accounting, including calculating the daily NAV, audit coordination, tax, and reporting obligations, pursuant to an agreement with Janus Capital, on behalf of the Fund. As compensation for such services, Janus Capital pays State Street a fee based on a percentage of the Fund’s assets, with a minimum flat fee, for certain services. Janus Capital serves as administrator to the Fund, providing oversight and coordination of the Fund’s service providers, recordkeeping and other administrative services. Janus Capital does not receive any additional compensation, beyond the unitary fee, for serving as administrator. State Street also serves as transfer agent for the shares of the Fund. Pursuant to agreements with Janus Capital on behalf of the Fund, State Street Global Markets, an affiliate of State Street, may execute portfolio transactions for the Fund, including but not limited to, transactions in connection with cash in lieu transactions for non-US securities.
The Fund’s Board of Trustees (“Board”) has approved a Distribution and Servicing Plan for shares of the Fund pursuant to Rule 12b-1 under the 1940 Act (the “Plan”). The Plan permits compensation in connection with the distribution and marketing of Fund shares and/or the provision of certain shareholder services. The Plan permits the Fund to pay ALPS Distributors, Inc. (the “Distributor”) or its designee, a fee for the sale and distribution and/or shareholder servicing of the shares at an annual rate of up to 0.25% of average daily net assets of the Fund. Under the terms of the Plan, the Fund would be authorized to make payments to the Distributor or its designee for remittance to retirement plan service providers, broker-dealers, bank trust departments, financial advisors, and other financial intermediaries, as compensation for distribution and/or shareholder services performed by such entities for their customers who are investors in the Fund. The 12b-1 fee may only be imposed or increased when (i) the Trustees determine that it is in the best interests of shareholders to do so, and (ii) the imposition of or increase in the 12b-1 fee is first approved by the Fund’s shareholders. Because these fees are paid out of the Fund’s assets on an ongoing basis, to the extent that a fee is authorized by shareholders in the future, over time they will increase the cost of an investment in the Fund. The Plan fee may cost an investor more than other types of sales charges. At this time, Janus Capital does not intend to seek shareholder approval for implementation of the Plan.
As of April 30, 2021, an affiliate of Janus Capital owned 101,000 shares or 0.17% of the Fund.
The Fund is permitted to purchase or sell securities (“cross-trade”) between itself and other funds or accounts managed by Janus Capital in accordance with Rule 17a-7 under the Investment Company Act of 1940 (“Rule 17a-7”), when the transaction is consistent with the investment objectives and policies of the Fund and in accordance with the Internal Cross Trade Procedures adopted by the Trust’s Board of Trustees. These procedures have been designed to ensure that any cross-trade of securities by the Fund from or to another fund or account that is or could be considered an affiliate of the Fund under certain limited circumstances by virtue of having a common investment adviser, common Officer, or common Trustee complies with Rule 17a-7. Under these procedures, each cross-trade is effected at the current market price to save costs where allowed. During the period ended April 30, 2021, the Fund engaged in cross trades amounting to $82,345,957 in purchases.
5. Federal Income Tax
Income and capital gains distributions are determined in accordance with income tax regulations that may differ from US GAAP. These differences are due to differing treatments for items such as net short-term gains, deferral of wash sale losses, foreign currency transactions, passive foreign investment companies, net investment losses, in-kind transactions and capital loss carryovers.
The Fund has elected to treat gains and losses on forward foreign currency contracts as capital gains and losses, if applicable. Other foreign currency gains and losses on debt instruments are treated as ordinary income for federal income tax purposes pursuant to Section 988 of the Internal Revenue Code.
Janus Henderson Short Duration Income ETF
Notes to Financial Statements (unaudited)
Accumulated capital losses noted below represent net capital loss carryovers, as of October 31, 2020, that may be available to offset future realized capital gains and thereby reduce future taxable gains distributions. The following table shows these capital loss carryovers.
| | | | | | | | | | |
Capital Loss Carryover Schedule
For the year ended October 31, 2020
No Expiration | | | Accumulated Capital Losses | |
| Short-Term | | | Long-Term | |
| $ | (1,038,420) | | | $ | (3,402,630) | | | $ | (4,441,050) | |
The aggregate cost of investments and the composition of unrealized appreciation and depreciation of investment securities for federal income tax purposes as of April 30, 2021 are noted below. The primary difference between book and tax appreciation or depreciation of investments is wash sale loss deferrals.
| | | | | | | | | | | | | | |
| Federal Tax Cost | | | Unrealized Appreciation | | | Unrealized (Depreciation) | | | Net Tax Appreciation/
(Depreciation) | |
| $ | 2,949,009,576 | | | $ | 59,501,942 | | | $ | (3,503,907) | | | $ | 55,998,035 | |
6. Capital Share Transactions
| | | | | | | | | | | | | | | | |
| | | Period ended April 30, 2021 | | | Year ended October 31, 2020 | |
| | | Shares | | | Amount | | | Shares | | | Amount | |
| Shares sold | | | 6,850,000 | | | $ | 345,555,343 | | | | 35,700,000 | | | $ | 1,790,187,597 | |
| Shares repurchased | | | (1,600,000) | | | | (80,252,017) | | | | (2,400,000) | | | | (118,575,652) | |
Net Increase/(Decrease) | | | 5,250,000 | | | $ | 265,303,326 | | | | 33,300,000 | | | $ | 1,671,611,945 | |
7. Purchases and Sales of Investment Securities
For the period ended April 30, 2021, the aggregate cost of purchases and proceeds from sales of investment securities (excluding any short-term securities, short-term options contracts, and in-kind transactions) was as follows:
| | | | | | | | | | | | | | |
Purchases of Securities | | | Proceeds from Sales of Securities | | | Purchases of Long- Term U.S. Government Obligations | | | Proceeds from Sales of Long-Term U.S. Government Obligations | |
| $ | 936,994,592 | | | $ | 436,593,803 | | | $ | — | | | $ | — | |
8. Recent Accounting Pronouncements
The FASB issued Accounting Standards Update 2020-04 Reference Rate Reform: Facilitation of the Effects of Reference Rate Reform on Financial Reporting (“ASU 2020-04”) in March 2020. The new guidance in the ASU provide optional temporary financial reporting relief from the effect of certain types of contract modifications due to the planned discontinuation of the LIBOR or other interbank-offered based reference rates as of the end of 2021. For new and existing contracts, Funds may elect to apply the guidance as of March 12, 2020 through December 31, 2022. Management is currently evaluating the impact, if any, of the ASU’s adoption to the Fund’s financial statements.
9. Subsequent Events
Management has evaluated whether any events or transactions occurred subsequent to April 30, 2021 and through
the date of the issuance of the Fund’s financial statements and determined that there were no material events or
transactions that would require recognition or disclosure in the Fund’s financial statements.
| | |
| | Janus Detroit Street Trust ½ 35 |
Janus Henderson Short Duration Income ETF
Additional Information (unaudited)
Proxy Voting Policies and Voting Record
A description of the policies and procedures that the Fund uses to determine how to vote proxies relating to its portfolio securities is available without charge: (i) upon request, by calling 1-800-668-0434 (toll free); (ii) on the Fund’s website at janushenderson.com/proxyvoting; and (iii) on the SEC’s website at http://www.sec.gov.
Quarterly Portfolio Holdings
The Fund files its complete portfolio holdings (schedule of investments) with the SEC for the first and third quarters each fiscal year as an exhibit to Form N-PORT within 60 days of the end of such fiscal quarter. The Fund’s Form N-PORT filings: are available on the SEC’s website at http://www.sec.gov; (ii) may be reviewed and copied at the SEC’s Public Reference Room in Washington, D.C. (information on the Public Reference Room may be obtained by calling 1-800-SEC-0330); and (iii) are available without charge, upon request, by calling Janus Henderson at 1-800-668-0434 (toll free).
Janus Henderson Short Duration Income ETF
Board Considerations Regarding Approval of Investment Advisory Agreements (unaudited)
The Board of Trustees (the “Board”) of Janus Detroit Street Trust (the “Trust”), including a majority of the Trustees who are not “interested persons” as that term is defined in the Investment Company Act of 1940, as amended (the “Independent Trustees”), met on April 21-22, 2021 to consider the proposed renewal of the investment management agreement between Janus Capital Management LLC (the “Adviser”) and the Trust (the “Investment Management Agreement”), on behalf of Janus Henderson Short Duration Income ETF (“VNLA”), Janus Henderson Small Cap Growth Alpha ETF (“JSML”), Janus Henderson Small/Mid Cap Growth Alpha ETF (“JSMD”), Janus Henderson Mortgage-Backed Securities ETF (“JMBS”) and The Long Term Care ETF (“OLD” and, together with VNLA, JSML, JSMD and JMBS, the “Funds”). In the course of their consideration of the renewal of the Investment Management Agreement, the Independent Trustees met in executive session and were advised by their independent counsel. In this regard, the Independent Trustees evaluated the terms of the Investment Management Agreement and reviewed the duties and responsibilities of trustees in evaluating and approving such agreements. In considering renewal of the Investment Management Agreement, the Board and the Independent Trustees, as applicable, reviewed the materials provided to them relating to the consideration of the renewal of the Investment Management Agreement for the Funds and other information provided by counsel and the Adviser, including: (i) information regarding the nature, quality and extent of the services provided to the Funds by the Adviser, and the fees charged to each Fund therefor; (ii) information concerning the Adviser’s financial condition, business, operations, portfolio management personnel, compliance programs, and profitability with respect to the Trust and each Fund; (iii) comparative information describing each Fund’s advisory fee structures, operating expenses, and performance information as compared to peer fund groups selected and reported to the Board by an independent third party; (iv) a copy of the Adviser’s current Form ADV; and (v) a memorandum from counsel to the Independent Trustees on the responsibilities of trustees in considering investment advisory arrangements under the 1940 Act. The Board also considered presentations made by, and discussions held with, representatives of the Adviser over the previous year and since the inception of the Funds. The Trustees previously met via telephone on March 15, 2021 to discuss certain information provided by the Adviser related to the Trustees’ consideration of the renewal of the Investment Management Agreement.
During its review of this information, the Board focused on and analyzed the factors that it deemed relevant, including, among other factors: (i) the nature, extent and quality of the services provided to the Funds by the Adviser; (ii) the Adviser’s personnel and operations; (iii) each Fund’s expense level; (iv) the profitability to the Adviser under the Investment Management Agreement with respect to each Fund; (v) any “fall-out” benefits to the Adviser and its affiliates (i.e., the ancillary benefits realized by the Adviser and its affiliates from the Adviser’s relationship with the Trust); (vi) the effect of asset growth on each Fund’s expenses; and (vii) potential conflicts of interest.
The Trustees also considered benefits that accrue to the Adviser and its affiliates from their relationships with the Trust and each Fund. The Trustees also considered that, other than the services provided by the Adviser and its affiliates pursuant to agreements with the Funds and the fees paid by the Funds therefor, the Funds and the Adviser may potentially benefit from their relationship with each other in other ways. The Trustees considered that the success of the Funds could attract other business to the Adviser or other Janus Henderson funds, and that the success of the Adviser could enhance the Adviser’s ability to serve the Funds.
The Board, including the Independent Trustees, considered the following in respect of the Funds:
(a) The nature, extent and quality of services provided by the Adviser; personnel and operations of the Adviser.
The Board reviewed the services that the Adviser provides to the Funds. In connection with the investment advisory services provided by the Adviser, the Board noted the responsibilities that the Adviser has as the Funds’ investment adviser, including: the overall supervisory responsibility for the general management and investment of each Fund’s securities portfolio; providing oversight of the investment performance and processes and compliance with each Fund’s investment objectives, policies and limitations; the implementation of the investment management program of each Fund; the management of the day-to-day investment and reinvestment of the assets of each Fund; determining daily baskets of securities and cash components in connection with creation and redemption transactions in each Fund’s shares; executing portfolio security trades for purchases and redemptions of each Fund’s shares conducted on a cash-in-lieu basis; the review of brokerage matters; the oversight of general portfolio compliance with relevant law; and the implementation of Board directives as they relate to the Funds.
The Board reviewed the Adviser’s experience, resources and strengths in managing the Funds and other pooled investment vehicles, including an assessment of the Adviser’s personnel. Based on its consideration and review of the foregoing information, the Board determined that each Fund was likely to continue to benefit from the nature, quality and extent of these services, as well as the Adviser’s ability to render such services based on the Adviser’s experience, personnel, operations and resources.
| | |
| | Janus Detroit Street Trust ½ 37 |
Janus Henderson Short Duration Income ETF
Board Considerations Regarding Approval of Investment Advisory Agreements (unaudited)
(b) Comparison of services rendered and fees paid under other investment advisory contracts, and the cost of the services to be provided and profits to be realized by the Adviser from the relationship with the Funds; “fall-out” benefits.
The Board then compared both the services rendered and the fees paid under other contracts of the Adviser and under contracts of other investment advisers with respect to similar mutual funds and ETFs. In particular, the Board reviewed a report compiled by an independent third party to compare each Fund’s management fee and expense ratio to other investment companies within each Fund’s respective peer grouping, as determined by the independent third party.
The comparative reporting indicated that total expense ratios for JSMD, VNLA, JMBS and OLD were in the 1st, 2nd, 1st and 1st quintiles, respectively, as compared to each Fund’s respective peer grouping. The comparative reporting indicated that the total expense ratio for JMSL was ranked third in the peer group assigned by the independent third party, which contained five peers. The Board also noted that the Adviser had reduced the management fees charged to the Funds at the April 22-23, 2020 Meeting by implementing reductions in each Fund’s breakpoint schedule. The Board further considered that the Adviser had voluntarily agreed to cap the expenses of VNLA and JMBS to the extent that the Funds’ total expense ratio exceeded 0.23% and 0.29%, respectively, for at least the period February 28, 2021 through February 28, 2022.
The Board also discussed the costs incurred by the Adviser in connection with its serving as investment adviser to the Funds, including operational costs. After comparing each Fund’s fees and expenses with those of other ETFs and mutual funds (as applicable) in the Funds’ respective peer groups, and in light of the nature, extent and quality of services provided by the Adviser and the costs incurred by the Adviser in rendering those services, as well as the profitability of the Adviser in providing these services, the Board concluded that the level of fees paid to the Adviser and the profitability with respect to each Fund was fair and reasonable.
The Board also considered that the Adviser may experience reputational “fall-out” benefits based on the success of the Funds, but that such benefits are not easily quantifiable.
(c) The extent to which economies of scale would be realized as the Fund grows and whether fee levels would reflect such economies of scale.
The Board next discussed potential economies of scale. In its review, the Board considered that the Funds were positioned to realize economies of scale as assets grow over time, given the inclusion of management fee breakpoints for each Fund in the current investment advisory agreement at various asset levels.
(d) Investment performance of the Fund and the Adviser.
The Board next discussed the performance of the Funds on both an absolute basis and relative to the performance of funds comprising a peer group compiled by an independent third party for each Fund for the one-year period, two-year period, r three-year period, and/or four-year period, as applicable. The Board noted that for the one-, two-, three-, and four year periods, respectively, OLD was reported to be in the 5th, 5th, 5th and 5th quintiles, JSMD was reported to be in the 3rd, 3rd, 2nd and 3rd quintiles and JSML was reported to be in the 4th, 3rd, 3rd and 3rd quintiles. VNLA was reported to be in the 3rd, 4th and 2nd quintiles for the one-, two- and three-year periods, respectively. JMBS was reported to be in the 1st quintile for both the one- and two-year periods. The Board considered the Adviser’s explanation of performance provided as part of the consideration of the renewal of the Investment Advisory Agreement, and during the course of the previous year.
With respect to OLD, JSML and JSMD, the Board noted that these Funds are index-based and, as a result, passively managed to seek to track the returns of specified indices. For this reason, the Board also considered the performance of these Funds in relation to the performance of each Fund’s respective underlying index (i.e. “tracking error”), and considered that the tracking error was within anticipated ranges.
Conclusion.
No single factor was determinative to the decision of the Board. Based on the foregoing and such other matters as were deemed relevant, the Board concluded that the management fee rates and total expense ratios of each Fund are reasonable in relation to the services provided by the Adviser to such Fund, as well as the costs incurred and benefits gained by the Adviser in providing such services. The Board also found the management fees to be reasonable in comparison to the fees charged by advisers to other comparable ETFs and mutual funds (as applicable). As a result, the Board concluded that the renewal of the Investment Management Agreement for an additional one-year period was in the best interests of each Fund.
After full consideration of the above factors, as well as other factors, the Trustees, including all of the Independent Trustees voting separately, determined to approve the renewal of the Investment Management Agreement for each Fund.
Janus Henderson Short Duration Income ETF
Liquidity Risk Management Program (unaudited)
Rule 22e-4 under the Investment Company Act of 1940, as amended (the “Liquidity Rule”), requires open-end funds (but not money market funds) to adopt and implement a written liquidity risk management program (the “LRMP”) that is reasonably designed to assess and manage liquidity risk. In compliance with the Liquidity Rule, the Fund has implemented a LRMP, which incorporates the following elements: (i) assessment, management, and periodic review of liquidity risk; (ii) classification of portfolio holdings, as applicable; (iii) the establishment and monitoring of a highly liquid investment minimum, as applicable; (iv) a 15% limitation on a Fund’s illiquid investments; (v) redemptions in-kind; and (vi) board oversight. In light of the fact that the Fund operates as an exchange-traded fund (“ETF”), the LRMP also takes into account considerations unique to ETFs, including the relationship between the ETF’s portfolio liquidity and the way in which, and the prices and spreads at which, ETF shares trade, including: (i) the efficiency of the arbitrage function and the level of active participation by market participants (including authorized participants); and (ii) the effect of the composition of baskets on the overall liquidity of the ETF’s portfolio. The LRMP also considers whether the ETF meets redemptions through in-kind transfers of securities, positions, and assets other than a de minimis amount of cash.
The Trustees of the Fund (the “Trustees”) have designated Janus Capital Management LLC, the Fund’s investment adviser (“Janus Capital”), as the Program Administrator for the LRMP. A working group comprised of various groups within Janus Capital’s business is responsible for administering different aspects of the LRMP (the “Liquidity Risk Working Group”).
The Liquidity Rule requires the Trustees to review at least annually a written report provided by the Janus Capital that addresses the operation of the LRMP and assesses its adequacy and the effectiveness of its implementation, including, if applicable, the operation of the highly liquid investment minimum and any material changes to the LRMP (the “Program Administrator Report”). At a meeting held April 22, 2021, Janus Capital provided the Program Administrator Report to the Trustees which covered the operation of the LRMP from January 1, 2020 through December 31, 2020 (the “Reporting Period”).
The Program Administrator Report discussed the operation and effectiveness of the LRMP during the Reporting Period. It noted that the Fund was able to meet redemptions during the normal course of business during the Reporting Period, and discussed the additional actions that the Liquidity Risk Working Group took during the period of market volatility in the spring of 2020, in light of the impact of the coronavirus outbreak, to monitor the Fund’s liquidity. The Program Administrator Report also stated that the Fund did not exceed the 15% limit on illiquid assets during the Reporting Period, that the Fund held primarily highly liquid assets, and was considered to be a primarily highly liquid fund during the Reporting Period. In addition, Janus Capital expressed its belief in the Program Administrator Report that the LRMP is reasonably designed and adequate to assess and manage the Fund’s liquidity risk, taking into account the Fund’s particular risks and circumstances, and includes policies and procedures reasonably designed to implement each required component of the Liquidity Rule.
There can be no assurance that the LRMP will achieve its objectives in the future. Please refer to your Fund’s prospectus for more information regarding the risks to which an investment in the Fund may be subject.
| | |
| | Janus Detroit Street Trust ½ 39 |
Janus Henderson Short Duration Income ETF
Notes
Janus Henderson Short Duration Income ETF
Notes
| | |
| | Janus Detroit Street Trust ½ 41 |
This report is submitted for the general information of shareholders of the Fund. It is not an offer or solicitation for the Fund and is not authorized for distribution to prospective investors unless preceded or accompanied by an effective prospectus.
Janus Henderson is a trademark of Janus Henderson Group plc or one of its subsidiaries. © Janus Henderson Group plc.
Janus Capital Management LLC is the investment adviser and ALPS Distributors, Inc. is the distributor. ALPS is not affiliated with Janus Henderson or any of its subsidiaries.
SEMIANNUAL REPORT
April 30, 2021
Janus Henderson Mortgage-Backed Securities ETF
Janus Detroit Street Trust

Table of Contents
Janus Henderson Mortgage-Backed Securities ETF (unaudited)
Fund At A Glance
April 30, 2021
INVESTMENT OBJECTIVE
The Janus Henderson Mortgage-Backed Securities ETF seeks a high level of total return consisting of income and capital appreciation. The Fund seeks to identify high-quality U.S. Agency MBS opportunities by modeling inefficiencies in borrower behavior.
| | | | |
| Sector Allocation – (% of Net Assets) | |
Mortgage-Backed Securities | | | 133.2% | ^ |
Investment Companies | | | 38.4% | |
Asset-Backed Securities | | | 5.6% | |
Consumer, Non-cyclical | | | 0.4% | |
| | | | |
| | | 177.6% | |
| ^ | Percentage includes amounts allocated to certain Forward Commitment Transactions, including “to-be announced” mortgage-backed securities. Please see the Schedule of Investments and Notes to Financial Statements for additional information. |
Holdings are subject to change without notice.
| | |
| | Janus Detroit Street Trust ½ 1 |
Janus Henderson Mortgage-Backed Securities ETF (unaudited)
Performance
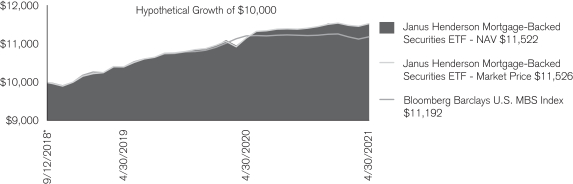
| | | | | | |
| Average Annual Total Return for the period ended April 30, 2021 |
| | | Fiscal
Year-to-Date | | One
Year | | Since
Inception* |
Janus Henderson Mortgage-Backed Securities ETF – NAV | | 0.96% | | 3.09% | | 5.53% |
Janus Henderson Mortgage-Backed Securities ETF – Market Price | | 0.98% | | 3.30% | | 5.55% |
Bloomberg Barclays U.S. MBS Index | | -0.27% | | -0.17% | | 4.37% |
| * | The Fund commenced operations on September 12, 2018. |
Total annual expense ratio as stated in the prospectus: 0.33% (gross), 0.32 (net). See Financial Highlights for actual expense ratios during the reporting period.
Returns quoted are past performance and do not guarantee future results; current performance may be lower or higher. Investment returns and principal value will vary; there may be a gain or loss when shares are sold. For the most recent month-end performance call 800.668.0434 or visit janushenderson.com/performance.
Shares of ETFs are bought and sold at market price (not NAV) and are not individually redeemed from the Fund. Market returns are based upon the midpoint of the bid/ask spread at 4:00 p.m. Eastern time (when NAV is normally determined for most ETFs), and do not represent the returns you would receive if you traded shares at other times. Ordinary brokerage commissions apply and will reduce returns.
Net expense ratios reflect the expense waiver, if any, contractually agreed to through at least February 28, 2022.
Investing involves risk, including the possible loss of principal and fluctuation of value.
See the prospectus for a more complete discussion of objectives, risks and expenses.
Returns include reinvestment of dividends and capital gains. Returns do not reflect the deduction of taxes that a shareholder would pay on Fund distributions, sales, or redemptions Fund shares.
There is no assurance the stated objective(s) will be met.
See Notes to Schedule of Investments and Other Information for index definitions.
Index performance does not reflect the expenses of managing a portfolio as an index is unmanaged and not available for direct investment.
Janus Henderson Mortgage-Backed Securities ETF (unaudited)
Disclosure of Fund Expenses
As a shareholder of the Fund, you incur two types of costs: (1) transaction costs, which may include creation and redemption fees or brokerage charges and (2) ongoing costs, including management fees and other Fund expenses. This example is intended to help you understand your ongoing costs (in dollars) of investing in the Fund and to compare these costs with the ongoing costs of investing in other ETFs. To do so, compare this 5% hypothetical example with the 5% hypothetical examples that appear in the shareholder reports of the other funds. The example is based upon an investment of $1,000 invested at the beginning of the period and held for the six-months indicated, unless noted otherwise in the table and footnotes below.
Actual Expenses
The information in the table under the heading “Actual” provides information about actual account values and actual expenses. You may use the information in these columns, together with the amount you invested, to estimate the expenses that you paid over the period. Simply divide your account value by $1,000 (for example, an $8,600 account value divided by $1,000 = 8.6), then multiply the result by the number under the heading entitled “Expenses Paid During Period” to estimate the expenses you paid on your account during the period.
Hypothetical Example for Comparison Purposes
The information in the table under the heading “Hypothetical (5% return before expenses)” provides information about hypothetical account values and hypothetical expenses based upon the Fund’s actual expense ratio and an assumed rate of return of 5% per year before expenses, which is not the Fund’s actual return. The hypothetical account values and expenses may not be used to determine the actual ending account balance or expenses you paid for the period. You may use this information to compare the ongoing costs of investing in the Fund and other funds. To do so, compare this 5% hypothetical example with the 5% hypothetical examples that appear in the shareholder reports of the other funds. Additionally, for an analysis of the fees associated with an investment or other similar funds, please visit www.finra.org/fundanalyzer.
Please note that the expenses shown in the table are meant to highlight your ongoing costs only and do not reflect any transaction costs, such as creation and redemption fees, or brokerage charges. These fees are fully described in the Fund’s prospectus. Therefore, the hypothetical examples are useful in comparing ongoing costs only, and will not help you determine the relative total costs of owning different funds. In addition, if these transaction costs were included, your costs would have been higher.
| | | | | | | | | | | | | | | | | | | | | | | | |
Actual | | | Hypothetical
(5% return before expenses) | | | | |
Beginning
Account
Value
(11/1/20) | | Ending
Account
Value
(4/30/21) | | | Expenses
Paid During
Period
(11/1/20 - 4/30/21)† | | | Beginning
Account
Value
(11/1/20) | | | Ending
Account
Value
(4/30/21) | | | Expenses
Paid During
Period
(11/1/20 - 4/30/21)† | | | Net Annualized
Expense Ratio
(11/1/20 - 4/30/21) | |
| $1,000.00 | | $ | 1,009.60 | | | $ | 1.44 | | | $ | 1,000.00 | | | $ | 1,023.36 | | | $ | 1.45 | | | | 0.29% | |
| † | Expenses Paid During Period is equal to the Net Annualized Expense Ratio multiplied by the average account value over the period, multiplied by 181/365 (to reflect the one-half year period). |
| | |
| | Janus Detroit Street Trust ½ 3 |
Janus Henderson Mortgage-Backed Securities ETF
Schedule of Investments (unaudited)
April 30, 2021
| | | | | | | | |
| | | Shares/
Principal Amounts | | | Value | |
| Asset-Backed Securities – 5.6% | |
Bayview Opportunity Master fund, 1.5607%, 1/10/31 | | | $6,188,715 | | | | $6,188,715 | |
BVRT Financing Trust, 1.8705%, 11/10/32 (144A) | | | 5,121,218 | | | | 5,121,218 | |
BVRT Financing Trust, 0%, 1/10/33 (144A) | | | 11,112,631 | | | | 11,112,631 | |
BVRT Financing Trust, 1.5600%, 7/1/33 (144A) | | | 1,332,930 | | | | 1,332,998 | |
BVRT Financing Trust, 2.0600%, 7/1/33 (144A) | | | 3,000,000 | | | | 3,000,292 | |
LakeView 2020, 1.9000%, 7/10/32 (144A) | | | 4,090,571 | | | | 4,090,571 | |
LakeView 2020, 3.0000%, 7/10/32 (144A) | | | 2,526,000 | | | | 2,526,000 | |
NRZ Excess Spread-Collateralized Notes, 3.8440%, 12/25/25 (144A) | | | 2,828,400 | | | | 2,859,116 | |
VCAT LLC, 3.6710%, 8/25/50 (144A)Ç | | | 3,724,328 | | | | 3,783,777 | |
Total Asset-Backed Securities (cost $39,924,742) | | | | | | | 40,015,318 | |
| Corporate Bonds – 0.4% | |
| Consumer, Non-cyclical – 0.4% | |
Celestial-Saturn Merger Sub, Inc., 4.5000%, 5/1/28 (144A) | | | 2,500,000 | | | | 2,496,325 | |
Total Corporate Bonds (cost $2,500,000) | | | | | | | 2,496,325 | |
| Mortgage-Backed Securities – 133.2% | |
Angel Oak Mortgage Trust I LLC, 3.6490%, 9/25/48 (144A)‡ | | | 24,134 | | | | 24,334 | |
BVRT Financing Trust, 1.5663%, 1/10/32 (144A) | | | 3,966,000 | | | | 3,966,000 | |
CIM Trust, 2.5690%, 7/25/55 (144A)Ç | | | 2,553,428 | | | | 2,552,063 | |
COLT Funding LLC, 1.0000%, 12/25/64 (144A)‡ | | | 2,862,000 | | | | 2,862,269 | |
COLT Mortgage Loan Trust, 1.8530%, 3/25/65 (144A)‡ | | | 59,364 | | | | 59,945 | |
COLT Mortgage Loan Trust, 1.5120%, 9/25/65 (144A)‡ | | | 2,284,296 | | | | 2,293,664 | |
Connecticut Avenue Securities Trust, ICE LIBOR USD 1 Month + 2.3000%, 2.4061%, 8/25/31 (144A)‡ | | | 7,851,214 | | | | 7,897,387 | |
Connecticut Avenue Securities Trust, ICE LIBOR USD 1 Month + 2.1500%, 2.2561%, 9/25/31 (144A)‡ | | | 9,030,773 | | | | 9,095,550 | |
Eagle RE, Ltd., ICE LIBOR USD 1 Month + 0.9000%, 1.0061%, 1/25/30 (144A)‡ | | | 1,200,000 | | | | 1,199,014 | |
Federal Home Loan Mortgage Corp., ICE LIBOR USD 1 Month + 0.7500%, 0.8561%, 3/25/30‡ | | | 401,281 | | | | 401,282 | |
Federal Home Loan Mortgage Corp., 3.0000%, 5/1/31 | | | 166,108 | | | | 176,329 | |
Federal Home Loan Mortgage Corp., 2.5000%, 12/1/31 | | | 20,427 | | | | 21,436 | |
Federal Home Loan Mortgage Corp., ICE LIBOR USD 1 Month + 0.3500%, 0.4646%, 2/15/32‡ | | | 35,265 | | | | 35,458 | |
Federal Home Loan Mortgage Corp., ICE LIBOR USD 1 Month + 0.6500%, 0.7646%, 3/15/32‡ | | | 51,243 | | | | 52,072 | |
Federal Home Loan Mortgage Corp., ICE LIBOR USD 1 Month + 0.5000%, 0.6146%, 7/15/32‡ | | | 41,395 | | | | 41,680 | |
Federal Home Loan Mortgage Corp., 3.0000%, 9/1/32 | | | 154,395 | | | | 164,261 | |
Federal Home Loan Mortgage Corp., 3.0000%, 1/1/33 | | | 83,304 | | | | 88,627 | |
Federal Home Loan Mortgage Corp., ICE LIBOR USD 1 Month + 0.4000%, 0.5146%, 1/15/33‡ | | | 35,419 | | | | 35,694 | |
Federal Home Loan Mortgage Corp., ICE LIBOR USD 1 Month + 2.2500%, 2.2600%, 8/25/33 (144A)‡ | | | 5,000,000 | | | | 5,034,334 | |
Federal Home Loan Mortgage Corp., 2.5000%, 12/1/33 | | | 745,462 | | | | 782,284 | |
Federal Home Loan Mortgage Corp., 2.5000%, 11/1/34 | | | 1,554,814 | | | | 1,638,953 | |
Federal Home Loan Mortgage Corp., ICE LIBOR USD 1 Month + 0.2500%, 0.3646%, 9/15/35‡ | | | 30,863 | | | | 30,958 | |
Federal Home Loan Mortgage Corp., ICE LIBOR USD 1 Month + 0.5900%, 0.7046%, 10/15/37‡ | | | 91,508 | | | | 93,165 | |
Federal Home Loan Mortgage Corp., ICE LIBOR USD 1 Month + 0.3000%, 0.4146%, 8/15/40‡ | | | 62,598 | | | | 62,775 | |
Federal Home Loan Mortgage Corp., ICE LIBOR USD 1 Month + 0.5000%, 0.6146%, 9/15/40‡ | | | 97,211 | | | | 98,290 | |
Federal Home Loan Mortgage Corp., ICE LIBOR USD 1 Month + 0.5500%, 0.6646%, 4/15/41‡ | | | 330,279 | | | | 335,485 | |
Federal Home Loan Mortgage Corp., 2.0000%, 5/1/41 | | | 71,138,404 | | | | 72,608,289 | |
Federal Home Loan Mortgage Corp., 3.5000%, 7/1/42 | | | 79,222 | | | | 86,518 | |
Federal Home Loan Mortgage Corp., 3.5000%, 8/1/42 | | | 88,611 | | | | 96,772 | |
Federal Home Loan Mortgage Corp., 3.5000%, 8/1/42 | | | 109,680 | | | | 119,781 | |
Federal Home Loan Mortgage Corp., 3.0000%, 2/1/43 | | | 1,578 | | | | 1,684 | |
Federal Home Loan Mortgage Corp., 3.0000%, 3/1/43 | | | 885 | | | | 945 | |
See Notes to Schedule of Investments and Other Information and Notes to Financial Statements.
Janus Henderson Mortgage-Backed Securities ETF
Schedule of Investments (unaudited)
April 30, 2021
| | | | | | | | |
| | | Shares/
Principal Amounts | | | Value | |
| Mortgage-Backed Securities – (continued) | |
Federal Home Loan Mortgage Corp., 3.0000%, 3/1/43 | | | $ 4,059,704 | | | | $ 4,322,825 | |
Federal Home Loan Mortgage Corp., 3.5000%, 3/1/43 | | | 348 | | | | 380 | |
Federal Home Loan Mortgage Corp., 3.0000%, 4/1/43 | | | 81,216 | | | | 86,480 | |
Federal Home Loan Mortgage Corp., 3.0000%, 6/1/43 | | | 194,860 | | | | 202,889 | |
Federal Home Loan Mortgage Corp., 3.5000%, 6/1/43 | | | 37,172 | | | | 40,493 | |
Federal Home Loan Mortgage Corp., 3.0000%, 11/1/43 | | | 1,586,093 | | | | 1,692,358 | |
Federal Home Loan Mortgage Corp., 3.5000%, 2/1/44 | | | 474,419 | | | | 518,969 | |
Federal Home Loan Mortgage Corp., 3.5000%, 12/1/44 | | | 900,224 | | | | 980,641 | |
Federal Home Loan Mortgage Corp., 3.0000%, 8/1/46 | | | 1,253,881 | | | | 1,321,777 | |
Federal Home Loan Mortgage Corp., 3.0000%, 10/1/46 | | | 3,556,795 | | | | 3,792,148 | |
Federal Home Loan Mortgage Corp., 3.0000%, 12/1/46 | | | 23,071 | | | | 24,505 | |
Federal Home Loan Mortgage Corp., 3.5000%, 1/1/47 | | | 578,196 | | | | 631,431 | |
Federal Home Loan Mortgage Corp., 3.0000%, 2/1/47 | | | 12,846,041 | | | | 13,541,639 | |
Federal Home Loan Mortgage Corp., 4.0000%, 3/1/47 | | | 258,232 | | | | 282,338 | |
Federal Home Loan Mortgage Corp., 3.0000%, 4/1/47 | | | 4,704,005 | | | | 4,949,166 | |
Federal Home Loan Mortgage Corp., 3.0000%, 4/1/47 | | | 1,814,981 | | | | 1,913,260 | |
Federal Home Loan Mortgage Corp., 4.0000%, 11/1/47 | | | 688,749 | | | | 759,326 | |
Federal Home Loan Mortgage Corp., 3.0000%, 12/1/47 | | | 33,291 | | | | 35,494 | |
Federal Home Loan Mortgage Corp., 4.5000%, 8/1/48 | | | 178,236 | | | | 193,975 | |
Federal Home Loan Mortgage Corp., 5.0000%, 9/1/48 | | | 407,158 | | | | 451,776 | |
Federal Home Loan Mortgage Corp., 4.5000%, 12/1/48 | | | 50,046 | | | | 55,096 | |
Federal Home Loan Mortgage Corp., 4.5000%, 12/1/48 | | | 653,010 | | | | 724,601 | |
Federal Home Loan Mortgage Corp., 2.7185%, 2/25/49‡,(a) | | | 10,000,000 | | | | 2,063,706 | |
Federal Home Loan Mortgage Corp., 4.0000%, 5/1/49 | | | 575,740 | | | | 619,625 | |
Federal Home Loan Mortgage Corp., 3.0000%, 8/1/49 | | | 146,070 | | | | 154,518 | |
Federal Home Loan Mortgage Corp., 3.0000%, 8/1/49 | | | 163,883 | | | | 174,043 | |
Federal Home Loan Mortgage Corp., 3.0000%, 8/1/49 | | | 3,708,548 | | | | 3,908,558 | |
Federal Home Loan Mortgage Corp., 3.5000%, 8/1/49 | | | 637,431 | | | | 677,871 | |
Federal Home Loan Mortgage Corp., 3.0000%, 10/1/49 | | | 6,228,083 | | | | 6,511,157 | |
Federal Home Loan Mortgage Corp., 3.0000%, 10/1/49 | | | 5,430,733 | | | | 5,677,567 | |
Federal Home Loan Mortgage Corp., 3.0000%, 11/1/49 | | | 6,444,146 | | | | 6,737,041 | |
Federal Home Loan Mortgage Corp., 3.0000%, 11/1/49 | | | 5,582,482 | | | | 5,836,213 | |
Federal Home Loan Mortgage Corp., 3.0000%, 11/1/49 | | | 9,668,039 | | | | 10,107,464 | |
Federal Home Loan Mortgage Corp., 3.0000%, 12/1/49 | | | 8,649,547 | | | | 9,042,680 | |
Federal Home Loan Mortgage Corp., 3.0000%, 3/1/50 | | | 540,726 | | | | 566,849 | |
Federal Home Loan Mortgage Corp., 3.5000%, 3/1/50 | | | 972,243 | | | | 1,044,075 | |
Federal Home Loan Mortgage Corp., ICE LIBOR USD 1 Month + 2.0000%, 2.0100%, 1/25/51 (144A)‡ | | | 2,601,125 | | | | 2,613,661 | |
Federal Home Loan Mortgage Corp., 3.5000%, 5/25/51 | | | 29,664,550 | | | | 4,004,714 | |
Federal National Mortgage Association, ICE LIBOR USD 1 Month + 4.9000%, 5.0061%, 11/25/24‡ | | | 1,068,798 | | | | 1,104,124 | |
Federal National Mortgage Association, ICE LIBOR USD 1 Month + 4.0000%, 4.1061%, 5/25/25‡ | | | 5,956,062 | | | | 6,049,729 | |
Federal National Mortgage Association, ICE LIBOR USD 1 Month + 5.0000%, 5.1061%, 7/25/25‡ | | | 2,014,143 | | | | 2,047,050 | |
Federal National Mortgage Association, ICE LIBOR USD 1 Month + 5.7000%, 5.8061%, 4/25/28‡ | | | 1,369,123 | | | | 1,451,088 | |
Federal National Mortgage Association, ICE LIBOR USD 1 Month + 6.0000%, 6.1061%, 9/25/28‡ | | | 320,316 | | | | 337,713 | |
Federal National Mortgage Association, ICE LIBOR USD 1 Month + 5.9000%, 6.0061%, 10/25/28‡ | | | 1,695,000 | | | | 1,779,458 | |
Federal National Mortgage Association, ICE LIBOR USD 1 Month + 2.8500%, 2.9561%, 11/25/29‡ | | | 3,135,666 | | | | 3,174,834 | |
Federal National Mortgage Association, ICE LIBOR USD 1 Month + 2.2000%, 2.3061%, 1/25/30‡ | | | 6,945,232 | | | | 7,026,213 | |
Federal National Mortgage Association, ICE LIBOR USD 1 Month + 2.2500%, 2.3561%, 7/25/30‡ | | | 4,810,501 | | | | 4,859,978 | |
Federal National Mortgage Association, 2.5000%, 8/1/31 | | | 23,919 | | | | 25,096 | |
Federal National Mortgage Association, 2.5000%, 10/1/31 | | | 26,129 | | | | 27,479 | |
Federal National Mortgage Association, 2.5000%, 2/1/32 | | | 24,070 | | | | 25,330 | |
See Notes to Schedule of Investments and Other Information and Notes to Financial Statements.
| | |
| | Janus Detroit Street Trust ½ 5 |
Janus Henderson Mortgage-Backed Securities ETF
Schedule of Investments (unaudited)
April 30, 2021
| | | | | | | | |
| | | Shares/
Principal Amounts | | | Value | |
| Mortgage-Backed Securities – (continued) | |
Federal National Mortgage Association, ICE LIBOR USD 1 Month + 0.4000%, 0.5061%, 4/25/32‡ | | | $ 44,714 | | | | $ 45,053 | |
Federal National Mortgage Association, ICE LIBOR USD 1 Month + 0.5500%, 0.6561%, 4/25/32‡ | | | 34,477 | | | | 34,827 | |
Federal National Mortgage Association, ICE LIBOR USD 1 Month + 0.5000%, 0.6061%, 9/25/33‡ | | | 46,544 | | | | 46,935 | |
Federal National Mortgage Association, 3.0000%, 11/1/34 | | | 111,503 | | | | 119,216 | |
Federal National Mortgage Association, 3.0000%, 12/1/34 | | | 122,262 | | | | 130,436 | |
Federal National Mortgage Association, ICE LIBOR USD 1 Month + 0.3000%, 0.4061%, 10/25/35‡ | | | 37,727 | | | | 37,975 | |
Federal National Mortgage Association, ICE LIBOR USD 1 Month + 0.3500%, 0.4561%, 4/25/36‡ | | | 127,056 | | | | 127,847 | |
Federal National Mortgage Association, 1.5000%, TBA, 15 Year Maturity(b) | | | 12,180,277 | | | | 12,310,362 | |
Federal National Mortgage Association, 2.0000%, TBA, 15 Year Maturity(b) | | | 48,934,328 | | | | 50,478,206 | |
Federal National Mortgage Association, 2.5000%, TBA, 15 Year Maturity(b) | | | 21,679,916 | | | | 22,651,393 | |
Federal National Mortgage Association, 3.0000%, TBA, 15 Year Maturity(b) | | | 15,195,555 | | | | 16,016,115 | |
Federal National Mortgage Association, 3.5000%, TBA, 15 Year Maturity(b) | | | 6,061,089 | | | | 6,483,729 | |
Federal National Mortgage Association, 4.0000%, TBA, 15 Year Maturity(b) | | | 1,501,500 | | | | 1,600,929 | |
Federal National Mortgage Association, ICE LIBOR USD 1 Month + 0.5200%, 0.6261%, 9/25/37‡ | | | 38,060 | | | | 38,499 | |
Federal National Mortgage Association, 3.0000%, 4/1/38 | | | 321,693 | | | | 343,036 | |
Federal National Mortgage Association, ICE LIBOR USD 1 Month + 0.3500%, 0.4561%, 5/25/38‡ | | | 35,727 | | | | 35,772 | |
Federal National Mortgage Association, ICE LIBOR USD 1 Month + 2.1000%, 2.2061%, 6/25/39 (144A)‡ | | | 1,905,098 | | | | 1,911,273 | |
Federal National Mortgage Association, ICE LIBOR USD 1 Month + 0.4000%, 0.5061%, 9/25/40‡ | | | 25,399 | | | | 25,598 | |
Federal National Mortgage Association, ICE LIBOR USD 1 Month + 55.0000%, 53.7336%, 10/25/40‡ | | | 41,248 | | | | 159,233 | |
Federal National Mortgage Association, ICE LIBOR USD 1 Month + 0.4300%, 0.5361%, 11/25/40‡ | | | 24,224 | | | | 24,433 | |
Federal National Mortgage Association, 3.0000%, 9/1/42 | | | 401,407 | | | | 427,910 | |
Federal National Mortgage Association, ICE LIBOR USD 1 Month + 0.4000%, 0.5061%, 9/25/42‡ | | | 18,221 | | | | 18,380 | |
Federal National Mortgage Association, 3.0000%, 10/1/42 | | | 308,684 | | | | 328,940 | |
Federal National Mortgage Association, ICE LIBOR USD 1 Month + 0.3500%, 0.4561%, 10/25/42‡ | | | 212,613 | | | | 214,140 | |
Federal National Mortgage Association, ICE LIBOR USD 1 Month + 4.0000%, 3.8939%, 11/25/42‡ | | | 840,696 | | | | 748,109 | |
Federal National Mortgage Association, 3.0000%, 1/1/43 | | | 512,733 | | | | 546,586 | |
Federal National Mortgage Association, 3.0000%, 1/1/43 | | | 288,317 | | | | 307,131 | |
Federal National Mortgage Association, 3.0000%, 2/1/43 | | | 16,874 | | | | 18,000 | |
Federal National Mortgage Association, 3.0000%, 2/1/43 | | | 804,049 | | | | 857,136 | |
Federal National Mortgage Association, ICE LIBOR USD 1 Month + 0.5000%, 0.6061%, 2/25/43‡ | | | 66,632 | | | | 67,337 | |
Federal National Mortgage Association, 3.0000%, 3/1/43 | | | 596,994 | | | | 636,851 | |
Federal National Mortgage Association, 3.0000%, 3/1/43 | | | 186,734 | | | | 199,201 | |
Federal National Mortgage Association, 3.0000%, 5/1/43 | | | 160,019 | | | | 170,702 | |
Federal National Mortgage Association, 3.0000%, 5/1/43 | | | 1,621,778 | | | | 1,732,653 | |
Federal National Mortgage Association, 3.0000%, 5/1/43 | | | 1,683,094 | | | | 1,774,201 | |
Federal National Mortgage Association, 3.0000%, 5/1/43 | | | 2,427,738 | | | | 2,583,905 | |
Federal National Mortgage Association, 4.0000%, 6/1/43 | | | 83,122 | | | | 92,006 | |
Federal National Mortgage Association, 3.0000%, 8/1/43 | | | 214,075 | | | | 230,098 | |
Federal National Mortgage Association, 3.0000%, 10/1/44 | | | 1,443,376 | | | | 1,537,560 | |
Federal National Mortgage Association, 4.5000%, 6/1/45 | | | 9,549 | | | | 10,718 | |
Federal National Mortgage Association, 3.0000%, 7/1/45 | | | 833,479 | | | | 889,124 | |
Federal National Mortgage Association, 3.5000%, 12/1/45 | | | 922,267 | | | | 990,146 | |
Federal National Mortgage Association, 3.0000%, 1/1/46 | | | 21,414 | | | | 22,632 | |
Federal National Mortgage Association, 3.5000%, 1/1/46 | | | 88,728 | | | | 95,258 | |
Federal National Mortgage Association, 3.0000%, 3/1/46 | | | 3,252,491 | | | | 3,428,551 | |
Federal National Mortgage Association, 3.0000%, 6/1/46 | | | 663,934 | | | | 699,280 | |
See Notes to Schedule of Investments and Other Information and Notes to Financial Statements.
Janus Henderson Mortgage-Backed Securities ETF
Schedule of Investments (unaudited)
April 30, 2021
| | | | | | | | |
| | | Shares/
Principal Amounts | | | Value | |
| Mortgage-Backed Securities – (continued) | |
Federal National Mortgage Association, 3.0000%, 9/1/46 | | | $ 380,026 | | | | $ 405,117 | |
Federal National Mortgage Association, 3.0000%, 9/1/46 | | | 65,089 | | | | 69,276 | |
Federal National Mortgage Association, 3.0000%, 10/1/46 | | | 2,130,903 | | | | 2,255,629 | |
Federal National Mortgage Association, 3.0000%, 11/1/46 | | | 82,551 | | | | 88,532 | |
Federal National Mortgage Association, 3.0000%, 1/1/47 | | | 118,572 | | | | 126,416 | |
Federal National Mortgage Association, 3.0000%, 1/1/47 | | | 34,918 | | | | 37,448 | |
Federal National Mortgage Association, 3.0000%, 1/1/47 | | | 509,058 | | | | 541,803 | |
Federal National Mortgage Association, 3.0000%, 1/1/47 | | | 701,617 | | | | 739,596 | |
Federal National Mortgage Association, 3.5000%, 3/1/47 | | | 793,097 | | | | 851,469 | |
Federal National Mortgage Association, 4.0000%, 5/1/47 | | | 499,853 | | | | 551,261 | |
Federal National Mortgage Association, 3.5000%, 7/1/47 | | | 676,967 | | | | 726,792 | |
Federal National Mortgage Association, 3.5000%, 8/1/47 | | | 213,274 | | | | 233,416 | |
Federal National Mortgage Association, 3.5000%, 12/1/47 | | | 224,507 | | | | 245,710 | |
Federal National Mortgage Association, 3.0000%, 2/1/48 | | | 740,219 | | | | 787,913 | |
Federal National Mortgage Association, 3.0000%, 4/1/48 | | | 40,191,925 | | | | 42,777,310 | |
Federal National Mortgage Association, 3.0000%, 5/1/48 | | | 332,785 | | | | 352,030 | |
Federal National Mortgage Association, 5.0000%, 5/1/48 | | | 3,033,222 | | | | 3,352,774 | |
Federal National Mortgage Association, 3.5000%, 7/1/48 | | | 19,199,015 | | | | 20,590,147 | |
Federal National Mortgage Association, 3.0000%, 11/1/48 | | | 9,174,724 | | | | 9,671,359 | |
Federal National Mortgage Association, 4.0000%, 2/1/49 | | | 2,373,219 | | | | 2,548,799 | |
Federal National Mortgage Association, 3.0000%, 8/1/49 | | | 188,497 | | | | 200,170 | |
Federal National Mortgage Association, 3.0000%, 8/1/49 | | | 195,673 | | | | 207,791 | |
Federal National Mortgage Association, 3.0000%, 9/1/49 | | | 313,712 | | | | 331,334 | |
Federal National Mortgage Association, 3.0000%, 5/1/50 | | | 5,248,510 | | | | 5,540,638 | |
Federal National Mortgage Association, 2.5000%, 10/1/50 | | | 953,020 | | | | 990,256 | |
Federal National Mortgage Association, 2.5000%, 1/1/51 | | | 12,675,700 | | | | 13,144,953 | |
Federal National Mortgage Association, 2.0000%, TBA, 30 Year Maturity(b) | | | 8,434,575 | | | | 8,502,558 | |
Federal National Mortgage Association, 2.5000%, TBA, 30 Year Maturity(b) | | | 17,011,183 | | | | 17,662,031 | |
Federal National Mortgage Association, 2.5000%, TBA, 30 Year Maturity(b) | | | 45,015,592 | | | | 46,484,001 | |
Federal National Mortgage Association, 3.5000%, TBA, 30 Year Maturity(b) | | | 45,498,976 | | | | 48,360,862 | |
Federal National Mortgage Association, 4.0000%, TBA, 30 Year Maturity(b) | | | 60,410,762 | | | | 64,904,114 | |
Federal National Mortgage Association, 4.5000%, TBA, 30 Year Maturity(b) | | | 4,203,000 | | | | 4,578,622 | |
Federal National Mortgage Association, 3.5000%, 8/1/56 | | | 60,166 | | | | 65,897 | |
Federal National Mortgage Association, 3.0000%, 2/1/57 | | | 2,316,419 | | | | 2,468,392 | |
Federal National Mortgage Association, 3.0000%, 6/1/57 | | | 137,586 | | | | 146,565 | |
Federal National Mortgage Association, 3.0000%, 9/1/57 | | | 240,684 | | | | 256,391 | |
Federal National Mortgage Association, 3.0000%, 5/1/58 | | | 863,676 | | | | 920,036 | |
Federal National Mortgage Association, 3.5000%, 1/25/61(a) | | | 34,707,405 | | | | 6,438,810 | |
Government National Mortgage Association, ICE LIBOR USD 1 Month + 0.4000%, 0.5156%, 8/16/29‡ | | | 35,258 | | | | 35,503 | |
Government National Mortgage Association, ICE LIBOR USD 1 Month + 0.4000%, 0.5159%, 7/20/34‡ | | | 63,083 | | | | 63,667 | |
Government National Mortgage Association, ICE LIBOR USD 1 Month + 0.3000%, 0.4156%, 8/16/34‡ | | | 46,301 | | | | 46,568 | |
Government National Mortgage Association, ICE LIBOR USD 1 Month + 0.2000%, 0.3159%, 6/20/35‡ | | | 37,892 | | | | 37,962 | |
Government National Mortgage Association, ICE LIBOR USD 1 Month + 0.1500%, 0.2659%, 8/20/35‡ | | | 44,146 | | | | 44,131 | |
Government National Mortgage Association, ICE LIBOR USD 1 Month + 0.3000%, 0.4159%, 4/20/37‡ | | | 15,111 | | | | 15,198 | |
Government National Mortgage Association, ICE LIBOR USD 1 Month + 0.3100%, 0.4259%, 6/20/37‡ | | | 42,821 | | | | 43,111 | |
Government National Mortgage Association, ICE LIBOR USD 1 Month + 0.3200%, 0.4359%, 7/20/37‡ | | | 64,996 | | | | 65,503 | |
Government National Mortgage Association, ICE LIBOR USD 1 Month + 0.5000%, 0.6159%, 10/20/37‡ | | | 20,679 | | | | 21,022 | |
Government National Mortgage Association, ICE LIBOR USD 1 Month + 0.5000%, 0.6159%, 10/20/37‡ | | | 49,968 | | | | 50,798 | |
Government National Mortgage Association, ICE LIBOR USD 1 Month + 0.5000%, 0.6159%, 2/20/38‡ | | | 41,664 | | | | 42,269 | |
See Notes to Schedule of Investments and Other Information and Notes to Financial Statements.
| | |
| | Janus Detroit Street Trust ½ 7 |
Janus Henderson Mortgage-Backed Securities ETF
Schedule of Investments (unaudited)
April 30, 2021
| | | | | | | | |
| | | Shares/
Principal Amounts | | | Value | |
| Mortgage-Backed Securities – (continued) | |
Government National Mortgage Association, ICE LIBOR USD 1 Month + 0.5000%, 0.6159%, 2/20/38‡ | | | $ 84,550 | | | | $ 85,826 | |
Government National Mortgage Association, ICE LIBOR USD 1 Month + 0.7000%, 0.8159%, 5/20/39‡ | | | 623 | | | | 623 | |
Government National Mortgage Association, ICE LIBOR USD 1 Month + 0.6000%, 0.7156%, 1/16/40‡ | | | 14,387 | | | | 14,700 | |
Government National Mortgage Association, ICE LIBOR USD 1 Month + 0.3500%, 0.4659%, 6/20/40‡ | | | 1,354 | | | | 1,362 | |
Government National Mortgage Association, ICE LIBOR USD 1 Month + 0.4300%, 0.5456%, 10/16/40‡ | | | 69,475 | | | | 70,108 | |
Government National Mortgage Association, 0%, 5/16/41¤ | | | 6,786,711 | | | | 6,203,125 | |
Government National Mortgage Association, ICE LIBOR USD 1 Month + 0.3000%, 0.4159%, 7/20/41‡ | | | 34,150 | | | | 34,275 | |
Government National Mortgage Association, 4.5000%, 2/20/48 | | | 3,075,778 | | | | 3,346,937 | |
Government National Mortgage Association, 4.0000%, 5/20/48 | | | 687,303 | | | | 738,420 | |
Government National Mortgage Association, 4.0000%, 6/20/48 | | | 2,281,808 | | | | 2,451,515 | |
Government National Mortgage Association, 4.5000%, 7/20/48 | | | 322,404 | | | | 351,116 | |
Government National Mortgage Association, 4.5000%, 11/20/48 | | | 387,840 | | | | 412,568 | |
Government National Mortgage Association, 5.0000%, 1/20/49 | | | 186,413 | | | | 203,667 | |
Government National Mortgage Association, 4.0000%, 2/20/49 | | | 492,359 | | | | 516,679 | |
Government National Mortgage Association, 5.5000%, 2/20/49 | | | 233,218 | | | | 254,561 | |
Government National Mortgage Association, 4.0000%, 4/20/49 | | | 470,996 | | | | 498,531 | |
Government National Mortgage Association, 2.0000%, TBA, 30 Year Maturity(b) | | | 40,620,401 | | | | 41,362,942 | |
Government National Mortgage Association, 2.5000%, TBA, 30 Year Maturity(b) | | | 76,441,270 | | | | 79,290,236 | |
Government National Mortgage Association, 3.0000%, TBA, 30 Year Maturity(b) | | | 46,467,968 | | | | 48,608,747 | |
Government National Mortgage Association, 3.5000%, TBA, 30 Year Maturity(b) | | | 42,854,100 | | | | 45,423,632 | |
Government National Mortgage Association, 4.0000%, TBA, 30 Year Maturity(b) | | | 16,139,200 | | | | 17,227,305 | |
JP Morgan Mortgage Trust, 3.0000%, 6/25/45 (144A)‡ | | | 1,019,847 | | | | 1,042,009 | |
Mello Warehouse Securitization Trust, ICE LIBOR USD 1 Month + 1.1500%, 1.2561%, 11/25/52 (144A)‡ | | | 3,378,378 | | | | 3,421,012 | |
Mello Warehouse Securitization Trust, ICE LIBOR USD 1 Month + 2.7500%, 2.8586%, 2/25/55 (144A)‡ | | | 3,489,000 | | | | 3,521,278 | |
New Residential Mortgage Loan Trust, ICE LIBOR USD 1 Month + 0.9000%, 1.0061%, 1/25/48 (144A)‡ | | | 213,265 | | | | 215,058 | |
Provident Funding Mortgage Warehouse Securitization Trust, ICE LIBOR USD 1 Month + 2.0000%, 2.1103%, 2/25/55 (144A)‡ | | | 7,500,000 | | | | 7,497,737 | |
PRPM LLC, 2.8570%, 9/25/25 (144A)Ç | | | 2,093,716 | | | | 2,112,309 | |
Sequoia Mortgage Trust, 2.5000%, 5/25/43 (144A)‡ | | | 1,405,901 | | | | 1,440,715 | |
Sequoia Mortgage Trust, 0.2551%, 11/25/48 (144A)‡,(a) | | | 1,850,829 | | | | 1,927 | |
Sequoia Mortgage Trust, 4.0000%, 9/25/49 (144A)‡ | | | 564,443 | | | | 579,647 | |
Spruce Hill Mortgage Loan Trust, 3.4070%, 6/25/55 (144A)‡ | | | 5,697,762 | | | | 5,748,669 | |
Station Place Securitization Trust, ICE LIBOR USD 1 Month + 2.0000%, 2.1086%, 1/26/54 (144A)‡ | | | 6,250,000 | | | | 6,251,342 | |
Total Mortgage-Backed Securities (cost $950,534,537) | | | | | | | 954,924,649 | |
| Investment Companies – 38.4% | |
| Money Markets Funds – 38.4% | |
STIT – Government and Agency Portfolio, 0.0259% | | | 275,534,653 | | | | 275,534,653 | |
Total Money Markets Funds (cost $275,534,653) | | | | | | | 275,534,653 | |
Total Investments (total cost $1,268,493,932) – 177.6% | | | | | | | 1,272,970,945 | |
Liabilities, net of Cash, Receivables and Other Assets – (77.6%) | | | | | | | (556,054,990) | |
Net Assets – 100% | | | | | | | $716,915,955 | |
See Notes to Schedule of Investments and Other Information and Notes to Financial Statements.
Janus Henderson Mortgage-Backed Securities ETF
Schedule of Investments (unaudited)
April 30, 2021
Summary of Investments by Country – (Long Positions) (unaudited)
| | | | | | | | |
| Country | | Value | | | % of
Investment
Securities | |
United States | | | $1,271,771,931 | | | | 99.9% | |
Bermuda | | | 1,199,014 | | | | 0.1 | |
Total | | | $1,272,970,945 | | | | 100.0% | |
Schedule of TBA sales commitments – (% of Net Assets)
| | | | | | | | |
| | | Principal Amounts | | | Value | |
| Securities Sold Short – (28.5)% | |
| Mortgage-Backed Securities – (28.5)% | |
Federal National Mortgage Association, 2.5000%, TBA, 15 Year Maturity(b) | | | $(42,000,000) | | | | $(43,882,020) | |
Federal National Mortgage Association, 2.0000%, TBA, 30 Year Maturity(b) | | | (70,000,000) | | | | (70,695,800) | |
Federal National Mortgage Association, 2.5000%, TBA, 30 Year Maturity(b) | | | (17,011,183) | | | | (17,662,031) | |
Federal National Mortgage Association, 3.0000%, TBA, 30 Year Maturity(b) | | | (68,952,000) | | | | (72,214,119) | |
Total Securities Sold Short (proceeds $204,064,155) | | | | $(204,453,970) | |
Summary of Investments by Country – (Short Positions) (unaudited)
| | | | | | | | |
| Country | | Value | | | % of
Investment
Securities | |
United States | | | $(204,453,970) | | | | 100.0% | |
Schedule of Futures Contracts
| | | | | | | | | | | | | | | | | | | | |
| Description | | Number of
Contracts | | | Expiration
Date | | | Value and Notional
Amount | | | Unrealized
Appreciation
(Depreciation) | | | Variation Margin
Asset/(Liability) | |
Futures Bought: | | | | | | | | | | | | | | | | | | | | |
10-Year U.S. Treasury Note | | | 156 | | | | 06/21/21 | | | | $20,596,875 | | | | $(9,921) | | | | $(105,291) | |
Futures Sold: | | | | | | | | | | | | | | | | | | | | |
90-Day Euro Future | | | 7 | | | | 12/18/23 | | | | (1,731,450) | | | | 11,976 | | | | 127,097 | |
90-Day Euro Future | | | 7 | | | | 03/18/24 | | | | (1,728,650) | | | | 14,076 | | | | 149,383 | |
90-Day Euro Future | | | 7 | | | | 06/17/24 | | | | (1,725,763) | | | | 16,176 | | | | 171,669 | |
90-Day Euro Future | | | 7 | | | | 09/16/24 | | | | (1,722,962) | | | | 18,102 | | | | 192,098 | |
| | | | | | | | | | | | | | | | 60,330 | | | | 640,247 | |
Total | | | | $50,409 | | | | $534,956 | |
See Notes to Schedule of Investments and Other Information and Notes to Financial Statements.
| | |
| | Janus Detroit Street Trust ½ 9 |
Janus Henderson Mortgage-Backed Securities ETF
Schedule of Investments (unaudited)
April 30, 2021
The following table, grouped by derivative type, provides information about the fair value and location of derivatives within the Statement of Assets and Liabilities as of April 30, 2021
Fair Value of Derivative Instruments (not accounted for as hedging instruments) as of April 30, 2021
| | | | |
| | | Interest Rate
Contracts | |
Asset Derivatives: | | | | |
Variation Margin Receivable on Futures contracts | | | $640,247 | |
Liability Derivatives: | | | | |
Variation Margin Payable on Futures contracts | | | $105,291 | |
The following tables provide information about the effect of derivatives and hedging activities on the Fund’s Statement of Operations for the period ended April 30, 2021.
The effect of Derivative Instruments (not accounted for as hedging instruments) on the Statement of Operations for the period ended April 30, 2021
| | | | |
| Amount of Realized Gain/(Loss) Recognized on Derivatives | |
| Derivative | | Interest Rate
Contracts | |
Futures contracts | | | $1,069,181 | |
| | | | |
| Amount of Change in Unrealized Appreciation/(Depreciation) Recognized on Derivatives | |
| Derivative | | Interest Rate
Contracts | |
Futures contracts | | | $(139,584) | |
Please see the “Net realized and change in unrealized gain/(loss) on investments” sections of the Fund’s Statement of Operations.
Average ending Monthly Market Value of Derivative Instruments During the Period Ended April 30, 2021
| | | | |
| Derivative | | Market Value | |
Futures contracts, purchased | | | $57,586,342 | |
Futures contracts, sold | | | 99,913,046 | |
See Notes to Schedule of Investments and Other Information and Notes to Financial Statements.
Janus Henderson Mortgage-Backed Securities ETF
Notes to Schedule of Investments and Other Information (unaudited)
April 30, 2021
| | |
Bloomberg Barclays
U.S. MBS Index | | Bloomberg Barclays U.S. MBS Index tracks the performance of U.S. fixed-rate agency mortgage backed pass-through securities. |
| |
| ICE | | Intercontinental Exchange |
| |
| LIBOR | | LIBOR (London Interbank Offered Rate) is a short-term interest rate that banks offer one another and generally represents current cash rates. |
| |
| LLC | | Limited Liability Company |
| |
| TBA | | (To Be Announced) Securities are purchased/sold on a forward commitment basis with an approximate principal amount and no defined maturity date. The actual principal and maturity date will be determined upon settlement when specific mortgage pools are assigned. |
| Ç | Step Bond. The coupon rate will increase or decrease periodically based upon a predetermined schedule. The rate shown reflects the current rate. |
| ‡ | The interest rate on floating rate notes is based on an index or market interest rates and is subject to change. Rate in the security description is as of April 30, 2021. |
| 144A | Securities sold under Rule 144A of the Securities Act of 1933, as amended, are subject to legal and/or contractual restrictions on resale and may not be publicly sold without registration under the 1993 Act. Unless otherwise noted, these securities have been determined to be liquid in accordance with the requirements of Rule 22e-4, under the 1940 Act. The total value of 144A securities as of the period ended April 30, 2021 is $107,664,125 which represents 15.0% of net assets. |
| (b) | Settlement is on a delayed delivery or when-issued basis with final maturity TBA in the future. |
The following is a summary of the inputs that were used to value the Fund’s investments in securities and other financial instruments as of April 30, 2021. See Notes to Financial Statements for more information.
Valuation Inputs Summary
| | | | | | | | | | | | |
| | | Level 1 -
Quoted Prices | | | Level 2 -
Other Significant
Observable Inputs | | | Level 3 -
Significant
Unobservable Inputs | |
|
Assets | |
|
Investments in Securities: | |
| | | |
Asset-Backed Securities | | $ | — | | | $ | 40,015,318 | | | $ | — | |
| | | |
Corporate Bonds | | | — | | | | 2,496,325 | | | | — | |
| | | |
Mortgage-Backed Securities | | | — | | | | 954,924,649 | | | | — | |
| | | |
Investment Companies | | | 275,534,653 | | | | — | | | | — | |
| | | | |
| | | |
Total Investments in Securities | | $ | 275,534,653 | | | $ | 997,436,292 | | | $ | — | |
|
Other Financial Instruments(a): | |
| | | |
Variation Margin Receivable on Futures contracts | | $ | 640,247 | | | $ | — | | | $ | — | |
| | | | |
| | | |
Total Assets | | $ | 276,174,900 | | | $ | 997,436,292 | | | $ | — | |
| | | | |
|
Liabilities | |
| | | |
TBA sales commitments: | | | | | | | | | | | | |
| | | |
Mortgage-Backed Securities | | $ | — | | | $ | 204,453,970 | | | $ | — | |
|
Other Financial Instruments(a): | |
| | | |
Variation Margin Payable on Futures contracts | | $ | 105,291 | | | $ | — | | | $ | — | |
| | | | |
| | | |
Total Liabilities | | $ | 105,291 | | | $ | 204,453,970 | | | $ | — | |
| (a) | Other financial instruments include futures. Futures are reported at their variation margin at measurement date, which represents the amount due to/from the Fund at that date. |
| | |
| | Janus Detroit Street Trust ½ 11 |
Janus Henderson Mortgage-Backed Securities ETF
Statement of Assets and Liabilities (unaudited)
April 30, 2021
| | | | |
Assets: | |
Investments, at value(1) | | $ | 1,272,970,945 | |
Cash | | | 4,083,418 | |
Due from broker for futures | | | 232,727 | |
Receivable for variation margin on futures contracts | | | 640,247 | |
Receivables: | | | | |
Investments sold | | | 861,484,611 | |
Fund units sold | | | 2,665,149 | |
Interest | | | 1,107,793 | |
Total Assets | | | 2,143,184,890 | |
Liabilities: | |
TBA sales commitments, at value(2) | | | 204,453,970 | |
Payable for variation margin on futures contracts | | | 105,291 | |
Payables: | | | | |
Investments purchased | | | 1,221,533,932 | |
Management fees | | | 175,742 | |
Total Liabilities | | | 1,426,268,935 | |
Net Assets | | $ | 716,915,955 | |
Net Assets Consists of: | |
Capital (par value and paid-in surplus) | | $ | 709,527,019 | |
Total distributable earnings (loss) | | | 7,388,936 | |
Total Net Assets | | $ | 716,915,955 | |
Net Assets | | $ | 716,915,955 | |
Shares outstanding, $0.001 Par Value (unlimited shares authorized) | | | 13,450,001 | |
Net Asset Value Per Share | | $ | 53.30 | |
| (1) | Includes cost of $1,268,493,932. |
| (2) | Proceeds $204,064,155. |
See Notes to Financial Statements.
Janus Henderson Mortgage-Backed Securities ETF
Statement of Operations (unaudited)
For the period ended April 30, 2021
| | | | |
Investment Income: | |
Dividends | | $ | 35,868 | |
Interest | | | 5,352,972 | |
Total Investment Income | | | 5,388,840 | |
Expenses: | |
Management Fees | | | 939,349 | |
Total Expenses | | | 939,349 | |
Net Investment Income/(Loss) | | | 4,449,491 | |
Net Realized Gain/(Loss) on Investments: | |
Investments | | $ | 1,532,593 | |
TBA sales commitments | | | 95,878 | |
Futures contracts | | | 1,069,181 | |
Total Net Realized Gain/(Loss) on Investments | | $ | 2,697,652 | |
Change in Unrealized Net Appreciation/Depreciation: | |
Investments | | $ | (829,172) | |
TBA sales commitments | | | (362,245) | |
Futures contracts | | | (139,584) | |
Total Change in Unrealized Net Appreciation/Depreciation | | $ | (1,331,001) | |
Net Increase/(Decrease) in Net Assets Resulting from Operations | | $ | 5,816,142 | |
See Notes to Financial Statements.
| | |
| | Janus Detroit Street Trust ½ 13 |
Janus Henderson Mortgage-Backed Securities ETF
Statements of Changes in Net Assets
| | | | | | | | |
| | | Period Ended
April 30, 2021
(unaudited) | | | Year Ended
October 31, 2020 | |
Operations: | |
Net investment income/(loss) | | $ | 4,449,491 | | | $ | 8,537,473 | |
Net realized gain/(loss) on investments | | | 2,697,652 | | | | 5,201,002 | |
Change in unrealized net appreciation/depreciation | | | (1,331,001) | | | | 3,690,595 | |
Net Increase/(Decrease) in Net Assets Resulting from Operations | | | 5,816,142 | | | | 17,429,070 | |
Dividends and Distributions to Shareholders: | |
Dividends and Distributions | | | (9,255,106) | | | | (10,243,739) | |
Net Decrease from Dividends and Distributions to Shareholders | | | (9,255,106) | | | | (10,243,739) | |
Capital Share Transactions | | | 141,709,980 | | | | 403,078,165 | |
Net Increase/(Decrease) in Net Assets | | | 138,271,016 | | | | 410,263,496 | |
Net Assets: | |
Beginning of period | | | 578,644,939 | | | | 168,381,443 | |
End of period | | $ | 716,915,955 | | | $ | 578,644,939 | |
See Notes to Financial Statements.
Janus Henderson Mortgage-Backed Securities ETF
Financial Highlights
| | | | | | | | | | | | | | | | | | |
For a share outstanding during the period ended April 30, 2021 (unaudited)
and each year or period ended October 31 | | 2021 | | | 2020 | | | 2019 | | | 2018(1) | |
| | Net Asset Value, Beginning of Period | | | $53.58 | | | | $52.62 | | | | $49.53 | | | | $50.00 | |
| | Income/(Loss) from Investment Operations: | |
| | Net investment income/(loss)(2) | | | 0.36 | | | | 1.22 | | | | 1.56 | | | | 0.17 | |
| | Net realized and unrealized gain/(loss) | | | 0.04 | | | | 1.51 | | | | 3.03 | | | | (0.64) | |
| | Total from Investment Operations | | | 0.40 | | | | 2.73 | | | | 4.59 | | | | (0.47) | |
| | Less Dividends and Distributions: | |
| | Dividends (from net investment income) | | | (0.68) | | | | (1.77) | | | | (1.50) | | | | — | |
| | Total Dividends and Distributions | | | (0.68) | | | | (1.77) | | | | (1.50) | | | | — | |
| | Net Asset Value, End of Period | | | $53.30 | | | | $53.58 | | | | $52.62 | | | | $49.53 | |
| | Total Return* | | | 0.96% | | | | 5.30%(3) | | | | 9.40%(3) | | | | (0.94)% | |
| | Net assets, End of Period (in thousands) | | | $716,916 | | | | $578,645 | | | | $168,381 | | | | $32,193 | |
| | Average Net Assets for the Period (in thousands) | | | $652,467 | | | | $369,845 | | | | $78,797 | | | | $30,452 | |
| | Ratios to Average Net Assets**: | |
| | Ratio of Gross Expenses | | | 0.29% | | | | 0.32% | | | | 0.35% | | | | 0.35% | |
| | Ratio of Net Investment Income/(Loss) | | | 1.38% | | | | 2.31% | | | | 3.05% | | | | 2.67% | |
| | Portfolio Turnover Rate(4)(5) | | | 72% | | | | 300% | | | | 348% | | | | 91% | |
| * | Total return not annualized for periods of less than one full year. |
| ** | Annualized for periods of less than one full year. |
| (1) | Period from September 12, 2018 (commencement of operations) through October 31, 2018. |
| (2) | Per share amounts are calculated based on average shares outstanding during the year or period. |
| (3) | The return includes adjustments in accordance with generally accepted accounting principles required at period end date. |
| (4) | Portfolio turnover rate excludes securities received or delivered from in-kind processing of creation or redemptions. |
| (5) | Portfolio Turnover Rate excludes TBA (to be announced) purchase and sales commitments. |
See Notes to Financial Statements.
| | |
| | Janus Detroit Street Trust ½ 15 |
Janus Henderson Mortgage-Backed Securities ETF
Notes to Financial Statements (unaudited)
1. Organization and Significant Accounting Policies
Janus Henderson Mortgage-Backed Securities ETF (the “Fund”) is a series fund. The Fund is part of Janus Detroit Street Trust (the “Trust”), which is organized as a Delaware statutory trust and is registered under the Investment Company Act of 1940, as amended (the “1940 Act”), as an open-end management investment company, and therefore has applied the specialized accounting and reporting guidance in Financial Accounting Standards Board (“FASB”) Accounting Standards Codification (“ASC”) Topic 946. As of the date of this report, the Trust offers six Funds each of which represent shares of beneficial interest in a separate portfolio of securities and other assets with its own objective and policies. The Fund seeks a high level of total return consisting of income and capital appreciation. The Fund is classified as diversified, as defined in the 1940 Act.
The Fund is an actively-managed exchange-traded fund. Unlike shares of traditional mutual funds, shares of the Fund are not individually redeemable and may only be purchased or redeemed directly from the Fund at net asset value (“NAV”) in large increments called “Creation Units” by certain participants, known as “Authorized Participants.” The size of a Creation Unit to purchase shares of the Fund may differ from the size of a Creation Unit to redeem shares of the Fund. The Fund will issue or redeem Creation Units in exchange for portfolio securities and/or cash. Except when aggregated in Creation Units, Fund shares are not redeemable securities of the Fund. Shares of the Fund are listed and trade on NYSE Arca, Inc. (“NYSE Arca”), and individual investors can purchase or sell shares in much smaller increments for cash in the secondary market through a broker. These transactions, which do not involve the Fund, are made at market prices that may vary throughout the day and differ from the Fund’s NAV. As a result, you may pay more than NAV (a premium) when you purchase shares and receive less than NAV (a discount) when you sell shares, in the secondary market.
An Authorized Participant (or other broker-dealers making markets in shares of the Fund) may hold of record more than 25% of the outstanding shares of the Fund. From time to time, Authorized Participants (or other broker-dealers making markets in shares of the Fund) may be a beneficial and/or legal owner of the Fund, may be affiliated with an index provider, may be deemed to have control of the Fund and/or may be able to affect the outcome of matters presented for a vote of the shareholders of the Fund. Authorized Participants (or other broker-dealers making markets in shares of the Fund) may execute an irrevocable proxy granting the Distributor, Janus Capital Management LLC (“Janus Capital” or “Janus”) or an affiliate of Janus Capital power to vote or abstain from voting such Authorized Participant’s beneficially or legally owned shares of the Fund. In such cases, the agent shall mirror vote (or abstain from voting) such shares in the same proportion as all other beneficial owners of the Fund.
The following accounting policies have been followed by the Fund and are in conformity with United States of America generally accepted accounting principles (“US GAAP”).
Investment Valuation
Securities held by the Fund are valued in accordance with policies and procedures established by and under the supervision of the Trustees (the “Valuation Procedures”). Equity securities, including shares of exchange-traded funds, traded on a domestic securities exchange are generally valued at the closing prices on the primary market or exchange on which they trade. If such price is lacking for the trading period immediately preceding the time of determination, such securities are valued at their current bid price. Equity securities that are traded on a foreign exchange are generally valued at the closing prices on such markets. In the event that there is no current trading volume on a particular security in such foreign exchange, the bid price from the primary exchange is generally used to value the security. Securities that are traded on the over-the-counter (“OTC”) markets are generally valued at their closing or latest bid prices as available. Foreign securities and currencies are converted to U.S. dollars using the applicable exchange rate in effect at the close of the London Stock Exchange. The Fund will determine the market value of individual securities held by it by using prices provided by one or more approved professional pricing services or, as needed, by obtaining market quotations from independent broker-dealers. Most debt securities are valued in accordance with the evaluated bid price supplied by the pricing service that is intended to reflect market value. The evaluated bid price supplied by the pricing service is an evaluation that may consider factors such as security prices, yields, maturities and ratings. Certain short-term securities maturing within 60 days or less may be evaluated and valued on an amortized cost basis provided that the amortized cost determined approximates market value. Securities for which market quotations or evaluated prices are not readily available or are deemed unreliable, are valued at fair value determined in good faith under the Valuation Procedures. Circumstances in which fair value pricing may be utilized include, but are not limited to: (i) a significant event that may affect the securities of a single issuer, such as a merger, bankruptcy, or significant issuer-specific development; (ii) an event that may affect an entire market, such as a natural disaster or significant governmental action; (iii) a nonsignificant event such as a market closing early or not opening, or a security trading halt; and (iv) pricing of a nonvalued security and a restricted or nonpublic security. Special valuation considerations may apply with respect to “odd-lot” fixed-income
Janus Henderson Mortgage-Backed Securities ETF
Notes to Financial Statements (unaudited)
transactions which, due to their small size, may receive evaluated prices by pricing services which reflect a large block trade and not what actually could be obtained for the odd-lot position.
Valuation Inputs Summary
FASB ASC 820, Fair Value Measurements and Disclosures (“ASC 820”), defines fair value, establishes a framework for measuring fair value, and expands disclosure requirements regarding fair value measurements. This standard emphasizes that fair value is a market-based measurement that should be determined based on the assumptions that market participants would use in pricing an asset or liability and establishes a hierarchy that prioritizes inputs to valuation techniques used to measure fair value. These inputs are summarized into three broad levels:
Level 1 – Unadjusted quoted prices in active markets the Fund has the ability to access for identical assets or liabilities.
Level 2 – Observable inputs other than unadjusted quoted prices included in Level 1 that are observable for the asset or liability either directly or indirectly. These inputs may include quoted prices for the identical instrument on an inactive market, prices for similar instruments, interest rates, prepayment speeds, credit risk, yield curves, default rates and similar data.
Assets or liabilities categorized as Level 2 in the hierarchy generally include: debt securities fair valued in accordance with the evaluated bid or ask prices supplied by a pricing service; securities traded on OTC markets and listed securities for which no sales are reported that are fair valued at the latest bid price (or yield equivalent thereof) obtained from one or more dealers transacting in a market for such securities or by a pricing service approved by the Fund’s Trustees; and certain short-term debt securities with maturities of 60 days or less that are fair valued at amortized cost. Other securities that may be categorized as Level 2 in the hierarchy include, but are not limited to, preferred stocks, bank loans, swaps, investments in unregistered investment companies, options, and forward contracts.
Level 3 – Unobservable inputs for the asset or liability to the extent that relevant observable inputs are not available, representing the Fund’s own assumptions about the assumptions that a market participant would use in valuing the asset or liability, and that would be based on the best information available.
There have been no significant changes in valuation techniques used in valuing any such positions held by the Fund since the beginning of the fiscal year.
The inputs or methodology used for fair valuing securities are not necessarily an indication of the risk associated with investing in those securities. The summary of inputs used as of April 30, 2021 to fair value the Fund’s investments in securities and other financial instruments is included in the “Valuation Inputs Summary” in the Notes to Schedule of Investments and Other Information.
Investment Transactions and Investment Income
Investment transactions are accounted for as of the date purchased or sold (trade date). Dividend income is recorded on the ex-dividend date. Certain dividends from foreign securities will be recorded as soon as the Fund is informed of the dividend, if such information is obtained subsequent to the ex-dividend date. Dividends from foreign securities may be subject to withholding taxes in foreign jurisdictions. Interest income is recorded daily on an accrual basis and includes amortization of premiums and accretion of discounts. The Fund classifies gains and losses on prepayments received as an adjustment to interest income. Debt securities may be placed in non-accrual status and related interest income may be reduced by stopping current accruals and writing off interest receivables when collection of all or a portion of interest has become doubtful. Gains and losses are determined on the identified cost basis, which is the same basis used for federal income tax purposes.
Estimates
The preparation of financial statements in conformity with US GAAP requires management to make estimates and
assumptions that affect the reported amount of assets and liabilities and disclosure of contingent assets and liabilities at the date of the financial statements and the reported amounts of income and expenses during the reporting period.
Actual results could differ from those estimates.
| | |
| | Janus Detroit Street Trust ½ 17 |
Janus Henderson Mortgage-Backed Securities ETF
Notes to Financial Statements (unaudited)
Indemnifications
In the normal course of business, the Fund may enter into contracts that contain provisions for indemnification of other parties against certain potential liabilities. The Fund’s maximum exposure under these arrangements is unknown and would involve future claims that may be made against the Fund that have not yet occurred. Currently, the risk of material loss from such claims is considered remote.
Dividends and Distributions
Dividends from net investment income are generally declared and distributed monthly. Net realized capital gains (if any) are distributed annually. The Fund may treat a portion of the amount paid to redeem shares as a distribution of investment company taxable income and realized capital gains that are reflected in the NAV. This practice, commonly referred to as “equalization,” has no effect on the redeeming shareholder or a Fund’s total return but may reduce the amounts that would otherwise be required to be paid as taxable dividends to the remaining shareholders. It is possible that the Internal Revenue Service (IRS) could challenge the Fund’s equalization methodology or calculations, and any such challenge could result in additional tax, interest, or penalties to be paid by the Fund.
Federal Income Taxes
The Fund intends to continue to qualify as a regulated investment company and distribute all of its taxable income in accordance with the requirements of Subchapter M of the Internal Revenue Code. Management has analyzed the Fund’s tax positions taken for all open federal income tax years, generally a three-year period, and has concluded that no provision for federal income tax is required in the Fund’s financial statements. The Fund is not aware of any tax positions for which it is reasonably possible that the total amounts of unrecognized tax benefits will significantly change in the next twelve months.
2. Derivative Instruments
The Fund may invest in various types of derivatives. A derivative is a financial instrument whose performance is derived from the performance of another asset. The Fund may invest in derivative instruments including, but not limited to futures contracts, options, and swaps. Each derivative instrument that was held by the Fund during the period ended April 30, 2021 is discussed in further detail below. A summary of derivative activity by the Fund is reflected in the tables at the end of the Schedule of Investments.
The Fund may use derivatives only to manage or hedge portfolio risk, including interest rate risk, or to manage duration. The Fund’s exposure to derivatives will vary. The Fund may also enter into short positions for hedging purposes. The Fund’s use of derivative instruments involves risks different from, or possibly greater than, the risks associated with investing directly in securities and other traditional investments. Derivatives are subject to a number of risks including liquidity risk, market risk, credit risk, default risk, counterparty risk and management risk. They also involve the risk of mispricing or improper valuation and the risk that changes in the value of the derivative may not correlate exactly with the change in the value of the underlying asset, rate or index. Also, suitable derivative transactions may not be available in all circumstances and there can be no assurance that the Fund will engage in these transactions to reduce exposure to other risks when that would be beneficial. While use of derivatives to hedge can reduce or eliminate losses, it can also reduce or eliminate gains or cause losses if the market moves in a manner different from that anticipated by Janus Capital or if the cost of the derivative outweighs the benefit of the hedge. The Fund’s ability to use derivatives may also be limited by certain regulatory and tax considerations.
In pursuit of its investment objective, the Fund may seek to use derivatives to increase or decrease exposure to the following market risk factors:
| | • | | Counterparty Risk – the risk that the counterparty (the party on the other side of the transaction) on a derivative transaction will be unable to honor its financial obligation to the Fund. |
| | • | | Credit Risk – the risk an issuer will be unable to make principal and interest payments when due or will default on its obligations. |
| | • | | Currency Risk – the risk that changes in the exchange rate between currencies will adversely affect the value (in U.S. dollar terms) of an investment. |
| | • | | Index Risk – if the derivative is linked to the performance of an index, it will be subject to the risks associated with changes in that index. If the index changes, the Fund could receive lower interest payments or experience a reduction in the value of the derivative to below what the Fund paid. Certain indexed securities, including inverse securities (which move in an opposite direction to the index), may create leverage, to the extent that they increase or decrease in value at a rate that is a multiple of the changes in the applicable index. |
Janus Henderson Mortgage-Backed Securities ETF
Notes to Financial Statements (unaudited)
| | • | | Interest Rate Risk – the risk that the value of fixed-income securities will generally decline as prevailing interest rates rise, which may cause the Fund’s NAV to likewise decrease. |
| | • | | Liquidity Risk – the risk that certain securities may be difficult or impossible to sell at the time that the seller would like or at the price that the seller believes the security is currently worth. |
| | • | | Leverage Risk – the risk associated with certain types of leveraged investments or trading strategies pursuant to which relatively small market movements may result in large changes in the value of an investment. The Fund creates leverage by investing in instruments, including derivatives, where the investment loss can exceed the original amount invested. Certain investments or trading strategies, such as short sales, that involve leverage can result in losses that greatly exceed the amount originally invested. |
Derivatives may generally be traded OTC or on an exchange. Derivatives traded OTC are agreements that are individually negotiated between parties and can be tailored to meet a purchaser’s needs. OTC derivatives are not guaranteed by a clearing agency and may be subject to increased credit risk.
In an effort to mitigate credit risk associated with derivatives traded OTC, the Fund may enter into collateral agreements with certain counterparties whereby, subject to certain minimum exposure requirements, the Fund may require the counterparty to post collateral if the Fund has a net aggregate unrealized gain on all OTC derivative contracts with a particular counterparty. Additionally, the Fund may deposit cash and/or treasuries as collateral with the counterparty and/ or custodian daily (based on the daily valuation of the financial asset) if the Fund has a net aggregate unrealized loss on OTC derivative contracts with a particular counterparty. All liquid securities and restricted cash are considered to cover in an amount at all times equal to or greater than the Fund’s commitment with respect to certain exchange-traded derivatives, centrally cleared derivatives, short sales, and/or securities with extended settlement dates. There is no guarantee that counterparty exposure is reduced and these arrangements are dependent on Janus Capital’s ability to establish and maintain appropriate systems and trading.
Futures Contracts
A futures contract is an exchange-traded agreement to take or make delivery of an underlying asset at a specific time in the future for a specific predetermined negotiated price. The Fund may enter into futures contracts to hedge or protect itself from fluctuations or other adverse movement in the value of individual securities, the securities markets generally, or interest rate fluctuations, without actually buying or selling the underlying debt security. The Fund is subject to interest rate risk and equity risk in the normal course of pursuing its investment objective through its investments in futures contracts. The use of futures contracts may involve risks such as the possibility of illiquid markets or imperfect correlation between the values of the contracts and the underlying securities, or that the counterparty will fail to perform its obligations.
Futures contracts on commodities are valued at the settlement price on valuation date on the commodities exchange as reported by an approved vendor. Mini contracts, as defined in the description of the contract, shall be valued using the Actual Settlement Price or “ASET” price type as reported by an approved vendor. Futures contracts are marked-to-market daily, and the daily variation margin is recorded as a receivable or payable on the Statement of Assets and Liabilities (if applicable). The change in unrealized net appreciation/depreciation is reported on the Statement of Operations (if applicable). When a contract is closed, a realized gain or loss is reported on the Statement of Operations (if applicable), equal to the difference between the opening and closing value of the contract.
Securities held by the Fund that are designated as collateral for market value on futures contracts are noted on the Schedule of Investments (if applicable). Such collateral is in the possession of the Fund’s futures option merchant.
With futures, there is minimal counterparty credit risk to the Fund since futures are exchange-traded and the exchange’s clearinghouse, as counterparty to all exchange-traded futures, guarantees the futures against default.
During the period, the Fund purchased interest rate futures to increase exposure to interest rate risk.
During the period, the Fund sold interest rate futures to decrease exposure to interest rate risk.
3. Other Investments and Strategies
Additional Investment Risk
In response to the COVID-19 pandemic, the U.S. government and the Federal Reserve, as well as certain foreign governments and central banks, have taken extraordinary actions to support local and global economies and the financial markets, including reducing interest rates to record low levels. Extremely low or negative interest rates may become more prevalent or may not work as intended. As there is little precedent for this situation, the impact on various markets that
| | |
| | Janus Detroit Street Trust ½ 19 |
Janus Henderson Mortgage-Backed Securities ETF
Notes to Financial Statements (unaudited)
interest rate or other significant policy changes may have is unknown. The withdrawal of this support, a failure of measures put in place in response to such economic uncertainty, or investor perception that such efforts were not sufficient could each negatively affect financial markets generally, and the value and liquidity of specific securities. In addition, policy and legislative changes in the United States and in other countries continue to impact many aspects of financial regulation.
Widespread disease, including pandemics and epidemics, and natural or environmental disasters, including those which may be attributable to global climate change, such as earthquakes, fires, floods, hurricanes, tsunamis and weather-related phenomena generally, have been and can be highly disruptive to economies and markets, adversely impacting individual companies, sectors, industries, markets, currencies, interest and inflation rates, credit ratings, investor sentiment, and other factors affecting the value of a Fund’s investments. Economies and financial markets throughout the world have become increasingly interconnected, which increases the likelihood that events or conditions in one region or country will adversely affect markets or issuers in other regions or countries, including the United States. These disruptions could prevent a Fund from executing advantageous investment decisions in a timely manner and negatively impact a Fund’s ability to achieve its investment objective(s). Any such event(s) could have a significant adverse impact on the value of a Fund. In addition, these disruptions could also impair the information technology and other operational systems upon which the Fund’s service providers, including Janus Capital, rely, and could otherwise disrupt the ability of employees of the Fund’s service providers to perform essential tasks on behalf of the Fund. Adverse weather conditions may also have a particularly significant negative effect on issuers in the agricultural sector and on insurance and reinsurance companies that insure or reinsure against the impact of natural disasters.
A number of countries in the European Union (the “EU”) have experienced, and may continue to experience, severe economic and financial difficulties. In particular, many EU nations are susceptible to economic risks associated with high levels of debt. Many non-governmental issuers, and even certain governments, have defaulted on, or been forced to restructure, their debts. Many other issuers have faced difficulties obtaining credit or refinancing existing obligations. Financial institutions have in many cases required government or central bank support, have needed to raise capital, and/or have been impaired in their ability to extend credit. As a result, financial markets in the EU have experienced extreme volatility and declines in asset values and liquidity. These difficulties may continue, worsen, or spread further within the EU. Responses to these financial problems by European governments, central banks, and others, including austerity measures and reforms, may not work, may result in social unrest, and may limit future growth and economic recovery or have other unintended consequences. The risk of investing in securities in the European markets may also be heightened due to the referendum in which the United Kingdom voted to exit the EU commonly known as “Brexit,” which immediately led to significant market volatility around the world, as well as political, economic and legal uncertainty. The United Kingdom formally left the EU on January 31, 2020 and entered into an eleven-month transition period, which expired on December 31, 2020. The negative impact on not only the United Kingdom and European economies could be significant, potentially resulting in increased volatility and illiquidity and lower economic growth for companies that rely significantly on the United Kingdom and/or Europe for their business activities and revenues. Any further exits from the EU, or an increase in the belief that such exits are likely or possible, would likely cause additional market disruption globally and introduce new legal and regulatory uncertainties.
Management Risk
The Fund is an actively managed investment portfolio and is therefore subject to the risk that the investment strategies employed for the Fund may fail to produce the intended results. Although the Fund seeks to provide long-term positive returns, market conditions or implementation of the Fund’s investment process may result in losses, and the Fund may not meet its investment objective. As such, there can be no assurance of positive “absolute” returns.
LIBOR Replacement Risk
The Fund may invest in certain debt securities, derivatives or other financial instruments that utilize the London Interbank Offered Rate (“LIBOR”) as a reference rate for various rate calculations. On July 27, 2017, the U.K. Financial Conduct Authority announced that it intends to stop compelling or inducing banks to submit LIBOR rates after 2021. However, it remains unclear if LIBOR will continue to exist in its current, or a modified, form. Actions by regulators have resulted in the establishment of alternative reference rates to LIBOR in most major currencies. The U.S. Federal Reserve, based on the recommendations of the New York Federal Reserve’s Alternative Reference Rate Committee (comprised of major derivative market participants and their regulators), has begun publishing a Secured Overnight Financing Rate (SOFR), that is intended to replace U.S. dollar LIBOR. Proposals for alternative reference rates for other currencies have also been announced or have already begun publication. However, global consensus on alternative rates is lacking. The elimination of LIBOR or changes to other reference rates or any other changes or reforms to the determination or supervision of reference rates could adversely impact (i) volatility and liquidity in markets that are tied to LIBOR, (ii) the market for, or
Janus Henderson Mortgage-Backed Securities ETF
Notes to Financial Statements (unaudited)
value of, specific securities or payments linked to those reference rates, (iii) availability or terms of borrowing or refinancing, or (iv) the effectiveness of hedging strategies. For these and other reasons, the elimination of LIBOR or changes to other interest rates may adversely affect the Fund’s performance and/or net asset value. Since the usefulness of LIBOR as a benchmark could deteriorate during the transition period, these effects could occur prior to the end of 2021. Markets are slowly developing in response to these new rates. Uncertainty regarding the process for amending existing contracts or instruments to transition away from LIBOR remains a concern for the Fund. The effect of any changes to, or discontinuation of, LIBOR on the Fund will vary depending, among other things, on (1) existing fallback or termination provisions in individual contracts and (2) whether, how, and when industry participants develop and adopt new reference rates and fallbacks for both legacy and new products and instruments. Accordingly, it is difficult to predict the full impact of the transition away from LIBOR on the Fund until new reference rates and fallbacks for both legacy and new products, instruments and contracts are commercially accepted.
Mortgage- and Asset-Backed Securities
Mortgage- and asset-backed securities represent interests in “pools” of commercial or residential mortgages or other assets, including consumer and commercial loans or receivables. The Fund may purchase fixed or variable rate commercial or residential mortgage-backed securities issued by the Government National Mortgage Association (“Ginnie Mae”), the Federal National Mortgage Association (“Fannie Mae”), the Federal Home Loan Mortgage Corporation (“Freddie Mac”), or other governmental or government-related entities. Ginnie Mae’s guarantees are backed as to the timely payment of principal and interest by the full faith and credit of the U.S. Government. Fannie Mae and Freddie Mac securities are not backed by the full faith and credit of the U.S. Government. In September 2008, the Federal Housing Finance Agency (“FHFA”), an agency of the U.S. Government, placed Fannie Mae and Freddie Mac under conservatorship. Since that time, Fannie Mae and Freddie Mac have received capital support through U.S. Treasury preferred stock purchases and Treasury and Federal Reserve purchases of their mortgage-backed securities. The FHFA and the U.S. Treasury have imposed strict limits on the size of these entities’ mortgage portfolios. The FHFA has the power to cancel any contract entered into by Fannie Mae and Freddie Mac prior to FHFA’s appointment as conservator or receiver, including the guarantee obligations of Fannie Mae and Freddie Mac.
The Fund may also purchase other mortgage- and asset-backed securities through single- and multi-seller conduits, collateralized debt obligations, structured investment vehicles, and other similar securities. Asset-backed securities may be backed by various consumer obligations, including automobile loans, equipment leases, credit card receivables, or other collateral. In the event the underlying loans are not paid, the securities’ issuer could be forced to sell the assets and recognize losses on such assets, which could impact your return. Unlike traditional debt instruments, payments on these securities include both interest and a partial payment of principal. Mortgage- and asset-backed securities are subject to both extension risk, where borrowers pay off their debt obligations more slowly in times of rising interest rates, and prepayment risk, where borrowers pay off their debt obligations sooner than expected in times of declining interest rates. These risks may reduce the Fund’s returns. In addition, investments in mortgage- and asset-backed securities, including those comprised of subprime mortgages, may be subject to a higher degree of credit risk, valuation risk, extension risk (if interest rates rise), and liquidity risk than various other types of fixed-income securities. Additionally, although mortgage-backed securities are generally supported by some form of government or private guarantee and/or insurance, there is no assurance that guarantors or insurers will meet their obligations.
TBA Commitments
The Fund enters into “to be announced” or “TBA” commitments to purchase mortgage-backed securities. TBAs are
forward agreements for the purchase or sale of securities, including mortgage-backed securities, for a fixed price, with payment and delivery on an agreed upon future settlement date. The specific securities to be delivered are not identified at the trade date. However, delivered securities must meet specified terms, including issuer, rate, and mortgage terms. Although the particular TBA securities must meet industry-accepted “good delivery” standards, there can be no assurance that a security purchased on forward commitment basis will ultimately be issued or delivered by the counterparty. During the settlement period, the Fund will still bear the risk of any decline in the value of the security to be delivered. Because TBA commitments do not require the purchase and sale of identical securities, the characteristics of the security delivered to the Fund may be less favorable than the security delivered to the dealer. If the counterparty to a transaction fails to deliver the security, the Fund could suffer a loss. To facilitate TBA commitments, the Fund is required to segregate or otherwise earmark liquid assets marked to market daily in an amount at least equal to such TBA commitments. Rules of the Financial Industry Regulatory Authority (“FINRA”) which are expected to be effective in October 2021, include mandatory margin requirements for TBA commitments which, in some circumstances, will require the Fund to also post collateral. These collateral requirements may increase costs associated with the Fund’s participation in the TBA market.
| | |
| | Janus Detroit Street Trust ½ 21 |
Janus Henderson Mortgage-Backed Securities ETF
Notes to Financial Statements (unaudited)
When-Issued, Delayed Delivery and Forward Commitment Transactions
The Fund may purchase or sell securities on a when-issued, delayed delivery, or forward commitment basis. When purchasing a security on a when-issued, delayed delivery, or forward commitment basis, the Fund assumes the rights and risks of ownership of the security, including the risk of price and yield fluctuations, and takes such fluctuations into account when determining its net asset value. Typically, no income accrues on securities the Fund has committed to purchase prior to the time delivery of the securities is made. Because the Fund is not required to pay for the security until the delivery date, these risks are in addition to the risks associated with the Fund’s other investments. If the other party to a transaction fails to deliver the securities, the Fund could miss a favorable price or yield opportunity. If the Fund remains substantially fully invested at a time when when-issued, delayed delivery, or forward commitment purchases (including TBA commitments) are outstanding, the purchases may result in a form of leverage.
When the Fund has sold a security on a when-issued, delayed delivery, or forward commitment basis, the Fund does not participate in future gains or losses with respect to the security. If the other party to a transaction fails to pay for the securities, the Fund could suffer a loss. Additionally, when selling a security on a when-issued, delayed delivery, or forward commitment basis without owning the security, the Fund will incur a loss if the security’s price appreciates in value such that the security’s price is above the agreed upon price on the settlement date. The Fund may dispose of or renegotiate a transaction after it is entered into, and may purchase or sell when-issued, delayed delivery or forward commitment securities before the settlement date, which may result in a gain or loss.
4. Investment Advisory Agreements and Other Transactions with Affiliates
Under its unitary fee structure, the Fund pays Janus Capital a management fee in return for providing certain investment advisory, supervisory, and administrative services to the Fund, including the costs of transfer agency, custody, fund administration, legal, audit, and other services. Janus Capital’s fee structure is designed to pay substantially all of the Fund’s expenses. However, the Fund bears other expenses which are not covered under the management fee which may vary and affect the total level of expenses paid by shareholders, such as distribution fees (if any), brokerage expenses or commissions, interest, dividends, taxes, litigation expenses, acquired fund fees and expenses (if any), and extraordinary expenses. The Fund’s unitary management fee provides for reductions in the fee rate as the Fund’s assets grow. As of the date of this report, the Fund’s management fee was calculated daily and paid monthly according to the following schedule:
| | | | |
| Daily Net Assets | | Fee Rate | |
| $0-$500 million | | | 0.30% | |
| Next $500 million | | | 0.25% | |
| Over $1 billion | | | 0.20% | |
Additionally, Janus Capital has contractually agreed to waive and/or reimburse the management fee payable by the
Fund in an amount equal to the amount, if any, that the Fund’s total annual fund operating expenses (excluding distribution fees (if any), brokerage expenses or commissions, interest, dividends, taxes, litigation expenses, acquired fund fees and expenses (if any), and other extraordinary expenses not incurred in the ordinary course of the
Fund’s business) exceed the annual rate of 0.29% of the Fund’s average daily net assets. Janus Capital has agreed to
continue the waiver for at least the period from February 28, 2021 through February 28, 2022. If applicable, amounts waived and/or reimbursed to the Fund by Janus Capital are disclosed as “Excess Expense Reimbursement and Waivers” on the Statement of Operations.
For the period ended April 30, 2021, the Fund’s contractual management fee rate (expressed as an annual rate) was 0.29% of the Fund’s average daily net assets.
As of the date of this report, State Street Bank and Trust Company (“State Street”) provides certain fund administration services to the Fund, including services related to the Fund’s accounting, including calculating the daily NAV, audit coordination, tax, and reporting obligations, pursuant to an agreement with Janus Capital, on behalf of the Fund. As compensation for such services, Janus Capital pays State Street a fee based on a percentage of the Fund’s assets, with a minimum flat fee, for certain services. Janus Capital serves as administrator to the Fund, providing oversight and coordination of the Fund’s service providers, recordkeeping and other administrative services. Janus Capital does not receive any additional compensation, beyond the unitary fee, for serving as administrator. State Street also serves as transfer agent for the shares of the Fund. Pursuant to agreements with Janus Capital on behalf of the Fund, State Street Global Markets, an affiliate of State Street, may execute portfolio transactions for the Fund, including but not limited to, transactions in connection with cash in lieu transactions.
Janus Henderson Mortgage-Backed Securities ETF
Notes to Financial Statements (unaudited)
The Trust has adopted a Distribution and Servicing Plan for shares of the Fund pursuant to Rule 12b-1 under the 1940 Act (the “Plan”). The Plan permits compensation in connection with the distribution and marketing of Fund shares and/or the provision of certain shareholder services. The Plan permits the Fund to pay ALPS Distributors, Inc. (the “Distributor”) or its designee, a fee for the sale and distribution and/or shareholder servicing of the shares at an annual rate of up to 0.25% of average daily net assets of the Fund. However, the Trustees have determined not to authorize payment under this Plan at this time. Under the terms of the Plan, the Trust would be authorized to make payments to the Distributor or its designee for remittance to retirement plan service providers, broker-dealers, bank trust departments, financial advisors, and other financial intermediaries, as compensation for distribution and/or shareholder services performed by such entities for their customers who are investors in the Fund. The 12b-1 fee may only be imposed or increased when the Trustees determine that it is in the best interests of shareholders to do so. Because these fees are paid out of the Fund’s assets on an ongoing basis, to the extent that a fee is authorized, over time they will increase the cost of an investment in the Fund. The Plan fee may cost an investor more than other types of sales charges.
As of April 30, 2021, Janus Capital owned 1 share or less than 0.0% of the Fund.
The Fund is permitted to purchase or sell securities (“cross-trade”) between itself and other funds or accounts managed by Janus Capital in accordance with Rule 17a-7 under the Investment Company Act of 1940 (“Rule 17a-7”), when the transaction is consistent with the investment objectives and policies of the Fund and in accordance with the Internal Cross Trade Procedures adopted by the Trust’s Board of Trustees. These procedures have been designed to ensure that any cross-trade of securities by the Fund from or to another fund or account that is or could be considered an affiliate of the Fund under certain limited circumstances by virtue of having a common investment adviser, common Officer, or common Trustee complies with Rule 17a-7. Under these procedures, each cross-trade is effected at the current market price to save costs where allowed. During the period ended April 30, 2021, the Fund engaged in cross trades amounting to $49,644,843 in purchases.
5. Federal Income Tax
Income and capital gains distributions are determined in accordance with income tax regulations that may differ from US GAAP. These differences are due to differing treatments for items such as net short-term gains, deferral of wash sale losses, foreign currency transactions, passive foreign investment companies, net investment losses, in-kind transactions and capital loss carryovers.
The Fund has elected to treat gains and losses on forward foreign currency contracts as capital gains and losses, if
applicable. Other foreign currency gains and losses on debt instruments are treated as ordinary income for federal
income tax purposes pursuant to Section 988 of the Internal Revenue Code.
The aggregate cost of investments and the composition of unrealized appreciation and depreciation of investment
securities for federal income tax purposes as of April 30, 2021 are noted below. The primary difference between book and tax appreciation or depreciation of investments is wash sale loss deferrals.
| | | | | | | | | | | | | | |
| Federal Tax Cost | | | Unrealized Appreciation | | | Unrealized (Depreciation) | | | Net Tax Appreciation/
(Depreciation) | |
| $ | 1,268,506,699 | | | $ | 5,197,427 | | | $ | (733,181) | | | $ | 4,464,246 | |
6. Capital Share Transactions
| | | | | | | | | | | | | | | | |
| | | Period ended April 30, 2021 | | | Year ended October 31, 2020 | |
| | | Shares | | | Amount | | | Shares | | | Amount | |
| Shares sold | | | 2,950,000 | | | $ | 157,769,249 | | | | 8,050,000 | | | $ | 426,661,907 | |
| Shares repurchased | | | (300,000) | | | | (16,059,269) | | | | (450,000) | | | | (23,583,742) | |
Net Increase/(Decrease) | | | 2,650,000 | | | $ | 141,709,980 | | | | 7,600,000 | | | $ | 403,078,165 | |
7. Purchases and Sales of Investment Securities
For the period ended April 30, 2021, the aggregate cost of purchases and proceeds from sales of investment securities (excluding any short-term securities, short-term options contracts, TBAs, and in-kind transactions) was as follows:
| | | | | | | | | | | | | | |
Purchases of Securities | | | Proceeds from Sales of Securities | | | Purchases of Long- Term U.S. Government Obligations | | | Proceeds from Sales of Long-Term U.S. Government Obligations | |
| $ | 87,274,938 | | | $ | 84,756,989 | | | $ | 296,220,548 | | | $ | 193,957,257 | |
| | |
| | Janus Detroit Street Trust ½ 23 |
Janus Henderson Mortgage-Backed Securities ETF
Notes to Financial Statements (unaudited)
8. Recent Accounting Pronouncements
The FASB issued Accounting Standards Update 2020-04 Reference Rate Reform: Facilitation of the Effects of Reference Rate Reform on Financial Reporting (“ASU 2020-04”) in March 2020. The new guidance in the ASU provide optional temporary financial reporting relief from the effect of certain types of contract modifications due to the planned discontinuation of the LIBOR or other interbank-offered based reference rates as of the end of 2021. For new and existing contracts, Funds may elect to apply the guidance as of March 12, 2020 through December 31, 2022. Management is currently evaluating the impact, if any, of the ASU’s adoption to the Fund’s financial statements.
9. Subsequent Events
Management has evaluated whether any events or transactions occurred subsequent to April 30, 2021 and through
the date of the issuance of the Fund’s financial statements and determined that there were no material events or
transactions that would require recognition or disclosure in the Fund’s financial statements.
Janus Henderson Mortgage-Backed Securities ETF
Additional Information (unaudited)
Proxy Voting Policies and Voting Record
A description of the policies and procedures that the Fund uses to determine how to vote proxies relating to its portfolio securities is available without charge: (i) upon request, by calling 1-800-668-0434 (toll free); (ii) on the Fund’s website at janushenderson.com/proxyvoting; and (iii) on the SEC’s website at http://www.sec.gov.
Quarterly Portfolio Holdings
The Fund files its complete portfolio holdings (schedule of investments) with the SEC for the first and third quarters each fiscal year as an exhibit to Form N-PORT within 60 days of the end of such fiscal quarter. The Fund’s Form N-PORT filings: are available on the SEC’s website at http://www.sec.gov; (ii) may be reviewed and copied at the SEC’s Public Reference Room in Washington, D.C. (information on the Public Reference Room may be obtained by calling 1-800-SEC-0330); and (iii) are available without charge, upon request, by calling Janus Henderson at 1-800-668-0434 (toll free).
| | |
| | Janus Detroit Street Trust ½ 25 |
Janus Henderson Mortgage-Backed Securities ETF
Board Considerations Regarding Approval of Investment Advisory Agreements (unaudited)
The Board of Trustees (the “Board”) of Janus Detroit Street Trust (the “Trust”), including a majority of the Trustees who are not “interested persons” as that term is defined in the Investment Company Act of 1940, as amended (the “Independent Trustees”), met on April 21-22, 2021 to consider the proposed renewal of the investment management agreement between Janus Capital Management LLC (the “Adviser”) and the Trust (the “Investment Management Agreement”), on behalf of Janus Henderson Short Duration Income ETF (“VNLA”), Janus Henderson Small Cap Growth Alpha ETF (“JSML”), Janus Henderson Small/Mid Cap Growth Alpha ETF (“JSMD”), Janus Henderson Mortgage-Backed Securities ETF (“JMBS”) and The Long Term Care ETF (“OLD” and, together with VNLA, JSML, JSMD and JMBS, the “Funds”). In the course of their consideration of the renewal of the Investment Management Agreement, the Independent Trustees met in executive session and were advised by their independent counsel. In this regard, the Independent Trustees evaluated the terms of the Investment Management Agreement and reviewed the duties and responsibilities of trustees in evaluating and approving such agreements. In considering renewal of the Investment Management Agreement, the Board and the Independent Trustees, as applicable, reviewed the materials provided to them relating to the consideration of the renewal of the Investment Management Agreement for the Funds and other information provided by counsel and the Adviser, including: (i) information regarding the nature, quality and extent of the services provided to the Funds by the Adviser, and the fees charged to each Fund therefor; (ii) information concerning the Adviser’s financial condition, business, operations, portfolio management personnel, compliance programs, and profitability with respect to the Trust and each Fund; (iii) comparative information describing each Fund’s advisory fee structures, operating expenses, and performance information as compared to peer fund groups selected and reported to the Board by an independent third party; (iv) a copy of the Adviser’s current Form ADV; and (v) a memorandum from counsel to the Independent Trustees on the responsibilities of trustees in considering investment advisory arrangements under the 1940 Act. The Board also considered presentations made by, and discussions held with, representatives of the Adviser over the previous year and since the inception of the Funds. The Trustees previously met via telephone on March 15, 2021 to discuss certain information provided by the Adviser related to the Trustees’ consideration of the renewal of the Investment Management Agreement.
During its review of this information, the Board focused on and analyzed the factors that it deemed relevant, including, among other factors: (i) the nature, extent and quality of the services provided to the Funds by the Adviser; (ii) the Adviser’s personnel and operations; (iii) each Fund’s expense level; (iv) the profitability to the Adviser under the Investment Management Agreement with respect to each Fund; (v) any “fall-out” benefits to the Adviser and its affiliates (i.e., the ancillary benefits realized by the Adviser and its affiliates from the Adviser’s relationship with the Trust); (vi) the effect of asset growth on each Fund’s expenses; and (vii) potential conflicts of interest.
The Trustees also considered benefits that accrue to the Adviser and its affiliates from their relationships with the Trust and each Fund. The Trustees also considered that, other than the services provided by the Adviser and its affiliates pursuant to agreements with the Funds and the fees paid by the Funds therefor, the Funds and the Adviser may potentially benefit from their relationship with each other in other ways. The Trustees considered that the success of the Funds could attract other business to the Adviser or other Janus Henderson funds, and that the success of the Adviser could enhance the Adviser’s ability to serve the Funds.
The Board, including the Independent Trustees, considered the following in respect of the Funds:
(a) The nature, extent and quality of services provided by the Adviser; personnel and operations of the Adviser.
The Board reviewed the services that the Adviser provides to the Funds. In connection with the investment advisory services provided by the Adviser, the Board noted the responsibilities that the Adviser has as the Funds’ investment adviser, including: the overall supervisory responsibility for the general management and investment of each Fund’s securities portfolio; providing oversight of the investment performance and processes and compliance with each Fund’s investment objectives, policies and limitations; the implementation of the investment management program of each Fund; the management of the day-to-day investment and reinvestment of the assets of each Fund; determining daily baskets of securities and cash components in connection with creation and redemption transactions in each Fund’s shares; executing portfolio security trades for purchases and redemptions of each Fund’s shares conducted on a cash-in-lieu basis; the review of brokerage matters; the oversight of general portfolio compliance with relevant law; and the implementation of Board directives as they relate to the Funds.
The Board reviewed the Adviser’s experience, resources and strengths in managing the Funds and other pooled investment vehicles, including an assessment of the Adviser’s personnel. Based on its consideration and review of the foregoing information, the Board determined that each Fund was likely to continue to benefit from the nature, quality and
Janus Henderson Mortgage-Backed Securities ETF
Board Considerations Regarding Approval of Investment Advisory Agreements (unaudited)
extent of these services, as well as the Adviser’s ability to render such services based on the Adviser’s experience, personnel, operations and resources.
(b) Comparison of services rendered and fees paid under other investment advisory contracts, and the cost of the services to be provided and profits to be realized by the Adviser from the relationship with the Funds; “fall-out” benefits.
The Board then compared both the services rendered and the fees paid under other contracts of the Adviser and under contracts of other investment advisers with respect to similar mutual funds and ETFs. In particular, the Board reviewed a report compiled by an independent third party to compare each Fund’s management fee and expense ratio to other investment companies within each Fund’s respective peer grouping, as determined by the independent third party.
The comparative reporting indicated that total expense ratios for JSMD, VNLA, JMBS and OLD were in the 1st, 2nd, 1st and 1st quintiles, respectively, as compared to each Fund’s respective peer grouping. The comparative reporting indicated that the total expense ratio for JMSL was ranked third in the peer group assigned by the independent third party, which contained five peers. The Board also noted that the Adviser had reduced the management fees charged to the Funds at the April 22-23, 2020 Meeting by implementing reductions in each Fund’s breakpoint schedule. The Board further considered that the Adviser had voluntarily agreed to cap the expenses of VNLA and JMBS to the extent that the Funds’ total expense ratio exceeded 0.23% and 0.29%, respectively, for at least the period February 28, 2021 through February 28, 2022.
The Board also discussed the costs incurred by the Adviser in connection with its serving as investment adviser to the Funds, including operational costs. After comparing each Fund’s fees and expenses with those of other ETFs and mutual funds (as applicable) in the Funds’ respective peer groups, and in light of the nature, extent and quality of services provided by the Adviser and the costs incurred by the Adviser in rendering those services, as well as the profitability of the Adviser in providing these services, the Board concluded that the level of fees paid to the Adviser and the profitability with respect to each Fund was fair and reasonable.
The Board also considered that the Adviser may experience reputational “fall-out” benefits based on the success of the Funds, but that such benefits are not easily quantifiable.
(c) The extent to which economies of scale would be realized as the Fund grows and whether fee levels would reflect such economies of scale.
The Board next discussed potential economies of scale. In its review, the Board considered that the Funds were positioned to realize economies of scale as assets grow over time, given the inclusion of management fee breakpoints for each Fund in the current investment advisory agreement at various asset levels.
(d) Investment performance of the Fund and the Adviser.
The Board next discussed the performance of the Funds on both an absolute basis and relative to the performance of funds comprising a peer group compiled by an independent third party for each Fund for the one-year period, two-year period, r three-year period, and/or four-year period, as applicable. The Board noted that for the one-, two-, three-, and four year periods, respectively, OLD was reported to be in the 5th, 5th, 5th and 5th quintiles, JSMD was reported to be in the 3rd, 3rd, 2nd and 3rd quintiles and JSML was reported to be in the 4th, 3rd, 3rd and 3rd quintiles. VNLA was reported to be in the 3rd, 4th and 2nd quintiles for the one-, two- and three-year periods, respectively. JMBS was reported to be in the 1st quintile for both the one- and two-year periods. The Board considered the Adviser’s explanation of performance provided as part of the consideration of the renewal of the Investment Advisory Agreement, and during the course of the previous year.
With respect to OLD, JSML and JSMD, the Board noted that these Funds are index-based and, as a result, passively managed to seek to track the returns of specified indices. For this reason, the Board also considered the performance of these Funds in relation to the performance of each Fund’s respective underlying index (i.e. “tracking error”), and considered that the tracking error was within anticipated ranges.
Conclusion.
No single factor was determinative to the decision of the Board. Based on the foregoing and such other matters as were deemed relevant, the Board concluded that the management fee rates and total expense ratios of each Fund are reasonable in relation to the services provided by the Adviser to such Fund, as well as the costs incurred and benefits gained by the Adviser in providing such services. The Board also found the management fees to be reasonable in comparison to the fees charged by advisers to other comparable ETFs and mutual funds (as applicable). As a result, the
| | |
| | Janus Detroit Street Trust ½ 27 |
Janus Henderson Mortgage-Backed Securities ETF
Board Considerations Regarding Approval of Investment Advisory Agreements (unaudited)
Board concluded that the renewal of the Investment Management Agreement for an additional one-year period was in the best interests of each Fund.
After full consideration of the above factors, as well as other factors, the Trustees, including all of the Independent Trustees voting separately, determined to approve the renewal of the Investment Management Agreement for each Fund.
Janus Henderson Mortgage-Backed Securities ETF
Liquidity Risk Management Program (unaudited)
Rule 22e-4 under the Investment Company Act of 1940, as amended (the “Liquidity Rule”), requires open-end funds (but not money market funds) to adopt and implement a written liquidity risk management program (the “LRMP”) that is reasonably designed to assess and manage liquidity risk. In compliance with the Liquidity Rule, the Fund has implemented a LRMP, which incorporates the following elements: (i) assessment, management, and periodic review of liquidity risk; (ii) classification of portfolio holdings, as applicable; (iii) the establishment and monitoring of a highly liquid investment minimum, as applicable; (iv) a 15% limitation on a Fund’s illiquid investments; (v) redemptions in-kind; and (vi) board oversight. In light of the fact that the Fund operates as an exchange-traded fund (“ETF”), the LRMP also takes into account considerations unique to ETFs, including the relationship between the ETF’s portfolio liquidity and the way in which, and the prices and spreads at which, ETF shares trade, including: (i) the efficiency of the arbitrage function and the level of active participation by market participants (including authorized participants); and (ii) the effect of the composition of baskets on the overall liquidity of the ETF’s portfolio. The LRMP also considers whether the ETF meets redemptions through in-kind transfers of securities, positions, and assets other than a de minimis amount of cash.
The Trustees of the Fund (the “Trustees”) have designated Janus Capital Management LLC, the Fund’s investment adviser (“Janus Capital”), as the Program Administrator for the LRMP. A working group comprised of various groups within Janus Capital’s business is responsible for administering different aspects of the LRMP (the “Liquidity Risk Working Group”).
The Liquidity Rule requires the Trustees to review at least annually a written report provided by the Janus Capital that addresses the operation of the LRMP and assesses its adequacy and the effectiveness of its implementation, including, if applicable, the operation of the highly liquid investment minimum and any material changes to the LRMP (the “Program Administrator Report”). At a meeting held April 22, 2021, Janus Capital provided the Program Administrator Report to the Trustees which covered the operation of the LRMP from January 1, 2020 through December 31, 2020 (the “Reporting Period”).
The Program Administrator Report discussed the operation and effectiveness of the LRMP during the Reporting Period. It noted that the Fund was able to meet redemptions during the normal course of business during the Reporting Period, and discussed the additional actions that the Liquidity Risk Working Group took during the period of market volatility in the spring of 2020, in light of the impact of the coronavirus outbreak, to monitor the Fund’s liquidity. The Program Administrator Report also stated that the Fund did not exceed the 15% limit on illiquid assets during the Reporting Period, that the Fund held primarily highly liquid assets, and was considered to be a primarily highly liquid fund during the Reporting Period. In addition, Janus Capital expressed its belief in the Program Administrator Report that the LRMP is reasonably designed and adequate to assess and manage the Fund’s liquidity risk, taking into account the Fund’s particular risks and circumstances, and includes policies and procedures reasonably designed to implement each required component of the Liquidity Rule.
There can be no assurance that the LRMP will achieve its objectives in the future. Please refer to your Fund’s prospectus for more information regarding the risks to which an investment in the Fund may be subject.
| | |
| | Janus Detroit Street Trust ½ 29 |
This report is submitted for the general information of shareholders of the Fund. It is not an offer or solicitation for the Fund and is not authorized for distribution to prospective investors unless preceded or accompanied by an effective prospectus.
Janus Henderson is a trademark of Janus Henderson Group plc or one of its subsidiaries. © Janus Henderson Group plc.
Janus Capital Management LLC is the investment adviser and ALPS Distributors, Inc. is the distributor. ALPS is not affiliated with Janus Henderson or any of its subsidiaries.
SEMIANNUAL REPORT
April 30, 2021
Janus Henderson AAA CLO ETF
Janus Detroit Street Trust

Table of Contents
Janus Henderson AAA CLO ETF (unaudited)
Fund At A Glance
April 30, 2021
INVESTMENT OBJECTIVE
Janus Henderson AAA CLO ETF seeks capital preservation and current income by seeking to deliver floating-rate exposure to high-quality AAA-rated collateralized loan obligations (CLOs).
| | | | |
| Sector Allocation – (% of Net Assets) | |
Collateralized Loan Obligations | | | 99.7% | |
Investment Companies | | | 1.1% | |
| | | | |
| | | 100.8% | |
Holdings are subject to change without notice.
| | |
| | Janus Detroit Street Trust ½ 1 |
Janus Henderson AAA CLO ETF (unaudited)
Performance
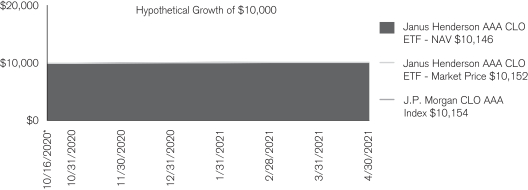
| | | | |
| Cumulative Total Return for the period ended April 30, 2021 | | | | |
| | | Fiscal Year-to-Date | | Since
Inception* |
Janus Henderson AAA CLO ETF – NAV | | 1.88% | | 1.46% |
Janus Henderson AAA CLO ETF – Market Price | | 1.88% | | 1.52% |
J.P. Morgan CLO AAA Index | | 1.75% | | 1.54% |
| * | The Fund commenced operations on October 16, 2020. |
Total annual expense ratio as stated in the prospectus (estimated): 0.25%. See Financial Highlights for actual expense ratios during the reporting period.
Returns quoted are past performance and do not guarantee future results; current performance may be lower or higher. Investment returns and principal value will vary; there may be a gain or loss when shares are sold. For the most recent month-end performance call 800.668.0434 or visit janushenderson.com/performance.
Shares of ETFs are bought and sold at market price (not NAV) and are not individually redeemed from the Fund. Market returns are based upon the midpoint of the bid/ask spread at 4:00 p.m. Eastern time (when NAV is normally determined for most ETFs), and do not represent the returns you would receive if you traded shares at other times. Ordinary brokerage commissions apply and will reduce returns.
Investing involves risk, including the possible loss of principal and fluctuation of value.
The ETF is new and has less than one year of operating history.
See the prospectus for a more complete discussion of objectives, risks and expenses.
Returns include reinvestment of dividends and capital gains. Returns do not reflect the deduction of taxes that a shareholder would pay on Fund distributions, sales, or redemptions of Fund shares.
See Financial Highlights for actual expense ratios during the reporting period.
There is no assurance the stated objective(s) will be met.
See Notes to Schedule of Investments and Other Information for index definitions.
Index performance does not reflect the expenses of managing a portfolio as an index is unmanaged and not available for direct investment.
Janus Henderson AAA CLO ETF (unaudited)
Disclosure of Fund Expenses
As a shareholder of the Fund, you incur two types of costs: (1) transaction costs, which may include creation and redemption fees or brokerage charges and (2) ongoing costs, including management fees and other Fund expenses. This example is intended to help you understand your ongoing costs (in dollars) of investing in the Fund and to compare these costs with the ongoing costs of investing in other ETFs. To do so, compare this 5% hypothetical example with the 5% hypothetical examples that appear in the shareholder reports of the other funds. The example is based upon an investment of $1,000 invested at the beginning of the period and held for the six-months indicated, unless noted otherwise in the table and footnotes below.
Actual Expenses
The information in the table under the heading “Actual” provides information about actual account values and actual expenses. You may use the information in these columns, together with the amount you invested, to estimate the expenses that you paid over the period. Simply divide your account value by $1,000 (for example, an $8,600 account value divided by $1,000 = 8.6), then multiply the result by the number under the heading entitled “Expenses Paid During Period” to estimate the expenses you paid on your account during the period.
Hypothetical Example for Comparison Purposes
The information in the table under the heading “Hypothetical (5% return before expenses)” provides information about hypothetical account values and hypothetical expenses based upon the Fund’s actual expense ratio and an assumed rate of return of 5% per year before expenses, which is not the Fund’s actual return. The hypothetical account values and expenses may not be used to determine the actual ending account balance or expenses you paid for the period. You may use this information to compare the ongoing costs of investing in the Fund and other funds. To do so, compare this 5% hypothetical example with the 5% hypothetical examples that appear in the shareholder reports of the other funds. Additionally, for an analysis of the fees associated with an investment or other similar funds, please visit www.finra.org/fundanalyzer.
Please note that the expenses shown in the table are meant to highlight your ongoing costs only and do not reflect any transaction costs, such as creation and redemption fees, or brokerage charges. These fees are fully described in the Fund’s prospectus. Therefore, the hypothetical examples are useful in comparing ongoing costs only, and will not help you determine the relative total costs of owning different funds. In addition, if these transaction costs were included, your costs would have been higher.
| | | | | | | | | | | | | | | | | | | | | | | | |
Actual | | | Hypothetical
(5% return before expenses) | | | | |
Beginning
Account
Value
(11/1/20) | | Ending
Account
Value
(4/30/21) | | | Expenses
Paid During
Period
(11/1/20 - 4/30/21)† | | | Beginning
Account
Value
(11/1/20) | | | Ending
Account
Value
(4/30/21) | | | Expenses
Paid During
Period
(11/1/20 - 4/30/21)† | | | Net Annualized
Expense Ratio
(11/1/20 - 4/30/21) | |
| $1,000.00 | | $ | 1,018.80 | | | $ | 1.25 | | | $ | 1,000.00 | | | $ | 1,023.55 | | | $ | 1.25 | | | | 0.25% | |
| † | Expenses Paid During Period is equal to the Net Annualized Expense Ratio multiplied by the average account value over the period, multiplied by 181/365 (to reflect the one-half year period). |
| | |
| | Janus Detroit Street Trust ½ 3 |
Janus Henderson AAA CLO ETF
Schedule of Investments (unaudited)
April 30, 2021
| | | | | | | | |
| | | Shares/
Principal Amounts | | | Value | |
| Collateralized Loan Obligations – 99.7% | |
AIG CLO Ltd. 2021-1A A, ICE LIBOR USD 3 Month + 1.1000%, 1.2800%, 4/22/34 (144A)‡ | | | $1,000,000 | | | | $999,992 | |
Allegro CLO IX Ltd. 2018-3A A, ICE LIBOR USD 3 Month + 1.1650%, 1.3486%, 10/16/31 (144A)‡ | | | 1,000,000 | | | | 999,042 | |
Apidos CLO XXIX Ltd. 2018 29A A1B, ICE LIBOR USD 3 Month + 1.3000%, 1.4758%, 7/25/30 (144A)‡ | | | 2,000,000 | | | | 2,000,238 | |
Benefit Street Partners CLO VIII Ltd. 2015-8A A1AR, ICE LIBOR USD 3 Month + 1.1000%, 1.2883%, 1/20/31 (144A)‡ | | | 3,000,000 | | | | 2,995,278 | |
Carlyle Global Market Strategies CLO Ltd. 2015-1A AR2, ICE LIBOR USD 3 Month + 1.2000%, 1.3883%, 7/20/31 (144A)‡ | | | 988,301 | | | | 988,499 | |
CBAM CLO Ltd. 2018-5A A, ICE LIBOR USD 3 Month + 1.0200%, 1.2098%, 4/17/31 (144A)‡ | | | 5,900,000 | | | | 5,901,563 | |
CIFC Funding CLO Ltd. 2017-4A A1, ICE LIBOR USD 3 Month + 1.2500%, 1.4258%, 10/24/30 (144A)‡ | | | 4,750,000 | | | | 4,757,600 | |
CIFC Funding CLO Ltd. 2018-3A A, ICE LIBOR USD 3 Month + 1.1000%, 1.2898%, 7/18/31 (144A)‡ | | | 2,500,000 | | | | 2,503,492 | |
CIFC Funding CLO Ltd. 2019-6A C, ICE LIBOR USD 3 Month + 2.7000%, 2.8836%, 1/16/33 (144A)‡ | | | 1,500,000 | | | | 1,504,647 | |
Deer Creek CLO Ltd. 2017-1A A, ICE LIBOR USD 3 Month + 1.1800%, 1.3683%, 10/20/30 (144A)‡ | | | 3,000,000 | | | | 3,001,611 | |
Dryden 37 CLO Senior Loan Fund 2015-37A AR, ICE LIBOR USD 3 Month + 1.1000%, 1.2838%, 1/15/31 (144A)‡ | | | 3,000,000 | | | | 3,000,057 | |
Dryden 53 CLO Ltd. 2017-53A A, ICE LIBOR USD 3 Month + 1.1200%, 1.3038%, 1/15/31 (144A)‡ | | | 3,000,000 | | | | 2,997,117 | |
Dryden 57 CLO Ltd. 2018-57A A, ICE LIBOR USD 3 Month + 1.0100%, 1.2038%, 5/15/31 (144A)‡ | | | 1,000,000 | | | | 1,000,150 | |
Dryden 86 CLO Ltd. 2020-86A C, ICE LIBOR USD 3 Month + 2.8000%, 2.9898%, 7/17/30 (144A)‡ | | | 1,000,000 | | | | 1,001,210 | |
Eaton Vance CLO Ltd. 2014-1RA C, ICE LIBOR USD 3 Month + 2.1000%, 2.2838%, 7/15/30 (144A)‡ | | | 3,077,215 | | | | 3,078,495 | |
Galaxy XVIII CLO Ltd. 2018-28A A1, ICE LIBOR USD 3 Month + 1.1000%, 1.2838%, 7/15/31 (144A)‡ | | | 1,000,000 | | | | 1,001,739 | |
Goldentree Loan Management US CLO 1 Ltd. 2017-1A A1R2, ICE LIBOR USD 3 Month + 1.0200%, 1.2198%, 4/20/34 (144A)‡ | | | 2,000,000 | | | | 2,000,784 | |
HPS Loan Management CLO Ltd. 14A-19 A1R, ICE LIBOR USD 3 Month + 1.0200%, 1.1958%, 1/25/34 (144A)‡ | | | 3,950,000 | | | | 3,948,811 | |
KKR CLO Ltd. 22A A, ICE LIBOR USD 3 Month + 1.1500%, 1.3383%, 7/20/31 (144A)‡ | | | 3,000,000 | | | | 3,000,870 | |
LCM CLO XVIII LP 19A AR, ICE LIBOR USD 3 Month + 1.2400%, 1.4238%, 7/15/27 (144A)‡ | | | 1,299,841 | | | | 1,300,769 | |
Madison Park Funding XI CLO Ltd. 2013-11A CR2, ICE LIBOR USD 3 Month + 1.9500%, 2.1229%, 7/23/29 (144A)‡ | | | 1,500,000 | | | | 1,500,171 | |
Madison Park Funding XVIII CLO Ltd. 2015-18A A1R, ICE LIBOR USD 3 Month + 1.1900%, 1.3760%, 10/21/30 (144A)‡ | | | 3,400,000 | | | | 3,400,534 | |
Madison Park Funding XXX CLO Ltd. 2018-30A A, ICE LIBOR USD 3 Month + 0.7500%, 0.9338%, 4/15/29 (144A)‡ | | | 5,000,000 | | | | 4,986,665 | |
Magnetite XVII CLO Ltd. 2016-17A AR, ICE LIBOR USD 3 Month + 1.1000%, 1.2883%, 7/20/31 (144A)‡ | | | 1,650,000 | | | | 1,652,855 | |
Marble Point CLO XI Ltd. 2017-2A A, ICE LIBOR USD 3 Month + 1.1800%, 1.3698%, 12/18/30 (144A)‡ | | | 3,000,000 | | | | 3,001,059 | |
MP CLO III Ltd. 2013-1A AR, ICE LIBOR USD 3 Month + 1.2500%, 1.4383%, 10/20/30 (144A)‡ | | | 2,250,000 | | | | 2,250,450 | |
Neuberger Berman Loan Advisers CLO 29 Ltd. 2018-29A A1, ICE LIBOR USD 3 Month + 1.1300%, 1.3198%, 10/19/31 (144A)‡ | | | 1,000,000 | | | | 1,000,486 | |
OCP CLO Ltd. 2014-5A A1R, ICE LIBOR USD 3 Month + 1.0800%, 1.2558%, 4/26/31 (144A)‡ | | | 1,250,000 | | | | 1,247,455 | |
Octagon Investment Partners CLO XVII Ltd. 2013-1A A1R2, ICE LIBOR USD 3 Month + 1.0000%, 1.1758%, 1/25/31 (144A)‡ | | | 5,900,000 | | | | 5,892,218 | |
Octagon Loan Funding CLO Ltd. 2014-1A ARR, ICE LIBOR USD 3 Month + 1.1800%, 1.3686%, 11/18/31 (144A)‡ | | | 6,000,000 | | | | 6,000,138 | |
See Notes to Schedule of Investments and Other Information and Notes to Financial Statements.
Janus Henderson AAA CLO ETF
Schedule of Investments (unaudited)
April 30, 2021
| | | | | | | | |
| | | Shares/
Principal Amounts | | | Value | |
| Collateralized Loan Obligations – (continued) | |
OHA Credit Partners XIV CLO Ltd. 2017-14A C, ICE LIBOR USD 3 Month + 1.8000%, 1.9860%, 1/21/30 (144A)‡ | | | $ 1,000,000 | | | | $ 1,000,002 | |
Palmer Square CLO Ltd. 2018-2A A1A, ICE LIBOR USD 3 Month + 1.1000%, 1.2836%, 7/16/31 (144A)‡ | | | 5,000,000 | | | | 5,007,685 | |
Palmer Square Loan Funding CLO Ltd. 2020-1A A1, ICE LIBOR USD 3 Month + 0.8000%, 0.9824%, 2/20/28 (144A)‡ | | | 4,707,488 | | | | 4,707,483 | |
Rockford Tower CLO Ltd. 2018-1A A, ICE LIBOR USD 3 Month + 1.1000%, 1.2824%, 5/20/31 (144A)‡ | | | 2,000,000 | | | | 1,998,600 | |
Signal Peak CLO 8 Ltd. 2020-8A C, ICE LIBOR USD 3 Month + 2.0000%, 2.1883%, 4/20/33 (144A)‡ | | | 2,000,000 | | | | 1,985,274 | |
Sound Point CLO IV-R Ltd. 2013-3RA A, ICE LIBOR USD 3 Month + 1.1500%, 1.3398%, 4/18/31 (144A)‡ | | | 5,000,000 | | | | 4,993,040 | |
Sound Point CLO XIX Ltd. 2018-1A A, ICE LIBOR USD 3 Month + 1.0000%, 1.1838%, 4/15/31 (144A)‡ | | | 3,000,000 | | | | 2,994,843 | |
Symphony CLO XXII Ltd. 2020-22A A1A, ICE LIBOR USD 3 Month + 1.2900%, 1.4798%, 4/18/33 (144A)‡ | | | 2,650,000 | | | | 2,657,219 | |
THL Credit Wind River CLO Ltd. 2017-1A ARR, ICE LIBOR USD 3 Month + 1.0600%, 1.2498%, 4/18/36 (144A)‡ | | | 2,500,000 | | | | 2,499,995 | |
THL Credit Wind River CLO Ltd. 2019-2A C, ICE LIBOR USD 3 Month + 2.6500%, 2.8338%, 1/15/33 (144A)‡ | | | 1,500,000 | | | | 1,502,370 | |
Venture 32 CLO Ltd. 2018-32A A1, ICE LIBOR USD 3 Month + 1.1000%, 1.2898%, 7/18/31 (144A)‡ | | | 3,766,000 | | | | 3,761,839 | |
Venture XXVIII CLO Ltd. 2017-28A A2, ICE LIBOR USD 3 Month + 1.1100%, 1.2983%, 7/20/30 (144A)‡ | | | 1,000,000 | | | | 998,598 | |
Vibrant CLO VI Ltd. 2017-6A A, ICE LIBOR USD 3 Month + 1.2400%, 1.4266%, 6/20/29 (144A)‡ | | | 3,000,000 | | | | 3,000,681 | |
Voya CLO Ltd. 2013-3A A1RR, ICE LIBOR USD 3 Month + 1.1500%, 1.3398%, 10/18/31 (144A)‡ | | | 1,993,114 | | | | 1,993,508 | |
Voya CLO Ltd. 2019-1A AR, ICE LIBOR USD 3 Month + 1.0600%, 1.2438%, 4/15/31 (144A)‡ | | | 1,000,000 | | | | 1,000,546 | |
Wind River CLO Ltd. 2016-1A AR, ICE LIBOR USD 3 Month + 1.0500%, 1.2338%, 7/15/28 (144A)‡ | | | 678,718 | | | | 678,846 | |
Zais CLO 8 Ltd. 2018-1A, ICE LIBOR USD 3 Month + 0.9500%, 1.1338%, 4/15/29 (144A)‡ | | | 967,053 | | | | 960,266 | |
Total Collateralized Loan Obligations (cost $119,899,628) | | | | | | | 120,654,790 | |
| Investment Companies – 1.1% | |
| Money Market Funds – 1.1% | |
STIT - Government and Agency Portfolio, 0.0259% | | | 1,341,944 | | | | 1,341,944 | |
Total Money Market Funds (cost $1,341,944) | | | | | | | 1,341,944 | |
Total Investments (total cost $121,241,572) – 100.8% | | | | | | | 121,996,734 | |
Liabilities, net of Cash, Receivables and Other Assets – (0.8%) | | | | | | | (932,910) | |
Net Assets – 100% | | | | | | | $121,063,824 | |
Summary of Investments by Country – (Long Positions) (unaudited)
| | | | | | | | |
| Country | | Value | | | % of
Investment
Securities | |
United States | | | $121,996,734 | | | | 100.0% | |
See Notes to Schedule of Investments and Other Information and Notes to Financial Statements.
| | |
| | Janus Detroit Street Trust ½ 5 |
Janus Henderson AAA CLO ETF
Notes to Schedule of Investments and Other Information (unaudited)
April 30, 2021
| | |
| J.P. Morgan CLO AAA Index | | J.P. Morgan CLO AAA Index is designed to track the AAA-rated components of the USD-denominated, broadly syndicated CLO market. |
| |
| ICE | | Intercontinental Exchange |
| |
| LIBOR | | LIBOR (London Interbank Offered Rate) is a short-term interest rate that banks offer one another and generally represents current cash rates. |
| ‡ | The interest rate on floating rate notes is based on an index or market interest rates and is subject to change. Rate in the security description is as of April 30, 2021. |
| 144A | Securities sold under Rule 144A of the Securities Act of 1933, as amended, are subject to legal and/or contractual restrictions on resale and may not be publicly sold without registration under the 1993 Act. Unless otherwise noted, these securities have been determined to be liquid in accordance with the requirements of Rule 22e-4, under the 1940 Act. The total value of 144A securities as of the period ended April 30, 2021 is $120,654,790 which represents 99.7% of net assets. |
The following is a summary of the inputs that were used to value the Fund’s investments in securities and other financial instruments as of April 30, 2021. See Notes to Financial Statements for more information.
Valuation Inputs Summary
| | | | | | | | | | | | |
| | | Level 1 -
Quoted Prices | | | Level 2 -
Other Significant
Observable Inputs | | | Level 3 -
Significant
Unobservable Inputs | |
| | | |
Assets | | | | | | | | | | | | |
|
Investments in Securities: | |
| | | |
Collateralized Loan Obligations | | $ | — | | | $ | 120,654,790 | | | $ | — | |
| | | |
Investment Companies | | | 1,341,944 | | | | — | | | | — | |
| | | | |
| | | |
Total Assets | | $ | 1,341,944 | | | $ | 120,654,790 | | | $ | — | |
Janus Henderson AAA CLO ETF
Statement of Assets and Liabilities (unaudited)
April 30, 2021
| | | | |
Assets: | |
Investments, at value(1) | | $ | 121,996,734 | |
Receivables: | | | | |
Interest | | | 94,609 | |
Total Assets | | | 122,091,343 | |
Liabilities: | |
Payables: | | | | |
Investments purchased | | | 1,001,000 | |
Management fees | | | 26,519 | |
Total Liabilities | | | 1,027,519 | |
Net Assets | | $ | 121,063,824 | |
Net Assets Consists of: | |
Capital (par value and paid-in surplus) | | $ | 120,001,000 | |
Total distributable earnings (loss) | | | 1,062,824 | |
Total Net Assets | | $ | 121,063,824 | |
Net Assets | | $ | 121,063,824 | |
Shares outstanding, $0.001 Par Value (unlimited shares authorized) | | | 2,400,020 | |
Net Asset Value Per Share | | $ | 50.44 | |
| (1) | Includes cost of $121,241,572. |
See Notes to Financial Statements.
| | |
| | Janus Detroit Street Trust ½ 7 |
Janus Henderson AAA CLO ETF
Statement of Operations (unaudited)
For the period ended April 30, 2021
| | | | |
Investment Income: | |
Dividends | | $ | 253 | |
Interest | | | 916,680 | |
Total Investment Income | | | 916,933 | |
Expenses: | |
Management Fees | | | 151,434 | |
Total Expenses | | | 151,434 | |
Net Investment Income/(Loss) | | | 765,499 | |
Net Realized Gain/(Loss) on Investments: | |
Investments | | $ | 180,324 | |
Total Net Realized Gain/(Loss) on Investments | | $ | 180,324 | |
Change in Unrealized Net Appreciation/Depreciation: | |
Investments | | $ | 1,320,330 | |
Total Change in Unrealized Net Appreciation/Depreciation | | $ | 1,320,330 | |
Net Increase/(Decrease) in Net Assets Resulting from Operations | | $ | 2,266,153 | |
See Notes to Financial Statements.
Janus Henderson AAA CLO ETF
Statements of Changes in Net Assets
| | | | | | | | |
| | | Period Ended April 30, 2021 (unaudited) | | | Period Ended
October 31, 2020(1) | |
Operations: | |
Net investment income/(loss) | | $ | 765,499 | | | $ | 50,470 | |
Net realized gain/(loss) on investments | | | 180,324 | | | | — | |
Change in unrealized net appreciation/depreciation | | | 1,320,330 | | | | (565,168) | |
Net Increase/(Decrease) in Net Assets Resulting from Operations | | | 2,266,153 | | | | (514,698) | |
Dividends and Distributions to Shareholders: | |
Dividends and Distributions | | | (688,631) | | | | — | |
Net Decrease from Dividends and Distributions to Shareholders | | | (688,631) | | | | — | |
Capital Share Transactions | | | — | | | | 120,001,000 | |
Net Increase/(Decrease) in Net Assets | | | 1,577,522 | | | | 119,486,302 | |
Net Assets: | |
Beginning of period | | | 119,486,302 | | | | — | |
End of period | | $ | 121,063,824 | | | $ | 119,486,302 | |
| (1) | Period from October 16, 2020 (commencement of operations) through October 31, 2020. |
See Notes to Financial Statements.
| | |
| | Janus Detroit Street Trust ½ 9 |
Janus Henderson AAA CLO ETF
Financial Highlights
| | | | | | | | | | |
| For a share outstanding during the period ended April 30, 2021 (unaudited) and the period ended October 31, 2020 | | 2021 | | | 2020(1) | |
| | Net Asset Value, Beginning of Period | | | $49.79 | | | | $50.00 | |
| | Income/(Loss) from Investment Operations: | |
| | Net investment income/(loss)(2) | | | 0.32 | | | | 0.02 | |
| | Net realized and unrealized gain/(loss) | | | 0.62 | | | | (0.23) | |
| | Total from Investment Operations | | | 0.94 | | | | (0.21) | |
| | Less Dividends and Distributions: | |
| | Dividends (from net investment income) | | | (0.29) | | | | — | |
| | Total Dividends and Distributions | | | (0.29) | | | | — | |
| | Net Asset Value, End of Period | | | $50.44 | | | | $49.79 | |
| | Total Return* | | | 1.88% | | | | (0.42)% | |
| | Net assets, End of Period (in thousands) | | | $121,064 | | | | $119,486 | |
| | Average Net Assets for the Period (in thousands) | | | $120,815 | | | | $95,755 | |
| | Ratios to Average Net Assets**: | |
| | Ratio of Gross Expenses | | | 0.25% | | | | 0.25% | |
| | Ratio of Net Investment Income/(Loss) | | | 1.28% | | | | 1.29% | |
| | Portfolio Turnover Rate(3) | | | 27% | | | | 0%(4) | |
| * | Total return not annualized for periods of less than one full year. |
| ** | Annualized for periods of less than one full year. |
| (1) | Period from October 16, 2020 (commencement of operations) through October 31, 2020. |
| (2) | Per share amounts are calculated based on average shares outstanding during the year or period. |
| (3) | Portfolio turnover rate excludes securities received or delivered from in-kind processing of creation or redemptions. |
| (4) | Amount is less than 0.5% |
See Notes to Financial Statements.
Janus Henderson AAA CLO ETF
Notes to Financial Statements (unaudited)
1. Organization and Significant Accounting Policies
Janus Henderson AAA CLO ETF (the “Fund”) is a series fund. The Fund is part of Janus Detroit Street Trust (the “Trust”), which is organized as a Delaware statutory trust and is registered under the Investment Company Act of 1940, as amended (the “1940 Act”), as an open-end management investment company, and therefore has applied the specialized accounting and reporting guidance in Financial Accounting Standards Board (“FASB”) Accounting Standards Codification (“ASC”) Topic 946. As of the date of this report, the Trust offers six Funds each of which represent shares of beneficial interest in a separate portfolio of securities and other assets with its own objective and policies. The Fund seeks capital preservation and current income by seeking to deliver floating-rate exposure to high quality AAA-rated collateralized loan obligations (“CLOs”). The Fund is classified as diversified, as defined in the 1940 Act.
The Fund is an actively-managed exchange-traded fund. Unlike shares of traditional mutual funds, shares of the Fund are not individually redeemable and may only be purchased or redeemed directly from the Fund at net asset value (“NAV”) in large increments called “Creation Units” by certain participants, known as “Authorized Participants.” The size of a Creation Unit to purchase shares of the Fund may differ from the size of a Creation Unit to redeem shares of the Fund. The Fund will issue or redeem Creation Units in exchange for portfolio securities and/or cash. Except when aggregated in Creation Units, Fund shares are not redeemable securities of the Fund. Shares of the Fund are listed and trade on NYSE Arca, Inc. (“NYSE Arca”), and individual investors can purchase or sell shares in much smaller increments for cash in the secondary market through a broker. These transactions, which do not involve the Fund, are made at market prices that may vary throughout the day and differ from the Fund’s NAV. As a result, you may pay more than NAV (a premium) when you purchase shares and receive less than NAV (a discount) when you sell shares, in the secondary market.
An Authorized Participant (or other broker-dealers making markets in shares of the Fund) may hold of record more than 25% of the outstanding shares of the Fund. From time to time, Authorized Participants (or other broker-dealers making markets in shares of the Fund) may be a beneficial and/or legal owner of the Fund, may be affiliated with an index provider, may be deemed to have control of the Fund and/or may be able to affect the outcome of matters presented for a vote of the shareholders of the Fund. Authorized Participants (or other broker-dealers making markets in shares of the Fund) may execute an irrevocable proxy granting the Distributor, Janus Capital Management LLC (“Janus Capital” or “Janus”) or an affiliate of Janus Capital power to vote or abstain from voting such Authorized Participant’s beneficially or legally owned shares of the Fund. In such cases, the agent shall mirror vote (or abstain from voting) such shares in the same proportion as all other beneficial owners of the Fund.
The following accounting policies have been followed by the Fund and are in conformity with United States of America generally accepted accounting principles (“US GAAP”).
Investment Valuation
Securities held by the Fund are valued in accordance with policies and procedures established by and under the supervision of the Trustees (the “Valuation Procedures”). Equity securities, including shares of exchange-traded funds, traded on a domestic securities exchange are generally valued at the closing prices on the primary market or exchange on which they trade. If such price is lacking for the trading period immediately preceding the time of determination, such securities are valued at their current bid price. Equity securities that are traded on a foreign exchange are generally valued at the closing prices on such markets. In the event that there is no current trading volume on a particular security in such foreign exchange, the bid price from the primary exchange is generally used to value the security. Securities that are traded on the over-the-counter (“OTC”) markets are generally valued at their closing or latest bid prices as available. Foreign securities and currencies are converted to U.S. dollars using the applicable exchange rate in effect at the close of the London Stock Exchange. The Fund will determine the market value of individual securities held by it by using prices provided by one or more approved professional pricing services or, as needed, by obtaining market quotations from independent broker-dealers. Most debt securities are valued in accordance with the evaluated bid price supplied by the pricing service that is intended to reflect market value. The evaluated bid price supplied by the pricing service is an evaluation that may consider factors such as security prices, yields, maturities and ratings. Certain short-term securities maturing within 60 days or less may be evaluated and valued on an amortized cost basis provided that the amortized cost determined approximates market value. Securities for which market quotations or evaluated prices are not readily available or are deemed unreliable, are valued at fair value determined in good faith under the Valuation Procedures. Circumstances in which fair value pricing may be utilized include, but are not limited to: (i) a significant event that may affect the securities of a single issuer, such as a merger, bankruptcy, or significant issuer-specific development; (ii) an event that may affect an entire market, such as a natural disaster or significant governmental action; (iii) a nonsignificant event such as a market closing early or not opening, or a security trading halt; and (iv) pricing of a nonvalued security and a restricted or nonpublic security. Special valuation considerations may apply with respect to “odd-lot” fixed-income transactions which, due to their small size, may receive evaluated prices by pricing services which reflect a large block trade and not what actually could be obtained for the odd-lot position.
| | |
| | Janus Detroit Street Trust ½ 11 |
Janus Henderson AAA CLO ETF
Notes to Financial Statements (unaudited)
Valuation Inputs Summary
FASB ASC 820, Fair Value Measurements and Disclosures (“ASC 820”), defines fair value, establishes a framework for measuring fair value, and expands disclosure requirements regarding fair value measurements. This standard emphasizes that fair value is a market-based measurement that should be determined based on the assumptions that market participants would use in pricing an asset or liability and establishes a hierarchy that prioritizes inputs to valuation techniques used to measure fair value. These inputs are summarized into three broad levels:
Level 1 – Unadjusted quoted prices in active markets the Fund has the ability to access for identical assets or liabilities.
Level 2 – Observable inputs other than unadjusted quoted prices included in Level 1 that are observable for the asset or liability either directly or indirectly. These inputs may include quoted prices for the identical instrument on an inactive market, prices for similar instruments, interest rates, prepayment speeds, credit risk, yield curves, default rates and similar data.
Assets or liabilities categorized as Level 2 in the hierarchy generally include: debt securities fair valued in accordance with the evaluated bid or ask prices supplied by a pricing service; securities traded on OTC markets and listed securities for which no sales are reported that are fair valued at the latest bid price (or yield equivalent thereof) obtained from one or more dealers transacting in a market for such securities or by a pricing service approved by the Fund’s Trustees; and certain short-term debt securities with maturities of 60 days or less that are fair valued at amortized cost. Other securities that may be categorized as Level 2 in the hierarchy include, but are not limited to, preferred stocks, bank loans, swaps, investments in unregistered investment companies, options, and forward contracts.
Level 3 – Unobservable inputs for the asset or liability to the extent that relevant observable inputs are not available, representing the Fund’s own assumptions about the assumptions that a market participant would use in valuing the asset or liability, and that would be based on the best information available.
There have been no significant changes in valuation techniques used in valuing any such positions held by the Fund since the beginning of the fiscal year.
The inputs or methodology used for fair valuing securities are not necessarily an indication of the risk associated with investing in those securities. The summary of inputs used as of April 30, 2021 to fair value the Fund’s investments in securities and other financial instruments is included in the “Valuation Inputs Summary” in the Notes to Schedule of Investments and Other Information.
Investment Transactions and Investment Income
Investment transactions are accounted for as of the date purchased or sold (trade date). Dividend income is recorded on the ex-dividend date. Certain dividends from foreign securities will be recorded as soon as the Fund is informed of the dividend, if such information is obtained subsequent to the ex-dividend date. Dividends from foreign securities may be subject to withholding taxes in foreign jurisdictions. Interest income is recorded daily on an accrual basis and includes amortization of premiums and accretion of discounts. The Fund classifies gains and losses on prepayments received as an adjustment to interest income. Debt securities may be placed in non-accrual status and related interest income may be reduced by stopping current accruals and writing off interest receivables when collection of all or a portion of interest has become doubtful. Gains and losses are determined on the identified cost basis, which is the same basis used for federal income tax purposes.
Estimates
The preparation of financial statements in conformity with US GAAP requires management to make estimates and assumptions that affect the reported amount of assets and liabilities and disclosure of contingent assets and liabilities at the date of the financial statements and the reported amounts of income and expenses during the reporting period.
Actual results could differ from those estimates.
Indemnifications
In the normal course of business, the Fund may enter into contracts that contain provisions for indemnification of other parties against certain potential liabilities. The Fund’s maximum exposure under these arrangements is unknown and would involve future claims that may be made against the Fund that have not yet occurred. Currently, the risk of material loss from such claims is considered remote.
Janus Henderson AAA CLO ETF
Notes to Financial Statements (unaudited)
Dividends and Distributions
Dividends from net investment income are generally declared and distributed monthly. Net realized capital gains (if any) are distributed annually. The Fund may treat a portion of the amount paid to redeem shares as a distribution of investment company taxable income and realized capital gains that are reflected in the NAV. This practice, commonly referred to as “equalization,” has no effect on the redeeming shareholder or a Fund’s total return but may reduce the amounts that would otherwise be required to be paid as taxable dividends to the remaining shareholders. It is possible that the Internal Revenue Service (IRS) could challenge the Fund’s equalization methodology or calculations, and any such challenge could result in additional tax, interest, or penalties to be paid by the Fund.
Federal Income Taxes
The Fund intends to continue to qualify as a regulated investment company and distribute all of its taxable income in accordance with the requirements of Subchapter M of the Internal Revenue Code. Management has analyzed the Fund’s tax positions taken for all open federal income tax years, generally a three-year period, and has concluded that no provision for federal income tax is required in the Fund’s financial statements. The Fund is not aware of any tax positions for which it is reasonably possible that the total amounts of unrecognized tax benefits will significantly change in the next twelve months.
2. Other Investments and Strategies
Additional Investment Risk
In response to the COVID-19 pandemic, the U.S. government and the Federal Reserve, as well as certain foreign governments and central banks, have taken extraordinary actions to support local and global economies and the financial markets, including reducing interest rates to record low levels. Extremely low or negative interest rates may become more prevalent or may not work as intended. As there is little precedent for this situation, the impact on various markets that interest rate or other significant policy changes may have is unknown. The withdrawal of this support, a failure of measures put in place in response to such economic uncertainty, or investor perception that such efforts were not sufficient could each negatively affect financial markets generally, and the value and liquidity of specific securities. In addition, policy and legislative changes in the United States and in other countries continue to impact many aspects of financial regulation.
Widespread disease, including pandemics and epidemics, and natural or environmental disasters, including those which may be attributable to global climate change, such as earthquakes, fires, floods, hurricanes, tsunamis and weather-related phenomena generally, have been and can be highly disruptive to economies and markets, adversely impacting individual companies, sectors, industries, markets, currencies, interest and inflation rates, credit ratings, investor sentiment, and other factors affecting the value of a Fund’s investments. Economies and financial markets throughout the world have become increasingly interconnected, which increases the likelihood that events or conditions in one region or country will adversely affect markets or issuers in other regions or countries, including the United States. These disruptions could prevent a Fund from executing advantageous investment decisions in a timely manner and negatively impact a Fund’s ability to achieve its investment objective(s). Any such event(s) could have a significant adverse impact on the value of a Fund. In addition, these disruptions could also impair the information technology and other operational systems upon which the Fund’s service providers, including Janus Capital, rely, and could otherwise disrupt the ability of employees of the Fund’s service providers to perform essential tasks on behalf of the Fund. Adverse weather conditions may also have a particularly significant negative effect on issuers in the agricultural sector and on insurance and reinsurance companies that insure or reinsure against the impact of natural disasters.
A number of countries in the European Union (the “EU”) have experienced, and may continue to experience, severe economic and financial difficulties. In particular, many EU nations are susceptible to economic risks associated with high levels of debt. Many non-governmental issuers, and even certain governments, have defaulted on, or been forced to restructure, their debts. Many other issuers have faced difficulties obtaining credit or refinancing existing obligations. Financial institutions have in many cases required government or central bank support, have needed to raise capital, and/or have been impaired in their ability to extend credit. As a result, financial markets in the EU have experienced extreme volatility and declines in asset values and liquidity. These difficulties may continue, worsen, or spread further within the EU. Responses to these financial problems by European governments, central banks, and others, including austerity measures and reforms, may not work, may result in social unrest, and may limit future growth and economic recovery or have other unintended consequences. The risk of investing in securities in the European markets may also be heightened due to the referendum in which the United Kingdom voted to exit the EU commonly known as “Brexit,” which immediately led to significant market volatility around the world, as well as political, economic and legal uncertainty. The United Kingdom formally left the EU on January 31, 2020 and entered into an eleven-month transition period, which expired on
| | |
| | Janus Detroit Street Trust ½ 13 |
Janus Henderson AAA CLO ETF
Notes to Financial Statements (unaudited)
December 31, 2020. The negative impact on not only the United Kingdom and European economies could be significant, potentially resulting in increased volatility and illiquidity and lower economic growth for companies that rely significantly on the United Kingdom and/or Europe for their business activities and revenues. Any further exits from the EU, or an increase in the belief that such exits are likely or possible, would likely cause additional market disruption globally and introduce new legal and regulatory uncertainties.
Management Risk
The Fund is an actively managed investment portfolio and is therefore subject to the risk that the investment strategies employed for the Fund may fail to produce the intended results. Although the Fund seeks to provide long-term positive returns, market conditions or implementation of the Fund’s investment process may result in losses, and the Fund may not meet its investment objective. As such, there can be no assurance of positive “absolute” returns.
CLO Risk
The risks of investing in CLOs include both the economic risks of the underlying loans combined with the risks associated with the CLO structure governing the priority of payments. The degree of such risk will generally correspond to the specific tranche in which the Fund is invested. The Fund intends to invest primarily in AAA-rated tranches; however, this rating does not constitute a guarantee, may be downgraded, and in stressed market environments it is possible that even senior CLO tranches could experience losses due to actual defaults, increased sensitivity to defaults due to collateral default and the disappearance of the subordinated/equity tranches, market anticipation of defaults, as well as negative market sentiment with respect to CLO securities as an asset class. The Fund’s portfolio managers may not be able to accurately predict how specific CLOs or the portfolio of underlying loans for such CLOs will react to changes or stresses in the market, including changes in interest rates. The most common risks associated with investing in CLOs are liquidity risk, interest rate risk, credit risk, call risk, and the risk of default of the underlying asset, among others.
Investment Focus Risk
Because the Fund invests primarily in CLOs it is susceptible to an increased risk of loss due to adverse occurrences in the CLO market, generally, and in the various markets impacting the portfolios of loans underling these CLOs. The Fund’s CLO investment focus may cause the Fund to perform differently than the overall financial market and the Fund’s performance may be more volatile than if the Fund’s investments were more diversified across financial instruments and or markets.
Liquidity Risk
Liquidity risk refers to the possibility that the Fund may not be able to sell or buy a security or close out an investment contract at a favorable price or time. Consequently, the Fund may have to accept a lower price to sell a security, sell other securities to raise cash, or give up an investment opportunity, any of which could have a negative effect on the Fund’s performance. Infrequent trading of securities also may lead to an increase in their price volatility. CLOs, and their underlying loan obligations, are typically not registered for sale to the public and therefore are subject to certain restrictions on transfer and sale, potentially making them less liquid than other types of securities. Additionally, when the Fund purchases a newly issued CLO directly from the issuer (rather than from the secondary market), there often may be a delayed settlement period, during which time, the liquidity of the CLO may be further reduced. During periods of limited liquidity and higher price volatility, the Fund’s ability to acquire or dispose of CLOs at a price and time the Fund deems advantageous may be impaired. CLOs are generally considered to be long-term investments and there is no guarantee that an active secondary market will exist or be maintained for any given CLO.
Floating-Rate Obligations Risk
Securities with floating or variable interest rates can be less sensitive to interest rate changes than securities with fixed interest rates, but may decline in value if their interest rates do not rise as much, or as quickly, as interest rates in general. Conversely, floating rate securities will not generally increase in value if interest rates decline. A decline in interest rates may result in a reduction of income received from floating rate securities held by the Fund and may adversely affect the value of the Fund’s shares. Generally, floating rate securities carry lower yields than fixed notes of the same maturity. The interest rate for a floating rate note resets or adjusts periodically by reference to a benchmark interest rate. The impact of interest rate changes on floating rate investments is typically mitigated by the periodic interest rate reset of the investments. Securities with longer durations tend to be more sensitive to interest rate changes, usually making them more volatile than securities with shorter durations. Benchmark interest rates, such as the London Interbank Offered Rate (“LIBOR”), may not accurately track market interest rates.
Janus Henderson AAA CLO ETF
Notes to Financial Statements (unaudited)
Privately Issued Securities Risk
CLOs are generally privately-issued securities, and are normally purchased pursuant to Rule144A or Regulation S under the Securities Act of 1933, as amended (the “Securities Act”). Privately-issued securities typically may be resold only to qualified institutional buyers, in a privately negotiated transaction, to a limited number of purchasers, or in limited quantities after they have been held for a specified period of time and other conditions are met for an exemption from registration. Because there may be relatively few potential purchasers for such securities, especially under adverse market or economic conditions or in the event of adverse changes in the financial condition of the issuer, the Fund may find it more difficult to sell such securities when it may be advisable to do so or it may be able to sell such securities only at prices lower than if such securities were more widely held and traded. At times, it also may be more difficult to determine the fair value of such securities for purposes of computing the Fund’s net asset value per share (“NAV”) due to the absence of an active trading market. There can be no assurance that a privately-issued security previously deemed to be liquid when purchased will continue to be liquid for as long as it is held by the Fund, and its value may decline as a result.
LIBOR Replacement Risk
The Fund may invest in certain debt securities, derivatives or other financial instruments that utilize the London Interbank Offered Rate (“LIBOR”) as a reference rate for various rate calculations. On July 27, 2017, the U.K. Financial Conduct Authority announced that it intends to stop compelling or inducing banks to submit LIBOR rates after 2021. However, it remains unclear if LIBOR will continue to exist in its current, or a modified, form. Actions by regulators have resulted in the establishment of alternative reference rates to LIBOR in most major currencies. The U.S. Federal Reserve, based on the recommendations of the New York Federal Reserve’s Alternative Reference Rate Committee (comprised of major derivative market participants and their regulators), has begun publishing a Secured Overnight Financing Rate (SOFR), that is intended to replace U.S. dollar LIBOR. Proposals for alternative reference rates for other currencies have also been announced or have already begun publication. However, global consensus on alternative rates is lacking. The elimination of LIBOR or changes to other reference rates or any other changes or reforms to the determination or supervision of reference rates could adversely impact (i) volatility and liquidity in markets that are tied to LIBOR, (ii) the market for, or value of, specific securities or payments linked to those reference rates, (iii) availability or terms of borrowing or refinancing, or (iv) the effectiveness of hedging strategies. For these and other reasons, the elimination of LIBOR or changes to other interest rates may adversely affect the Fund’s performance and/or net asset value. Since the usefulness of LIBOR as a benchmark could deteriorate during the transition period, these effects could occur prior to the end of 2021. Markets are slowly developing in response to these new rates. Uncertainty regarding the process for amending existing contracts or instruments to transition away from LIBOR remains a concern for the Fund. The effect of any changes to, or discontinuation of, LIBOR on the Fund will vary depending, among other things, on (1) existing fallback or termination provisions in individual contracts and (2) whether, how, and when industry participants develop and adopt new reference rates and fallbacks for both legacy and new products and instruments. Accordingly, it is difficult to predict the full impact of the transition away from LIBOR on the Fund until new reference rates and fallbacks for both legacy and new products, instruments and contracts are commercially accepted.
3. Investment Advisory Agreements and Other Transactions with Affiliates
Under its unitary fee structure, the Fund pays Janus Capital a management fee in return for providing certain investment advisory, supervisory, and administrative services to the Fund, including the costs of transfer agency, custody, fund administration, legal, audit, and other services. Janus Capital’s fee structure is designed to pay substantially all of the Fund’s expenses. However, the Fund bears other expenses which are not covered under the management fee which may vary and affect the total level of expenses paid by shareholders, such as distribution fees (if any), brokerage expenses or commissions, interest, dividends, taxes, litigation expenses, acquired fund fees and expenses (if any), and extraordinary expenses. The Fund’s unitary management fee provides for reductions in the fee rate as the Fund’s assets grow. As of the date of this report, the Fund’s management fee was calculated daily and paid monthly according to the following schedule:
| | | | |
| Daily Net Assets | | Fee Rate | |
| $0-$1 billion | | | 0.25% | |
| Over $1 billion | | | 0.20% | |
For the period ended April 30, 2021, the Fund’s contractual management fee rate (expressed as an annual rate) was 0.25% of the Fund’s average daily net assets.
| | |
| | Janus Detroit Street Trust ½ 15 |
Janus Henderson AAA CLO ETF
Notes to Financial Statements (unaudited)
As of the date of this report, State Street Bank and Trust Company (“State Street”) provides certain fund administration services to the Fund, including services related to the Fund’s accounting, including calculating the daily NAV, audit coordination, tax, and reporting obligations, pursuant to an agreement with Janus Capital, on behalf of the Fund. As compensation for such services, Janus Capital pays State Street a fee based on a percentage of the Fund’s assets, with a minimum flat fee, for certain services. Janus Capital serves as administrator to the Fund, providing oversight and coordination of the Fund’s service providers, recordkeeping and other administrative services. Janus Capital does not receive any additional compensation, beyond the unitary fee, for serving as administrator. State Street also serves as transfer agent for the shares of the Fund. Pursuant to agreements with Janus Capital on behalf of the Fund, State Street Global Markets, an affiliate of State Street, may execute portfolio transactions for the Fund, including but not limited to, transactions in connection with cash in lieu transactions.
The Trust has adopted a Distribution and Servicing Plan for shares of the Fund pursuant to Rule 12b-1 under the 1940 Act (the “Plan”). The Plan permits compensation in connection with the distribution and marketing of Fund shares and/or the provision of certain shareholder services. The Plan permits the Fund to pay ALPS Distributors, Inc. (the “Distributor”) or its designee, a fee for the sale and distribution and/or shareholder servicing of the shares at an annual rate of up to 0.25% of average daily net assets of the Fund. However, the Trustees have determined not to authorize payment under this Plan at this time. Under the terms of the Plan, the Trust would be authorized to make payments to the Distributor or its designee for remittance to retirement plan service providers, broker-dealers, bank trust departments, financial advisors, and other financial intermediaries, as compensation for distribution and/or shareholder services performed by such entities for their customers who are investors in the Fund. The 12b-1 fee may only be imposed or increased when the Trustees determine that it is in the best interests of shareholders to do so. Because these fees are paid out of the Fund’s assets on an ongoing basis, to the extent that a fee is authorized, over time they will increase the cost of an investment in the Fund. The Plan fee may cost an investor more than other types of sales charges.
As of April 30, 2021, Janus Capital owned 200,020 shares or 8.33% of the Fund.
The Fund is permitted to purchase or sell securities (“cross-trade”) between itself and other funds or accounts managed by Janus Capital in accordance with Rule 17a-7 under the Investment Company Act of 1940 (“Rule 17a-7”), when the transaction is consistent with the investment objectives and policies of the Fund and in accordance with the Internal Cross Trade Procedures adopted by the Trust’s Board of Trustees. These procedures have been designed to ensure that any cross-trade of securities by the Fund from or to another fund or account that is or could be considered an affiliate of the Fund under certain limited circumstances by virtue of having a common investment adviser, common Officer, or common Trustee complies with Rule 17a-7. Under these procedures, each cross-trade is effected at the current market price to save costs where allowed. During the period ended April 30, 2021, the Fund engaged in cross trades amounting to $1,250,538 in sales, resulting in a net realized gain of $8,766. The net realized gain is included within the “Net Realized Gain/(Loss) on Investments” section of the Fund’s Statement of Operations.
4. Federal Income Tax
Income and capital gains distributions are determined in accordance with income tax regulations that may differ from US GAAP. These differences are due to differing treatments for items such as net short-term gains, deferral of wash sale losses, foreign currency transactions, passive foreign investment companies, net investment losses, in-kind transactions and capital loss carryovers.
The Fund has elected to treat gains and losses on forward foreign currency contracts as capital gains and losses, if applicable. Other foreign currency gains and losses on debt instruments are treated as ordinary income for federal income tax purposes pursuant to Section 988 of the Internal Revenue Code.
The aggregate cost of investments and the composition of unrealized appreciation and depreciation of investment securities for federal income tax purposes as of April 30, 2021 are noted below.
| | | | | | | | | | | | | | |
| Federal Tax Cost | | | Unrealized
Appreciation | | | Unrealized
(Depreciation) | | | Net Tax Appreciation/
(Depreciation) | |
| $ | 121,241,572 | | | $ | 786,345 | | | $ | (31,183) | | | $ | 755,162 | |
Janus Henderson AAA CLO ETF
Notes to Financial Statements (unaudited)
5. Capital Share Transactions
| | | | | | | | | | | | | | | | |
| | | Period ended April 30, 2021 | | | Period ended October 31, 2020(1) | |
| | | Shares | | | Amount | | | Shares | | | Amount | |
| Shares sold | | | — | | | $ | — | | | | 2,400,020 | | | $ | 120,001,000 | |
| Shares repurchased | | | — | | | | — | | | | — | | | | — | |
Net Increase/(Decrease) | | | — | | | $ | — | | | | 2,400,020 | | | $ | 120,001,000 | |
| (1) | Period from October 16, 2020 (commencement of operations) through October 31, 2020. |
6. Purchases and Sales of Investment Securities
For the period ended April 30, 2021, the aggregate cost of purchases and proceeds from sales of investment securities (excluding any short-term securities, short-term options contracts, TBAs, and in-kind transactions) was as follows:
| | | | | | | | | | | | | | |
Purchases of Securities | | | Proceeds from Sales of Securities | | | Purchases of Long- Term U.S. Government Obligations | | | Proceeds from Sales of Long-Term U.S. Government Obligations | |
| $ | 33,436,446 | | | $ | 32,734,063 | | | $ | — | | | $ | — | |
7. Recent Accounting Pronouncements
The FASB issued Accounting Standards Update 2020-04 Reference Rate Reform: Facilitation of the Effects of Reference Rate Reform on Financial Reporting (“ASU 2020-04”) in March 2020. The new guidance in the ASU provide optional temporary financial reporting relief from the effect of certain types of contract modifications due to the planned discontinuation of the LIBOR or other interbank-offered based reference rates as of the end of 2021. For new and existing contracts, Funds may elect to apply the guidance as of March 12, 2020 through December 31, 2022. Management is currently evaluating the impact, if any, of the ASU’s adoption to the Fund’s financial statements.
8. Subsequent Events
Management has evaluated whether any events or transactions occurred subsequent to April 30, 2021 and through the date of the issuance of the Fund’s financial statements and determined that there were no material events or
transactions that would require recognition or disclosure in the Fund’s financial statements.
| | |
| | Janus Detroit Street Trust ½ 17 |
Janus Henderson AAA CLO ETF
Additional Information (unaudited)
Proxy Voting Policies and Voting Record
A description of the policies and procedures that the Fund uses to determine how to vote proxies relating to its portfolio securities is available without charge: (i) upon request, by calling 1-800-668-0434 (toll free); (ii) on the Fund’s website at janushenderson.com/proxyvoting; and (iii) on the SEC’s website at http://www.sec.gov.
Quarterly Portfolio Holdings
The Fund files its complete portfolio holdings (schedule of investments) with the SEC for the first and third quarters each fiscal year as an exhibit to Form N-PORT within 60 days of the end of such fiscal quarter. The Fund’s Form N-PORT filings: are available on the SEC’s website at http://www.sec.gov; (ii) may be reviewed and copied at the SEC’s Public Reference Room in Washington, D.C. (information on the Public Reference Room may be obtained by calling 1-800-SEC-0330); and (iii) are available without charge, upon request, by calling Janus Henderson at 1-800-668-0434 (toll free).
Janus Henderson AAA CLO ETF
Liquidity Risk Management Program (unaudited)
Rule 22e-4 under the Investment Company Act of 1940, as amended (the “Liquidity Rule”), requires open-end funds (but not money market funds) to adopt and implement a written liquidity risk management program (the “LRMP”) that is reasonably designed to assess and manage liquidity risk. In compliance with the Liquidity Rule, the Fund has implemented a LRMP, which incorporates the following elements: (i) assessment, management, and periodic review of liquidity risk; (ii) classification of portfolio holdings, as applicable; (iii) the establishment and monitoring of a highly liquid investment minimum, as applicable; (iv) a 15% limitation on a Fund’s illiquid investments; (v) redemptions in-kind; and (vi) board oversight. In light of the fact that the Fund operates as an exchange-traded fund (“ETF”), the LRMP also takes into account considerations unique to ETFs, including the relationship between the ETF’s portfolio liquidity and the way in which, and the prices and spreads at which, ETF shares trade, including: (i) the efficiency of the arbitrage function and the level of active participation by market participants (including authorized participants); and (ii) the effect of the composition of baskets on the overall liquidity of the ETF’s portfolio. The LRMP also considers whether the ETF meets redemptions through in-kind transfers of securities, positions, and assets other than a de minimis amount of cash.
The Trustees of the Fund (the “Trustees”) have designated Janus Capital Management LLC, the Fund’s investment adviser (“Janus Capital”), as the Program Administrator for the LRMP. A working group comprised of various groups within Janus Capital’s business is responsible for administering different aspects of the LRMP (the “Liquidity Risk Working Group”).
The Liquidity Rule requires the Trustees to review at least annually a written report provided by the Janus Capital that addresses the operation of the LRMP and assesses its adequacy and the effectiveness of its implementation, including, if applicable, the operation of the highly liquid investment minimum and any material changes to the LRMP (the “Program Administrator Report”). At a meeting held April 22, 2021, Janus Capital provided the Program Administrator Report to the Trustees which covered the operation of the LRMP from the Fund’s launch through December 31, 2020 (the “Reporting Period”).
The Program Administrator Report discussed the operation and effectiveness of the LRMP during the Reporting Period. It noted that the Fund was able to meet redemptions during the normal course of business during the Reporting Period, and discussed the additional actions that the Liquidity Risk Working Group took during the period of market volatility in the spring of 2020, in light of the impact of the coronavirus outbreak, to monitor the Fund’s liquidity. The Program Administrator Report also stated that the Fund did not exceed the 15% limit on illiquid assets during the Reporting Period, that the Fund held primarily highly liquid assets, and was considered to be a primarily highly liquid fund during the Reporting Period. In addition, Janus Capital expressed its belief in the Program Administrator Report that the LRMP is reasonably designed and adequate to assess and manage the Fund’s liquidity risk, taking into account the Fund’s particular risks and circumstances, and includes policies and procedures reasonably designed to implement each required component of the Liquidity Rule.
There can be no assurance that the LRMP will achieve its objectives in the future. Please refer to your Fund’s prospectus for more information regarding the risks to which an investment in the Fund may be subject.
| | |
| | Janus Detroit Street Trust ½ 19 |
Janus Henderson AAA CLO ETF
Notes
Janus Henderson AAA CLO ETF
Notes
| | |
| | Janus Detroit Street Trust ½ 21 |
This report is submitted for the general information of shareholders of the Fund. It is not an offer or solicitation for the Fund and is not authorized for distribution to prospective investors unless preceded or accompanied by an effective prospectus.
Janus Henderson is a trademark of Janus Henderson Group plc or one of its subsidiaries. © Janus Henderson Group plc.
Janus Capital Management LLC is the investment adviser and ALPS Distributors, Inc. is the distributor. ALPS is not affiliated with Janus Henderson or any of its subsidiaries.
(b) Not applicable.
Item 2. Code of Ethics.
Not applicable to semiannual reports.
Item 3. Audit Committee Financial Expert.
Not applicable to semiannual reports.
Item 4. Principal Accountant Fees and Services.
Not applicable to semiannual reports.
Item 5. Audit Committee of Listed Registrants.
Not applicable to semiannual reports.
Item 6. Investments.
(a) Schedule of Investments is contained in the Reports to Shareholders included under Item 1 of this Form N-CSR.
(b) Not applicable.
Item 7. Disclosure of Proxy Voting Policies and Procedures for Closed-End Management Investment Companies.
Not applicable.
Item 8. Portfolio Managers of Closed-End Management Investment Companies.
Not applicable.
Item 9. Purchases of Equity Securities by Closed-End Management Investment Company and Affiliated Purchasers.
Not applicable.
Item 10. Submission of Matters to a Vote of Security Holders.
There have been no material changes to the procedures by which shareholders may recommend nominees to the Registrant’s Board of Trustees.
Item 11. Controls and Procedures.
(a) The Registrant’s Principal Executive Officer and Principal Financial Officer have evaluated the Registrant’s disclosure controls and procedures (as defined in Rule 30a-3(c) under the Investment Company Act of 1940, as amended) within 90 days of this filing and have concluded that the Registrant’s disclosure controls and procedures were effective, as of that date.
(b) There have been no changes in the Registrant’s internal control over financial reporting (as defined in Rule 30a-3(d) under the Investment Company Act of 1940, as amended) that occurred during the period covered by this report that have materially affected, or are reasonably likely to materially affect, the Registrant’s internal control over financial reporting.
Item 12. Disclosure of Securities Lending Activities for Closed-End Management Investment Companies
Not applicable.
Item 13. Exhibits.
SIGNATURES
Pursuant to the requirements of the Securities Exchange Act of 1934 and the Investment Company Act of 1940, the registrant has duly caused this report to be signed on its behalf by the undersigned, thereunto duly authorized.
| | |
| JANUS DETROIT STREET TRUST |
| |
| By: | | /s/ Bruce L. Koepfgen |
| | Bruce L. Koepfgen |
| | President and Chief Executive Officer (Principal Executive Officer) |
|
| Date: June 29, 2021 |
Pursuant to the requirements of the Securities Exchange Act of 1934 and the Investment Company Act of 1940, this report has been signed below by the following persons on behalf of the registrant and in the capacities and on the dates indicated.
| | |
| |
| By: | | /s/ Bruce L. Koepfgen |
| | Bruce L. Koepfgen |
| | President and Chief Executive Officer (Principal Executive Officer) |
|
| Date: June 29, 2021 |
| | |
| |
| By: | | /s/ Jesper Nergaard |
| | Jesper Nergaard |
| | Vice President, Chief Financial Officer, Treasurer and Principal Accounting Officer (Principal Financial Officer and Principal Accounting Officer) |
|
| Date: June 29, 2021 |