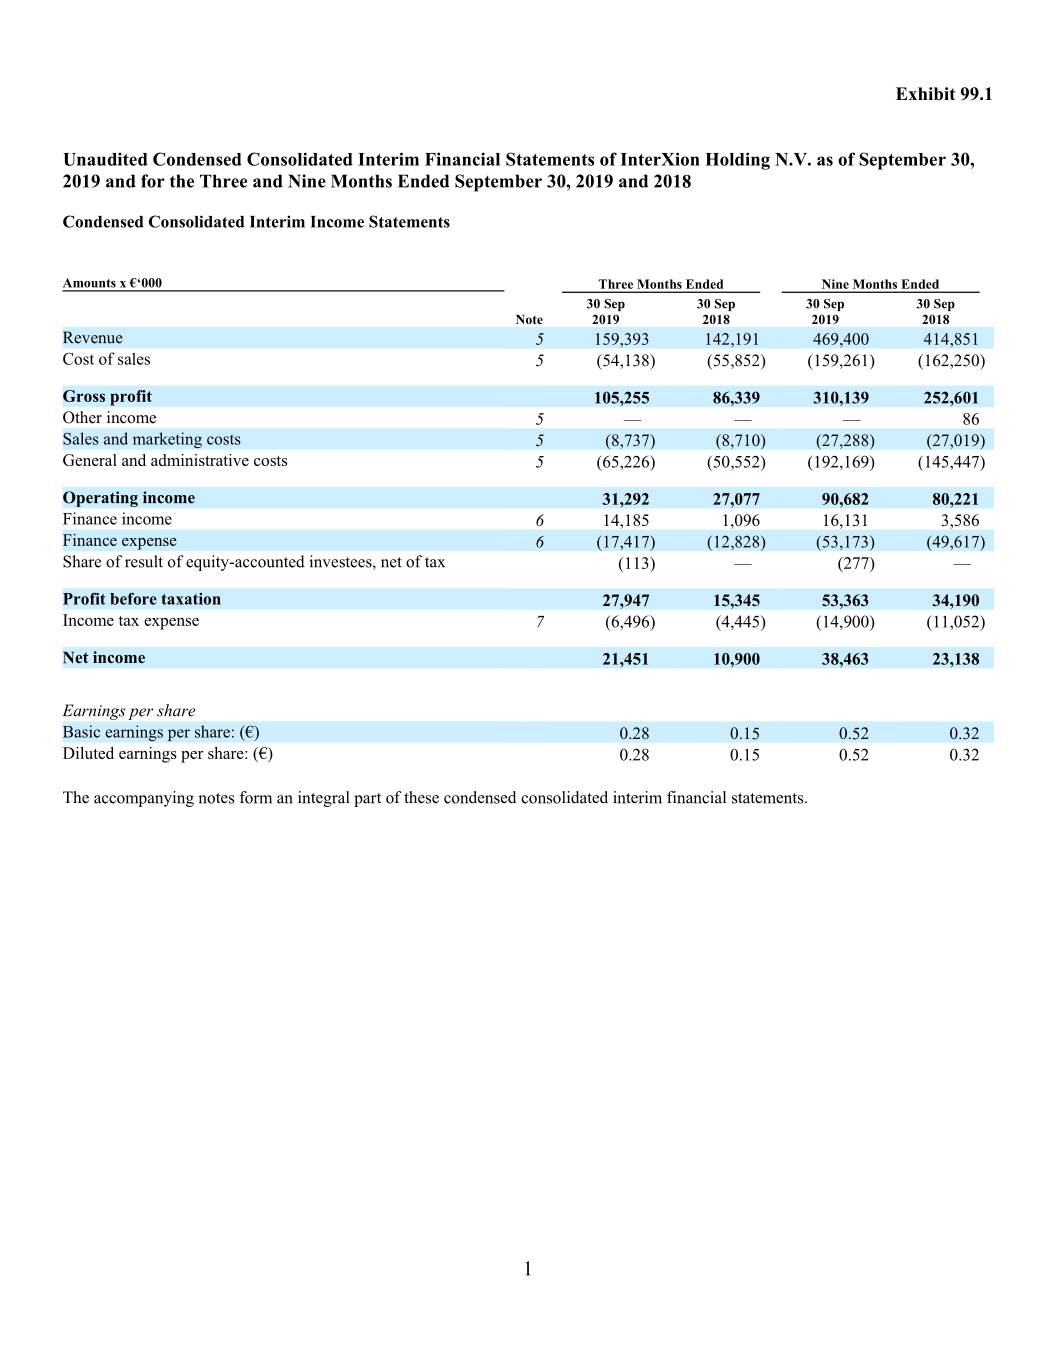
Exhibit 99.1 Unaudited Condensed Consolidated Interim Financial Statements of InterXion Holding N.V. as of September 30, 2019 and for the Three and Nine Months Ended September 30, 2019 and 2018 Condensed Consolidated Interim Income Statements Amounts x €‘000 Three Months Ended Nine Months Ended 30 Sep 30 Sep 30 Sep 30 Sep Note 2019 2018 2019 2018 Revenue 5 159,393 142,191 469,400 414,851 Cost of sales 5 (54,138 ) (55,852 ) (159,261 ) (162,250 ) Gross profit 105,255 86,339 310,139 252,601 Other income 5 — — — 86 Sales and marketing costs 5 (8,737 ) (8,710 ) (27,288 ) (27,019 ) General and administrative costs 5 (65,226 ) (50,552 ) (192,169 ) (145,447 ) Operating income 31,292 27,077 90,682 80,221 Finance income 6 14,185 1,096 16,131 3,586 Finance expense 6 (17,417 ) (12,828 ) (53,173 ) (49,617 ) Share of result of equity-accounted investees, net of tax (113 ) — (277 ) — Profit before taxation 27,947 15,345 53,363 34,190 Income tax expense 7 (6,496 ) (4,445 ) (14,900 ) (11,052 ) Net income 21,451 10,900 38,463 23,138 Earnings per share Basic earnings per share: (€) 0.28 0.15 0.52 0.32 Diluted earnings per share: (€) 0.28 0.15 0.52 0.32 The accompanying notes form an integral part of these condensed consolidated interim financial statements. 1
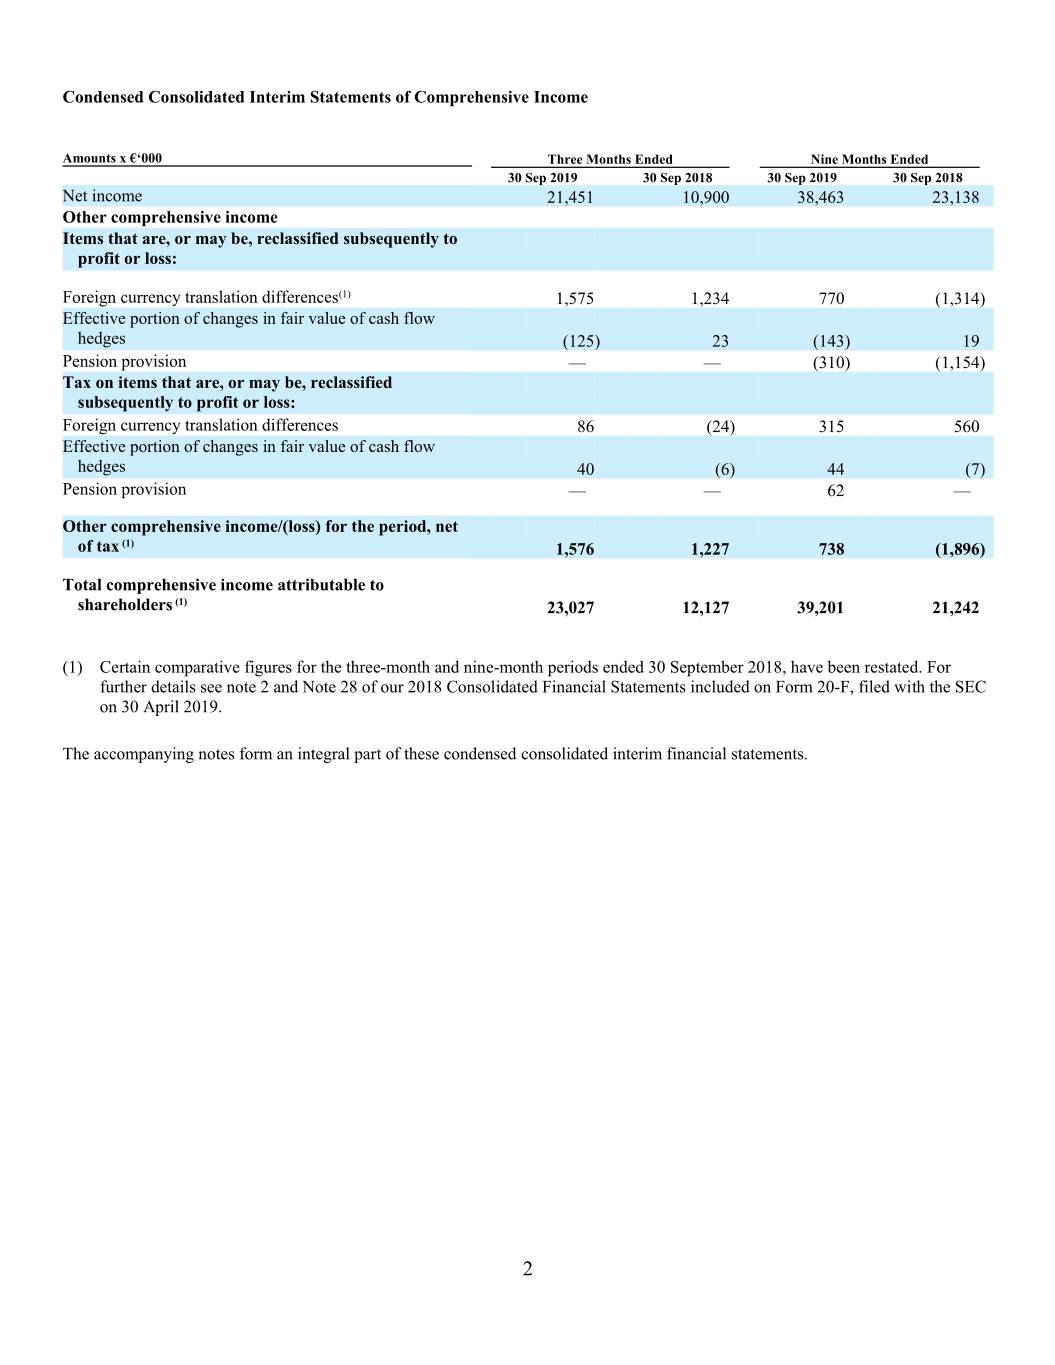
Condensed Consolidated Interim Statements of Comprehensive Income Amounts x €‘000 Three Months Ended Nine Months Ended 30 Sep 2019 30 Sep 2018 30 Sep 2019 30 Sep 2018 Net income 21,451 10,900 38,463 23,138 Other comprehensive income Items that are, or may be, reclassified subsequently to profit or loss: Foreign currency translation differences (1) 1,575 1,234 770 (1,314 ) Effective portion of changes in fair value of cash flow hedges (125 ) 23 (143 ) 19 Pension provision — — (310 ) (1,154 ) Tax on items that are, or may be, reclassified subsequently to profit or loss: Foreign currency translation differences 86 (24 ) 315 560 Effective portion of changes in fair value of cash flow hedges 40 (6 ) 44 (7 ) Pension provision — — 62 — Other comprehensive income/(loss) for the period, net of tax (1) 1,576 1,227 738 (1,896 ) Total comprehensive income attributable to shareholders (1) 23,027 12,127 39,201 21,242 (1) Certain comparative figures for the three-month and nine-month periods ended 30 September 2018, have been restated. For further details see note 2 and Note 28 of our 2018 Consolidated Financial Statements included on Form 20-F, filed with the SEC on 30 April 2019. The accompanying notes form an integral part of these condensed consolidated interim financial statements. 2
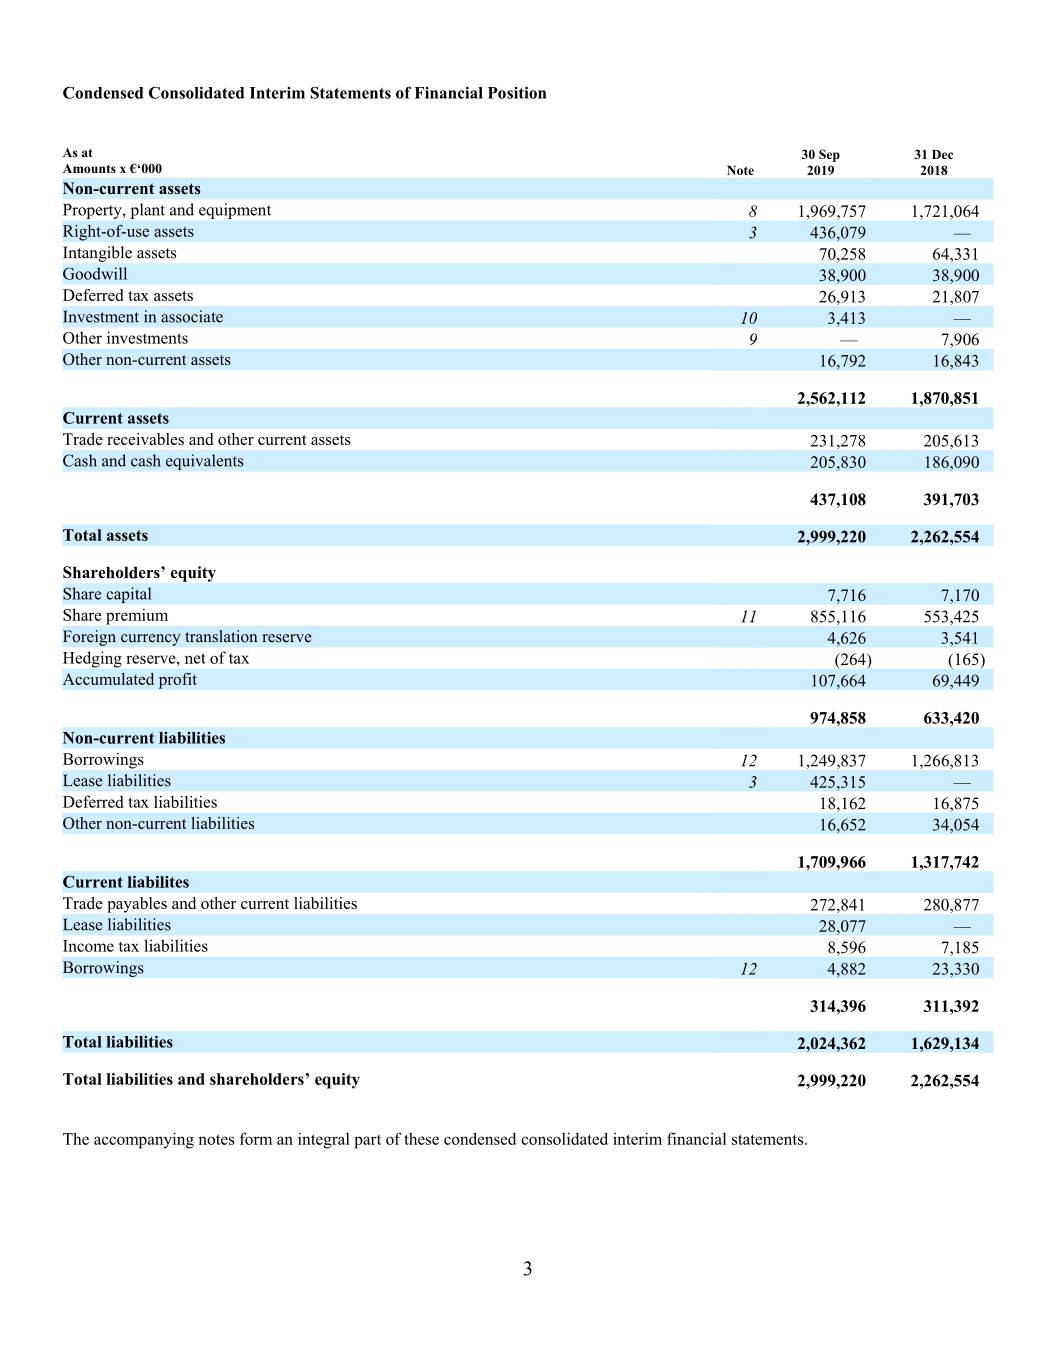
Condensed Consolidated Interim Statements of Financial Position As at 30 Sep 31 Dec Amounts x €‘000 Note 2019 2018 Non-current assets Property, plant and equipment 8 1,969,757 1,721,064 Right-of-use assets 3 436,079 — Intangible assets 70,258 64,331 Goodwill 38,900 38,900 Deferred tax assets 26,913 21,807 Investment in associate 10 3,413 — Other investments 9 — 7,906 Other non-current assets 16,792 16,843 2,562,112 1,870,851 Current assets Trade receivables and other current assets 231,278 205,613 Cash and cash equivalents 205,830 186,090 437,108 391,703 Total assets 2,999,220 2,262,554 Shareholders’ equity Share capital 7,716 7,170 Share premium 11 855,116 553,425 Foreign currency translation reserve 4,626 3,541 Hedging reserve, net of tax (264 ) (165 ) Accumulated profit 107,664 69,449 974,858 633,420 Non-current liabilities Borrowings 12 1,249,837 1,266,813 Lease liabilities 3 425,315 — Deferred tax liabilities 18,162 16,875 Other non-current liabilities 16,652 34,054 1,709,966 1,317,742 Current liabilites Trade payables and other current liabilities 272,841 280,877 Lease liabilities 28,077 — Income tax liabilities 8,596 7,185 Borrowings 12 4,882 23,330 314,396 311,392 Total liabilities 2,024,362 1,629,134 Total liabilities and shareholders’ equity 2,999,220 2,262,554 The accompanying notes form an integral part of these condensed consolidated interim financial statements. 3
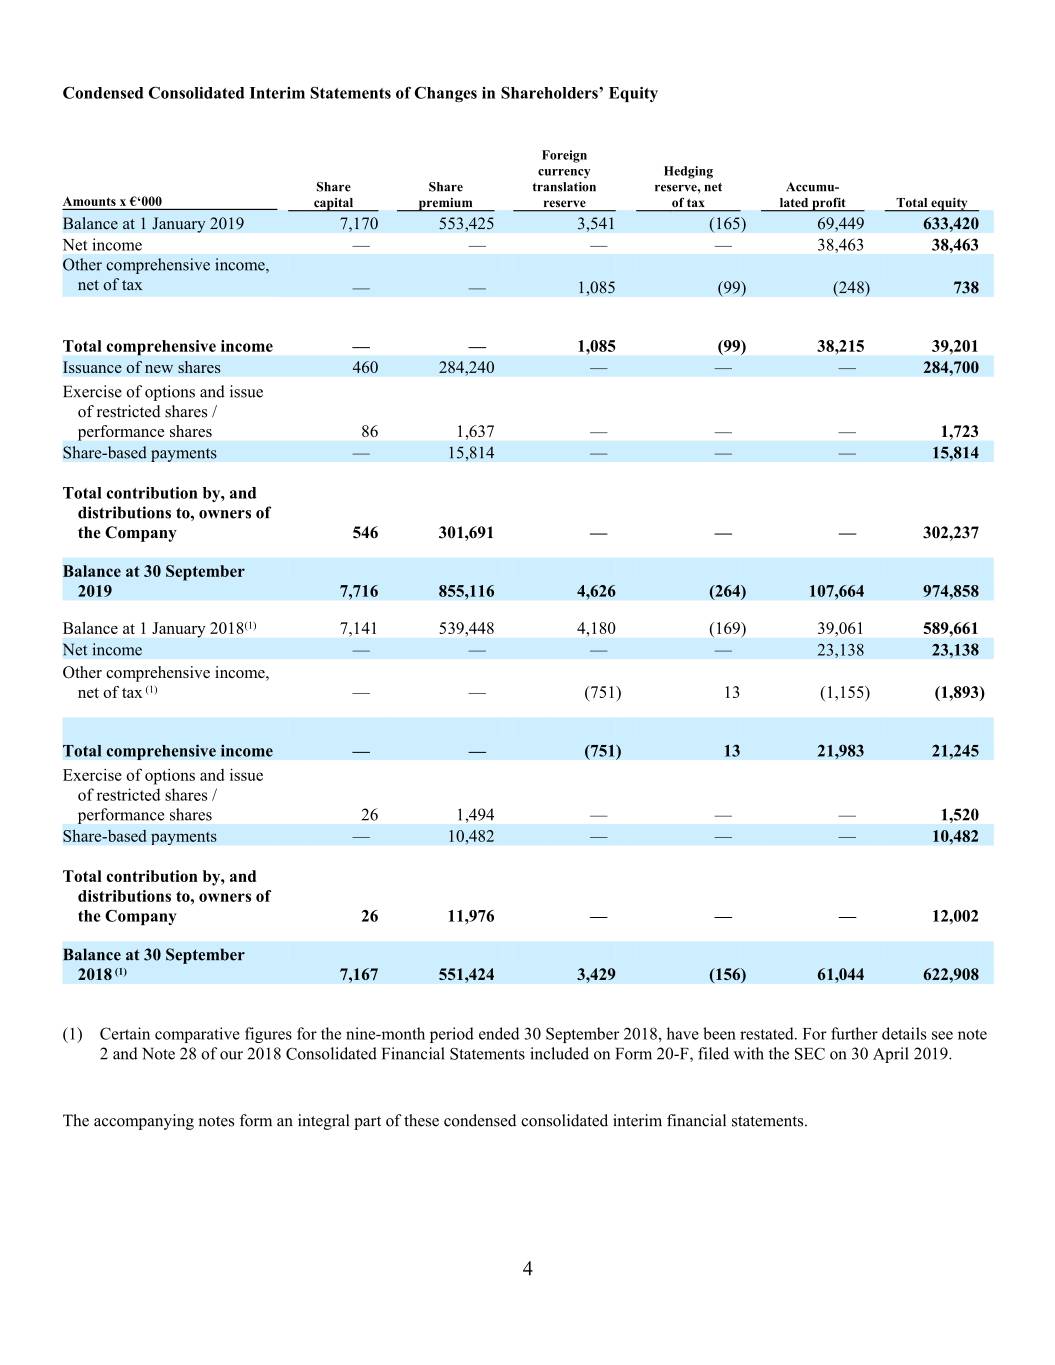
Condensed Consolidated Interim Statements of Changes in Shareholders’ Equity Foreign currency Hedging Share Share translation reserve, net Accumu- Amounts x €‘000 capital premium reserve of tax lated profit Total equity Balance at 1 January 2019 7,170 553,425 3,541 (165 ) 69,449 633,420 Net income — — — — 38,463 38,463 Other comprehensive income, net of tax — — 1,085 (99 ) (248 ) 738 Total comprehensive income — — 1,085 (99) 38,215 39,201 Issuance of new shares 460 284,240 — — — 284,700 Exercise of options and issue of restricted shares / performance shares 86 1,637 — — — 1,723 Share -based payments — 15,814 — — — 15,814 Total contribution by, and distributions to, owners of the Company 546 301,691 — — — 302,237 Balance at 30 September 2019 7,716 855,116 4,626 (264 ) 107,664 974,858 Balance at 1 January 2018 (1) 7,141 539,448 4,180 (169 ) 39,061 589,661 Net income — — — — 23,138 23,138 Other comprehensive income, net of tax (1) — — (751 ) 13 (1,155 ) (1,893 ) Total comprehensive income — — (751 ) 13 21,983 21,245 Exercise of options and issue of restricted shares / performance shares 26 1,494 — — — 1,520 Share -based payments — 10,482 — — — 10,482 Total contribution by, and distributions to, owners of the Company 26 11,976 — — — 12,002 Balance at 30 September 2018 (1) 7,167 551,424 3,429 (156 ) 61,044 622,908 (1) Certain comparative figures for the nine-month period ended 30 September 2018, have been restated. For further details see note 2 and Note 28 of our 2018 Consolidated Financial Statements included on Form 20-F, filed with the SEC on 30 April 2019. The accompanying notes form an integral part of these condensed consolidated interim financial statements. 4
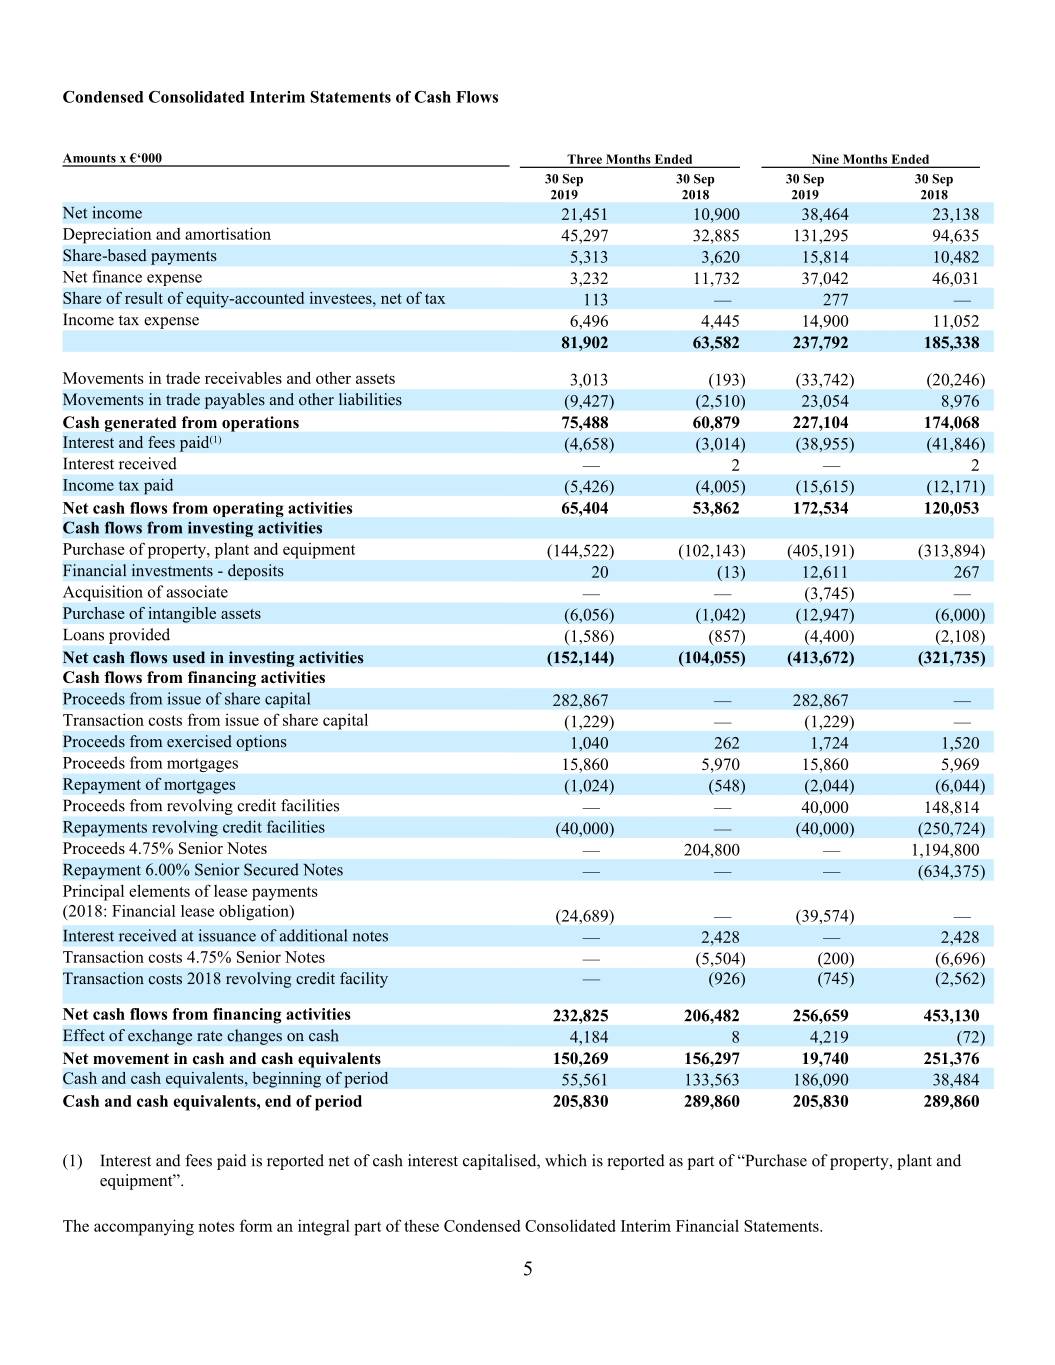
Condensed Consolidated Interim Statements of Cash Flows Amounts x €‘000 Three Months Ended Nine Months Ended 30 Sep 30 Sep 30 Sep 30 Sep 2019 2018 2019 2018 Net income 21,451 10,900 38,464 23,138 Depreciation and amortisation 45,297 32,885 131,295 94,635 Share-based payments 5,313 3,620 15,814 10,482 Net finance expense 3,232 11,732 37,042 46,031 Share of result of equity-accounted investees, net of tax 113 — 277 — Income tax expense 6,496 4,445 14,900 11,052 81,902 63,582 237,792 185,338 Movements in trade receivables and other assets 3,013 (193 ) (33,742 ) (20,246 ) Movements in trade payables and other liabilities (9,427 ) (2,510 ) 23,054 8,976 Cash generated from operations 75,488 60,879 227,104 174,068 Interest and fees paid (1) (4,658 ) (3,014 ) (38,955 ) (41,846 ) Interest received — 2 — 2 Income tax paid (5,426 ) (4,005 ) (15,615 ) (12,171 ) Net cash flows from operating activities 65,404 53,862 172,534 120,053 Cash flows from investing activities Purchase of property, plant and equipment (144,522 ) (102,143 ) (405,191 ) (313,894 ) Financial investments - deposits 20 (13 ) 12,611 267 Acquisition of associate — — (3,745 ) — Purchase of intangible assets (6,056 ) (1,042 ) (12,947 ) (6,000 ) Loans provided (1,586 ) (857 ) (4,400 ) (2,108 ) Net cash flows used in investing activities (152,144 ) (104,055 ) (413,672 ) (321,735 ) Cash flows from financing activities Proceeds from issue of share capital 282,867 — 282,867 — Transaction costs from issue of share capital (1,229 ) — (1,229 ) — Proceeds from exercised options 1,040 262 1,724 1,520 Proceeds from mortgages 15,860 5,970 15,860 5,969 Repayment of mortgages (1,024 ) (548 ) (2,044 ) (6,044 ) Proceeds from revolving credit facilities — — 40,000 148,814 Repayments revolving credit facilities (40,000 ) — (40,000 ) (250,724 ) Proceeds 4.75% Senior Notes — 204,800 — 1,194,800 Repayment 6.00% Senior Secured Notes — — — (634,375 ) Principal elements of lease payments (2018: Financial lease obligation) (24,689 ) — (39,574 ) — Interest received at issuance of additional notes — 2,428 — 2,428 Transaction costs 4.75% Senior Notes — (5,504 ) (200 ) (6,696 ) Transaction costs 2018 revolving credit facility — (926 ) (745 ) (2,562 ) Net cash flows from financing activities 232,825 206,482 256,659 453,130 Effect of exchange rate changes on cash 4,184 8 4,219 (72 ) Net movement in cash and cash equivalents 150,269 156,297 19,740 251,376 Cash and cash equivalents, beginning of period 55,561 133,563 186,090 38,484 Cash and cash equivalents, end of period 205,830 289,860 205,830 289,860 (1) Interest and fees paid is reported net of cash interest capitalised, which is reported as part of “Purchase of property, plant and equipment”. The accompanying notes form an integral part of these Condensed Consolidated Interim Financial Statements. 5
Notes to the Condensed Consolidated Interim Financial Statements 1 The Company Interxion Holding NV (the “Company”) is domiciled in The Netherlands. The address of the Company’s registered office is Scorpius 30, 2132 LR, Hoofddorp, The Netherlands. The Condensed Consolidated Interim Financial Statements of the Company as at and for the three-month and nine-month periods ended 30 September 2019 comprise the Company and its subsidiaries (together referred to as the “Group”). The Group is a leading pan-European operator of carrier neutral Internet data centres. 2 Basis of preparation a) Statement of compliance The Condensed Consolidated Interim Financial Statements have been prepared in accordance with International Financial Reporting Standards (IFRS) IAS 34 Interim Financial Reporting . They do not include all the information required for full annual financial statements, and should be read in conjunction with the audited Consolidated Financial Statements of the Group as at and for the year ended 31 December 2018; these are contained in the 2018 Annual Report (Form 20-F) as filed with the Securities and Exchange Commission on 30 April 2019, which is publicly available on the company’s website – www.interxion.com , or from the SEC website – www.sec.gov . b) Estimates, judgment and seasonality The preparation of the Condensed Consolidated Interim Financial Statements requires management to make judgments, estimates and assumptions that affect the application of accounting policies and the reported amounts of assets and liabilities, income and expense. Actual results may differ from these estimates. The estimates and underlying assumptions are reviewed on an ongoing basis. Revisions to accounting estimates are recognised in the period in which the estimates are revised and in any future periods affected. In preparing these Condensed Consolidated Interim Financial Statements, the significant judgments made by management in applying the Group’s accounting policies and the key sources of estimation uncertainty were the same as those applied to the Consolidated Financial Statements as at and for the year ended 31 December 2018 in the 2018 Annual Report (Form 20-F). The Group’s operations are not significantly exposed to seasonality. 3 Significant accounting policies a) Accounting policies applied The accounting policies applied by the Group in these Condensed Consolidated Interim Financial Statements are similar to those applied by the Group in its Consolidated Financial Statements as at and for the year ended 31 December 2018 in the 2018 Annual Report (Form 20-F), if necessary amended to include new Standards and Interpretations effective as of 1 January 2019. In addition to the accounting policies applied in its 2018 Annual Report, the Group applies IAS 28 – Investments in Associates and Joint Ventures since it made an investment in an equity-accounted associate. An associate is an entity in which the Group has significant influence, but no control or joint control over the financial and operational policies. Interests in associates are accounted for using the equity method. They are initially recognised at cost, which includes transaction costs. Subsequent to initial recognition, the consolidated financial statements include the Group’s share of the profit or loss and Other comprehensive income of equity-accounted investees, until the date on which significant influence or joint control ceases. The Group adopted IFRS 16 retrospectively from 1 January 2019, but has not restated comparatives for the 2018 reporting period, as permitted under the specific transitional provisions in the standard. The reclassifications and the adjustments arising from the new leasing rules are therefore recognised in the opening balance sheet on 1 January 2019. b) Adjustments recognised on adoption of IFRS 16 On adoption of IFRS 16, the Group recognised lease liabilities in relation to leases which had previously been classified as ‘operating leases’ under the principles of IAS 17 Leases. These liabilities were measured at the present value of the remaining lease payments, discounted using the lessee’s incremental borrowing rate as of 1 January 2019. The weighted average lessee’s incremental borrowing rate applied to the lease liabilities on 1 January 2019 was 2.9%. 6
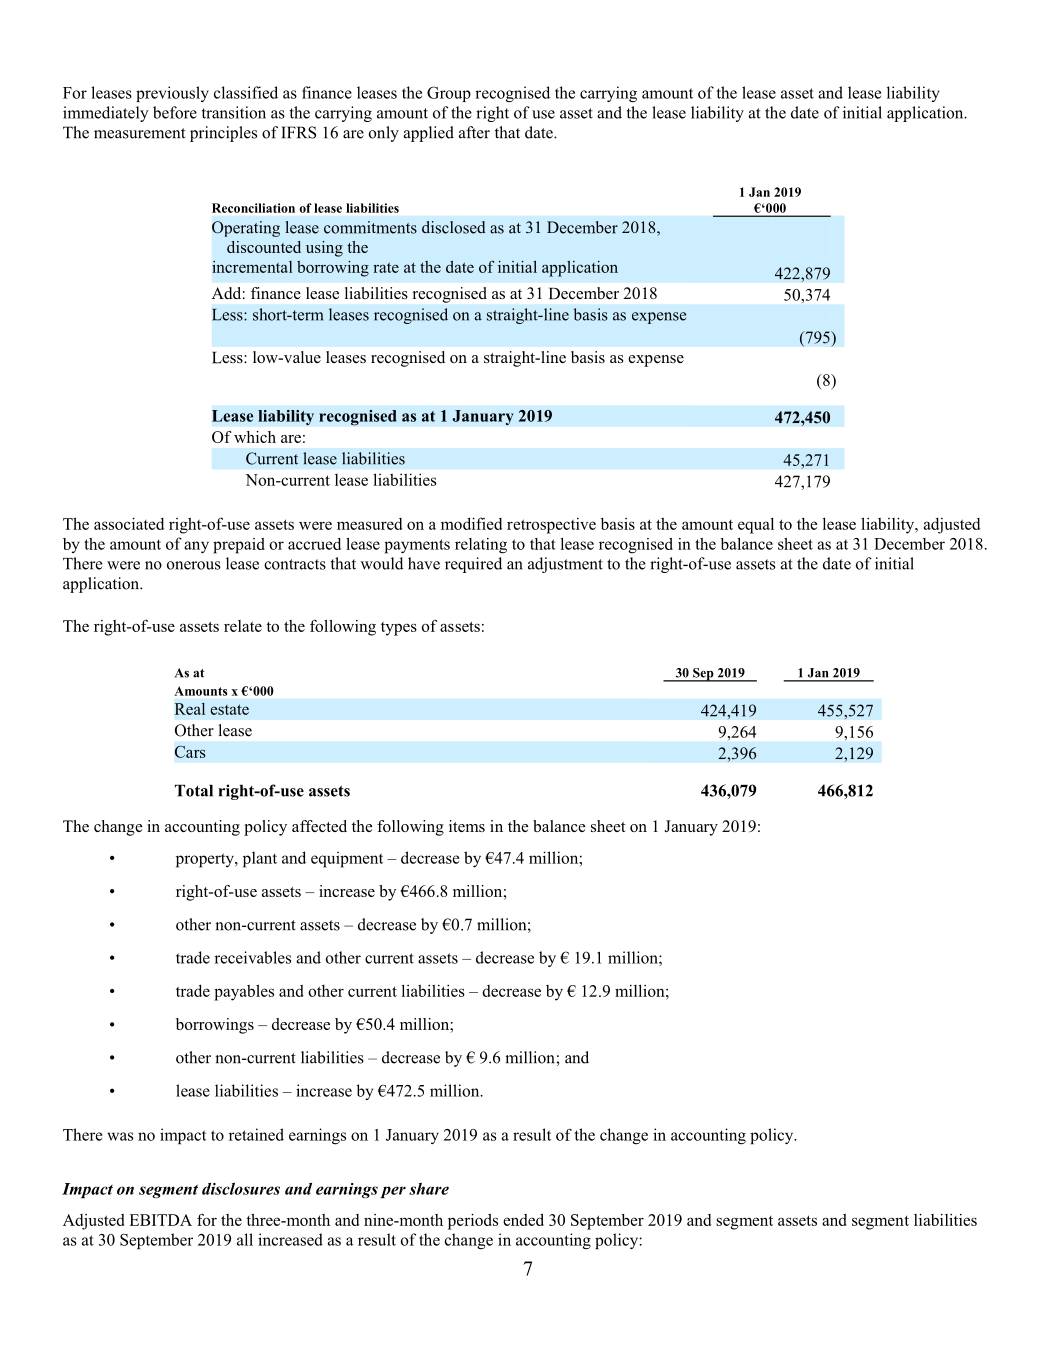
For leases previously classified as finance leases the Group recognised the carrying amount of the lease asset and lease liability immediately before transition as the carrying amount of the right of use asset and the lease liability at the date of initial application. The measurement principles of IFRS 16 are only applied after that date. 1 Jan 2019 Reconciliation of lease liabilities €‘000 Operating lease commitments disclosed as at 31 December 2018, discounted using the incremental borrowing rate at the date of initial application 422,879 Add: finance lease liabilities recognised as at 31 December 2018 50,374 Less: short-term leases recognised on a straight-line basis as expense (795 ) Less: low-value leases recognised on a straight-line basis as expense (8 ) Lease liability recognised as at 1 January 2019 472,450 Of which are: Current lease liabilities 45,271 Non-current lease liabilities 427,179 The associated right-of-use assets were measured on a modified retrospective basis at the amount equal to the lease liability, adjusted by the amount of any prepaid or accrued lease payments relating to that lease recognised in the balance sheet as at 31 December 2018. There were no onerous lease contracts that would have required an adjustment to the right-of-use assets at the date of initial application. The right-of-use assets relate to the following types of assets: As at 30 Sep 2019 1 Jan 2019 Amounts x €‘000 Real estate 424,419 455,527 Other lease 9,264 9,156 Cars 2,396 2,129 Total right-of-use assets 436,079 466,812 The change in accounting policy affected the following items in the balance sheet on 1 January 2019: • property, plant and equipment – decrease by €47.4 million; • right-of-use assets – increase by €466.8 million; • other non-current assets – decrease by €0.7 million; • trade receivables and other current assets – decrease by € 19.1 million; • trade payables and other current liabilities – decrease by € 12.9 million; • borrowings – decrease by €50.4 million; • other non-current liabilities – decrease by € 9.6 million; and • lease liabilities – increase by €472.5 million. There was no impact to retained earnings on 1 January 2019 as a result of the change in accounting policy. Impact on segment disclosures and earnings per share Adjusted EBITDA for the three-month and nine-month periods ended 30 September 2019 and segment assets and segment liabilities as at 30 September 2019 all increased as a result of the change in accounting policy: 7
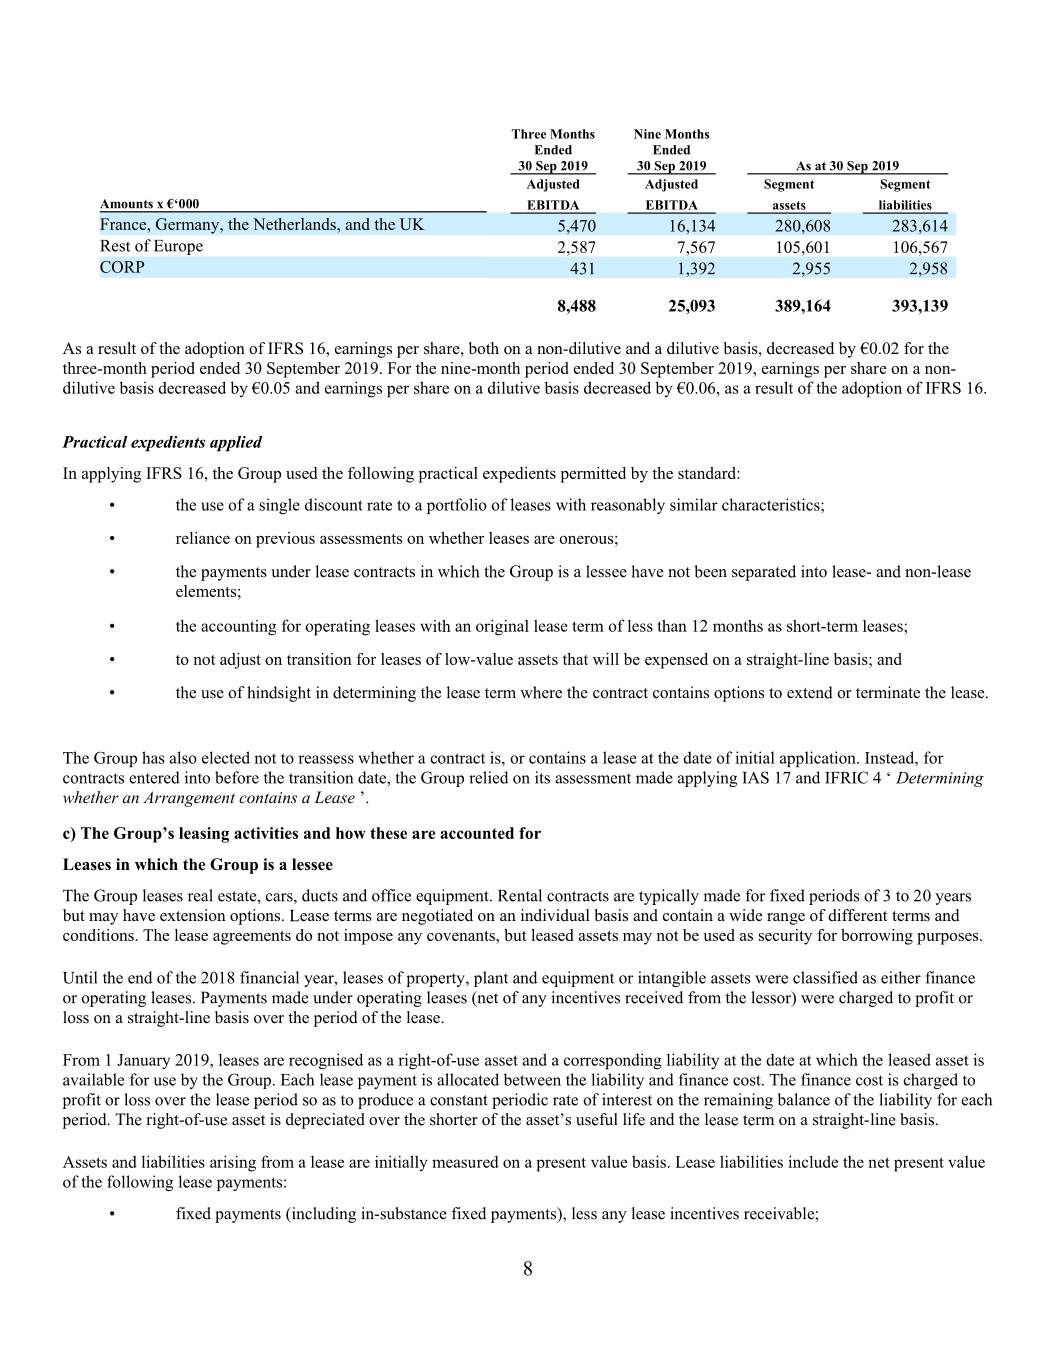
Three Months Nine Months Ended Ended 30 Sep 2019 30 Sep 2019 As at 30 Sep 2019 Adjusted Adjusted Segment Segment Amounts x €‘000 EBITDA EBITDA assets liabilities France, Germany, the Netherlands, and the UK 5,470 16,134 280,608 283,614 Rest of Europe 2,587 7,567 105,601 106,567 CORP 431 1,392 2,955 2,958 8,488 25,093 389,164 393,139 As a result of the adoption of IFRS 16, earnings per share, both on a non-dilutive and a dilutive basis, decreased by €0.02 for the three-month period ended 30 September 2019. For the nine-month period ended 30 September 2019, earnings per share on a non- dilutive basis decreased by €0.05 and earnings per share on a dilutive basis decreased by €0.06, as a result of the adoption of IFRS 16. Practical expedients applied In applying IFRS 16, the Group used the following practical expedients permitted by the standard: • the use of a single discount rate to a portfolio of leases with reasonably similar characteristics; • reliance on previous assessments on whether leases are onerous; • the payments under lease contracts in which the Group is a lessee have not been separated into lease- and non-lease elements; • the accounting for operating leases with an original lease term of less than 12 months as short-term leases; • to not adjust on transition for leases of low-value assets that will be expensed on a straight-line basis; and • the use of hindsight in determining the lease term where the contract contains options to extend or terminate the lease. The Group has also elected not to reassess whether a contract is, or contains a lease at the date of initial application. Instead, for contracts entered into before the transition date, the Group relied on its assessment made applying IAS 17 and IFRIC 4 ‘ Determining whether an Arrangement contains a Lease ’. c) The Group’s leasing activities and how these are accounted for Leases in which the Group is a lessee The Group leases real estate, cars, ducts and office equipment. Rental contracts are typically made for fixed periods of 3 to 20 years but may have extension options. Lease terms are negotiated on an individual basis and contain a wide range of different terms and conditions. The lease agreements do not impose any covenants, but leased assets may not be used as security for borrowing purposes. Until the end of the 2018 financial year, leases of property, plant and equipment or intangible assets were classified as either finance or operating leases. Payments made under operating leases (net of any incentives received from the lessor) were charged to profit or loss on a straight-line basis over the period of the lease. From 1 January 2019, leases are recognised as a right-of-use asset and a corresponding liability at the date at which the leased asset is available for use by the Group. Each lease payment is allocated between the liability and finance cost. The finance cost is charged to profit or loss over the lease period so as to produce a constant periodic rate of interest on the remaining balance of the liability for each period. The right-of-use asset is depreciated over the shorter of the asset’s useful life and the lease term on a straight-line basis. Assets and liabilities arising from a lease are initially measured on a present value basis. Lease liabilities include the net present value of the following lease payments: • fixed payments (including in-substance fixed payments), less any lease incentives receivable; 8
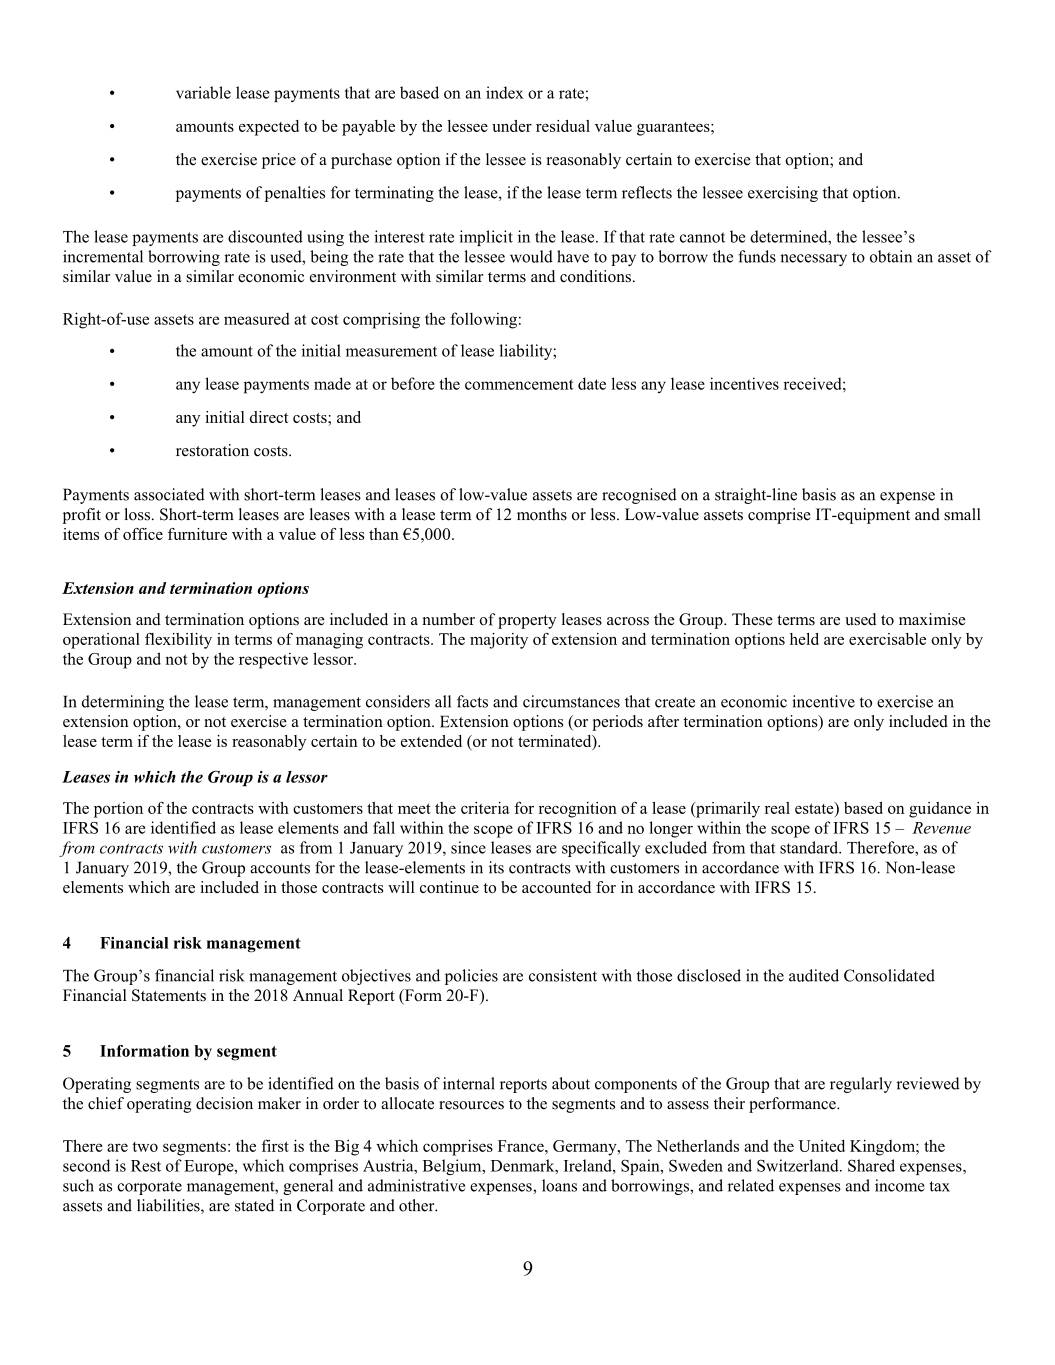
• variable lease payments that are based on an index or a rate; • amounts expected to be payable by the lessee under residual value guarantees; • the exercise price of a purchase option if the lessee is reasonably certain to exercise that option; and • payments of penalties for terminating the lease, if the lease term reflects the lessee exercising that option. The lease payments are discounted using the interest rate implicit in the lease. If that rate cannot be determined, the lessee’s incremental borrowing rate is used, being the rate that the lessee would have to pay to borrow the funds necessary to obtain an asset of similar value in a similar economic environment with similar terms and conditions. Right-of-use assets are measured at cost comprising the following: • the amount of the initial measurement of lease liability; • any lease payments made at or before the commencement date less any lease incentives received; • any initial direct costs; and • restoration costs. Payments associated with short-term leases and leases of low-value assets are recognised on a straight-line basis as an expense in profit or loss. Short-term leases are leases with a lease term of 12 months or less. Low-value assets comprise IT-equipment and small items of office furniture with a value of less than €5,000. Extension and termination options Extension and termination options are included in a number of property leases across the Group. These terms are used to maximise operational flexibility in terms of managing contracts. The majority of extension and termination options held are exercisable only by the Group and not by the respective lessor. In determining the lease term, management considers all facts and circumstances that create an economic incentive to exercise an extension option, or not exercise a termination option. Extension options (or periods after termination options) are only included in the lease term if the lease is reasonably certain to be extended (or not terminated). Leases in which the Group is a lessor The portion of the contracts with customers that meet the criteria for recognition of a lease (primarily real estate) based on guidance in IFRS 16 are identified as lease elements and fall within the scope of IFRS 16 and no longer within the scope of IFRS 15 – Revenue from contracts with customers as from 1 January 2019, since leases are specifically excluded from that standard. Therefore, as of 1 January 2019, the Group accounts for the lease-elements in its contracts with customers in accordance with IFRS 16. Non-lease elements which are included in those contracts will continue to be accounted for in accordance with IFRS 15. 4 Financial risk management The Group’s financial risk management objectives and policies are consistent with those disclosed in the audited Consolidated Financial Statements in the 2018 Annual Report (Form 20-F). 5 Information by segment Operating segments are to be identified on the basis of internal reports about components of the Group that are regularly reviewed by the chief operating decision maker in order to allocate resources to the segments and to assess their performance. There are two segments: the first is the Big 4 which comprises France, Germany, The Netherlands and the United Kingdom; the second is Rest of Europe, which comprises Austria, Belgium, Denmark, Ireland, Spain, Sweden and Switzerland. Shared expenses, such as corporate management, general and administrative expenses, loans and borrowings, and related expenses and income tax assets and liabilities, are stated in Corporate and other. 9
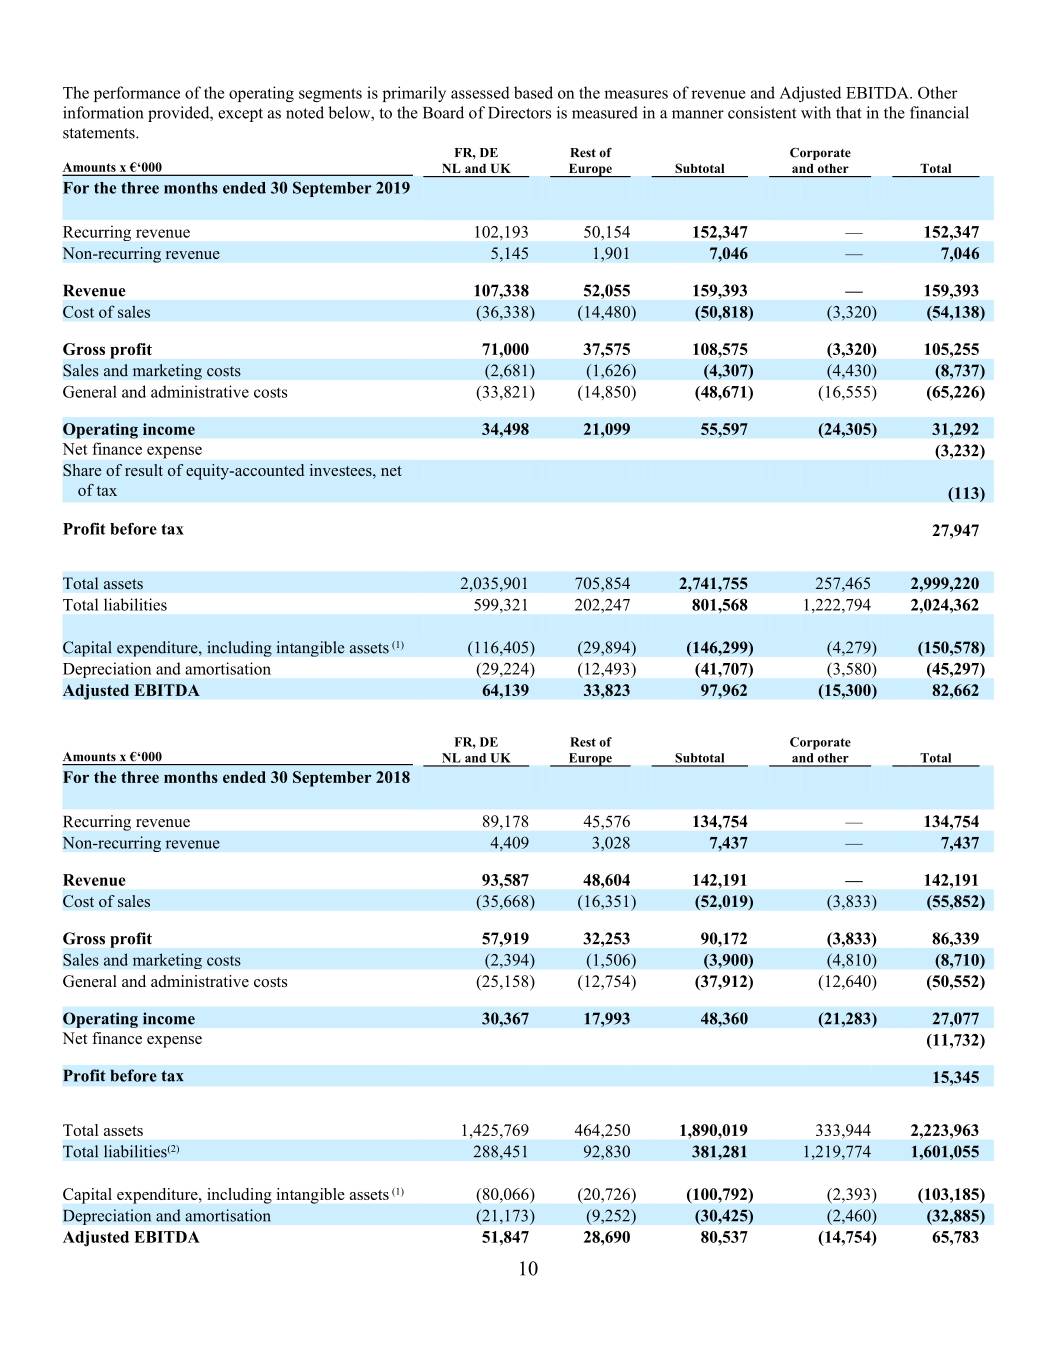
The performance of the operating segments is primarily assessed based on the measures of revenue and Adjusted EBITDA. Other information provided, except as noted below, to the Board of Directors is measured in a manner consistent with that in the financial statements. FR, DE Rest of Corporate Amounts x €‘000 NL and UK Europe Subtotal and other Total For the three months ended 30 September 2019 Recurring revenue 102,193 50,154 152,347 — 152,347 Non -recurring revenue 5,145 1,901 7,046 — 7,046 Revenue 107,338 52,055 159,393 — 159,393 Cost of sales (36,338 ) (14,480 ) (50,818 ) (3,320 ) (54,138 ) Gross profit 71,000 37,575 108,575 (3,320) 105,255 Sales and marketing costs (2,681 ) (1,626 ) (4,307 ) (4,430 ) (8,737 ) General and administrative costs (33,821 ) (14,850 ) (48,671) (16,555 ) (65,226 ) Operating income 34,498 21,099 55,597 (24,305 ) 31,292 Net finance expense (3,232 ) Share of result of equity-accounted investees, net of tax (113 ) Profit before tax 27,947 Total assets 2,035,901 705,854 2,741,755 257,465 2,999,220 Total liabilities 599,321 202,247 801,568 1,222,794 2,024,362 Capital expenditure, including intangible assets (1) (116,405 ) (29,894 ) (146,299 ) (4,279 ) (150,578 ) Depreciation and amortisation (29,224 ) (12,493 ) (41,707) (3,580 ) (45,297 ) Adjusted EBITDA 64,139 33,823 97,962 (15,300 ) 82,662 FR, DE Rest of Corporate Amounts x €‘000 NL and UK Europe Subtotal and other Total For the three months ended 30 September 2018 Recurring revenue 89,178 45,576 134,754 — 134,754 Non -recurring revenue 4,409 3,028 7,437 — 7,437 Revenue 93,587 48,604 142,191 — 142,191 Cost of sales (35,668 ) (16,351 ) (52,019 ) (3,833 ) (55,852 ) Gross profit 57,919 32,253 90,172 (3,833) 86,339 Sales and marketing costs (2,394 ) (1,506 ) (3,900 ) (4,810 ) (8,710 ) General and administrative costs (25,158 ) (12,754 ) (37,912) (12,640 ) (50,552 ) Operating income 30,367 17,993 48,360 (21,283 ) 27,077 Net finance expense (11,732 ) Profit before tax 15,345 Total assets 1,425,769 464,250 1,890,019 333,944 2,223,963 Total liabilities (2) 288,451 92,830 381,281 1,219,774 1,601,055 Capital expenditure, including intangible assets (1) (80,066 ) (20,726 ) (100,792) (2,393 ) (103,185 ) Depreciation and amortisation (21,173 ) (9,252 ) (30,425 ) (2,460 ) (32,885 ) Adjusted EBITDA 51,847 28,690 80,537 (14,754) 65,783 10
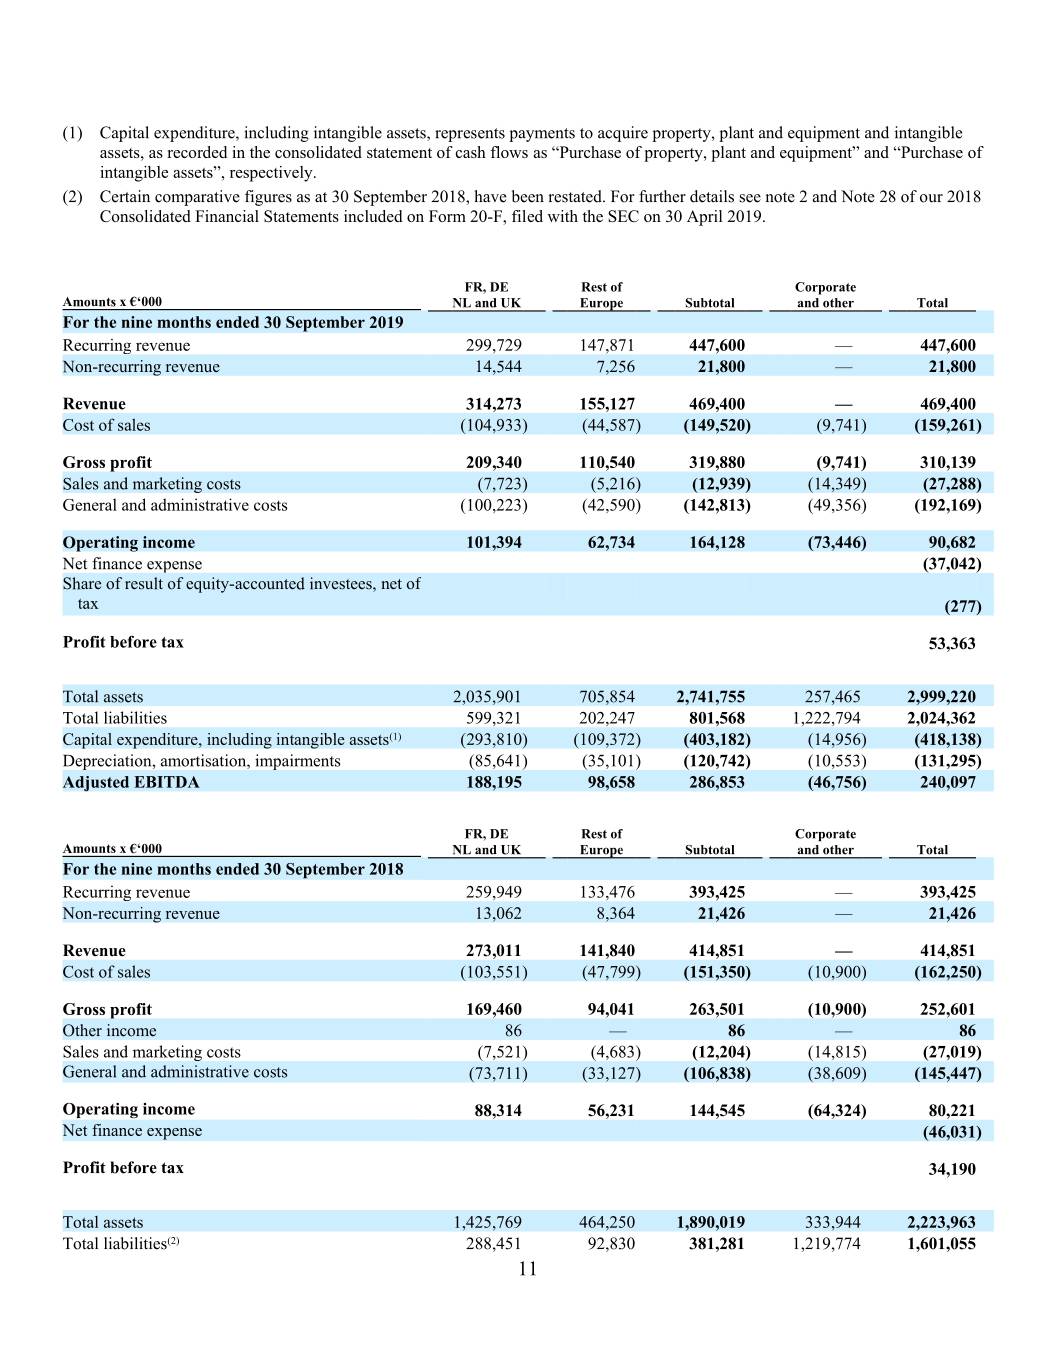
(1) Capital expenditure, including intangible assets, represents payments to acquire property, plant and equipment and intangible assets, as recorded in the consolidated statement of cash flows as “Purchase of property, plant and equipment” and “Purchase of intangible assets”, respectively. (2) Certain comparative figures as at 30 September 2018, have been restated. For further details see note 2 and Note 28 of our 2018 Consolidated Financial Statements included on Form 20-F, filed with the SEC on 30 April 2019. FR, DE Rest of Corporate Amounts x €‘000 NL and UK Europe Subtotal and other Total For the nine months ended 30 September 2019 Recurring revenue 299,729 147,871 447,600 — 447,600 Non -recurring revenue 14,544 7,256 21,800 — 21,800 Revenue 314,273 155,127 469,400 — 469,400 Cost of sales (104,933 ) (44,587 ) (149,520 ) (9,741 ) (159,261 ) Gross profit 209,340 110,540 319,880 (9,741) 310,139 Sales and marketing costs (7,723 ) (5,216 ) (12,939 ) (14,349 ) (27,288 ) General and administrative costs (100,223 ) (42,590 ) (142,813) (49,356 ) (192,169) Operating income 101,394 62,734 164,128 (73,446 ) 90,682 Net finance expense (37,042) Share of result of equity-accounted investees, net of tax (277 ) Profit before tax 53,363 Total assets 2,035,901 705,854 2,741,755 257,465 2,999,220 Total liabilities 599,321 202,247 801,568 1,222,794 2,024,362 Capital expenditure, including intangible assets (1) (293,810 ) (109,372 ) (403,182 ) (14,956 ) (418,138 ) Depreciation, amortisation, impairments (85,641 ) (35,101 ) (120,742) (10,553 ) (131,295) Adjusted EBITDA 188,195 98,658 286,853 (46,756 ) 240,097 FR, DE Rest of Corporate Amounts x €‘000 NL and UK Europe Subtotal and other Total For the nine months ended 30 September 2018 Recurring revenue 259,949 133,476 393,425 — 393,425 Non -recurring revenue 13,062 8,364 21,426 — 21,426 Revenue 273,011 141,840 414,851 — 414,851 Cost of sales (103,551 ) (47,799 ) (151,350 ) (10,900 ) (162,250 ) Gross profit 169,460 94,041 263,501 (10,900) 252,601 Other income 86 — 86 — 86 Sales and marketing costs (7,521 ) (4,683 ) (12,204) (14,815 ) (27,019) General and administrative costs (73,711 ) (33,127 ) (106,838 ) (38,609 ) (145,447 ) Operating income 88,314 56,231 144,545 (64,324) 80,221 Net finance expense (46,031 ) Profit before tax 34,190 Total assets 1,425,769 464,250 1,890,019 333,944 2,223,963 Total liabilities (2) 288,451 92,830 381,281 1,219,774 1,601,055 11
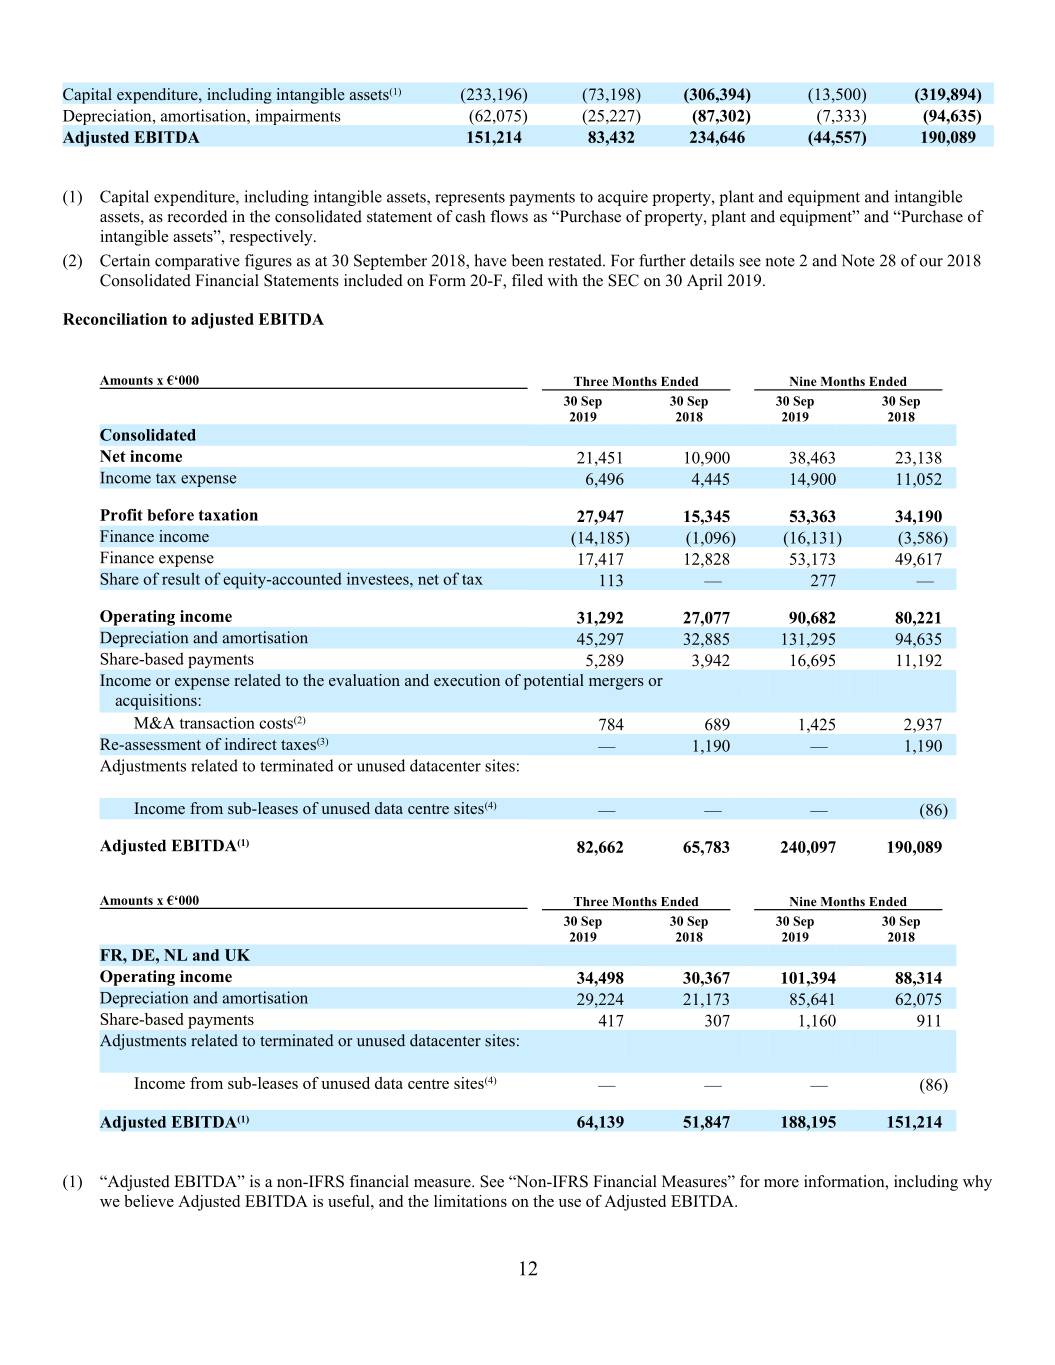
Capital expenditure, including intangible assets (1) (233,196 ) (73,198 ) (306,394 ) (13,500 ) (319,894 ) Depreciation, amortisation, impairments (62,075 ) (25,227 ) (87,302) (7,333 ) (94,635) Adjusted EBITDA 151,214 83,432 234,646 (44,557 ) 190,089 (1) Capital expenditure, including intangible assets, represents payments to acquire property, plant and equipment and intangible assets, as recorded in the consolidated statement of cash flows as “Purchase of property, plant and equipment” and “Purchase of intangible assets”, respectively. (2) Certain comparative figures as at 30 September 2018, have been restated. For further details see note 2 and Note 28 of our 2018 Consolidated Financial Statements included on Form 20-F, filed with the SEC on 30 April 2019. Reconciliation to adjusted EBITDA Amounts x €‘000 Three Months Ended Nine Months Ended 30 Sep 30 Sep 30 Sep 30 Sep 2019 2018 2019 2018 Consolidated Net income 21,451 10,900 38,463 23,138 Income tax expense 6,496 4,445 14,900 11,052 Profit before taxation 27,947 15,345 53,363 34,190 Finance income (14,185 ) (1,096 ) (16,131 ) (3,586 ) Finance expense 17,417 12,828 53,173 49,617 Share of result of equity-accounted investees, net of tax 113 — 277 — Operating income 31,292 27,077 90,682 80,221 Depreciation and amortisation 45,297 32,885 131,295 94,635 Share-based payments 5,289 3,942 16,695 11,192 Income or expense related to the evaluation and execution of potential mergers or acquisitions: M&A transaction costs (2) 784 689 1,425 2,937 Re-assessment of indirect taxes (3) — 1,190 — 1,190 Adjustments related to terminated or unused datacenter sites: Income from sub-leases of unused data centre sites (4) — — — (86 ) Adjusted EBITDA (1) 82,662 65,783 240,097 190,089 Amounts x €‘000 Three Months Ended Nine Months Ended 30 Sep 30 Sep 30 Sep 30 Sep 2019 2018 2019 2018 FR, DE, NL and UK Operating income 34,498 30,367 101,394 88,314 Depreciation and amortisation 29,224 21,173 85,641 62,075 Share-based payments 417 307 1,160 911 Adjustments related to terminated or unused datacenter sites: Income from sub-leases of unused data centre sites (4) — — — (86 ) Adjusted EBITDA (1) 64,139 51,847 188,195 151,214 (1) “Adjusted EBITDA” is a non-IFRS financial measure. See “Non-IFRS Financial Measures” for more information, including why we believe Adjusted EBITDA is useful, and the limitations on the use of Adjusted EBITDA. 12
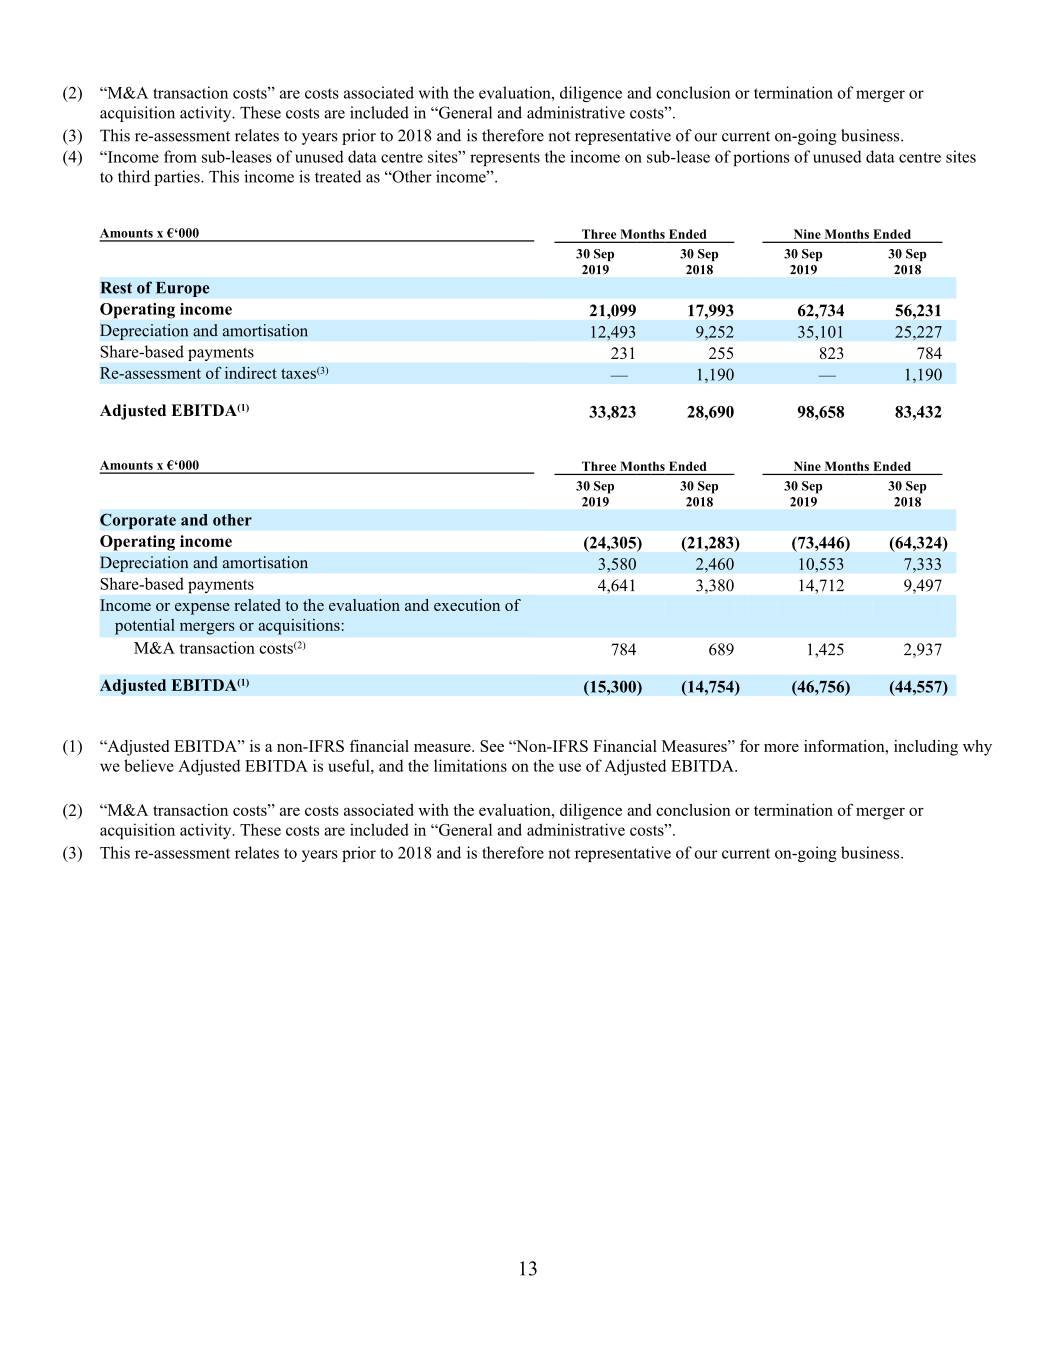
(2) “M&A transaction costs” are costs associated with the evaluation, diligence and conclusion or termination of merger or acquisition activity. These costs are included in “General and administrative costs”. (3) This re-assessment relates to years prior to 2018 and is therefore not representative of our current on-going business. (4) “Income from sub-leases of unused data centre sites” represents the income on sub-lease of portions of unused data centre sites to third parties. This income is treated as “Other income”. Amounts x €‘000 Three Months Ended Nine Months Ended 30 Sep 30 Sep 30 Sep 30 Sep 2019 2018 2019 2018 Rest of Europe Operating income 21,099 17,993 62,734 56,231 Depreciation and amortisation 12,493 9,252 35,101 25,227 Share-based payments 231 255 823 784 Re-assessment of indirect taxes (3) — 1,190 — 1,190 Adjusted EBITDA (1) 33,823 28,690 98,658 83,432 Amounts x €‘000 Three Months Ended Nine Months Ended 30 Sep 30 Sep 30 Sep 30 Sep 2019 2018 2019 2018 Corporate and other Operating income (24,305) (21,283) (73,446) (64,324) Depreciation and amortisation 3,580 2,460 10,553 7,333 Share-based payments 4,641 3,380 14,712 9,497 Income or expense related to the evaluation and execution of potential mergers or acquisitions: M&A transaction costs (2) 784 689 1,425 2,937 Adjusted EBITDA (1) (15,300 ) (14,754 ) (46,756 ) (44,557 ) (1) “Adjusted EBITDA” is a non-IFRS financial measure. See “Non-IFRS Financial Measures” for more information, including why we believe Adjusted EBITDA is useful, and the limitations on the use of Adjusted EBITDA. (2) “M&A transaction costs” are costs associated with the evaluation, diligence and conclusion or termination of merger or acquisition activity. These costs are included in “General and administrative costs”. (3) This re-assessment relates to years prior to 2018 and is therefore not representative of our current on-going business. 13
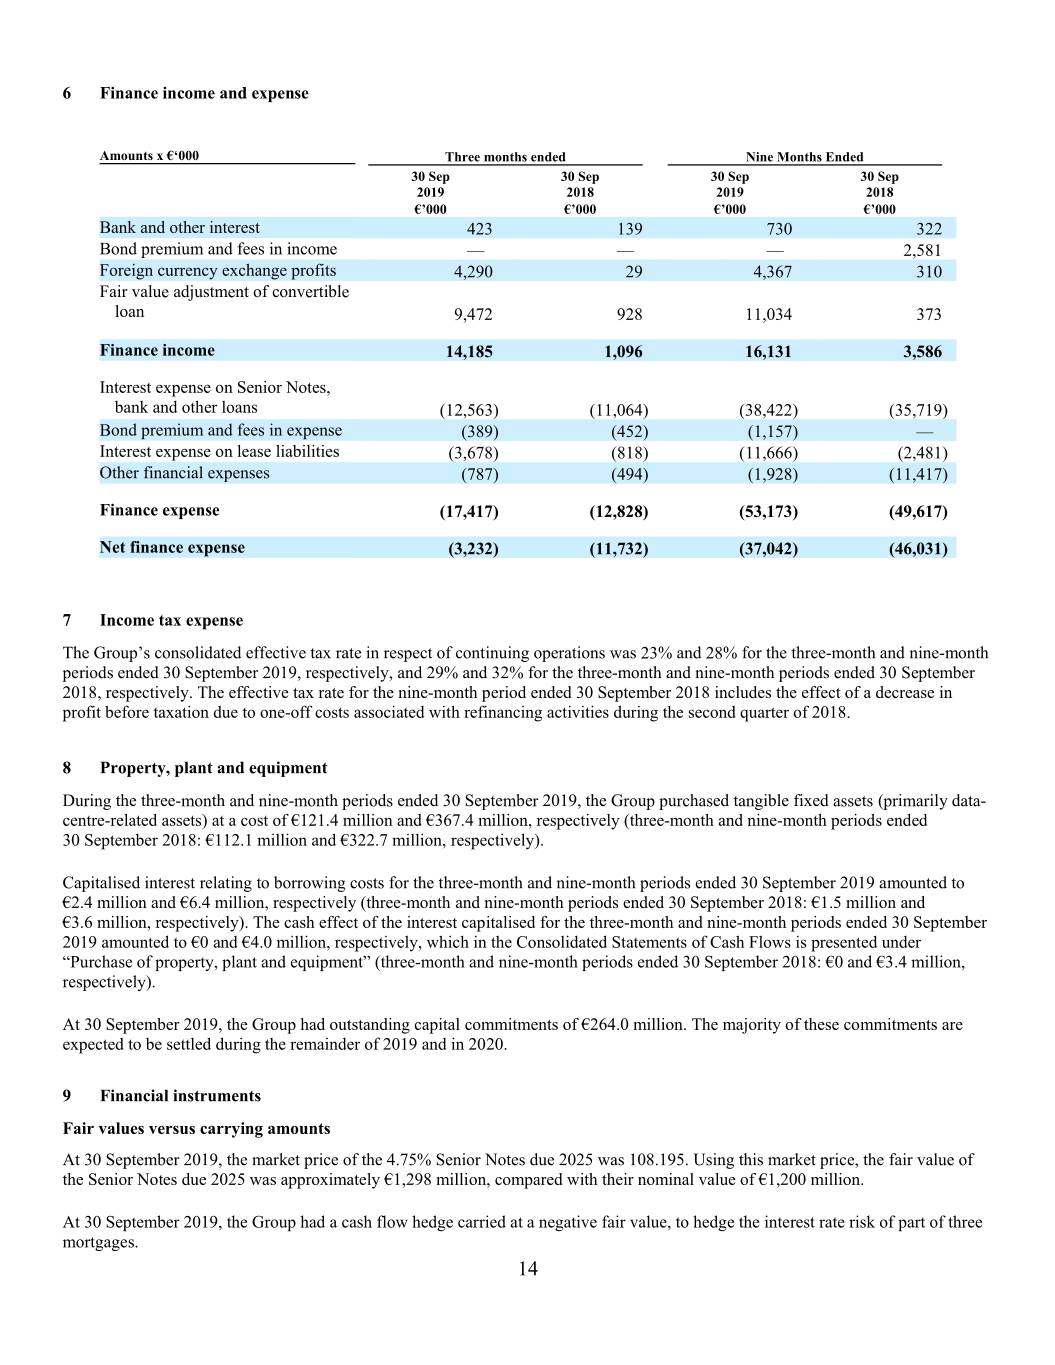
6 Finance income and expense Amounts x €‘000 Three months ended Nine Months Ended 30 Sep 30 Sep 30 Sep 30 Sep 2019 2018 2019 2018 €’000 €’000 €’000 €’000 Bank and other interest 423 139 730 322 Bond premium and fees in income — — — 2,581 Foreign currency exchange profits 4,290 29 4,367 310 Fair value adjustment of convertible loan 9,472 928 11,034 373 Finance income 14,185 1,096 16,131 3,586 Interest expense on Senior Notes, bank and other loans (12,563 ) (11,064 ) (38,422 ) (35,719 ) Bond premium and fees in expense (389 ) (452 ) (1,157 ) — Interest expense on lease liabilities (3,678 ) (818 ) (11,666 ) (2,481 ) Other financial expenses (787 ) (494 ) (1,928 ) (11,417 ) Finance expense (17,417 ) (12,828) (53,173 ) (49,617) Net finance expense (3,232 ) (11,732 ) (37,042 ) (46,031 ) 7 Income tax expense The Group’s consolidated effective tax rate in respect of continuing operations was 23% and 28% for the three-month and nine-month periods ended 30 September 2019, respectively, and 29% and 32% for the three-month and nine-month periods ended 30 September 2018, respectively. The effective tax rate for the nine-month period ended 30 September 2018 includes the effect of a decrease in profit before taxation due to one-off costs associated with refinancing activities during the second quarter of 2018. 8 Property, plant and equipment During the three-month and nine-month periods ended 30 September 2019, the Group purchased tangible fixed assets (primarily data- centre-related assets) at a cost of €121.4 million and €367.4 million, respectively (three-month and nine-month periods ended 30 September 2018: €112.1 million and €322.7 million, respectively). Capitalised interest relating to borrowing costs for the three-month and nine-month periods ended 30 September 2019 amounted to €2.4 million and €6.4 million, respectively (three-month and nine-month periods ended 30 September 2018: €1.5 million and €3.6 million, respectively). The cash effect of the interest capitalised for the three-month and nine-month periods ended 30 September 2019 amounted to €0 and €4.0 million, respectively, which in the Consolidated Statements of Cash Flows is presented under “Purchase of property, plant and equipment” (three-month and nine-month periods ended 30 September 2018: €0 and €3.4 million, respectively). At 30 September 2019, the Group had outstanding capital commitments of €264.0 million. The majority of these commitments are expected to be settled during the remainder of 2019 and in 2020. 9 Financial instruments Fair values versus carrying amounts At 30 September 2019, the market price of the 4.75% Senior Notes due 2025 was 108.195. Using this market price, the fair value of the Senior Notes due 2025 was approximately €1,298 million, compared with their nominal value of €1,200 million. At 30 September 2019, the Group had a cash flow hedge carried at a negative fair value, to hedge the interest rate risk of part of three mortgages. 14
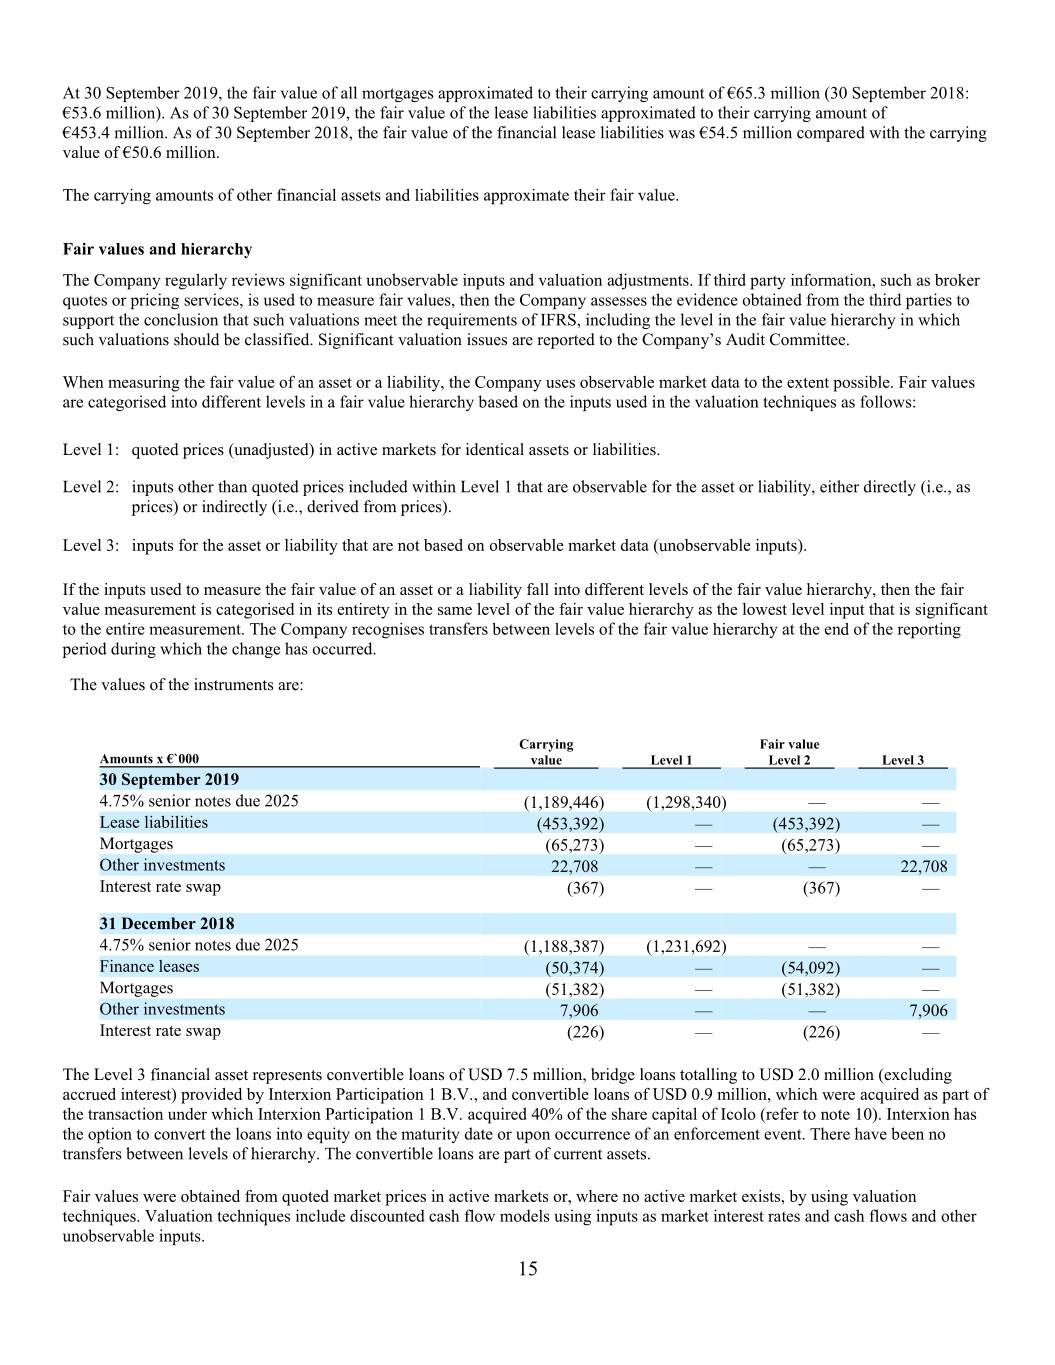
At 30 September 2019, the fair value of all mortgages approximated to their carrying amount of €65.3 million (30 September 2018: €53.6 million). As of 30 September 2019, the fair value of the lease liabilities approximated to their carrying amount of €453.4 million. As of 30 September 2018, the fair value of the financial lease liabilities was €54.5 million compared with the carrying value of €50.6 million. The carrying amounts of other financial assets and liabilities approximate their fair value. Fair values and hierarchy The Company regularly reviews significant unobservable inputs and valuation adjustments. If third party information, such as broker quotes or pricing services, is used to measure fair values, then the Company assesses the evidence obtained from the third parties to support the conclusion that such valuations meet the requirements of IFRS, including the level in the fair value hierarchy in which such valuations should be classified. Significant valuation issues are reported to the Company’s Audit Committee. When measuring the fair value of an asset or a liability, the Company uses observable market data to the extent possible. Fair values are categorised into different levels in a fair value hierarchy based on the inputs used in the valuation techniques as follows: Level 1: quoted prices (unadjusted) in active markets for identical assets or liabilities. Level 2: inputs other than quoted prices included within Level 1 that are observable for the asset or liability, either directly (i.e., as prices) or indirectly (i.e., derived from prices). Level 3: inputs for the asset or liability that are not based on observable market data (unobservable inputs). If the inputs used to measure the fair value of an asset or a liability fall into different levels of the fair value hierarchy, then the fair value measurement is categorised in its entirety in the same level of the fair value hierarchy as the lowest level input that is significant to the entire measurement. The Company recognises transfers between levels of the fair value hierarchy at the end of the reporting period during which the change has occurred. The values of the instruments are: Carrying Fair value Amounts x €`000 value Level 1 Level 2 Level 3 30 September 2019 4.75% senior notes due 2025 (1,189,446 ) (1,298,340 ) — — Lease liabilities (453,392 ) — (453,392 ) — Mortgages (65,273 ) — (65,273 ) — Other investments 22,708 — — 22,708 Interest rate swap (367 ) — (367 ) — 31 December 2018 4.75% senior notes due 2025 (1,188,387 ) (1,231,692 ) — — Finance leases (50,374 ) — (54,092 ) — Mortgages (51,382 ) — (51,382 ) — Other investments 7,906 — — 7,906 Interest rate swap (226 ) — (226 ) — The Level 3 financial asset represents convertible loans of USD 7.5 million, bridge loans totalling to USD 2.0 million (excluding accrued interest) provided by Interxion Participation 1 B.V., and convertible loans of USD 0.9 million, which were acquired as part of the transaction under which Interxion Participation 1 B.V. acquired 40% of the share capital of Icolo (refer to note 10). Interxion has the option to convert the loans into equity on the maturity date or upon occurrence of an enforcement event. There have been no transfers between levels of hierarchy. The convertible loans are part of current assets. Fair values were obtained from quoted market prices in active markets or, where no active market exists, by using valuation techniques. Valuation techniques include discounted cash flow models using inputs as market interest rates and cash flows and other unobservable inputs. 15
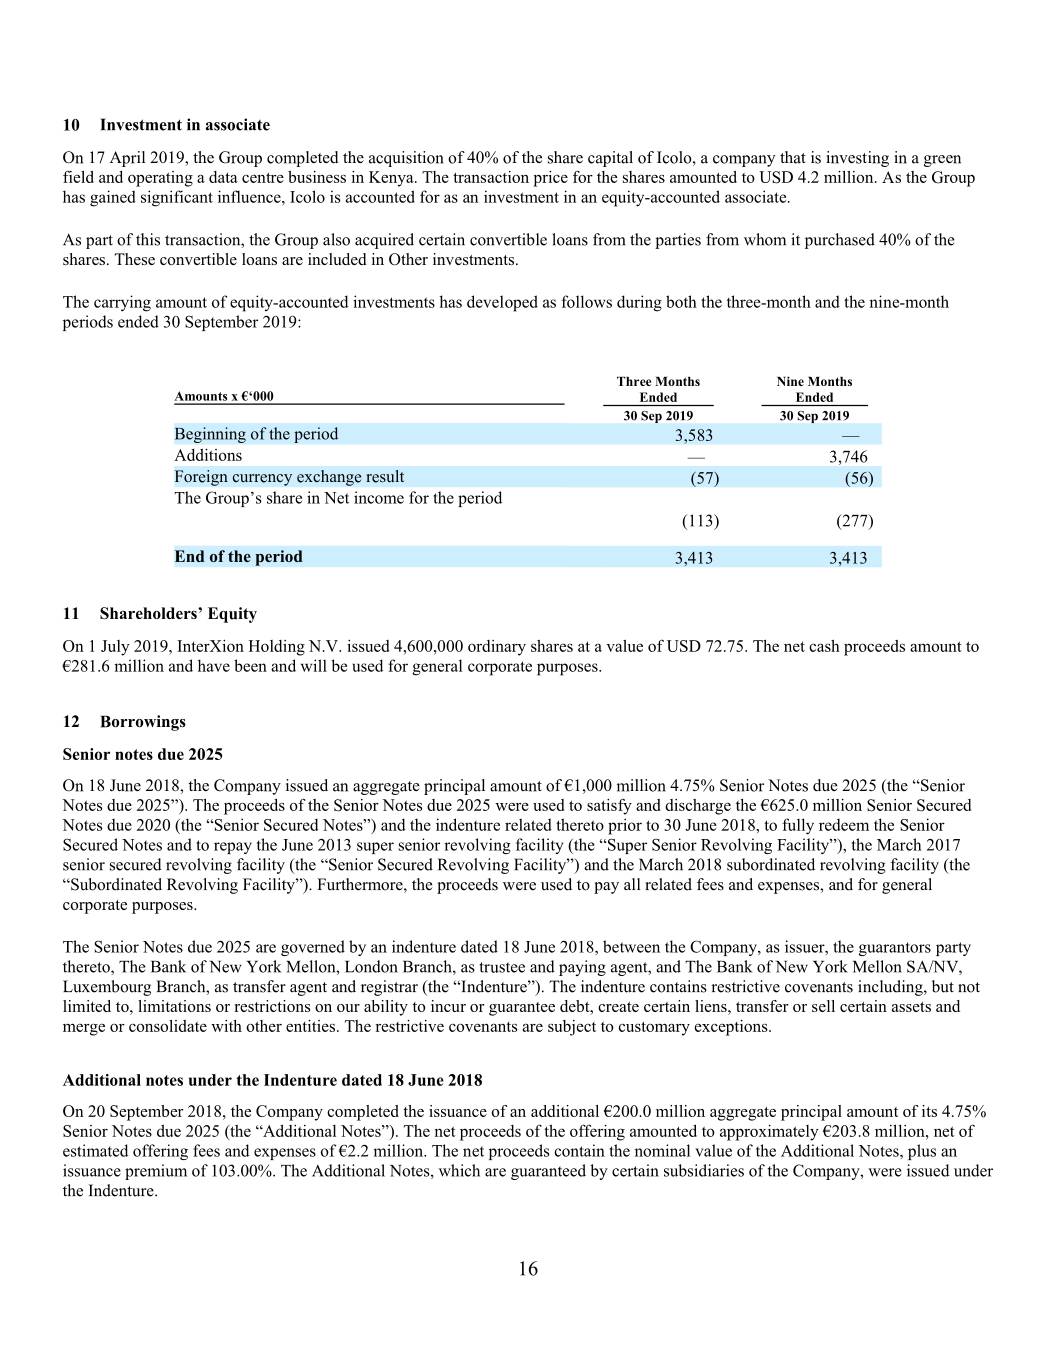
10 Investment in associate On 17 April 2019, the Group completed the acquisition of 40% of the share capital of Icolo, a company that is investing in a green field and operating a data centre business in Kenya. The transaction price for the shares amounted to USD 4.2 million. As the Group has gained significant influence, Icolo is accounted for as an investment in an equity-accounted associate. As part of this transaction, the Group also acquired certain convertible loans from the parties from whom it purchased 40% of the shares. These convertible loans are included in Other investments. The carrying amount of equity-accounted investments has developed as follows during both the three-month and the nine-month periods ended 30 September 2019: Three Months Nine Months Amounts x €‘000 Ended Ended 30 Sep 2019 30 Sep 2019 Beginning of the period 3,583 — Additions — 3,746 Foreign currency exchange result (57 ) (56 ) The Group’s share in Net income for the period (113 ) (277 ) End of the period 3,413 3,413 11 Shareholders’ Equity On 1 July 2019, InterXion Holding N.V. issued 4,600,000 ordinary shares at a value of USD 72.75. The net cash proceeds amount to €281.6 million and have been and will be used for general corporate purposes. 12 Borrowings Senior notes due 2025 On 18 June 2018, the Company issued an aggregate principal amount of €1,000 million 4.75% Senior Notes due 2025 (the “Senior Notes due 2025”). The proceeds of the Senior Notes due 2025 were used to satisfy and discharge the €625.0 million Senior Secured Notes due 2020 (the “Senior Secured Notes”) and the indenture related thereto prior to 30 June 2018, to fully redeem the Senior Secured Notes and to repay the June 2013 super senior revolving facility (the “Super Senior Revolving Facility”), the March 2017 senior secured revolving facility (the “Senior Secured Revolving Facility”) and the March 2018 subordinated revolving facility (the “Subordinated Revolving Facility”). Furthermore, the proceeds were used to pay all related fees and expenses, and for general corporate purposes. The Senior Notes due 2025 are governed by an indenture dated 18 June 2018, between the Company, as issuer, the guarantors party thereto, The Bank of New York Mellon, London Branch, as trustee and paying agent, and The Bank of New York Mellon SA/NV, Luxembourg Branch, as transfer agent and registrar (the “Indenture”). The indenture contains restrictive covenants including, but not limited to, limitations or restrictions on our ability to incur or guarantee debt, create certain liens, transfer or sell certain assets and merge or consolidate with other entities. The restrictive covenants are subject to customary exceptions. Additional notes under the Indenture dated 18 June 2018 On 20 September 2018, the Company completed the issuance of an additional €200.0 million aggregate principal amount of its 4.75% Senior Notes due 2025 (the “Additional Notes”). The net proceeds of the offering amounted to approximately €203.8 million, net of estimated offering fees and expenses of €2.2 million. The net proceeds contain the nominal value of the Additional Notes, plus an issuance premium of 103.00%. The Additional Notes, which are guaranteed by certain subsidiaries of the Company, were issued under the Indenture. 16
Revolving credit facility On 18 June 2018, the Company entered into an unsecured multicurrency revolving loan facility agreement (the “Revolving Facility Agreement”) between, among others, ABN AMRO Bank N.V., Bank of America Merrill Lynch International Limited, Barclays Bank PLC, Citigroup Global Markets Limited and Crédit Agricole CIB S.A. as arrangers, and ABN AMRO Bank N.V. as agent, pursuant to which a €200.0 million revolving loan facility (the “Facility”) was made available to the Company. The Facility has an initial maturity date of 18 June 2023. The Facility initially bears interest at an annual rate equal to EURIBOR (subject to a 0% floor) plus a margin of 2.00% per annum from the date of the Revolving Facility Agreement, subject to a margin ratchet pursuant to which the margin may increase thereafter on certain specified dates and subject to a maximum margin of 3.50% per annum. In addition, the Company is required to pay a commitment fee computed at the rate of 30% of the applicable margin on any available amount under the Facility. During the first quarter of 2019, Interxion increased its unsecured revolving credit facility by €100 million for a total commitment of €300 million. As of 30 September 2019, the Facility was undrawn. 13 Related party transactions There are no material transactions with related parties other than those related to the investment in an equity-accounted associate as disclosed in note 10 and the provision of certain loans to this associate, as disclosed in note 9. Shares awarded to key management and Non-Executive Directors In 2019, the Board of Directors approved the initial award of 57,810 performance shares and 45,000 restricted shares to certain members of key management, excluding the Executive Director. Furthermore, both the Board of Directors and the Annual General Meeting of Shareholders approved the final award of 107,571 performance shares to the Executive Director, related to the performance period from 1 January 2016 to 31 December 2016. On 28 June 2019, the Annual General Meeting of Shareholders approved to award restricted shares equivalent to a value of €40,000 to each of the Company’s Non-Executive Directors. 14 Events subsequent to balance sheet date Business combination with Digital Realty On 29 October 2019, the Company and Digital Realty Trust, Inc., (“Digital Realty”) announced they have entered into a definitive agreement pursuant to which a subsidiary of Digital Realty will commence a tender offer to acquire all of the Company’s issued and outstanding ordinary shares in exchange for 0.7067 shares of Digital Realty common stock for each Interxion ordinary share (subject to a minimum tender of at least 80% of Interxion’s outstanding ordinary shares, which minimum may be reduced to 66 2/3% by Digital Realty). Upon completion of the transaction, Interxion shareholders will own approximately 20% of the outstanding common stock of the combined company. The transaction is not subject to any financing condition. A special meeting of Digital Realty shareholders will be convened to approve the issuance of Digital Realty common stock in the transaction, in accordance with New York Stock Exchange rules. Following the close of the tender offer, in line with Dutch market practice, Digital Realty and the Company will effectuate a corporate reorganization of the Company and its subsidiaries, resulting in Digital Realty owning 100% of the Company’s business and interests in the Company’s subsidiaries. If less than 95% of the Company’s ordinary shares are tendered, Interxion shareholders who do not tender their shares in the tender offer will ultimately receive in the corporate reorganization the same consideration of 0.7067 shares of Digital Realty common stock for each Interxion ordinary share (without interest and subject to applicable withholding taxes). If 95% or more of Interxion’s ordinary shares are tendered, Interxion shareholders who did not tender will ultimately be squeezed out in accordance with a statutory Dutch court procedure in which they will receive cash in an amount determined under Dutch law. An extraordinary general meeting of the Company’s shareholders will be convened in connection with the tender offer to adopt, among other things, certain resolutions relating to the transaction. 17


