Exhibit 96.1

Dewey Burdock Project
South Dakota, USA
S-K 1300 Technical Report Summary
Effective Date: October 8, 2024
Report Date: January 6, 2025
Prepared for enCore Energy Corporation by:

Table of Contents
| 1.0 | EXECUTIVE SUMMARY | 1 | ||
| 1.1 | Property Description and Ownership | 1 | ||
| 1.2 | Geology and Mineralization | 1 | ||
| 1.3 | Exploration Status | 2 | ||
| 1.4 | Development and Operations | 2 | ||
| 1.5 | Mineral Resource Estimates | 3 | ||
| 1.6 | Mineral Reserve Estimates | 3 | ||
| 1.7 | Summary Capital and Operating Cost Estimates | 3 | ||
| 1.8 | Permitting Requirements | 4 | ||
| 1.9 | Conclusions and Recommendations | 4 | ||
| 2.0 | INTRODUCTION | 6 | ||
| 2.1 | Registrant | 6 | ||
| 2.2 | Terms of Reference and Purpose | 6 | ||
| 2.3 | Information and Data Sources | 6 | ||
| 2.4 | QP Site Inspection | 6 | ||
| 3.0 | PROPERTY DESCRIPTION | 7 | ||
| 3.1 | Description and Location | 7 | ||
| 3.2 | Mineral Titles | 7 | ||
| 3.3 | Mineral Rights | 7 | ||
| 3.4 | Encumbrances | 8 | ||
| 3.4.1 | Legacy Issues | 8 | ||
| 3.4.2 | Permitting and Licensing | 8 | ||
| 3.5 | Other Significant Factors and Risks | 9 | ||
| 4.0 | ACCESSIBILITY, CLIMATE, LOCAL RESOURCES, INFRASTRUCTURE AND PHYSIOGRAPHY | 13 | ||
| 4.1 | Topography, Elevation and Vegetation | 13 | ||
| 4.2 | Access | 13 | ||
| 4.3 | Climate | 14 | ||
| 4.4 | Infrastructure | 15 | ||
| i | REPORT DATE: JANUARY 6, 2025 |
| 5.0 | HISTORY | 16 | |||
| 5.1 | Ownership | 16 | |||
| 5.2 | Historic Mineral Resource Estimates | 17 | |||
| 5.3 | Historic Production | 18 | |||
| 6.0 | GEOLOGICAL SETTING, MINERALIZATION AND DEPOSIT | 19 | |||
| 6.1 | Regional Geology | 19 | |||
| 6.2 | Local and Project Geology | 20 | |||
| 6.3 | Significant Mineralized Zones | 22 | |||
| 6.3.1 | Mineralization | 22 | |||
| 6.4 | Relevant Geologic Controls | 22 | |||
| 6.5 | Deposit Type | 23 | |||
| 7.0 | EXPLORATION | 25 | |||
| 7.1 | Drilling | 25 | |||
| 7.2 | Drilling Type and Procedures | 25 | |||
| 7.3 | Past Exploration | 25 | |||
| 7.4 | Accuracy and Reliability | 28 | |||
| 7.5 | Hydrogeology | 29 | |||
| 7.5.1 | Hydraulic Properties of the Inyan Kara | 29 | |||
| 7.5.1.1 | Dewey | 29 | |||
| 7.5.1.2 | Burdock | 30 | |||
| 7.5.2 | Hydrogeologic Considerations for ISR Mining | 32 | |||
| 7.5.3 | Hydrogeologic Considerations for ISR Mining Impact to Groundwater System | 33 | |||
| 7.5.4 | Groundwater Chemistry | 34 | |||
| 7.5.5 | Assessment of Dewey Burdock Project Hydrogeology | 35 | |||
| 8.0 | SAMPLE PREPARATION, ANALYSIS AND SECURITY | 36 | |||
| 8.1 | Sample Methods | 36 | |||
| 8.1.1 | Downhole Geophysical Data | 36 | |||
| 8.1.2 | Drill Cuttings | 36 | |||
| 8.1.3 | Core Samples | 36 | |||
| 8.2 | Laboratory Analysis | 37 | |||
| 8.3 | Opinion on Adequacy | 37 | |||
| 9.0 | DATA VERIFICATION | 38 | |||
| 9.1 | Data Confirmation | 38 | |||
| 9.2 | Limitations | 38 | |||
| 9.3 | Data Adequacy | 38 | |||
| 10.0 | MINERAL PROCESSING AND METALLURGICAL TESTING | 39 | |||
| 10.1 | Procedures | 39 | |||
| 10.2 | Evaluation | 39 | |||
| 10.2.1 | Ambient Bottle Roll Tests | 39 | |||
| 10.3 | Results | 40 | |||
| 10.4 | Additional Testing | 41 | |||
| ii | REPORT DATE: JANUARY 6, 2025 |
| 11.0 | MINERAL RESOURCE ESTIMATES | 42 | ||
| 11.1 | Key Assumptions, Parameters and Methods | 42 | ||
| 11.1.1 | Key Assumptions | 42 | ||
| 11.1.2 | Key Parameters | 42 | ||
| 11.1.3 | Key Methods | 42 | ||
| 11.2 | Resource Classification | 43 | ||
| 11.2.1 | Measured Mineral Resources | 43 | ||
| 11.2.2 | Indicated Mineral Resources | 43 | ||
| 11.2.3 | Inferred Mineral Resources | 43 | ||
| 11.3 | Mineral Resource Estimates | 44 | ||
| 11.4 | Material Affects to Mineral Resources | 44 | ||
| 12.0 | MINERAL RESERVE ESTIMATES | 44 | ||
| 13.0 | MINING METHODS | 45 | ||
| 13.1 | Mine Designs and Plans | 45 | ||
| 13.1.1 | Patterns, Wellfields and Mine Units | 45 | ||
| 13.1.2 | Monitoring Wells | 45 | ||
| 13.1.3 | Wellfield Surface Piping System and Header Houses | 46 | ||
| 13.1.4 | Wellfield Production | 46 | ||
| 13.1.5 | Production Rates and Expected Mine Life | 46 | ||
| 13.2 | Mine Development | 48 | ||
| 13.3 | Mining Fleet and Machinery | 48 | ||
| 14.0 | PROCESS AND RECOVERY METHODS | 50 | ||
| 14.1 | Processing Facilities | 50 | ||
| 14.2 | Process Flow | 50 | ||
| 14.2.1 | Ion Exchange | 50 | ||
| 14.2.2 | Production Bleed | 50 | ||
| 14.2.3 | Elution Circuit | 50 | ||
| 14.2.4 | Precipitation Circuit | 54 | ||
| 14.2.5 | Product Filtering, Drying and Packaging | 54 | ||
| 14.3 | Water Balance | 54 | ||
| 14.4 | Liquid Waste Disposal | 54 | ||
| 14.5 | Solid Waste Disposal | 55 | ||
| 14.6 | Energy, Water and Process Material Requirements | 55 | ||
| 14.6.1 | Energy Requirements | 55 | ||
| 14.6.2 | Water Requirements | 55 | ||
| 15.0 | INFRASTRUCTURE | 56 | ||
| 15.1 | Utilities | 56 | ||
| 15.1.1 | Electrical Power | 56 | ||
| 15.1.2 | Domestic and Utility Water Wells | 56 | ||
| 15.1.3 | Sanitary Sewer | 56 | ||
| 15.2 | Transportation | 56 | ||
| 15.2.1 | Railway | 56 | ||
| 15.2.2 | Roads | 56 | ||
| 15.3 | Buildings | 58 | ||
| 15.3.1 | Central Processing Plant & Satellite | 58 | ||
| 15.3.2 | Office | 58 | ||
| 15.3.3 | Warehouse | 59 | ||
| 15.3.4 | Maintenance Shop | 59 | ||
| 15.3.5 | Wellfield Construction Shop | 59 | ||
| 15.3.6 | Diesel and Gasoline Storage | 59 | ||
| 15.3.7 | Laboratory | 59 | ||
| 15.3.8 | Surface Impoundments | 59 | ||
| 15.3.9 | Radium Settling Pond | 60 | ||
| 15.3.10 | Outlet Pond | 60 | ||
| 15.3.11 | CPP Pond | 60 | ||
| 15.3.12 | Surge Pond | 60 | ||
| 15.3.13 | Spare Settling Pond | 60 | ||
| 16.0 | MARKET STUDIES | 61 | ||
| 16.1 | Uranium Market | 61 | ||
| 16.2 | Uranium Price Projection | 61 | ||
| 16.3 | Contracts | 61 | ||
| iii | REPORT DATE: JANUARY 6, 2025 |
| 17.0 | ENVIRONMENTAL STUDIES, PERMITTING, AND PLANS, NEGOTIATIONS, OR AGREEMENTS WITH LOCAL INDIVIDUALS OR GROUPS | 62 | |||
| 17.1 | Environmental Studies | 62 | |||
| 17.1.1 | Potential Wellfield Impacts | 62 | |||
| 17.1.2 | Potential Soil Impacts | 63 | |||
| 17.1.3 | Potential Impacts from Shipping Resin, Yellowcake and 11.e.(2) Materials | 64 | |||
| 17.1.3.1 | Ion Exchange Resin Shipment | 64 | |||
| 17.1.3.2 | Yellowcake Shipment | 65 | |||
| 17.1.3.3 | 11.e.(2) Shipment | 65 | |||
| 17.2 | Socioeconomic Studies and Issues | 65 | |||
| 17.3 | Permitting Requirements and Status | 66 | |||
| 17.4 | Community Affairs | 67 | |||
| 17.5 | Project Closure | 68 | |||
| 17.5.1 | Byproduct Disposal | 68 | |||
| 17.5.2 | Well Abandonment and Groundwater Restoration | 68 | |||
| 17.5.3 | Demolition and Removal of Infrastructure | 68 | |||
| 17.5.4 | Reclamation | 69 | |||
| 17.6 | Financial Assurance | 69 | |||
| 17.7 | Adequacy of Mitigation Plans | 69 | |||
| 18.0 | CAPITAL AND OPERATING COSTS | 70 | |||
| 18.1 | Capital Cost Estimates | 70 | |||
| 18.2 | Operating Cost Estimates | 75 | |||
| 18.3 | Cost Accuracy | 75 | |||
| 19.0 | ECONOMIC ANALYSIS | 80 | |||
| 19.1 | Economic analysis | 80 | |||
| 19.2 | Taxes, Royalties and Other Interests | 87 | |||
| 19.2.1 | Federal Income Tax | 87 | |||
| 19.2.2 | State Income Tax | 87 | |||
| 19.2.3 | Production Taxes | 87 | |||
| 19.2.4 | Royalties | 87 | |||
| 19.3 | Sensitivity Analysis | 88 | |||
| 19.3.1 | NPV and IRR v. Variable Capital and Operating Cost | 89 | |||
| 20.0 | ADJACENT PROPERTIES | 90 | |||
| 21.0 | OTHER RELEVANT DATA AND INFORMATION | 91 | |||
| 21.1 | Other Relevant Items | 91 | |||
| 22.0 | INTERPRETATION AND CONCLUSIONS | 92 | |||
| 22.1 | Risk Assessment | 92 | |||
| 22.2 | Uranium Recovery and Processing | 92 | |||
| 22.2.1 | Permitting and Licensing Delays | 93 | |||
| 22.3 | Social and/or Political | 94 | |||
| 23.0 | RECOMMENDATIONS | 95 | |||
| 24.0 | REFERENCES | 96 | |||
| 25.0 | RELIANCE ON INFORMATION PROVIDED BY THE REGISTRANT | 98 | |||
| 26.0 | DATE, SIGNATURE AND CERTIFICATION | 99 | |||
| iv | REPORT DATE: JANUARY 6, 2025 |
Tables
| Table 1.1: | Mineral Resources Summary | 3 |
| Table 7.1: | Results of Fall River Formation Core Holes | 28 |
| Table 7.2: | Results of Lakota Formation Core Holes | 28 |
| Table 7.3: | Dewey Production Area Water Level Data (MSL) | 30 |
| Table 7.4: | Burdock Production Area Water Level Data (MSL) | 32 |
| Table 7.5: | Hydro-stratigraphic unit Property Summary for the Dewey Burdock Project | 32 |
| Table 7.6: | Groundwater Chemistry for Fall River and Chilson Formations | 35 |
| Table 10.1: | Uranium and Vanadium Dissolutions Based on Solids Assays | 40 |
| Table 10.2: | Uranium Dissolutions Based on Leachate and Residue Assays | 41 |
| Table 10.3: | Vanadium Dissolutions Based on Head and Leachate Assays | 41 |
| Table 11.1: | Summary of Mineral Resource Estimates | 44 |
| Table 17.1: | Permitting Status | 67 |
| Table 18.1: | Capital Cost Components | 71 |
| Table 18.2: | Capital Cost Forecast by Year | 72 |
| Table 18.3: | Operating Cost Components | 76 |
| Table 18.4: | Operating Cost Forecast by Year | 77 |
| Table 19.1: | Economic Analysis Forecast by Year with Exclusion of Federal Income Tax | 81 |
| Table 19.2: | Economic Analysis Forecast by Year with Inclusion of Federal Income Tax | 84 |
| Table 25.0: | Other Experts | 98 |
| Table 25.1: | Referenced Sections | 98 |
| v | REPORT DATE: JANUARY 6, 2025 |
Figures
| Figure 3.1: | Project Location Map | 10 |
| Figure 3.2: | Dewey Burdock Mineral Ownership | 11 |
| Figure 3.3: | Surface Use Agreements | 12 |
| Figure 4.1: | Average Monthly Precipitation (2009 – 2022) | 15 |
| Figure 6.1 | Stratigraphic Column | 20 |
| Figure 6.2: | Cross-section A – A’ | 21 |
| Figure 6.3: | Typical Roll Front Deposit | 24 |
| Figure 7.1. | Drill Hole Locations | 26 |
| Figure 13.1: | Production Forecast Model | 47 |
| Figure 13.2: | Dewey Burdock Mine | 49 |
| Figure 14.1: | Process Flow Diagram | 51 |
| Figure 14.2: | CPP Facility General Arrangement | 52 |
| Figure 14.3: | Satellite Facility General Arrangement | 53 |
| Figure 15.1: | Project Infrastructure | 57 |
| Figure 19.1: | NPV & IRR v. Uranium Price | 88 |
| Figure 19.2: | NPV v. Variable Capital and Operating Cost | 89 |
| Figure 19.3: | IRR v. Variable Capital and Operating Cost | 90 |
| vi | REPORT DATE: JANUARY 6, 2025 |
| Units of Measure and Abbreviations | |
| Avg | Average |
| ° | Degrees |
| ft | Feet |
| F | Fahrenheit |
| g/L | Grams per liter |
| GT | Mineralization Grade times (x) Mineralization Thickness |
| gpm | Gallons per minute |
| kWh | Kilo Watt Hour |
| Lbs | Pounds |
| M | Million |
| Ma | One Million Years |
| mg/l | Milligrams per liter |
| Mi | Mile |
| ml | Milliliter |
| MBTUH | Million British Thermal Units per Hour |
| U3O8 | Chemical formula used to express natural form of uranium |
| eU3O8 | Radiometric equivalent U3O8 measured by a calibrated total gamma downhole probe |
| pCi/L | Picocuries per liter of air |
| pH | Potential of hydrogen |
| ppm | Parts per Million |
| % | Percent |
| +/- | Plus, or Minus |
| USD | United States Dollar |
| vii | REPORT DATE: JANUARY 6, 2025 |
| Definitions and Abbreviations | |
| Azarga | Azarga Uranium |
| BLM | Bureau of Land Management |
| BNSF | Burlington Northern Santa Fe Railroad |
| CIM | Canadian Institute of Mining |
| D&D | Decontamination and Decommissioning |
| DANR | South Dakota Department of Agriculture and Natural Resources |
| Denver Uranium | Denver Uranium Company |
| DDW | Deep Disposal Well |
| EAB | Environmental Appeals Board |
| ELI | Energy Laboratories Incorporated |
| enCore | enCore Energy Corporation |
| Energy Fuels | Energy Fuels Nuclear Company |
| Energy Metals | Energy Metals Corporation |
| EPA | Environmental Protection Agency |
| IRR | Internal Rate of Return |
| ISR | In Situ Recovery |
| IX | Ion Exchange |
| LLC | Limited Liability Company |
| LOM | Life of Mine |
| MCL | Maximum Contaminant Level |
| MSL | Mean Sea Level |
| MBTUH | Million British Thermal Units per Hour |
| NI 43-101 | National Instrument 43-101 – Standards of Disclosure for Mineral Projects |
| NI 43-101F1 | Form 43-101 Technical Report Table of Contents |
| NGO | Non-Government Organization |
| NPV | Net Present Value |
| NRC | Nuclear Regulatory Commission |
| Petrotek | Petrotek Engineering Corporation |
| Project | Dewey Burdock ISR Project |
| PV | Pore volume |
| QEMSCAN | Quantitative evaluation of minerals by scanning electron microscopy |
| QP | Qualified Person |
| RBS&A | Robert Bob Smith and Associates |
| RO | Reverse Osmosis |
| Rough Stock | Rough Stock Mining Services |
| S-K 1300 | United States Securities and Exchange Commission disclosure requirements for mineral resources or mineral reserves, S-K 1300 Technical Report Summary |
| Susquehanna | Susquehanna Western Corporation |
| TVA | Tennessee Valley Authority |
| U | Uranium |
| US | United States |
| USDW | Underground Source of Drinking Water |
| USGS | United States Geological Survey |
| WMB | South Dakota Water Management Board |
| V | Vanadium |
| 11.e.(2) | Tailings or wastes produced by the extraction or concentration of uranium from processed ore |
| viii | REPORT DATE: JANUARY 6, 2025 |
1.0 EXECUTIVE SUMMARY
1.1 Property Description and Ownership
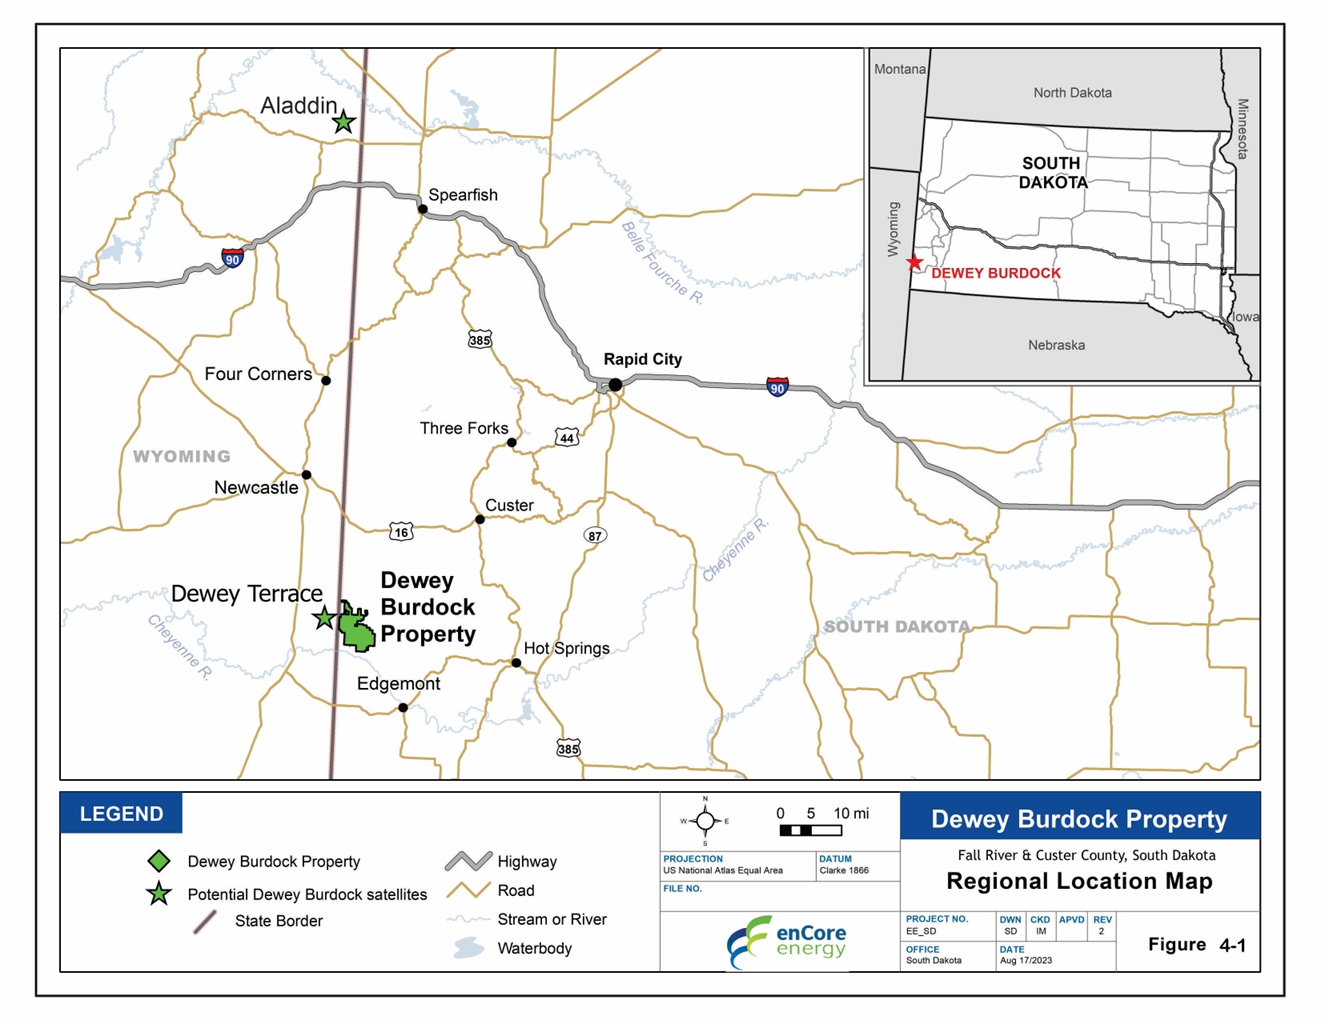
The Project is an advanced-stage uranium exploration project located in southwest South Dakota and forms part of the northwestern extension of the Edgemont Uranium Mining District about 13 miles north-northwest of Edgemont. The Project is wholly owned by enCore.
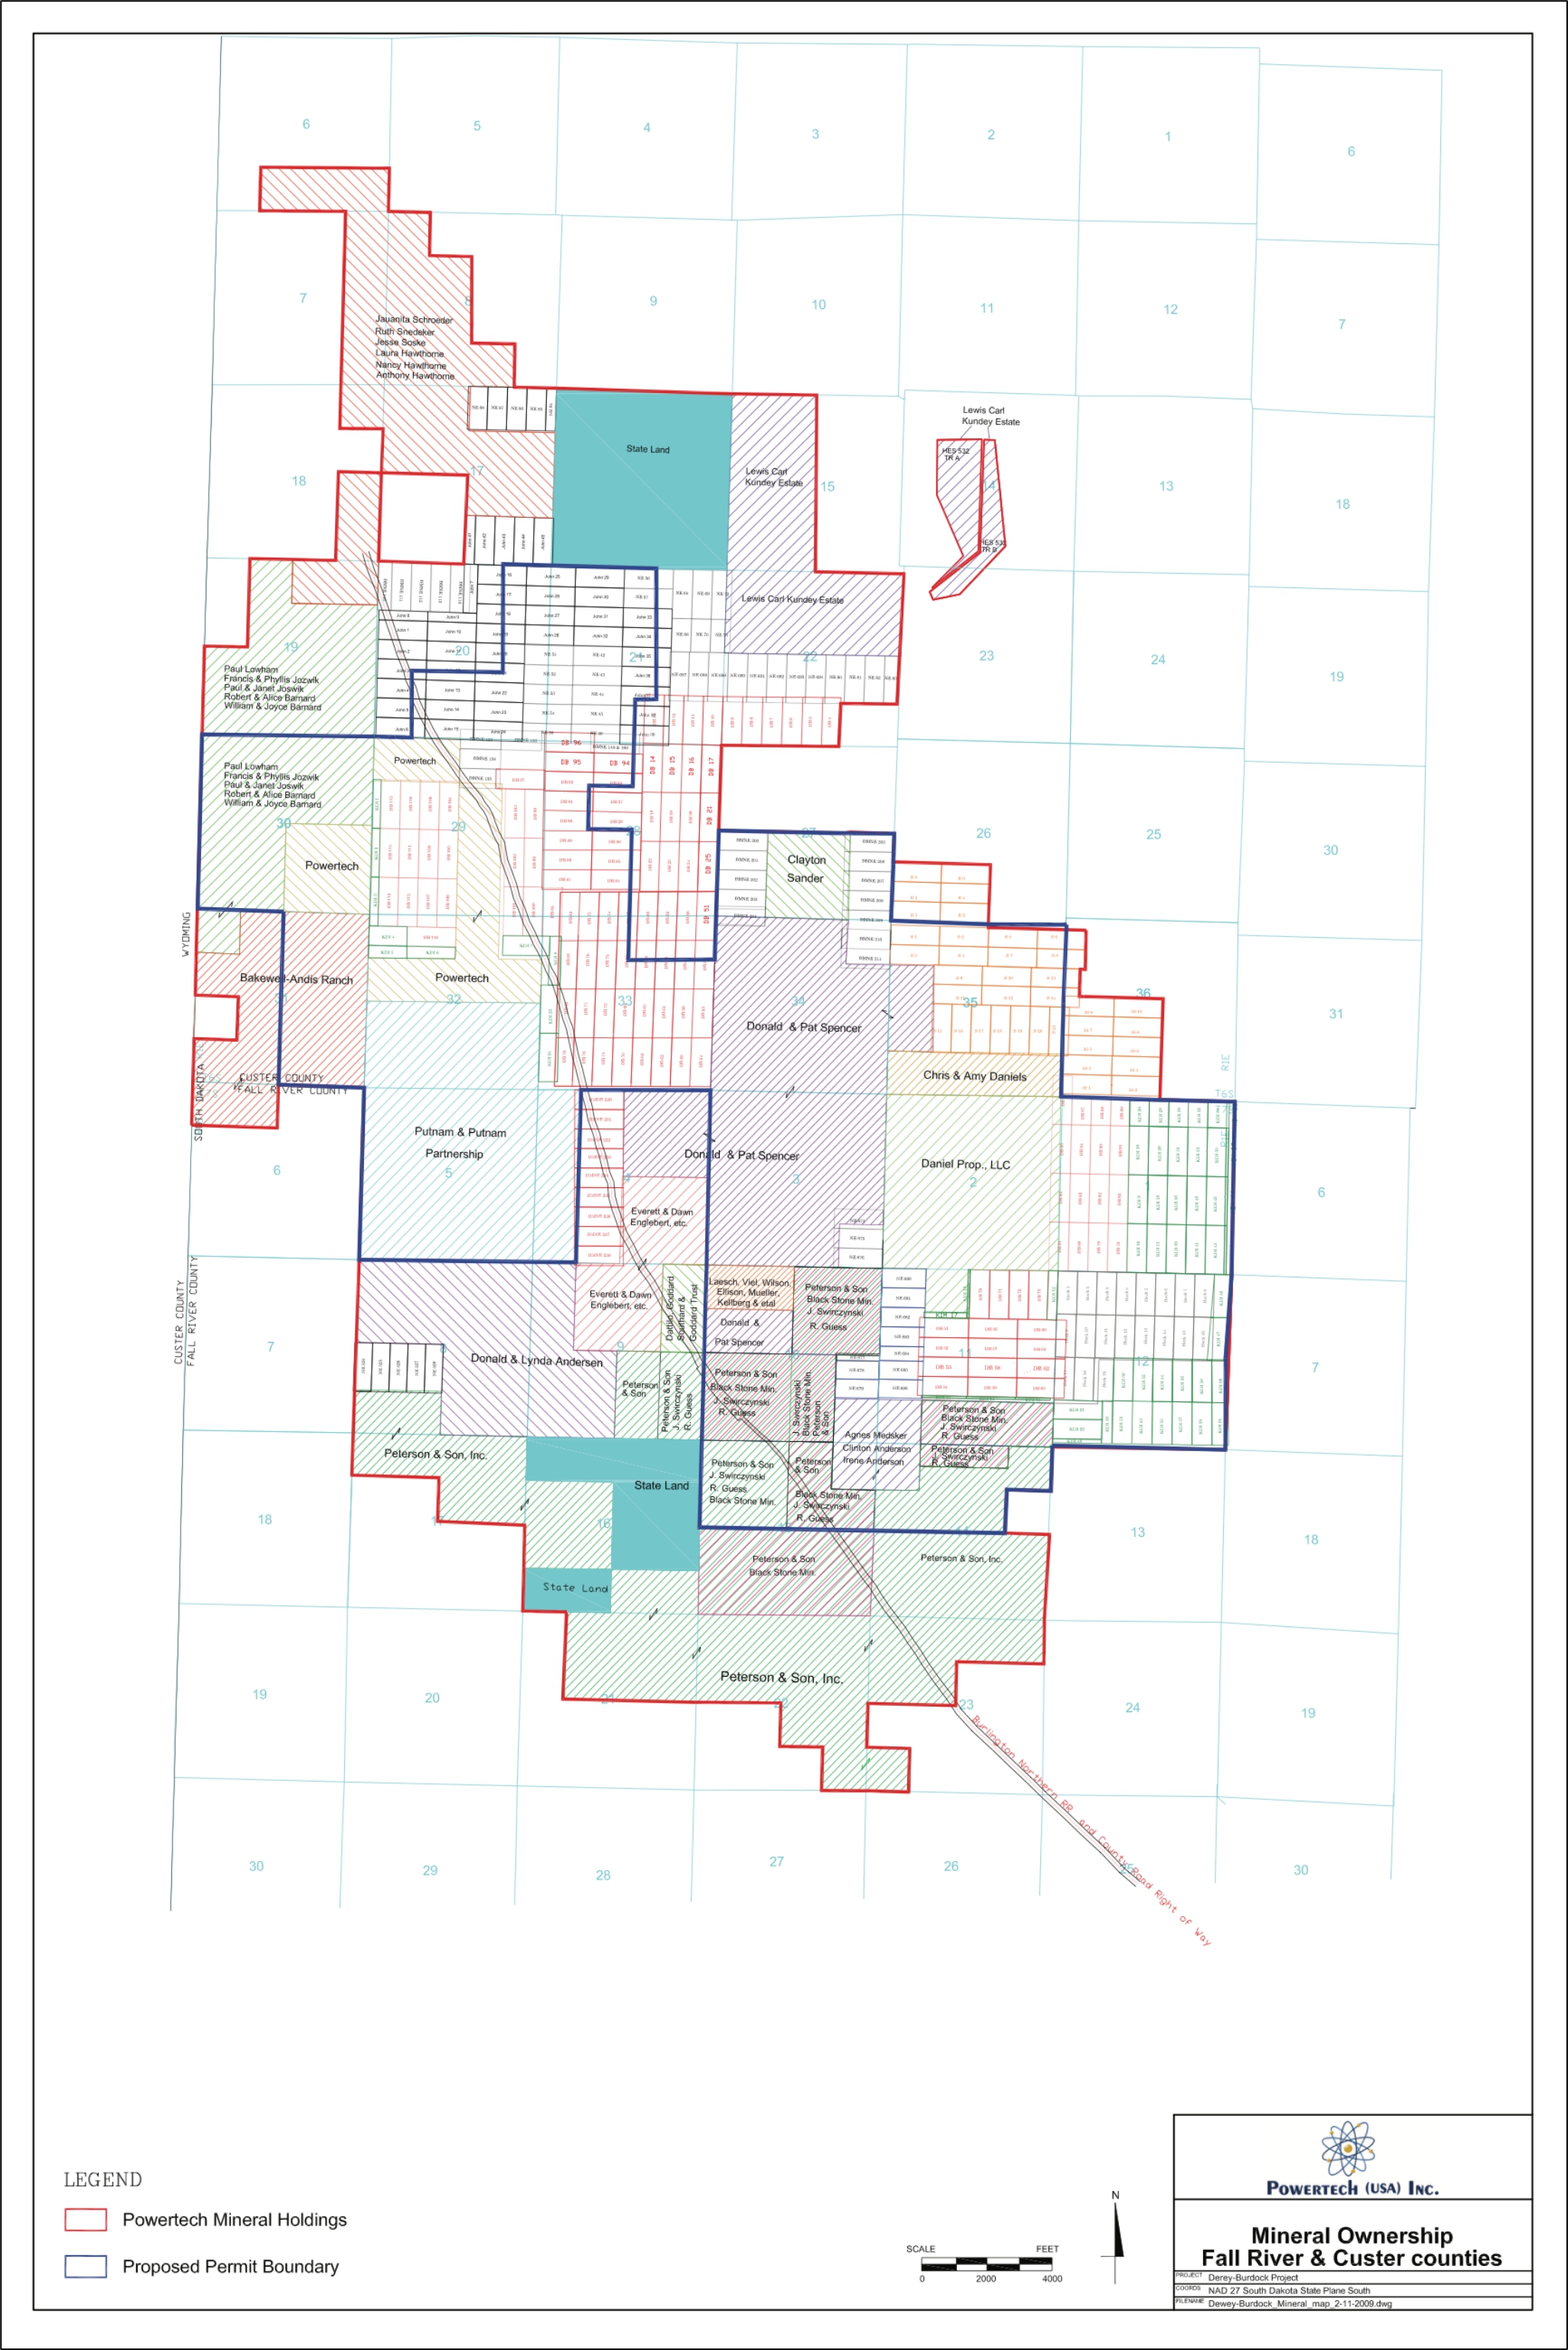
enCore controls over 16,000 acres in the area, of which over 10,500 acres are within the Project’s permit boundary. Mineral title is controlled by federal mining claims and private lease agreements.
The project is within an area of low population density characterized by an agriculture-based economy with little other types of commercial and industrial activity. The Project is expected to bring a significant economic benefit to the local area in terms of tax revenue, new jobs, and commercial activity supporting the project. Previously, a uranium mill was in the town of Edgemont from 1956 to 1972, and a renewal of uranium production is expected to be a locally favorable form of economic development. Regionally, there are individuals and other organizations that oppose the project, though typically not in the immediate Edgemont area.
1.2 Geology and Mineralization
The Edgemont Uranium District is located on the southwest side of the Black Hills Uplift. The Black Hills Uplift is a Laramide Age structure forming a northwest trending dome about 125 miles long x 60 miles wide located in southwestern South Dakota and northeastern Wyoming. The uplift has deformed all rocks in age from Cambrian to latest Cretaceous. Subsequent erosion has exposed these rock units dipping outward in successive elliptical outcrops surrounding the central Precambrian granite core. Differential weathering has resulted in present day topography of concentric ellipsoids of valleys under softer rocks and ridges held up by more competent units.
The Cretaceous sediments contain uranium roll front deposits in the more porous and permeable sands within the Inyan Kara Group, Lakota and Fall River Formations. The entire Inyan Kara Group consists of basal fluvial sediments grading into near marine sandstones, silts and clays deposited along the ancestral Black Hills Uplift. The sandstones are continuous along the entire western flank of the uplift and dip about 3° to the southwest in the Project area.
The Lakota and Fall River Formations were deposited by northward flowing stream systems. Sediments are characterized by point bar and traverse bar deposition, in meandering fluvial systems. Sand units fine upward with numerous cut-and-fill indicative of channel migration depositing silt and clay upon older sand and additional channel sands overly older silts and clays. The Fall River sands are noticeably thinner with marine sediments superimposed directly on the fluvial sands.
The depositional characteristics of the Lakota and Fall River Formations results in stratigraphic heterogeneity within the sands. Because of this heterogeneity, uranium mineralization occurs as multiple sinuous roll fronts, instead of one large front as is observed in more homogeneous sands. Individual roll fronts are continuous and generally trend along strike but may or may not overlap. Individual roll fronts average about 8 feet thick and 30 feet wide. Where overlapping the deposit can be tens of feet thick and hundreds of feet wide. The strike length of individual roll fronts is variable but often on the order of thousands of feet, where the total strike length of the deposit is miles. Depth to mineralization is variable and ranges from about 180 to 920 feet.
| 1 | REPORT DATE: JANUARY 6, 2025 |
1.3 Exploration Status
Exploration started in the Edgemont Uranium District in the early 1950’s. Since that time numerous companies have explored on or around the Project. To date over 6,000 holes have been drilled on the property. The most recent exploration was conducted by Powertech in 2007 and 2008. Since enCore’s acquisition of the Project in 2021 no exploration has been conducted.
1.4 Development and Operations
In Azarga’s 2019 technical report, the Project was planned to operate with a satellite facility and toll-mill processing at a competitor’s plant. To de-risk the project, enCore has elected to proceed with construction of a CPP to recover and process uranium, followed by construction of a satellite.
enCore will mine uranium using ISR. An alkaline leach system of bicarbonate and oxygen will be used for extraction. The fundamental ISR production unit will be the pattern which is comprised of a recovery well and associated injection wells. Patterns will be grouped into wellfields of 20-30 recovery wells and their associated injection wells. Wellfields function as the fundamental operating unit for distribution of the alkaline leach system. Wellfields will be grouped into Mine Units. Mine Units represent a collection of wellfields for which baseline data, monitoring requirements, restoration criteria and development of a Wellfield Hydrologic Data Package, that will be submitted to regulatory authorities for mining approval.
enCore is advancing pre-construction activities to achieve a commercial operation in the second half of 2028. Permitting and licensing actions are ongoing, and forecasted completion is Q3 2026. Engineering is anticipated to commence in late 2025 or early 2026. Construction will start on the Burdock CPP in early 2027. Also in 2027, enCore will install the first Burdock mine unit monitor wells, conduct hydrologic testing, baseline sampling, and preparation of the hydrologic data package. Starting in late 2027 or early 2028, wellfield construction will start in the first Mine Unit.
Pursuant to start of commercial operations, construction will start on the Dewey Satellite and first Dewey mine unit. Construction is forecasted to take one year with the start of commercial operations in the second half of 2029.
| 2 | REPORT DATE: JANUARY 6, 2025 |
1.5 Mineral Resource Estimates
A summary of the Project’s mineral resources is provided in Table 1.1.
Table 1.1: Mineral Resources Summary
| ISR Resources | Measured | Indicated | M & I | Inferred | ||||||||||||
| Lbs (U3O8) | 14,285,988 | 2,836,159 | 17,122,147 | 712,624 | ||||||||||||
| Tons | 5,419,779 | 1,968,443 | 7,388,222 | 645,546 | ||||||||||||
| Avg. GT | 0.73 | 0.41 | 0.66 | 0.32 | ||||||||||||
| Avg. Grade (% U3O8) | 0.13 | % | 0.07 | % | 0.12 | % | 0.06 | % | ||||||||
| Avg. Thickness (ft) | 5.56 | 5.74 | 5.65 | 5.87 | ||||||||||||
Notes:
| 1. | enCore reports mineral reserves and mineral resources separately. Reported mineral resources do not include mineral reserves. |
| 2. | The geological model used is based on geological interpretations on section and plan derived from surface drillhole information. |
| 3. | Mineral resources have been estimated using a minimum grade-thickness cut-off of 0.20 ft% U3O8. |
| 4. | Mineral resources are estimated based on the use of ISR for mineral extraction. |
| 5. | Inferred mineral resources are estimated with a level of sampling sufficient to determine geological continuity but less confidence in grade and geological interpretation such that inferred resources cannot be converted to mineral reserves. |
1.6 Mineral Reserve Estimates
No mineral reserves are defined for the Project.
1.7 Summary Capital and Operating Cost Estimates
Estimated capital costs are $264.2 M and includes $2.2 M for pre-construction permitting and licensing costs, $178.0 M for wellfield development, $84.0 M for the CPP, Satellite and associated infrastructure.
Capital is heavily weighted from 2027 through 2029 with completion of permitting and licensing and start-up costs for construction of the Burdock CPP, Dewey Satellite, initial Dewey and Burdock wellfields, and associated infrastructure. Capital costs during this period are estimated at $105.0 M.
Operating costs are estimated to be $23.81 per pound of U3O8. The basis for operating costs is planned development, production sequence, production quantity, and past production experience. Operating costs include plant and wellfield operations, product transaction, administrative support, decontamination and decommissioning, and restoration.
Taxes, royalties, and other interests are applicable to production and revenue. Total Federal income tax is estimated at $113.4 M for a cost per pound U3O8 of $8.04. The state of South Dakota does not impose a corporate income tax, but uranium sales revenue is subject to a state combined severance and conservation tax of 4.74% for a total production tax burden of $54.4 M for a cost per pound U3O8 of $3.85. Property taxes will also be realized based on property value as discussed in Section 22.2.3, in the amount of $16.2 M or $1.15 per pound of U3O8. The project is subject to a cumulative 5.8% surface and mineral royalty at an average LOM sales price of $86.34 per pound U3O8 for $70.9 M or $5.03 per pound.
| 3 | REPORT DATE: JANUARY 6, 2025 |
The economic analysis assumes that 80% of the mineral resources are recoverable. The pre-tax net cash flow incorporates estimated sales revenue from recoverable uranium, less costs for surface and mineral royalties, severance and conservation tax, property tax, plant and wellfield operations, product transaction, administrative support, D&D, restoration, and pre-construction capital. The after-tax analysis includes the above information plus amortized development costs, depreciated plant and wellfield capital costs, existing and forecasted operating losses to estimate federal income tax.
Less Federal Tax, the Projects cash flow is estimated at $476.8 M or $52.56 per pound U3O8.Using an 8% discount rate, the Projects NPV is $180.1 M with an IRR of 39% (Table 22.1). The Projects after tax cash flow is estimated at $363.4 M for a cost per pound U3O8 of $60.60. Using an 8.0% discount rate, the Projects NPV is $133.6 M with an IRR of 33% (Table 22.2).
Commercial operations are forecasted to start Q3 2028, and the estimated project payback is 2032.
1.8 Permitting Requirements
Permitting and licensing actions are ongoing, and forecasted completion is Q3 2026. The most significant permits and licenses required to operate the Project are (1) the Source and Byproduct Materials License, which was issued by NRC April of 2014; (2) the Large Scale Mine Permit, to be issued by the South Dakota DENR; and (3) UIC Class III and V wells (injection and/or deep disposal), and aquifer exemption, all three were issued in November 2020 by the EPA, but are currently under appeal.
The land within the Project boundary includes mining claims on private and federal lands. Access to these lands is controlled with leases held by enCore or by public access. Thus, a BLM Plan of Operations and associated Environmental Assessment which will reference the already completed Environmental Impact Statement previously finalized by NRC with BLM as a cooperating agency will be completed. The status of the various federal and state permits and licenses are summarized in Table 17.1. Prior to the start of mining (the injection of lixiviant), enCore will obtain all the following necessary permits, licenses, and approvals required by the NRC, DENR and EPA.
1.9 Conclusions and Recommendations
Based on the quality and quantity of geologic data, stringent adherence to geologic evaluation procedures and thorough geological interpretative work, mineralogical and hydrological testing, deposit modeling and resource estimation methods, production forecasting detail, high degree of design and pre-engineering, quality and substantial quantity of detailed cost inputs, cost estimates, and comprehensive economic analysis, the QP responsible for this report considers that the current mineral resource estimates are relevant and reliable.
As with any pre-development mining property there are risks to the Project. Key risks are with respect to uranium recovery, liquid waste disposal, permitting and licensing delays, and social and political opposition. Based on the technical and scientific work of previous operators and their own development plans, enCore is actively working to mitigate risk to ensure a profitable and successful project.
| 4 | REPORT DATE: JANUARY 6, 2025 |
To further de-risk technical and scientific aspects, enCore staff and SOLA have reviewed the technical and scientific work completed by previous operators. Previous metallurgical and hydrologic studies were done in accordance with industry standard procedures, and the results indicate the geological conditions are suitable for ISR mine development. SOLA has also revised the Project LOM production forecast using a more reliable and predictive model.
Regarding liquid waste disposal, enCore has previous operators engineering studies for DDW’s and surface impoundments. These studies have been used to develop a liquid waste management plan utilizing surface impoundments and subsurface injection of treated effluents through permitted Class V injection wells.
enCore has an ongoing community affairs program to address social and political misunderstandings with education and community relations. enCore maintains routine contacts with landowners, local communities and businesses, and the public.
There is opposition to the Project by environmental NGO’s, tribal governments, and individuals though typically not in the Edgemont area. This has created increased regulatory efforts and logistics for accommodating public involvement. There has already been extensive public involvement including public hearings and public comment on the project for the NRC license and draft EPA permits, as well as challenges and litigation of issued approvals. Hearings for State of South Dakota permits begun in 2013 but were suspended pending completion of federal licenses. To successfully permit and license the Project, enCore is working proactively with State and Federal regulatory agencies and have internal staff and outside support dedicated to this effort.
It is recommended enCore continue pre-construction activities to achieve start of commercial operations in 2028 to include:
| ● | Finalize state and federal permitting and licensing work obtaining necessary permits and licenses required to operate Project. This work will consist of pre-operations inspections, regulatory fees, and fees associated with contestations. Pre-construction remaining permitting and licensing work is estimated to cost $2.2 M. |
| ● | Since enCore has not conducted drilling on the Project, it is recommended that as part of their 2025 program, confirmation holes are drilled to verify some of the historic drilling data. It is also recommended that a coring program be conducted to better assess deposit mineralogy, confirm secular equilibrium, measure U/V ratios in leach solutions, and determine the best approach to handling U and V separation. Confirmation drilling and coring are estimated to cost $0.2 M. Conducting a drilling program is not contingent on receipt of major permits and licenses. |
| ● | Commence engineering in Q3 2026, for the Burdock CPP, office facility, warehouse, maintenance shop, construction shop, Dewey satellite and liquid waste disposal facilities. Engineering services are estimated at 8% of plant development costs or $6.7 M. To advance engineering is not contingent on receipt of permits and licenses. |
| 5 | REPORT DATE: JANUARY 6, 2025 |
2.0 INTRODUCTION
2.1 Registrant
This report was prepared by SOLA Project Servicers LLC., for the registrant, enCore Energy Corporation.
enCore was incorporated in 2009 under the previous name of Tigris Uranium Corporation and is engaged in the identification, acquisition, exploration, development and operation of uranium properties in the United States. enCore is incorporated British Columbia, Canada. The company’s principal executive offices are located at 101 N. Shoreline Blvd. Suite 450, Corpus Christi, Texas 78401. enCore’s portfolio includes uranium mineral properties in Texas, South Dakota, Wyoming and New Mexico.
2.2 Terms of Reference and Purpose
This report was prepared to disclose mineral resources, updated development plans and the results of an economic analysis.
The technical and scientific information in this report reflects material changes in enCore’s mineral project development plans, which are material in the company’s affairs. The report has an effective date of October 8, 2024, and has been prepared in accordance with the guidelines set forth under SEC Subpart 229.1300 – Disclosure by Registrants Engaged in Mining Operations.
2.3 Information and Data Sources
The report has been prepared with internal enCore Project technical and financial information, as well as data prepared by others. Documents, files and information provided by the registrant used to prepare this report are listed in Section 24.0 REFERENCES and Section 25.0 RELIANCE ON INFORMATION PROVIDED BY THE REGISTRANT.
2.4 QP Site Inspection
Stuart Bryan Soliz is the QP responsible for the content of this report. He visited the Project on January 30th, 2024. The purpose of the visit was to inspect the site and to meet with the enCore team to review the details of material changes.
| 6 | REPORT DATE: JANUARY 6, 2025 |
3.0 PROPERTY DESCRIPTION
3.1 Description and Location
The Project is in southwest South Dakota and forms part of the northwestern extension of the Edgemont Uranium Mining District. The project area is in Townships 6 and 7 South, Range 1 East, of the Black Hills Prime Meridian approximately 13 miles north-northwest of Edgemont. The county line dividing Custer and Fall River counties, South Dakota, lies at the confluence of Townships 6 and 7 South (Figure 3.1 Project Location Map). The company holds approximately 16,962 acres of mineral rights in the area. The permitted area encompasses approximately 10,580 acres of mostly private land and 240 acres under the control of the BLM.
3.2 Mineral Titles
Mineral titles are comprised of federal claims, private minerals and private surface rights within the permit boundary and surrounding areas. Access and mineral rights are currently held by a combination of private surface use agreements, access and mining lease agreements, purchase agreements and federal mineral claims.
The name or number of each title, mineral right, lease, or option under which enCore have the right to hold or operate the property are shown on Figures 3.2 and 3.3; however, lease terms are not disclosed in this report due to confidentiality and competitive leasing conditions. Mineral title is a matter of public record that can be obtained at the Custer and Fall River County Register’s Offices.
enCore controls federal unpatented lode mining claims. Title to mining claims is subject to rights of pedis possession against all third-party claimants if the claims are maintained. Mining Claims do not have an expiration date and affidavits are filed with the BLM and recorded with the Custer and Fall River County Register’s Offices attesting to the payment of BLM annual maintenance fees.
3.3 Mineral Rights
Leases have been acquired from various landowners with several levels of payments and obligations. Where enCore will develop mineral resources, both surface and minerals are leased or controlled by unpatented mineral claims. Furthermore, enCore controls all surface and mineral rights within the permit boundary. Most leases and purchase agreements are maintained through annual payments. Several leases are subject to an annual payment that is based on uranium spot price at payment due date. Claims are held by annual payments to the BLM.
Royalty agreements have been established with mineral and surface owners. Furthermore, surface owners are paid an annual rental to hold the surface on behalf of enCore. Additionally, the agreements also provide for additional charges to the surface owner to cover surface damages and for reduction of husbandry grazing during field operations.
| 7 | REPORT DATE: JANUARY 6, 2025 |
3.4 Encumbrances
3.4.1 Legacy Issues
On the east side of the Project there are shallow un-reclaimed open pits from legacy surface uranium mining operations. Existing surface disturbance related to these pits are the responsibility of previous operators and existing landowners. Mineralization does exist below these surface pits, but at this time enCore has no intention to pursue development options due to potential liabilities associated with the pits.
3.4.2 Permitting and Licensing
The Project is the first uranium ISR facility to submit permit applications in the State of South Dakota. As such, there is inherent risk in a new permitting process, regulatory unfamiliarity with ISR methods, and an untested review period. The amount of time required for regulatory review of all permits associated with the commissioning of an ISR facility is highly variable and directly affects project economics. It is assumed enCore will have all permits necessary to construct in 2027. The timeframe to obtain licenses and permits is expected to be impacted by environmental NGO’s and public contestation of both state and federal permits and licenses. Time for contested cases has been accounted for in the project development schedule.
The Project has drawn attention from environmental NGO’s, tribal governments, and individuals in the public. enCore is managing this risk through the State and Federal permitting processes. Extensive efforts by the regulatory agencies have proceeded to near completion of all major permitting and licensing actions.
The NRC license (SUA 1600) was issued in 2014, challenged and appealed, is now in good standing and in timely renewal. The EPA issued the Class III and Class V Area Underground Injection Control (UIC) permits and Aquifer Exemption in 2020. The Class III and Class V UIC permits, and Aquifer Exemption were challenged by the OST and are under appeal.
The EAB heard oral arguments on the Class III and Class V UIC permits in March 2024. In September, the EAB issued its ruling on the OST appeal finding:
| ● | The EAB 2023 decision denying OST claims and finding that EPA complied with the National Historic Preservation ACT (NHPA) Section 106, |
| ● | Denied OST claims and found that EPA complied with NHPA Section 110, |
| ● | Denied OST claims that EPA failed to comply with the National Environmental Protection Act (NEPA), |
| ● | Reserved judgment on other OST claims until EPA expands the administrative record adding documents, considers those additional materials, responds to related comments, takes further appropriate action in reissuing the permit decisions; and, |
| 8 | REPORT DATE: JANUARY 6, 2025 |
| ● | The EAB remanded the reserved issues to EPA and specified that any appeals challenging the reissued permit decisions will be limited to the issues reserved in the remand and any modifications to the permits made as a result of the remand. |
The EAB decisions regarding EPA compliance with NHPA and NAPA were favorable rulings and consistent with the 2023 D.C. Circuit Court of Appeals rulings where similar appeals were made by the OST against the NRC Source Material License.
Regarding the portion of the ruling remanded back to the EPA Region 8, it is anticipated that this will be an exercise to formally complete the administrative record. Once the administrative record is complete and the permit decision reissued, the EAB will consider any additional materials and respond to related comments. It is also anticipated that the OST will appeal the reissued permit, but the EAB will rule in favor of the EPA and enCore with minimal impact to the overall project schedule. If the EAB does find merit in the appealed reissued permit, there could be an impact to the project schedule.
A ruling on the issuance of the Aquifer Exemption is currently under appeal to the 8th Circuit Court of Appeals and will rule upon once the EAB issues final ruling on the Class III and Class V UIC permits.
In South Dakota, enCore is advancing work on the major state permits needed to operate the Project. The State Engineer had previously recommended approval of the Inyan Kara (#2686-2) and Madison (#2685-2) Water Rights. The next step to advance water rights will be the resumption of the Department of Agriculture and Natural Resources (DANR) Water Management Board hearings. Efforts are also advancing on the DANR Groundwater Discharge Plan and Large-Scale Permit to Mine approvals. The DANR has recommended conditional approval of the Groundwater Discharge Plan and Large-Scale Permit to Mine, pending completion of all federal challenges of the Class III, Class V and Aquifer Exemption.
3.5 Other Significant Factors and Risks
There are no other significant factors or risks that may affect access, title or the right or ability to perform work on the property that have not been addressed elsewhere in this report.
| 9 | REPORT DATE: JANUARY 6, 2025 |
Figure 3.1: Project Location Map
| 10 | REPORT DATE: JANUARY 6, 2025 |
Figure 3.2: Dewey Burdock Mineral Ownership
| 11 | REPORT DATE: JANUARY 6, 2025 |
Figure 3.3: Surface Use Agreements

| 12 | REPORT DATE: JANUARY 6, 2025 |
4.0 ACCESSIBILITY, CLIMATE, LOCAL RESOURCES, INFRASTRUCTURE AND PHYSIOGRAPHY
4.1 Topography, Elevation and Vegetation
The Project is located at the extreme southwest corner of the Black Hills Uplift. Terrain is thus, in part, undulating to moderately incised at the south and west. The eastern and northern areas are further into the Uplift and are cut by narrow canyons draining the higher hills. Significant drainages are few, with only four or five canyons in the area. These canyons are cut less than 1,000 feet in width between the ridges. Slopes may be gentle or steep depending upon the underlying rock type. Sandstones may form cliffs up to 30 to 45 feet in height that will extend for only hundreds of feet in length.
There is only about 300 feet of elevation change across the Project. The south and west side are at a lower elevation of about 3,600 feet above mean sea level. The highest elevation is at near 3,900 feet above mean sea level in the northeast.
Three major vegetation regions are noted: grassland, ponderosa pine and desert shrub. Grassland vegetation is dominated by buffalo grass, blue grama grass and western wheatgrass. Ponderosa pine occurs with Rocky Mountain juniper. Shrubs are composed of big sagebrush and black greasewood.
Cultivated crops are limited to and consist of flood irrigated hay land. Less than 5% of the Project includes cultivated farming. Most of the vegetation is given over to cattle. A minor portion of the Project covered by stands of ponderosa pine has been selectively logged for pulpwood. Timber is not a significant industry in the area.
4.2 Access
The nearest population center to the Project is Edgemont, South Dakota (population 900) located on US Highway 18, 14 miles east from the Wyoming-South Dakota state line. Fall River County Road 6463 extends northwestward from Edgemont to the abandoned community of Burdock located in the southern portion of the Project, about 16 miles from Edgemont. This road is two-lane and all-weather gravel and continues north from Burdock to the Fall River-Custer County line where it becomes Custer County Road 769. 769 continues to the hamlet of Dewey, a total distance of about 23 miles from Edgemont. The road closely follows the tracks of the BNSF between Edgemont and Newcastle, Wyoming. Dewey is about 2 miles from the northwest corner of the Project.
An unnamed unimproved public access road into the Black Hills National Forest intersects Fall River County Road 6463 4.3 miles southeast of Burdock and extends northward about 4 miles, allowing access to the east side of the Project. About 0.9 miles northwest from Burdock, an unimproved public access road to the west from Fall River County Road 6463 allows access to the western portion of the Project. Private ranch roads intersecting Fall River County Road 6463 and Custer County Road 769 allow access to all other portions of the Project.
| 13 | REPORT DATE: JANUARY 6, 2025 |
As discussed in Section 3.0, Project access is granted by private surface leases, or public access on federal lands. There are no significant limitations to surface access and usage rights that will affect the company’s ability to conduct exploration, development or operations. Since waste rock and tailings will not be generated there is no requirement for surface mine waste disposal and no requirement for acquiring surface rights for on-site disposal. All 11.e.(2) designated waste will be disposed of at an off-site licensed facility, all non 11.e.(2) waste will be disposed of at a local licensed landfill and liquid wastes will be disposed of using licensed lined impoundments and treated liquid effluents will be injected into a subsurface aquifer using permitted Class V injection wells.
4.3 Climate
The general climate of the project area is semi-arid continental or steppe with a dry winter season. Low precipitation, high evaporation rates, low relative humidity and moderate mean temperatures with significant diurnal and seasonal variations characterize the area. The higher Black Hills to the northeast of the project seem to generally moderate temperature extremes especially during winter months. The local climate is not expected to have any adverse impacts to construction or operations. Similar projects have been constructed and operated for decades in neighboring Nebraska and Wyoming. Blizzards and extreme cold during the winter months can cause temporary access restrictions but are typically short lived and have rarely been a significant impedance.
The annual mean temperature in this area of South Dakota is 46°F. The low mean temperature of 20°F occurs in January. The mean high temperature of 74°F occurs in July. The Project averages 198 day/year of below freezing temperatures. Below freezing temperatures generally do not occur after mid-May or before late September.
The average precipitation at the Project is 15 inches. The wettest month is May when rainfall amounts to 3 inches and the driest months are January and December yielding 0.5 inch each month, usually as snow. The average annual snowfall is 37 inches (Figure 4.1).
| 14 | REPORT DATE: JANUARY 6, 2025 |
Figure 4.1: Average Monthly Precipitation (2009 – 2022)

4.4 Infrastructure
The Project is well supported by nearby towns and services. Major power lines are located across the Project and can be accessed for electrical service. The BNSF railroad crosses the Project, and a major railroad siding occurs at Edgemont and may be used for shipment of materials and equipment, if necessary.
Human resources will be employed from nearby population centers. The local communities of Edgemont, Custer and Hot Springs offer sources for labor, housing, offices and basic supplies. It is enCore’s plan to utilize local resources when and where possible supporting the local economy.
Regarding site infrastructure, leases are written to have maximum flexibility for emplacement of tanks, out buildings, storage areas and pipelines. Most of the topography is relatively low lying and undulating and is conducive to development and operations.
The project site has no mining facilities or buildings. The only site equipment related to mining include a weather monitoring station, radiological monitoring stations, and monitor wells. All are accessible by dirt roads.
| 15 | REPORT DATE: JANUARY 6, 2025 |
5.0 HISTORY
5.1 Ownership
Property ownership is often represented by split estate where separate parties own the rights to a surface parcel and the minerals beneath that parcel are owned by a different entity. Historically, when surface real estate was sold, property owners often retained mineral ownership resulting in the above-mentioned spilt estate. Other properties are split estate that were homesteaded under the 1916 Homestead Act granting homesteader surface ownership and the mineral rights were reserved by the U.S. Government.
Uranium minerals were discovered in the vicinity of the Project as early as 1952 and were soon mined by small mining companies using open pit, adit, or shallow underground mines. These mining companies leased the mineral rights from mineral or other claim owners. By the late 1950’s, these deposits came under the control of Susquehanna who had purchased the process mill located in Edgemont. Susquehanna mined most of the known, shallow uranium deposits before closure of the mill in 1972.
During the uranium boom of the 1970s, several companies returned to the Project area, acquired leases and began exploration for deeper deposits. During this period, exploration companies such as Wyoming Mineral, Homestake Mining Company, Federal Resources and Susquehanna discovered deeper uranium roll-front type uranium mineralization. In 1978, TVA purchased Susquehanna’s interest in the Edgemont Uranium Mining District, including the Edgemont mill. TVA made Dewey Burdock its main exploration target and developed enough reserves to warrant mine plans that included an underground mine shaft at both the Burdock and Dewey sites and a new uranium mill that was planned to be located near Burdock. TVA’s plans ended when the price of uranium dropped in the early 1980’s. Eventually, TVA dropped their leases and mining claims.
In 1994, Energy Fuels acquired the properties with an interest in exploration and development of the roll-front deposits. By 2000, Energy Fuels relinquished their land position in the Project.
In 2005, Denver Uranium acquired federal claims and private mineral leases covering 11,180 acres and private surface rights covering 11,520 acres in the Project area. This acreage created a contiguous land position of both surface and mineral rights covering most of the discovered and delineated uranium in this district.
On February 21, 2006, Powertech and Denver Uranium entered into a binding Agreement of Purchase and Sale for the Project assets.
On October 29, 2014, Powertech merged with Azarga Resources Limited forming Azarga Uranium. To further consolidate project resources, Azarga entered into a binding property purchase agreement with Energy Metals on November 18, 2005, whereby Azarga acquired a 100% interest in 119 mineral claims covering approximately 2,300 acres.
In 2021, Azarga and enCore entered into an agreement whereby enCore was to purchase Azarga. In September of 2021, the acquisition was finalized with enCore acquiring multiple assets in various stages of development including the advanced stage Dewey Burdock Project.
| 16 | REPORT DATE: JANUARY 6, 2025 |
5.2 Historic Mineral Resource Estimates
There are no historical mineral resource and mineral reserve estimates within the meaning of NI-43-101 to report; however, historical mineral resources were estimated for TVA by Silver King in 1981, as part of an underground mine feasibility study. Silver King classified resources as identified resources and mineable reserves. Resources were classified based drill density, and categories used are other than categories set out in NI 43-101, Sections 1.2 and 1.3.
Estimation parameters that Silver King used were minimum thickness of 6 feet with a minimum average grade of 0.20% U3O8. As with subsequent evaluations, geological interpretation methods were done on section and plan from surface drillhole information. The study concluded that 5.0 M lbs could be mined by underground methods from a total calculated resource of about 8.0 M lbs.
In 1985, Silver King estimated Project in place identified resources of 10 M lbs. Average grade and tonnage were not specified. Within these in-place pounds, Silver King also estimated underground mineable reserves of approximately 5.0 M lbs, based on a run of mine total of 1,250,000 tons averaging 0.20% U3O8.
As part of the feasibility study, TVA and Silver King conducted several leach studies designed for a conventional milling circuit. Uranium recovery averaged over 99% and mineralization was not refractory. Copies of the same drillhole assay maps were available to RBS&A in 1991 (ref., Smith, 1993 and 1994).
In 1991, RBS&A evaluated the Project to determine if ISR was a viable development approach.
Estimation parameters that RBS&A used were minimum thickness of 6 feet with a minimum average grade of 0.05% U3O8 and thickness with a grade-thickness product of 0.50. RBS&A geological interpretation methods were done on section and plan from surface drillhole information.
RBS&A used a grade-thickness contour method to model the deposit estimating 8.1 M lbs, contained in 1,928,000 tons or rock with an average grade of 0.21% eU3O8.
Powertech purchased all RBS&A data in 2006. These records include documentation of the method of calculation and interpretation.
In 2015, with the merger of Powertech and Azarga, the company reported mineral resources for the Project of 8.5 M lbs of measured and indicated resources, and 3.5 M lbs of Inferred. The average grade and thickness reported for measured and indicated resources was 0.25% eU3O8and 5.2 feet. Inferred resources average grade was 0.05% eU3O8with an average thickness of 4.2 feet.
In 2018, Rough Stock was retained by Azarga and their wholly owned subsidiary Powertech, to prepare an independent resource estimate for the Project (ref., Rough Stock 2018). Rough Stock reported mineral resources for the Project of 16.9 M lbs of measured and indicated resources, and 0.8 M lbs of Inferred. The average grade and thickness reported for measured and indicated resources was 0.11% eU3O8and 5.6 feet. Inferred resources average grade was 0.05% eU3O8with an average thickness of 5.9 feet.
| 17 | REPORT DATE: JANUARY 6, 2025 |
In 2019, Azarga completed an internal mineral resources evaluation which serves as the basis for the Projects current mineral resource estimates. The individual that completed the 2019 evaluation is still with the Project and employed by enCore. Details of this evaluation are discussed in Section 12. MINERAL RESOURCE ESTIMATES.
5.3 Historic Production
Uranium was first produced as early as 1954 by a local group, Triangle Mining, a subsidiary of Edgemont Mining Company. Early commercial production entailed a single, shallow open pit and driving of an adit from both sides of an exposed ridge mining a narrow orebody, on the Burdock side of the project.
Susquehanna acquired the Project in about 1960 and discovered with shallow drilling, sufficient mineralization in the Fall River formation to warrant mining in five or six pits less than 100 feet deep. Susquehanna controlled the mill in Edgemont, which allowed some tolerances to mine low-grade ore that other mining companies could not afford. Susquehanna also had a milling contract with Homestake Mining Company buying ore from the Hauber Mine in northeast Wyoming. If Susquehanna had the Hauber ore to run through the Edgemont mill, the company could afford to mine low-grade ores from the Burdock pits. When the Hauber Mine was depleted and Homestake ceased ore shipments to Edgemont, Susquehanna closed their mining operations at Burdock and elsewhere in the Black Hills.
No actual production records are known for the Susquehanna mines, but it’s estimated that about 200,000 lbs of U3O8was produced.
| 18 | REPORT DATE: JANUARY 6, 2025 |
6.0 GEOLOGICAL SETTING, MINERALIZATION AND DEPOSIT
6.1 Regional Geology
The Black Hills Uplift is a Laramide Age structure forming a northwest trending dome about 125 miles long x 60 miles wide located in southwestern South Dakota and northeastern Wyoming. The uplift has deformed all rocks in age from Cambrian to latest Cretaceous. Subsequent erosion has exposed these rock units dipping outward in successive elliptical outcrops surrounding the central Precambrian granite core. Differential weathering has resulted in present day topography of concentric ellipsoids of valleys under softer rocks and ridges held up by more competent units.
The Cretaceous sediments contain uranium roll front deposits in the more porous and permeable sands within the Inyan Kara Group Lakota and Fall River Formations. These Formations are equivalent to the Cloverly Formation in western Wyoming, the Lakota Formation in western Minnesota, and the Dakota Formation in the Colorado Plateau. The entire Inyan Kara Group consists of basal fluvial sediments grading into near marine sandstones, silts and clays deposited along the ancestral Black Hills Uplift. The sandstones are continuous along the western flank of the Uplift. The Inyan Kara Group unconformably overlies the Jurassic Morrison formation, characterized as a flood plain deposit and terrestrial clay unit. Overlying the Inyan Kara are later early Cretaceous marine shales composed of the Skull Creek, Mowry, and Belle Fourche formations and referred to as the Graneros Group. Post uplift, the entire truncated set of formations was unconformably overlain by the Tertiary White River Formation. The White River consisted of several thousand feet of volcanic ash laden sediments that have since been eroded.
The Inyan Kara is typical of units formed as first incursion of a transgressive sea. The basal fluvial units’ grade into marine units as the ocean inundates a stable land surface. The basal units of the Lakota rest in scours cut into the underlying Morrison shale and display the depositional nature associated with mega-channel systems crossing a broad, flat coastal plain. Between channel sands are thin deposits of overbank and flood plain silts and clays.
Crevasse splays are common and abruptly terminate into inter-channel clays. The upper-most unit of the Lakota Formation is a widespread clay unit generally easily identified on electric logs by a characteristic “shoulder” on the resistivity curve. This unit is known as the Fuson Member. The basal unit of the Fall River Formation is a widespread, thick channel sand deposited in a middle deltaic environment that is evidenced by low-grade coals in its upper portion. Younger Fall River sand units are progressively thinner, less widespread; contain more silt and contain considerably more carbon, denoting a lower deltaic environment of deposition. There is little or no evidence of scouring of the contact between Fall River and the overlying marine Skull Creek. Inundation must have been rapid since within less than 20 feet of sedimentation, rock character goes from middle deltaic, marginal marine to deep marine environment with no evidence of beach deposits or offshore bar systems.
The overall structure of the Black Hills Uplift is relatively simple in that the structure is domal and rock units dip outward away from the central core. Regionally across the Black Hills, subsequent and attendant local doming caused by local intrusions disrupts the general dip of the units. Tensional stress creates fault zones with considerable displacement from one side of the zone to the other. This is often a distance of three or four miles. The Dewey fault zone, a few miles to the north, is a zone of major displacement. The faulting drops the uranium host units several hundred feet and truncates the oxidation reduction contact that formed the Project mineralization. However, detailed geologic and hydrogeologic investigations indicate no evidence of faulting within the permit area.
| 19 | REPORT DATE: JANUARY 6, 2025 |
6.2 Local and Project Geology
The Lakota Formation was deposited by a northward flowing stream system. Sediments consist of point bar and transverse bar deposition. The stream channel systems are typical of meandering fluvial deposition. Sand units fine upward and numerous cut-and-fill sandstones are indicative of channel migration depositing silt and clay upon older sand and additional channel sands overlay older silts and clays. Uranium mineralization occurs in several stratigraphically different sands within the Lakota.
Similar channel deposition occurred during Fall River time, but the channel sands are noticeably thinner with marine sediments immediately superimposed on the fluvial sands. The major sand unit in the basal Fall River is mineralized. On the Dewey side of the property, this mineralization is below the water table; however, on the Burdock mineralization is at or above the water table and is not considered economically viable by ISR.
The lithologic units of the Lakota and Fall River Formations dip about 3° to the southwest off the flank of the Black Hills Uplift. This structure controls present day groundwater hydrogeologic conditions.
The Projects geology is illustrated in stratigraphic column, Figure 6.1, and Figure 6.2 cross-section A – A’.
Figure 6.1 Stratigraphic Column

| 20 | REPORT DATE: JANUARY 6, 2025 |
Figure 6.2: Cross-section A – A’

| 21 | REPORT DATE: JANUARY 6, 2025 |
6.3 Significant Mineralized Zones
6.3.1 Mineralization
Historical TVA reports indicate that uranium minerals are all of +4 valence state and deposited from epigenetic solutions. Sandstone permeability controlled the migration of these epigenetic solutions and deposit formation. The deposit is characterized by numerous roll fronts in the overall deposit. Deposits with multiple roll fronts form because of heterogeneity within the host sands and changes in groundwater oxidation/reduction potential. The deposits are continuous for thousands of feet and in some instances several miles. Individual roll fronts range in thickness from 5 to 12 feet thick and 10 to 50 feet wide. Where roll fronts overlap or nearly overlap vertically, total deposit thickness can be tens of feet thick and hundreds of feet wide. Grade along the length of the roll fronts is highly variable ranging from below detectable up to tenths of a % eU3O8.
6.4 Relevant Geologic Controls
The primary geologic controls for development of the Project’s deposit are:
| ● | The White River Formation uranium source, |
| ● | The permeable sandstones within the Lakota and Fall River Formation, |
| ● | Groundwater and formation geochemical conditions suitable for uranium transport |
| ● | Reductant source (hydrocarbons or carbonaceous materials) within the sandstones to interact with uranium bearing groundwater modifying oxidation/reduction potential of geochemical conditions and precipitation of uranium. |
| 22 | REPORT DATE: JANUARY 6, 2025 |
6.5 Deposit Type
The Project’s deposit type is sandstone hosted uranium roll-fronts. The deposit is characterized by numerous vertically stacked roll-fronts controlled by stratigraphic heterogeneity and variability in groundwater oxidation-reduction potential. Individual roll-fronts are a few tens of feet wide, 5 to 10 feet thick, and often thousands of feet long. Collectively, roll-fronts result in an overall roll-front deposit that is up to a few hundred feet wide, 50 to 75 feet thick and continuous for miles in length.
The uranium deposits in the southern Black Hills region are characteristic of the Rocky Mountain and Intermontane Basin uranium province, United States (ref., Finch, 1996). The uranium province is essentially defined by the extent of the Laramide uplifts and basins.
Roll-front sandstone uranium deposits formed in the continental fluvial basins developed between uplifts. These uranium deposits were formed by oxidizing uranium-bearing groundwater that entered the host sandstone from the edges of the basins. Two possible sources of the uranium were (1) uraniferous Precambrian granite that provided sediment for the host sandstone and (2) overlying Tertiary age (Oligocene) volcanic ash sediments. Major uranium deposits occur as sandstone deposits in Cretaceous and Tertiary age basin sediments. Cluster size and grades for the sandstone deposits range from 500 to 20,000t U3O8, at typical grades of 0.04 to 0.23% U3O8.
The tectono-stratigraphic setting for roll-front uranium ores is in arkosic and fluvial sandstone formations deposited in small basins. Host rocks are continental fluvial and near-shore sandstone. The principal ages of the host rocks are Early Cretaceous (144–97Ma), Eocene (52–36Ma), and Oligocene (36–24Ma), with epochs of mineralization at 70Ma, 35–26Ma, and 3Ma.
Ore mineralogy consists of uraninite, pitchblende and coffinite with associated vanadium in some deposits. Typical alteration in the roll-front sandstone deposit includes oxidation of iron minerals up-dip from the front and reduction of iron minerals down-dip along advancing redox interface boundaries (Figure 6.3).
| 23 | REPORT DATE: JANUARY 6, 2025 |
Figure 6.3: Typical Roll Front Deposit

(ref., Powertech, 2009)
| 24 | REPORT DATE: JANUARY 6, 2025 |
7.0 EXPLORATION
7.1 Drilling
No exploration work has been conducted by or on behalf of enCore since acquisition of the Project. Since Project inception, over 6,300 holes have been drilled on the property by previous operators and the nature and extent of that information is discussed in the following. See Figure 7.1, plan view map of the property showing locations of all drill holes.
7.2 Drilling Type and Procedures
Drilling has been conducted by surface drilling vertical holes. Holes are drilled using direct mud rotary drilling system, where drilling fluid is pumped through the drill pipe, drill bit ports, and back to surface between the pipe and borehole wall. Drilling fluid is typically a mix of clean water and industrial materials added to the water to lift cuttings, stabilize hole to prevent sidewall caving and sloughing, and to clean and lubricate the drilling system.
Hole depth is determined by depth of the deepest stratigraphic unit to be investigated. Hole diameter is determined by drill bit and pipe diameter used.
Drill holes are sampled by collection of drill cuttings, downhole geophysics and core. Cuttings are typically collected every 5 feet and assessed for lithology and color. If core is collected, a coring tool is used to drill and sample lithological material without comprising its natural condition. Holes are also logged for downhole geophysical characteristics to assess lithology type, stratigraphic and structural geologic features, and mineralization location and quality. The collar or surface location of each drill hole is surveyed for azimuth and bearing, and since mineralized stratigraphic horizons are nearly horizontal and drill holes are nearly vertical, mineralization’s true thickness is represented in geophysical and core data.
Initial Project exploration was wide spaced drilling at miles or thousands of feet between drill holes. With increasing geologic knowledge and confidence, closer spaced drilling was conducted on drilling densities of 250 x 500, 100 x 250 and 100 x 100 feet.
7.3 Past Exploration
Exploration in the vicinity of the Project began in 1952 following discovery of uranium minerals in Craven Canyon in the Edgemont District. Early efforts by the US Atomic Energy Commission and the USGS determined the Lakota and Fall River formations were potential uranium host formations.
Early ranchers and prospectors made the first uranium discovery in outcrops of the Fall River formation. Prospectors leased their holdings to local uranium mining companies who first drilled shallow exploration holes with wagon drills and hand-held Geiger probes. Sufficient uranium was discovered to warrant mine development by adit and shallow decline. Susquehanna drilled the first deep holes (600 ft) discovering unoxidized uranium roll-front deposits in the Lakota formation.
| 25 | REPORT DATE: JANUARY 6, 2025 |
Figure 7.1. Drill Hole Locations

| 26 | REPORT DATE: JANUARY 6, 2025 |
After acquisition of the Project by TVA in 1978, its contractor, Silver King Mine, evaluated previous exploration data and began its own exploration program. Exploration and development drilling continued until 1986. When TVA allowed its leases to expire, approximately 6,000 holes had been drilled on the Project.
TVA conducted downhole petrophysical analysis using a downhole suite consisting of gamma, self-potential and resistivity measurement, to evaluate uranium and lithologic characteristics.
TVA drilled approximately 64 core holes on the Burdock to determine deposit uranium equilibrium conditions. Results did show that mineralization is in equilibrium and that gamma logging provides an accurate measurement of in-situ uranium grade.
TVA completed an extensive development drilling program and hydrologic study, and in 1981 finalized a feasibility study anticipating underground mine development. The mine was planned with five shafts, three on the Burdock deposit and two on the Dewey. Forecasted mine production was 750 tons/day with a mining cutoff grade of 6.0 ft of 0.20% eU3O8. Total LOM estimated production was 5.0 M lbs U3O8. Later studies evaluated constructing a processing mill on site that would also process other ores mined in the Edgemont District.
Between 1982 and 1986 TVA performed assessment drilling that was required to hold lode mining claims. This effort ended in 1988, and claims and leases were allowed to expire.
In 1992, Energy Fuels acquired Project leases and drillhole information. Energy Fuels intended to develop an ISR mine and retained RBS&A as an independent consultant to evaluate the Project. Energy Fuels did no exploration or development drilling and in 2000, International Uranium Corporation, the successor to Energy Fuels, dropped their Project holdings.
Previous operator, Powertech, conducted the most recent drilling on the Project drilling 91 holes between 2007 and 2008. Depths ranged from 185 to 761 feet. Core was collected in 10 holes and 12 were completed as water wells. Core was collected for metallurgical and leach testing, and wells were installed to perform pump testing. Holes were drilled in areas away from known mineral resources, but where mineralization had been intersected. In 56 of the holes, mineralization was intersected with grades more than 0.05% eU3O8.
Drilling confirmed the location of mineralization and reinforced confidence in the resource model. While higher uranium grades were not encountered, results did justify future closer spaced drilling.
Powertech did collect core from 10 of the 91 holes. 10 feet-long by 4 inches in diameter core barrel was used. A total of 407 feet of core was recovered. Samples were collected from within four separate areas with defined mineral resources. Coring was planned to intersect various parts of deposits obtaining samples for chemical analyses and for metallurgical testing.
Six holes were cored in the Fall River Formation and four holes were cored in the Lakota Formation. Table 7.1 and Table 7.2 present a listing of the uranium values in these core holes, as determined by down-hole radiometric logging for the Fall River and Lakota Formations, respectively.
| 27 | REPORT DATE: JANUARY 6, 2025 |
Table 7.1: Results of Fall River Formation Core Holes
| Core Hole Number | Depth (ft) | Mineralization | GT | Highest ½ ft Interval | ||||
| DB 07-29-1C | 579.5 | 12.5’ of 0.150% eU3O8 | 1.88 | 0.944% eU3O8 | ||||
| DB 07-32_1C | 589.5 | 5.0’ of 0.208% eU3O8 | 1.88 | 0.774% eU3O8 | ||||
| DB 07-32-2C | 582.5 | 16.0’ of 0.159% eU3O8 | 2.54 | 0.902% eU3O8 | ||||
| DB 07-32-3C | - | No Mineralized Sand Rec Recovered | - | - | ||||
| DB 07-32-4C | 559.0 | 13.0’ of 0.367% eU3O8 | 4.77 | 1.331% eU3O8 | ||||
| DB 08-32-9C | 585.5 | 10.5’ of 0.045% eU3O8 | 0.47 | 0.076% eU3O8 |
Table 7.2: Results of Lakota Formation Core Holes
| Core Hole Number | Depth (ft) | Mineralization | GT | Highest ½ ft Interval | ||||
| DB 07-11-4C | 432.5 | 6.0’ of 0.037% eU3O8 | 0.22 | 0.056% eU3O8 | ||||
| DB 07-11-11C | 429.5 | 7.0’ of 0.056% eU3O8 | 0.40 | 0.061% eU3O8 | ||||
| DB 07-11-14C | 415.0 | 9.0’ of 0.052% eU3O8 | 0.47 | 0.126% eU3O8 | ||||
| DB 07-11-16C | 409.0 | 3.5’ of 0.031% eU3O8 | 0.17 | 0.041% eU3O8 |
Overall core recovery, despite poor hole conditions in DB 07-32-3C, was greater than 90%.
Laboratory analyses were performed on select core samples to determine the permeability and porosity of the mineralized sands, and the overlying and underlying clays.
Analyses of the sandstone samples showed horizontal permeabilities ranging from 449 to 3207 millidarcies. Horizontal permeabilities within this range are indicative of flow rates conducive for successful mine operations. Analyses of overlying and underlying confining unit core samples showed low vertical permeabilities ranging from 0.007 to 0.697 millidarcies. Low vertical permeabilities were expected from confining unit samples and bolster confidence that overlying and underlying shales will ensure production fluid confinement to the production zone sand.
Powertech did complete 12 of the 91 drills holes as wells in both Fall River and Lakota sands. Wells were used in conjunction with existing wells for collection of water quality sampling and hydrostatic pump tests. Groundwater quality and hydrology data are available for public review in the permit applications submitted to the NRC and the State of South Dakota.
7.4 Accuracy and Reliability
Past drilling practices were conducted in accordance with industry standard procedures and the most recent drilling conducted by Powertech, confirmed historical drill results in previously intersected mineralization for thickness, grade and location. The QP of this report is knowledgeable of the 2007 and 2008 work and technical participants who were responsible for the work.
It is the opinion of this QP that there are no drilling, sampling or recovery factors that materially affect the accuracy and reliability of results; however, the QP does provide additional opinion in Section 9.0 DATA VERIFICATION and Section 23.0 RECOMMENDATIONS.
| 28 | REPORT DATE: JANUARY 6, 2025 |
7.5 Hydrogeology
Substantial work has been done by previous companies to characterize the hydrogeology of the sandstone hosted uranium deposits, with respect specifically to:
| ● | Permeability of the mineralized horizon, |
| ● | Hydrologic confinement of the mineralized horizon; and, |
| ● | Ability to return groundwater within the mined area to original baseline quality and usage. |
Because of the amount and importance of hydrogeology to ISR development of sandstone hosted uranium systems, considerable technical detail is provided.
Within the Project area the uppermost hydro-stratigraphic unit and the production hydro-stratigraphic unit are both the Inyan Kara, the underlying hydro-stratigraphic unit is the Unkpapa Formation (or Sundance if the Unkpapa is not present). There is no overlying hydro-stratigraphic unit within the project area other than minor localized alluvial hydro-stratigraphic units.
7.5.1 Hydraulic Properties of the Inyan Kara
Hydraulic information presented is based on results of work completed by Powertech and TVA. Powertech completed groundwater sampling, piezometric surface mapping, and individual hydro-stratigraphic tests within both the Dewey and Burdock project area in 2007-2009. TVA completed three hydro-stratigraphic tests. One test was conducted just north of the Dewey project area in 1982, and two tests were performed within the Burdock in 1979 (ref., Powertech, 2013a and 2013b).
Powertech installed monitor and pumping wells, conducted hydro-stratigraphic testing, groundwater sampling, and developed regional and wellfield scale groundwater models.
The following section discusses the results of hydro-stratigraphic and geotechnical tests.
7.5.1.1 Dewey
Two hydro-stratigraphic test programs were completed within or just outside of Dewey, by TVA in 1982 (ref., Powertech, 2013a) and Powertech in 2008 (ref., Powertech, 2013c).
The TVA test consisted of pumping the Lakota Formation for 11 days at an average rate of 495 gpm from a screened interval 75 feet in length. The results of the test yielded:
| ● | Transmissivity average of 590 ft2/day; and |
| ● | Storativity of approximately 0.0001 (dimensionless). |
TVA recorded a hydraulic response in the Fall River through the intervening Fuson Member late in the hydro-stratigraphic unit test (3,000 to 10,000 minutes). TVA calculated the vertical hydraulic conductivity of the Fuson Member to be 0.0002 ft/day using the Neuman-Witherspoon ratio method (ref., Neuman and Witherspoon, 1972).
| 29 | REPORT DATE: JANUARY 6, 2025 |
TVA observed a barrier boundary, or a decrease in transmissivity due to lithologic changes or lithologic changes with distance from the site. A possible geologic feature corresponding to a barrier was noted to be the Dewey Fault Zone, located approximately 1.5 miles north of the test site, where the Lakota and Fall River Formations are structurally offset.
Powertech’s 2008 test consisted of pumping in the Fall River Formation for 74 hours at an average rate of 30.2 gpm from a screened interval 15 feet in length. The results of the test yielded:
| ● | Ten determinations of transmissivity ranging from 180 to 330 ft2/day, with the median value of 255 ft2/day; and |
| ● | Five determinations of storativity ranged from 0.000023 to 0.0002 with a median value of 0.000046. |
Powertech recorded a delayed response in the upper Fall River Formation which indicates lateral and vertical anisotropy due to interbedded shales in the formation. No flow was observed through the Fuson Member between the Fall River and the Lakota.
In addition to the 2008 hydro-stratigraphic test, Powertech collected core from the Fall River Formation, the same stratigraphic unit that was hydro-stratigraphically tested. Laboratory measurements of horizontal and vertical hydraulic conductivity, from the core, measured:
| ● | Horizontal hydraulic conductivity was 6.1 ft/day; and |
| ● | Horizontal to vertical hydraulic conductivity ratio of 4.5:1. |
Core was also collected for confining units above the Fall River (Skull Creek Shale), and between the Fall River and Lakota (Fuson Shale). Laboratory measurements of horizontal and vertical to hydraulic conductivity on these hydro-stratigraphic units measured:
| ● | Skull Creek Shale: average vertical hydraulic conductivity of 0.000015 ft/day; and |
| ● | Fuson Shale: average vertical hydraulic conductivity of 0.000018 ft/day. |
Water level data collected by Powertech from a nest of vertical wells, at Dewey, indicated that the Unkpapa, Lakota, and Fall River hydro-stratigraphic units are confined and locally hydraulically isolated. Generalized water level data for the Lower Fall River Sandstone that hosts uranium mineralization in the Dewey project area are detailed in Table 7.3.
Table 7.3: Dewey Production Area Water Level Data (MSL)
| Hydro-Stratigraphic Unit | Top Elevation (ft) | Bottom Elevation (ft) | Static Water Elevation (ft) | Available Drawdown (ft) | ||||||||||||
| Lower Fall River | 3,151 | 3,011 | 3,642 | 491 | ||||||||||||
7.5.1.2 Burdock
Three hydro-stratigraphic tests were completed at Burdock. Two tests were completed by TVA in 1979 (ref., Powertech, 2013b), and a third by Powertech in 2008 (ref., Powertech, 2013c).
| 30 | REPORT DATE: JANUARY 6, 2025 |
The 1979 tests consisted of pumping in the Lakota Formation for 73 hours at an average rate of 200 gpm and pumping in the Fall River for 49 hours at an average rate of 8.5 gpm. A single pumping well was utilized for these tests, with a pneumatic packer set to separate the screened intervals within the Lakota and Fall River. The screen length in the Lakota was approximately 75 feet, and in the Fall River 55 feet. The results of the hydro-stratigraphic unit tests yielded the following data:
| ● | Interpreted transmissivity of the Lakota was based on analysis of late time data and inferred decreasing transmissivity with distance from the test site due to changes in lithology; overall transmissivity averaged approximately 190 ft2/day and storativity was 0.00018. The maximum transmissivity determined from early time was approximately 310 ft2/day, |
| ● | Transmissivity of the Fall River averaged approximately 54 ft2/day and storativity of 0.000014, |
| ● | Communication was observed between the Fall River and Lakota Formations through the intervening Fuson shale; and leaky behavior was observed in the Fall River Formation; and, |
| ● | The vertical hydraulic conductivity of the Fuson Shale determined with the Neuman-Witherspoon ratio method (ref., Neuman and Witherspoon, 1972) was estimated to be 0.001 to 0.0001 ft/day. |
Powertech’s 2008 test consisted of pumping in the Lakota Formation for 72 hours at an average rate of 30.2 gpm from a screened interval 10 feet in length. The results of the hydro-stratigraphic unit test yielded the following data:
| ● | Nine determinations of transmissivity ranged from 120 to 223 ft2/day with a median value of 150 ft2/day; and |
| ● | Four storativity determinations ranged from 0.000068 to 0.00019 with a median value of 0.00012. |
In addition to the 2008 pump test, Powertech collected and submitted Lakota sandstone core samples, from the same stratigraphic intervals tested during the hydro-stratigraphic test. Laboratory measurements from core of horizontal and vertical hydraulic conductivity measured:
| ● | Horizontal hydraulic conductivity ranged from 5.9 to 9.1 ft/day, and a mean value of 7.4 ft/day; and, |
| ● | Horizontal to vertical hydraulic conductivity ratio of 2.47:1. |
Core was also collected for confining units above and below the Lakota Formation, in the Fuson and Morrison Shales. Laboratory measurements of horizontal and vertical hydraulic conductivity measured:
| ● | Fuson shale: average vertical hydraulic conductivity of 0.00027 ft/day; and |
| ● | Morrison shale: average vertical hydraulic conductivity of 0.00006 ft/day. |
| 31 | REPORT DATE: JANUARY 6, 2025 |
Water level data collected by Powertech from a vertical well nest, at Burdock, indicate that the Unkpapa, Lakota, and Fall River hydro-stratigraphic units are confined and locally hydraulically isolated. Generalized water level data for the Lower Lakota Sandstone that hosts uranium mineralization in the Burdock project area are detailed in Table 7.4.
Table 7.4: Burdock Production Area Water Level Data (MSL)
| Hydro-Stratigraphic Unit | Top Elevation (ft) | Bottom Elevation (ft) | Static Water Elevation (ft) | Available Drawdown (ft) | ||||||||||||
| Lower Lakota | 3,290 | 3,245 | 3,660 | 370 | ||||||||||||
The data collected by TVA and Powertech is sufficient to characterize the Project’s hydrogeologic regimes of the production zone and confining hydro-stratigraphic units. Table 7.5 summarizes groundwater flow parameters determined for the project.
Table 7.5: Hydro-stratigraphic unit Property Summary for the Dewey Burdock Project
| Transmissivity (ft2/day) | Horizontal Hydraulic Conductivity* (ft/day) | Vertical Hydraulic Conductivity* (ft/day) | ||||||||||||||||||
| Geologic Unit | TVA | Powertech | Powertech | TVA | Powertech | |||||||||||||||
| Dewey | ||||||||||||||||||||
| Skull Creek | - | - | - | - | 1.5 x 10⁻⁵ | |||||||||||||||
| Fall River | - | 255 (15’ Screen) | 6.1 | - | - | |||||||||||||||
| Fuson | - | - | - | 2.0 x 10⁻⁴ | 1.8 x 10⁻⁵ | |||||||||||||||
| Lakota | 590 (75’ Screen) | - | - | - | - | |||||||||||||||
| Morrison | - | - | - | - | - | |||||||||||||||
| Burdock | ||||||||||||||||||||
| Skull Creek | - | - | - | - | - | |||||||||||||||
| Fall River | 54 (55’ Screen) | - | - | - | - | |||||||||||||||
| Fuson | - | - | - | 10-3 to 10-4 | 2.7 x 10⁻⁴ | |||||||||||||||
| Lakota | 190 (75’ Screen) | 150 (10’ Screen) | 7.4 | - | - | |||||||||||||||
| Morrison | - | - | - | - | 6.0 x 10⁻⁵ | |||||||||||||||
| * | Core Material |
7.5.2 Hydrogeologic Considerations for ISR Mining
Analysis of the Fall River and Lakota Formations hydrogeologic data suggests that a range of pumping rates will be achievable during operations. The artesian conditions in the Fall River and hydro-stratigraphic unit transmissivity provide favorable conditions for ISR mining techniques. The existing hydro-stratigraphic unit parameters will allow significant dissolved oxygen to be maintained in the groundwater for uranium oxidation and extraction.
| 32 | REPORT DATE: JANUARY 6, 2025 |
7.5.3 Hydrogeologic Considerations for ISR Mining Impact to Groundwater System
In February 2012, Petrotek completed a three-dimensional numerical model to evaluate the response of the Fall River and Chilson hydro-stratigraphic units to Project operations. (ref., Powertech, 2013d). The model was developed using site-specific data regarding top and bottom hydro-stratigraphic unit elevations, saturated thicknesses, potentiometric surfaces, hydraulic gradients, hydraulic conductivities, specific yields, storativities, and porosities. The model was calibrated to existing conditions and to three pumping tests.
Once calibrated, the model was used to simulate the complete operational Project cycle, from production through post-restoration recovery. Simulations were run using production rates of 4,000 and 8,000 gpm, a restoration rate of up to 500 gpm, and net bleeds ranging from 0.5 to 1.0%. Modeling results indicated the following:
| ● | Simulated production at rates of 4,000 and 8,000 gpm with 0.5 to 1.0% bleeds for a period of 8.5 years did not result in hydro-stratigraphic unit dewatering, |
| ● | The maximum drawdown simulated outside the project area was less than 12 feet, |
| ● | Restoration using reverse osmosis at a rate of up to 500 gpm per wellfield with a 1.0% bleed was simulated to be sustainable throughout a restoration cycle of 6 pore volumes, |
| ● | Groundwater sweep simulated at rates to remove one pore volume every 6 to 18 months per wellfield did not result in localized dewatering of the hydro-stratigraphic unit, |
| ● | Wellfield interference was shown to be manageable for the simulated production, restoration and net bleed rates through sequencing of wellfields to maximize distances between concurrently operating units, |
| ● | Model simulations indicate limited drawdown will occur within the Fall River because of ISR operations within the Chilson; and, |
| ● | Simulated water levels were shown to recover to near pre-operational elevations within one year of ISR cessation. |
| 33 | REPORT DATE: JANUARY 6, 2025 |
7.5.4 Groundwater Chemistry
NRC ISR licensing regulations and guidance specify that site characterization of pre-mining groundwater chemistry data be determined from the production, underlying, overlying, and uppermost hydro-stratigraphic units. At the Project, the uppermost and production hydro-stratigraphic unit are the Inyan Kara, and the underlying hydro-stratigraphic unit is the Unkpapa Formation. There is no overlying hydro-stratigraphic unit within the project area other than minor localized alluvial hydro-stratigraphic units.
Across the Black Hills region, the Inyan Kara groundwater ranges from soft to very hard and fresh to slightly saline. Compared to other regional hydro-stratigraphic units, the Inyan Kara has relatively high concentrations of sulfate, sodium, and magnesium. These concentrations, along with chloride, are generally higher in the southern Black Hills. The exact source of the sulfate is uncertain but could be the result of oxidation of sulfide minerals such as pyrite within the Inyan Kara (ref., RESPEC 2008a).
Chemical composition and pH of groundwater within the Inyan Kara vary based upon distance from the outcrop. Previous studies indicate the groundwater pH increases down dip, as well as a change from calcium sulfate type water near outcrop to sodium sulfate down gradient.
The Inyan Kara is a principal uranium-bearing unit in the southwestern Black Hills. As such, the hydro-stratigraphic unit typically has measurable amounts of dissolved uranium, radium-226, radon-222, and other byproducts of radioactive decay. In addition to the radionuclides, high concentrations of sulfate and dissolved solids deter use of the Inyan Kara as a source of drinking water (ref., RESPEC 2008b).
Groundwater chemistry data for the Fall River Formation and Lakota Formation of the Inyan Kara are shown in Table 7.6 (ref., Powertech, 2013e). Minimum, maximum, and mean concentrations are based upon background data collected for the Dewey Burdock NRC Source and Byproduct Materials License application. In general, the Project water of the Inyan Kara is characterized by high concentrations of dissolved solids, sulfate, and radionuclides. Mean concentrations of sulfate, dissolved solids, manganese, and radionuclides (gross alpha, Radon-222) exceed EPA MCL’s for drinking water quality standards in over half of the samples collected.
| 34 | REPORT DATE: JANUARY 6, 2025 |
Table 7.6: Groundwater Chemistry for Fall River and Chilson Formations
| Analyte | Units | Fall River Hydro ID Means | Chilson Hydro ID Means | ||||
| Min | Max | Mean1 | Min | Max | Mean1 | ||
| pH, Laboratory | s.u. | 7.10 | 8.45 | 7.92 | 7.10 | 8.05 | 7.64 |
| (TDS) | mg/L | 773.85 | 2250.00 | 1275.01 | 708.33 | 2358.33 | 1263.38 |
| Major Ions | |||||||
| Bicarbonate as HCO3 | mg/L | 142.92 | 239.67 | 195.92 | 86.75 | 318.25 | 206.27 |
| Calcium, Dissolved | mg/L | 30.10 | 368.00 | 110.93 | 34.74 | 385.50 | 145.84 |
| Carbonate as CO3 | mg/L | <5 | 7.85 | 2.95 | <5 | 3.125 | 2.54 |
| Chloride | mg/L | 9.50 | 47.00 | 15.62 | 5.00 | 17.50 | 10.06 |
| Magnesium, Dissolved | mg/L | 10.51 | 133.75 | 38.56 | 11.80 | 124.14 | 51.34 |
| Potassium, Dissolved | mg/L | 7.08 | 15.98 | 11.20 | 7.18 | 21.65 | 13.57 |
| Sodium, Dissolved | mg/L | 86.60 | 502.50 | 236.23 | 47.42 | 283.00 | 168.00 |
| Sulfate | mg/L | 425.38 | 1442.50 | 743.25 | 388.77 | 1509.17 | 733.54 |
| Metals, Total | |||||||
| Arsenic | mg/L | 0.00075 | 0.00379 | 0.00205 | 0.001 | 0.02 | 0.005 |
| Chromium | mg/L | <0.05 | <0.05 | <0.05 | <0.05 | <0.05 | <0.05 |
| Copper | mg/L | <0.01 | <0.01 | <0.01 | <0.01 | 0.0425 | 0.008 |
| Iron | mg/L | 0.042 | 4.76 | 0.82 | 0.08 | 15.30 | 3.33 |
| Lead | mg/L | <0.001 | 0.002 | 0.001 | <0.001 | 0.026 | 0.0032 |
| Manganese | mg/L | 0.03000 | 2.48 | 0.33 | 0.04 | 1.74 | 0.36 |
| Mercury | mg/L | <0.001 | <0.001 | <0.001 | <0.001 | <0.001 | <0.001 |
| Molybdenum | mg/L | <0.01 | 0.03 | 0.04 | <0.01 | 0.075 | 0.05 |
| Selenium | mg/L | <0.001 | 0.001 | 0.001 | <0.001 | 0.0019 | 0.001 |
| Strontium | mg/L | 0.65 | 6.20 | 2.18 | 0.70 | 7.45 | 3.04 |
| Uranium | mg/L | <0.0003 | 0.11 | 0.01 | <0.0003 | 0.02 | 0.0046 |
| Zinc | mg/L | <0.01 | 0.01 | 0.01 | <0.01 | 0.13 | 0.03 |
| Radionuclides | |||||||
| Gross Alpha, Dissolved | pCi/L | 5.58 | 1504 | 272 | 3.56 | 4990 | 418 |
| Radium 226, Dissolved | pCi/L | 1.18 | 388 | 67 | 1.2 | 1289 | 103 |
| Radon 222, Total | pCi/L | 276.83 | 278,000 | 27,100 | 196 | 180,000 | 21,200 |
Note 1. ½ x reporting limit used to calculate mean where non-detect results occurred
| |||||||
| Analyte concentration exceeds standard for: | |||||||
| Federal MCL | |||||||
| Secondary Standard | |||||||
| Proposed MCL | |||||||
7.5.5 Assessment of Dewey Burdock Project Hydrogeology
The data confidence level is typical of a uranium ISR project at this stage of development. Prior to the development of each individual wellfield, enCore will complete specific testing including coring and hydro-stratigraphic unit testing that will increase confidence and understanding.
| 35 | REPORT DATE: JANUARY 6, 2025 |
8.0 SAMPLE PREPARATION, ANALYSIS AND SECURITY
8.1 Sample Methods
Samples are collected from drill holes by collecting drill cuttings, downhole geophysics and core samples. Sampling, sample preparation and security are described in the following sections.
8.1.1 Downhole Geophysical Data
Geophysical data is collected using a logging truck equipped with gamma, resistivity and spontaneous potential logging tools. A continuous measurement of downhole geophysical properties is measured from total hole depth to surface. This suite of logs is ideal for defining lithologic units in the subsurface. The resistivity and spontaneous potential tools are used define lithology by qualitative measurements of water conductivities.
The gamma tool provides an indirect measurement of uranium content. Gamma radiation is measured in one-tenth foot intervals and converted to gamma ray readings measured in counts-per-second into %-eU3O8. Equivalent percent uranium grades are reported in one-half foot increments.
To ensure geophysical data quality control, tools are calibrated at a US Depart of Energy test pit. The test pit has a known uranium source concentration and using industry calibration procedures tools are calibrated, to ensure consistent measurement and reporting of uranium concentrations from US deposits.
8.1.2 Drill Cuttings
Drill cuttings are collected at 5-foot intervals while drilling. Samples are arranged on the ground in order of depth to show changes in lithology and color. Lithology and color are recorded on a lithology log for entire hole depth. Particular attention is paid to color in the mineralized sand to assess oxidation/reduction potential. Cuttings are not chemically assayed as drilling mud will contaminate samples and precise sample location or depth cannot be determined from cuttings.
8.1.3 Core Samples
Core samples are collected to conduct chemical analyses, metallurgical testing, and testing of physical parameters of lithologic units. Retrieved cores are measured to determine core recovery. Cores are also washed, photographed and described. In preparation for laboratory analysis, to maintain moisture content and prevent oxidation, core is wrapped in plastic, boxed and frozen or iced.
| 36 | REPORT DATE: JANUARY 6, 2025 |
8.2 Laboratory Analysis
As discussed in Section 10.2, previous operator, Powertech, conducted the most recent drilling on the Project in 2007 and 2008, and as part of that work did collect core for laboratory analysis.
Powertech submitted 6-inch intervals of whole core for physical parameter testing (permeability, porosity, density). Core from mineralized sands were also submitted in 6-inch intervals but these samples were split in half and used for chemical analyses and metallurgical testing.
Samples were submitted to Energy Laboratories in Casper, Wyoming. Energy Laboratories is certified through the National Environmental Laboratory Accreditation Program, which establishes and promotes mutually acceptable performance standards for the operation of environmental laboratories. The standards address analytical testing, with State and Federal agencies and serve as accrediting authorities with coordination facilitated by the EPA to assure uniformity. Chain of Custody procedures were followed by Powertech and Energy Laboratories during sample transfer.
8.3 Opinion on Adequacy
The QP of this report is knowledgeable of Powertech’s 2007 and 2008 program and individuals who were responsible for the work. It is the opinion of this QP that quality control procedures and quality assurance actions do provide adequate confidence in data collection and estimation, and that samples were adequately prepared, and security and analytical procedures were followed and there are no factors that materially affect the accuracy and reliability of results.
With respect to historical sample preparation, security and analytical procedures for work performed by operators prior to Powertech, this information is not available and cannot be confirmed.
| 37 | REPORT DATE: JANUARY 6, 2025 |
9.0 DATA VERIFICATION
9.1 Data Confirmation
Numerous companies have worked on the Project since the 1950’s and as a result numerous data sets of different vintages exist. enCore has a nearly complete data set for the Project. The QP of this report has reviewed geophysical, core and hydrogeologic technical data. Technical data is stored in digital format for geologic interpretation and modeling. The QP has reviewed geologic interpretations and the resultant models, in the form of cross-sections, isopach and structural maps, and uranium roll front deposit models.
9.2 Limitations
The work done by enCore and previous operators to verify historical records does validate Project information. Data are available for over 6,300 drill holes and for approximately 24% of the holes, enCore does not have the actual geophysical logs. The company does have collar location and mineralization data, for all holes, and have used data from surrounding holes to verify data for holes with missing geophysical logs. Considering drilling density, enCore’s approach to data verification is a reasonable means to confirm data validity; however, not having data in hand does limit knowledge of precise location of downhole information.
9.3 Data Adequacy
A considerable amount of work has been done by enCore and previous operators to ensure an adequate data set exists for the Project. It is the QP’s opinion that the data used in this technical report is adequate for technical reporting. Since enCore has done no drilling on the project, it is recommended that as part of their 2025 program, confirmation holes are drilled to verify data from missing geophysical logs.
Based on data quality, efforts of others, and the QP’s review, it is the opinion of the QP that there are no known data factors that will materially affect the accuracy and reliability of results; however, enCore should proceed with recommended actions addressing uncertainties to further improve confidence in data adequacy.
| 38 | REPORT DATE: JANUARY 6, 2025 |
10.0 MINERAL PROCESSING AND METALLURGICAL TESTING
10.1 Procedures
Powertech conducted leach amenability studies on uranium core samples obtained during their 2007 drilling program. Powertech conducted the tests at ELI’s Casper facility between July 27 and August 3, 2007. Leach amenability studies were intended to demonstrate that the uranium mineralization is capable of being leached using conventional ISR chemistry. The leach solution was prepared using sodium bicarbonate as the source of the carbonate complexing agent (formation of uranyldicarbonate (UDC) or uranyltricarbonate ion (UTC)). Hydrogen peroxide was added as the uranium-oxidizing agent as the tests are conducted at ambient pressure. Sequential leach “bottle roll” tests were conducted on the four core intervals selected by Powertech personnel. The tests were not designed to approximate in-situ conditions (permeability, porosity, pressure) but are an indication of an ore’s reaction rate and potential uranium recovery.
10.2 Evaluation
10.2.1 Ambient Bottle Roll Tests
ELI reported that acid producing reactions were occurring during the initial leaching cycles and this is consistent with the core samples having been exposed to air during unsealed storage. This may have influenced uranium leaching kinetics and final uranium extraction, but two other aspects of the work deserve emphasis: (1) the coarsest grain size in two of the four leach residues had very high uranium assays; and (2) all four composites contained leachable vanadium.
The 615.5-616.5 ft interval of Hole # DB0732-2C produced a 30 PV leach residue assaying 2.95% U3O8 in the +20-mesh fraction, and the same coarse fraction from the 616.5-617.3 ft interval of that hole assayed 5.02% U3O8. The weight fractions were small, 0.7% and 1.8%, but the respective uranium distributions were 28% and 30% of total uranium retained in the residues. Possibly, these losses in the coarsest grain fraction were due simply to calcite encapsulation or another post-mineralization event. In any case, a QEMSCAN characterization of the uranium could shed light on the likelihood of increased uranium dissolution by reagent diffusion during longer retention times in a commercial wellfield. If this interpretation is supported by new evidence, there is a potential for ultimate uranium extractions (not overall recoveries) well over 90% from higher-grade intervals. Table 13.1 includes calculated uranium extractions based on the ELI leach tests without accounting for possible improvements at longer retention times.
The leach tests were conducted on four core intervals recovered from two holes. One interval represented low-grade resource at 0.067% U3O8and the other three intervals represented resource ranging from 0.14% U3O8 to 0.74% U3O8. Based on the known volume of core in the selected intervals and the apparent wet density, wet masses of sample representing a 100mL pore volume (PV), assuming 30% porosity, were delivered to the reaction vessels. 5 PV lixiviant charges (500mL of 2g/L NaHCO3, 0.5 g/L H2O2) were mixed with the resource samples and vessel rotation was started. Over a six-day period, 30PV of lixiviant was delivered to and extracted from the vessels.
| 39 | REPORT DATE: JANUARY 6, 2025 |
10.3 Results
As shown in Table 10.1, the four composites contained variable concentrations of vanadium, but most of it, at least by one method of calculation, was dissolved by the oxygenated bicarbonate lixiviant. The uranium and vanadium dissolutions in Table 10.1 were calculated from worksheets describing individual ELI leaching cycles and are based on assays of heads and residues. There are analytical uncertainties, however, so Tables 10.2 and 10.3 summarize results obtained by different approaches. The uranium dissolutions in Table 10.2 are based on dividing the uranium mass in the leachates by the sum of the masses of uranium in leachates and residues. The vanadium dissolutions in Table 10.3 are based on dividing the sum of the vanadium masses in the leachates by the vanadium mass in the sample prior to leaching. Thus, the vanadium dissolutions given in Table 10.3 are lower than those in Table 10.1, while the uranium dissolutions in Tables 10.1 and 10.2 are comparable (ref., Roughstock, 2018). Available data do not allow a rigorous determination of the amount of vanadium that will dissolve during commercial leaching, but vanadium will be present in the pregnant leach solutions.
Analyses of the resulting leach solution indicated leach efficiencies of 71% to 92.8% as shown in Table 10.1. Peak recovery solution grades ranged from 414 mg/L to 1,654 mg/L. Tails analysis indicated efficiencies of 75.8% to 97%, see Table 10.2. The differences between the two calculations are likely to involve the difficulty in obtaining truly representative 1 g subsamples of the feed and tails solids. The solution assays are believed to be more accurate and representative than the feed/tails results, and they typically showed a less conservative estimate of uranium leachability.
These preliminary leach tests indicate that the uranium deposits at Dewey Burdock appear to be readily mobilized in oxidizing solutions and potentially well suited for ISR mining. The results presented in this section provide an indication of the leachability of uranium from the host formation. The results are not an absolute indication of the potential head grade or recoverability; however, based on operating information and experience from other ISR operations, the data do support the use of an average head grade of 60 ppm and recovery rate of 80%.
Table 10.1: Uranium and Vanadium Dissolutions Based on Solids Assays
| Core Assays (mg/kg) | Residue Assays (mg/kg) | Dissolution (%) | ||||||||||||||||||||||
| Sample | Uranium | Vanadium | Uranium | Vanadium | Uranium | Vanadium | ||||||||||||||||||
| DB 07-11-4C #1 | 670 | 59 | 70 | 35 | 90.3 | 45.0 | ||||||||||||||||||
| DB 07-32-2C #2 | 2,020 | 678 | 625 | 475 | 71.0 | 74.7 | ||||||||||||||||||
| DB 07-32-2C #3 | 7,370 | 378 | 2,336 | 358 | 71.0 | 5.9 | ||||||||||||||||||
| DB 07-32-2C #4 | 1,370 | 79 | 103 | 31 | 92.8 | 61.4 | ||||||||||||||||||
(ref., Roughstock, 2018)
| 40 | REPORT DATE: JANUARY 6, 2025 |
Table 10.2: Uranium Dissolutions Based on Leachate and Residue Assays
| Sample | Uranium in Leachates (mg) | Uranium in Residues (mg) | Total Uranium (mg) | Uranium Dissolution (%) | ||||||||||||
| DB 07-11-4C #1 | 324 | 10.0 | 334 | 97.0 | ||||||||||||
| DB 07-32-2C #2 | 722 | 229.5 | 952 | 75.8 | ||||||||||||
| DB 07-32-2C #3 | 3,235 | 386.5 | 3,621 | 89.3 | ||||||||||||
| DB 07-32-2C #4 | 775 | 73.7 | 849 | 91.3 | ||||||||||||
(ref., Roughstock, 2018)
Table 10.3: Vanadium Dissolutions Based on Head and Leachate Assays
| Head: Pre-Test | Leachate | |||||||||||||||||||
| Sample | Dry Head Mass (g) | Vanadium (mg/kg) | Vanadium (mg) | Vanadium Extracted (mg) | Vanadium Dissolution (%) | |||||||||||||||
| DB 07-11-4C #1 | 631 | 59 | 37 | 6.5 | 17.4 | |||||||||||||||
| DB 07-32-2C #2 | 610 | 648 | 395 | 194.9 | 49.3 | |||||||||||||||
| DB 07-32-2C #3 | 597 | 348 | 208 | 24.1 | 11.6 | |||||||||||||||
| DB 07-32-2C #4 | 629 | 79 | 50 | 17.5 | 35.0 | |||||||||||||||
(ref., Roughstock, 2018)
The ELI report states, “Vanadium mobilization occurred in all intervals; however, uranium appeared to leach first and preferentially.” This conclusion is generally supported by the test results. There are potentially important consequences of high vanadium dissolution. Vanadium in the VO-3 and VO4-2 valence states will exchange onto and elute from a strong-base anionic resin along with uranium. However, the resin’s affinity for uranium is stronger, so vanadium can be “crowded off” the resin with higher uranium loadings. Based upon present data, vanadium ratios are variable and may require additional attention within the processing facility. There are several options for removal of vanadium, including elution and separation by IX or solvent extraction. Should further testing or initial operations prove that vanadium is inhibiting uranium recovery, the addition of a vanadium removal system to the processing plant may be necessary. Capital costs for a vanadium circuit are not presented in this economic analysis.
10.4 Additional Testing
A considerable amount of work has been done by enCore and previous operators to ensure an adequate data set exists for the Project. It is the QP’s opinion that the data used in this technical report is adequate for technical reporting and analytical procedures used in analysis do meet conventional industry practice.
Since enCore has done no drilling on the project, it is recommended that as part of their 2025 program, that when confirmation holes are drilled to verify data from missing geophysical logs, core is also sampled. Core should be used by enCore to perform additional metallurgical testing verifying deposit mineralogy and confirm that the uranium mineralization is capable of being leached using conventional ISR chemistry, uranium equilibrium, U/V ratios in leach solutions, and determine the best approach to handling uranium and vanadium separation.
Based on data quality, efforts of others, and the QP’s review, it is the opinion of the QP that there are no known data factors that will materially affect the accuracy and reliability of results; however, enCore should proceed with recommended actions addressing uncertainties to further improve confidence in data adequacy.
| 41 | REPORT DATE: JANUARY 6, 2025 |
11.0 MINERAL RESOURCE ESTIMATES
enCore reports mineral reserves and mineral resources separately. The amount of reported mineral resources does not include those amounts identified as mineral reserves. Mineral resources that are not mineral reserves have no demonstrated economic viability and do not meet the requirement for all the relevant modifying factors. Stated mineral resources are derived from estimated quantities of mineralized material recoverable by ISR methods.
11.1 Key Assumptions, Parameters and Methods
11.1.1 Key Assumptions
| ● | Mineral resources have been estimated based on the use of the ISR extraction method and yellowcake production, |
| ● | Uranium price forecast is based on TradeTech’s Uranium Market Study 2023: Issue 4, |
| ● | Price forecast, production costs and an 80% metallurgical recovery were used to estimate mineral resources. |
| 11.1.2 | Key Parameters |
| ● | The mineral resources estimates are based on 6,394 drillholes, |
| ● | Grades (% U3O8) were obtained from gamma radiometric probing of drillholes and checked against assay results to account for disequilibrium, |
| ● | Average density of 16.0 cubic feet per ton was used, based on historical sample measurements, |
| ● | Minimum grade to define mineralized intervals is 0.020% eU3O8, |
| ● | Minimum mineralized interval thickness is 1.0 feet, |
| ● | Minimum GT (Grade x Thickness) cut-off per hole per mineralized interval for grade-thickness contour modeling is 0.20 ft% U3O8, |
| ● | Mineralized interval with GT values below the 0.20 ft% U3O8GT cut-off is used for model definition but are not included within the mineral resource estimation, |
11.1.3 Key Methods
| ● | Geological interpretation of the orebody was done on section and plan from surface drillhole information, |
| ● | The orebody was modeled creating roll-front outlines for each of the deposit’s individual mineralized zones, |
| ● | Mineral resources within the roll-front outlines were estimated by grade-thickness contouring, where the variable of uranium grade is multiplied by interval thickness and contoured area, |
| ● | Geological modeling and mining applications used were AutoCAD Map 3D. |
| 42 | REPORT DATE: JANUARY 6, 2025 |
11.2 Resource Classification
Mineral resources are disclosed as required by United States Code of Federal Regulations, Title 17, Chapter II, Part 229, §229.1303 and §229.1304, and are based upon and accurately reflect information and supporting documentation prepared by the QP, as defined in §229.1300.
The following classification criteria for each mineral resource category are applied for alignment with §229.1300 definitions of Measured, Indicated and Inferred mineral resources.
11.2.1 Measured Mineral Resources
Drilling density equivalent to or denser than 100 x 100 feet spacing for mineralized zones characterized by a uniform and easily correlatable roll-front morphology, from one drilling fence line to another. Mineralization must be continuous between drill fences. The hydrogeological properties of the hosting horizon are studied by aquifer pump tests. The amenability of mineralization to ISR mining is demonstrated by laboratory leach tests. Mineralization is characterized by sufficient confidence in geological interpretation to support detailed wellfield planning and development with no or very little changes expected from additional drilling.
11.2.2 Indicated Mineral Resources
Drilling density equivalent to or denser than 100 x 250 feet spacing for mineralized zones characterized by a uniform and easily correlatable roll-front morphology, from one drilling fence line to another. Mineralization must be continuous between drill fences. The hydrogeological properties of the hosting horizon are studied by aquifer pump tests. The amenability of mineralization to ISR mining is demonstrated by laboratory leach tests. Mineralization is characterized by sufficient confidence in geological interpretation to support wellfield planning and development with some changes expected from additional drilling.
11.2.3 Inferred Mineral Resources
Drilling density equivalent to or denser than 250 x 500 feet spacing for mineralized zones characterized by less uniformity and not easily correlatable roll-front morphology, from one drilling fence line to another. Mineralization must be continuous between drill fences but there is less confidence in geologic interpretation. The hydrogeological properties of the hosting horizon are studied by aquifer pump tests. The amenability of mineralization to ISR mining is demonstrated by laboratory leach tests. Mineralization is characterized by insufficient confidence in geological interpretation to support wellfield planning and development due to significant changes expected from additional drilling.
| 43 | REPORT DATE: JANUARY 6, 2025 |
11.3 Mineral Resource Estimates
A summary of the Project’s mineral resource estimates is provided in Table 11.1.
Table 11.1: Summary of Mineral Resource Estimates
| ISR Resources | Measured | Indicated | M & I | Inferred | ||||||||||||
| Lbs (U3O8) | 14,285,988 | 2,836,159 | 17,122,147 | 712,624 | ||||||||||||
| Tons | 5,419,779 | 1,968,443 | 7,388,222 | 645,546 | ||||||||||||
| Avg. GT | 0.73 | 0.41 | 0.66 | 0.32 | ||||||||||||
| Avg. Grade (% U3O8) | 0.132 | % | 0.072 | % | 0.116 | % | 0.055 | % | ||||||||
| Avg. Thickness (ft) | 5.56 | 5.74 | 5.65 | 5.87 | ||||||||||||
Notes:
| 1. | enCore reports mineral reserves and mineral resources separately. Reported mineral resources do not include mineral reserves. |
| 2. | The geological model used is based on geological interpretations on section and plan derived from surface drillhole information. |
| 3. | Mineral resources have been estimated using a minimum grade-thickness cut-off of 0.20 ft% U3O8. |
| 4. | Mineral resources are estimated based on the use of ISR for mineral extraction. |
| 5. | Inferred mineral resources are estimated with a level of sampling sufficient to determine geological continuity but less confidence in grade and geological interpretation such that inferred resources cannot be converted to mineral reserves. |
11.4 Material Affects to Mineral Resources
It is the QP’s opinion that the quality of data, geological evaluation and modeling, in conjunction with metallurgical and hydrological testing results, are valid for mineral resource estimation.
To the extent that mineral resources may be impacted by environmental, permitting, legal, title, taxation, socio-economic, marketing, political, or other relevant factors, impacts could result in a material loss or gain to the Project’s mineral resources. The QP is not aware of any relevant factors that could materially affect the Project’s mineral resource estimates.
12.0 MINERAL RESERVE ESTIMATES
enCore reports mineral reserves and mineral resources separately. The point at which mineral reserves are defined is where mineralization occurs under existing or planned wellfields. No mineral reserves are defined for the Project.
| 44 | REPORT DATE: JANUARY 6, 2025 |
13.0 MINING METHODS
enCore will mine uranium using ISR. An alkaline leach system of carbon dioxide and oxygen will be used as the extracting solution. Bicarbonate, resulting from the addition of carbon dioxide to the extracting solution, will be used as the complexing agent. Oxygen will be added to oxidize the uranium to a soluble +6 valence state.
ISR has been successfully used for over five decades elsewhere in the United States as well as in other countries such as Kazakhstan and Australia. ISR mining was developed independently in the 1970s in the former USSR and US for extracting uranium from sandstone hosted uranium deposits that were not suitable for open pit or underground mining. Many sandstones host deposits that are amenable to ISR, which is now a well-established mining method. As discussed in Section 13.0, bottle roll tests demonstrate that uranium can be mobilized and recovered with an oxygenated carbonate lixiviant.
13.1 Mine Designs and Plans
13.1.1 Patterns, Wellfields and Mine Units
The fundamental production unit for design and production planning or scheduling is the pattern. A pattern is comprised of a production or recovery well, and some number of injection wells. Pattern wells are typically configured in a five or seven well configuration. A five well, or five-spot well pattern consists of one recovery and four injection wells generally in a square or near-square configuration. A seven well or seven-spot well pattern, like the five-spot, is comprised of a recovery well surrounded by six injection wells in a hexagon or near-hexagon configuration. Pattern design is determined by the size and shape of the deposit, hydrogeological properties of the mining formation and mining economics. At Dewey Burdock, enCore plans to use a five-spot pattern, and recovery wells will be spaced 71 feet from injection wells.
Patterns are grouped into production units referred to as wellfields forming a practical means for design, development and production, where groups of 20-30 recovery wells and their associated injections wells are designed, constructed and operated, serving as the fundamental operating unit for distribution of the alkaline leach system.
To further facilitate planning, wellfields are grouped into mine units. Mine Units represent a collection of wellfields for which baseline data, monitoring requirements, and restoration criteria have been established, for development of a Wellfield Hydrologic Data Package that will be submitted to regulatory authorities for mining approval.
An economic wellfield must cover the construction costs associated with well installation, connection of wells to piping that conveys the leach system between wellfields and the processing plant, and wellfield and plant operating costs.
13.1.2 Monitoring Wells
Wellfields will typically be developed based on conventional five-spot patterns. Injection and recovery wells within a wellfield will be completed in the mineralized interval of only one mineralized zone at any one time. Injection and recovery wells will be completed in a manner to isolate the screened uranium-bearing interval. To establish baseline water quality data, monitoring requirements and restoration criteria, monitor wells will be installed for each mine unit. Baseline production zone monitor wells will be completed in the deposit hosting sandstone unit to establish baseline water restoration criteria.
| 45 | REPORT DATE: JANUARY 6, 2025 |
Perimeter monitor wells will also be installed in a ring around the entire wellfield. This ring will be setback approximately 400 feet from the patterns and 400 feet apart. This monitor well ring will be used to ensure mining fluids are contained within wellfield.
Overlying and underlying monitor wells will also be completed in hydro-stratigraphic units immediately above and below the production zone to monitor the potential for vertical lixiviant migration. Overlying monitor wells will be completed in all overlying units. Underlying wells will be completed in the immediately underlying unit unless the wellfield immediately overlies the Morrison Formation. It has been demonstrated that the Morrison is sufficiently thick and continuous such that NRC will not require excursion monitoring beneath the Morrison.
13.1.3 Wellfield Surface Piping System and Header Houses
Each injection and production well will be connected within a network of buried pipe to an injection or production manifold located within an enclosed climate-controlled header house. The manifolds are connected to pipes that convey leaching solutions to and from the ion exchange columns in the CPP or Satellite facility. Flow meters, control valves, and pressure gauges in the individual well piping will monitor and control the individual well flow rates. Wellfield piping will be constructed using high-density polyethylene pipe.
13.1.4 Wellfield Production
The proposed uranium ISR process will involve the dissolution of the water-soluble uranium compound from the mineralized host sands at near neutral pH ranges. The lixiviant contains dissolved oxygen and carbon dioxide. The oxygen oxidizes the uranium, which is then complexed with the bicarbonate formed by addition of carbon dioxide to the solution. The uranium-rich solution will be pumped from the recovery wells to the nearby CPP or Satellite facility for uranium concentration with ion exchange (IX) resin. A slightly greater volume of water will be recovered from the mineralized zone hydro-stratigraphic unit than injected, referred to as “bleed”, to create an inward flow gradient towards the wellfields. Thus, overall recovery flow rates will always be slightly greater than overall injection rates. This bleed solution will be disposed, as permitted, via injection into Class V DDW’s after treatment for radionuclide removal.
13.1.5 Production Rates and Expected Mine Life
Production rate was calculated using the production model in Figure13.1. The production model was applied to mineral resources using the following parameters:
| ● | Average recovery well flow rate of 20 gpm, |
| ● | Maximum CPP flow rate of 2,400 gpm, |
| ● | Maximum Satellite flow rate of 1,600 gpm, |
| ● | Average feed grade of 60 ppm U3O8, |
| ● | 80% mineral recovery in 24 months |
Based on existing mineral resources total site production is 14.1 M lbs of U3O8. Production forecast by year is illustrated in Table 19.1.
| 46 | REPORT DATE: JANUARY 6, 2025 |
Figure 13.1: Production Forecast Model

| 47 | REPORT DATE: JANUARY 6, 2025 |
13.2 Mine Development
In Azarga’s 2019 technical report, the Project development plan was a phased approach starting with a satellite facility and offsite toll-mill processing at a competitor’s plant. To de-risk the project, enCore has elected to proceed with construction of a CPP to recover and process uranium on site as described in the technical report supporting the NRC Source Material License. Mine development will begin on the Burdock with the start of construction of the CPP and first mine units in early 2027.
In 2027, enCore will complete installation of the Mine Unit 1 monitor wells, conduct pump testing, and submit the required regulatory documentation to commence Mine Unit 1 operations. Starting in late 2027 or early 2028, Mine Unit 1, wellfield construction will commence, and production is forecasted to start of Q3 2028. A new wellfield will be brought online monthly until the central processing plant name plate flow rate of 2,400 gpm is achieved.
Upon the start of commercial operations in Q3 2028, construction will also commence on the satellite facility and first mine unit located on the Dewey side of the property. Development and construction activities are anticipated to take one year with commencement of satellite and wellfield operations on the Dewey in Q3 2029. Like Burdock, Dewey wellfields will be brought online monthly until the satellite facility name plate flow rate of 1,600 gpm is achieved.
To sustain the CPP and satellite a cumulative 4,000 gpm flow rate will be established to achieve a 0.9 to 1.0 M pound U3O8annual production rate. New wellfields will be developed and commissioned at a rate to ensure adequate head grades are maintained to achieve production objectives as operating wellfields are depleted. See Figure 13.2 Dewey Burdock Mine.
13.3 Mining Fleet and Machinery
This assessment accounts for the quantity and associated cost of required rolling stock and equipment. Rolling stock and equipment will include resin haul tractor and trailers to deliver loaded resin from the satellite facility to the CPP, pump hoists, cementers, forklifts, pickups, logging trucks, and generators. In addition, several pieces of heavy equipment will be on site for excavation of mud pits, road maintenance, and reclamation activities.
| 48 | REPORT DATE: JANUARY 6, 2025 |
Figure 13.2: Dewey Burdock Mine

| 49 | REPORT DATE: JANUARY 6, 2025 |
14.0 PROCESS AND RECOVERY METHODS
14.1 Processing Facilities
A CPP and Satellite will collect and process uranium. The CPP processing circuits will consist of ion exchange, elution, precipitation, dewatering, drying and packaging. The Satellite facility will include an IX circuit and a resin transfer system to facilitate transfer of loaded resin by truck from the Satellite to the CPP. See Figure 14.1, Process Flow Diagram. The processing method is an industry standard and proven method that is most suitable for uranium processing and recovery. The method also has low environmental impact and results in a high purity product.
The CPP will be located on the Burdock property and the Satellite will be located at Dewey. The distance between the two facilities is approximately four miles.
14.2 Process Flow
A preliminary design has been completed for facilities and equipment. Figures 14.2 and 14.3 are general equipment layouts for the CPP and Satellite facilities. A description of the process is provided in the remainder of the section.
14.2.1 Ion Exchange
Uranium will be recovered from pregnant lixiviant solution using the ion exchange circuit. Each vessel is designed to contain a 500 cubic foot batch of anionic ion exchange resin. The vessels will be configured in parallel trains of multiple columns operating in a series, utilizing pressurized down-flow methodology for loading. Production and Injection booster pumps will be located upstream and downstream of the IX trains, respectively.
Vessels will be designed to provide optimum contact time between pregnant lixiviant and IX resin. An interior stainless-steel piping manifold system will distribute lixiviant evenly across the resin. The dissolved uranium in the pregnant lixiviant will be chemically adsorbed onto the ion exchange resin. The resultant barren lixiviant exiting the vessels will contain less than 2 ppm of uranium and will be returned to the wellfield where oxygen and carbon dioxide will be added prior to reinjection.
14.2.2 Production Bleed
A bleed will be drawn from the injection stream prior to reinjection into the wellfield to maintain control of hydraulic conditions in production zone. The bleed will be directed to a smaller bleed column where any residual uranium will be collected. The barren bleed will be discharged at a constant flow rate to the radium treatment system prior to discharging to settling ponds, which will be designed for a minimum of 13 days residence time. Water from the settling ponds will be tested periodically to confirm conformance with discharge standards and disposed of via the DDW.
14.2.3 Elution Circuit
Loaded resin will be transferred to the elution circuit and uranium will be stripped from the resin with a sodium chloride and sodium carbonate brine solution forming a uranium rich eluate. Eluted resin will then be rinsed and returned to the IX vessels for reloading.
| 50 | REPORT DATE: JANUARY 6, 2025 |
Figure 14.1: Process Flow Diagram
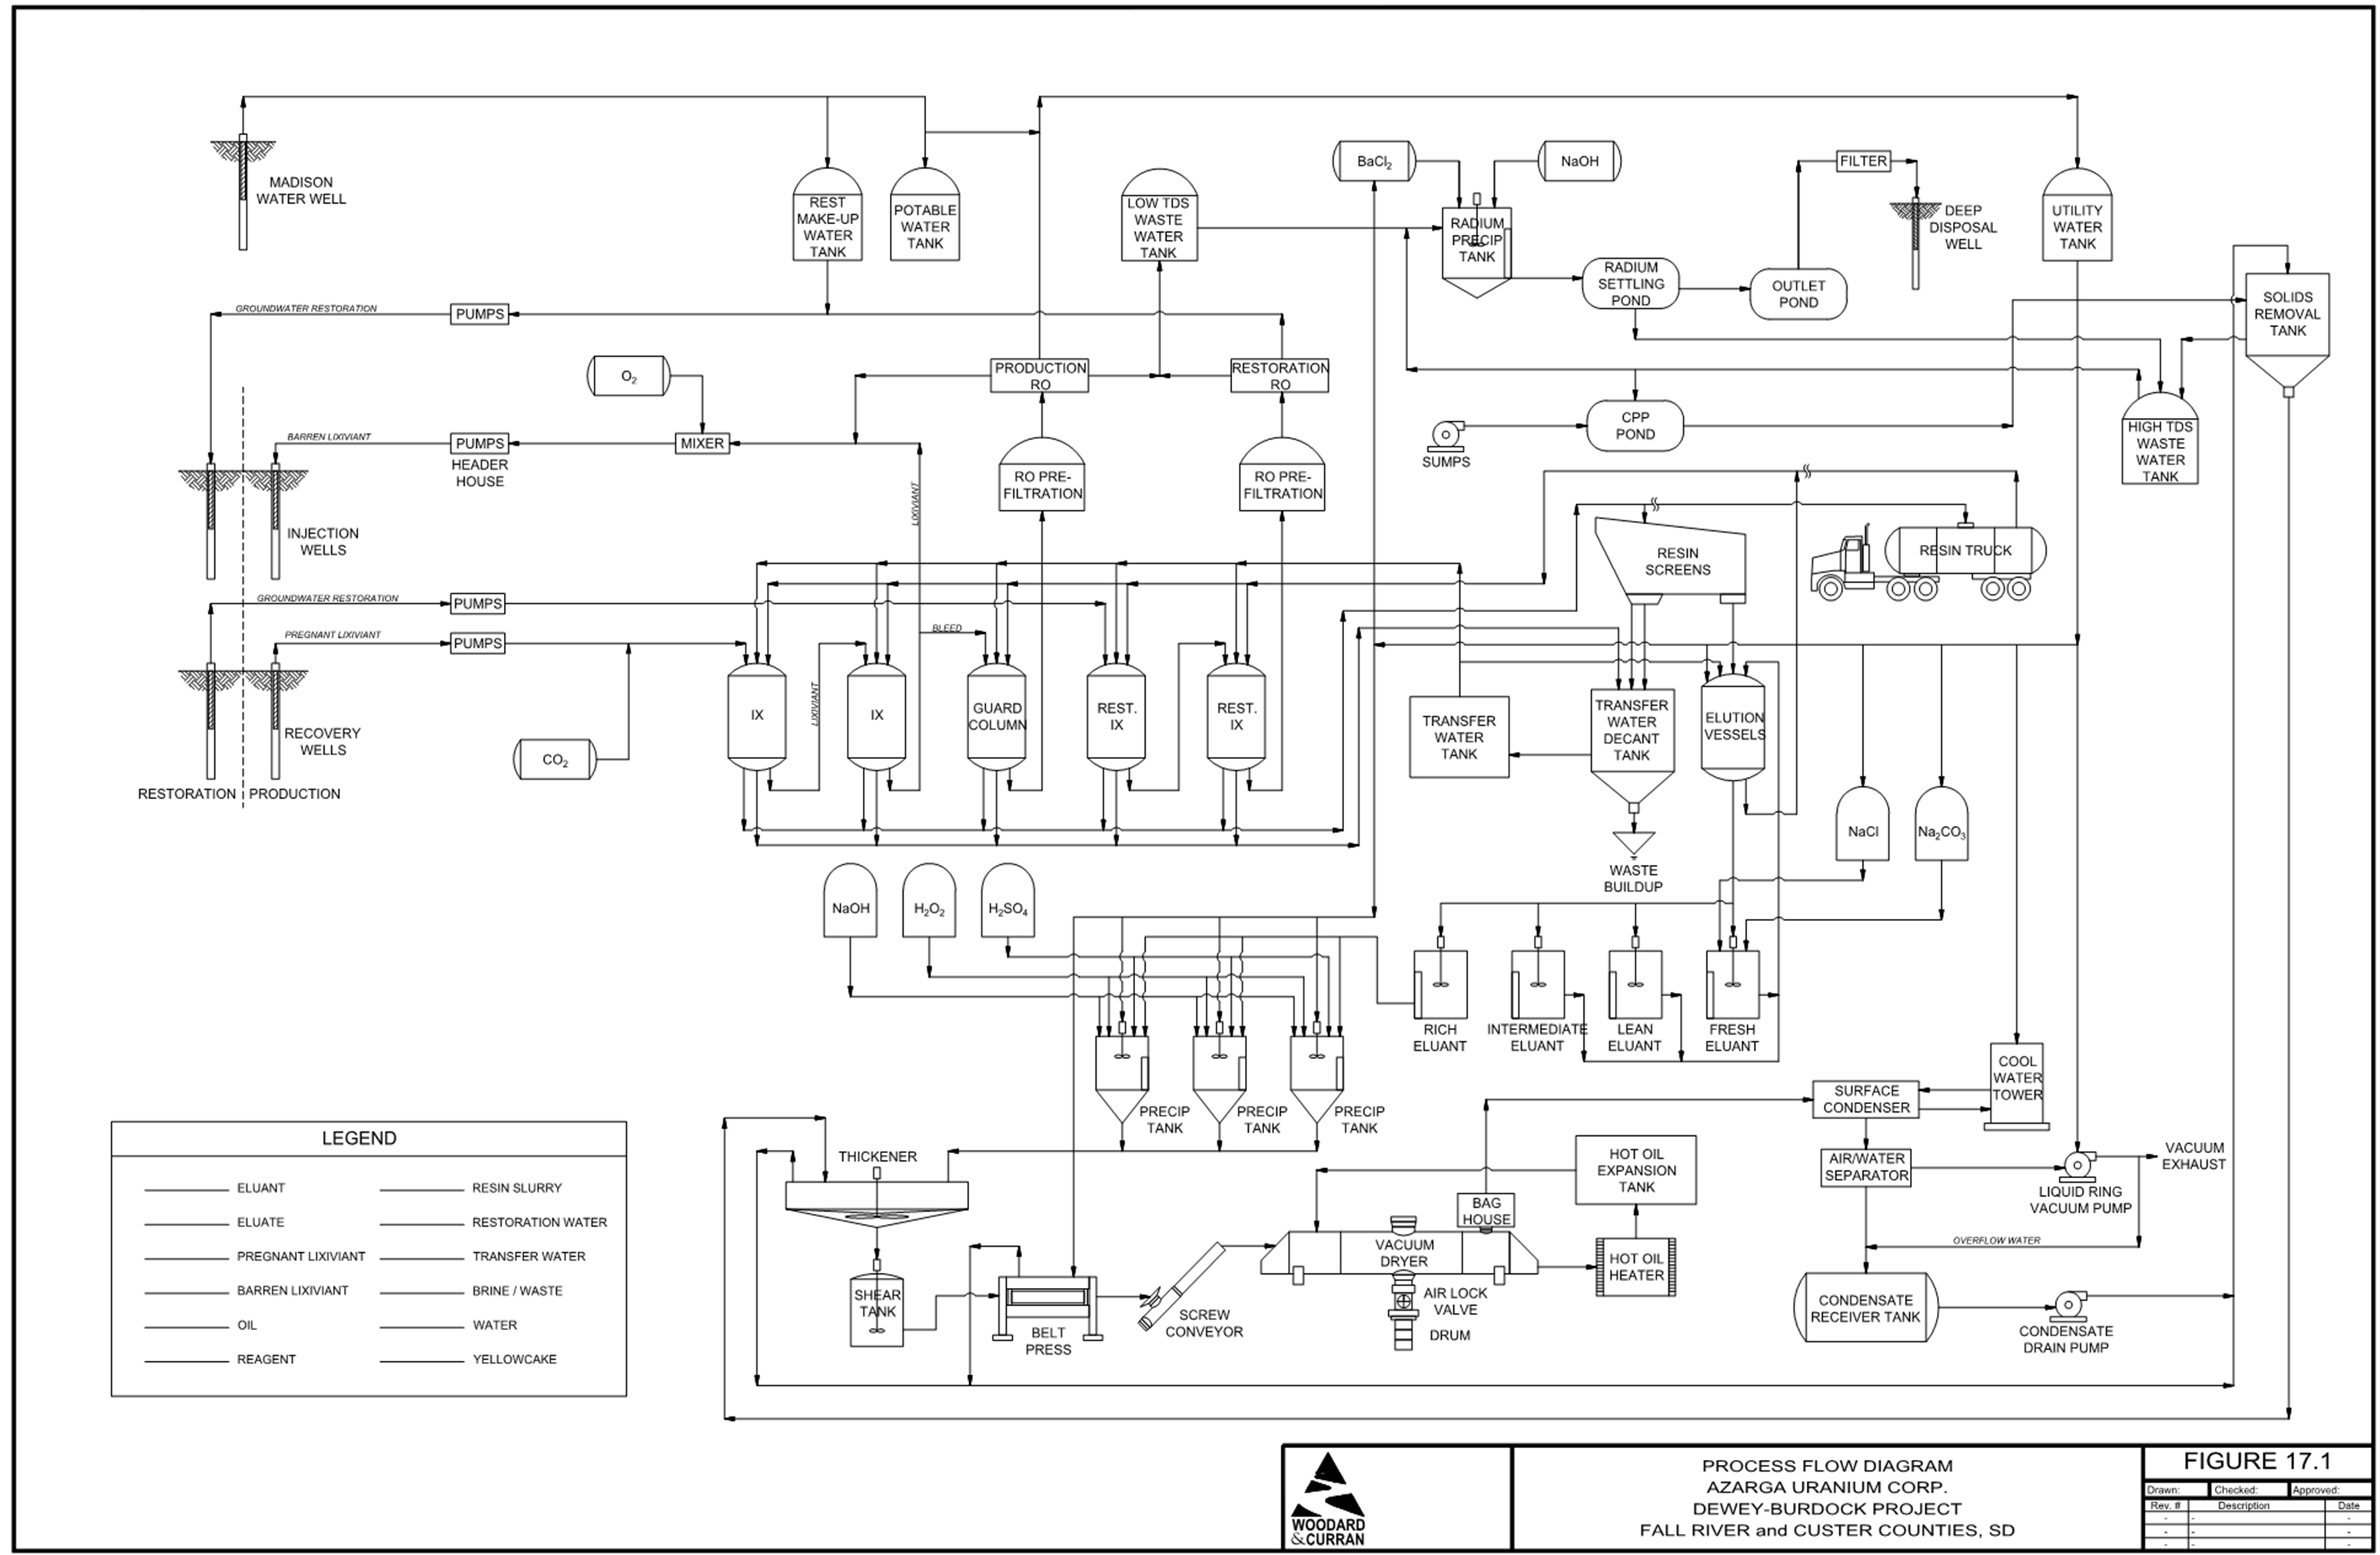
(ref., Azarga, 2020)
| 51 | REPORT DATE: JANUARY 6, 2025 |
Figure 14.2: CPP Facility General Arrangement

| 52 | REPORT DATE: JANUARY 6, 2025 |
Figure 14.3: Satellite Facility General Arrangement

| 53 | REPORT DATE: JANUARY 6, 2025 |
14.2.4 Precipitation Circuit
Sulfuric acid will be added to the uranium rich eluate to bring the pH down to the range of 2 to 3 where the uranyl carbonate breaks down, liberating carbon dioxide and leaving free uranyl ions. Next, sodium hydroxide (caustic soda) will be added to raise the pH to the range of 4 to 5. After this pH adjustment, hydrogen peroxide will be added in a batch process to form an insoluble uranyl peroxide (UO2O2.H2O) compound. After precipitation, the pH is raised to approximately 7 and the uranium precipitate slurry is pumped to a thickener where uranium settles from solution and the uranium gravity-thickens into a yellowcake slurry. The uranium-depleted supernate solution overflows the thickener and is disposed of via a deep injection well. The supernate solution will be treated to remove radium and other radionuclides before disposal, as required.
14.2.5 Product Filtering, Drying and Packaging
After precipitation, yellowcake is removed for washing, filtering, drying and product packaging in a controlled area. The yellowcake from the thickener underflow will be washed to remove excess chlorides and other soluble contaminants. The slurry will then be dewatered in a filter press and the filter cake transferred in an enclosed conveyor directly to the yellowcake dryer.
The yellowcake will be dried in a low temperature (<300°F) vacuum dryer. The dryer is an enclosed unit and heated by circulating thermal fluid through an external jacket. The off gases generated during the drying cycle, which will be primarily water vapor, are filtered through a bag house to remove entrained particulates and then condensed. Compared to conventional high temperature drying by multi-hearth systems, this dryer will have no significant airborne particulate emissions.
The dried yellowcake will be packaged into 55-gallon steel drums for storage before transport by a licensed trucking contractor to a conversion facility.
The yellowcake drying and packaging stations will be segregated within the processing plant for worker safety. Dust abatement and filtration equipment will be deployed in this area of the facility. Filled yellowcake drums will be staged in a dedicated and locked storage until transport. Mine
14.3 Water Balance
The water balance is based on a production flow rate of 4,000 gpm with a 1% or 40 gpm bleed to maintain hydraulic control of the mine units. In the CPP water will be used for make-up and washdown at a rate of approximately 12 gpm from a local fresh water supply well. Restoration activities will include 250 gpm feed to an RO, with 175 gpm returned to the wellfield and 75 gpm to a liquid effluent management system that includes the use of lined impoundments and treated water injection into permitted Class V injection wells. Make-up water from a Madison well will be used to minimize wellfield drawdown if necessary.
14.4 Liquid Waste Disposal
Deep well injection and land application are options that can be used for disposal of liquid waste generated during production and restoration. Liquid waste will be injected and isolated from any underground source of drinking water. UIC Class V permit application was submitted to the EPA for approval of four wells which will allow for the onsite disposal of all wastewater streams. The EPA has issued a draft permit; however, the permit is currently in contestation. Upon final approval enCore plans to install two of the wells. One well will be located at the CPP and the second well at the Satellite. The two additional wells may be installed later if new or additional disposal capacity is needed.
| 54 | REPORT DATE: JANUARY 6, 2025 |
In the case of land application, the liquid waste bleed stream discharged from processing operations will be treated to remove radionuclides before application. The bleed stream will be treated with ion exchange to remove any residual uranium followed by barium chloride (BaCl2) treatment to remove radium. Barium treatment will result in sludge that will be separated from liquid waste. To achieve the separation of sludge from liquid waste, the solution will be discharged to a radium settling pond. Settling ponds will be designed to hold all material accumulated over the life of the project. Reagent tanks used for radium removal will be located within the CPP and Satellite.
enCore does not intend to use land application relying on wells for liquid waste disposal. Two Class V wells permitted under EPA are used in this economic assessment, but land application has not been included in this PEA.
14.5 Solid Waste Disposal
Waste classified as non-contaminated (non-hazardous, non-radiological) will be disposed of in the nearest permitted sanitary waste disposal facility. Waste classified as hazardous (non-radiological) will be segregated and disposed of at the nearest permitted hazardous waste facility. Radiologically contaminated solid wastes, that cannot be decontaminated, are classified as 11.e.(2) byproduct material. This waste will be packaged and stored on site temporarily, and periodically shipped to a licensed 11.e.(2) byproduct waste facility or a licensed mill tailings facility.
14.6 Energy, Water and Process Material Requirements
14.6.1 Energy Requirements
To heat the CPP and Satellite during winter months, an estimated 3.9 MBTUH of propane will be required. Additionally, nearly 12 million kWh annually of electricity will be necessary to operate the CPP and the wellfields during peak production with simultaneous mining and restoration activities. Also, it is estimated that approximately 1 MBTUH of propane will be consumed to operate one dryer for 12 hours per day.
14.6.2 Water Requirements
Bleed from the production stream will be treated by RO and permeate will be re-introduced to the injection stream or sent to disposal. Fresh water will be supplied from a Madison formation well and used for process make-up, showers, domestic uses, and plant wash-down and yellowcake wash. Approximately 1.9 gpm of fresh water is estimated to meet demand.
| 55 | REPORT DATE: JANUARY 6, 2025 |
15.0 INFRASTRUCTURE
The basic infrastructure (power, water and transportation) necessary to support the project is located within reasonable proximity of the site as further described below and presented in Figure 15.1.
15.1 Utilities
15.1.1 Electrical Power
The Black Hills Electric Cooperative will be the anticipated power provider. It has been determined that the most cost-effective power source for the project is from a substation located in Edgemont, South Dakota. Approximately 15 miles of new 69 kV power line and a new substation located at the intersection of Highway 18 and County Road 6463 will be constructed to establish power to the site. From the substation, power will be carried by overhead distribution lines to medium voltage transformers located near the CPP and Satellite.
15.1.2 Domestic and Utility Water Wells
Two water wells are necessary to provide domestic water to the CPP and Satellite plant. Geological testing has identified the nearest accessible domestic water supply to be approximately 3,000 ft below the surface in the Madison Formation. Water from the Madison wells will be pumped to the plant and stored in a utility water tank and a domestic water tank. The utility water tank will provide make-up water for plant processing circuits, while the domestic water tank will provide water for items such as showers, toilets, sinks emergency stations, etc. A chlorination system will be installed. Commercial bottled drinking water may be brought to the site from appropriate off-site sources.
15.1.3 Sanitary Sewer
A gravity absorption field septic system will be located at both the CPP and satellite to receive effluent. The systems will be designed in accordance with state and local health and sanitation requirements.
15.2 Transportation
15.2.1 Railway
The Burlington Northern Railroad runs parallel to County Road 6463 along the length of the project and extends southeast to the town of Edgemont. Rail access may be negotiated to facilitate transport and delivery of construction equipment and supplies.
15.2.2 Roads
The nearest population center to the Dewey Burdock Project is Edgemont, South Dakota (population 900) located on US Highway 18, 14 miles east from the Wyoming-South Dakota state line. Fall River County Road 6463 extends northwestward from Edgemont to the abandoned community of Burdock located in the southern portion of the Dewey Burdock project, about 16 miles from Edgemont. This road is a two-lane, all-weather gravel road. Fall River County Road 6463 continues northwest from Burdock to the Fall River-Custer County line where it becomes Custer County Road 769 and continues to the hamlet of Dewey, a total distance of about 23 miles from Edgemont. This county highway closely follows the tracks of the BNSF (Burlington Northern Santa Fe) railroad between Edgemont and Newcastle, Wyoming. Dewey is about 2 miles from the northwest corner of the Dewey Burdock project.
| 56 | REPORT DATE: JANUARY 6, 2025 |
Figure 15.1: Project Infrastructure

| 57 | REPORT DATE: JANUARY 6, 2025 |
An unnamed unimproved public access road into the Black Hills National Forest intersects Fall River County Road 6463 4.3 miles southeast of Burdock and extends northward about 4 miles, allowing access to the east side of the Dewey Burdock project. About 0.9 miles northwest from Burdock, an unimproved public access road to the west from Fall River County Road 6463 allows access to the western portion of the Dewey Burdock project. Private ranch roads intersecting Fall River County Road 6463 and Custer County Road 769 allow access to all other portions of the Dewey Burdock Project.
Secondary access roads will be improved with added structural support and properly graded to reduce maintenance costs. A small road section will be constructed to connect existing unimproved roads to the plant buildings for immediate access to both the Burdock CPP, and the Dewey Satellite plant. In addition, secondary access roads will be used for access to the header house buildings. The secondary access roads will be constructed with limited cut and fill construction and may be surfaced with small sized aggregate or other appropriate material.
15.3 Buildings
15.3.1 Central Processing Plant & Satellite
The CPP and Satellite facilities will be housed in pre-engineered insulated buildings to provide year-round operation. Some chemical storage will occur on concrete pads immediately adjacent to the buildings. In addition to the process equipment and resin tailer bays, these buildings will have offices, breakroom, restrooms with showers, and a small lab for process control. Adequate ventilation and heating will be installed to maintain temperature and airborne radionuclide concentrations.
Parking areas will be graded, and snow removal will be performed as necessary.
15.3.2 Office
An office facility will be constructed on site to accommodate management, administrative, technical, regulatory and safety services for the project. The facility will be outfitted with all equipment, materials and supplies to ensure efficient operation of those functions. The facility will be built to accommodate approximately 40 personnel, with offices, conference/meeting room, administration, kitchen/lunchroom, and restroom facilities.
| 58 | REPORT DATE: JANUARY 6, 2025 |
15.3.3 Warehouse
A warehouse will be constructed on site to house supplies, materials and spare parts. The shop will be outfitted with all equipment, materials and supplies to ensure efficient warehouse operations. The warehouse will have office space, lunchroom and restroom facilities.
15.3.4 Maintenance Shop
A maintenance shop will constructed be on site for asset maintenance and repair of rolling stock, equipment and facilities. The shop will be outfitted with all equipment, material and supplies to ensure efficient maintenance and repair support of the site. The shop will have office space, lunchroom, as well as change room with restroom and shower facilities. The shop will also have storage for commonly used supplies and materials.
15.3.5 Wellfield Construction Shop
A construction shop will be on site for wellfield construction activities. The shop will be outfitted with all equipment, material and supplies to ensure efficient construction of wellfield activities. The shop will also have storage for commonly used supplies and materials.
15.3.6 Diesel and Gasoline Storage
Diesel and gasoline will be stored on site in individual tanks. Both tanks will be manufactured for the use of fuel storage, and they will be double walled for spill leak prevention. A concrete containment area will be provided around the tanks to prevent potential environmental impacts from leaks or spills. Diesel and gasoline transfer pumps may be used to refuel vehicles, heavy equipment, and miscellaneous small equipment. A fuel truck may be used to transport fuel to large equipment vehicles and wellfield operations.
15.3.7 Laboratory
A laboratory will be required for testing procedures and sample analysis, as well as storage for sample receipts, sample preparation, chemicals, and analytical documentation. The laboratory will be located within the CPP or part of the office complex and outfitted with all equipment, materials and supplies required to efficiently operate the mine and plant.
15.3.8 Surface Impoundments
As discussed in Section 14.4 Liquid Waste Disposal, enCore will treat the liquid waste bleed stream discharged from processing operations to remove radionuclides before deep well injection. To treat and aid in water management, storage impoundments (ponds) will be constructed. In 2009, Knight Piesold and Company designed six pond categories including radium settling, outlet, storage, central plant, spare settling pond, and spare storage. Designs account for anticipated precipitation volumes received directly to ponds surface. Allowances have also been made for storage volumes resulting from a 100-year, 24-hour storm event, while maintaining 3 feet of freeboard (ref., Powertech, 2013f).
| 59 | REPORT DATE: JANUARY 6, 2025 |
15.3.9 Radium Settling Pond
Radium settling ponds will be constructed at both the Burdock and Dewey sites to allow radium to settle out of solution. The settlement process is accomplished by adding barium chloride to the water. Co-precipitation of radium occurs when natural sulfate (SO4) in the water combines with radium (Ra) and barium (Ba) to form insoluble RaBaSO4. The requirements for efficient settlement of solids out of a solution have been incorporated into the size and dimensions of the ponds and include the following:
| ● | Storage capacity of 15.9-acre-ft for sufficient retention time for the settlement of radium out of solution. |
| ● | Adequate surface area to prevent the development of large surface currents. |
| ● | Pond geometry or arrangement that will prevent short circuiting of flows through the pond. |
15.3.10 Outlet Pond
An outlet pond has been designed for both the Burdock and Dewey Sites and has been sized to accommodate one day’s production water and precipitation from the 100-year, 24-hour storm event falling on both the radium settling and outlet pond. The design will be capable of storing 5.1-acre-ft, allocated as follows:
| ● | 2.7-acre-ft for production water from the Radium Settling Pond. |
| ● | 1.7-acre-ft for the 100-year, 24-hour design storm event falling on the radium settling pond. |
| ● | 0.4-acre-ft for the 100-year, 24-hour design storm event falling on the outlet pond. |
15.3.11 CPP Pond
The CPP pond is located only at Burdock and has been sized to accommodate a discharge of 10.81 gpm over a period of one year. The design will be capable of storing 15.9-acre-ft, allocated as follows:
| ● | 15.2-acre-ft for brine from the CPP. |
| ● | 0.7-acre-ft for the 100-year, 24-hour design storm event. |
15.3.12 Surge Pond
The surge pond will be located at both the Burdock and Dewey Sites and have been sized to accommodate 8.3 acre-feet each. The surge pond will provide surge capacity for treated liquid waste flowing out of the outlet ponds. It has been sized to accommodate approximately 16 days of water production.
15.3.13 Spare Settling Pond
A spare settling pond has been designed to be identical to the radium settling pond, which are the largest double-lined ponds in the system. The spare pond is located adjacent to the radium settling pond and has been designed to accommodate water from any of the radium settling or central plant ponds, should additional storage be required.
The spare storage pond has been designed sufficiently to provide a temporary replacement for any operating ponds should it be taken out of service.
| 60 | REPORT DATE: JANUARY 6, 2025 |
16.0 MARKET STUDIES
16.1 Uranium Market
The uranium market is experiencing a global renaissance as people around the world work to develop clean and reliable sources of energy. This market rise is supported by growing support for nuclear power and government efforts through legislative subsidies to reduce carbon emission, advancements nuclear technologies, and to ensure domestic fuel supplies.
The United States, which is the world’s largest consumer of uranium is also a minimal producer. Production in the United States has dropped from varying levels of 2.0 to 5.0 million lbs U3O8 produced annually, between 2000 to 2017, to less than 0.5 million lbs produced in 2023 (ref., USEAI, 2023). To meet US demand, which is in excess of 48.0 million lbs of U3O8 annually, the US is importing supply from around the world.
Therefore, companies such as enCore are positioning themselves to participate in this improving market producing and supplying uranium from its diverse asset portfolio.
16.2 Uranium Price Projection
enCore’s uranium price forecast is based on TradeTech’s Uranium Market Study 2023: Issue 4 and the report has been read by the qualified person. Based on TradeTech’s study and analysis of the uranium market, TradeTech forecasts SPOT LOW, SPOT HIGH, and TERM prices in Real US$/lb U3O8. enCore has assumed that spot pricing will be an average of the annual spot high and spot low prices. enCore has also assumed portfolio pricing will be a mix of average spot and term sales prices. Using this approach, enCore’s is using a uranium sales price that ranges from $82.00 to $89.00, with an average LOM sales price of $86.34, for the economic analysis.
16.3 Contracts
enCore will execute agreements for goods and services, such as chemical and material supply, transportation, processing, and waste disposal as the company advances the Project towards commercial operations.
enCore’s contracting and sales strategy is defined by a blend of pricing collars and exposure to the spot market. enCore has six sales agreements with five U.S. nuclear utilities that includes three large multi-reactor operators and one legacy contract with a trading firm. Contracts are structured with pricing that reflects market conditions at the time of execution with floors and ceilings that are adjusted annually for inflation. Inflation adjusted floor and ceiling prices provide base levels of revenue assuring an operating margin while providing significant upside exposure to spot market pricing. At current prices, enCore plans to contract less than 50% of planned production rates but contracting will likely increase if spot prices begin to spike. enCore’s current contracts represent less than 30% of planned production through 2032 and the company is reviewing other contracting opportunities.
| 61 | REPORT DATE: JANUARY 6, 2025 |
17.0 ENVIRONMENTAL STUDIES, PERMITTING, AND PLANS, NEGOTIATIONS, OR AGREEMENTS WITH LOCAL INDIVIDUALS OR GROUPS
17.1 Environmental Studies
Powertech conducted an environmental baseline data collection program from July 2007 to September 2008. An independent, third-party contractor directed sampling and analysis activities to characterize pre-mining conditions related to water, soils, air, vegetation, and wildlife of the site and surrounding areas.
In addition to the baseline environmental data collected by the third-party contractor, U.S. Nuclear Regulatory Commission (NRC) staff prepared a Generic Environmental Impact Statement (GEIS) (ref., USNRC, 2009) for western-area license applicants that addressed common environmental issues associated with the construction, operation, and decommissioning of ISR facilities, as well as ground water restoration at such facilities. The GEIS served as a starting point for the site-specific environmental review of the Dewey Burdock license application. Findings of the site-specific assessment are presented in NRC’s Final Supplemental Environmental Impact Statement (FSEIS) for the Project (ref., USNRC, 2014).
Results of the baseline studies, GEIS and FSEIS indicate that moderate to significant environmental concerns are unlikely for the Project.
17.1.1 Potential Wellfield Impacts
The injection of treated groundwater as part of uranium recovery or as part of restoration of the production zone is unlikely to cause changes in the underground environment except to restore the water quality consistent with baseline or other NRC approved limits and to reduce mobility of any residual radionuclides. Further, industry standard operating procedures, which are accepted by NRC and other regulating agencies for ISR operations, include a regional pump test prior to licensing, followed by more detailed pump tests after licensing and before production, for each individual mine area (mine unit).
During wellfield operations, potential environmental impacts include consumptive use, horizontal fluid excursions, vertical fluid excursions, and changes to groundwater quality in production zones (ref., USNRC, 2009). Through analyses in the GEIS and continued in the FSEIS, NRC staff concluded that impacts of wellfield operations on the environment will be small. That is, wellfield operations will have environmental effects that are either not detectable or are so minor that they will neither destabilize nor noticeably alter any important attribute of the area’s groundwater resources (ref., USNRC, 2014).
NRC staff concluded the potential environmental impact of consumptive groundwater use during wellfield operation will be small at the Dewey Burdock Project because such consumptive use will result in limited drawdown near the project area, water levels will recover relatively rapidly after groundwater withdrawals cease and it is dependent upon a State water appropriation permit. The State has recommended approval of the permit after considering important site-specific conditions such as the proximity of water users’ wells to wellfields, the total volume of water in the production hydro-stratigraphic units, the natural recharge rate of the production hydro-stratigraphic units, the transmissivities and storage coefficients of the production hydro-stratigraphic units, and the degree of isolation of the production hydro-stratigraphic units from overlying and underlying hydro-stratigraphic units.
| 62 | REPORT DATE: JANUARY 6, 2025 |
NRC staff also concluded the potential environmental impact from horizontal excursions at the proposed Dewey Burdock ISR Project will be small. This is because i) EPA will exempt a portion of the uranium-bearing aquifer from USDW classification according to the criteria under 40 CFR 146.4, ii) enCore is required to submit wellfield operational plans for NRC and EPA approval, iii) inward hydraulic gradients will be maintained to ensure groundwater flow is toward the production zone, and iv) enCore’s NRC-mandated groundwater monitoring plan will ensure that excursions, if they occur, are detected and corrected.
Similarly, potential impacts from vertical excursions were concluded by NRC staff to be small. The reasons given for the conclusion included i) uranium-bearing production zones in the Fall River Formation and Chilson member of the Lakota Formation are hydrologically isolated from adjacent aquifers by thick, low permeability layers (i.e., the overlying Graneros Group and underlying Morrison Formation), ii) there is a prevailing upward hydraulic gradient across the major hydro-stratigraphic units, iii) enCore’s required mechanical integrity testing program will mitigate the impacts of potential vertical excursions resulting from borehole failure, and iv) Azarga has committed to properly plugging and abandoning or mitigating any previously drilled wells and exploration holes that may potentially impact the control and containment of wellfield solutions within the proposed project area.
Lastly, potential impacts of wellfield operations on groundwater quality in production zones were concluded by NRC staff to be small because enCore must initiate groundwater restoration in the production zone to return groundwater to Commission-approved background levels, EPA MCL’s or to NRC-approved alternative water quality levels at the end of ISR operations.
17.1.2 Potential Soil Impacts
NRC staff have concluded that potential impacts to soil during all phases of construction, operation, hydro-stratigraphic unit, and decommissioning of the Dewey Burdock Project will be small (ref., USNRC, 2014).
During construction, earthmoving activities associated with the construction of the Burdock central plant and Dewey satellite plant facilities, access roads, wellfields, pipelines, and surface impoundments will include topsoil clearing and land grading. Topsoil removed during these activities will be stored and reused later to restore disturbed areas. The limited areal extent of the construction area, the soil stockpiling procedures, the implementation of best management practices, the short duration of the construction phase, and mitigative measures such as reestablishment of native vegetation will further minimize the potential impact on soils.
During operations, the occurrence of potential spills during transfer of uranium-bearing lixiviant to and from the Burdock central plant and Dewey satellite facility will be mitigated by implementing onsite standard procedures and by complying with NRC requirements for spill response and reporting of surface releases and cleanup of any contaminated soils.
| 63 | REPORT DATE: JANUARY 6, 2025 |
During groundwater restoration, the potential impact to soils from spills and leaks of treated wastewater will be comparable to those described for the operations phase.
During decommissioning, disruption or displacement of soils will occur during facility dismantling and surface reclamation; however, disturbed lands will be restored to their pre-ISR land use. Topsoil will be reclaimed, and the surface will be graded to the original topography.
The following proposed measures will be used to minimize the potential impacts to soil resources:
| ● | Salvage and stockpile soil from disturbed areas. |
| ● | Reestablish temporary or permanent native vegetation as soon as possible after disturbance utilizing the latest technologies in reseeding and sprigging, such as hydroseeding. |
| ● | Decrease runoff from disturbed areas by using structures to temporarily divert and/or dissipate surface runoff from undisturbed areas. |
| ● | Retain sediment within the disturbed areas by using silt fencing, retention ponds, and hay bales. |
| ● | Fill pipeline and cable trenches with appropriate material and re-grade surface soon after completion. |
| ● | Drainage design will minimize potential for erosion by creating slopes less than 4 to 1 and/or provide riprap or other soil stabilization controls. |
| ● | Construct roads using techniques that will minimize erosion, such as surfacing with a gravel road base, constructing stream crossings at right angles with adequate embankment protection and culvert installation. |
| ● | Use a spill prevention and cleanup plan to minimize soil contamination from vehicle accidents and/or wellfield spills or leaks. |
17.1.3 Potential Impacts from Shipping Resin, Yellowcake and 11.e.(2) Materials
The Project operations will require truck shipment of resin, yellowcake and 11.e.(2) materials.
17.1.3.1 Ion Exchange Resin Shipment
Loaded resin will be transported by tanker trucks from the satellite to the CPP. The radiological risk of these shipments is lower than shipping finished yellowcake because i) loaded resin shipments have lower uranium concentrations than yellowcake shipments, ii) uranium is chemically bound to resin beads; therefore, it is less likely to spread and easier to remediate in the event of a spill, and iii) loaded resin shipments are transported over shorter distances between the satellite and CPP versus over-the-road yellowcake shipments which are transported from site to a conversion facility. The NRC regulations at 10 CFR Part 71 and the incorporated U.S. Department of Transportation regulations for shipping ion exchange resins, which are enforced by NRC onsite inspections, also provide confidence that safety is maintained and the potential for environmental impacts regarding resin shipments remains small (ref. US NRC, 2009 and 2014).
| 64 | REPORT DATE: JANUARY 6, 2025 |
17.1.3.2 Yellowcake Shipment
After yellowcake is produced at an ISR processing facility, it is transported to a US approved conversion plant, to produce uranium hexafluoride (UF6) for production of nuclear reactor fuel. NRC and others have previously analyzed the hazards associated with transporting yellowcake and have determined potential impacts are small. Previously reported accidents involving yellowcake releases indicate that in all cases spills were contained and cleaned up quickly (by the shipper with state involvement) without significant health or safety impacts to workers or the public. Safety controls and compliance with existing transportation regulations in 10 CFR Part 71 add confidence that yellowcake can be shipped safely with a low potential for adversely affecting the environment. Transport drums, for example, must meet specifications of 49 CFR Part 173, which is incorporated in NRC regulations at 10 CFR Part 71. To further minimize transportation-related yellowcake releases, delivery trucks are recommended to meet safety certifications and drivers hold appropriate licenses (ref., USNRC, 2009 and 2014).
17.1.3.3 11. e.(2) Shipment
Operational 11.e.(2) byproduct materials (as defined in the Atomic Energy Act of 1954, as amended) will be shipped from the Dewey Burdock Project by truck for disposal at a licensed disposal site. All shipments will be completed in accordance with applicable NRC requirements in 10 CFR Part 71 and U.S. Department of Transportation requirements in 49 CFR Parts 171–189. Risks associated with transporting yellowcake were determined by NRC to bound the risks expected from byproduct material shipments, owing to the more concentrated nature of shipped yellowcake, the longer distance yellowcake is shipped relative to byproduct material destined for a licensed disposal facility, and the relative number of shipments of each material type. Therefore, potential environmental impacts from transporting byproduct material are considered small (ref., USNRC, 2009 and 2014).
17.2 Socioeconomic Studies and Issues
A Socioeconomic Assessment for the Project was performed by Knight Piesold and Co. in 2008 and updated by WWC Engineering August 2013. The Assessment’s summary of the economic impact was as follows (ref., WWC, 2013):
According to the economic impact analysis, the most significant benefits are the potential to create jobs, which will have direct and indirect effects on the local economies. Additional significant benefits include capital expenditures and tax benefits to the State of South Dakota, Custer County and Fall River County.
Impacts to the regional housing market should be minimal because of the large percentage of local workers. Impacts to schools and public facilities should be negligible because of their present ability to absorb any associated regional influx.
This economic impact analysis indicates that the construction and operation costs including capital costs of this project will result in positive economic benefits to the local and regional economy by the creation of hundreds of jobs and millions of dollars in tax revenue over the life of the project.
The development of the ISR project should present Custer and Fall River counties with net positive gain.
| 65 | REPORT DATE: JANUARY 6, 2025 |
17.3 Permitting Requirements and Status
The most significant permits and licenses required to operate the Project are (1) the Source and Byproduct Materials License, which was issued by NRC April of 2014; (2) the Large Scale Mine Permit, to be issued by the South Dakota DENR; and (3) UIC Class III and V wells (injection and/or deep disposal), and aquifer exemption, all three were issued in November 2020 by the EPA, but are currently under appeal.
The land within the Project boundary includes mining claims on private and federal lands. Access to these lands, as stated in Section 2, is controlled with leases held by enCore or by public access. Thus, a BLM Plan of Operations and associated Environmental Assessment which will reference the already completed Environmental Impact Statement previously finalized by NRC with BLM as a cooperating agency will be completed.
The status of the various federal and state permits and licenses are summarized in Table 17.1. Prior to the start of mining (the injection of lixiviant), enCore will obtain all the following necessary permits, licenses, and approvals required by the NRC, DENR and EPA.
| 66 | REPORT DATE: JANUARY 6, 2025 |
Table 17.1: Permitting Status
| Permit/License | Agency | Status | ||
| State of South Dakota | ||||
| Inyan Kara Water Right #2686-2 | SDDANR | Pending | ||
| Madison Water Right #2685-2 | SDDANR | Pending | ||
| Groundwater Discharge Plan | SDDANR | Pending | ||
| Large Scale Mine Permit | SDDANR | Pending | ||
| NPDES Construction Storm Water Permit | SDDANR | To be acquired | ||
| Septic System Permit | SDDANR | To be acquired | ||
| US EPA | ||||
| Class III - UIC Area Permit SD31231-00000 | USEPA-R8 | Issued, Under Appeal | ||
| Class V - UIC | USEPA-R8 | Issued, Under Appeal | ||
| Aquifer Exemption (EA) | USEPA-R8 | Issued, Under Appeal | ||
| Subpart W | USEPA-R8 | To be acquired | ||
| US Department of Interior BLM | ||||
| Plan of Operations | USDOI-BLM | Pending | ||
| Environmental Assessment DOI-BLM-MT-040-2015-0013 | USDOI-BLM | Complete | ||
| Reclamation Cost Estimate (RCE) | USDOI-BLM | To be acquired | ||
| US NRC | ||||
| Programmatic Agreement (USNRC,BLM,SD State Historic Preservation office & Advisory Council on Historic Preservation) | Interagency | Complete | ||
| Source and By-Product Materials License | USNRC | In good standing | ||
| NUREG 1910 Supplement 4, FSEIS | USNRC | In good standing | ||
| Final SER | NRC/BLM (coop agency) | In good standing | ||
| US Army Corp of Engineers | ||||
| Wetland Jurisdictional Determinations | USACE | Pending | ||
| Fall River and Custer Counties | ||||
| County Building Permits | Fall River & Custer Counties | To be acquired | ||
SDDANR = South Dakota Department of Agriculture and Natural Resources
SDWMB = South Dakota Water Management Board
SDBME = South Dakota Board of Minerals and Environment
USEPA-R8 = United States Environmental Protection Agency - Region 8
USDOI - BLM = United States Department of the Interior - Bureau of Land Management
USNRC = United States Nuclear Regulatory Commission
SECULD = Special Exceptional Critical or Unique Land Determination
UIC = Underground Injection Control
17.4 Community Affairs
enCore has an ongoing community affairs program. enCore maintains routine contacts with landowners, local communities and businesses, and the public. Once the project commences, the senior project operational managers and environmental manager will be onsite at the facility and are included in the administrative support labor costs for operations.
There is opposition to the project by environmental NGO’s, tribal governments and individuals though typically not in the Edgemont area. This has created increased regulatory efforts and logistics for accommodating public involvement, but at the time of this report, the NRC license has been issued, the draft EPA permits have been issued and the State of South Dakota large scale mine permit has been recommended for approval.
| 67 | REPORT DATE: JANUARY 6, 2025 |
There has already been extensive public involvement including public hearings and public comment on the project for the NRC license and draft EPA permits. Hearings for State of South Dakota permits begun in 2013 but were suspended pending completion of federal approvals. These hearings will resume, following issuance of the final EPA permits.
17.5 Project Closure
17.5.1 Byproduct Disposal
The 11.e.(2) or non-11.e.(2) byproduct disposal methods are discussed in Section 20. Deep disposal wells, landfills, and licensed 11.e.(2) facilities will be used depending on waste classification and type.
17.5.2 Well Abandonment and Groundwater Restoration
Groundwater restoration will begin as soon as practicable after uranium recovery is completed in each wellfield. If a depleted wellfield is near an area that is being recovered, a portion of the depleted area’s restoration may be delayed limiting interference with the on-going mining operations.
Groundwater restoration will require the circulation of mining fluids and extraction of mobilized ions through reverse osmosis treatment and subsequent reinjection of the RO permeate. The intent of groundwater restoration is to return the groundwater quality parameters consistent with that established during the pre-operational sampling for each wellfield. As previously noted, groundwater from the Inyan Kara does not meet EPA drinking water standards, as established in the site characterization baseline data.
Restoration completion assumes up to six pore volumes of groundwater will be extracted and treated by reverse osmosis. Following completion of successful restoration activities, stability monitoring, and regulatory approval, the injection and recovery wells will be plugged and abandoned in accordance with DENR regulations. Monitor wells will also be abandoned following verification of successful groundwater restoration.
17.5.3 Demolition and Removal of Infrastructure
Simultaneous with well abandonment operations, the trunk and feeder pipelines will be removed, tested for radiological contamination, segregated as either solid 11.e.(2) or non-11.e.(2), then chipped and transported to appropriate disposal facilities. The header houses will be disconnected from their foundations, decontaminated, segregated as either solid 11.e.(2) or non-11.e.(2), and transported to appropriate disposal facilities. The facilities’ processing equipment and ancillary structures will be demolished, tested for radiological properties, segregated and either scrapped or disposed of in appropriate disposal facilities based on their radiological properties.
| 68 | REPORT DATE: JANUARY 6, 2025 |
17.5.4 Reclamation
All disturbances will be reclaimed including, wellfields, plant sites and roads. The site will be re-graded to approximate pre-development contours, and the stockpiled topsoil placed over disturbed areas. The disturbed areas will then be seeded.
17.6 Financial Assurance
Financial surety will be required by NRC, the State of South Dakota, BLM and EPA. The Project will be secured for the estimated amount of total closure costs which include groundwater restoration, facility decommissioning and reclamation with a bond provided by a broker. Cash collateral, updated annually of the bond to enCore will be charged at a rate of 25% of total bonded closure costs. The remaining 75% will be bonded by company collateral. The broker will also require an annual premium payment of 2% of the face value of the bond. The financial surety (revised annually) is based on the estimated amount of annual development that would require closure by a third-party contactor in the case of default by the owner. The costs for project closure and financial assurance are included in Table 18.2: Operating Cost Forecast by Year, and the economic analysis presented in Tables 19.1 and 19.2.
17.7 Adequacy of Mitigation Plans
It is the QP’s opinion that enCore’s plans to address any issues related to environmental compliance, permitting and local individuals or groups are adequate. enCore is proactive with an ongoing community affairs program maintaining routine contacts with landowners, local communities, businesses, and the public. The company has good relationships with state and federal regulatory agencies and is proactive working with these agencies as good stewards of the Project.
| 69 | REPORT DATE: JANUARY 6, 2025 |
18.0 CAPITAL AND OPERATING COSTS
Capital and operating costs are on a 100% cost basis. All costs are based on 2024 USD and the estimated production throughput. Cost projections do not contain any estimates associated with development, mining or processing of inferred mineral resources.
18.1 Capital Cost Estimates
Estimated capital costs are $264.2 M and includes $2.2 M for pre-construction permitting and licensing costs, $178.0 M for wellfield development, $84.0 M for the CPP, Satellite and associated infrastructure. Labor costs for Wellfield Construction are also included in capital costs totaling $34.1 M. See Table 18.1 for Capital Cost Components and Table 18.2 for tabulation of capital components over the LOM.
Capital is heavily weighted from 2027 through 2029 with start-up costs for construction of the Burdock CPP, Dewey Satellite, initial Dewey and Burdock wellfields, and associated infrastructure. Capital costs during this period are estimated at $105.0 M.
| 70 | REPORT DATE: JANUARY 6, 2025 |
Table 18.1: Capital Cost Components
| Item Description | Cost | CPP | Satellite | |||||||||
| Plant Development Costs | ||||||||||||
| DIV-01: General Requirements | $ | 5,179,360 | $ | 3,568,567 | $ | 1,610,794 | ||||||
| DIV-02: Existing Conditions | $ | 0 | $ | 0 | $ | 0 | ||||||
| DIV-03: Concrete | $ | 2,827,150 | $ | 1,818,825 | $ | 1,008,325 | ||||||
| DIV-04: Masonry | $ | 0 | $ | 0 | $ | 0 | ||||||
| DIV-05: Metals | $ | 1,323,292 | $ | 1,088,040 | $ | 235,252 | ||||||
| DIV-06: Carpentry | $ | 0 | $ | 0 | $ | 0 | ||||||
| DIV-07: Thermal & Moisture | $ | 0 | $ | 0 | $ | 0 | ||||||
| DIV-08: Openings | $ | 0 | $ | 0 | $ | 0 | ||||||
| DIV-09: Finishes | $ | 101,919 | $ | 69,412 | $ | 32,508 | ||||||
| DIV-10: Specialties | $ | 0 | $ | 0 | $ | 0 | ||||||
| DIV-11: Equipment | $ | 2,076,858 | $ | 2,052,858 | $ | 24,000 | ||||||
| DIV-12: Furnishings | $ | 1,722,559 | $ | 975,378 | $ | 747,181 | ||||||
| DIV-13: Special Construction | $ | 6,461,558 | $ | 4,430,078 | $ | 2,031,480 | ||||||
| DIV-14: Conveying Equipment | $ | 0 | $ | 0 | $ | 0 | ||||||
| DIV-21: Fire Suppression | $ | 564,326 | $ | 367,799 | $ | 196,527 | ||||||
| DIV-22: Plumbing | $ | 521,202 | $ | 317,200 | $ | 204,002 | ||||||
| DIV-23: HVAC | $ | 864,298 | $ | 559,282 | $ | 305,016 | ||||||
| DIV-25: Integrated Automation | $ | 0 | $ | 0 | $ | 0 | ||||||
| DIV-26: Electrical | $ | 8,052,369 | $ | 5,100,106 | $ | 2,952,263 | ||||||
| DIV-27: Communications | $ | 110,274 | $ | 73,516 | $ | 36,758 | ||||||
| DIV-28: Electric Safety & Security | $ | 0 | $ | 0 | $ | 0 | ||||||
| DIV-31: Earthwork | $ | 10,670,189 | $ | 6,425,861 | $ | 4,244,327 | ||||||
| DIV-32: Exterior Improvements | $ | 268,735 | $ | 212,908 | $ | 55,827 | ||||||
| DIV-33: Utilities | $ | 9,449,585 | $ | 8,851,163 | $ | 598,422 | ||||||
| DIV-34: Transportation | $ | 0 | $ | 0 | $ | 0 | ||||||
| DIV-35: Waterway & Marine Construction | $ | 0 | $ | 0 | $ | 0 | ||||||
| DIV-40: Process Integration | $ | 5,444,958 | $ | 3,376,766 | $ | 2,068,192 | ||||||
| DIV-41: Material Processing & Handling | $ | 274,680 | $ | 274,680 | $ | 0 | ||||||
| DIV-42: Process Heating Cooling & Drying | $ | 948,102 | $ | 948,102 | $ | 0 | ||||||
| DIV-43: Process Gas & Liquid Handling | $ | 4,818,275 | $ | 3,582,908 | $ | 1,235,367 | ||||||
| DIV-44: Pollution & Waste Control Equipment | $ | 0 | $ | 0 | $ | 0 | ||||||
| DIV-45: Industry Specific Manufacturing | $ | 0 | $ | 0 | $ | 0 | ||||||
| DIV-46: Water & Wastewater Equipment | $ | 8,011,539 | $ | 3,967,130 | $ | 4,044,408 | ||||||
| DIV-48: Electrical Power Generation | $ | 230,138 | $ | 115,069 | $ | 115,069 | ||||||
| Plant Development Subtotal | $ | 69,921,366 | $ | 48,175,649 | $ | 21,745,717 | ||||||
| Sales Tax (4.5%) | $ | 3,146,461 | $ | 2,167,904.21 | $ | 978,557 | ||||||
| Total Plant CAPEX | $ | 73,067,828 | $ | 50,343,553 | $ | 22,724,275 | ||||||
| Wellfield Development Costs | ||||||||||||
| Wellfield CAPEX | $ | 119,752,679 | ||||||||||
| Sales Tax (4.5%) | $ | 5,388,871 | ||||||||||
| Total Wellfield CAPEX | $ | 125,141,550 | ||||||||||
| Total CAPEX | $ | 198,209,378 | ||||||||||
| 71 | REPORT DATE: JANUARY 6, 2025 |
Table 18.2: Capital Cost Forecast by Year
| Total or | $ per | 2024 | 2025 | 2026 | 2027 | 2028 | 2029 | 2030 | 2031 | 2032 | 2033 | |||||||||||||||||||||||||||||||||||||||
| Cash Flow Line Items | Units | Average | Pound | Year-2 | Year-1 | Year 1 | Year 2 | Year 3 | Year 4 | Year 5 | Year 6 | Year 7 | Year 8 | |||||||||||||||||||||||||||||||||||||
| Less: Pre-Construction Capital Costs | US$000s | $ | 2,200 | $ | 0.16 | $ | 0 | $ | 400 | $ | 900 | $ | 900 | $ | 0 | $ | 0 | $ | 0 | $ | 0 | $ | 0 | $ | 0 | |||||||||||||||||||||||||
| Less: Plant Development Costs | US$000s | $ | 84,028 | $ | 5.95 | $ | 0 | $ | 0 | $ | 0 | $ | 43,421 | $ | 27,540 | $ | 13,066 | $ | 0 | $ | 0 | $ | 0 | $ | 0 | |||||||||||||||||||||||||
| Less: Wellfield Development Costs | US$000s | $ | 178,050 | $ | 12.61 | $ | 0 | $ | 0 | $ | 0 | $ | 2,105 | $ | 7,222 | $ | 11,697 | $ | 10,059 | $ | 11,122 | $ | 10,608 | $ | 11,972 | |||||||||||||||||||||||||
| Capital Costs | US$000s | $ | 264,278 | $ | 18.72 | $ | 0 | $ | 400 | $ | 900 | $ | 46,426 | $ | 34,762 | $ | 24,764 | $ | 10,059 | $ | 11,122 | $ | 10,608 | $ | 11,972 | |||||||||||||||||||||||||
| 72 | REPORT DATE: JANUARY 6, 2025 |
| 2034 | 2035 | 2036 | 2037 | 2038 | 2039 | 2040 | 2041 | 2042 | 2043 | 2044 | 2045 | 2046 | ||||||||||||||||||||||||||||||||||||||||
| Cash Flow Line Items | Year 9 | Year 10 | Year 11 | Year 12 | Year 13 | Year 14 | Year 15 | Year 16 | Year 17 | Year 18 | Year 19 | Year 20 | Year 21 | |||||||||||||||||||||||||||||||||||||||
| Less: Pre-Construction Capital Costs | $ | 0 | $ | 0 | $ | 0 | $ | 0 | $ | 0 | $ | 0 | $ | 0 | $ | 0 | $ | 0 | $ | 0 | $ | 0 | $ | 0 | $ | 0 | ||||||||||||||||||||||||||
| Less: Plant Development Costs | $ | 0 | $ | 0 | $ | 0 | $ | 0 | $ | 0 | $ | 0 | $ | 0 | $ | 0 | $ | 0 | $ | 0 | $ | 0 | $ | 0 | $ | 0 | ||||||||||||||||||||||||||
| Less: Wellfield Development Costs | $ | 10,732 | $ | 12,951 | $ | 11,186 | $ | 10,091 | $ | 9,518 | $ | 10,132 | $ | 10,315 | $ | 9,070 | $ | 7,641 | $ | 7,216 | $ | 6,765 | $ | 5,278 | $ | 970 | ||||||||||||||||||||||||||
| Capital Costs | $ | 10,732 | $ | 12,951 | $ | 11,186 | $ | 10,091 | $ | 9,518 | $ | 10,132 | $ | 10,315 | $ | 9,070 | $ | 7,641 | $ | 7,216 | $ | 6,765 | $ | 5,278 | $ | 970 | ||||||||||||||||||||||||||
| 73 | REPORT DATE: JANUARY 6, 2025 |
| 2047 | 2048 | 2049 | 2050 | 2051 | 2052 | |||||||||||||||||||
| Cash Flow Line Items | Year 22 | Year 23 | Year 24 | Year 25 | Year 26 | Year 27 | ||||||||||||||||||
| Less: Pre-Construction Capital Costs | $ | 0 | $ | 0 | $ | 0 | $ | 0 | $ | 0 | $ | 0 | ||||||||||||
| Less: Plant Development Costs | $ | 0 | $ | 0 | $ | 0 | $ | 0 | $ | 0 | $ | 0 | ||||||||||||
| Less: Wellfield Development Costs | $ | 233 | $ | 233 | $ | 233 | $ | 233 | $ | 233 | $ | 233 | ||||||||||||
| Capital Costs | $ | 233 | $ | 233 | $ | 233 | $ | 233 | $ | 233 | $ | 233 | ||||||||||||
| 74 | REPORT DATE: JANUARY 6, 2025 |
18.2 Operating Cost Estimates
Estimated operating costs for plant and wellfield operations, product transaction, administrative support, decontamination, and decommissioning, and restoration are presented in Table 18.3: Operating Cost Components and over the LOM in Table 18.4: Operating Cost Forecast by Year.
Wellfield operating costs include electricity, replacement wells and associated equipment, header house repairs, rental equipment, rolling stock, equipment fuel and maintenance, and wellfield chemicals.
Plant operating expenses include plant chemicals, electricity, equipment fuel and maintenance, waste management operations, rentals and supplies, RO operations and product handling.
Product transaction costs include costs for product shipping and conversion fees.
D&D and restoration costs include costs for restoration of the wellfields, decontamination and decommissioning of facilities, and reclamation of the site.
Administrative support costs include legal fees, land and mineral acquisitions, regulatory fees, insurance, office supplies and financial assurance.
Baseline, environmental monitoring and operational monitoring are included in Closure, Labor and Plant operating costs.
Operating costs are estimated to be $23.81 per pound of U3O8. The basis for operating costs is planned development and production sequence and quantity, in conjunction with past production knowledge.
Labor costs associated with wellfield and plant operations, restoration and administration are included in operating costs.
18.3 Cost Accuracy
To assess the accuracy of the capital and operating cost estimates, the QP has considered the risks associated with the specific engineering estimation methods used to arrive at the estimates. As part of this analysis, the QP has taken into consideration the completeness of relevant factors in determining the estimation accuracy compared to prior similar environments. Relevant factors considered include site infrastructure, mine design and planning, processing plant, environmental compliance and permitting, other relevant factors, capital costs, operating costs and economic analysis.
With respect to site infrastructure, required access roads, infrastructure location, plant and satellite areas are defined. The source of utilities required for development and production are defined and are suitable for cost estimating.
The preferred mining method is defined and detailed mine layouts are designed. Development and production plans are defined for the mining method and required equipment fleet has been specified.
For processing, detailed bench lab tests have been conducted and detailed process flow sheet, equipment sizes and general arrangement is completed.
| 75 | REPORT DATE: JANUARY 6, 2025 |
Identification and detailed analysis of environmental compliance and permitting requirements is complete. Detailed baseline studies with impact assessments are complete, as well as detailed disposal, reclamation and mitigation plans.
Regarding other relevant factors, reasonable assumptions are made regarding testing and modifying factors are sufficient to demonstrate that extraction is economically viable.
Capital and operating cost estimates have an accuracy of ±25% and contingency of ≤15%.
An economic analysis is included. Taxes are evaluated and described in detail. Revenues are estimated based on a detailed market analysis and economics are assessed in detail using a after-tax discounted cash flow analysis.
It is the QP’s opinion that the accuracy of capital and operating cost estimates does comply with § 229.1302 of Regulation S–K for a preliminary feasibility study.
Table 18.3: Operating Cost Components
| Cash Flow Line Items | Units | Total or Average | $ per Pound | |||||||
| Uranium Production as U3O81,2 | Lbs 000s | 14,116 | - | |||||||
| Uranium Price for U3O83 | US$/lb | $ | 86.34 | - | ||||||
| Uranium Gross Revenue | US$000s | $ | 1,218,816 | - | ||||||
| Less: Surface & Mineral Royalties4 | US$000s | $ | 70,935 | $ | 5.03 | |||||
| Taxable Revenue | US$000s | $ | 1,147,881 | - | ||||||
| Less: Severance & Conservation Tax5 | US$000s | $ | 54,410 | $ | 3.85 | |||||
| Less: Property Tax6 | US$000s | $ | 16,233 | $ | 1.15 | |||||
| Net Gross Sales | US$000s | $ | 1,077,239 | - | ||||||
| Less: Plant & Wellfield Operating Costs | US$000s | $ | 276,856 | $ | 19.61 | |||||
| Less: Product Transaction Costs | US$000s | $ | 4,636 | $ | 0.33 | |||||
| Less: Administrative Support Costs | US$000s | $ | 23,632 | $ | 1.67 | |||||
| Less: D&D and Restoration Costs | US$000s | $ | 30,955 | $ | 2.19 | |||||
| Net Operating Cash Flow | US$000s | $ | 741,159 | - | ||||||
| 76 | REPORT DATE: JANUARY 6, 2025 |
Table 18.4: Operating Cost Forecast by Year
| Total or | $ per | 2024 | 2025 | 2026 | 2027 | 2028 | 2029 | 2030 | 2031 | |||||||||||||||||||||||||||||||||
| Cash Flow Line Items | Units | Average | Pound | Year-2 | Year-1 | Year 1 | Year 2 | Year 3 | Year 4 | Year 5 | Year 6 | |||||||||||||||||||||||||||||||
| Less: Plant & Wellfield Operating Costs | US$000s | $ | 276,856 | $ | 19.61 | $ | 0 | $ | 540 | $ | 671 | $ | 1,798 | $ | 8,117 | $ | 14,729 | $ | 15,507 | $ | 15,507 | |||||||||||||||||||||
| Less: Product Transaction Costs | US$000s | $ | 4,636 | $ | 0.33 | $ | 0 | $ | 0 | $ | 0 | $ | 0 | $ | 135 | $ | 298 | $ | 280 | $ | 317 | |||||||||||||||||||||
| Less: Administrative Support Costs | US$000s | $ | 23,632 | $ | 1.67 | $ | 0 | $ | 0 | $ | 1,274 | $ | 1,559 | $ | 1,240 | $ | 1,325 | $ | 1,332 | $ | 1,434 | |||||||||||||||||||||
| Less: D&D and Restoration Costs | US$000s | $ | 30,955 | $ | 2.19 | $ | 0 | $ | 0 | $ | 0 | $ | 0 | $ | 0 | $ | 0 | $ | 0 | $ | 0 | |||||||||||||||||||||
| Operating Costs | US$000s | $ | 336,079 | $ | 23.81 | $ | 0 | $ | 540 | $ | 1,945 | $ | 3,358 | $ | 9,493 | $ | 16,352 | $ | 17,119 | $ | 17,258 | |||||||||||||||||||||
| 77 | REPORT DATE: JANUARY 6, 2025 |
| 2032 | 2033 | 2034 | 2035 | 2036 | 2037 | 2038 | 2039 | 2040 | 2041 | 2042 | ||||||||||||||||||||||||||||||||||
| Cash Flow Line Items | Year 7 | Year 8 | Year 9 | Year 10 | Year 11 | Year 12 | Year 13 | Year 14 | Year 15 | Year 16 | Year 17 | |||||||||||||||||||||||||||||||||
| Less: Plant & Wellfield Operating Costs | $ | 15,507 | $ | 15,507 | $ | 15,507 | $ | 15,507 | $ | 15,507 | $ | 15,507 | $ | 15,507 | $ | 15,507 | $ | 15,507 | $ | 15,041 | $ | 9,076 | ||||||||||||||||||||||
| Less: Product Transaction Costs | $ | 283 | $ | 317 | $ | 262 | $ | 316 | $ | 284 | $ | 280 | $ | 248 | $ | 281 | $ | 250 | $ | 281 | $ | 250 | ||||||||||||||||||||||
| Less: Administrative Support Costs | $ | 1,147 | $ | 1,045 | $ | 1,044 | $ | 938 | $ | 931 | $ | 888 | $ | 954 | $ | 829 | $ | 863 | $ | 889 | $ | 894 | ||||||||||||||||||||||
| Less: D&D and Restoration Costs | $ | 355 | $ | 666 | $ | 1,144 | $ | 1,736 | $ | 1,511 | $ | 1,728 | $ | 1,583 | $ | 1,895 | $ | 1,629 | $ | 1,809 | $ | 1,565 | ||||||||||||||||||||||
| Operating Costs | $ | 17,292 | $ | 17,535 | $ | 17,957 | $ | 18,496 | $ | 18,232 | $ | 18,404 | $ | 18,292 | $ | 18,512 | $ | 18,248 | $ | 18,021 | $ | 11,785 | ||||||||||||||||||||||
| 78 | REPORT DATE: JANUARY 6, 2025 |
| 2043 | 2044 | 2045 | 2046 | 2047 | 2048 | 2049 | 2050 | 2051 | 2052 | |||||||||||||||||||||||||||||||
| Cash Flow Line Items | Year 18 | Year 19 | Year 20 | Year 21 | Year 22 | Year 23 | Year 24 | Year 25 | Year 26 | Year 27 | ||||||||||||||||||||||||||||||
| Less: Plant & Wellfield Operating Costs | $ | 8,610 | $ | 6,816 | $ | 5,852 | $ | 5,619 | $ | 5,231 | $ | 5,231 | $ | 5,231 | $ | 5,231 | $ | 5,231 | $ | 3,256 | ||||||||||||||||||||
| Less: Product Transaction Costs | $ | 235 | $ | 168 | $ | 130 | $ | 20 | $ | 0 | $ | 0 | $ | 0 | $ | 0 | $ | 0 | $ | 0 | ||||||||||||||||||||
| Less: Administrative Support Costs | $ | 782 | $ | 553 | $ | 497 | $ | 513 | $ | 507 | $ | 502 | $ | 554 | $ | -270 | $ | 704 | $ | 704 | ||||||||||||||||||||
| Less: D&D and Restoration Costs | $ | 1,481 | $ | 1,428 | $ | 1,485 | $ | 1,444 | $ | 1,392 | $ | 1,261 | $ | 3,264 | $ | 2,936 | $ | 557 | $ | 85 | ||||||||||||||||||||
| Operating Costs | $ | 11,109 | $ | 8,965 | $ | 7,965 | $ | 7,596 | $ | 7,130 | $ | 6,993 | $ | 9,049 | $ | 7,896 | $ | 6,491 | $ | 4,045 | ||||||||||||||||||||
| 79 | REPORT DATE: JANUARY 6, 2025 |
19.0 ECONOMIC ANALYSIS
19.1 Economic analysis
The Project economic analysis illustrates a cash flow forecast on an annual basis using mineral resources and an annual production schedule for the LOM NPV, IRR and capital payback period. A summary of taxes, royalties, and other interests, as applicable to production and revenue are also discussed, as well as the impact of significant parameters such as uranium sales price, and capital and operating costs to economic sensitivity. The analysis assumes no escalation, no debt, no debt interest, no capital repayment and no state income tax since South Dakota does not impose a corporate income tax.
enCore is using a uranium sales price ranging from $82.00 to $89.00, with an average sales price of $86.34. Price basis is discussed in Section 19.
The economic analysis assumes that 80% of the mineral resources are recoverable. The pre-tax net cash flow incorporates estimated sales revenue from recoverable uranium, less costs for surface and mineral royalties, severance and conservation tax, property tax, plant and wellfield operations, product transaction, administrative support, D&D, restoration, and pre-construction capital. The after-tax analysis includes the above information plus amortized development costs, depreciated plant and wellfield capital costs, existing and forecasted operating losses to estimate federal income tax.
Less Federal Tax, the Projects cash flow is estimated at $476.8 M or $52.56 per pound U3O8.Using an 8% discount rate, the Projects NPV is $180.1 M with an IRR of 39% (Table 19.1). The Projects after tax cash flow is estimated at $363.4 M for a cost per pound U3O8 of $60.60. Using an 8.0% discount rate, the Projects NPV is $133.6 M and has an IRR of 33% (Table 19.2).
| 80 | REPORT DATE: JANUARY 6, 2025 |
Table 19.1: Economic Analysis Forecast by Year with Exclusion of Federal Income Tax
| Total or | $ per | 2024 | 2025 | 2026 | 2027 | 2028 | 2029 | 2030 | 2031 | 2032 | 2033 | ||||||||||||||||||||||||||||||||||||||||
| Cash Flow Line Items | Units | Average | Pound | Year -2 | Year -1 | Year 1 | Year 2 | Year 3 | Year 4 | Year 5 | Year 6 | Year 7 | Year 8 | ||||||||||||||||||||||||||||||||||||||
| Uranium Production as U3O81,2 | Lbs 000s | 14,116 | - | 0 | 0 | 0 | 0 | 412 | 909 | 852 | 966 | 861 | 965 | ||||||||||||||||||||||||||||||||||||||
| Uranium Price for U3O83 | US$/lb | $ | 86.34 | - | $ | 82.00 | $ | 82.00 | $ | 84.25 | $ | 83.75 | $ | 83.25 | $ | 82.00 | $ | 83.50 | $ | 85.00 | $ | 85.75 | $ | 86.75 | |||||||||||||||||||||||||||
| Uranium Gross Revenue | US$000s | $ | 1,218,816 | - | $ | 0 | $ | 0 | $ | 0 | $ | 0 | $ | 34,284 | $ | 74,500 | $ | 71,178 | $ | 82,149 | $ | 73,835 | $ | 83,732 | |||||||||||||||||||||||||||
| Less: Surface & Mineral Royalties4 | US$000s | $ | 70,935 | $ | 5.03 | $ | 0 | $ | 0 | $ | 0 | $ | 0 | $ | 1,995 | $ | 4,336 | $ | 4,143 | $ | 4,781 | $ | 4,297 | $ | 4,873 | ||||||||||||||||||||||||||
| Taxable Revenue | US$000s | $ | 1,147,881 | - | $ | 0 | $ | 0 | $ | 0 | $ | 0 | $ | 32,289 | $ | 70,164 | $ | 67,035 | $ | 77,368 | $ | 69,538 | $ | 78,859 | |||||||||||||||||||||||||||
| Less: Severance & Conservation Tax5 | US$000s | $ | 54,410 | $ | 3.85 | $ | 0 | $ | 0 | $ | 0 | $ | 0 | $ | 1,530 | $ | 3,326 | $ | 3,177 | $ | 3,667 | $ | 3,296 | $ | 3,738 | ||||||||||||||||||||||||||
| Less: Property Tax6 | US$000s | $ | 16,233 | $ | 1.15 | $ | 0 | $ | 0 | $ | 0 | $ | 0 | $ | 0 | $ | 0 | $ | 95 | $ | 191 | $ | 286 | $ | 1,439 | ||||||||||||||||||||||||||
| Net Gross Sales | US$000s | $ | 1,077,239 | - | $ | 0 | $ | 0 | $ | 0 | $ | 0 | $ | 30,758 | $ | 66,838 | $ | 63,762 | $ | 73,509 | $ | 65,955 | $ | 73,682 | |||||||||||||||||||||||||||
| Less: Plant & Wellfield Operating Costs | US$000s | $ | 276,856 | $ | 19.61 | $ | 0 | $ | 540 | $ | 671 | $ | 1,798 | $ | 8,117 | $ | 14,729 | $ | 15,507 | $ | 15,507 | $ | 15,507 | $ | 15,507 | ||||||||||||||||||||||||||
| Less: Product Transaction Costs | US$000s | $ | 4,636 | $ | 0.33 | $ | 0 | $ | 0 | $ | 0 | $ | 0 | $ | 135 | $ | 298 | $ | 280 | $ | 317 | $ | 283 | $ | 317 | ||||||||||||||||||||||||||
| Less: Administrative Support Costs | US$000s | $ | 23,632 | $ | 1.67 | $ | 0 | $ | 0 | $ | 1,274 | $ | 1,559 | $ | 1,240 | $ | 1,325 | $ | 1,332 | $ | 1,434 | $ | 1,147 | $ | 1,045 | ||||||||||||||||||||||||||
| Less: D&D and Restoration Costs | US$000s | $ | 30,955 | $ | 2.19 | $ | 0 | $ | 0 | $ | 0 | $ | 0 | $ | 0 | $ | 0 | $ | 0 | $ | 0 | $ | 355 | $ | 666 | ||||||||||||||||||||||||||
| Net Operating Cash Flow | US$000s | $ | 741,159 | - | $ | 0 | $ | -540 | $ | -1,945 | $ | -3,358 | $ | 21,265 | $ | 50,486 | $ | 46,643 | $ | 56,251 | $ | 48,663 | $ | 56,147 | |||||||||||||||||||||||||||
| Less: Pre-Construction Capital Costs | US$000s | $ | 2,200 | $ | 0.16 | $ | 0 | $ | 400 | $ | 900 | $ | 900 | $ | 0 | $ | 0 | $ | 0 | $ | 0 | $ | 0 | $ | 0 | ||||||||||||||||||||||||||
| Less: Plant Development Costs | US$000s | $ | 84,028 | $ | 5.95 | $ | 0 | $ | 0 | $ | 0 | $ | 43,421 | $ | 27,540 | $ | 13,066 | $ | 0 | $ | 0 | $ | 0 | $ | 0 | ||||||||||||||||||||||||||
| Less: Wellfield Development Costs | US$000s | $ | 178,050 | $ | 12.61 | $ | 0 | $ | 0 | $ | 0 | $ | 2,105 | $ | 7,222 | $ | 11,697 | $ | 10,059 | $ | 11,122 | $ | 10,608 | $ | 11,972 | ||||||||||||||||||||||||||
| Net Before-Tax Cash Flow | US$000s | $ | 476,882 | - | $ | 0 | $ | -940 | $ | -2,845 | $ | -49,784 | $ | -13,497 | $ | 25,722 | $ | 36,584 | $ | 45,129 | $ | 38,055 | $ | 44,175 | |||||||||||||||||||||||||||
| Total cost per pound: | $ | 52.56 | |||||||||||||||||||||||||||||||||||||||||||||||||
| Discount Rate | 8 | % | |||||||||||||||||||||||||||||||||||||||||||||||||
| NPV | $ | 180,165 | |||||||||||||||||||||||||||||||||||||||||||||||||
| IRR | 39 | % | |||||||||||||||||||||||||||||||||||||||||||||||||
| 81 | REPORT DATE: JANUARY 6, 2025 |
| 2034 | 2035 | 2036 | 2037 | 2038 | 2039 | 2040 | 2041 | 2042 | 2043 | 2044 | 2045 | 2046 | ||||||||||||||||||||||||||||||||||||||||
| Cash Flow Line Items | Year 9 | Year 10 | Year 11 | Year 12 | Year 13 | Year 14 | Year 15 | Year 16 | Year 17 | Year 18 | Year 19 | Year 20 | Year 21 | |||||||||||||||||||||||||||||||||||||||
| Uranium Production as U3O81,2 | 798 | 961 | 864 | 854 | 756 | 857 | 761 | 857 | 760 | 716 | 511 | 395 | 60 | |||||||||||||||||||||||||||||||||||||||
| Uranium Price for U3O83 | $ | 88.00 | $ | 88.00 | $ | 88.25 | $ | 89.00 | $ | 89.00 | $ | 88.00 | $ | 86.25 | $ | 86.00 | $ | 86.00 | $ | 86.00 | $ | 86.00 | $ | 86.00 | $ | 86.50 | ||||||||||||||||||||||||||
| Uranium Gross Revenue | $ | 70,193 | $ | 84,564 | $ | 76,229 | $ | 75,992 | $ | 67,282 | $ | 75,425 | $ | 65,611 | $ | 73,689 | $ | 65,402 | $ | 61,558 | $ | 43,970 | $ | 34,009 | $ | 5,215 | ||||||||||||||||||||||||||
| Less: Surface & Mineral Royalties4 | $ | 4,085 | $ | 4,922 | $ | 4,437 | $ | 4,423 | $ | 3,916 | $ | 4,390 | $ | 3,819 | $ | 4,289 | $ | 3,806 | $ | 3,583 | $ | 2,559 | $ | 1,979 | $ | 304 | ||||||||||||||||||||||||||
| Taxable Revenue | $ | 66,108 | $ | 79,642 | $ | 71,793 | $ | 71,569 | $ | 63,366 | $ | 71,035 | $ | 61,792 | $ | 69,400 | $ | 61,596 | $ | 57,975 | $ | 41,411 | $ | 32,030 | $ | 4,911 | ||||||||||||||||||||||||||
| Less: Severance & Conservation Tax5 | $ | 3,134 | $ | 3,775 | $ | 3,403 | $ | 3,392 | $ | 3,004 | $ | 3,367 | $ | 2,929 | $ | 3,290 | $ | 2,920 | $ | 2,748 | $ | 1,963 | $ | 1,518 | $ | 233 | ||||||||||||||||||||||||||
| Less: Property Tax6 | $ | 1,534 | $ | 1,057 | $ | 1,057 | $ | 1,057 | $ | 1,057 | $ | 1,057 | $ | 1,057 | $ | 1,057 | $ | 1,057 | $ | 1,057 | $ | 1,057 | $ | 1,057 | $ | 1,057 | ||||||||||||||||||||||||||
| Net Gross Sales | $ | 61,440 | $ | 74,810 | $ | 67,333 | $ | 67,120 | $ | 59,306 | $ | 66,611 | $ | 57,806 | $ | 65,054 | $ | 57,619 | $ | 54,170 | $ | 38,391 | $ | 29,454 | $ | 3,621 | ||||||||||||||||||||||||||
| Less: Plant & Wellfield Operating Costs | $ | 15,507 | $ | 15,507 | $ | 15,507 | $ | 15,507 | $ | 15,507 | $ | 15,507 | $ | 15,507 | $ | 15,041 | $ | 9,076 | $ | 8,610 | $ | 6,816 | $ | 5,852 | $ | 5,619 | ||||||||||||||||||||||||||
| Less: Product Transaction Costs | $ | 262 | $ | 316 | $ | 284 | $ | 280 | $ | 248 | $ | 281 | $ | 250 | $ | 281 | $ | 250 | $ | 235 | $ | 168 | $ | 130 | $ | 20 | ||||||||||||||||||||||||||
| Less: Administrative Support Costs | $ | 1,044 | $ | 938 | $ | 931 | $ | 888 | $ | 954 | $ | 829 | $ | 863 | $ | 889 | $ | 894 | $ | 782 | $ | 553 | $ | 497 | $ | 513 | ||||||||||||||||||||||||||
| Less: D&D and Restoration Costs | $ | 1,144 | $ | 1,736 | $ | 1,511 | $ | 1,728 | $ | 1,583 | $ | 1,895 | $ | 1,629 | $ | 1,809 | $ | 1,565 | $ | 1,481 | $ | 1,428 | $ | 1,485 | $ | 1,444 | ||||||||||||||||||||||||||
| Net Operating Cash Flow | $ | 43,483 | $ | 56,314 | $ | 49,101 | $ | 48,716 | $ | 41,014 | $ | 48,099 | $ | 39,558 | $ | 47,032 | $ | 45,834 | $ | 43,061 | $ | 29,426 | $ | 21,490 | $ | -3,974 | ||||||||||||||||||||||||||
| Less: Pre-Construction Capital Costs | $ | 0 | $ | 0 | $ | 0 | $ | 0 | $ | 0 | $ | 0 | $ | 0 | $ | 0 | $ | 0 | $ | 0 | $ | 0 | $ | 0 | $ | 0 | ||||||||||||||||||||||||||
| Less: Plant Development Costs | $ | 0 | $ | 0 | $ | 0 | $ | 0 | $ | 0 | $ | 0 | $ | 0 | $ | 0 | $ | 0 | $ | 0 | $ | 0 | $ | 0 | $ | 0 | ||||||||||||||||||||||||||
| Less: Wellfield Development Costs | $ | 10,732 | $ | 12,951 | $ | 11,186 | $ | 10,091 | $ | 9,518 | $ | 10,132 | $ | 10,315 | $ | 9,070 | $ | 7,641 | $ | 7,216 | $ | 6,765 | $ | 5,278 | $ | 970 | ||||||||||||||||||||||||||
| Net Before-Tax Cash Flow | $ | 32,751 | $ | 43,363 | $ | 37,914 | $ | 38,624 | $ | 31,496 | $ | 37,966 | $ | 29,243 | $ | 37,962 | $ | 38,192 | $ | 35,845 | $ | 22,661 | $ | 16,211 | $ | -4,945 | ||||||||||||||||||||||||||
| 82 | REPORT DATE: JANUARY 6, 2025 |
| 2047 | 2048 | 2049 | 2050 | 2051 | 2052 | |||||||||||||||||||
| Cash Flow Line Items | Year 22 | Year 23 | Year 24 | Year 25 | Year 26 | Year 27 | ||||||||||||||||||
| Uranium Production as U3O81,2 | 0 | 0 | 0 | 0 | 0 | 0 | ||||||||||||||||||
| Uranium Price for U3O83 | $ | 87.00 | $ | 87.00 | $ | 87.00 | $ | 87.00 | $ | 87.00 | $ | 87.00 | ||||||||||||
| Uranium Gross Revenue | $ | 0 | $ | 0 | $ | 0 | $ | 0 | $ | 0 | $ | 0 | ||||||||||||
| Less: Surface & Mineral Royalties4 | $ | 0 | $ | 0 | $ | 0 | $ | 0 | $ | 0 | $ | 0 | ||||||||||||
| Taxable Revenue | $ | 0 | $ | 0 | $ | 0 | $ | 0 | $ | 0 | $ | 0 | ||||||||||||
| Less: Severance & Conservation Tax5 | $ | 0 | $ | 0 | $ | 0 | $ | 0 | $ | 0 | $ | 0 | ||||||||||||
| Less: Property Tax6 | $ | 0 | $ | 0 | $ | 0 | $ | 0 | $ | 0 | $ | 0 | ||||||||||||
| Net Gross Sales | $ | 0 | $ | 0 | $ | 0 | $ | 0 | $ | 0 | $ | 0 | ||||||||||||
| Less: Plant & Wellfield Operating Costs | $ | 5,231 | $ | 5,231 | $ | 5,231 | $ | 5,231 | $ | 5,231 | $ | 3,256 | ||||||||||||
| Less: Product Transaction Costs | $ | 0 | $ | 0 | $ | 0 | $ | 0 | $ | 0 | $ | 0 | ||||||||||||
| Less: Administrative Support Costs | $ | 507 | $ | 502 | $ | 554 | $ | -270 | $ | 704 | $ | 704 | ||||||||||||
| Less: D&D and Restoration Costs | $ | 1,392 | $ | 1,261 | $ | 3,264 | $ | 2,936 | $ | 557 | $ | 85 | ||||||||||||
| Net Operating Cash Flow | $ | -7,130 | $ | -6,993 | $ | -9,049 | $ | -7,896 | $ | -6,491 | $ | -4,045 | ||||||||||||
| Less: Pre-Construction Capital Costs | $ | 0 | $ | 0 | $ | 0 | $ | 0 | $ | 0 | $ | 0 | ||||||||||||
| Less: Plant Development Costs | $ | 0 | $ | 0 | $ | 0 | $ | 0 | $ | 0 | $ | 0 | ||||||||||||
| Less: Wellfield Development Costs | $ | 233 | $ | 233 | $ | 233 | $ | 233 | $ | 233 | $ | 233 | ||||||||||||
| Net Before-Tax Cash Flow | $ | -7,363 | $ | -7,226 | $ | -9,282 | $ | -8,129 | $ | -6,724 | $ | -4,277 | ||||||||||||
Notes:
| 1) | Analysis illustrates an annual cash flow forecast using mineral resources and an annual production schedule for the LOM. |
| 2) | It is estimated that 80% of mineral resources are recoverable. |
| 3) | Average sales price over LOM is $86.34. |
| 4) | The project is subject to a cumulative 5.8% surface and mineral royalty. |
| 5) | Uranium production is subject to state combined severance and conservation tax of 4.74%. |
| 6) | Property tax is discussed in Section 19. |
| 83 | REPORT DATE: JANUARY 6, 2025 |
Table 19.2: Economic Analysis Forecast by Year with Inclusion of Federal Income Tax
| Total or | $ per | 2024 | 2025 | 2026 | 2027 | 2028 | 2029 | 2030 | 2031 | 2032 | 2033 | |||||||||||||||||||||||||||||||||||||||
| Cash Flow Line Items | Units | Average | Pound | Year -2 | Year -1 | Year 1 | Year 2 | Year 3 | Year 4 | Year 5 | Year 6 | Year 7 | Year 8 | |||||||||||||||||||||||||||||||||||||
| Uranium Production as U3O81,2 | Lbs 000s | 14,116 | - | 0 | 0 | 0 | 0 | 412 | 909 | 852 | 966 | 861 | 965 | |||||||||||||||||||||||||||||||||||||
| Uranium Price for U3O83 | US$/lb | $ | 86.34 | - | $ | 82.00 | $ | 84.25 | $ | 84.25 | $ | 83.75 | $ | 83.25 | $ | 82.00 | $ | 83.50 | $ | 85.00 | $ | 85.75 | $ | 86.75 | ||||||||||||||||||||||||||
| Uranium Gross Revenue | US$000s | $ | 1,218,816 | - | $ | 0 | $ | 0 | $ | 0 | $ | 0 | $ | 34,284 | $ | 74,500 | $ | 71,178 | $ | 82,149 | $ | 73,835 | $ | 83,732 | ||||||||||||||||||||||||||
| Less: Surface & Mineral Royalties4 | US$000s | $ | 70,935 | $ | 5.03 | $ | 0 | $ | 0 | $ | 0 | $ | 0 | $ | 1,995 | $ | 4,336 | $ | 4,143 | $ | 4,781 | $ | 4,297 | $ | 4,873 | |||||||||||||||||||||||||
| Taxable Revenue | US$000s | $ | 1,147,881 | - | $ | 0 | $ | 0 | $ | 0 | $ | 0 | $ | 32,289 | $ | 70,164 | $ | 67,035 | $ | 77,368 | $ | 69,538 | $ | 78,859 | ||||||||||||||||||||||||||
| Less: Severance & Conservation Tax5 | US$000s | $ | 54,410 | $ | 3.85 | $ | 0 | $ | 0 | $ | 0 | $ | 0 | $ | 1,530 | $ | 3,326 | $ | 3,177 | $ | 3,667 | $ | 3,296 | $ | 3,738 | |||||||||||||||||||||||||
| Less: Property Tax6 | US$000s | $ | 16,233 | $ | 1.15 | $ | 0 | $ | 0 | $ | 0 | $ | 0 | $ | 0 | $ | 0 | $ | 95 | $ | 191 | $ | 286 | $ | 1,439 | |||||||||||||||||||||||||
| Net Gross Sales | US$000s | $ | 1,077,239 | - | $ | 0 | $ | 0 | $ | 0 | $ | 0 | $ | 30,758 | $ | 66,838 | $ | 63,762 | $ | 73,509 | $ | 65,955 | $ | 73,682 | ||||||||||||||||||||||||||
| Less: Plant & Wellfield Operating Costs | US$000s | $ | 276,856 | $ | 19.61 | $ | 0 | $ | 540 | $ | 671 | $ | 1,798 | $ | 8,117 | $ | 14,729 | $ | 15,507 | $ | 15,507 | $ | 15,507 | $ | 15,507 | |||||||||||||||||||||||||
| Less: Product Transaction Costs | US$000s | $ | 4,636 | $ | 0.33 | $ | 0 | $ | 0 | $ | 0 | $ | 0 | $ | 135 | $ | 298 | $ | 280 | $ | 317 | $ | 283 | $ | 317 | |||||||||||||||||||||||||
| Less: Administrative Support Costs | US$000s | $ | 23,632 | $ | 1.67 | $ | 0 | $ | 0 | $ | 1,274 | $ | 1,559 | $ | 1,240 | $ | 1,325 | $ | 1,332 | $ | 1,434 | $ | 1,147 | $ | 1,045 | |||||||||||||||||||||||||
| Less: D&D and Restoration Costs | US$000s | $ | 30,955 | $ | 2.19 | $ | 0 | $ | 0 | $ | 0 | $ | 0 | $ | 0 | $ | 0 | $ | 0 | $ | 0 | $ | 355 | $ | 666 | |||||||||||||||||||||||||
| Net Operating Cash Flow | US$000s | $ | 741,159 | - | $ | 0 | $ | -540 | $ | -1,945 | $ | -3,358 | $ | 21,265 | $ | 50,486 | $ | 46,643 | $ | 56,251 | $ | 48,663 | $ | 56,147 | ||||||||||||||||||||||||||
| Less: Pre-Construction Capital Costs | US$000s | $ | 2,200 | $ | 0.16 | $ | 0 | $ | 400 | $ | 900 | $ | 900 | $ | 0 | $ | 0 | $ | 0 | $ | 0 | $ | 0 | $ | 0 | |||||||||||||||||||||||||
| Less: Depreciated Permanent Buildings | US$000s | $ | 45,038 | $ | 3.19 | $ | 0 | $ | 0 | $ | 0 | $ | 0 | $ | 1,408 | $ | 1,818 | $ | 1,818 | $ | 1,818 | $ | 1,818 | $ | 1,818 | |||||||||||||||||||||||||
| Less: Depreciated Plant Development Costs | US$000s | $ | 38,990 | $ | 2.76 | $ | 0 | $ | 0 | $ | 0 | $ | 0 | $ | 3,244 | $ | 7,888 | $ | 7,959 | $ | 5,684 | $ | 4,062 | $ | 3,480 | |||||||||||||||||||||||||
| Less: Depreciated Wellfield Development Costs | US$000s | $ | 178,050 | $ | 12.61 | $ | 0 | $ | 0 | $ | 0 | $ | 0 | $ | 0 | $ | 5,132 | $ | 8,795 | $ | 6,281 | $ | 7,095 | $ | 8,531 | |||||||||||||||||||||||||
| Less: Net Operating Losses | US$000s | $ | 20,499 | $ | 1.45 | $ | 0 | $ | 0 | $ | 0 | $ | 0 | $ | 16,613 | $ | 3,886 | $ | 0 | $ | 0 | $ | 0 | $ | 0 | |||||||||||||||||||||||||
| Taxable Income | US$000s | $ | 456,383 | - | $ | 0 | $ | -940 | $ | -2,845 | $ | -4,258 | $ | 0 | $ | 31,763 | $ | 28,071 | $ | 42,468 | $ | 35,689 | $ | 42,318 | ||||||||||||||||||||||||||
| Less: Federal Tax7 | US$000s | $ | 113,444 | $ | 8.04 | $ | 0 | $ | 0 | $ | 0 | $ | 0 | $ | 0 | $ | 6,670 | $ | 5,895 | $ | 8,918 | $ | 7,495 | $ | 8,887 | |||||||||||||||||||||||||
| Net Income | US$000s | $ | 342,939 | - | $ | 0 | $ | -940 | $ | -2,845 | $ | -4,258 | $ | 0 | $ | 25,092 | $ | 22,176 | $ | 33,550 | $ | 28,194 | $ | 33,431 | ||||||||||||||||||||||||||
| Plus: Non-Cash Deductions | US$000s | $ | 284,777 | $ | 20.17 | $ | 0 | $ | 400 | $ | 900 | $ | 900 | $ | 21,265 | $ | 18,723 | $ | 18,572 | $ | 13,783 | $ | 12,974 | $ | 13,829 | |||||||||||||||||||||||||
| Less: Pre-Construction Capital Costs | US$000s | $ | 2,200 | $ | 0.16 | $ | 0 | $ | 400 | $ | 900 | $ | 900 | $ | 0 | $ | 0 | $ | 0 | $ | 0 | $ | 0 | $ | 0 | |||||||||||||||||||||||||
| Less: Plant Development Costs | US$000s | $ | 84,028 | $ | 5.95 | $ | 0 | $ | 0 | $ | 0 | $ | 43,421 | $ | 27,540 | $ | 13,066 | $ | 0 | $ | 0 | $ | 0 | $ | 0 | |||||||||||||||||||||||||
| Less: Wellfield Development Costs | US$000s | $ | 178,050 | $ | 12.61 | $ | 0 | $ | 0 | $ | 0 | $ | 2,105 | $ | 7,222 | $ | 11,697 | $ | 10,059 | $ | 11,122 | $ | 10,608 | $ | 11,972 | |||||||||||||||||||||||||
| After Tax Cash Flow | US$000s | $ | 363,438 | - | $ | 0 | $ | -940 | $ | -2,845 | $ | -49,784 | $ | -13,497 | $ | 19,052 | $ | 30,690 | $ | 36,210 | $ | 30,560 | $ | 35,288 | ||||||||||||||||||||||||||
| Total cost per pound: | $ | 60.60 | ||||||||||||||||||||||||||||||||||||||||||||||||
| Discount Rate | 8 | % | ||||||||||||||||||||||||||||||||||||||||||||||||
| NPV | $ | 133,590 | ||||||||||||||||||||||||||||||||||||||||||||||||
| IRR | 33 | % | ||||||||||||||||||||||||||||||||||||||||||||||||
| 84 | REPORT DATE: JANUARY 6, 2025 |
| 2034 | 2035 | 2036 | 2037 | 2038 | 2039 | 2040 | 2041 | 2042 | 2043 | 2044 | 2045 | 2046 | ||||||||||||||||||||||||||||||||||||||||
| Cash Flow Line Items | Year 9 | Year 10 | Year 11 | Year 12 | Year 13 | Year 14 | Year 15 | Year 16 | Year 17 | Year 18 | Year 19 | Year 20 | Year 21 | |||||||||||||||||||||||||||||||||||||||
| Uranium Production as U3O81,2 | 798 | 961 | 864 | 854 | 756 | 857 | 761 | 857 | 760 | 716 | 511 | 395 | 60 | |||||||||||||||||||||||||||||||||||||||
| Uranium Price for U3O83 | $ | 88.00 | $ | 88.00 | $ | 88.25 | $ | 89.00 | $ | 89.00 | $ | 88.00 | $ | 86.25 | $ | 86.00 | $ | 86.00 | $ | 86.00 | $ | 86.00 | $ | 86.00 | $ | 86.50 | ||||||||||||||||||||||||||
| Uranium Gross Revenue | $ | 70,193 | $ | 84,564 | $ | 76,229 | $ | 75,992 | $ | 67,282 | $ | 75,425 | $ | 65,611 | $ | 73,689 | $ | 65,402 | $ | 61,558 | $ | 43,970 | $ | 34,009 | $ | 5,215 | ||||||||||||||||||||||||||
| Less: Surface & Mineral Royalties4 | $ | 4,085 | $ | 4,922 | $ | 4,437 | $ | 4,423 | $ | 3,916 | $ | 4,390 | $ | 3,819 | $ | 4,289 | $ | 3,806 | $ | 3,583 | $ | 2,559 | $ | 1,979 | $ | 304 | ||||||||||||||||||||||||||
| Taxable Revenue | $ | 66,108 | $ | 79,642 | $ | 71,793 | $ | 71,569 | $ | 63,366 | $ | 71,035 | $ | 61,792 | $ | 69,400 | $ | 61,596 | $ | 57,975 | $ | 41,411 | $ | 32,030 | $ | 4,911 | ||||||||||||||||||||||||||
| Less: Severance & Conservation Tax5 | $ | 3,134 | $ | 3,775 | $ | 3,403 | $ | 3,392 | $ | 3,004 | $ | 3,367 | $ | 2,929 | $ | 3,290 | $ | 2,920 | $ | 2,748 | $ | 1,963 | $ | 1,518 | $ | 233 | ||||||||||||||||||||||||||
| Less: Property Tax6 | $ | 1,534 | $ | 1,057 | $ | 1,057 | $ | 1,057 | $ | 1,057 | $ | 1,057 | $ | 1,057 | $ | 1,057 | $ | 1,057 | $ | 1,057 | $ | 1,057 | $ | 1,057 | $ | 1,057 | ||||||||||||||||||||||||||
| Net Gross Sales | $ | 61,440 | $ | 74,810 | $ | 67,333 | $ | 67,120 | $ | 59,306 | $ | 66,611 | $ | 57,806 | $ | 65,054 | $ | 57,619 | $ | 54,170 | $ | 38,391 | $ | 29,454 | $ | 3,621 | ||||||||||||||||||||||||||
| Less: Plant & Wellfield Operating Costs | $ | 15,507 | $ | 15,507 | $ | 15,507 | $ | 15,507 | $ | 15,507 | $ | 15,507 | $ | 15,507 | $ | 15,041 | $ | 9,076 | $ | 8,610 | $ | 6,816 | $ | 5,852 | $ | 5,619 | ||||||||||||||||||||||||||
| Less: Product Transaction Costs | $ | 262 | $ | 316 | $ | 284 | $ | 280 | $ | 248 | $ | 281 | $ | 250 | $ | 281 | $ | 250 | $ | 235 | $ | 168 | $ | 130 | $ | 20 | ||||||||||||||||||||||||||
| Less: Administrative Support Costs | $ | 1,044 | $ | 938 | $ | 931 | $ | 888 | $ | 954 | $ | 829 | $ | 863 | $ | 889 | $ | 894 | $ | 782 | $ | 553 | $ | 497 | $ | 513 | ||||||||||||||||||||||||||
| Less: D&D and Restoration Costs | $ | 1,144 | $ | 1,736 | $ | 1,511 | $ | 1,728 | $ | 1,583 | $ | 1,895 | $ | 1,629 | $ | 1,809 | $ | 1,565 | $ | 1,481 | $ | 1,428 | $ | 1,485 | $ | 1,444 | ||||||||||||||||||||||||||
| Net Operating Cash Flow | $ | 43,483 | $ | 56,314 | $ | 49,101 | $ | 48,716 | $ | 41,014 | $ | 48,099 | $ | 39,558 | $ | 47,032 | $ | 45,834 | $ | 43,061 | $ | 29,426 | $ | 21,490 | $ | -3,974 | ||||||||||||||||||||||||||
| Less: Pre-Construction Capital Costs | $ | 0 | $ | 0 | $ | 0 | $ | 0 | $ | 0 | $ | 0 | $ | 0 | $ | 0 | $ | 0 | $ | 0 | $ | 0 | $ | 0 | $ | 0 | ||||||||||||||||||||||||||
| Less: Depreciated Permanent Buildings | $ | 1,818 | $ | 1,818 | $ | 1,818 | $ | 1,818 | $ | 1,818 | $ | 1,818 | $ | 1,818 | $ | 1,818 | $ | 1,818 | $ | 1,818 | $ | 1,818 | $ | 1,818 | $ | 1,818 | ||||||||||||||||||||||||||
| Less: Depreciated Plant Development Costs | $ | 3,480 | $ | 2,467 | $ | 726 | $ | 0 | $ | 0 | $ | 0 | $ | 0 | $ | 0 | $ | 0 | $ | 0 | $ | 0 | $ | 0 | $ | 0 | ||||||||||||||||||||||||||
| Less: Depreciated Wellfield Development Costs | $ | 10,523 | $ | 12,575 | $ | 13,027 | $ | 11,879 | $ | 9,105 | $ | 6,780 | $ | 8,477 | $ | 13,978 | $ | 13,812 | $ | 9,097 | $ | 7,596 | $ | 7,888 | $ | 6,995 | ||||||||||||||||||||||||||
| Less: Net Operating Losses | $ | 0 | $ | 0 | $ | 0 | $ | 0 | $ | 0 | $ | 0 | $ | 0 | $ | 0 | $ | 0 | $ | 0 | $ | 0 | $ | 0 | $ | 0 | ||||||||||||||||||||||||||
| Taxable Income | $ | 27,663 | $ | 39,454 | $ | 33,530 | $ | 35,018 | $ | 30,091 | $ | 39,501 | $ | 29,263 | $ | 31,236 | $ | 30,204 | $ | 32,145 | $ | 20,011 | $ | 11,783 | $ | -12,788 | ||||||||||||||||||||||||||
| Less: Federal Tax7 | $ | 5,809 | $ | 8,285 | $ | 7,041 | $ | 7,354 | $ | 6,319 | $ | 8,295 | $ | 6,145 | $ | 6,560 | $ | 6,343 | $ | 6,751 | $ | 4,202 | $ | 2,474 | $ | 0 | ||||||||||||||||||||||||||
| Net Income | $ | 21,853 | $ | 31,169 | $ | 26,488 | $ | 27,665 | $ | 23,772 | $ | 31,206 | $ | 23,117 | $ | 24,677 | $ | 23,862 | $ | 25,395 | $ | 15,809 | $ | 9,309 | $ | -12,788 | ||||||||||||||||||||||||||
| Plus: Non-Cash Deductions | $ | 15,821 | $ | 16,860 | $ | 15,571 | $ | 13,697 | $ | 10,923 | $ | 8,598 | $ | 10,295 | $ | 15,796 | $ | 15,629 | $ | 10,915 | $ | 9,414 | $ | 9,706 | $ | 8,813 | ||||||||||||||||||||||||||
| Less: Pre-Construction Capital Costs | $ | 0 | $ | 0 | $ | 0 | $ | 0 | $ | 0 | $ | 0 | $ | 0 | $ | 0 | $ | 0 | $ | 0 | $ | 0 | $ | 0 | $ | 0 | ||||||||||||||||||||||||||
| Less: Plant Development Costs | $ | 0 | $ | 0 | $ | 0 | $ | 0 | $ | 0 | $ | 0 | $ | 0 | $ | 0 | $ | 0 | $ | 0 | $ | 0 | $ | 0 | $ | 0 | ||||||||||||||||||||||||||
| Less: Wellfield Development Costs | $ | 10,732 | $ | 12,951 | $ | 11,186 | $ | 10,091 | $ | 9,518 | $ | 10,132 | $ | 10,315 | $ | 9,070 | $ | 7,641 | $ | 7,216 | $ | 6,765 | $ | 5,278 | $ | 970 | ||||||||||||||||||||||||||
| After Tax Cash Flow | $ | 26,942 | $ | 35,077 | $ | 30,873 | $ | 31,270 | $ | 25,177 | $ | 29,671 | $ | 23,098 | $ | 31,402 | $ | 31,850 | $ | 29,094 | $ | 18,459 | $ | 13,737 | $ | -4,945 | ||||||||||||||||||||||||||
| 85 | REPORT DATE: JANUARY 6, 2025 |
| 2047 | 2048 | 2049 | 2050 | 2051 | 2052 | |||||||||||||||||||
| Cash Flow Line Items | Year 22 | Year 23 | Year 24 | Year 25 | Year 26 | Year 27 | ||||||||||||||||||
| Uranium Production as U3O81,2 | 0 | 0 | 0 | 0 | 0 | 0 | ||||||||||||||||||
| Uranium Price for U3O83 | $ | 87.00 | $ | 87.00 | $ | 87.00 | $ | 87.00 | $ | 87.00 | $ | 87.00 | ||||||||||||
| Uranium Gross Revenue | $ | 0 | $ | 0 | $ | 0 | $ | 0 | $ | 0 | $ | 0 | ||||||||||||
| Less: Surface & Mineral Royalties4 | $ | 0 | $ | 0 | $ | 0 | $ | 0 | $ | 0 | $ | 0 | ||||||||||||
| Taxable Revenue | $ | 0 | $ | 0 | $ | 0 | $ | 0 | $ | 0 | $ | 0 | ||||||||||||
| Less: Severance & Conservation Tax5 | $ | 0 | $ | 0 | $ | 0 | $ | 0 | $ | 0 | $ | 0 | ||||||||||||
| Less: Property Tax6 | $ | 0 | $ | 0 | $ | 0 | $ | 0 | $ | 0 | $ | 0 | ||||||||||||
| Net Gross Sales | $ | 0 | $ | 0 | $ | 0 | $ | 0 | $ | 0 | $ | 0 | ||||||||||||
| Less: Plant & Wellfield Operating Costs | $ | 5,231 | $ | 5,231 | $ | 5,231 | $ | 5,231 | $ | 5,231 | $ | 3,256 | ||||||||||||
| Less: Product Transaction Costs | $ | 0 | $ | 0 | $ | 0 | $ | 0 | $ | 0 | $ | 0 | ||||||||||||
| Less: Administrative Support Costs | $ | 507 | $ | 502 | $ | 554 | $ | -270 | $ | 704 | $ | 704 | ||||||||||||
| Less: D&D and Restoration Costs | $ | 1,392 | $ | 1,261 | $ | 3,264 | $ | 2,936 | $ | 557 | $ | 85 | ||||||||||||
| Net Operating Cash Flow | $ | -7,130 | $ | -6,993 | $ | -9,049 | $ | -7,896 | $ | -6,491 | $ | -4,045 | ||||||||||||
| Less: Pre-Construction Capital Costs | $ | 0 | $ | 0 | $ | 0 | $ | 0 | $ | 0 | $ | 0 | ||||||||||||
| Less: Depreciated Permanent Buildings | $ | 1,818 | $ | 1,818 | $ | 1,818 | $ | 1,818 | $ | 1,818 | $ | 1,818 | ||||||||||||
| Less: Depreciated Plant Development Costs | $ | 0 | $ | 0 | $ | 0 | $ | 0 | $ | 0 | $ | 0 | ||||||||||||
| Less: Depreciated Wellfield Development Costs | $ | 5,238 | $ | 2,400 | $ | 1,138 | $ | 1,139 | $ | 569 | $ | 0 | ||||||||||||
| Less: Net Operating Losses | $ | 0 | $ | 0 | $ | 0 | $ | 0 | $ | 0 | $ | 0 | ||||||||||||
| Taxable Income | $ | -14,186 | $ | -11,211 | $ | -12,005 | $ | -10,853 | $ | -8,878 | $ | -5,863 | ||||||||||||
| Less: Federal Tax7 | $ | 0 | $ | 0 | $ | 0 | $ | 0 | $ | 0 | $ | 0 | ||||||||||||
| Net Income | $ | -14,186 | $ | -11,211 | $ | -12,005 | $ | -10,853 | $ | -8,878 | $ | -5,863 | ||||||||||||
| Plus: Non-Cash Deductions | $ | 7,056 | $ | 4,218 | $ | 2,956 | $ | 2,957 | $ | 2,387 | $ | 1,818 | ||||||||||||
| Less: Pre-Construction Capital Costs | $ | 0 | $ | 0 | $ | 0 | $ | 0 | $ | 0 | $ | 0 | ||||||||||||
| Less: Plant Development Costs | $ | 0 | $ | 0 | $ | 0 | $ | 0 | $ | 0 | $ | 0 | ||||||||||||
| Less: Wellfield Development Costs | $ | 233 | $ | 233 | $ | 233 | $ | 233 | $ | 233 | $ | 233 | ||||||||||||
| After Tax Cash Flow | $ | -7,363 | $ | -7,226 | $ | -9,282 | $ | -8,129 | $ | -6,724 | $ | -4,277 | ||||||||||||
Notes:
| 1) | Analysis illustrates an annual cash flow forecast using mineral resources and an annual production schedule for the LOM. |
| 2) | It is estimated that 80% of mineral resources are recoverable. |
| 3) | Average sales price over LOM is $86.34. |
| 4) | The project is subject to a cumulative 5.8% surface and mineral royalty. |
| 5) | Uranium production is subject to state combined severance and conservation tax of 4.74%. |
| 6) | Property tax is discussed in Section 19. |
| 7) | Federal tax is estimated at US corporate tax rate of 21%. |
| 86 | REPORT DATE: JANUARY 6, 2025 |
19.2 Taxes, Royalties and Other Interests
19.2.1 Federal Income Tax
Total Federal income tax for LOM is estimated at $113.4 M for a cost per pound U3O8 of $8.04. Federal income tax estimates do account for non-cash deductions including amortization, depreciation and historic and forecasted non-operating losses.
19.2.2 State Income Tax
The state of South Dakota does not impose a corporate income tax.
19.2.3 Production Taxes
Production taxes in South Dakota include property tax, sales and use tax, and severance and conservation tax. Custer and Fall River Counties do not impose an Ad Valorem tax on minerals.
As shown in Figure 13.2, the project area is divided by Custer County and Fall River County, and each county imposes their own methods of implementing property tax. The Satellite facility will be in the Custer County tax district and the CPP in Fall River County tax district.
Custer County follows a discretionary tax formula to encourage development of certain industrial property within the county boundaries. After construction of the Dewey Facility, a 2.1% property tax will be imposed on the assessed value of the land and its permanent improvements for five years. However, its assessed value shall be defined as 20% of its actual value in the first year, 40% in the second year, 60% in the third year, 80% in the fourth year, and 100% in the fifth year (ref., Custer County, 2005).
Fall River County utilizes a different tax schedule. For the purposes of attracting new business, Fall River taxes solely the value of the surface property for the first five years, then adds a tax of 2.1% on the assessed value of improvements of greater than $30,000 for the remainder of the property ownership (ref., Edgemont Herald Tribune, 2011). Since enCore does not own any surface property, the property tax for the first five years after the construction of the Burdock Facility is 0%.
Purchases of equipment and supplies are subject to sales and use tax. The State imposes a 4.5% tax on retail sales and services. Project economics presented in this report have sales and use tax of 4.5% included in the capital cost estimate.
Severance on uranium production is taxed at 4.5% of gross sales. Additionally, the state of South Dakota requires a conservation tax of 0.24% of gross sales for all energy mineral production.
The total production tax burden for LOM is estimated at $70.6 M for a cost per pound U3O8 of $5.00.
19.2.4 Royalties
Royalties are assessed on gross proceeds. The project is subject to a cumulative 5.8% surface and mineral royalty at an average LOM sales price of $86.34 per lb. U3O8for $70.9 M or $5.03 per pound.
| 87 | REPORT DATE: JANUARY 6, 2025 |
19.3 Sensitivity Analysis
NPV and IRR v. Uranium Price
This analysis is based on a variable commodity price per pound of U3O8 and the cash flow results. The Project is most sensitive to changes in the price of uranium. A $5.0 change in the price of uranium can have an impact to the NPV of more than $29.0 M, and impact to the IRR of approximately 5% at a discount rate of 8%. See Figure 19.1.
Figure 19.1: NPV & IRR v. Uranium Price
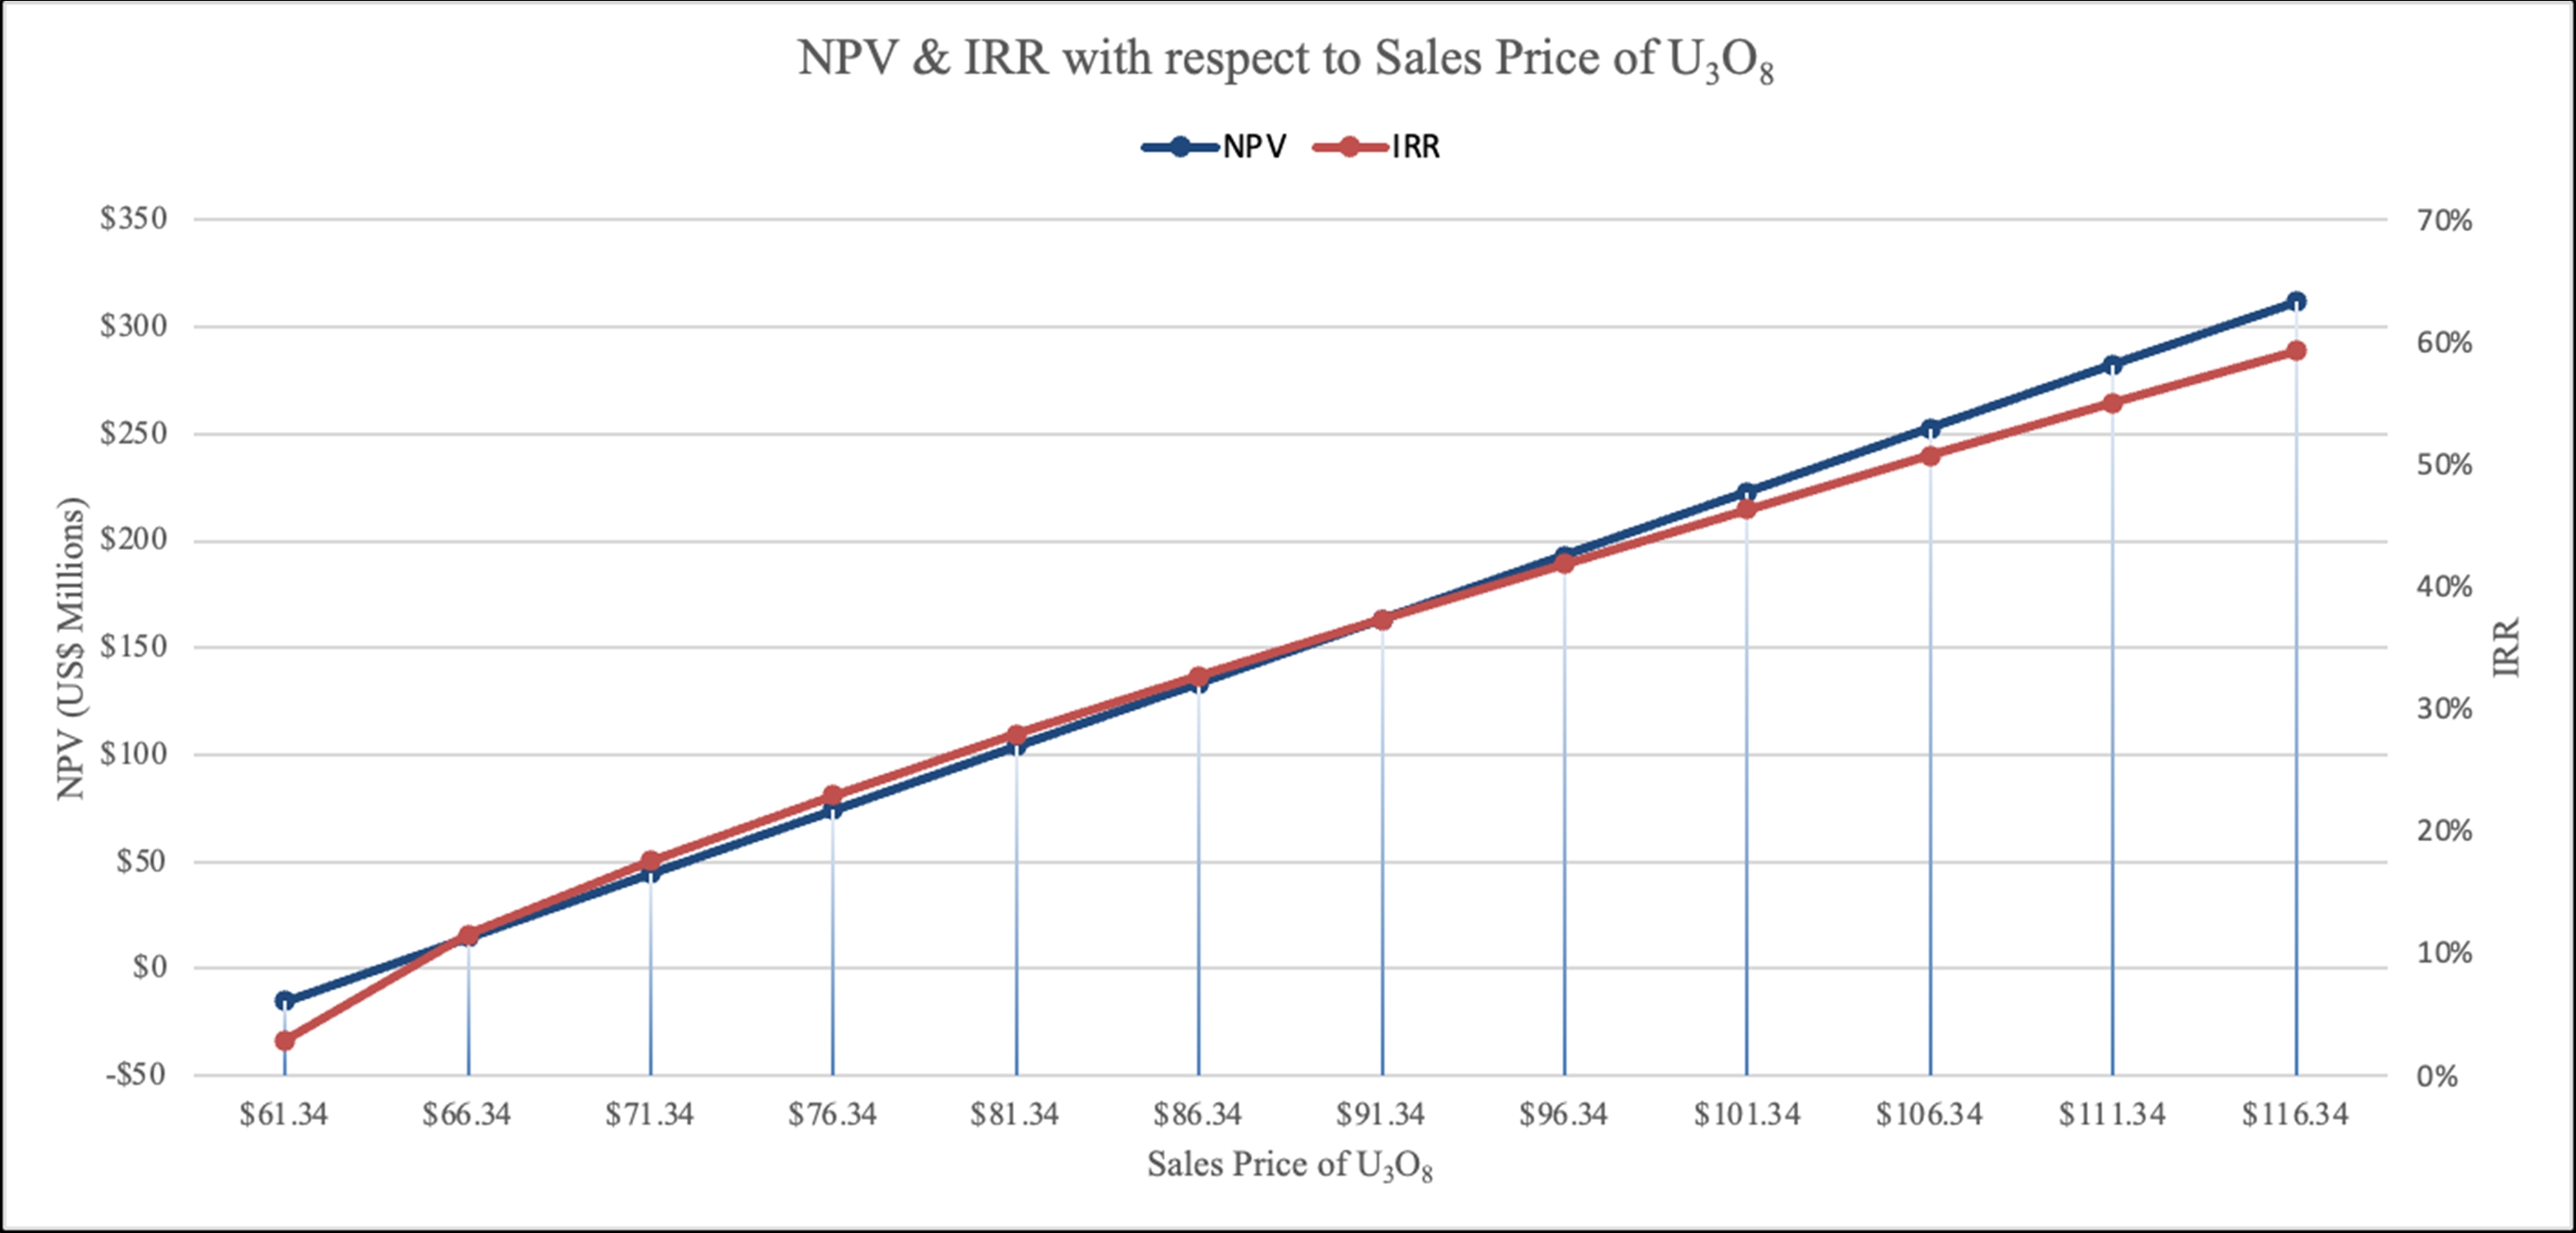
| 88 | REPORT DATE: JANUARY 6, 2025 |
19.3.1 NPV and IRR v. Variable Capital and Operating Cost
The Project NPV and IRR are also sensitive to changes in either capital or operating costs as shown on Figures 19.2 and 19.3 (NPV and IRR v. Variable Capital and Operating Cost). A 5% change in the operating cost can have an impact to the NPV of approximately $6.5 M and the IRR of approximately 1% based on a discount rate of 8% and a uranium price of $86.34 per pound of U3O8. Using the same discount rate and sales price, a 5% change in the capital cost can have an impact to the NPV of approximately $7.1 million and the IRR of approximately 2.3%.
Figure 19.2: NPV v. Variable Capital and Operating Cost

| 89 | REPORT DATE: JANUARY 6, 2025 |
Figure 19.3: IRR v. Variable Capital and Operating Cost

| 20.0 | ADJACENT PROPERTIES |
There are no operating uranium mines near the Project. Cameco operates the Crow Butte ISR uranium mine near Crawford, Nebraska, approximately 70 miles south and Strata Energy operates the Ross Project in Converse County, Wyoming approximately 90 miles northwest.
| 90 | REPORT DATE: JANUARY 6, 2025 |
21.0 OTHER RELEVANT DATA AND INFORMATION
21.1 Other Relevant Items
The surface pits on the east part of the property are not included in enCore’s future development plans. These pits remain the responsibility of previous operators and existing landowners. Mineralization does exist below these pits, but enCore does intend to pursue development due to potential legacy liability.
Adjacent to the west side of the Project and located along the South Dakota and Wyoming border, enCore owns the Dewey Terrace property. Dewey Terrace is an exploration property in Wyoming. enCore plans to explore the property with expectation of defining a mineral resource and expanding the Project footprint.
Within the Project’s property boundary, there are extensive unexplored mineralized trends. enCore plans to explore these trends increasing the Project’s mineral resources. Exploration efforts are scheduled to commence in 2025.
| 91 | REPORT DATE: JANUARY 6, 2025 |
22.0 INTERPRETATION AND CONCLUSIONS
Based on the technical and economic data, economic analysis and anticipated risks, the Project will be a successfully operable ISR mine.
Based on the quality and quantity of geologic data, stringent adherence to geologic evaluation procedures and thorough geological interpretative work, mineralogical and hydrological testing, deposit modeling and resource estimation methods, production forecasting detail, high degree of design and pre-engineering, quality and substantial quantity of detailed cost inputs, cost estimates, and detailed comprehensive analysis, the QP responsible for this report considers that the current mineral resources estimates are relevant and reliable.
Less Federal Tax, the Projects cash flow is estimated at $476.8 M or $52.56 per pound U3O8. Using an 8% discount rate, the Projects NPV is $179.9 M with an IRR of 38% (Table 19.1). The Projects after tax cash flow is estimated at $363.4 M for a cost per pound U3O8 of $60.60. Using an 8.0% discount rate, the Projects NPV is $133.6 M with an IRR of 33% (Table 19.2).
Estimated capital costs are $264.2 M and includes $2.2 M for pre-construction permitting and licensing, $178.0 M for wellfield development, $84.0 M for the CPP, Satellite and associated infrastructure.
Operating costs are estimated to be $23.81 per pound of U3O8. The basis for operating costs is planned development and production sequence and quantity, in conjunction with past production knowledge.
Commercial operations are forecasted to start Q3 2028, and the estimated project payback is 2032.
22.1 Risk Assessment
As with any pre-development mining property, there are project risks. For Dewey Burdock, those risks have been identified and can be de-risked with proper planning. The following sections discuss these risks.
22.2 Uranium Recovery and Processing
The Project is like other operating facilities because there will have been no wellfield pilot testing completed prior to construction of a full production facility. There is a risk that uranium recovery rate and quantity could be overestimated. Proceeding directly from a preliminary economic assessment to full production is a business decision and risk that enCore is willing to accept based on ISR production history of other similar deposits elsewhere in the U.S.
Uranium recovery is based on site specific laboratory recovery data and experience of enCore personnel and other industry experts, all of which have experience from similar facilities. There can be no assurance that mine recovery will match laboratory results. Grade and recovery are difficult to determine prior to initiation of an ISR project even with pilot test empirical data.
Bench-scale bottle roll and column tests have been performed on core samples from the Project.
| 92 | REPORT DATE: JANUARY 6, 2025 |
A potential risk to meeting the production and thus financial results presented in this PEA will be associated with the success of wellfield operation and the efficiency of recovering uranium from the targeted host sands. A potential risk in the wellfield recovery process depends on whether geochemical conditions that affect solution mining uranium recovery rates from the mineralized zones are comparable or significantly different than previous bench-scale tests and experience at other operations. If they prove to be different, then potential efficiency or financial risks might arise.
The percent recovery results of several bottle roll leach amenability tests Powertech had performed by ELI are presented in Section 10. These indicate an average uranium dissolution of 85%; therefore, a recovery factor of 80% (as determined in earlier bench scale studies and used in this PEA) is potentially achievable given the following considerations:
| ● | The pregnant lixiviant will consist of a mix of multiple well streams designed to have an average head grade of 60 ppm thus allowing for production to continue from individual wells long after the peak grade has been achieved (Figure 13.1). This targeted concentration will result in a higher depletion of the resources within the host sandstones leading to greater total recovery. The wellfield design package includes instrumentation and data collection equipment to optimize wellfield production by monitoring flow rates, injection pressure and formation pressure allowing control of hydraulic factors. |
| ● | As discussed in Section 10 laboratory dissolution results ranged from 71 to 97%, indicating the deposit is amenable to ISR mining methods. ISR PEAs for similar projects have predicted a range of recoverability from 67 to 80%. As indicated by these ranges of dissolution and recovery, it is possible to see lower recovery than estimated in this PEA. |
Capacity of wastewater disposal systems is another process risk. Limited capacity of deep disposal wells can affect the ability to achieve timely groundwater restoration. enCore has included up to four wells in the Class V UIC permit application to EPA. As well, enCore is also permitting land application for liquid waste disposal, which has been permitted for other non-uranium mining operations in South Dakota; however, enCore does not plan to utilize land application.
22.2.1 Permitting and Licensing Delays
The Project is the first uranium ISR facility to submit permit applications in the State of South Dakota. As such, there is inherent risk in a new permitting process, regulatory unfamiliarity with ISR methods, and an untested review period. The amount of time required for regulatory review of all permits associated with the commissioning of an ISR facility is highly variable and directly affects project economics. It is assumed enCore will have all permits necessary to construct in 2027. The timeframe to obtain licenses and permits is expected to be impacted by environmental NGO’s and public contestation of both state and federal permits and licenses. Time for contested cases has been accounted for in the project development schedule.
| 93 | REPORT DATE: JANUARY 6, 2025 |
22.3 Social and/or Political
The Project has drawn attention from environmental NGO’s, tribal governments, and individuals in the public. enCore is managing this risk through the State and Federal permitting processes. Extensive efforts by the regulatory agencies have proceeded to near completion of all major permitting and licensing actions.
The NRC license (SUA 1600) was issued in 2014, challenged and appealed, is now in good standing and in timely renewal. The EPA issued the Class III and Class V Area Underground Injection Control (UIC) permits and Aquifer Exemption in 2020. The Class III and Class V UIC permits, and Aquifer Exemption were challenged by the OST and are under appeal.
The EAB heard oral arguments on the Class III and Class V UIC permits in March 2024. In September, the EAB issued its ruling on the OST appeal finding:
| ● | The EAB 2023 decision denying OST claims and finding that EPA complied with the National Historic Preservation ACT (NHPA) Section 106, |
| ● | Denied OST claims and found that EPA complied with NHPA Section 110, |
| ● | Denied OST claims that EPA failed to comply with the National Environmental Protection Act (NEPA), |
| ● | Reserved judgment on other OST claims until EPA expands the administrative record adding documents, considers those additional materials, responds to related comments, takes further appropriate action in reissuing the permit decisions; and, |
| ● | The EAB remanded the reserved issues to EPA and specified that any appeals challenging the reissued permit decisions will be limited to the issues reserved in the remand and any modifications to the permits made as a result of the remand. |
The EAB decisions regarding EPA compliance with NHPA and NAPA were favorable rulings and consistent with the 2023 D.C. Circuit Court of Appeals rulings where similar appeals were made by the OST against the NRC Source Material License.
Regarding the portion of the ruling remanded back to the EPA Region 8, it is anticipated that this will be an exercise to formally complete the administrative record. Once the administrative record is complete and the permit decision reissued, the EAB will consider any additional materials and respond to related comments. It is also anticipated that the OST will appeal the reissued permit, but the EAB will rule in favor of the EPA and enCore with minimal impact to the overall project schedule. If the EAB does find merit in the appealed reissued permit, there could be an impact to the project schedule.
A ruling on the issuance of the Aquifer Exemption is currently under appeal to the 8th Circuit Court of Appeals and will rule upon once the EAB issues final ruling on the Class III and Class V UIC permits.
In South Dakota, enCore is advancing work on the major state permits needed to operate the Project. The State Engineer had previously recommended approval of the Inyan Kara (#2686-2) and Madison (#2685-2) Water Rights. The next step to advance water rights will be the resumption of the Department of Agriculture and Natural Resources (DANR) Water Management Board hearings. Efforts are also advancing on the DANR Groundwater Discharge Plan and Large-Scale Permit to Mine approvals. The DANR has recommended conditional approval of the Groundwater Discharge Plan and Large-Scale Permit to Mine, pending completion of all federal challenges of the Class III, Class V and Aquifer Exemption.
| 94 | REPORT DATE: JANUARY 6, 2025 |
23.0 RECOMMENDATIONS
It is recommended enCore continue pre-construction works to achieve start of commercial operations in 2028. Pre-construction efforts include:
| ● | Finalize state and federal permitting and licensing work obtaining necessary permits and licenses required to operate Project. This work will consist of pre-operations inspections, regulatory fees, and fees associated with contestations. Pre-construction remaining permitting and licensing work is estimated to cost $2.2 M. |
| ● | Since enCore has conducted no drilling on the Project since acquisition, it is recommended that as part of their 2025 program, confirmation holes are drilled to verify data from missing geophysical logs. It is also recommended that a coring program be conducted to better assess deposit mineralogy, confirm secular equilibrium, measure U/V ratios in leach solutions, and determine the best approach to handling U and V separation. Confirmation drilling and coring are estimated to cost $0.2 M. Conducting a drilling program is not contingent on receipt of major permits and licenses. |
| ● | Commence engineering in Q3 2026, for the Dewey Burdock CPP, office facility, warehouse, maintenance shop, construction shop, satellite and liquid waste disposal facilities. Engineering services are estimated at 8% of plant development costs or $6.7 M. Advancing engineering is not contingent on receipt of permits and licenses. |
| 95 | REPORT DATE: JANUARY 6, 2025 |
24.0 REFERENCES
Azarga, 2020. NI 43-101 Technical Report Preliminary Economic Assessment Dewey-Burdock Uranium ISR Project South Dakota, USA, January 17, 2020.
CIM Council, 2003. Estimation of Mineral Resources and Mineral Reserves, Best Practice Guidelines, adopted November 23, 2003.
Custer County, 2005. Resolution #2005-15: A Resolution to Adopt an Industrial Based Discretionary Formula, signed Joe McFarland, Chairman, July 14, 2005.
Edgemont Herald Tribune, 2011. Public Notices, p. 9, “2011-022 Fall River County Minutes,” February 2, 2011.
Finch, W.I., 1996. Uranium Provinces of North America - Their Definition, Distribution and Models. U.S. Geological Survey Bulletin 2141, 24 p.
Neuman, S.P. and Witherspoon, P.A., 1972. Field Determination of the Hydraulic Properties of Leaky Multiple Aquifer Systems, Water Resources Research, Vol. 8, No. 5, pp. 1284-1298, October 1972.
____2013a. App. 2.7-K, Hydrogeologic Investigations at Proposed Uranium Mine near Dewey, South Dakota, for Tennessee Valley Authority by J. Mark Boggs, WR28-2-520-128, 54 p., October 1983.
____2013b. App. 2.7-K, Analysis of Aquifer Tests Conducted at the Proposed Burdock Uranium Mine Site, Burdock, South Dakota, for Tennessee Valley Authority by J.M. Boggs and A.M. Jenkins, WR28-8-520-109, 71 p., May 1980.
____2013c. App. 2.7-B, Powertech (USA) Inc., Dewey Burdock Project, 2008 Pumping Tests: Results Analysis. Knight Piésold Consulting, November 2009.
____2013d. App. 6.1-A, Numerical Modeling of Hydrogeologic Conditions, Dewey Burdock Project, South Dakota. Petrotek Engineering Corporation, February 2012.
____2013e. App. 2.7-G, Groundwater Quality Summary Tables, December 2013.
____2013f. App. 3.1-A, Powertech (USA) Inc., Dewey Burdock Project, Pond Design Report. Knight Piésold Consulting, August 2009.
Powertech, 2009. Application for NRC Uranium Recovery License Proposed Action Fall River and Custer Counties South Dakota Environmental Report. February 2009.
Smith, Robert B., 1991. An Evaluation of the Dewey and Burdock Project’s Uranium Resources, Edgemont District, South Dakota, consultant report, 40 p.
RESPEC 2008 a, b. Characterization of the Groundwater Quality at the Dewey Burdock Uranium Project, Fall River and Custer Counties, South Dakota. Report prepared for Powertech (USA) Inc. December 2008.
Rough Stock, 2018. NI 43-101 Technical Report, Resource Estimate, Dewey Burdock Uranium ISR Project, for Azarga Uranium, November 12, 2018
| 96 | REPORT DATE: JANUARY 6, 2025 |
Smith, Robert B., 1993. Potential Uranium Resource of the Dewey Burdock Project, consultant report, 8 p.
Smith, Robert B., 1994. An Evaluation of the Northeast Portion of the Burdock Uranium Resource, consultant report, 10 p.
TradeTech, 2023. Uranium Market Study Issue 4.
U.S. Energy Information Administration, 2023. Domestic Uranium Production Report (2009-23), Table 9.
U.S. Nuclear Regulatory Commission, 2009. Generic Environmental Impact Statement for In-Situ Leach Uranium Milling Facilities, NUREG-1910, Volumes 1 and 2, May 2009.
U.S. Nuclear Regulatory Commission, 2014. Environmental Impact Statement for the Dewey Burdock Project in Custer and Fall River Counties, South Dakota; Supplement to the Generic Environmental Impact Statement for In-Situ Leach Uranium Milling Facilities; Final Report, NUREG-1910, Supplement 4, Volume 2, January 2014.
WWC Engineering, 2013. Dewey Burdock Project Socioeconomic Assessment prepared for Powertech (USA) Inc., August 2013.
| 97 | REPORT DATE: JANUARY 6, 2025 |
25.0 RELIANCE ON INFORMATION PROVIDED BY THE REGISTRANT
The QP has relied on other experts and previous works for contribution to certain sections of the report (Table 25.0: Other Experts).
Table 25.0: Other Experts
| Other Experts | Title | Number | Section | ||||
| Len Eakin, enCore | Senior Geologist | 14.0 | MINERAL RESOURCE ESTIMATES | ||||
| Jon Winter, enCore | Permitting and Regulatory Affairs Manager, Wyoming and South Dakota Operations | 20.0 | ENVIRONMENTAL STUDIES, PERMITTING AND SOCIAL OR COMMUNITY IMPACT | ||||
| Larry McGonagle, SOLA | Consultant | 13.0 | MINERAL PROCESSING AND METALLURGICAL TESTING | ||||
| 21.0 | CAPITAL AND OPERATING COSTS |
The QP also relied upon, extracted in-part with minor edits to sections noted in Table 25.1: Referenced Sections, from Azarga’s Technical Report “NI 43-101 Technical Report Resource Estimate, Dewey Burdock Uranium ISR Project, South Dakota, USA, with an effective date of December 3, 2019 (ref., Azarga, 2019). Changes to formats, sub-titles and organization have been made to suit the format of this report.
Table 25.1: Referenced Sections
| Number | Section | |
| 4.0 | ACCCESSIBILIY, CLIMATE, LOCAL RESOURCES, INFRASTRUCTURE AND PHYSIOGRAPHY | |
| 5.0 | HISTORY | |
| 6.0 | GEOLOGICAL SETTING AND MINERALIZATION AND DEPOSIT | |
| 7.0 | EXPLORATION | |
| 8.0 | SAMPLE PREPARATION, ANALYSIS AND SECURITY | |
| 9.0 | DATA VERIFICATION | |
| 10.0 | MINERAL PROCESSING AND METALLURGICAL TESTING |
| 98 | REPORT DATE: JANUARY 6, 2025 |
26.0 DATE, SIGNATURE AND CERTIFICATION
This S-K 1300 Technical Report Summary titled “Preliminary Economic Assessment, Dewey Burdock Uranium ISR Project, South Dakota, USA” dated January 6, 2025, with an effective date of October 8, 2024, was prepared and signed by SOLA Project Services, LLC. SOLA is an independent, third-party consulting company and certify that by education, professional registration, and relevant work experience, SOLA’s professionals fulfill the requirements to be a “qualified person” for the purposes of S-K 1300 reporting.
(“Signed and Sealed”) SOLA Project Services, LLC.
January 6, 2025
Stuart Bryan Soliz | Principal
Wyoming Board of Professional Geologists License Number PG-3775
Society for Mining, Metallurgy, & Exploration Registered Member Number 4068645

4912 Stoneridge Way
Casper, Wyoming 82601
United States of America
| 99 | REPORT DATE: JANUARY 6, 2025 |