ZODIAC EXPLORATION INC.
MANAGEMENT’S DISCUSSION & ANALYSIS
The following is Management’s Discussion and Analysis (“MD&A”) of the performance, financial condition and future prospects of Zodiac Exploration Inc. (“Zodiac” or “the Company”). This document should be read in conjunction with the audited annual consolidated financial statements of the Company for the year ended September 30, 2011 and September 30, 2010, and notes thereto. With its head office based in Calgary, Alberta, Canada, Zodiac is primarily engaged in the exploration for, and development of, oil and gas interests in California, USA. Common shares of the Company are listed on the TSX-Venture under the symbol “ZEX”.
The financial information in this MD&A is derived from the Company’s audited consolidated financial statements. All amounts are expressed in Canadian $000’s unless otherwise indicated and prepared in accordance with US generally accepted accounting principles (“US GAAP”).
Additional information about Zodiac and its business activities is available on SEDAR at http://www.sedar.com and at http://www.zodiacexploration.ca
Forward Looking Statements
Certain information contained herein may constitute forward-looking statements under applicable securities laws. Forward-looking statements look into the future and provide an opinion as to the effect of certain events and trends on the business. Forward-looking statements are based on the estimates and opinions of the Company’s management at the time the statements were made. Readers are cautioned not to place undue reliance on these statements as the Company’s actual results, performance or achievements may differ materially from any future results, performance or achievements expressed or implied by such forward-looking statements if known or unknown risks, uncertainties or other factors affect the Company’s business, or if the Company’s estimates or assumptions prove inaccurate. Therefore, the Company cannot provide any assurance that forward-looking statements will materialize.
The Company assumes no obligation to update forward-looking statements should circumstances or management’s estimates change.
The material assumptions that were applied in making the forward-looking statements in this MD&A include: execution of the Company’s existing plans for each of its projects, which may change due to changes in the views of the Company or if new information arises which makes it prudent to change such plans; and execution of the Company’s plans to seek out additional opportunities in the natural resource sector, which are dependent in part on global economic conditions and upon the prices of commodities and natural resources.
Readers are urged to carefully review and consider the various disclosures made by us in this report and in our other reports filed with the Securities and Exchange Commission.
Highlights
During the year ended September 30, 2011, Zodiac:
| - | Listed on the Toronto Stock Exchange - Venture under symbol ZEX. |
| - | Drilled, completed and tested its first exploratory well, the 4-9 well – a vertical well drilled to 14,961 feet in Kings County, California. The following summarizes the 4-9 well results: |
| o | The Upper Kreyenhagen formation tested a rate of 24 Bbls per day of 29° API oil. It was estimated that a rate of 120 bbl per day of oil could be achieved by removing the formation damage and increasing the pressure drawdown. |
| o | The Lower Vaqueros formation produced water at a rate of 57 Bbls per day. The Company continues to investigate the source of the water. |
| o | The Whepley formation produced at a rate of 13 Bbls per day of 33° API oil. It was estimated that a rate of 30 Bbls per day could be achieved by removing the formation damage and increasing the pressure drawdown. |
| - | Spud a second well in Kings County, California – the 1-10 well. The 1-10 vertical pilot hole was drilled to a depth of 16,950 feet, plugged back and a lateral of 2647 feet was placed in the Upper Kreyenhagen at an average depth of 14,550 ft. |
| - | Continued to expand land base to approximately 89,000 net acres. |
| - | Raised approximately $34 million through the exercise of 38.6 million warrants. |
| - | Ended the year with $40.5 million in cash and $37.7 million in working capital. |
Location of Operations
Zodiac’s operations are focused in the San Joaquin Basin – principally Kings County, California.
Summary of Operations
4-9 Well
On December 25, 2010, the Company spud its initial evaluation well – the 4-9 well - in the Jaguar prospect area. The well reached a total depth of 14,950 feet in the Kreyenhagen formation and a 7 inch production liner was set on March 18, 2011.
This is the first deep well in the Kings County area in the past 25 years and it provided the Company with a comprehensive data set over several prospective light oil targets within the Monterey, Allison/Whepley, Vaqueros and Tumey/Kreyenhagen Formations. The drilling operations included the collection of 417 feet of core and an extensive suite of modern well logs over these prospective geological horizons.
Kreyenhagen Formation
The Kreyenhagen formation is one of the primary source rocks in the San Joaquin Basin and these source rocks have been estimated by the United States Geological Service (“USGS”) to have generated over 100 Billion barrels of crude oil.1 USGS PP 1713
The 4-9 well reached total depth after intersecting 650 feet of Kreyenhagen silts and organic source shales. In the area of the wellbore, the Kreyenhagen formation is approximately 800 feet thick and reaches thicknesses exceeding 1,500 feet further south on Zodiac acreage.
Zodiac completed and tested a 30 foot silty interval in the upper part of the Kreyenhagen. The upper Kreyenhagen interval flowed 29° API oil at an average rate of 24 barrels per day (“bbls/day”) over a nine day flow test period. The pressure transient analysis (“PTA”) indicated significant formation damage with a positive skin factor of 13 (“S=+13”). The Inflow Performance Relationship (“IPR”) derived from the well test analysis demonstrated that a rate of 120 bbls per day could be achieved by removing the formation damage (“S=0”) and decreasing the pressure drawdown to 60 % (from 45 %). The extrapolated reservoir pressure from the PTA was 12,900 pound per square inch (“psia”) which equates to a pressure gradient of approximately 0.9 psi per foot. The reservoir permeability calculated from the PTA was 0.85 mD.
The Company believes the formation damage observed in the 4-9 well can be addressed by optimizing completion procedures in future wells. Porosity and permeability values derived from the well log and core analyses indicated effective siltstone porosity ranging between 10% and 13%, with permeability ranging between 0.4 and 3.0 millidarcies.
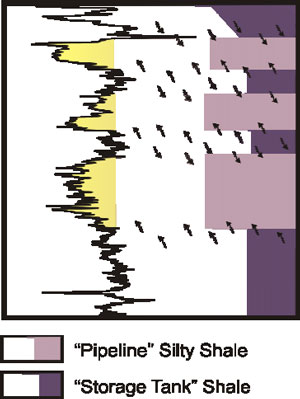
Fig: 1 “Bakken-like” Model
The production testing, the coring and the log analyses have shown that the Kreyenhagen formation has similarities to the Bakken in that organic rich shales are feeding oil into siltier units.
The major difference between the Bakken and the Kreyenhagen interval is the thickness. The Kreyenhagen is approximately 800 to 1,500 feet thick across Zodiac’s land base while the Bakken ranges from 40 to 100 feet.
The 1-10 horizontal well was drilled into this same interval, and it is anticipated that testing will commence prior to end of December 2011.
Lower Vaqueros Formation
The Company performed a completion over a 30 foot interval in the Lower Vaqueros formation. Following this operation, the zone flowed water at an average rate of 57 bbls/day over a 19 day period. The chemistry and the salinities of the water recovered during the flow period do not match regional Vaqueros water properties. The Company believes the water could have originated from interference from the 1-9 offset well which was injected with 5,000 bbls of kill fluid during well control operations.
Given the proximity of the 4-9 wellbore to the 1-9 wellbore and the fractured nature of the rock, there is more than one possible source for the water produced during the production test over the Lower Vaqueros.
This test does not negate the Vaqueros formation as a target. The entire Vaqueros formation is over 650 feet thick, with the first test comprising 30 feet within the lowermost 200 feet of the Vaqueros formation. Oil-bearing sandstones above the tested zone have been identified in core and on well logs in both the 4-9 and 1-10 wells but down-hole equipment limitations did not allow the Company to test these zones in the 4-9 well. Further testing will be required to fully evaluate this formation.
Fig 2: Core and testing zones
Allison/Whepley Formation
A 30 foot interval was completed in the Allison/Whepley formation. This zone flowed 33° API oil at a stabilized an average rate of 13 bbls/day over a 9 day flow period. The well was then shut-in and the pressure transient analysis indicated significant formation damage with a positive skin factor or of 7 (S=+7). A reservoir pressure of 11,100 psia was extrapolated from the PTA and this equates to a gradient of 0.8 psi per foot. The IPR curve derived from the well test analysis demonstrated that a rate of 30 bbls per day could be achieved with the removal of the formation damage (S=0).
The test results achieved in the Allison/Whepley formation were very encouraging to the Company, particularly as the interval completed was mostly shale rather than a siltstone or sandstone sequence inter-bedded in the shale. Over 50 feet of potential siltstone reservoir remains to be adequately tested in future operations. The Company is confident it can reduce the skin factor and by optimizing its completion procedures in future wells
Jaguar Prospect Earning Obligation
The Company has now completed its earning obligation on the Jaguar prospect as required under the Zodiac/Bayswater farm-in agreement effective May 27, 2009.
1-10 Well
The Company’s second well was drilled one mile east of the 4-9 location and was spud on June 16, 2011. The 1-10 well consisted of a vertical pilot hole with a lateral section drilled in the Upper Kreyenhagen zone which tested oil in the 4-9 well.
The vertical pilot hole reached total depth of 16,950 feet, on August 28, 2011, in the Cretaceous Moreno formation. The lower section was successfully logged and plugged back to the Whepley formation. A 2,647 foot horizontal wellbore was then drilled into the Upper Kreyenhagen at an average depth approximately 14,550 feet. This operation was completed in October 2011.
The Upper Kreyenhagen zone was cored in the 1-10 well with a total of 110 feet recovered. Thorough analysis of the logging and coring data gathered to date in the 1-10 and 4-9 wells over this horizon indicates the presence of significant oil stained natural fractures (observed in magnetic resonance images and confirmed visually in core and detailed petrographic analysis), high silica content and high brittleness. The Company believes these recent findings will help in optimizing the upcoming completion results of the 1-10 well.
The Company has now demonstrated that a horizontal wellbore can be drilled successfully at these depths and pressures in the San Joaquin Basin, which had been an uncertainty from the outset. In addition, the horizontal operation is a key first step in proving the potential of the Upper Kreyenhagen formation, which is only one of the several primary plays identified on the Company’s acreage to date.
Detailed geologic mapping indicates that this zone is present on at least 100 net sections of Zodiac acreage. Based on preliminary internal estimates from petrophysical logs and core data, management's best estimate is that the prospective resources for the Upper Kreyenhagen formation amounts to 16 million barrels of petroleum initially-in-place per section. This could comprise a significant resource addition to Zodiac’s portfolio as the Kreyenhagen formation was not included in the resource assessment conducted by Sproule (US) Limited (a summary is available within the September 1, 2010 Management Information Circular on SEDAR). This estimate represents less than 10% of the Kreyenhagen formation, which has a thickness of approximately 800 feet in this location. Several prospective lower zones in the Kreyenhagen have been identified and have not yet been tested. The total thickness of the Kreyenhagen formation ranges from approximately 800 to 1,500 feet throughout Zodiac’s acreage. The Company anticipates that with continued wellbore design refinements, horizontal drilling should have widespread application in the Kreyenhagen and in the development of other plays that comprise Zodiac’s portfolio.
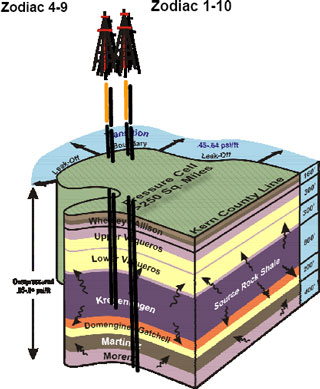
Deeper Potential
The 1-10 well, originally targeted to a total vertical depth of 15,240 feet, was deepened to test additional zones of interest including the Cretaceous Moreno formation, a significant source rock interval in this area, according to the USGS. The well reached total depth at 16,950 feet on August 28, 2011, after intersecting sandstone, siltstone, and shale sections below the Kreyenhagen formation with high background gas readings and associated increases in C1-C5 on mud logs, and oil shows. The Company encountered significant hydrocarbon response and pressures that exceeded 14,000 psi in the lowermost 250 feet of the wellbore, which required mud weight to be increased to 16.4 ppg prior to stopping drilling. Subsequent analysis conducted by the Company has confirmed that the Moreno formation in this area is in an oil generation phase.
Fig 4: Overpressure cell
Core Analysis
The Company continues to conduct analysis and interpretation of the core and the suite of modern wireline well logs that were obtained from the 4-9 and 1-10 wells. These data, combined with the existing 3‐D seismic data, are expected to enable Zodiac to systematically identify and rank all potential reservoir targets and to further refine and implement a testing and appraisal program which will continue in 2012.
Well Costs
Well costs were higher than anticipated due primarily to the significant changes in scope such as additional coring and logging intervals, increase in the number of intervals completed and tested, the deepening of the 1-10 pilot hole. Other factors contributing to the cost over runs are equipment failures and inexperienced crews. The drilling and completion costs for the 4-9 well were approximately $23 million while gross drilling and completion costs for the 1-10 well are estimated to be approximately $27 million.
These costs are in line with those faced by ‘first movers’ in the early stages of operations in new plays of this complexity in other areas of North America. The Company expects to reduce these costs by 50 percent once in development mode.
Some examples of substantial cost reductions are
| - | Reduce casing size (13 3/8” Conductor, 9 5/8” Surface and 7” Intermediate, all with standard connections instead of premium connections) |
| - | Reduced logging and coring |
| - | Increase crew and rig efficiency |
| - | Minimize equipment useage from outside California requiring support personnel from outside California |
Land Holdings
The Company continued to add to its land base in a significant manner in 2011, bringing its total land base to approximately 89,000 net acres by year-end.
Our single largest land transaction during the year closed on January 31, 2011. On that date, the Company closed a transaction whereon Zodiac acquired, through farm-in, a 75% working interest in approximately 21,500 acres (the "Assets") located in Kings and Kern Counties in California (the "Panther prospect"). The transaction included the payment of US$5.6 million in cash, the issuance of 2,700,018 shares with a deemed value of US$1.9 million and provision of a work credit in respect of future cash calls made by Zodiac of US$0.9 million for a total transaction cost of US$8.4 million. Going forward Zodiac is required to pay 92 % of the drilling costs of two wells to test Monterey and Kreyenhagen formations. These lands carry, on average, a 19.5% gross royalty interest burden.
Land Holdings | | |
| Gross | 112,000 | 175 |
| Net | 89,000 | 139 |
| Net Revenue Interest | 70,000 | 109 |
Note: Net Revenue Interest is shown after payout and includes all overriding royalty interests
Net lands include lands associated with earning requirements in Hawk and Panther.
Strategy and Outlook
Zodiac plans to commence completion operations on the horizontal section of the 1-10 well in Kings County during the last week of December, 2011. Results of the test on the horizontal well are expected within 30 days of completion of the operation.
In September, Zodiac began a process to identify a joint venture (“JV”) partner to assist the Company in assessing and ultimately exploiting the potential within its acquired land base. That process is currently on-going and the Company anticipates a deal will be announced by the end of first quarter of calendar 2012.
Once a JV approach is established, the Company will finalize its plans for the current fiscal year, 2012. The Company expects to develop a systematic plan to both achieve commerciality and further appraise the array of resource and conventional plays on its land base. The pace at which this is executed will depend on the resources that the Company has at its disposal.
Corporate History and Background
Zodiac is in the pre-production stages of its oil and gas exploration and development program on its land holdings in California, USA (San Joaquin Valley, California). The Company holds varying working interests in approximately 89,000 net acres in the San Joaquin Basin in California. The primary target formations in the Jaguar prospect area are characterized as naturally fractured, low permeability sandstone, siltstone and shale contained in the Whepley, Vaqueros and Kreyenhagen formations. Management believes that this acreage position contains a major accumulation of light oil and further believes that through the application of established oilfield drilling, completion and production technologies and methodologies that Zodiac will be able to ultimately prove the commercial productivity of these lands.
On August 19, 2010, Zodiac Exploration Corp. (“Old Zodiac”) entered into an Arrangement Agreement with Peninsula Resources Ltd. (“Peninsula”), and a wholly-owned subsidiary of Peninsula, 1543081 Alberta Ltd., to effect a reverse takeover transaction (“RTO”). Under the Agreement, Old Zodiac amalgamated with 1543081 Alberta Ltd (the continuing corporate entity post-amalgamation was named Zodiac Exploration Corp.). Peninsula was renamed Zodiac Exploration Inc. (TSX-V:ZEX). This transaction was successfully completed on September 28, 2010 and shares of ZEX began trading on October 6, 2010.
Upon completion of the RTO, Old Zodiac shareholders exchanged their shares in Old Zodiac for shares in Zodiac Exploration Inc. on a 1:1.45 basis. Pre-existing warrants, performance warrants and stock options of Old Zodiac remain outstanding until they are exercised, expired, forfeited, or cancelled. Upon exercise of the warrants, performance warrants, or options they will be exchanged at the 1:1.45 ratio for Zodiac Exploration Inc. shares.
SELECTED ANNUAL FINANCIAL INFORMATION
At September 30, 2011, the Company has not yet achieved profitable operations, has accumulated a deficit of $18,381 (nine months ended September 30, 2010 - $4,620 and twelve months ended December 31, 2009 - $2,029) since inception and expects to incur further losses in the development of its business, which is typical of an oil and gas exploration company in the early stages of development. As at September 30, 2011, the Company’s cash balance was $40,532 (September 30, 2010 - $58,445) primarily resulting from warrant exercises during the year ended September 30, 2011 and financings completed in the nine month period ended September 30, 2010.
To date, the Company has no oil and gas revenues and is considered to be in the development stage as defined by the Financial Accounting Standards Board (“FASB”) Accounting Standard’s Codification (“ASC”) 915.
SELECTED ANNUAL FINANCIAL INFORMATION
| | | | |
| | | September 30, 2011 $ | | | September 30, 2010 $ | | | December 31, 2009 $ | |
| Interest income | | | 215 | | | | 42 | | | | 21 | |
| Total assets | | | 109,198 | | | | 80,108 | | | | 17,202 | |
| Cash flows used in operating activities | | | (3,785 | ) | | | (1,666 | ) | | | (1,538 | ) |
| Net loss | | | (13,761 | ) | | | (2,591 | ) | | | (1,767 | ) |
| Per share (basic and diluted) | | | (0.04 | ) | | | (0.02 | ) | | | (0.02 | ) |
| Capital expenditures | | | 46,402 | | | | 5,320 | | | | 7,241 | |
| General & administrative expenses | | | 3,824 | | | | 1,876 | | | | 1,549 | |
Interest income was generated from interest received on cash held in bank deposits and term deposits obtained throughout the period. During the twelve months ended September 30, 2011, interest revenue increased when compared to the nine month period ended September 30, 2010 and twelve month period ended December 31, 2009, primarily due to higher cash deposits held during the year.
Total assets at September 30, 2011 were $109,198 (September 30, 2010 - $80,108). The significant increase in assets was primarily the result of warrant and option exercises which occurred during the twelve months ended September 30, 2011. Assets are comprised mainly of cash of $40,532 and property, plant and equipment of $64,477.
During the twelve months ended September 30, 2011, funds used in operating activities increased to $3,785, from usage of $1,666 during the nine months ended September 30, 2010 and $1,538 during the twelve months ended December 31, 2009. This increase is due to the increase in G&A expense resulting from the growth of the Company.
Net loss for the twelve months ended September 30, 2011 was $13,761 or $(0.04) per share, compared to a loss of $2,591 or $(0.02) per share for the nine months ended September 30, 2010, and a loss of $1,767 or $(0.02) during the twelve months ended December 31, 2009. Weighted average share calculations have been restated for comparative periods in accordance with reverse takeover accounting guidance. For the year ended September 30, 2011, Zodiac expensed $3,824 in general and administrative expenses (nine months ended September 30, 2010 - $1,876 and twelve months ended December 31, 2009 – $1,549), net of capitalized G&A of $1,544 (nine months ended September 30, 2010 - $738 and twelve months ended December 31, 2009 - $522). The amounts capitalized are directly related to the Company’s drilling, geological and geophysical capital programs, which increased due to activity related to the beginning of physical operations in December 2010. Additionally, G&A expenses increased throughout 2011 primarily as a result of the expanding activities of the Company and consequent increases of technical and financial personnel to undertake and oversee those activities.
Zodiac uses the Canadian dollar as its functional and reporting currency. The Company’s US operations are considered integrated. Accordingly, the Company uses the temporal method of accounting for the foreign currency transactions of its US subsidiaries. It is anticipated that, as US operations comprise a progressively larger proportion of the Company’s balance sheet and operations, adoption of the US dollar as its reporting currency may occur.
ANNUAL RESULTS OF OPERATIONS
| | | | |
| | | September 30, 2011 $ | | | September 30, 2010 $ | | | December 31, 2009 $ | |
| Interest income | | | 215 | | | | 42 | | | | 21 | |
| General and administrative expenses | | | 3,824 | | | | 1,876 | | | | 1,549 | |
| Foreign exchange (gain)/loss | | | 64 | | | | (115 | ) | | | 34 | |
| Stock based compensation | | | 1,546 | | | | 814 | | | | 183 | |
| Depletion, depreciation and accretion | | | 45 | | | | 33 | | | | 22 | |
| Asset impairment charge | | | 8,497 | | | | 25 | | | | | |
| Net loss | | | 13,761 | | | | 2,591 | | | | 1,767 | |
During the year, the Company recognized $265 (nine months ended September 30, 2011 - $489 and twelve months ended December 31, 2009 - $nil) of performance warrant compensation expense (included in stock-based compensation) resulting from the issuance of 10,150,000 performance warrants to officers of the Company. As at December 31, 2010, all performance warrants had vested.
Depreciation and accretion (“D&A”) expenses during the period ended September 30, 2011, September 30, 2010 and December 31, 2009 were $45, $33 and $22, respectively, related to depreciation on fixed assets and, beginning during the quarter ended March 31, 2010, accretion on the asset retirement obligation (“ARO”). As the Company’s petroleum and natural gas assets have not yet commenced production, no depletion has been recorded.
CAPITAL EXPENDITURES
The Company’s intention is to fund the acquisition of mineral and surface rights, the initiation of exploration activities including acquisition of seismic data, and the drilling, completion and tie-in of oil and gas wells through equity issues, operating cash flow and eventually borrowing base loans. A summary of the Company’s Property, Plant and Equipment additions to date are summarized below:
| | September 30, 2011 $ | September 30, 2010 $ |
| Beginning asset balance | 21,087 | 15,722 |
| Land and lease rentals additions | 13,342 | 1,846 |
| Geology and seismic additions | 1,584 | 1,298 |
| Drilling and completions additions | 28,344 | 2,221 |
| Asset retirement obligation additions | 163 | (12) |
| Other fixed assets additions | 36 | 12 |
| Accumulated depreciation | (78) | (49) |
| Total | 64,477 | 21,037 |
Since its inception, the Company’s Property, Plant and Equipment additions have been $64,477, net of depreciation and impairment (September 30, 2010 - $21,037).
During the quarter the Company’s operational focus continued to be on the drilling of the horizontal 1-10 well in the San Joaquin Basin and planning the completion program thereof. Throughout the year, additional areas of capital expenditure were the drilling activities on the 4-9 and 1-10 well along with the acquisition of the Panther prospect (discussed above) and additional lands in the Company’s operational area of focus in the San Joaquin basin, lease rental costs to maintain our rights in our land holdings, and acquisition of additional 3-D seismic data.
The Company’s initial entry into California occurred on June 8, 2009, when the Company acquired the rights, through farm-in, to drill for petroleum and natural gas on approximately 19,700 gross acres (15,750 net) (the “Jaguar Prospect”), of principally contiguous land in the San Joaquin Basin in California (“California Transaction”). The Company paid US$2,500 (CDN $2,800), issued 2 million Zodiac common shares, committed to pay 100% of a seismic program and drill the initial well on the Jaguar prospect, and agreed to pay 100% of the land lease rentals until the initial well is drilled to earn an 80% interest in these lands. The California Transaction also has a secondary component, the Hawk prospect, which is characterized as a conventional prospect. The Company received an option to drill and pay for 100% of the first exploratory well on the Hawk prospect (to be spud by May 31, 2013) to earn an 80% interest in an approximate additional 4,800 gross acres (3,860 net). All of the lands are entirely freehold lands and have varying royalty requirements, which average approximately 20%. These lands are also subject to an overriding royalty interest on production of 2.5% before payout and 4% after payout.
With the completion of the drilling of the 4-9 well on the Jaguar prospect the Company has satisfied its earning requirements on the Jaguar prospect.
During the year ended September 30, 2011, the Company had minimal activities in the Windsor Basin in Nova Scotia. The Company took a full impairment charge on its Nova Scotia assets upon assessing certain factors including (among others): intent to drill by the operator of the Windsor Basin project; remaining lease term; geological and geophysical evaluations; and drilling results. Given that the operator was no longer allocating meaningful resources to continued evaluation, lack of proved reserves attributable to the property and no success to date in finding a joint venture partner to fund a drilling program the Company felt that a full impairment charge was both reasonable and warranted.
LIQUIDITY & CAPITAL RESOURCES
As of September 30, 2011 the Company had positive working capital of $37,731 (September 30, 2010 - $56,913). The Company had $40,532 in cash, generated through equity financings in 2010 and warrant exercises in 2011. Management believes that through existing cash it will have adequate funding to support the Company’s planned capital expenditure programs to the end of calendar 2011. Zodiac’s revenue is comprised entirely of interest earned on cash and cash equivalent balances and short-term investments. Zodiac invests the short-term investments with a major Canadian financial institution. Zodiac has no outstanding bank debt or other interest-bearing indebtedness as at September 30, 2011.
In connection with the RTO of Peninsula, escrow conditions were imposed on the shareholders of Old Zodiac. To date, 100% of the restricted shares have now been released from escrow. The final escrow release date occurred on October 6, 2011.
The Company spud its initial evaluation well on December 25, 2010 and as of the date of this MD&A has completed and tested it. This well has satisfied the Company’s obligations to earn its interest in the Jaguar prospect as previously described above. In order for the Company to earn its working interest in the Hawk and Panther prospects, it will need to spud a well on the Hawk prospect by May 31, 2013; in addition to one well in Panther by January 1, 2013 and a second well in Panther by January 1, 2014.
The Company currently holds an operating lease agreement for office space in Calgary, Alberta which commenced on May 1, 2010 and ends on February 29, 2012. The annual basic rent obligation is $38, payable in monthly instalments of $3. In addition to the basic rent, additional rent is payable monthly, and includes the Company’s proportionate share of all operating costs and taxes.
The Company currently holds an operating lease agreement for the lease of office space in Bakersfield, California for two years which commenced July 1, 2010 and ends on June 30, 2012. The annual basic rent obligation is US$37 per annum, payable in monthly instalments of US$3. In addition to the basic rent, additional rent is payable monthly, and includes the Company’s proportionate share of all operating costs and taxes.
Zodiac assesses its financing requirements and its ability to access equity or debt markets on an ongoing basis. This assessment considers: the stage and success of the Company’s evaluation activities to date; the continued participation of the Company’s partners in evaluation activities; and financial market conditions.
The Company’s intent is to fund the acquisition of mineral and surface rights, the initiation of exploration activities including acquisition of seismic data, and the drilling, completion and tie-in of oil and gas wells through equity issues and potentially farm-out agreements and eventually operating cash flow and borrowing base loans.
Zodiac will continue to maintain financial flexibility and monitor its financing requirements along with its ability to access the equity markets. It is possible that future economic events and global conditions may result in further volatility in the financial markets which could negatively impact Zodiac’s ability to access equity or debt markets in the future. Any inability to access equity or debt markets for sufficient capital, at acceptable terms, and within required timeframes, could have a material adverse effect on Zodiac’s financial condition, results of operations and prospects. Further discussion of these risks may be found in the “Business Risks and Uncertainties” section of this MD&A.
On June 9, 2011, the Company filed a form 40-F registration statement with the SEC. This is the first step in listing the Company’s common shares on a U.S. exchange.
TRANSACTIONS WITH RELATED PARTIES
Related party transactions during the period ended September 30, 2011 not disclosed elsewhere in this Management’s Discussion and Analysis are as follows:
| a) | Aggregate management fees of $nil (nine months ended September 30, 2010 - $220 and twelve months ended December 31, 2009 – $581) were paid to officers of the Company and recorded in the consolidated statement of loss and deficit. All officers of the Company became employees on May 1, 2010. |
| b) | Included in accounts payable as at September 30, 2011 was $nil (September 30, 2010 - $nil) payable to directors and officers of the Company. |
Transactions with related parties are recorded at the exchange amount, being the price agreed to between the parties.
CRITICAL ACCOUNTING POLICIES AND ESTIMATES
The discussion and analysis of our financial condition and results of operations are based upon the consolidated financial statements, which have been prepared in accordance with accounting principles generally accepted in the Unites States of America. The preparation of these financial statements requires us to make estimates and assumptions that affect the reported amounts of assets, liabilities, revenues and expenses, related disclosure of contingent assets and liabilities and oil and gas properties. Certain accounting policies involve judgments and uncertainties to such an extent that there is reasonable likelihood that materially different amounts could have been reported under different conditions, or if different assumptions had been used. We evaluate our estimates and assumptions on a regular basis. We base our estimates on historical experience and various other assumptions that are believed to be reasonable under the circumstances, the results of which form the basis for making judgments about the carrying values of assets and liabilities that are not readily apparent from other sources. Actual results may differ from these estimates and assumptions used in preparation of our financial statements. Below, we have provided expanded discussion of our more significant accounting policies, estimates and judgments for our financial statements. We believe these accounting policies reflect the more significant estimates and assumptions used in preparation of the financial statements.
The Company views the following estimates as critical:
Income Tax
Income taxes are accounted for using the liability method of income tax allocation. Under the liability method, future income tax assets and liabilities are recorded to recognize future income tax inflows and outflows arising from the settlement or recovery of assets and liabilities at their carrying values. Future income tax assets are also recognized for the benefits from tax losses and deductions that cannot be identified with particular assets or liabilities, provided those benefits are more likely than not to be realized. Future income tax assets and liabilities are determined based on the substantively enacted tax laws and rates that are anticipated to apply in the period of realization.
Oil and Gas Properties
The Company follows the full cost method of accounting whereby all costs related to the acquisition are initially capitalized. Costs capitalized include land acquisition costs, geological and geophysical expenditures, lease rentals on undeveloped properties, costs of drilling productive and non-productive wells, together with overhead and interest directly related to exploration and development activities, and lease and well equipment.
Costs capitalized are to be depleted and amortized on a cost centre basis using the unit-of-production method based on estimated proved petroleum and natural gas reserves before royalties as determined by independent engineers. In determining its depletion base, the Company includes estimated future capital costs to be incurred in developing proved reserves and excludes the cost of significant unproved properties until it is determined whether proved reserves are attributable to the unproved properties or impairment has occurred. Unproved properties are evaluated separately for impairment based on management’s assessment of future drilling and exploration activities. The Company’s decision to withhold costs from amortization and the timing of the transfer of those costs into the depreciating asset base involve significant judgment and may be subject to changes over time based on several factors, including drilling plans, availability of capital, project economics and results of drilling on adjacent acreage. During the period there has been nil production, and a depletion expense was not recognized.
Costs capitalized are periodically assessed for impairment after considering geological data and other information. A loss is recognized at the time of impairment by providing an impairment allowance.
As at September 30, 2011, the Company had oil and gas properties with a net book value of $64,406 (September 30, 2010 - $20,973) included in Property, Plant and Equipment on the balance sheet. During the year ended September 30, 2011, management considered whether events occurred or conditions existed, as at period end, that would indicate that net carrying amounts would not be recoverable from estimated future cash flows. Management has determined that, other than those amounts already claimed, there was no additional asset impairment as at September 30, 2011.
Future Development and Abandonment Costs
The Company recognizes the fair value of an asset retirement obligation (“ARO”) in the period in which a well or related asset is drilled, constructed or acquired and when a reasonable estimate of the fair value can be made. The fair value of the estimated ARO is recorded as a long-term liability, and equals the present value of estimated future cash flows, discounted using a risk-free interest rate adjusted for the Company’s credit standing. The liability accretes until the date of expected settlement of the retirement obligations or the asset is sold and is recorded as an accretion expense. Asset retirement costs are capitalized as part of the carrying value of the related assets. The capitalized amount is amortized to earnings on a basis consistent with depreciation and depletion of the underlying assets. Actual restoration expenditures are charged to the accumulated obligation as incurred. Any settlements are charged to income in the period of settlement. Holding all other factors constant, if our estimate of future abandonment and development costs is revised upward, earnings would decrease due to higher depletion, depreciation & accretion expense. Conversely, should these estimates be revised downwards, earnings would increase.
The Company develops estimates of these costs on a location by location basis, and as these costs typically extend many years into the future, estimating these future costs is difficult and requires management to make judgments that are subject to future revisions based upon numerous factors, including changing technology and the political and regulatory environment. We review our assumptions and estimates of future development and future abandonment costs on an annual basis.
Revenue Recognition
Revenue from the sale of petroleum and natural gas is recorded on a gross basis when title passes to an external party and is recognized based on volumes delivered to customers at contractual delivery points and when the significant risks and rewards of ownership have been transferred to the buyer and collectability is reasonably assured.
As at September 30, 2011, the Company has not recognized revenue from the sale of petroleum and natural gas as production has not yet occurred, other than incidental production from testing net against capital costs.
Stock-based Compensation
The Company records compensation expense in the consolidated financial statements for stock options granted to employees, consultants and directors using the fair value method. Fair values are determined using the Black-Scholes option pricing model, which is sensitive to the estimate of stock price volatility and the options’ expected life.
Financial Instruments
The fair values of financial instruments, which include cash and cash equivalents, other receivables, accounts payable and accrued liabilities approximate their carrying values due to the relatively short maturity of these instruments.
RECENT ACCOUNTING PRONOUNCEMENTS
The Company successfully completed efforts to raise additional equity capital in conjunction with the plan to combine with Peninsula (note 4). Post RTO, U.S. based investors form a substantial minority of the Company’s shareholder base. Should trading of the Company’s shares shift the balance to majority ownership by U.S. investors, it is anticipated, given the Company’s focus on the properties located in California, that the Company will eventually become a Domestic Issuer from a Securities Exchange Commission ("SEC") perspective. As a result, the Company would then be obligated to prepare and file U.S. GAAP based financial statements and regulatory filings to comply with U.S. regulations and the Company could avail itself of the option to use its U.S. GAAP statements for all financial disclosure requirements both in Canada and the U.S. Alternatively, should shareholdings shift towards a greater allocation to Canadian and international investors or stay static, International Financial Reporting Standards (“IFRS”) would need to be adopted for the fiscal year beginning October 1, 2011. In order to eliminate the uncertainty regarding an inevitable accounting conversion, to either IFRS or U.S. GAAP, the Company filed a form 40 F registration statement with the SEC during the quarter ended June 30, 2011. The Company intends to list its securities on a U.S. exchange and file U.S. GAAP statements with the SEC within the next 12 months. Further the Company intends to avail itself of the option to use its U.S. GAAP statements for all financial disclosure requirements both in Canada and the U.S. beginning in fiscal 2012. The Company has determined that a conversion to U.S. GAAP will have an insignificant impact on its financial statements.
The following recently issued accounting developments have been applied or may impact the Company in future periods.
Comprehensive Income - In June of 2011, the FASB issued Accounting Standards Update No. 2011-05: Comprehensive Income (Topic 220): Presentation of Comprehensive Income (ASU 2011-05). ASU 2011-05 provides that an entity that reports items of other comprehensive income has the option to present comprehensive income in either one continuous financial statement or two consecutive financial statements. ASU 2011-05 is effective for annual period beginning after December 15, 2011. We do not anticipate the implementation to have an impact on the Company's financial position or results of operations.
Fair Value Measurements - In May of 2011, the FASB issued Accounting Standards Update No. 2011-04: Fair Value Measurement (Topic 820): Amendments to Achieve Common Fair Value Measurement and Disclosure Requirements in U.S. GAAP and IFRSs (ASU 2011-04). ASU 2011-04 clarifies application of fair value measurement and disclosure requirements and is effective for annual periods beginning after December 15, 2011. We are currently evaluating the provisions of ASU 2011-04 and assessing the impact, if any, it may have on our financial position and results of operations.
OFF BALANCE SHEET ARRANGEMENTS
The Company has not entered into any off-balance sheet arrangements such as guarantee contracts, contingent interests in assets transferred to unconsolidated entities, derivative financial obligations, or with respect to any obligation under a variable interest equity arrangement.
OUTSTANDING SHARE DATA
Authorized capital:
Unlimited number of common shares with voting rights.
Unlimited number of preferred shares, issuable in series.
Issued and outstanding:
| - | 359,248,741 common shares as at December 22, 2011. |
Warrants outstanding:
| - | 14,500,000 with an exercise price of $1.034. Expiry dates are between February 8th and February 10th, 2012. |
| - | 24,445,706 with an exercise price of $0.414. 12,325,008 expire on March 17, 2015, 11,088,539 expire on April 1, 2015 and 1,032,159 expire on April 9, 2015. |
| - | Subsequent to year end, 1,630,000 options were issued to directors, officers, employees and consultants of the company. |
BUSINESS RISKS AND UNCERTAINTIES
The Company is subject to various risks and uncertainties, including, but not limited to, those listed below:
Oil and Gas Exploration and Development
The oil and gas industry is extremely competitive in all aspects including the acquisition of oil and gas interests, the marketing of oil and natural gas, and acquiring or gaining access to necessary drilling equipment, services and supplies. Zodiac competes with numerous other companies in the search for and acquisition of prospective oil and gas plays.
Zodiac is subject to all risks and hazards inherent in the business involved in the exploration for, and the acquisition, development, production and marketing of oil and natural gas. Many of these inherent risks cannot be compensated for, even with the combination of experience, knowledge and careful planning of an experienced technical team. The risks and hazards typically associated with oil and gas operations include equipment failure, fire, explosion, blowouts, sour gas releases, pipeline ruptures and oil spills, each of which could result in substantial damage to oil and gas wells, production facilities, other property, the environment or personal injury.
Capital Requirements
To finance future operations, Zodiac may require financing from external sources including, but not limited to, issuance of common or preferred shares, issuance of debt or implementation of working interest farm-out agreements. There can be no assurance that such financing will be offered on acceptable terms or that it will be available at all to the Company. If additional financing is raised through the issuance of equity or convertible debt securities, control of the Company may change and the interests of shareholders in the net assets of Zodiac may be diluted. If unable to secure financing on acceptable terms, Zodiac may have to cancel or postpone certain of its planned exploration and development activities which may ultimately lead to Zodiac’s inability to fulfill the minimum work obligations under various farm-in agreements and potentially to the forfeiture of existing land holdings. Availability of capital will also directly impact the Company’s ability to take advantage of additional farm-in and acquisition opportunities.
Operations
Zodiac’s largest land position relates to the oil and gas projects located in Kings County, California, USA, which is currently its primary focus. Uncertainties include, but are not limited to: a change in the general regulatory environment; a change in environmental protection policies; or a change in taxation policies. These uncertainties, all of which are beyond the Company’s control, could have a material adverse effect on Zodiac’s business, prospects and results of operations. Zodiac will require licenses or permits from various governmental authorities to carry out future exploration, development and production activities. There can be no assurance that Zodiac will be able to obtain all necessary licenses and permits when required.
Uncertainty of Title
Although Zodiac conducts a thorough title review prior to acquiring additional acreage in its areas of interest, such reviews do not guarantee that an unforeseen defect in the chain of title will not arise that may call into question Zodiac’s interest in its land holdings. Any uncertainty with respect to one or more of Zodiac’s leasehold interests could have a material adverse effect on the Company’s business, prospects and results of operations.
Foreign Operations
Zodiac operates in the United States and consequently, if legal disputes arise related to oil and gas leases acquired by Zodiac, these disputes would likely be subject to the jurisdiction of courts other than those of Canada.
Operational Uncertainties
In carrying out its planned exploration program, Zodiac is subject to various risks including, but not limited to: the availability of equipment, manpower and supplies; the effects of weather on drilling and production; and operating in an environmentally responsible fashion.
The Company mitigates these business risks by: working with qualified operators and/or operating the majority of properties to control the amount and timing of capital expenditures; restricting operations to areas where locations are accessible, operating and capital costs are reasonable and on-stream times are shorter; drilling wells in areas with multiple high deliverability zone potential; striving to maintain cost-effective operations; using current technology to maximize production and recoveries and reduce operating costs and environmental impacts; and maintaining memberships in industry organizations.
Dependence on Management
The Company strongly depends on the technical and business expertise of its management team and there is little possibility that this dependence will decrease in the near term. The unexpected loss of any member of the management team may have a material adverse impact on the operations of the Company.
DATE
This MD&A is dated December 22, 2011