UNITED STATES
SECURITIES AND EXCHANGE COMMISSION
Washington, D.C. 20549
FORM N-CSR
CERTIFIED SHAREHOLDER REPORT OF REGISTERED
MANAGEMENT INVESTMENT COMPANIES
811-22472
(Investment Company Act File Number)
RiverNorth Opportunities Fund, Inc.
(Exact Name of Registrant as Specified in Charter)
1290 Broadway, Suite 1000
Denver, CO 80203
(Address of Principal Executive Offices)
Sareena Khwaja-Dixon
RiverNorth Opportunities Fund, Inc.
1290 Broadway, Suite 1000
Denver, CO 80203
(Name and Address of Agent for Service)
(303) 623-2577
(Registrant’s Telephone Number)
Date of Fiscal Year End: July 31
Date of Reporting Period: January 31, 2022
| Item 1. | Reports to Stockholders. |
| RiverNorth Opportunities Fund, Inc. | Performance Overview |
| | January 31, 2022 (Unaudited) |
INVESTMENT OBJECTIVE AND PRINCIPAL INVESTMENT STRATEGIES
RiverNorth Opportunities Fund, Inc.’s (the “Fund”) investment objective is total return consisting of capital appreciation and current income.
The Fund seeks to achieve its investment objective by pursuing a tactical asset allocation strategy and opportunistically investing under normal circumstances in closed-end funds ("CEF"), exchange-traded funds ("ETFs"), business development companies ("BDCs" and collectively, "Underlying Funds") and special purpose acquisition companies ("SPACs").
RiverNorth Capital Management, LLC (the "Subadviser") has the flexibility to change the Fund’s asset allocation based on its ongoing analysis of the equity, fixed income and alternative asset markets. The Subadviser considers various quantitative and qualitative factors relating to the domestic and foreign securities markets and economies when making asset allocation and security selection decisions. While the Subadviser continuously evaluates these factors, material shifts in the Fund’s asset class exposures will typically take place over longer periods of time.
PERFORMANCE OVERVIEW
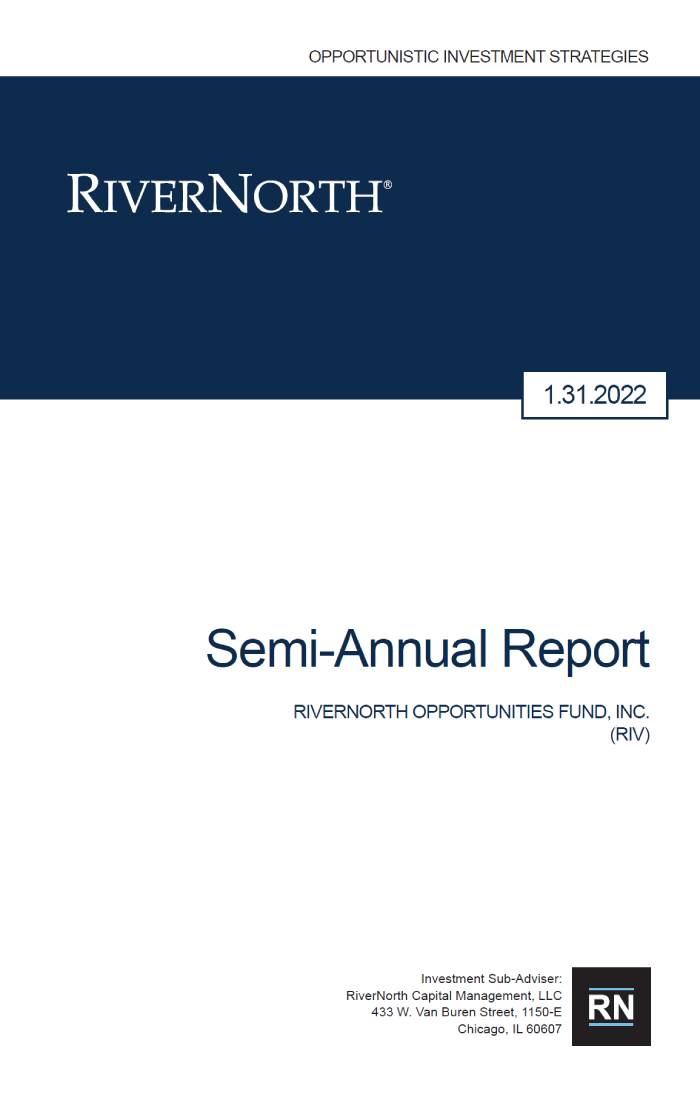
For the six-month period ended January 31, 2022, the Fund returned 0.35% on a net asset value (“NAV”) basis and -4.01% on a market price basis. The All Closed-end Fund (CEF) Index return was -1.37% on a NAV basis and -2.75% on a price basis over the six-month period. The S&P 500 Total Return Index returned 3.44% during the same period.
Discount narrowing in the Fund’s CEF portfolio was the most significant positive contributor to performance. CEF NAV exposure and the Fund’s short hedge were the largest detractors from performance.
During the period, the Fund opportunistically added leverage to take advantage of CEF discount volatility that increased towards the end of calendar year 2021. In our view, this volatility was driven by shifting sentiment around inflation and fears over rising interest rates. The Fund’s SPAC exposure increased by ~ 7% over the period with a commensurate reduction in BDCs, Investment Company Debt and Portfolio Cash.
Looking forward, we believe the Fund is well-positioned to deliver attractive risk-adjusted returns given the general uncertainty around interest rates and their impact on income-oriented assets including CEFs. Further the SPAC portfolio provides investors with exposure to a unique strategy with attractive, asymmetric return potential.
| RiverNorth Opportunities Fund, Inc. | Performance Overview |
| | January 31, 2022 (Unaudited) |
PERFORMANCE as of January 31, 2022
| | | CUMULATIVE | | AVERAGE ANNUAL |
| | | | | | | | | | | Since |
| TOTAL RETURNS(1) | | 6 Months | | 1 Year | | 3 Year | | 5 Year | | Inception(2) |
| RiverNorth Opportunities Fund, Inc. -NAV(3) | | 0.35% | | 9.97% | | 10.73% | | 8.02% | | 9.81% |
| RiverNorth Opportunities Fund, Inc. - Market Price(4) | | -4.01% | | 10.07% | | 12.45% | | 9.42% | | 9.67% |
| S&P 500® Total Return Index | | 3.44% | | 23.29% | | 20.71% | | 16.78% | | 15.84% |
| (1) | Total returns assume reinvestment of all distributions. |
| (2) | The Fund commenced operations on December 24, 2015. |
| (3) | Performance returns are net of management fees and other Fund expenses. |
| (4) | Market price is the value at which the Fund trades on an exchange. This market price can be more or less than its NAV. |
Performance data quoted represents past performance, which is not a guarantee of future results. Current performance may be lower or higher than the performance quoted. The principal value and investment return of an investment will fluctuate so that your shares, when redeemed, may be worth more or less than their original cost. You can obtain performance data current to the most recent month end by calling (855) 830-1222 or by visiting www.rivernorthcef.com. Total return measures net investment income and capital gain or loss from portfolio investments. All performance shown assumes reinvestment of dividends and capital gains distributions.
DISTRIBUTION TO COMMON STOCKHOLDERS
The Fund intends to make regular monthly distributions to stockholders at a constant and fixed (but not guaranteed) rate that is reset annually to a rate equal to a percentage of the average of the Fund’s NAV per share as reported for the final five trading days of the preceding calendar year. The Board of Directors approve the distribution and may adjust it from time to time. The monthly distribution amount paid from August 1, 2021 to January 31, 2022 was $0.17 per share and the Fund paid a long-term capital gain distribution of $0.2426 per share on December 31, 2021. At times, to maintain a stable level of distributions, the Fund may pay out less than all of its net investment income or pay out accumulated undistributed income, or return of capital, in addition to current net investment income.
Total annual expense ratio as a percentage of net assets attributable to common shares as of January 31, 2022, is 1.39% (excluding dividend expense and line of credit expense). Including dividend expense and line of credit expense, the expense ratio is 1.67%.
The Fund is a closed-end fund and does not continuously issue shares for sale as open-end mutual funds do. The Fund now trades only in the secondary market. Investors wishing to buy or sell shares need to place orders through an intermediary or broker and additional charges or commissions will apply. The share price of a closed-end fund is based on the market’s value.
Distributions may be paid from sources of income other than ordinary income, such as net realized short-term capital gains, net realized long-term capital gains and return of capital. The actual amounts and sources of the amounts for tax reporting purposes will depend upon a Fund’s investment experience during the remainder of its fiscal year and may be subject to changes based on tax regulations. If a distribution includes anything other than net investment income, the Fund provides a Section 19(a) notice of the best estimate of its distribution sources at that time. These estimates may not match the final tax characterization (for the full year’s distributions) contained in shareholders’ 1099-DIV forms after the end of the year.
| Semi-Annual Report | January 31, 2022 | 3 |
| RiverNorth Opportunities Fund, Inc. | Performance Overview |
| | January 31, 2022 (Unaudited) |
S&P 500® Total Return Index – A market value weighted index of 500 stocks chosen for market size, liquidity and industry grouping, among other factors. This index is designed to be a leading indicator of U.S. equities and is meant to reflect the risk/return characteristics of the large cap universe. This index reflects the effects of dividend reinvestment.
Indices are unmanaged; their returns do not reflect any fees, expenses, or sales charges.
An investor cannot invest directly in an index.
ALPS Advisors, Inc. is the investment adviser to the Fund.
RiverNorth Capital Management, LLC is the investment sub-adviser to the Fund. RiverNorth Capital Management, LLC is not affiliated with ALPS Advisors, Inc. or any of its affiliates.
Secondary market support provided to the Fund by ALPS Advisors, Inc.'s affiliate, ALPS Portfolio Solutions Distributor, Inc., a FINRA member.
GROWTH OF A HYPOTHETICAL $10,000 INVESTMENT
The graph below illustrates the growth of a hypothetical $10,000 investment assuming the purchase of common shares at NAV or the closing market price (NYSE: RIV) of $19.40 on December 24, 2015, and tracking its progress through January 31, 2022.
Past performance does not guarantee future results. Performance will fluctuate with changes in market conditions. Current performance may be lower or higher than the performance data shown. Performance information does not reflect the deduction of taxes that shareholders would pay on Fund distributions or the sale of Fund shares. An investment in the Fund involves risk, including loss of principal.
| RiverNorth Opportunities Fund, Inc. | Performance Overview |
| | January 31, 2022 (Unaudited) |
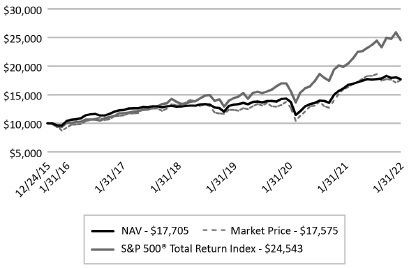
ASSET ALLOCATION as of January 31, 2022^
| ^ | Holdings are subject to change. |
| | * | Represents securities sold short. |
| | | Percentages are based on total net assets of the Fund. |
TOP TEN HOLDINGS* as of January 31, 2022
| | | |
| | | % of Net Assets** |
| Blackrock Capital Allocation Trust | | 6.44% |
| Pershing Square Holdings Ltd. | | 5.92% |
| Saba Capital Income & Opportunities Fund | | 4.13% |
| Morgan Stanley Emerging Markets Domestic Debt Fund, Inc. | | 3.84% |
| BlackRock Innovation & Growth Trust | | 3.77% |
| PIMCO Energy & Tactical Credit Opportunities Fund | | 3.19% |
| Cohen & Steers Tax-Advantaged Preferred Securities & Income Fund | | 3.04% |
| Sprott Physical Gold and Silver Trust | | 2.94% |
| Invesco Dynamic Credit Opportunity Fund | | 2.52% |
| First Eagle Alternative Capital BDC, Inc. | | 2.06% |
| | | 37.85% |
| * | Holdings are subject to change and exclude cash equivalents. Only long positions are listed. |
| ** | Percentages are based on total net assets, including securities sold short. |
| Semi-Annual Report | January 31, 2022 | 5 |
| RiverNorth Opportunities Fund, Inc. | Statement of Investments |
| | January 31, 2022 (Unaudited) |
| | | | | | Value | |
| Description | | Shares | | | (Note 2) | |
| CLOSED-END FUNDS - COMMON SHARES (66.97%) | | | | | | | | |
| Aberdeen Emerging Markets Equity Income Fund, Inc.(a) | | | 395,248 | | | $ | 3,114,554 | |
| Barings Corporate Investors | | | 256,534 | | | | 4,066,064 | |
| Barings Participation Investors | | | 263,584 | | | | 3,840,419 | |
| BlackRock 2022 Global Income Opportunity Trust | | | 176,578 | | | | 7,452 | |
| BlackRock California Municipal Income Trust(a) | | | 306,065 | | | | 4,107,392 | |
| Blackrock Capital Allocation Trust(a) | | | 983,887 | | | | 18,034,649 | |
| Blackrock ESG Capital Allocation Trust(a) | | | 240,630 | | | | 4,203,806 | |
| BlackRock Innovation & Growth Trust(a)(b) | | | 774,171 | | | | 10,551,951 | |
| BlackRock MuniHoldings Investment Quality Fund | | | 97,195 | | | | 1,284,918 | |
| BlackRock MuniVest Fund, Inc. | | | 50,276 | | | | 442,429 | |
| BlackRock MuniYield California Fund, Inc. | | | 19,207 | | | | 271,203 | |
| Blackrock Science & Technology Trust(b) | | | 58,914 | | | | 2,698,261 | |
| BrandywineGLOBAL - Global Income Opportunities Fund, | | | | | | | | |
| Inc. | | | 62,800 | | | | 708,384 | |
| Calamos Long/Short Equity & Dynamic Income Trust(b) | | | 206,161 | | | | 4,147,959 | |
| Cohen & Steers Tax-Advantaged Preferred Securities & | | | | | | | | |
| Income Fund | | | 365,462 | | | | 8,511,610 | |
| DTF Tax-Free Income 2028 Term Fund, Inc. | | | 61,947 | | | | 848,178 | |
| DWS Municipal Income Trust | | | 18,752 | | | | 205,710 | |
| Eaton Vance New York Municipal Bond Fund | | | 27,590 | | | | 314,802 | |
| First Trust Dynamic Europe Equity Income Fund | | | 67,635 | | | | 913,749 | |
| Franklin Limited Duration Income Trust | | | 3 | | | | 24 | |
| GDL Fund | | | 136,172 | | | | 1,199,675 | |
| Guggenheim Strategic Opportunities Fund | | | 1 | | | | 19 | |
| High Income Securities Fund(a) | | | 244,189 | | | | 2,063,397 | |
| Invesco Dynamic Credit Opportunity Fund | | | 568,170 | | | | 7,062,353 | |
| Kayne Anderson Midstream/Energy Fund, Inc.(a) | | | 483,845 | | | | 3,623,999 | |
| MFS Municipal Income Trust | | | 320,791 | | | | 2,069,102 | |
| Miller/Howard High Dividend Fund(b) | | | 329,948 | | | | 3,520,545 | |
| Morgan Stanley Emerging Markets Domestic Debt Fund, | | | | | | | | |
| Inc.(a)(b) | | | 1,963,454 | | | | 10,740,093 | |
| Neuberger Berman California Municipal Fund, Inc. | | | 52,706 | | | | 694,354 | |
| NexPoint Diversified Real Esta Trust | | | 244,187 | | | | 3,511,409 | |
| Nuveen Core Plus Impact Fund(a) | | | 294,147 | | | | 4,897,548 | |
| Nuveen Dividend Advantage Municipal Income Fund | | | 89,421 | | | | 1,429,842 | |
| Nuveen Dynamic Municipal Opportunities Fund(a) | | | 226,169 | | | | 3,424,199 | |
| Pershing Square Holdings Ltd. | | | 445,276 | | | | 16,586,531 | |
| PGIM Short Duration High Yield Opportunities Fund(a) | | | 232,458 | | | | 4,140,077 | |
| PIMCO Energy & Tactical Credit Opportunities Fund(b) | | | 645,937 | | | | 8,926,849 | |
| Pioneer Municipal High Income Fund Trust(a) | | | 217,657 | | | | 2,468,230 | |
| Pioneer Municipal High Income Opportunities Fund, Inc.(a) | | | 209,350 | | | | 3,565,231 | |
| Royce Micro-Cap Trust, Inc. | | | 79,866 | | | | 848,177 | |
| Saba Capital Income & Opportunities Fund(a) | | | 2,551,575 | | | | 11,558,635 | |
| Special Opportunities Fund, Inc.(a) | | | 380,689 | | | | 5,607,549 | |
| Sprott Physical Gold and Silver Trust | | | 474,436 | | | | 8,226,720 | |
See Notes to Financial Statements.
| RiverNorth Opportunities Fund, Inc. | Statement of Investments |
| | January 31, 2022 (Unaudited) |
| | | | | | Value | |
| Description | | Shares | | | (Note 2) | |
| Templeton Global Income Fund | | | 334,732 | | | $ | 1,710,481 | |
| Tortoise Pipeline & Energy Fund, Inc. | | | 66,900 | | | | 1,732,710 | |
| Virtus AllianzGI Convertible & Income Fund II(b) | | | 907,541 | | | | 4,192,839 | |
| Voya Emerging Markets High Income Dividend Equity Fund(a) | | | 155,330 | | | | 1,113,716 | |
| Western Asset Diversified Income Fund(a) | | | 242,326 | | | | 4,354,598 | |
| | | | | | | | | |
| TOTAL CLOSED-END FUNDS - COMMON SHARES | | | | | | | | |
| (Cost $185,060,054) | | | | | | | 187,542,392 | |
| | | | | | | | | |
| BUSINESS DEVELOPMENT COMPANIES - COMMON SHARES (1.41%) | | | | | | | | |
| First Eagle Alternative Capital BDC, Inc. | | | 903,098 | | | | 3,946,538 | |
| | | | | | | | | |
| TOTAL BUSINESS DEVELOPMENT COMPANIES - COMMON SHARES | | | | | | | | |
| (Cost $3,880,523) | | | | | | | 3,946,538 | |
| | | | | | | | | |
| BUSINESS DEVELOPMENT COMPANIES - PREFERRED SHARES (0.31%) | | | | | | | | |
| XAI Octagon Floating Rate Alternative Income Term Trust, | | | | | | | | |
| 6.50%, 3/31/2026 | | | 33,699 | | | | 879,881 | |
| | | | | | | | | |
| TOTAL BUSINESS DEVELOPMENT COMPANIES - PREFERRED SHARES | | | | | | | | |
| (Cost $842,093) | | | | | | | 879,881 | |
| Description | | Rate | | | Maturity
Date | | Principal
Amount/Shares | | | Value
(Note 2) | |
| BUSINESS DEVELOPMENT COMPANY NOTES (5.91%) | | | | | | | | | | | | | | |
| BlackRock Capital Investment Corp. | | | 5.000% | | | 06/15/22 | | $ | 1,760,565 | | | | 1,784,773 | |
| BlackRock TCP Capital Corp. | | | 4.625% | | | 03/01/22 | | | 699,500 | | | | 702,158 | |
| First Eagle Alternative Capital BDC, Inc. | | | 5.000% | | | 05/25/26 | | | 226,369 | | | | 5,763,355 | |
| Goldman Sachs BDC, Inc. | | | 4.500% | | | 04/01/22 | | | 500,000 | | | | 505,002 | |
| New Mountain Finance Corp. | | | 5.750% | | | 08/15/23 | | | 1,493,450 | | | | 1,563,994 | |
| Oxford Square Capital Corp. | | | 6.500% | | | 03/30/24 | | | 117,106 | | | | 2,963,953 | |
| PennantPark Floating Rate Capital, Ltd. | | | 4.250% | | | 04/01/26 | | | 3,280,000 | | | | 3,275,612 | |
| | | | | | | | | | | | | | 16,558,847 | |
| | | | | | | | | | | | | | | |
| TOTAL BUSINESS DEVELOPMENT COMPANY NOTES | | | | | | | | | | | | | | |
| (Cost $15,944,518) | | | | | | | | | | | | | 16,558,847 | |
| Description | | Rate | | | Maturity
Date | | Principal
Amount | | | Value
(Note 2) | |
| CORPORATE BONDS (0.11%) | | | | | | | | | | | | | | |
| Business Development Corp. of | | | 4.850% | | | 12/15/24 | | $ | 300,000 | | | | 312,894 | |
| America(c) | | | | | | | | | | | | | | |
| | | | | | | | | | | | | | | |
| TOTAL CORPORATE BONDS | | | | | | | | | | | | | | |
| (Cost $300,000) | | | | | | | | | | | | | 312,894 | |
See Notes to Financial Statements.
| Semi-Annual Report | January 31, 2022 | 7 |
| RiverNorth Opportunities Fund, Inc. | Statement of Investments |
| | January 31, 2022 (Unaudited) |
| Description | | Shares | | | Value
(Note 2) | |
| SPECIAL PURPOSE ACQUISITION COMPANIES - COMMON SHARES (33.05%)(d) | | | | | | | | |
| 26 Capital Acquisition Corp. | | | 6,044 | | | $ | 59,352 | |
| 7GC & Co. Holdings, Inc. | | | 2,490 | | | | 24,265 | |
| ABG Acquisition Corp. I | | | 1,698 | | | | 16,505 | |
| Accelerate Acquisition Corp. | | | 27,090 | | | | 262,502 | |
| Accretion Acquisition Corp. | | | 33,634 | | | | 327,595 | |
| Ace Global Business Acquisition, Ltd. | | | 23,244 | | | | 235,462 | |
| Achari Ventures Holdings Corp. I | | | 28,750 | | | | 284,338 | |
| Ackrell Spac Partners I Co. | | | 26,282 | | | | 266,762 | |
| Adit EdTech Acquisition Corp. | | | 28,640 | | | | 282,677 | |
| Advanced Merger Partners, Inc. | | | 634 | | | | 6,156 | |
| AF Acquisition Corp. | | | 41,970 | | | | 405,850 | |
| African Gold Acquisition Corp. | | | 424 | | | | 4,099 | |
| Agba Acquisition, Ltd. | | | 30,883 | | | | 340,639 | |
| Alpha Star Acquisition Corp. | | | 27,690 | | | | 281,884 | |
| Alpine Acquisition Corp. | | | 54,048 | | | | 542,101 | |
| ALSP Orchid Acquisition Corp. I | | | 86,742 | | | | 872,625 | |
| AltEnergy Acquisition Corp. | | | 23,793 | | | | 238,882 | |
| Altitude Acquisition Corp. | | | 5,136 | | | | 50,795 | |
| American Acquisition Opportunity, Inc. | | | 27,090 | | | | 272,525 | |
| America's Technology Acquisition Corp. | | | 18,890 | | | | 192,017 | |
| Apeiron Capital Investment Corp. | | | 7,852 | | | | 78,991 | |
| Apollo Strategic Growth Capital | | | 50,336 | | | | 497,823 | |
| Archimedes Tech SPAC Partners Co. | | | 54,092 | | | | 534,429 | |
| Ares Acquisition Corp. | | | 50,000 | | | | 486,000 | |
| Argus Capital Corp. | | | 14,068 | | | | 141,805 | |
| Aries I Acquisition Corp. | | | 30,180 | | | | 301,800 | |
| Arisz Acquisition Corp. | | | 39,063 | | | | 398,052 | |
| Artisan Acquisition Corp. | | | 23,946 | | | | 238,023 | |
| Astrea Acquisition Corp. | | | 10,062 | | | | 100,117 | |
| Athlon Acquisition Corp. | | | 54,212 | | | | 526,941 | |
| Atlantic Avenue Acquisition Corp. | | | 33,230 | | | | 325,654 | |
| Atlas Crest Investment Corp. II | | | 4,193 | | | | 40,840 | |
| Ault Disruptive Technologies Corp. | | | 43,543 | | | | 436,301 | |
| Austerlitz Acquisition Corp. I | | | 44,508 | | | | 431,728 | |
| Austerlitz Acquisition Corp. II | | | 99,364 | | | | 962,837 | |
| Authentic Equity Acquisition Corp. | | | 2,418 | | | | 23,563 | |
| Avalon Acquisition, Inc. | | | 109,049 | | | | 1,100,850 | |
| B Riley Principal 250 Merger Corp. | | | 2,380 | | | | 23,443 | |
| Bannix Acquisition Corp. | | | 51,497 | | | | 506,730 | |
| Battery Future Acquisition Corp. | | | 109,282 | | | | 1,092,820 | |
| Better World Acquisition Corp. | | | 29,581 | | | | 301,430 | |
| Big Sky Growth Partners, Inc. | | | 23,844 | | | | 230,333 | |
| BioPlus Acquisition Corp. | | | 30,629 | | | | 305,065 | |
| Biotech Acquisition Co. | | | 47,978 | | | | 471,624 | |
| Bison Capital Acquisition Corp. | | | 17,396 | | | | 174,047 | |
See Notes to Financial Statements.
| RiverNorth Opportunities Fund, Inc. | Statement of Investments |
| | January 31, 2022 (Unaudited) |
| | | | | | Value | |
| Description | | Shares | | | (Note 2) | |
| Black Mountain Acquisition Corp. | | | 39,233 | | | $ | 395,665 | |
| Blockchain Coinvestors Acquisition Corp. I | | | 15,680 | | | | 158,211 | |
| Blockchain Moon Acquisition Corp. | | | 28,817 | | | | 281,830 | |
| Blue Ocean Acquisition Corp. | | | 114,803 | | | | 1,144,586 | |
| Blue Safari Group Acquisition Corp. | | | 49,546 | | | | 494,469 | |
| BlueRiver Acquisition Corp. | | | 171 | | | | 1,664 | |
| Breeze Holdings Acquisition Corp. | | | 21,512 | | | | 220,283 | |
| Bright Lights Acquisition Corp. | | | 11,234 | | | | 111,217 | |
| Brilliant Acquisition Corp. | | | 11,614 | | | | 119,043 | |
| Build Acquisition Corp. | | | 27,078 | | | | 262,657 | |
| Bullpen Parlay Acquisition Co. | | | 76,882 | | | | 766,898 | |
| Burgundy Technology Acquisition Corp. | | | 25,350 | | | | 253,753 | |
| Cactus Acquisition Corp. 1, Ltd. | | | 47,585 | | | | 477,278 | |
| CC Neuberger Principal Holdings II, Class A | | | 106,700 | | | | 1,055,263 | |
| CC Neuberger Principal Holdings III | | | 34,335 | | | | 334,766 | |
| CF Acquisition Corp. IV | | | 2,490 | | | | 24,352 | |
| CF Acquisition Corp. VIII | | | 27,072 | | | | 269,908 | |
| Churchill Capital Corp. VI | | | 99,545 | | | | 973,550 | |
| Churchill Capital Corp. VII | | | 45,420 | | | | 441,937 | |
| CIIG Capital Partners II, Inc. | | | 28,306 | | | | 279,946 | |
| Clarim Acquisition Corp. | | | 3,479 | | | | 33,712 | |
| Class Acceleration Corp. | | | 6,044 | | | | 58,808 | |
| Codere Online Luxembourg SA | | | 15,356 | | | | 9,060 | |
| Colicity, Inc. | | | 1,709 | | | | 16,595 | |
| Colombier Acquisition Corp. | | | 42,080 | | | | 403,968 | |
| Compute Health Acquisition Corp. | | | 50,000 | | | | 485,500 | |
| Concord Acquisition Corp. | | | 11,516 | | | | 114,584 | |
| Corazon Capital V838 Monoceros Corp. | | | 19,197 | | | | 185,731 | |
| Corner Growth Acquisition Corp. | | | 6,261 | | | | 61,045 | |
| COVA Acquisition Corp. | | | 4,342 | | | | 42,248 | |
| Crescera Capital Acquisition Corp. | | | 23,340 | | | | 232,233 | |
| D & Z Media Acquisition Corp. | | | 1,062 | | | | 10,301 | |
| Data Knights Acquisition Corp. | | | 35,695 | | | | 361,590 | |
| Deep Lake Capital Acquisition Corp. | | | 246 | | | | 2,403 | |
| Deep Medicine Acquisition Corp. | | | 28,601 | | | | 282,292 | |
| Delwinds Insurance Acquisition Corp. | | | 41,410 | | | | 409,545 | |
| DHC Acquisition Corp. | | | 17,064 | | | | 165,265 | |
| DiamondHead Holdings Corp. | | | 212 | | | | 2,060 | |
| Digital Health Acquisition Corp. | | | 19,208 | | | | 194,577 | |
| DILA Capital Acquisition Corp. | | | 50,541 | | | | 494,291 | |
| Direct Selling Acquisition Corp. | | | 35,317 | | | | 355,995 | |
| dMY Technology Group, Inc. VI | | | 12,897 | | | | 125,617 | |
| DTRT Health Acquisition Corp. | | | 53,144 | | | | 529,846 | |
| Dune Acquisition Corp. | | | 18,958 | | | | 187,495 | |
| East Resources Acquisition Co. | | | 27,990 | | | | 276,541 | |
| Edify Acquisition Corp. | | | 28,306 | | | | 274,993 | |
| | | | | | | | | |
See Notes to Financial Statements.
| Semi-Annual Report | January 31, 2022 | 9 |
| RiverNorth Opportunities Fund, Inc. | Statement of Investments |
| | January 31, 2022 (Unaudited) |
| | | | | | Value | |
| Description | | Shares | | | (Note 2) | |
| EdtechX Holdings Acquisition Corp. II | | | 12,606 | | | $ | 126,501 | |
| Empowerment & Inclusion Capital I Corp. | | | 13,658 | | | | 132,961 | |
| Enterprise 4.0 Technology Acquisition Corp. | | | 9,605 | | | | 96,530 | |
| EQ Health Acquisition Corp. | | | 4,348 | | | | 42,263 | |
| Eucrates Biomedical Acquisition Corp. | | | 24,174 | | | | 235,938 | |
| EVe Mobility Acquisition Corp. | | | 109,282 | | | | 1,091,181 | |
| Everest Consolidator Acquisition Corp. | | | 34,274 | | | | 345,139 | |
| ExcelFin Acquisition Corp. | | | 9,609 | | | | 96,570 | |
| Far Peak Acquisition Corp. | | | 37,839 | | | | 374,606 | |
| FAST Acquisition Corp. II | | | 27,116 | | | | 263,025 | |
| Financial Strategies Acquisition Corp. | | | 65,633 | | | | 645,829 | |
| Finnovate Acquisition Corp. | | | 32,014 | | | | 321,901 | |
| Fintech Evolution Acquisition Group | | | 1,706 | | | | 16,506 | |
| Flame Acquisition Corp. | | | 4,258 | | | | 41,217 | |
| Fortistar Sustainable Solutions Corp. | | | 8,682 | | | | 84,215 | |
| Fortress Value Acquisition Corp. III | | | 6,185 | | | | 60,490 | |
| FoxWayne Enterprises Acquisition Corp. | | | 12,095 | | | | 120,345 | |
| Fusion Acquisition Corp. II | | | 8,540 | | | | 82,838 | |
| G Squared Ascend II, Inc. | | | 25,269 | | | | 246,120 | |
| Games & Esports Experience Acquisition Corp. | | | 61,369 | | | | 617,372 | |
| Gardiner Healthcare Acquisitions Corp. | | | 67,312 | | | | 678,168 | |
| Genesis Growth Tech Acquisition Corp. | | | 87,537 | | | | 875,370 | |
| GigCapital5, Inc. | | | 42,380 | | | | 419,562 | |
| GigInternational1, Inc. | | | 48,296 | | | | 479,821 | |
| Glass Houses Acquisition Corp. | | | 3,999 | | | | 39,650 | |
| Global Consumer Acquisition Corp. | | | 24,752 | | | | 245,292 | |
| Global SPAC Partners Co. | | | 40,780 | | | | 409,227 | |
| Globalink Investment, Inc. | | | 65,531 | | | | 671,693 | |
| Globis Acquisition Corp. | | | 37,823 | | | | 384,282 | |
| Golden Falcon Acquisition Corp. | | | 2,528 | | | | 24,699 | |
| Goldenbridge Acquisition, Ltd. | | | 29,011 | | | | 289,240 | |
| Gores Holdings VII, Inc. | | | 36,060 | | | | 350,864 | |
| Graf Acquisition Corp. IV | | | 48,324 | | | | 468,260 | |
| Green Visor Financial Technology Acquisition Corp. I | | | 31,409 | | | | 318,173 | |
| Growth Capital Acquisition Corp. | | | 21,746 | | | | 216,808 | |
| Growth For Good Acquisition Corp. | | | 65,633 | | | | 656,330 | |
| Healthcare AI Acquisition Corp. | | | 50,143 | | | | 496,416 | �� |
| Healthcare Capital Corp. | | | 6,044 | | | | 60,319 | |
| Healthcare Services Acquisition Corp. | | | 1,866 | | | | 18,175 | |
| Hennessy Capital Investment Corp. V | | | 53,420 | | | | 518,174 | |
| Hunt Cos. Acquisition Corp. I | | | 19,441 | | | | 196,257 | |
| IG Acquisition Corp. | | | 30,762 | | | | 301,468 | |
| Ignyte Acquisition Corp. | | | 3,466 | | | | 33,949 | |
| Industrial Human Capital, Inc. | | | 19,240 | | | | 195,575 | |
| Innovative International Acquisition Corp. | | | 14,300 | | | | 145,002 | |
| Integrated Rail and Resources Acquisition Corp. | | | 78,505 | | | | 787,405 | |
| | | | | | | | | |
See Notes to Financial Statements.
| RiverNorth Opportunities Fund, Inc. | Statement of Investments |
| | January 31, 2022 (Unaudited) |
| Description | | Shares | | | Value
(Note 2) | |
| Integrated Wellness Acquisition Corp. | | | 87,537 | | | $ | 879,747 | |
| Intelligent Medicine Acquisition Corp. | | | 6,412 | | | | 64,697 | |
| InterPrivate II Acquisition Corp. | | | 4,801 | | | | 46,467 | |
| InterPrivate III Financial Partners, Inc. | | | 5,335 | | | | 52,816 | |
| Isleworth Healthcare Acquisition Corp. | | | 39,372 | | | | 386,633 | |
| ITHAX Acquisition Corp. | | | 4,332 | | | | 42,410 | |
| Jack Creek Investment Corp. | | | 9,700 | | | | 94,284 | |
| Jackson Acquisition Co. | | | 65,652 | | | | 655,207 | |
| Jaws Mustang Acquisition Corp. | | | 99,988 | | | | 971,883 | |
| Jupiter Wellness Acquisition Corp. | | | 46,148 | | | | 455,481 | |
| Kadem Sustainable Impact Corp. | | | 27,306 | | | | 263,776 | |
| Kairos Acquisition Corp. | | | 9,996 | | | | 97,461 | |
| Kairous Acquisition Corp. ltd | | | 64,923 | | | | 655,073 | |
| Kensington Capital Acquisition Corp. V | | | 41,939 | | | | 413,939 | |
| Khosla Ventures Acquisition Co. III | | | 16,886 | | | | 163,625 | |
| Kingswood Acquisition Corp. | | | 20,076 | | | | 203,972 | |
| KINS Technology Group, Inc. | | | 12,594 | | | | 125,814 | |
| KKR Acquisition Holdings I Corp. | | | 73,332 | | | | 712,054 | |
| KL Acquisition Corp. | | | 1,406 | | | | 13,779 | |
| KludeIn I Acquisition Corp. | | | 8,544 | | | | 84,329 | |
| L&F Acquisition Corp. | | | 18,120 | | | | 182,106 | |
| Lakeshore Acquisition I Corp. | | | 20,160 | | | | 198,072 | |
| LAMF Global Ventures Corp. I | | | 110,737 | | | | 1,111,799 | |
| Larkspur Health Acquisition Corp. | | | 64,629 | | | | 642,089 | |
| Lazard Growth Acquisition Corp. I | | | 40,000 | | | | 387,600 | |
| Learn CW Investment Corp. | | | 9,575 | | | | 95,798 | |
| Legato Merger Corp. II | | | 147,931 | | | | 1,488,186 | |
| LF Capital Acquisition Corp. II | | | 39,110 | | | | 393,447 | |
| LightJump Acquisition Corp. | | | 28,126 | | | | 277,744 | |
| Lionheart Acquisition Corp. II | | | 33,322 | | | | 333,886 | |
| Lionheart III Corp. | | | 102,445 | | | | 1,028,548 | |
| LMF Acquisition Opportunities, Inc. | | | 31,863 | | | | 319,267 | |
| Longview Acquisition Corp. II | | | 4,025 | | | | 39,042 | |
| M3-Brigade Acquisition III Corp. | | | 19,192 | | | | 189,617 | |
| Mana Capital Acquisition Corp. | | | 31,198 | | | | 326,487 | |
| Maquia Capital Acquisition Corp. | | | 27,289 | | | | 274,254 | |
| Marlin Technology Corp. | | | 2,466 | | | | 23,970 | |
| McLaren Technology Acquisition Corp. | | | 12,832 | | | | 127,293 | |
| MDH Acquisition Corp. | | | 16,912 | | | | 164,046 | |
| Medicus Sciences Acquisition Corp. | | | 8,473 | | | | 82,230 | |
| Mercato Partners Acquisition Corp. | | | 64,028 | | | | 644,762 | |
| Merida Merger Corp. I | | | 61,365 | | | | 437,532 | |
| Minority Equality Opportunities Acquisition, Inc. | | | 50,249 | | | | 505,254 | |
| Model Performance Acquisition Corp. | | | 40,612 | | | | 406,932 | |
| Monterey Bio Acquisition Corp. | | | 41,579 | | | | 411,632 | |
| Monument Circle Acquisition Corp. | | | 2,448 | | | | 23,917 | |
| | | | | | | | | |
See Notes to Financial Statements.
| Semi-Annual Report | January 31, 2022 | 11 |
| RiverNorth Opportunities Fund, Inc. | Statement of Investments |
| | January 31, 2022 (Unaudited) |
| Description | | Shares | | | Value
(Note 2) | |
| Moringa Acquisition Corp. | | | 5,095 | | | $ | 49,371 | |
| Mount Rainier Acquisition Corp. | | | 49,577 | | | | 500,232 | |
| Mountain Crest Acquisition Corp. III | | | 48,112 | | | | 476,309 | |
| Mountain Crest Acquisition Corp. V | | | 67,514 | | | | 677,841 | |
| Nabors Energy Transition Corp. | | | 62,576 | | | | 632,956 | |
| New Vista Acquisition Corp. | | | 168 | | | | 1,630 | |
| Newbury Street Acquisition Corp. | | | 42,162 | | | | 407,285 | |
| Newcourt Acquisition Corp. | | | 19,240 | | | | 195,094 | |
| Noble Rock Acquisition Corp. | | | 12,685 | | | | 123,298 | |
| Nocturne Acquisition Corp. | | | 36,206 | | | | 363,508 | |
| North Atlantic Acquisition Corp. | | | 10,767 | | | | 105,840 | |
| NorthView Acquisition Corp. | | | 69,600 | | | | 679,296 | |
| OceanTech Acquisitions I Corp. | | | 48,836 | | | | 487,872 | |
| Omega Alpha SPAC | | | 280 | | | | 2,736 | |
| Omnichannel Acquisition Corp. | | | 20,080 | | | | 199,595 | |
| OmniLit Acquisition Corp. | | | 91,745 | | | | 916,533 | |
| Onyx Acquisition Co. I | | | 16,682 | | | | 167,821 | |
| OPY Acquisition Corp. I | | | 57,201 | | | | 571,152 | |
| Orion Biotech Opportunities Corp. | | | 42,045 | | | | 405,314 | |
| Osiris Acquisition Corp. | | | 47,892 | | | | 462,158 | |
| Oxbridge Acquisition Corp. | | | 52,752 | | | | 523,827 | |
| Oxus Acquisition Corp. | | | 53,236 | | | | 526,238 | |
| Oyster Enterprises Acquisition Corp. | | | 18,142 | | | | 176,068 | |
| Pacifico Acquisition Corp. | | | 49,847 | | | | 493,984 | |
| Periphas Capital Partnering Corp. | | | 10,140 | | | | 247,416 | |
| Phoenix Biotech Acquisition Corp. | | | 10,589 | | | | 105,043 | |
| PHP Ventures Acquisition Corp. | | | 51,134 | | | | 508,272 | |
| Pivotal Investment Corp. III | | | 168 | | | | 1,633 | |
| Post Holdings Partnering Corp. | | | 12,159 | | | | 117,334 | |
| Power & Digital Infrastructure Acquisition II Corp. | | | 131,265 | | | | 1,320,526 | |
| Priveterra Acquisition Corp. | | | 6,751 | | | | 65,485 | |
| Progress Acquisition Corp. | | | 8,438 | | | | 82,439 | |
| Project Energy Reimagined Acquisition Corp. | | | 38,069 | | | | 377,264 | |
| PROOF Acquisition Corp. I | | | 68,145 | | | | 684,176 | |
| Property Solutions Acquisition Corp. II | | | 60,171 | | | | 583,659 | |
| PropTech Investment Corp. II | | | 12,486 | | | | 121,926 | |
| Prospector Capital Corp. | | | 1,404 | | | | 13,647 | |
| Pyrophyte Acquisition Corp. | | | 4,766 | | | | 48,327 | |
| Quantum FinTech Acquisition Corp. | | | 30,397 | | | | 300,930 | |
| Recharge Acquisition Corp. | | | 15,380 | | | | 152,262 | |
| RedBall Acquisition Corp. | | | 19,827 | | | | 196,486 | |
| RMG Acquisition Corp. III | | | 345 | | | | 3,353 | |
| ROC Energy Acquisition Corp. | | | 92,054 | | | | 922,381 | |
| Roth CH Acquisition V Co. | | | 61,950 | | | | 616,402 | |
| Sanaby Health Acquisition Corp. I | | | 9,583 | | | | 95,447 | |
| Sandbridge X2 Corp. | | | 17,371 | | | | 168,152 | |
| | | | | | | | | |
See Notes to Financial Statements.
| RiverNorth Opportunities Fund, Inc. | Statement of Investments |
| | January 31, 2022 (Unaudited) |
| | | | | | Value | |
| Description | | Shares | | | (Note 2) | |
| ScION Tech Growth I | | | 6,261 | | | $ | 61,045 | |
| ScION Tech Growth II | | | 40,698 | | | | 395,585 | |
| Screaming Eagle Acquisition Corp. | | | 65,165 | | | | 646,437 | |
| Sculptor Acquisition Corp. I | | | 65,652 | | | | 656,520 | |
| Semper Paratus Acquisition Corp. | | | 6,402 | | | | 64,468 | |
| Senior Connect Acquisition Corp. I | | | 48,836 | | | | 476,151 | |
| Silver Spike Acquisition Corp. II | | | 6,760 | | | | 65,978 | |
| Sizzle Acquisition Corp. | | | 83,237 | | | | 831,538 | |
| Southport Acquisition Corp. | | | 65,587 | | | | 660,461 | |
| Spartan Acquisition Corp. III, Class A | | | 19,528 | | | | 192,937 | |
| Spindletop Health Acquisition Corp. | | | 12,805 | | | | 128,818 | |
| SPK Acquisition Corp. | | | 46,987 | | | | 468,695 | |
| SportsMap Tech Acquisition Corp. | | | 14,408 | | | | 141,991 | |
| SportsTek Acquisition Corp. | | | 12,736 | | | | 123,412 | |
| Spree Acquisition Corp. 1, Ltd. | | | 154,848 | | | | 1,545,693 | |
| ST Energy Transition I, Ltd. | | | 61,260 | | | | 618,726 | |
| Super Group SGHC, Ltd. | | | 31,852 | | | | 277,431 | |
| Sustainable Development Acquisition I Corp. | | | 2,738 | | | | 26,559 | |
| SVF Investment Corp. | | | 280 | | | | 2,730 | |
| SVF Investment Corp. 2 | | | 268 | | | | 2,602 | |
| SVF Investment Corp. 3 | | | 36,465 | | | | 358,086 | |
| Swiftmerge Acquisition Corp. | | | 65,570 | | | | 650,454 | |
| Tailwind Acquisition Corp. | | | 13,098 | | | | 128,884 | |
| Tailwind International Acquisition Corp. | | | 3,390 | | | | 32,951 | |
| Tastemaker Acquisition Corp. | | | 33,890 | | | | 333,139 | |
| Tech and Energy Transition Corp. | | | 27,052 | | | | 262,134 | |
| Tekkorp Digital Acquisition Corp. | | | 24,288 | | | | 238,022 | |
| TG Venture Acquisition Corp. | | | 25,665 | | | | 251,261 | |
| Thayer Ventures Acquisition Corp. | | | 44,510 | | | | 453,112 | |
| Thrive Acquisition Corp. | | | 9,609 | | | | 96,715 | |
| TKB Critical Technologies 1 | | | 1,906 | | | | 19,174 | |
| TLGY Acquisition Corp. | | | 12,390 | | | | 124,148 | |
| Trine II Acquisition Corp. | | | 76,995 | | | | 771,490 | |
| Tristar Acquisition I Corp. | | | 39,232 | | | | 390,947 | |
| Tuscan Holdings Corp. II | | | 92,638 | | | | 946,760 | |
| Twelve Seas Investment Co. II | | | 6,832 | | | | 66,339 | |
| UTA Acquisition Corp. | | | 92,054 | | | | 915,017 | |
| Vahanna Tech Edge Acquisition I Corp. | | | 31,197 | | | | 314,310 | |
| VectoIQ Acquisition Corp. II | | | 1,400 | | | | 13,594 | |
| Ventoux CCM Acquisition Corp. | | | 35,388 | | | | 355,296 | |
| Venus Acquisition Corp. | | | 16,878 | | | | 169,961 | |
| Vickers Vantage Corp. I | | | 70,218 | | | | 709,202 | |
| Vistas Media Acquisition Co., Inc. | | | 25,796 | | | | 265,699 | |
| Viveon Health Acquisition Corp. | | | 32,618 | | | | 328,137 | |
| Waverley Capital Acquisition Corp. 1 | | | 51,496 | | | | 496,422 | |
| Welsbach Technology Metals Acquisition Corp. | | | 66,708 | | | | 670,415 | |
| | | | | | | | | |
See Notes to Financial Statements.
| Semi-Annual Report | January 31, 2022 | 13 |
| RiverNorth Opportunities Fund, Inc. | Statement of Investments |
| | January 31, 2022 (Unaudited) |
| Description | | Shares | | | Value
(Note 2) | |
| WinVest Acquisition Corp. | | | 52,742 | | | $ | 520,564 | |
| Worldwide Webb Acquisition Corp. | | | 49,336 | | | | 489,906 | |
| Z-Work Acquisition Corp. | | | 1,739 | | | | 16,860 | |
| | | | | | | | | |
| TOTAL SPECIAL PURPOSE ACQUISITION COMPANIES - COMMON SHARES | | | | | | | | |
| (Cost $91,343,459) | | | | | | | 92,557,825 | |
| | | | | | | | | |
| RIGHTS (0.10%)(d) | | | | | | | | |
| Accretion Acquisition Corp., Strike Price $0.01, Expires | | | | | | | | |
| 12/31/2049 | | | 33,634 | | | | 8,240 | |
| Agba Acquisition, Ltd., Strike Price $11.50, Expires | | | | | | | | |
| 12/31/2049 | | | 30,883 | | | | 5,868 | |
| Alberton Acquisition Corp., Strike Price $0.01, Expires | | | | | | | | |
| 12/31/2049 | | | 22,730 | | | | 9,090 | |
| Allegro Merger Corp., Strike Price $11.50, Expires | | | | | | | | |
| 12/31/2049 | | | 24,649 | | | | — | |
| Bannix Acquisition Corp., Strike Price $0.01, Expires | | | | | | | | |
| 12/31/2049 | | | 51,497 | | | | 12,359 | |
| Benessere Capital Acquisition Corp., Strike Price $0.01, | | | | | | | | |
| Expires 12/31/2049 | | | 37,712 | | | | 12,068 | |
| Blockchain Moon Acquisition Corp., Strike Price $0.01, | | | | | | | | |
| Expires 12/31/2049 | | | 28,817 | | | | 6,052 | |
| Blue Safari Group Acquisition Corp., Strike Price $0.01, | | | | | | | | |
| Expires 09/24/2026 | | | 49,546 | | | | 27,498 | |
| Breeze Holdings Acquisition Corp., Strike Price $0.01, Expires | | | | | | | | |
| 05/25/2027 | | | 21,512 | | | | 3,593 | |
| Brilliant Acquisition Corp., Strike Price $11.50, Expires | | | | | | | | |
| 12/31/2025 | | | 11,614 | | | | 1,684 | |
| Deep Medicine Acquisition Corp., Strike Price $11.50, Expires | | | | | | | | |
| 12/09/2022 | | | 28,601 | | | | 7,007 | |
| East Stone Acquisition Corp., Strike Price $11.50, Expires | | | | | | | | |
| 12/31/2026 | | | 41,399 | | | | 16,191 | |
| Financial Strategies Acquisition Corp., Strike Price $11.50, | | | | | | | | |
| Expires 03/31/2028 | | | 65,633 | | | | 13,048 | |
| Goldenbridge Acquisition, Ltd., Strike Price $0.01, Expires | | | | | | | | |
| 12/31/2049 | | | 29,011 | | | | 5,512 | |
| Jupiter Wellness Acquisition Corp., Strike Price $11.50, | | | | | | | | |
| Expires 12/31/2049 | | | 46,148 | | | | 12,460 | |
| Model Performance Acquisition Corp., Strike Price $0.01, | | | | | | | | |
| Expires 04/30/2026 | | | 40,612 | | | | 12,167 | |
| Mountain Crest Acquisition Corp. III, Strike Price $0.01, | | | | | | | | |
| Expires 05/15/2026 | | | 48,112 | | | | 21,650 | |
| Nocturne Acquisition Corp., Strike Price $0.01, Expires | | | | | | | | |
| 12/29/2025 | | | 36,206 | | | | 9,071 | |
| NorthView Acquisition Corp., Strike Price $0.01, Expires | | | | | | | | |
| 12/31/2049 | | | 69,600 | | | | 12,117 | |
See Notes to Financial Statements.
| RiverNorth Opportunities Fund, Inc. | Statement of Investments |
| | January 31, 2022 (Unaudited) |
| Description | | Shares | | | Value
(Note 2) | |
| Pacifico Acquisition Corp., Strike Price $0.01, Expires | | | | | | | | |
| 12/31/2049 | | | 49,847 | | | $ | 19,939 | |
| PHP Ventures Acquisition Corp., Strike Price $0.01, Expires | | | | | | | | |
| 10/08/2022 | | | 51,134 | | | | 12,272 | |
| SPK Acquisition Corp., Strike Price $0.01, Expires 12/31/2049 | | | 46,987 | | | | 14,824 | |
| Ventoux CCM Acquisition Corp., Strike Price $0.01, Expires | | | | | | | | |
| 12/31/2049 | | | 35,388 | | | | 6,510 | |
| Venus Acquisition Corp., Strike Price $0.01, Expires | | | | | | | | |
| 02/02/2022 | | | 16,878 | | | | 5,722 | |
| Viveon Health Acquisition Corp., Strike Price $0.01, Expires | | | | | | | | |
| 12/31/2049 | | | 32,618 | | | | 4,567 | |
| WinVest Acquisition Corp., Strike Price $0.01, Expires | | | | | | | | |
| 12/31/2049 | | | 52,742 | | | | 9,246 | |
| | | | | | | | | |
| TOTAL RIGHTS | | | | | | | | |
| (Cost $320,135) | | | | | | | 268,755 | |
| | | | | | | | | |
| WARRANTS (0.40%)(d) | | | | | | | | |
| 26 Capital Acquisition Corp., Strike Price $11.50, Expires | | | | | | | | |
| 12/31/2027 | | | 3,022 | | | | 1,179 | |
| 7GC & Co. Holdings, Inc., Strike Price $11.50, Expires | | | | | | | | |
| 12/31/2026 | | | 1,245 | | | | 451 | |
| Accelerate Acquisition Corp., Strike Price $11.50, Expires | | | | | | | | |
| 12/31/2027 | | | 9,030 | | | | 4,515 | |
| Accretion Acquisition Corp., Strike Price $11.50, Expires | | | | | | | | |
| 02/19/2023 | | | 16,817 | | | | 5,290 | |
| Ace Global Business Acquisition, Ltd., Strike Price $11.50, | | | | | | | | |
| Expires 12/31/2027 | | | 23,244 | | | | 4,291 | |
| Achari Ventures Holdings Corp. I, Strike Price $11.50, Expires | | | | | | | | |
| 02/05/2023 | | | 28,748 | | | | 6,670 | |
| Ackrell Spac Partners I Co., Strike Price $11.50, Expires | | | | | | | | |
| 12/01/2026 | | | 13,141 | | | | 5,966 | |
| Adit EdTech Acquisition Corp., Strike Price $11.50, Expires | | | | | | | | |
| 12/31/2027 | | | 14,320 | | | | 5,155 | |
| AdTheorent Holding Co., Inc., Strike Price $11.50, Expires | | | | | | | | |
| 12/31/2027 | | | 558 | | | | 321 | |
| Advanced Merger Partners, Inc., Strike Price $11.50, Expires | | | | | | | | |
| 06/30/2026 | | | 105 | | | | 54 | |
| AF Acquisition Corp, Strike Price $11.50, Expires 03/31/2028 | | | 13,990 | | | | 5,504 | |
| African Gold Acquisition Corp., Strike Price $11.50, Expires | | | | | | | | |
| 03/13/2028 | | | 318 | | | | 118 | |
| Agba Acquisition, Ltd., Strike Price $11.50, Expires | | | | | | | | |
| 05/10/2024 | | | 30,883 | | | | 4,776 | |
| AgileThought, Inc., Strike Price $11.50, Expires 01/10/2025 | | | 46,360 | | | | 17,149 | |
| Allegro Merger Corp., Strike Price $11.50, Expires | | | | | | | | |
| 12/31/2049 | | | 24,649 | | | | — | |
See Notes to Financial Statements.
| Semi-Annual Report | January 31, 2022 | 15 |
| RiverNorth Opportunities Fund, Inc. | Statement of Investments |
| | January 31, 2022 (Unaudited) |
| | | | | | Value | |
| Description | | Shares | | | (Note 2) | |
| Alpine Acquisition Corp., Strike Price $11.50, Expires | | | | | | | | |
| 01/21/2023 | | | 27,024 | | | $ | 9,996 | |
| Altitude Acquisition Corp., Strike Price $11.50, Expires | | | | | | | | |
| 11/30/2027 | | | 698 | | | | 202 | |
| American Acquisition Opportunity, Inc., Strike Price $11.50, | | | | | | | | |
| Expires 05/28/2026 | | | 13,545 | | | | 4,092 | |
| America's Technology Acquisition Corp., Strike Price $11.50, | | | | | | | | |
| Expires 12/31/2027 | | | 9,445 | | | | 2,952 | |
| Apollo Strategic Growth Capital, Strike Price $11.50, Expires | | | | | | | | |
| 10/29/2027 | | | 10,112 | | | | 9,708 | |
| Arbe Robotics, Ltd., Strike Price $11.50, Expires 10/07/2026 | | | 33,034 | | | | 33,695 | |
| Archimedes Tech SPAC Partners, Strike Price $11.50, Expires | | | | | | | | |
| 12/31/2027 | | | 13,523 | | | | 10,952 | |
| Aries I Acquisition Corp., Strike Price $11.50, Expires | | | | | | | | |
| 05/07/2023 | | | 15,090 | | | | 8,073 | |
| Artisan Acquisition Corp., Strike Price $11.50, Expires | | | | | | | | |
| 12/31/2028 | | | 7,982 | | | | 3,872 | |
| Astrea Acquisition Corp., Strike Price $11.50, Expires | | | | | | | | |
| 01/13/2026 | | | 5,031 | | | | 1,760 | |
| Athlon Acquisition Corp., Strike Price $11.50, Expires | | | | | | | | |
| 03/05/2026 | | | 27,106 | | | | 11,927 | |
| Atlantic Avenue Acquisition Corp., Strike Price $11.50, | | | | | | | | |
| Expires 12/31/2025 | | | 16,615 | | | | 6,769 | |
| Austerlitz Acquisition Corp. I, Strike Price $11.50, Expires | | | | | | | | |
| 02/19/2026 | | | 11,127 | | | | 8,887 | |
| Austerlitz Acquisition Corp. II, Strike Price $11.50, Expires | | | | | | | | |
| 12/31/2027 | | | 12,341 | | | | 7,427 | |
| Authentic Equity Acquisition Corp., Strike Price $11.50, | | | | | | | | |
| Expires 12/31/2027 | | | 1,209 | | | | 555 | |
| Bannix Acquisition Corp., Strike Price $11.50, Expires | | | | | | | | |
| 02/19/2023 | | | 51,497 | | | | 14,821 | |
| Better World Acquisition Corp., Strike Price $11.50, Expires | | | | | | | | |
| 11/15/2027 | | | 29,581 | | | | 9,759 | |
| Big Sky Growth Partners, Inc., Strike Price $11.50, Expires | | | | | | | | |
| 02/26/2023 | | | 5,961 | | | | 3,129 | |
| Biotech Acquisition Co., Strike Price $11.50, Expires | | | | | | | | |
| 11/30/2027 | | | 23,989 | | | | 5,997 | |
| Bison Capital Acquisition Corp., Strike Price $11.50, Expires | | | | | | | | |
| 08/31/2027 | | | 8,698 | | | | 3,653 | |
| Blockchain Moon Acquisition Corp., Strike Price $11.50, | | | | | | | | |
| Expires 03/24/2023 | | | 28,817 | | | | 6,547 | |
| BlueRiver Acquisition Corp., Strike Price $11.50, Expires | | | | | | | | |
| 01/04/2026 | | | 57 | | | | 31 | |
| Breeze Holdings Acquisition Corp., Strike Price $11.50, | | | | | | | | |
| Expires 05/25/2027 | | | 21,512 | | | | 4,733 | |
See Notes to Financial Statements.
| RiverNorth Opportunities Fund, Inc. | Statement of Investments |
| | January 31, 2022 (Unaudited) |
| Description | | Shares | | | Value
(Note 2) | |
| Bright Lights Acquisition Corp., Strike Price $11.50, Expires | | | | | | | | |
| 01/01/2028 | | | 5,617 | | | $ | 3,286 | |
| Brilliant Acquisition Corp., Strike Price $11.50, Expires | | | | | | | | |
| 12/31/2025 | | | 6,735 | | | | 1,102 | |
| Build Acquisition Corp., Strike Price $11.50, Expires | | | | | | | | |
| 04/29/2023 | | | 9,026 | | | | 4,062 | |
| Burgundy Technology Acquisition Corp., Strike Price $11.50, | | | | | | | | |
| Expires 10/05/2025 | | | 12,675 | | | | 3,932 | |
| BuzzFeed, Inc., Strike Price $11.50, Expires 12/31/2027 | | | 1,396 | | | | 663 | |
| CC Neuberger Principal Holdings II, Strike Price $11.50, | | | | | | | | |
| Expires 07/29/2025 | | | 7,925 | | | | 7,133 | |
| CC Neuberger Principal Holdings III, Strike Price $11.50, | | | | | | | | |
| Expires 12/31/2027 | | | 1,867 | | | | 1,406 | |
| CF Acquisition Corp. IV, Strike Price $11.50, Expires | | | | | | | | |
| 12/14/2025 | | | 830 | | | | 307 | |
| CF Acquisition Corp. VIII, Strike Price $11.50, Expires | | | | | | | | |
| 12/31/2027 | | | 6,768 | | | | 3,043 | |
| Churchill Capital Corp. VI, Strike Price $11.50, Expires | | | | | | | | |
| 12/31/2027 | | | 9,909 | | | | 7,432 | |
| Churchill Capital Corp. VII, Strike Price $11.50, Expires | | | | | | | | |
| 02/29/2028 | | | 9,084 | | | | 5,632 | |
| CIIG Capital Partners II, Inc., Strike Price $11.50, Expires | | | | | | | | |
| 02/28/2028 | | | 14,153 | | | | 8,664 | |
| Cipher Mining, Inc., Strike Price $11.50, Expires 10/22/2025 | | | 5,318 | | | | 3,723 | |
| Clarim Acquisition Corp., Strike Price $11.50, Expires | | | | | | | | |
| 12/31/2027 | | | 1,159 | | | | 459 | |
| Clarus Therapeutics Holdings, Inc., Strike Price $11.50, | | | | | | | | |
| Expires 08/31/2027 | | | 17,581 | | | | 3,511 | |
| Class Acceleration Corp., Strike Price $11.50, Expires | | | | | | | | |
| 03/31/2028 | | | 3,022 | | | | 1,450 | |
| Colicity, Inc., Strike Price $11.50, Expires 12/31/2027 | | | 341 | | | | 160 | |
| Colombier Acquisition Corp., Strike Price $11.50, Expires | | | | | | | | |
| 12/31/2028 | | | 14,026 | | | | 6,963 | |
| Concord Acquisition Corp., Strike Price $11.50, Expires | | | | | | | | |
| 11/28/2025 | | | 5,758 | | | | 10,077 | |
| Corazon Capital V838 Monoceros Corp., Strike Price $11.50, | | | | | | | | |
| Expires 12/31/2028 | | | 6,399 | | | | 3,258 | |
| Corner Growth Acquisition Corp., Strike Price $11.50, Expires | | | | | | | | |
| 12/31/2027 | | | 2,087 | | | | 793 | |
| COVA Acquisition Corp., Strike Price $11.50, Expires | | | | | | | | |
| 12/31/2027 | | | 2,171 | | | | 738 | |
| D & Z Media Acquisition Corp., Strike Price $11.50, Expires | | | | | | | | |
| 12/31/2027 | | | 354 | | | | 159 | |
| Data Knights Acquisition Corp., Strike Price $11.50, Expires | | | | | | | | |
| 12/31/2028 | | | 35,695 | | | | 10,709 | |
See Notes to Financial Statements.
| Semi-Annual Report | January 31, 2022 | 17 |
| RiverNorth Opportunities Fund, Inc. | Statement of Investments |
| | January 31, 2022 (Unaudited) |
| Description | | Shares | | | Value
(Note 2) | |
| Deep Lake Capital Acquisition Corp., Strike Price $11.50, | | | | | | | | |
| Expires 12/31/2027 | | | 123 | | | $ | 49 | |
| Delwinds Insurance Acquisition Corp., Strike Price $11.50, | | | | | | | | |
| Expires 08/01/2027 | | | 20,705 | | | | 8,106 | |
| DHC Acquisition Corp., Strike Price $11.50, Expires | | | | | | | | |
| 12/31/2027 | | | 5,688 | | | | 2,531 | |
| DiamondHead Holdings Corp., Strike Price $11.50, Expires | | | | | | | | |
| 01/28/2028 | | | 53 | | | | 26 | |
| DILA Capital Acquisition Corp., Strike Price $11.50, Expires | | | | | | | | |
| 12/31/2028 | | | 50,541 | | | | 21,227 | |
| dMY Technology Group, Inc. VI, Strike Price $11.50, Expires | | | | | | | | |
| 06/25/2023 | | | 6,448 | | | | 4,770 | |
| DTRT Health Acquisition Corp., Strike Price $11.50, Expires | | | | | | | | |
| 11/12/2022 | | | 26,572 | | | | 10,629 | |
| Dune Acquisition Corp., Strike Price $11.50, Expires | | | | | | | | |
| 10/29/2027 | | | 9,479 | | | | 3,223 | |
| East Resources Acquisition Co., Strike Price $11.50, Expires | | | | | | | | |
| 07/01/2027 | | | 13,995 | | | | 4,338 | |
| Edify Acquisition Corp., Strike Price $11.50, Expires | | | | | | | | |
| 12/31/2027 | | | 14,153 | | | | 6,404 | |
| EdtechX Holdings Acquisition Corp. II, Strike Price $11.50, | | | | | | | | |
| Expires 06/15/2027 | | | 6,303 | | | | 1,324 | |
| Empowerment & Inclusion Capital I Corp., Strike Price | | | | | | | | |
| $11.50, Expires 01/12/2028 | | | 6,829 | | | | 2,868 | |
| EQ Health Acquisition Corp., Strike Price $11.50, Expires | | | | | | | | |
| 02/02/2028 | | | 2,174 | | | | 1,022 | |
| Eucrates Biomedical Acquisition Corp., Strike Price $11.50, | | | | | | | | |
| Expires 12/14/2025 | | | 8,058 | | | | 3,223 | |
| Evolv Technologies Holdings, Inc., Strike Price $11.50, | | | | | | | | |
| Expires 07/16/2026 | | | 27,277 | | | | 11,454 | |
| Far Peak Acquisition Corp., Strike Price $11.50, Expires | | | | | | | | |
| 12/07/2025 | | | 12,613 | | | | 10,452 | |
| FAST Acquisition Corp. II, Strike Price $11.50, Expires | | | | | | | | |
| 03/16/2026 | | | 6,779 | | | | 3,450 | |
| Financial Strategies Acquisition Corp., Strike Price $11.50, | | | | | | | | |
| Expires 03/31/2028 | | | 65,633 | | | | 12,470 | |
| Fintech Evolution Acquisition Group, Strike Price $11.50, | | | | | | | | |
| Expires 03/31/2028 | | | 568 | | | | 281 | |
| Flame Acquisition Corp., Strike Price $11.50, Expires | | | | | | | | |
| 12/31/2028 | | | 2,129 | | | | 766 | |
| Fortistar Sustainable Solutions Corp., Strike Price $11.50, | | | | | | | | |
| Expires 12/31/2027 | | | 4,341 | | | | 2,040 | |
| Fortress Value Acquisition Corp. III, Strike Price $11.50, | | | | | | | | |
| Expires 12/31/2027 | | | 1,236 | | | | 744 | |
| FoxWayne Enterprises Acquisition Corp., Strike Price $11.50, | | | | | | | | |
| Expires 01/12/2026 | | | 12,095 | | | | 3,374 | |
See Notes to Financial Statements.
| RiverNorth Opportunities Fund, Inc. | Statement of Investments |
| | January 31, 2022 (Unaudited) |
| | | | | | Value | |
| Description | | Shares | | | (Note 2) | |
| Fusion Acquisition Corp. II, Strike Price $11.50, Expires | | | | | | | | |
| 12/31/2027 | | | 2,846 | | | $ | 1,128 | |
| G Squared Ascend II, Inc., Strike Price $11.50, Expires | | | | | | | | |
| 12/31/2026 | | | 8,423 | | | | 4,210 | |
| Gelesis Holdings, Inc., Strike Price $11.50, Expires | | | | | | | | |
| 01/13/2027 | | | 1,941 | | | | 563 | |
| GigCapital5, Inc., Strike Price $11.50, Expires 12/31/2028 | | | 42,380 | | | | 15,685 | |
| GigInternational1, Inc., Strike Price $11.50, Expires | | | | | | | | |
| 12/31/2028 | | | 24,148 | | | | 9,670 | |
| Ginkgo Bioworks Holdings, Inc., Strike Price $11.50, Expires | | | | | | | | |
| 12/31/2027 | | | 8,936 | | | | 10,902 | |
| Global Consumer Acquisition Corp., Strike Price $11.50, | | | | | | | | |
| Expires 12/31/2027 | | | 12,376 | | | | 4,333 | |
| Global SPAC Partners Co., Strike Price $11.50, Expires | | | | | | | | |
| 11/30/2027 | | | 20,390 | | | | 6,321 | |
| Globis Acquisition Corp., Strike Price $11.50, Expires | | | | | | | | |
| 11/01/2025 | | | 37,823 | | | | 18,151 | |
| Golden Falcon Acquisition Corp., Strike Price $11.50, Expires | | | | | | | | |
| 11/04/2026 | | | 1,264 | | | | 493 | |
| Goldenbridge Acquisition, Ltd., Strike Price $11.50, Expires | | | | | | | | |
| 10/28/2025 | | | 29,011 | | | | 5,364 | |
| Graf Acquisition Corp. IV, Strike Price $11.50, Expires | | | | | | | | |
| 05/31/2028 | | | 9,664 | | | | 7,618 | |
| Greenrose Holding Co., Inc., Strike Price $11.50, Expires | | | | | | | | |
| 05/11/2024 | | | 74,128 | | | | 22,238 | |
| Growth Capital Acquisition Corp., Strike Price $11.50, Expires | | | | | | | | |
| 06/01/2027 | | | 10,873 | | | | 4,680 | |
| Healthcare Capital Corp., Strike Price $11.50, Expires | | | | | | | | |
| 03/08/2025 | | | 3,022 | | | | 1,027 | |
| Healthcare Services Acquisition Corp., Strike Price $11.50, | | | | | | | | |
| Expires 12/31/2027 | | | 933 | | | | 433 | |
| Hennessy Capital Investment Corp. V, Strike Price $11.50, | | | | | | | | |
| Expires 01/11/2026 | | | 7,105 | | | | 4,476 | |
| IG Acquisition Corp., Strike Price $11.50, Expires 10/05/2027 | | | 15,381 | | | | 6,152 | |
| Ignyte Acquisition Corp., Strike Price $11.50, Expires | | | | | | | | |
| 12/31/2027 | | | 1,733 | | | | 687 | |
| InterPrivate II Acquisition Corp., Strike Price $11.50, Expires | | | | | | | | |
| 12/31/2028 | | | 960 | | | | 470 | |
| InterPrivate III Financial Partners, Inc., Strike Price $11.50, | | | | | | | | |
| Expires 12/31/2027 | | | 1,067 | | | | 883 | |
| Isleworth Healthcare Acquisition Corp., Strike Price $11.50, | | | | | | | | |
| Expires 08/02/2027 | | | 19,686 | | | | 8,859 | |
| ITHAX Acquisition Corp., Strike Price $11.50, Expires | | | | | | | | |
| 12/31/2027 | | | 2,166 | | | | 704 | |
| Jack Creek Investment Corp., Strike Price $11.50, Expires | | | | | | | | |
| 12/31/2027 | | | 4,850 | | | | 1,649 | |
See Notes to Financial Statements.
| Semi-Annual Report | January 31, 2022 | 19 |
| RiverNorth Opportunities Fund, Inc. | Statement of Investments |
| | January 31, 2022 (Unaudited) |
| Description | | Shares | | | Value
(Note 2) | |
| Jasper Therapeutics, Inc., Strike Price $11.50, Expires | | | | | | | | |
| 12/01/2026 | | | 23,889 | | | $ | 17,081 | |
| Jaws Mustang Acquisition Corp., Strike Price $11.50, Expires | | | | | | | | |
| 01/30/2026 | | | 11,247 | | | | 7,646 | |
| Kadem Sustainable Impact Corp., Strike Price $11.50, Expires | | | | | | | | |
| 03/16/2026 | | | 13,653 | | | | 6,227 | |
| Kairos Acquisition Corp., Strike Price $11.50, Expires | | | | | | | | |
| 11/30/2027 | | | 4,998 | | | | 1,499 | |
| Kensington Capital Acquisition Corp. V, Strike Price $11.50, | | | | | | | | |
| Expires 07/19/2023 | | | 31,452 | | | | 18,557 | |
| Kingswood Acquisition Corp., Strike Price $11.50, Expires | | | | | | | | |
| 05/01/2027 | | | 15,057 | | | | 4,065 | |
| KINS Technology Group, Inc., Strike Price $11.50, Expires | | | | | | | | |
| 12/31/2025 | | | 6,297 | | | | 2,350 | |
| KKR Acquisition Holdings I Corp., Strike Price $11.50, Expires | | | | | | | | |
| 12/31/2027 | | | 7,083 | | | | 5,948 | |
| KL Acquisition Corp., Strike Price $11.50, Expires 01/12/2028 | | | 468 | | | | 229 | |
| KludeIn I Acquisition Corp., Strike Price $11.50, Expires | | | | | | | | |
| 08/07/2027 | | | 4,272 | | | | 1,538 | |
| L&F Acquisition Corp., Strike Price $11.50, Expires | | | | | | | | |
| 05/23/2027 | | | 9,060 | | | | 3,882 | |
| Lakeshore Acquisition I Corp., Strike Price $11.50, Expires | | | | | | | | |
| 04/30/2028 | | | 15,120 | | | | 8,770 | |
| LightJump Acquisition Corp., Strike Price $11.50, Expires | | | | | | | | |
| 12/31/2027 | | | 14,063 | | | | 4,640 | |
| Lionheart Acquisition Corp. II, Strike Price $11.50, Expires | | | | | | | | |
| 02/14/2026 | | | 16,661 | | | | 7,994 | |
| LMF Acquisition Opportunities, Inc., Strike Price $11.50, | | | | | | | | |
| Expires 01/31/2027 | | | 31,863 | | | | 9,874 | |
| Longview Acquisition Corp. II, Strike Price $11.50, Expires | | | | | | | | |
| 05/10/2026 | | | 805 | | | | 345 | |
| Malacca Straits Acquisition Co., Ltd., Strike Price $11.50, | | | | | | | | |
| Expires 06/30/2027 | | | 5,591 | | | | 1,861 | |
| Maquia Capital Acquisition Corp., Strike Price $11.50, Expires | | | | | | | | |
| 12/31/2027 | | | 7,755 | | | | 2,482 | |
| Marlin Technology Corp., Strike Price $11.50, Expires | | | | | | | | |
| 03/05/2026 | | | 822 | | | | 410 | |
| MDH Acquisition Corp., Strike Price $11.50, Expires | | | | | | | | |
| 02/02/2028 | | | 8,456 | | | | 2,806 | |
| Medicus Sciences Acquisition Corp., Strike Price $11.50, | | | | | | | | |
| Expires 12/31/2027 | | | 941 | | | | 453 | |
| Merida Merger Corp. I, Strike Price $11.50, Expires | | | | | | | | |
| 11/07/2026 | | | 30,682 | | | | 16,258 | |
| Minority Equality Opportunities Acquisition, Inc., Strike Price | | | | | | | | |
| $11.50, Expires 04/29/2023 | | | 50,249 | | | | 14,009 | |
See Notes to Financial Statements.
| RiverNorth Opportunities Fund, Inc. | Statement of Investments |
| | January 31, 2022 (Unaudited) |
| Description | | Shares | | | Value
(Note 2) | |
| Model Performance Acquisition Corp., Strike Price $11.50, | | | | | | | | |
| Expires 04/29/2026 | | | 20,306 | | | $ | 5,973 | |
| Monterey Bio Acquisition Corp., Strike Price $11.50, Expires | | | | | | | | |
| 06/07/2023 | | | 41,578 | | | | 10,810 | |
| Monument Circle Acquisition Corp., Strike Price $11.50, | | | | | | | | |
| Expires 12/31/2027 | | | 1,224 | | | | 490 | |
| Moringa Acquisition Corp., Strike Price $11.50, Expires | | | | | | | | |
| 02/10/2026 | | | 2,547 | | | | 1,206 | |
| New Vista Acquisition Corp., Strike Price $11.50, Expires | | | | | | | | |
| 12/31/2027 | | | 56 | | | | 25 | |
| Newbury Street Acquisition Corp., Strike Price $11.50, | | | | | | | | |
| Expires 12/31/2027 | | | 21,081 | | | | 9,486 | |
| Noble Rock Acquisition Corp., Strike Price $11.50, Expires | | | | | | | | |
| 12/31/2027 | | | 4,228 | | | | 1,649 | |
| North Atlantic Acquisition Corp., Strike Price $11.50, Expires | | | | | | | | |
| 10/20/2025 | | | 3,589 | | | | 1,504 | |
| NorthView Acquisition Corp., Strike Price $11.50, Expires | | | | | | | | |
| 10/21/2023 | | | 34,800 | | | | 6,960 | |
| OceanTech Acquisitions I Corp., Strike Price $11.50, Expires | | | | | | | | |
| 05/10/2026 | | | 48,836 | | | | 16,365 | |
| Omnichannel Acquisition Corp., Strike Price $11.50, Expires | | | | | | | | |
| 12/30/2027 | | | 10,040 | | | | 3,112 | |
| OppFi, Inc., Strike Price $11.50, Expires 08/31/2027 | | | 13,538 | | | | 11,100 | |
| Orion Biotech Opportunities Corp., Strike Price $11.50, | | | | | | | | |
| Expires 12/31/2027 | | | 8,409 | | | | 4,037 | |
| Osiris Acquisition Corp., Strike Price $11.50, Expires | | | | | | | | |
| 05/01/2028 | | | 23,946 | | | | 10,939 | |
| Oxbridge Acquisition Corp., Strike Price $11.50, Expires | | | | | | | | |
| 01/19/2023 | | | 52,752 | | | | 15,298 | |
| Oxus Acquisition Corp., Strike Price $11.50, Expires | | | | | | | | |
| 01/27/2023 | | | 53,236 | | | | 17,041 | |
| Oyster Enterprises Acquisition Corp., Strike Price $11.50, | | | | | | | | |
| Expires 12/31/2027 | | | 9,071 | | | | 3,493 | |
| P3 Health Partners, Inc., Strike Price $11.50, Expires | | | | | | | | |
| 01/31/2027 | | | 1,862 | | | | 1,433 | |
| Pear Therapeutics, Inc., Strike Price $11.50, Expires | | | | | | | | |
| 02/04/2026 | | | 10,359 | | | | 7,098 | |
| Periphas Capital Partnering Corp., Strike Price $28.75, | | | | | | | | |
| Expires 12/10/2028 | | | 2,535 | | | | 2,636 | |
| Phoenix Biotech Acquisition Corp., Strike Price $11.50, | | | | | | | | |
| Expires 09/01/2026 | | | 5,294 | | | | 1,932 | |
| PHP Ventures Acquisition Corp., Strike Price $11.50, Expires | | | | | | | | |
| 12/04/2023 | | | 25,567 | | | | 4,922 | |
| Pivotal Investment Corp. III, Strike Price $11.50, Expires | | | | | | | | |
| 12/31/2027 | | | 33 | | | | 21 | |
See Notes to Financial Statements.
| Semi-Annual Report | January 31, 2022 | 21 |
| RiverNorth Opportunities Fund, Inc. | Statement of Investments |
| | January 31, 2022 (Unaudited) |
| Description | | Shares | | | Value
(Note 2) | |
| Post Holdings Partnering Corp., Strike Price $11.50, Expires | | | | | | | | |
| 02/09/2023 | | | 4,053 | | | $ | 2,229 | |
| Priveterra Acquisition Corp., Strike Price $11.50, Expires | | | | | | | | |
| 12/31/2027 | | | 2,250 | | | | 1,055 | |
| Procaps Group SA, Strike Price $11.50, Expires 12/31/2026 | | | 5,982 | | | | 3,769 | |
| Progress Acquisition Corp., Strike Price $11.50, Expires | | | | | | | | |
| 12/31/2027 | | | 4,219 | | | | 1,561 | |
| Property Solutions Acquisition Corp. II, Strike Price $11.50, | | | | | | | | |
| Expires 03/01/2026 | | | 15,042 | | | | 6,017 | |
| PropTech Investment Corp. II, Strike Price $11.50, Expires | | | | | | | | |
| 12/31/2027 | | | 4,162 | | | | 1,602 | |
| Prospector Capital Corp., Strike Price $11.50, Expires | | | | | | | | |
| 01/01/2025 | | | 468 | | | | 213 | |
| Quantum FinTech Acquisition Corp., Strike Price $11.50, | | | | | | | | |
| Expires 12/31/2027 | | | 30,397 | | | | 9,405 | |
| Recharge Acquisition Corp., Strike Price $11.50, Expires | | | | | | | | |
| 10/05/2027 | | | 7,690 | | | | 3,229 | |
| RedBall Acquisition Corp., Strike Price $11.50, Expires | | | | | | | | |
| 08/17/2022 | | | 6,609 | | | | 4,429 | |
| REE Automotive, Ltd., Strike Price $11.50, Expires | | | | | | | | |
| 07/22/2026 | | | 17,980 | | | | 13,125 | |
| Renovacor, Inc., Strike Price $11.50, Expires 03/05/2025 | | | 29,794 | | | | 15,383 | |
| Revelation Biosciences, Inc., Strike Price $11.50, Expires | | | | | | | | |
| 05/25/2027 | | | 29,221 | | | | 5,260 | |
| RMG Acquisition Corp. III, Strike Price $11.50, Expires | | | | | | | | |
| 12/31/2027 | | | 69 | | | | 38 | |
| SAB Biotherapeutics, Inc., Strike Price $11.50, Expires | | | | | | | | |
| 12/07/2025 | | | 10,367 | | | | 11,300 | |
| Sanaby Health Acquisition Corp. I, Strike Price $11.50, | | | | | | | | |
| Expires 07/30/2028 | | | 4,791 | | | | 1,748 | |
| Sandbridge X2 Corp., Strike Price $11.50, Expires 12/31/2027 | | | 5,790 | | | | 2,895 | |
| Satellogic, Inc., Strike Price $11.50, Expires 01/25/2027 | | | 1,344 | | | | 605 | |
| ScION Tech Growth I, Strike Price $11.50, Expires | | | | | | | | |
| 11/01/2025 | | | 2,087 | | | | 938 | |
| ScION Tech Growth II, Strike Price $11.50, Expires | | | | | | | | |
| 01/28/2026 | | | 13,566 | | | | 6,783 | |
| Senior Connect Acquisition Corp. I, Strike Price $11.50, | | | | | | | | |
| Expires 12/31/2027 | | | 24,418 | | | | 11,232 | |
| Shapeways Holdings, Inc., Strike Price $11.50, Expires | | | | | | | | |
| 10/31/2026 | | | 9,373 | | | | 2,999 | |
| Silver Spike Acquisition Corp. II, Strike Price $11.50, Expires | | | | | | | | |
| 02/26/2026 | | | 1,690 | | | | 768 | |
| Sky Harbour Group Corp., Strike Price $11.50, Expires | | | | | | | | |
| 10/21/2025 | | | 12,144 | | | | 5,738 | |
| Sonder Holdings, Inc., Strike Price $11.50, Expires | | | | | | | | |
| 01/31/2028 | | | 806 | | | | 693 | |
See Notes to Financial Statements.
| RiverNorth Opportunities Fund, Inc. | Statement of Investments |
| | January 31, 2022 (Unaudited) |
| Description | | Shares | | | Value
(Note 2) | |
| SportsMap Tech Acquisition Corp., Strike Price $11.50, | | | | | | | | |
| Expires 09/01/2027 | | | 10,806 | | | $ | 4,160 | |
| SportsTek Acquisition Corp., Strike Price $11.50, Expires | | | | | | | | |
| 12/31/2027 | | | 6,368 | | | | 2,363 | |
| Super Group SGHC, Ltd., Strike Price $11.50, Expires | | | | | | | | |
| 01/28/2027 | | | 15,926 | | | | 27,074 | |
| Sustainable Development Acquisition I Corp., Strike Price | | | | | | | | |
| $11.50, Expires 12/31/2028 | | | 1,369 | | | | 493 | |
| SVF Investment Corp., Strike Price $11.50, Expires | | | | | | | | |
| 12/31/2027 | | | 56 | | | | 43 | |
| Tailwind Acquisition Corp., Strike Price $11.50, Expires | | | | | | | | |
| 09/07/2027 | | | 6,549 | | | | 1,933 | |
| Tailwind International Acquisition Corp., Strike Price $11.50, | | | | | | | | |
| Expires 03/01/2028 | | | 1,130 | | | | 418 | |
| Tastemaker Acquisition Corp., Strike Price $11.50, Expires | | | | | | | | |
| 01/07/2027 | | | 16,945 | | | | 6,695 | |
| Tech and Energy Transition Corp., Strike Price $11.50, | | | | | | | | |
| Expires 12/31/2027 | | | 9,017 | | | | 3,962 | |
| Tekkorp Digital Acquisition Corp., Strike Price $11.50, Expires | | | | | | | | |
| 10/26/2027 | | | 12,144 | | | | 5,099 | |
| TG Venture Acquisition Corp., Strike Price $11.50, Expires | | | | | | | | |
| 08/13/2023 | | | 25,664 | | | | 7,435 | |
| Thayer Ventures Acquisition Corp., Strike Price $11.50, | | | | | | | | |
| Expires 01/01/2030 | | | 9,455 | | | | 4,633 | |
| Tuscan Holdings Corp. II, Strike Price $11.50, Expires | | | | | | | | |
| 07/16/2025 | | | 46,319 | | | | 13,900 | |
| Twelve Seas Investment Co. II, Strike Price $11.50, Expires | | | | | | | | |
| 03/02/2028 | | | 2,277 | | | | 823 | |
| Valens Semiconductor, Ltd., Strike Price $11.50, Expires | | | | | | | | |
| 09/30/2026 | | | 32,769 | | | | 14,091 | |
| VectoIQ Acquisition Corp. II, Strike Price $11.50, Expires | | | | | | | | |
| 12/31/2027 | | | 280 | | | | 134 | |
| Ventoux CCM Acquisition Corp., Strike Price $11.50, Expires | | | | | | | | |
| 09/30/2025 | | | 35,388 | | | | 12,386 | |
| Venus Acquisition Corp., Strike Price $11.50, Expires | | | | | | | | |
| 12/31/2027 | | | 16,878 | | | | 3,038 | |
| VEW AG, Strike Price $11.50, Expires 02/28/2026 | | | 1,048 | | | | 419 | |
| Vickers Vantage Corp. I, Strike Price $11.50, Expires | | | | | | | | |
| 12/31/2027 | | | 35,109 | | | | 8,372 | |
| Vistas Media Acquisition Co., Inc., Strike Price $11.50, | | | | | | | | |
| Expires 08/01/2026 | | | 25,796 | | | | 9,029 | |
| Viveon Health Acquisition Corp., Strike Price $11.50, Expires | | | | | | | | |
| 12/31/2027 | | | 32,618 | | | | 4,889 | |
| Waverley Capital Acquisition Corp. 1, Strike Price $11.50, | | | | | | | | |
| Expires 04/30/2027 | | | 17,165 | | | | 7,724 | |
See Notes to Financial Statements.
| Semi-Annual Report | January 31, 2022 | 23 |
| RiverNorth Opportunities Fund, Inc. | Statement of Investments |
| | January 31, 2022 (Unaudited) |
| Description | | | | | Shares | | | Value
(Note 2) | |
| WinVest Acquisition Corp., Strike Price $11.50, Expires | | | | | | | | | | | | |
| 02/19/2023 | | | | | | | 52,742 | | | $ | 6,825 | |
| Z-Work Acquisition Corp., Strike Price $11.50, Expires | | | | | | | | | | | | |
| 01/04/2026 | | | | | | | 579 | | | | 253 | |
| TOTAL WARRANTS | | | | | | | | | | | | |
| (Cost $1,912,017) | | | | | | | | | | | 1,106,764 | |
| Description | | | 7-Day
Yield | | | | Shares | | | | Value
(Note 2) | |
| SHORT-TERM INVESTMENTS (2.83%) | | | | | | | | | | | | |
| State Street Institutional Treasury Money Market | | | | | | | | | | | | |
| Fund | | | 0.010% | | | | 7,926,758 | | | | 7,926,758 | |
| | | | | | | | | | | | | |
| TOTAL SHORT-TERM INVESTMENTS | | | | | | | | | | | | |
| (Cost $7,926,758) | | | | | | | | | | | 7,926,758 | |
| | | | | | | | | | | | | |
| TOTAL INVESTMENTS (111.09%) | | | | | | | | | | | | |
| (Cost $307,529,557) | | | | | | | | | | $ | 311,100,654 | |
| | | | | | | | | | | | | |
| Liabilities in Excess of Other Assets (-11.09%)(e) | | | | | | | | | | | (31,066,047 | ) |
| NET ASSETS (100.00%) | | | | | | | | | | $ | 280,034,607 | |
SCHEDULE OF SECURITIES SOLD SHORT
| Description | | Shares | | | Value
(Note 2) | |
| EXCHANGE TRADED FUNDS - COMMON SHARES (-8.82%) | | | | | | | | |
| Invesco S&P 500 Equal Weight ETF | | | (74,509 | ) | | $ | (11,596,581 | ) |
| iShares Russell 1000 Growth ETF | | | (24,455 | ) | | | (6,824,412 | ) |
| Energy Select Sector SPDR® Fund | | | (39,637 | ) | | | (2,612,871 | ) |
| SPDR S&P 500 ETF Trust | | | (4,252 | ) | | | (1,913,017 | ) |
| SPDR® Barclays Capital Convertible Securities ETF | | | (22,728 | ) | | | (1,745,965 | ) |
| | | | | | | | | |
| TOTAL EXCHANGE TRADED FUNDS - COMMON SHARES | | | | | | | (24,692,846 | ) |
| | | | | | | | | |
| TOTAL SECURITIES SOLD SHORT | | | | | | | | |
| (Proceeds $25,139,739) | | | | | | $ | (24,692,846 | ) |
| | | | | | | | | |
| (a) | All or a portion of the security is pledged as collateral for the loan payable. As of January 31, 2022, the aggregate value of those securities was $59,307,250, representing 21.18% of net assets. |
| (b) | All or a portion of the security is pledged as collateral for securities sold short. As of January 31, 2022, the aggregate value of those securities was $12,592,650 representing 4.50% of net assets. |
| (c) | Restricted security (see Note 7) |
| (d) | Non-income producing security. |
| (e) | Includes cash, in the amount of $23,892,443 which is being held as collateral for securities sold short. |
See Notes to Financial Statements.
| RiverNorth Opportunities Fund, Inc. | |
| Statement of Assets and Liabilities | | January 31, 2022 (Unaudited) |
| ASSETS: | | | |
| Investments, at value | | $ | 311,100,654 | |
| Cash | | | 316,764 | |
| Deposit with broker for securities sold short | | | 23,892,443 | |
| Receivable for investments sold | | | 734,751 | |
| Interest receivable | | | 110,221 | |
| Dividends receivable | | | 121,619 | |
| Deferred offering costs (Note 6) | | | 5,367 | |
| Prepaid and other assets | | | 23,886 | |
| Total Assets | | | 336,305,705 | |
| | | | | |
| LIABILITIES: | | | | |
| Securities sold short (Proceeds $25,139,739) | | | 24,692,846 | |
| Loan payable (Note 4) | | | 30,000,000 | |
| Payable for interest on loan | | | 11,700 | |
| Payable for investments purchased | | | 1,074,090 | |
| Payable to adviser | | | 267,719 | |
| Payable to administrator | | | 94,403 | |
| Payable to transfer agent | | | 10,674 | |
| Payable for director fees | | | 31,451 | |
| Payable for custodian fees | | | 30,315 | |
| Payable for professional fees | | | 37,026 | |
| Payable for printing fees | | | 14,342 | |
| Other payables | | | 6,532 | |
| Total Liabilities | | | 56,271,098 | |
| Net Assets | | $ | 280,034,607 | |
| | | | | |
| NET ASSETS CONSIST OF: | | | | |
| Paid-in capital | | $ | 285,889,667 | |
| Total distributable earnings/(accumulated deficit) | | | (5,855,060 | ) |
| Net Assets | | $ | 280,034,607 | |
| PRICING OF SHARES: | | | | |
| Net Assets | | $ | 280,034,607 | |
| Shares of common stock outstanding (37,500,000 of shares authorized, at | | | | |
| $0.0001 par value per share) | | | 17,693,323 | |
| Net asset value per share | | $ | 15.83 | |
| | | | | |
| Cost of Investments | | $ | 307,529,557 | |
See Notes to Financial Statements.
| Semi-Annual Report | January 31, 2022 | 25 |
| RiverNorth Opportunities Fund, Inc. | Statement of Operations |
| | For the Six Months Ended January 31, 2022 (Unaudited) |
| INVESTMENT INCOME: | | | |
| Interest | | $ | 305,010 | |
| Dividends | | | 5,805,726 | |
| Total Investment Income | | | 6,110,736 | |
| | | | | |
| EXPENSES: | | | | |
| Investment advisory fees | | | 1,306,101 | |
| Administration fees | | | 208,801 | |
| Transfer agent fees | | | 11,402 | |
| Dividend and interest expense - short sales | | | 302,635 | |
| Interest expense on loan | | | 52,336 | |
| Audit and tax fees | | | 13,796 | |
| Legal fees | | | 53,744 | |
| Custodian fees | | | 20,798 | |
| Director fees | | | 75,470 | |
| Printing fees | | | 38,095 | |
| Insurance fees | | | 14,144 | |
| Other expenses | | | 16,615 | |
| Total Expenses | | | 2,113,937 | |
| Net Investment Income | | | 3,996,799 | |
| | | | | |
| REALIZED AND UNREALIZED GAIN/(LOSS) ON INVESTMENTS: | | | | |
| Net realized gain/(loss) on: | | | | |
| Investments | | | 3,605,854 | |
| Securities sold short | | | (1,596,282 | ) |
| Net realized gain | | | 2,009,572 | |
| Net change in unrealized appreciation/depreciation on: | | | | |
| Investments | | | (8,193,309 | ) |
| Securities sold short | | | 1,459,819 | |
| Net change in unrealized appreciation/depreciation | | | (6,733,490 | ) |
| Net Realized and Unrealized Loss on Investments | | | (4,723,918 | ) |
| Net Decrease in Net Assets Resulting from Operations | | $ | (727,119 | ) |
See Notes to Financial Statements.
| RiverNorth Opportunities Fund, Inc. | |
| Statements of Changes in Net Assets | |
| | | For the Six | | | | |
| | | Months Ended | | | For the | |
| | | January 31, 2022 | | | Year Ended | |
| | | (Unaudited) | | | July 31, 2021 | |
| OPERATIONS: | | | | | | | | |
| Net investment income | | $ | 3,996,799 | | | $ | 3,196,208 | |
| Net realized gain | | | 2,009,572 | | | | 26,397,453 | |
| Long-term capital gains from other investment | | | | | | | | |
| companies | | | — | | | | 508,694 | |
| Net change in unrealized appreciation/depreciation | | | (6,733,490 | ) | | | 12,670,994 | |
| Net increase/(decrease) in net assets resulting from | | | | | | | | |
| operations | | | (727,119 | ) | | | 42,773,349 | |
| | | | | | | | | |
| TOTAL DISTRIBUTIONS TO SHAREHOLDERS: | | | | | | | | |
| From distributable earnings | | | (19,832,731 | ) | | | (21,846,422 | ) |
| Net decrease in net assets from distributions to | | | | | | | | |
| shareholders | | | (19,832,731 | ) | | | (21,846,422 | ) |
| CAPITAL SHARE TRANSACTIONS: | | | | | | | | |
| Proceeds from sales of shares, net of offering costs | | | 88,076,127 | | | | 50,679,487 | |
| Dividend Reinvestment | | | 807,077 | | | | 938,369 | |
| Net increase in net assets from capital share | | | | | | | | |
| transactions | | | 88,883,204 | | | | 51,617,856 | |
| Net Increase in Net Assets | | | 68,323,354 | | | | 72,544,783 | |
| | | | | | | | | |
| NET ASSETS: | | | | | | | | |
| Beginning of period | | | 211,711,253 | | | | 139,166,470 | |
| End of period | | $ | 280,034,607 | | | $ | 211,711,253 | |
| OTHER INFORMATION: | | | | | | | | |
| Share Transactions: | | | | | | | | |
| Shares outstanding - beginning of period | | | 12,436,466 | | | | 9,348,465 | |
| Shares issued in connection with public offering | | | 5,209,102 | | | | 3,031,356 | |
| Shares issued as reinvestment of dividends | | | 47,755 | | | | 56,645 | |
| Shares outstanding - end of period | | | 17,693,323 | | | | 12,436,466 | |
See Notes to Financial Statements.
| Semi-Annual Report | January 31, 2022 | 27 |
| RiverNorth Opportunities Fund, Inc. | Statement of Cash Flows |
| | For the Six Months Ended January 31, 2022 (Unaudited) |
| CASH FLOWS FROM OPERATING ACTIVITIES: | | | |
| Net decrease in net assets resulting from operations | | $ | (727,119 | ) |
| Adjustments to reconcile net decrease in net assets from operations to net cash used in operating activities: | | | | |
| Purchases of investment securities | | | (273,036,755 | ) |
| Proceeds from disposition of investment securities | | | 166,127,914 | |
| Proceeds from securities sold short transactions | | | 47,964,184 | |
| Purchases to cover securities sold short transactions | | | (46,380,704 | ) |
| Amortization of premium and accretion of discount on investments | | | (118,690 | ) |
| Net realized (gain)/loss on: | | | | |
| Investments | | | (3,605,854 | ) |
| Securities sold short | | | 1,596,282 | |
| Net change in unrealized (appreciation)/depreciation on: | | | | |
| Investments | | | 8,193,309 | |
| Securities sold short | | | (1,459,819 | ) |
| (Increase)/Decrease in assets: | | | | |
| Interest receivable | | | 6,888 | |
| Capital Stock Receivable | | | 863,784 | |
| Deferred offering costs | | | 10,788 | |
| Dividends receivable | | | 1,234 | |
| Prepaid and other assets | | | (12,325 | ) |
| Increase/(Decrease) in liabilities: | | | | |
| Payable for custodian fees | | | 20,798 | |
| Payable for interest on loan | | | 11,700 | |
| Payable for professional fees | | | (1,860 | ) |
| Payable for printing fees | | | (1,647 | ) |
| Payable to transfer agent | | | 7,404 | |
| Payable to adviser | | | 89,281 | |
| Payable to administrator | | | 58,020 | |
| Payable for director fees | | | (2,299 | ) |
| Other payables | | | (9,171 | ) |
| Net cash used in operating activities | | $ | (100,404,657 | ) |
| | | | | |
| CASH FLOWS USED IN FINANCING ACTIVITIES: | | | | |
| Cash provided by loan | | $ | 45,000,000 | |
| Cash used by loan | | $ | (15,000,000 | ) |
| Proceeds from sale of shares, net of offering costs | | | 87,849,231 | |
| Cash distributions paid | | $ | (19,025,654 | ) |
| Net cash provided by financing activities | | $ | 98,823,577 | |
| | | | | |
| Net decrease in cash and restricted cash | | $ | (1,581,080 | ) |
| Cash and restricted cash, beginning balance | | $ | 25,790,287 | |
| Cash and restricted cash, ending balance | | $ | 24,209,207 | |
See Notes to Financial Statements.
| RiverNorth Opportunities Fund, Inc. | Statement of Cash Flows |
| | For the Six Months Ended January 31, 2022 (Unaudited) |
| SUPPLEMENTAL DISCLOSURE OF CASH FLOW INFORMATION: | | | |
| Cash paid during the period for interest from loans | | $ | 40,636 | |
| Noncash financing activities not included herein consist of reinvestment of dividends and distributions of: | | $ | 807,077 | |
| | | | | |
| Reconciliation of restricted and unrestricted cash at the beginning of period to the statement of assets and liabilities | | | | |
| Deposit with broker for securities sold short | | $ | 25,790,287 | |
| | | | | |
| Reconciliation of restricted and unrestricted cash at the end of the period to the statement of assets and liabilities | | | | |
| Cash | | $ | 316,764 | |
| Deposit with broker for securities sold short | | $ | 23,892,443 | |
See Notes to Financial Statements.
| Semi-Annual Report | January 31, 2022 | 29 |
| |
| RiverNorth Opportunities Fund, Inc. | Financial Highlights |
| | For a share outstanding throughout the periods presented. |
| Net asset value - beginning of period |
| Income/(loss) from investment operations: |
| Net investment income(b) |
| Net realized and unrealized gain/(loss) |
| Total income/(loss) from investment operations |
| Less distributions to shareholders: |
| From net investment income |
| From net realized gains |
| From tax return of capital |
| Total distributions |
| Capital share transactions: |
| Dilutive effect of rights offering |
| Common share offering costs charged to paid-in capital |
| Total capital share transactions |
| Net increase/(decrease) in net asset value |
| Net asset value - end of period |
| Market price - end of period |
| Total Return - Net Asset Value(i) |
|
| Total Return - Market Price(i) |
| Supplemental Data: |
| Net assets, end of period (in thousands) |
| Ratios to Average Net Assets (including dividend expense and line of credit expense) |
| Total expenses |
| Net investment income |
| Ratios to Average Net Assets (excluding dividend expense and line of credit expense) |
| Total expenses |
| Net investment income |
Portfolio turnover rate Borrowings at End of Period |
| Loan Payable (in thousands) |
| Asset Coverage Per $1,000 of loan payable (in thousands)(l) |
| See Notes to Financial Statements. | |
| 30 | www.rivernorthcef.com |
| |
| RiverNorth Opportunities Fund, Inc. | Financial Highlights |
| | For a share outstanding throughout the periods presented. |
For the Six
Months Ended
January 31, 2022
(Unaudited) | | | For the
Year Ended
July 31, 2021 | | | For the
Year Ended
July 31, 2020 | | | For the
Year Ended
July 31, 2019 | | | For the
Period Ended
July 31, 2018(a) | | | For the
Year Ended
October 31, 2017 | |
| $ | 17.02 | | | $ | 14.89 | | | $ | 17.39 | | | $ | 19.07 | | | $ | 20.48 | | | $ | 19.72 | |
| | 0.27 | | | | 0.31 | | | | 0.41 | | | | 0.55 | | | | 0.44 | | | | 0.42 | |
| | (0.06 | ) | | | 4.03 | | | | (0.56 | ) | | | 0.29 | | | | 0.40 | | | | 2.23 | |
| | 0.21 | | | | 4.34 | | | | (0.15 | ) | | | 0.84 | | | | 0.84 | | | | 2.65 | |
| | (1.02 | ) | | | (0.72 | ) | | | (0.51 | ) | | | (0.63 | ) | | | (0.47 | ) | | | (0.53 | ) |
| | (0.24 | ) | | | (1.37 | ) | | | (0.00 | )(c) | | | (0.41 | ) | | | (1.34 | ) | | | (1.36 | ) |
| | – | | | | – | | | | (1.60 | ) | | | (1.20 | ) | | | (0.08 | ) | | | – | |
| | (1.26 | ) | | | (2.09 | ) | | | (2.11 | ) | | | (2.24 | ) | | | (1.89 | ) | | | (1.89 | ) |
| | (0.12 | )(d) | | | (0.08 | )(e) | | | (0.21 | )(f) | | | (0.26 | )(g) | | | (0.32 | )(h) | | | – | |
| | (0.02 | ) | | | (0.04 | ) | | | (0.03 | ) | | | (0.02 | ) | | | (0.04 | ) | | | – | |
| | (0.14 | ) | | | (0.12 | ) | | | (0.24 | ) | | | (0.28 | ) | | | (0.36 | ) | | | – | |
| | (1.19 | ) | | | 2.13 | | | | (2.50 | ) | | | (1.68 | ) | | | (1.41 | ) | | | 0.76 | |
| $ | 15.83 | | | $ | 17.02 | | | $ | 14.89 | | | $ | 17.39 | | | $ | 19.07 | | | $ | 20.48 | |
| $ | 16.20 | | | $ | 18.21 | | | $ | 14.81 | | | $ | 17.38 | | | $ | 19.14 | | | $ | 20.50 | |
| | 0.35 | %(j) | | | 30.09 | % | | | (1.75 | %) | | | 3.77 | % | | | 2.56 | %(j) | | | 14.11 | % |
| | (4.01 | %)(j) | | | 39.94 | % | | | (2.22 | %) | | | 3.33 | % | | | 2.84 | %(j) | | | 14.63 | % |
| $ | 280,035 | | | $ | 211,711 | | | $ | 139,166 | | | $ | 124,664 | | | $ | 101,624 | | | $ | 76,927 | |
| | 1.67 | %(k) | | | 1.91 | % | | | 2.06 | % | | | 2.17 | % | | | 2.07 | %(k) | | | 2.21 | % |
| | 3.16 | %(k) | | | 1.87 | % | | | 2.59 | % | | | 3.11 | % | | | 3.03 | %(k) | | | 2.03 | % |
| | 1.39 | %(k) | | | 1.45 | % | | | 1.54 | % | | | 1.56 | % | | | 1.72 | %(k) | | | 1.75 | % |
| | 3.44 | %(k) | | | 2.33 | % | | | 3.11 | % | | | 3.72 | % | | | 2.68 | %(k) | | | 1.57 | % |
| | 68 | %(j) | | | 190 | % | | | 133 | % | | | 76 | % | | | 74 | %(j) | | | 162 | % |
| $ | 30,000 | | | | – | | | $ | 7,500 | | | | – | | | | – | | | | – | |
| | 10,334 | | | | – | | | | 19,556 | | | | – | | | | – | | | | – | |
| See Notes to Financial Statements. | |
| Semi-Annual Report | January 31, 2022 | 31 |
| |
| RiverNorth Opportunities Fund, Inc. | Financial Highlights |
| | For a share outstanding throughout the periods presented. |
| (a) | Effective July 16, 2018, the Board approved changing the fiscal year-end of the Fund from October 31 to July 31. |
| (b) | Calculated using average shares throughout the period. |
| (c) | Less than ($0.005) per share. |
| (d) | Represents the impact of the Fund's rights offering of 4,373,407 common shares in November 2021 at a subscription price per share based on a formula. For more details, please refer to Note 6 of the Notes to Financial Statements. |
| (e) | Represents the impact of the Fund's rights offering of 575,706 common shares in November 2020 at a subscription price per share based on a formula. For more details, please refer to Note 6 of the Notes to Financial Statements. |
| (f) | Represents the impact of the Fund's rights offering of 2,163,193 common shares in November 2019 at a subscription price per share based on a formula. |
| (g) | Represents the impact of the Fund's rights offering of 1,790,000 common shares in November 2018. |
| (h) | Represents the impact of the Fund's rights offering of 1,564,710 common shares in November 2017. |
| (i) | Total investment return is calculated assuming a purchase of a common share at the opening on the first day and a sale at closing on the last day of each period reported. For purposes of this calculation, dividends and distributions, if any, are assumed to be reinvested at prices obtained under the Fund’s dividend reinvestment plan. Total investment returns do not reflect brokerage commissions, if any. Periods less than one year are not annualized. |
| (l) | Calculated by subtracting the Fund's total liabilities (excluding the principal amount of Loan Payable) from the Fund's total assets and dividing by the principal amount of the Loan Payable and then multiplying by $1,000. |
| See Notes to Financial Statements. | |
| 32 | www.rivernorthcef.com |
| |
| RiverNorth Opportunities Fund, Inc. | Notes to Financial Statements |
| | January 31, 2022 (Unaudited) |
1. ORGANIZATION
RiverNorth Opportunities Fund, Inc. (the “Fund”) is a Maryland corporation registered as a diversified, closed-end management investment company under the Investment Company Act of 1940, as amended (the “1940 Act”).
The Fund’s investment objective is total return consisting of capital appreciation and current income. The Fund seeks to achieve its investment objective by pursuing a tactical asset allocation strategy and opportunistically investing under normal circumstances in closed-end funds, exchange-traded funds (“ETFs), business development companies (“BDCs” and collectively, "Underlying Funds") and special purpose acquisition companies ("SPACs"). All Underlying Funds are registered under the Securities Act of 1933, as amended (the “Securities Act”). The Fund incurs higher and additional expenses when it invests in Underlying Funds. There is also the risk that the Fund may suffer losses due to the investment practices or operations of the Underlying Funds. To the extent that the Fund invests in one or more Underlying Funds that concentrate in a particular industry, the Fund would be vulnerable to factors affecting that industry and the concentrating Underlying Funds’ performance, and that of the Fund, may be more volatile than Underlying Funds that do not concentrate. In addition, one Underlying Fund may purchase a security that another Underlying Fund is selling.
The Fund may be converted to an open-end investment company at any time if approved by two-thirds of the Fund's Board of Directors (the "Board") and at least two-thirds of the Fund’s total outstanding shares. If the Fund converted to an open-end investment company, it would be required to redeem all preferred stock of the Fund then outstanding, if any (requiring in turn that it liquidate a portion of its investment portfolio). Conversion to open-end status could also require the Fund to modify certain investment restrictions and policies. The Board may at any time (but is not required to) propose conversion of the Fund to open-end status, depending upon its judgment regarding the advisability of such action in light of circumstances then prevailing.
Under normal circumstances, the Fund intends to maintain long positions in Underlying Funds, but may engage in short sales for investment purposes. When the Fund engages in a short sale, it sells a security it does not own and, to complete the sale, borrows the same security from a broker or other institution. The Fund may benefit from a short position when the shorted security decreases in value.
2. SIGNIFICANT ACCOUNTING POLICIES
Use of Estimates: The preparation of the financial statements in accordance with accounting principles generally accepted in the United States of America (“GAAP”) requires management to make estimates and assumptions that affect the reported amounts and disclosures, including the disclosure of contingent assets and liabilities, in the financial statements during the period reported. Management believes the estimates and security valuations are appropriate; however, actual results may differ from those estimates, and the security valuations reflected in the financial statements may differ from the value the Fund ultimately realizes upon sale of the securities. The Fund is considered an investment company under GAAP and follows the accounting and reporting guidance applicable to investment companies in the Financial Accounting Standards Board
| Semi-Annual Report | January 31, 2022 | 33 |
| |
| RiverNorth Opportunities Fund, Inc. | Notes to Financial Statements |
| | January 31, 2022 (Unaudited) |
Accounting Standards Codification Topic 946. The financial statements have been prepared as of the close of the New York Stock Exchange (“NYSE”) on January 31, 2022.
Portfolio Valuation: The net asset value per share of the Fund is determined daily, on each day that the NYSE is open for trading, as of the close of regular trading on the NYSE (normally 4:00 p.m. New York time). The Fund’s net asset value per share is calculated by dividing the value of the Fund’s total assets, less its liabilities by the number of shares outstanding.
The Board has established the following procedures for valuation of the Fund’s assets under normal market conditions. Marketable securities listed on foreign or U.S. securities exchanges generally are valued at closing sale prices or, if there were no sales, at the mean between the closing bid and ask prices on the exchange where such securities are primarily traded. Fixed income securities, including corporate bonds and convertible corporate bonds are normally valued on the basis of quotes obtained from brokers and dealers or independent pricing services. If the independent primary or secondary pricing service is unable to provide a price for a security, if the price provided by the independent primary or secondary pricing service is deemed unreliable, or if events occurring after the close of the market for a security but before the time as of which the Fund values its shares would materially affect net asset value, such security will be valued at its fair value as determined in good faith under procedures approved by the Board.
When applicable, fair value of an investment is determined by the Fund’s Fair Valuation Committee as a designee of the Board. In fair valuing the Fund’s investments, consideration is given to several factors, which may include, among others, the following: the fundamental business data relating to the issuer, borrower, or counterparty; an evaluation of the forces which influence the market in which the investments are purchased and sold; the type, size and cost of the investment; the information as to any transactions in or offers for the investment; the price and extent of public trading in similar securities (or equity securities) of the issuer, or comparable companies; the coupon payments, yield data/cash flow data; the quality, value and saleability of collateral, if any, securing the investment; the business prospects of the issuer, borrower, or counterparty, as applicable, including any ability to obtain money or resources from a parent or affiliate and an assessment of the issuer’s, borrower’s, or counterparty’s management; the prospects for the industry of the issuer, borrower, or counterparty, as applicable, and multiples (of earnings and/or cash flow) being paid for similar businesses in that industry; one or more independent broker quotes for the sale price of the portfolio security; and other relevant factors.
Securities Transactions and Investment Income: Investment security transactions are accounted for on a trade date basis. Dividend income is recorded on the ex-dividend date. Interest income, which includes accretion of discounts and amortization of premiums calculated using yield to maturity, is accrued and recorded as earned. Realized gains and losses from securities transactions and unrealized appreciation and depreciation of securities are determined using the specific identification method for both financial reporting and tax purposes.
Fair Value Measurements: Investments in the Fund are recorded at their estimated fair value. The Fund discloses the classification of its fair value measurements following a three-tier hierarchy based on the inputs used to measure fair value. Inputs refer broadly to the assumptions that market participants would use in pricing the asset or liability, including assumptions about risk. Inputs may be observable or unobservable. Observable inputs reflect the assumptions market participants would use in pricing the asset or liability that are developed based on market data obtained from
| |
| RiverNorth Opportunities Fund, Inc. | Notes to Financial Statements |
| | January 31, 2022 (Unaudited) |
sources independent of the reporting entity. Unobservable inputs reflect the reporting entity’s own assumptions about the assumptions market participants would use in pricing the asset or liability that are developed based on the best information available.
Various inputs are used in determining the value of the Fund’s investments as of the end of the reporting period. When inputs used fall into different levels of the fair value hierarchy, the level in the hierarchy within which the fair value measurement falls is determined based on the lowest level input that is significant to the fair value measurement in its entirety. The designated input levels are not necessarily an indication of the risk or liquidity associated with these investments.
These inputs are categorized in the following hierarchy under applicable financial accounting standards:
| Level 1 – | Unadjusted quoted prices in active markets for identical investments, unrestricted assets or liabilities that the Fund has the ability to access at the measurement date; |
| Level 2 – | Quoted prices which are not active, quoted prices for similar assets or liabilities in active markets or inputs other than quoted prices that are observable (either directly or indirectly) for substantially the full term of the asset or liability; and |
| Level 3 – | Significant unobservable prices or inputs (including the Fund’s own assumptions in determining the fair value of investments) where there is little or no market activity for the asset or liability at the measurement date. |
| Semi-Annual Report | January 31, 2022 | 35 |
| |
| RiverNorth Opportunities Fund, Inc. | Notes to Financial Statements |
| | January 31, 2022 (Unaudited) |
The following is a summary of the inputs used to value the Fund’s investments as of January 31, 2022:
| Investments in Securities at Value | | Level 1 -
Quoted Prices | | | Level 2 -
Other Significant
Observable
Inputs | | | Level 3 -
Significant
Unobservable
Inputs | | | Total | |
| Closed-End Funds - Common | | | | | | | | | | | | | | | | |
| Shares | | $ | 187,534,940 | | | $ | 7,452 | | | $ | – | | | $ | 187,542,392 | |
| Business Development | | | | | | | | | | | | | | | | |
| Companies - Common | | | | | | | | | | | | | | | | |
| Shares | | | 3,946,538 | | | | – | | | | – | | | | 3,946,538 | |
| Business Development | | | | | | | | | | | | | | | | |
| Companies - Preferred | | | | | | | | | | | | | | | | |
| Shares | | | 879,881 | | | | – | | | | – | | | | 879,881 | |
| Business Development | | | | | | | | | | | | | | | | |
| Company Notes | | | 8,727,308 | | | | 7,831,539 | | | | – | | | | 16,558,847 | |
| Corporate Bonds | | | – | | | | 312,894 | | | | – | | | | 312,894 | |
| Special Purpose Acquisition | | | | | | | | | | | | | | | | |
| Companies - Common | | | | | | | | | | | | | | | | |
| Shares | | | 92,557,825 | | | | – | | | | – | | | | 92,557,825 | |
| Rights | | | 268,755 | | | | – | | | | – | | | | 268,755 | |
| Warrants | | | 1,106,764 | | | | – | | | | – | | | | 1,106,764 | |
| Short-Term Investments | | | 7,926,758 | | | | – | | | | – | | | | 7,926,758 | |
| Total | | $ | 302,948,769 | | | $ | 8,151,885 | | | $ | – | | | $ | 311,100,654 | |
| Other Financial Instruments | | | | | | | | | | | | | | | | |
| Liabilities: | | | | | | | | | | | | | | | | |
| Securities Sold Short | | | | | | | | | | | | | | | | |
| Exchange Traded Funds - | | | | | | | | | | | | | | | | |
| Common Shares | | $ | (24,692,846 | ) | | $ | – | | | $ | – | | | $ | (24,692,846 | ) |
| Total | | $ | (24,692,846 | ) | | $ | – | | | $ | – | | | $ | (24,692,846 | ) |
The Fund did not have any securities that used significant unobservable inputs (Level 3) in determining fair value, and there were no transfers into or out of Level 3, during the year.
Short Sale Risks: The Fund and the Underlying Funds may engage in short sales. A short sale is a transaction in which a fund sells a security it does not own in anticipation that the market price of that security will decline. To establish a short position, a fund must first borrow the security from a broker or other institution. The fund may not always be able to borrow a security at a particular time or at an acceptable price. Accordingly, there is a risk that a fund may be unable to implement its investment strategy due to the lack of available securities or for other reasons. After selling a borrowed security, a fund is obligated to “cover” the short sale by purchasing and returning the security to the lender at a later date. The Fund and the Underlying Funds cannot guarantee that the security will be available at an acceptable price. Positions in shorted securities are speculative and more risky than long positions (purchases) in securities because the maximum sustainable loss on a
| |
| RiverNorth Opportunities Fund, Inc. | Notes to Financial Statements |
| | January 31, 2022 (Unaudited) |
security purchased is limited to the amount paid for the security plus the transaction costs, whereas there is no maximum attainable price of the shorted security. Therefore, in theory, securities sold short have unlimited risk. Short selling will also result in higher transaction costs (such as interest and dividends), and may result in higher taxes, which reduce a fund’s return.
Special Purpose Acquisition Company Risk: The Fund may invest in SPACs. SPACs are collective investment structures that pool funds in order to seek potential acquisition opportunities. SPACs are generally publicly traded companies that raise funds through an initial public offering (“IPO”) for the purpose of acquiring or merging with another company to be identified subsequent to the SPAC’s IPO. The securities of a SPAC are often issued in “units” that include one share of common stock and one right or warrant (or partial right or warrant) conveying the right to purchase additional shares or partial shares. Unless and until an acquisition is completed, a SPAC generally invests its assets (less an amount to cover expenses) in U.S. Government securities, money market fund securities and cash. SPACs and similar entities may be blank check companies with no operating history or ongoing business other than to seek a potential acquisition. Accordingly, the value of their securities is particularly dependent on the ability of the entity’s management to identify and complete a profitable acquisition. Certain SPACs may seek acquisitions only in limited industries or regions, which may increase the volatility of their prices. If an acquisition or merger that meets the requirements for the SPAC is not completed within a predetermined period of time, the invested funds are returned to the entity’s shareholders, less certain permitted expenses. Accordingly, any rights or warrants issued by the SPAC will expire worthless. Certain private investments in SPACs may be illiquid and/or be subject to restrictions on resale. Additionally, the Fund may acquire certain private rights and other interests issued by a SPAC (commonly referred to as “founder shares”), which may be subject to forfeiture or expire worthless and which typically have more limited liquidity than SPAC shares issued in an IPO. To the extent the SPAC is invested in cash or similar securities, this may impact a Fund’s ability to meet its investment objective.
Private Debt Risk: The Fund may invest in notes issued by private funds (“private debt”). Private debt often may be illiquid and is typically not listed on an exchange and traded less actively than similar securities issued by public funds. For certain private debt, trading may only be possible through the assistance of the broker who originally brought the security to the market and has a relationship with the issuer. Due to the limited trading market, independent pricing services may be unable to provide a price for private debt, and as such the fair value of the securities may be determined in good faith under procedures approved by the Board, which typically will include the use of one or more independent broker quotes.
Rights and Warrants Risks: Warrants are securities giving the holder the right, but not the obligation, to buy the stock of an issuer at a given price (generally higher than the value of the stock at the time of issuance) during a specified period or perpetually. Warrants do not carry with them the right to dividends or voting rights with respect to the securities that they entitle their holder to purchase and they do not represent any rights in the assets of the issuer. As a result, warrants may be considered to have more speculative characteristics than certain other types of investments. In addition, the value of a warrant does not necessarily change with the value of the underlying securities and a warrant ceases to have value if it is not exercised prior to its expiration date.
Rights are usually granted to existing shareholders of a corporation to subscribe to shares of a new issue of common stock before it is issued to the public. The right entitles its holder to buy common
| Semi-Annual Report | January 31, 2022 | 37 |
| |
| RiverNorth Opportunities Fund, Inc. | Notes to Financial Statements |
| | January 31, 2022 (Unaudited) |
stock at a specified price. Rights have similar features to warrants, except that the life of a right is typically much shorter, usually a few weeks.
During the six months ended January 31, 2022, the Fund invested in rights and warrants, which are disclosed in the Statement of Investments.
The effect of derivative instruments on the Statement of Assets and Liabilities as of January 31, 2022:
| Asset Derivatives |
| | | Statement of Assets and Liabilities | | | |
| Risk Exposure | | Location | | Value | |
| Equity Contracts (Rights) | | Investments, at value | | $ | 268,755 | |
| Equity Contracts (Warrants) | | Investments, at value | | | 1,106,764 | |
| | | | | $ | 1,375,519 | |
The effect of derivative instruments on the Statement of Operations for the six months ended January 31, 2022:
| | | | | | | | Change in | |
| | | | | | | | Unrealized | |
| | | | | Realized | | | Appreciation/ | |
| | | | | Gain/(Loss) | | | (Depreciation) | |
| Risk Exposure | | Statement of Operations Location | | on Derivatives | | | on Derivatives | |
| Equity Contracts | | Net realized gain/(loss) on | | | | | | | | |
| (Rights) | | investments/ Net change in | | | | | | | | |
| | | unrealized | | | | | | | | |
| | | appreciation/depreciation on | | | | | | | | |
| | | investments | | $ | 90,100 | | | $ | (119,247 | ) |
| Equity Contracts | | Net realized gain/(loss) on | | | | | | | | |
| (Warrants) | | investments/ Net change in | | | | | | | | |
| | | unrealized | | | | | | | | |
| | | appreciation/depreciation on | | | | | | | | |
| | | investments | | | 160,720 | | | | (872,627 | ) |
| Total | | | | $ | 250,820 | | | $ | (991,874 | ) |
The Fund’s average value of rights and warrants held for the six months ended January 31, 2022 were $111,782 and $803,955 respectively.
Market and Geopolitical Risk: The value of your investment in the Fund is based on the market prices of the securities the Fund holds. These prices change daily due to economic and other events that affect markets generally, as well as those that affect particular regions, countries, industries, companies or governments. These price movements, sometimes called volatility, may be greater or less depending on the types of securities the Fund owns and the markets in which the securities trade. The increasing interconnectivity between global economies and financial markets increases the likelihood that events or conditions in one region or financial market may adversely impact
| |
| RiverNorth Opportunities Fund, Inc. | Notes to Financial Statements |
| | January 31, 2022 (Unaudited) |
issuers in a different country, region or financial market. Securities in the Fund’s portfolio may underperform due to inflation (or expectations for inflation), interest rates, global demand for particular products or resources, natural disasters, pandemics, epidemics, terrorism, regulatory events and governmental or quasi-governmental actions. The occurrence of global events similar to those in recent years, such as terrorist attacks around the world, natural disasters, social and political discord or debt crises and downgrades, among others, may result in market volatility and may have long term effects on both the U.S. and global financial markets. It is difficult to predict when similar events affecting the U.S. or global financial markets may occur, the effects that such events may have and the duration of those effects. Any such event(s) could have a significant adverse impact on the value and risk profile of the Fund’s portfolio. There is a risk that you may lose money by investing in the Fund.
Other: The Fund holds certain investments which pay dividends to their shareholders based upon available funds from operations. It is possible for these dividends to exceed the underlying investments’ taxable earnings and profits resulting in the excess portion of such dividends being designated as a return of capital. Distributions received from investments in securities that represent a return of capital or long-term capital gains are recorded as a reduction of the cost of investments or as a realized gain, respectively.
3. INVESTMENT ADVISORY AND OTHER AGREEMENTS
ALPS Advisors, Inc. (“AAI”) serves as the Fund’s investment adviser pursuant to an Investment Advisory Agreement with the Fund. As compensation for its services to the Fund, AAI receives an annual investment advisory fee of 1.00% based on the Fund’s average daily Managed Assets (as defined below). Pursuant to an Investment Sub-Advisory Agreement, AAI has retained RiverNorth Capital Management, LLC (“RiverNorth” or the "Sub-Adviser") as the Fund’s sub-adviser and AAI pays RiverNorth an annual fee of 0.85% based on the Fund’s average daily Managed Assets.
ALPS Fund Services, Inc. (‘‘AFS’’), an affiliate of AAI, serves as administrator to the Fund. Under an Administration, Bookkeeping and Pricing Services Agreement, AFS is responsible for calculating the net asset values, providing additional fund accounting and tax services, and providing fund administration and compliance-related services to the Fund. AFS is entitled to receive a monthly fee, accrued daily based on the Fund’s average Managed Assets, as defined below, plus a fixed fee for completion of certain regulatory filings and reimbursement for certain out-of-pocket expenses.
DST Systems, Inc. (‘‘DST’’), the parent company of AAI and AFS, serves as the Transfer Agent to the Fund. Under the Transfer Agency Agreement, DST is responsible for maintaining all shareholder records of the Fund. DST is entitled to receive an annual minimum fee of $22,500 plus out-of-pocket expenses. DST is a wholly-owned subsidiary of SS&C Technologies Holdings, Inc. (“SS&C”), a publicly traded company listed on the NASDAQ Global Select Market.
The Fund pays no salaries or compensation to its officers or to interested Directors employed by the Adviser or Sub-Adviser. For their services, the Directors of the Fund, which are not affiliated with the Adviser or Sub-Adviser, receive an annual retainer in the amount of $17,000, an additional $2,000 for attending each meeting of the Board and $1,000 for attending a special meeting of the Board. In addition, the Independent Chairman receives an additional $10,000
| Semi-Annual Report | January 31, 2022 | 39 |
| |
| RiverNorth Opportunities Fund, Inc. | Notes to Financial Statements |
| | January 31, 2022 (Unaudited) |
annually. The Directors, which are not affiliated with the Adviser or Sub-Adviser, are also reimbursed for all reasonable out-of-pocket expenses relating to attendance at meetings of the Board.
Certain officers of the Fund are also employees of AAI and AFS. A Director is an officer of RiverNorth.
Managed Assets: For these purposes, the term Managed Assets is defined as the total assets of the Fund, including assets attributable to leverage, minus liabilities (other than debt representing leverage and any preferred stock that may be outstanding), calculated as of 4:00 p.m. Eastern time on such day or as of such other time or times as the Board may determine in accordance with the provisions of applicable law and of the declaration and bylaws of the Fund and with resolutions of the Board as from time to time in force.
4. LEVERAGE
The Fund may use leverage for investment purposes, which may include the use of borrowings, the issuance of preferred stock, and/or the use of derivatives or other transactions that may provide leverage (such as the investment of proceeds received from selling securities short). The Sub-Adviser will assess whether or not to engage in leverage based on its assessment of conditions in the debt and credit markets. Leverage, if used, may take the form of a borrowing or the issuance of preferred stock, although the Fund currently anticipates that leverage will primarily be obtained through the use of bank borrowings or other similar term loans.
The provisions of the 1940 Act further provide that the Fund may borrow or issue notes or debt securities in an amount up to 33 1/3% of its total assets or may issue preferred shares in an amount up to 50% of the Fund’s total assets (including the proceeds from leverage). Notwithstanding each of the limits discussed above, the Fund may enter into derivatives or other transactions (e.g., total return swaps) that may provide leverage (other than through borrowings or the issuance of preferred stock), but which are not subject to the above foregoing limitations, if the Fund earmarks or segregates liquid assets (or enters into offsetting positions) in accordance with applicable SEC regulations and interpretations to cover its obligations under those transactions and instruments. However, these transactions will entail additional expenses (e.g., transaction costs) which will be borne by the Fund.
If the net rate of return on the Fund’s investments purchased with the leverage proceeds exceeds the interest or dividend rate payable on the leverage, such excess earnings will be available to pay higher dividends to the Fund’s stockholders. If the net rate of return on the Fund’s investments purchased with leverage proceeds does not exceed the costs of leverage, the return to stockholders will be less than if leverage had not been used. The use of leverage magnifies gains and losses to stockholders. Since the stockholders pay all expenses related to the issuance of debt or use of leverage, any use of leverage would create a greater risk of loss for stockholders than if leverage is not used. There can be no assurance that a leveraging strategy will be successful during any period in which it is employed.
The Fund has entered into a $65,000,000 credit agreement for margin financing with Pershing LLC (the "Pershing Credit Agreement"). Per the Pershing Credit Agreement, the Fund may borrow at an interest rate of 1.10% plus the Overnight Bank Funding Rate.
| |
| RiverNorth Opportunities Fund, Inc. | Notes to Financial Statements |
| | January 31, 2022 (Unaudited) |
The average annualized interest rate charged, the average outstanding loan payable and the maximum outstanding loan payable for the six months ended January 31, 2022 was as follows:
| Average Interest Rate* | | 1.17% |
| Average Outstanding Loan Payable* | | $27,881,356 |
| Maximum Outstanding Loan Payable | | $30,000,000 |
| * | The average is calculated based on the actual number of days with an outstanding principal balance. |
At January 31, 2022, the Fund had $30,000,000 in principal balance outstanding.
5. DISTRIBUTIONS
The Fund intends to make regular monthly distributions to stockholders at a constant and fixed (but not guaranteed) rate that is reset annually to a rate equal to a percentage of the average of the Fund’s NAV per share (the “Distribution Amount”), as reported for the final five trading days of the preceding calendar year (the “Distribution Rate Calculation”). The Distribution Amount is set by the Board and may be adjusted from time to time. The Fund’s intention is that monthly distributions paid to stockholders throughout a calendar year will be at least equal to the Distribution Amount (plus any additional amounts that may be required to be included in a distribution for federal or excise tax purposes) and that, on the close of the calendar year, the Distribution Amount applicable to the following calendar year will be reset based upon the new results of the Distribution Rate Calculation.
Dividends and distributions may be payable in cash or shares of common stock, with stockholders having the option to receive additional common stock in lieu of cash. The Fund may at times, in its discretion, pay out less than the entire amount of net investment income earned in any particular period and may at times pay out such accumulated undistributed income in addition to net investment income earned in other periods in order to permit the fund to maintain a more stable level of distributions. As a result, the dividend paid by the Fund to common stockholders for any particular period may be more or less than the amount of net investment income earned by the Fund during such period. Any distribution that is treated as a return of capital generally will reduce a shareholder’s basis in his or her shares, which may increase the capital gain or reduce the capital loss realized upon the sale of such shares. Any amounts received in excess of a shareholder’s basis are generally treated as capital gain, assuming the shares are held as capital assets. The Fund’s ability to maintain a stable level of distributions to stockholders will depend on a number of factors, including the stability of income received from its investments and the costs of any leverage. As portfolio and market conditions change, the amount of dividends on the Fund’s common stock could change. For federal income tax purposes, the Fund is required to distribute substantially all of its net investment income each year to both reduce its federal income tax liability and to avoid a potential federal excise tax. The Fund intends to distribute all realized net capital gains, if any, at least annually.
6. CAPITAL TRANSACTIONS
The Fund’s authorized capital stock consists of 37,500,000 shares of common stock, $0.0001 par value per share, all of which is initially classified as common shares. Under the rules of the NYSE
| Semi-Annual Report | January 31, 2022 | 41 |
| |
| RiverNorth Opportunities Fund, Inc. | Notes to Financial Statements |
| | January 31, 2022 (Unaudited) |
applicable to listed companies, the Fund is required to hold an annual meeting of stockholders in each year.
Under the Fund’s Charter, the Board is authorized to classify and reclassify any unissued shares of stock into other classes or series of stock and authorize the issuance of shares of stock without obtaining stockholder approval. Also, the Fund’s Board, with the approval of a majority of the entire Board, but without any action by the stockholders of the Fund, may amend the Fund’s Charter from time to time to increase or decrease the aggregate number of shares of stock of the Fund or the number of shares of stock of any class or series that the Fund has authority to issue.
During the year ended July 31, 2021 and the six months ended January 31, 2022, the Board approved rights offerings to participating shareholders of record who were allowed to subscribe for new common shares of the Fund. Record date shareholders received one right for each common share held on the respective record dates. For every three rights held, a holder of the rights was entitled to buy one new common share of the Fund. Record date shareholders who fully exercised all rights initially issued to them in the primary subscription were entitled to buy those common shares that were not purchased by other record date shareholders. The Fund issued new shares of common stock at 95% of NAV per share for the October 2, 2020 rights offering, and at 97.5% of NAV per share for the October 1, 2021 rights offering. Offering costs were charged to paid-in-capital upon the exercise of the rights.
The shares of common stock issued, subscription price, and offering costs for the rights offerings were as follows:
| | | Shares of | | | | | |
| | Expiration | common | | Gross | Offering | | |
| | stock | Subscription | | |
| Record Date | Date | issued | price | Proceeds | costs | Net Proceeds | |
| October | November | | | | | | |
| 2, 2020 | 6, 2020 | 575,706 | $14.08 | $8,105,940 | $177,881 | $7,928,059 | |
| October | November | 4,373,407 | $16.81 | $73,516,972 | $223,000 | $73,293,972 | |
| 1, 2021 | 5, 2021 | | | | | | |
On August 31, 2018, the Fund entered into a sales agreement with Jones Trading Institutional Services LLC ("Jones"), under which the Fund may from time to time offer and sell up to 3,300,000 of the Fund's common stock in an "at-the-market" offering. On November 11, 2020, the agreement with Jones was terminated and the Fund entered into a distribution agreement with ALPS Distributors, Inc. (“ADI”), pursuant to which the Fund may offer and sell up to 3,196,130 shares of the Fund's common stock from time to time through ADI. On September 17, 2021, the Fund entered into a new distribution agreement with ADI, pursuant to which the Fund may offer and sell an additional 5,000,000 shares of the Fund's common stock from time to time through ADI, for a total of 8,196,130 shares.
| RiverNorth Opportunities Fund, Inc. | Notes to Financial Statements |
| | January 31, 2022 (Unaudited) |
The shares of common stock issued, gross proceeds from the sale of shares, and commissions to Jones and ADI were as follows:
| Period Ended | | | Shares of common stock issued | | | Gross Proceeds | | | Commissions | | | Offering Costs | | | Net Proceeds | |
| July 31, 2021 | | | | 2,455,650 | | | $ | 43,382,997 | | | $ | 437,175 | * | | $ | 194,394 | | | $ | 42,751,428 | |
| January 31, 2022 | | | | 835,695 | | | $ | 14,935,406 | | | $ | 149,355 | * | | $ | 3,896 | | | $ | 14,782,155 | |
| * | Includes commissions in the amount of $84,904 and $29,871 retained by the Fund's related party distributor, ADI for the year ended July 31, 2021 and the six months ended January 31, 2022, respectively. |
The Fund's 2020 rights offering and previous at-the-market offerings were made under the shelf registration statement that was initially effective with the SEC on July 26, 2018. Offering costs incurred through January, 31, 2022 as a result of the Fund's shelf registration statement initially effective with the SEC on September 17, 2021 are approximately $226,896. The Fund's 2021 rights offerings and the current at-the-market offering were made under this shelf registration statement. Management estimates an additional $683,295 of costs expected to be incurred resulting in total offering costs of approximately $910,191. The Statement of Assets and Liabilities reflects the current offering costs of $5,367 as deferred offering costs. These offering costs, as well as offering costs incurred subsequent to January 31, 2022, will be charged to paid-in-capital upon the issuance of shares.
Additional shares of the Fund may be issued under certain circumstances, including pursuant to the Fund’s Automatic Dividend Reinvestment Plan, as defined within the Fund’s organizational documents. Additional information concerning the Automatic Dividend Reinvestment Plan is included within this report.
As of January 31, 2022, investments in securities included a security that is considered restricted. Restricted securities are often purchased in private placement transactions, are not registered under the Securities Act of 1933, and may have contractual restrictions on resale.
| | | | | | | | | | | | Value as | |
| | | Acquisition | | | | | | | | | Percentage of | |
| Description | | Date | | | Cost | | | Value | | | Net Assets | |
| Business Development Corp. of America | | | 12/3/2019 | | | $ | 300,000 | | | $ | 312,894 | | | | 0.11 | % |
| TOTAL | | | | | | $ | 300,000 | | | $ | 312,894 | | | | 0.11 | % |
Purchases and Sales of Securities: For the six months ended January 31, 2022, the cost of purchases and proceeds from sales of securities, excluding short-term securities, were $271,987,468, and $165,404,396, respectively.
| Semi-Annual Report | January 31, 2022 | 43 |
| RiverNorth Opportunities Fund, Inc. | Notes to Financial Statements |
| | January 31, 2022 (Unaudited) |
Classification of Distributions: Net investment income/(loss) and net realized gain/(loss) may differ for financial statement and tax purposes. The character of distributions made during the year from net investment income or net realized gains may differ from its ultimate characterization for federal income tax purposes. Also, due to the timing of dividend distributions, the fiscal year in which amounts are distributed may differ from the fiscal year in which the income or realized gain was recorded by the Fund.
The amounts and characteristics of tax basis distributions and composition of distributable earnings/(accumulated losses) are finalized at fiscal year-end and are not available for the six months ended January 31, 2022.
The tax character of distributions paid during the year ended July 31, 2021 was as follows:
| | | For the Year Ended | |
| | | July 31, 2021 | |
| Ordinary Income | | $ | 21,674,120 | |
| Tax-Exempt Income | | | 172,302 | |
| Total | | $ | 21,846,422 | |
Tax Basis of Investments: Net unrealized appreciation/(depreciation) of investments based on federal tax cost as of January 31, 2022, was as follows:
| Cost of investments for income tax purposes | | $ | 282,996,344 | |
| Gross appreciation on investments (excess of value over tax cost)(a) | | | 14,725,723 | |
| Gross depreciation on investments (excess of tax cost over value)(a) | | | (11,314,259 | ) |
| Net unrealized appreciation on investments | | $ | 3,411,464 | |
| (a) | Includes appreciation/(depreciation) on securities sold short. |
The differences between book-basis and tax-basis are primarily due to wash sales, investments in passive foreign investment companies, and the tax treatment of certain other investments.
Federal Income Tax Status: For federal income tax purposes, the Fund currently qualifies, and intends to remain qualified, as a regulated investment company under the provisions of Subchapter M of the Internal Revenue Code of 1986, as amended, by distributing substantially all of its investment company taxable net income and realized gain, not offset by capital loss carryforwards, if any, to its shareholders. No provision for federal income taxes has been made.
As of and during the six months ended January 31, 2022, the Fund did not have a liability for any unrecognized tax benefits in the accompanying financial statements. The Fund recognizes the
| RiverNorth Opportunities Fund, Inc. | Notes to Financial Statements |
| | January 31, 2022 (Unaudited) |
interest and penalties, if any, related to the unrecognized tax benefits as income tax expense in the Statement of Operations. Management has analyzed the Fund’s tax positions taken on federal income tax returns for all open tax periods and has concluded that no provision for federal income tax is required in the Fund’s financial statements. During the year, the Fund did not incur any interest or penalties. The Fund files U.S. federal, state, and local tax returns as required. The Fund’s tax returns are subject to examination by the relevant tax authorities until expiration of the applicable statute of limitations which is generally three years after the filing of the tax return.
Under the Fund’s organizational documents, its officers and Directors are indemnified against certain liabilities arising out of the performance of their duties to the Fund. Additionally, in the normal course of business, the Fund enters into contracts with service providers that may contain general indemnification clauses. The Fund’s maximum exposure under those arrangements is unknown, as this would involve future claims that may be made against the Fund that have not yet occurred.
Subsequent to January 31, 2022, the Fund paid the following distributions:
| | | | Rate |
| Ex-Date | Record Date | Payable Date | (per share) |
| February 10, 2022 | February 11, 2022 | February 28, 2022 | $0.17 |
| March 16, 2022 | March 17, 2022 | March 31, 2022 | $0.17 |
On March 17, 2022, the Board of the Fund approved, subject to stockholder approval, a new investment advisory agreement with RiverNorth Capital Management. Stockholders of the Fund will receive a related proxy statement describing the proposal and will be asked to consider the approval of the new investment advisory agreement at a special shareholder meeting that will take place in the second quarter of this year. If approved by shareholders, the Fund anticipates the new investment advisory agreement will take effect in the third quarter of 2022. At that time, the Fund's current investment advisory agreement with AAI and the Fund's current sub-advisory agreement with RiverNorth will be terminated.
| Semi-Annual Report | January 31, 2022 | 45 |
| | Approval of Investment Advisory |
| RiverNorth Opportunities Fund, Inc. | and Sub-Advisory Agreements |
| | January 31, 2022 (Unaudited) |
At the August 10, 2021 meeting (“Meeting”) of the Board of Directors (the “Board” or the “Directors”) of RiverNorth Opportunities Fund, Inc. (the “Fund”), the Board, including those Directors who are not “interested persons” of the Fund (the “Independent Directors”), as that term is defined in the Investment Company Act of 1940, as amended (the “1940 Act”), renewed an Investment Advisory Agreement between the Fund and ALPS Advisors, Inc. (the “Adviser” or “AAI”), and an Investment Sub-Advisory Agreement, between the Adviser and RiverNorth Capital Management, LLC (the “Sub-Adviser” or “RiverNorth”), with respect to the Fund (collectively, the “Agreements”), upon the terms and conditions set forth therein.
The Directors relied upon the advice of independent legal counsel and their own business judgment in determining the material factors to be considered in evaluating the Agreements and the weight to be given to each such factor. The Directors’ conclusions were based on an evaluation of all of the information provided and were not the result of any one factor. Moreover, each Director may have afforded different weight to the various factors in reaching conclusions with respect to the Advisory Agreement and the Sub-Advisory Agreement. Although not meant to be all-inclusive, the following portion of the minutes summarizes the factors considered and conclusions reached by the Directors in the executive session and at the Meeting in determining to renew the Advisory Agreement and the Sub-Advisory Agreement.
Nature, Extent, and Quality of Services. In examining the nature, extent and quality of the investment advisory services provided by AAI, the Directors considered the qualifications, experience and capability of AAI’s management and other personnel and the extent of care and conscientiousness with which AAI performs its duties. In this regard, the Directors considered, among other matters, the process by which AAI its responsibilities with respect to the Fund, including ongoing due diligence regarding product structure, resources, personnel, technology, performance, compliance and oversight of RiverNorth. The Board noted that AAI had seen recent turnover in its management, but noted the experience of the personnel assuming management roles. Further, the Directors noted that the day to day team servicing the Fund (other than the Treasurer) remained consistent and noted the quality and expertise of this team. The Board acknowledged the addition of certain individuals to AAI’s team had provided the Fund with excellent support in managing the Fund’s operations.
With respect to the nature, extent and quality of the services provided by RiverNorth, the Directors considered RiverNorth’s investment management process it uses in managing the assets of the Fund, including the experience and capability of RiverNorth’s management and other personnel responsible for the portfolio management of the Fund and compliance with the Fund’s investment policies and restrictions. The Board noted that the RiverNorth personnel servicing the Fund continued to be consistent and acknowledged the fact that RiverNorth was considered a leader in the CEF field. The Directors also considered the continued favorable assessment provided by AAI as to the nature and quality of the services provided by RiverNorth and the ability of RiverNorth to fulfill its contractual obligations. The partnership between AAI and RiverNorth were considered by the Board, noting that the expanding operational and investment efficiencies of this partnership continue to benefit the Fund.
Based on the totality of the information considered, the Directors agreed that the Fund had already, and was likely to continue to benefit from the nature, extent and quality of AAI’s and RiverNorth’s
| | Approval of Investment Advisory |
| RiverNorth Opportunities Fund, Inc. | and Sub-Advisory Agreements |
| | January 31, 2022 (Unaudited) |
services based on their respective experience, operations and resources and strong track record in their roles as the Fund’s adviser and sub-adviser, respectively.
Investment Performance of the Fund. The Board reviewed the Fund’s investment performance over time and compared that performance to other funds in a peer group comparison report from FUSE, an independent research firm that, among other services, provides assistance to investment companies in connection with the advisory agreement approval process. The Board considered the Fund’s NAV and market price returns relative to the returns for funds in the peer groups, noting on a NAV basis, the Fund had underperformed the FUSE peer group median for the one-year, three- year and five-year periods and outperformed the FUSE peer group median since inception. Using market price returns, the Directors acknowledged that the Fund underperformed the FUSE peer group median return for the one-year, three-year and since inception periods and outperformed the FUSE peer group median return for the five-year period. In comparison to the benchmark, the Morningstar Moderate Aggressive Target Risk Index, the Board noted that the Fund underperformed for the one-year, three-year, five-year, and since inception periods. The Board considered the discussion during the Meeting of the differences in the peer group as compared to the Fund. The Directors also considered the Fund’s strong risk adjusted returns since inception. After considering all of the information provided, the Board agreed that the Fund’s performance supported the renewal of the Agreements with AAI and RiverNorth.
Fees and Expenses. The Board considered the fees payable under the Agreements and reviewed the information compiled by FUSE comparing the Fund’s management fees and expense ratio to other funds in the peer group, the peer group created by RiverNorth, as well as comparisons to fees paid by other funds advised by AAI and RiverNorth. It was noted that the Fund’s net management fee and the Fund’s expense ratio (as a percentage of net assets) were both lower than the FUSE peer group medians. The Board noted that the Fund was one of the smallest of any fund in either peer group, and accordingly, may not be benefiting from the resulting economies of scale that these peer funds had achieved. Further, the Board noted the Fund’s management fee was in-line or lower than most other CEFs advised by AAI after taking into account the sub-advisory fee paid by AAI to RiverNorth and required additional work as compared with the one CEF that had a lower net fee. With regard to RiverNorth’s sub-advisory fee, the Directors considered that the fees charged by RiverNorth for its work with the Fund were similar or lower to a majority of accounts managed by RiverNorth using similar strategies. The Directors further considered AAI’s belief that the compensation payable to RiverNorth was reasonable, appropriate and fair in light of the nature and quality of the services provided to the Fund.
The Directors also noted the firms’ limited ability to control the Fund’s other expenses. Finally, the Directors considered that these other expenses were more directly related to the size of the Fund, as these other Fund expenses generally were not charged on an asset-level basis.
Profitability and Economies of Scale. In reviewing the profitability information provided by each of AAI and RiverNorth, the Directors considered whether the firms had realized (or would be expected to realize) economies of scale related to its work with the Fund such that such economies should be shared with the Fund’s stockholders. The Board acknowledged that AAI had not yet begun to realize profits indicating it had realized economies of scale with respect to its work with the Fund. The Board considered the information provided by the Sub-Adviser regarding profitability from its relationship with the Fund. The Board noted that the Sub-Adviser’s profitability was not a significant
| Semi-Annual Report | January 31, 2022 | 47 |
| | Approval of Investment Advisory |
| RiverNorth Opportunities Fund, Inc. | and Sub-Advisory Agreements |
| | January 31, 2022 (Unaudited) |
factor considered by the Board, as the sub-advisory fee is paid by the Adviser out of the advisory fee paid to it by the Fund, and not by the Fund. With respect to whether assets had already risen, or would be expected to increase, to a level such that economies of scale might be realized by AAI and RiverNorth, the Board considered the each firm’s view that the Fund’s closed-end structure limited the likelihood of significant future increases in the Fund’s asset levels which would reach the point where the imposition of breakpoints in the management fees would be appropriate; noting the Fund’s offerings had not currently changed this belief.
Indirect Benefits. The Board considered any ancillary or indirect benefits that could accrue to AAI or RiverNorth as a result of their relationships with the Fund. The Directors considered details related to certain marketing services provided by AAI, as well as related to services that affiliates of AAI provided to the Fund: ALPS served as the Fund’s administrator and accountant, and DST Systems, Inc., an affiliate of AAI and ALPS, served as the Fund’s transfer agent. The Board also considered that RiverNorth did not expect to receive any such ancillary benefits beyond reputational benefits related to its role with Fund. The Board concluded that the benefits accruing to AAI and RiverNorth by virtue of their relationships to the Fund appeared to be reasonable.
After evaluation of the performance, fee and expense information and the profitability, ancillary benefits and other considerations as described above, and in light of the nature, extent and quality of services provided by AAI and RiverNorth, the Board concluded that the level of fees to be paid to each of AAI and RiverNorth was reasonable.
Conclusion. Having requested and received such information from each of AAI and RiverNorth as the Board believed to be reasonably necessary to evaluate the terms of the Agreements, and as assisted by the advice of independent counsel, the Board, including the Independent Directors, concluded that renewal of the Agreements were in the best interests of the Fund and its stockholders.
| RiverNorth Opportunities Fund, Inc. | Dividend Reinvestment Plan |
| | | January 31, 2022 (Unaudited) |
RiverNorth Opportunities Fund, Inc. (the “Fund”) has a dividend reinvestment plan commonly referred to as an “opt-out” plan. Unless the registered owner of the Fund’s shares of common stock (the “Common Shares”) elects to receive cash by contacting (the "Plan Administrator"), all dividends declared on Common Shares will be automatically reinvested by the Plan Administrator for shareholders in the Fund’s Automatic Dividend Reinvestment Plan (the “Plan”), in additional Common Shares. Common Shareholders who elect not to participate in the Plan will receive all dividends and other distributions in cash paid by check mailed directly to the shareholder of record (or, if the Common Shares are held in street or other nominee name, then to such nominee) by the Plan Administrator as dividend disbursing agent. Participation in the Plan is completely voluntary and may be terminated or resumed at any time without penalty by notice if received and processed by the Plan Administrator prior to the dividend record date; otherwise such termination or resumption will be effective with respect to any subsequently declared dividend or other distribution. Such notice will be effective with respect to a particular dividend or other distribution (together, a “Dividend”). Some brokers may automatically elect to receive cash on behalf of Common Shareholders and may re-invest that cash in additional Common Shares.
Whenever the Fund declares a Dividend payable in cash, non-participants in the Plan will receive cash and participants in the Plan will receive the equivalent in Common Shares. The Common Shares will be acquired by the Plan Administrator for the participants’ accounts, depending upon the circumstances described below, either (i) through receipt of additional unissued but authorized Common Shares from the Fund (“Newly Issued Common Shares”) or (ii) by purchase of outstanding Common Shares on the open market (“Open-Market Purchases”) on the New York Stock Exchange (“NYSE”) or elsewhere. If, on the payment date for any Dividend, the closing market price plus estimated brokerage commissions per Common Share is equal to or greater than the net asset value per Common Share, the Plan Administrator will invest the Dividend amount in Newly Issued Common Shares on behalf of the participants. The number of Newly Issued Common Shares to be credited to each participant’s account will be determined by dividing the dollar amount of the Dividend by the Fund’s net asset value per Common Share on the payment date. If, on the payment date for any Dividend, the net asset value per Common Share is greater than the closing market value plus estimated brokerage commissions (i.e., the Fund’s Common Shares are trading at a discount), the Plan Administrator will invest the Dividend amount in Common Shares acquired on behalf of the participants in Open-Market Purchases.
In the event of a market discount on the payment date for any Dividend, the Plan Administrator will have until the last business day before the next date on which the Common Shares trade on an “ex- dividend” basis or 30 days after the payment date for such Dividend, whichever is sooner (the “Last Purchase Date”), to invest the Dividend amount in Common Shares acquired in Open-Market Purchases. It is contemplated that the Fund will pay monthly income Dividends. If, before the Plan Administrator has completed its Open-Market Purchases, the market price per Common Share exceeds the net asset value per Common Share, the average per Common Share purchase price paid by the Plan Administrator may exceed the net asset value of the Common Shares, resulting in the acquisition of fewer Common Shares than if the Dividend had been paid in Newly Issued Common Shares on the Dividend payment date. Because of the foregoing difficulty with respect to Open-Market Purchases, the Plan provides that if the Plan Administrator is unable to invest the full Dividend amount in Open-Market Purchases during the purchase period or if the market discount shifts to a market premium during the purchase period, the Plan Administrator may cease making Open-Market Purchases and may invest the uninvested portion of the Dividend amount in Newly
| Semi-Annual Report | January 31, 2022 | 49 |
| RiverNorth Opportunities Fund, Inc. | Dividend Reinvestment Plan |
| | | January 31, 2022 (Unaudited) |
Issued Common Shares at the net asset value per Common Share at the close of business on the Last Purchase Date.
The Plan Administrator maintains all shareholders’ accounts in the Plan and furnishes written confirmation of all transactions in the accounts, including information needed by shareholders for tax records. Common Shares in the account of each Plan participant will be held by the Plan Administrator on behalf of the Plan participant, and each shareholder proxy will include those shares purchased or received pursuant to the Plan. The Plan Administrator will forward all proxy solicitation materials to participants and vote proxies for shares held under the Plan in accordance with the instructions of the participants.
Beneficial owners of Common Shares who hold their Common Shares in the name of a broker or nominee should contact the broker or nominee to determine whether and how they may participate in the Plan. In the case of Common Shareholders such as banks, brokers or nominees which hold shares for others who are the beneficial owners, the Plan Administrator will administer the Plan on the basis of the number of Common Shares certified from time to time by the record shareholder’s name and held for the account of beneficial owners who participate in the Plan.
There will be no brokerage charges with respect to Common Shares issued directly by the Fund. However, each participant will pay a pro rata share of brokerage commissions incurred in connection with Open-Market Purchases. The automatic reinvestment of Dividends will not relieve participants of any federal, state or local income tax that may be payable (or required to be withheld) on such Dividends. Participants that request a sale of Common Shares through the Plan Administrator are subject to brokerage commissions.
The Fund reserves the right to amend or terminate the Plan. There is no direct service charge to participants with regard to purchases in the Plan; however, the Fund reserves the right to amend the Plan to include a service charge payable by the participants.
All correspondence or questions concerning the Plan should be directed to the Plan Administrator at Mail Stop: RiverNorth Opp, 430 West 7th Street, Kansas City, MO 64105-1407.
| RiverNorth Opportunities Fund, Inc. | Additional Information |
| | | January 31, 2022 (Unaudited) |
The Fund files a complete schedule of portfolio holdings with the U.S. Securities and Exchange Commission (“SEC”) for the first and third quarters of each fiscal year on Form N-PORT within 60 days after the end of the period. Copies of the Fund’s Form N-PORT are available without a charge, upon request, by contacting the Fund at 1-855-830-1222 and on the SEC’s website at http://www.sec.gov.
A description of the Fund’s proxy voting policies and procedures is available (1) without charge, upon request, by calling 1-855-830-1222, (2) on the Fund’s website located at http://www.rivernorthcef.com, or (3) on the SEC’s website at http://www.sec.gov. Information regarding how the Fund voted proxies relating to portfolio securities during the twelve-month period ended June 30th is available on the SEC’s website at http://www.sec.gov.
| UNAUDITED TAX INFORMATION |
Of the distributions paid by the Fund from ordinary income for the calendar year ended December 31, 2021, the following percentages met the requirements to be treated as qualifying for the corporate dividends received deduction and qualified dividend income:
| | Dividend Received Deduction | Qualified Dividend Income |
| RiverNorth Opportunities Fund | 3.20% | 2.99% |
In early 2022, if applicable, shareholders of record received this information for the distributions paid to them by the Funds during the calendar year 2021 via Form 1099. The Fund will notify shareholders in early 2023 of amounts paid to them by the Fund, if any, during the calendar year 2022.
| CUSTODIAN AND TRANSFER AGENT |
State Street Bank and Trust Company, located at State Street Financial Center, One Lincoln Street, Boston, MA 02111, serves as the Fund’s custodian and maintains custody of the securities and cash of the Fund.
DST Systems, Inc., located at 333 West 11th Street, 5th Floor, Kansas City, Missouri 64105, serves as the Fund’s transfer agent and registrar.
Dechert LLP, located at 1095 Avenue of the Americas, New York, New York 10036, serves as legal counsel to the Fund.
| INDEPENDENT REGISTERED PUBLIC ACCOUNTING FIRM |
Cohen & Company, Ltd. is the independent registered public accounting firm for the Fund.
| Semi-Annual Report | January 31, 2022 | 51 |
| RiverNorth Opportunities Fund, Inc. | Data Privacy Policies and Procedures |
| FACTS | WHAT DOES RIVERNORTH OPPORTUNITIES FUND DO WITH YOUR PERSONAL INFORMATION? |
| WHY? | Financial companies choose how they share your personal information. Federal law gives consumers the right to limit some but not all sharing. Federal law also requires us to tell you how we collect, share, and protect your personal information. Please read this notice carefully to understand what we do. |
| WHAT? | The types of personal information we collect and share depend on the product or service you have with us. This information can include: |
| | |
| | • Social Security number | • Purchase History |
| | • Assets | • Account Balances |
| | • Retirement Assets | • Account Transactions |
| | • Transaction History | • Wire Transfer Instructions |
| | • Checking Account Information | |
| | When you are no longer our customer, we continue to share your information as described in this notice. |
| HOW? | All financial companies need to share customers’ personal information to run their everyday business. In the section below, we list the reasons financial companies can share their customers’ personal information; the reasons RiverNorth Opportunities Fund chooses to share; and whether you can limit this sharing. |
| REASONS WE CAN SHARE YOUR PERSONAL INFORMATION | DOES RIVERNORTH
OPPORTUNITIES
INCOME FUND
SHARE? | CAN YOU
LIMIT THIS
SHARING? |
For our everyday business purposes – such as to process your transactions, maintain your account(s), respond to court orders and legal investigations, or report to credit bureaus | Yes | No |
| For our marketing purposes – to offer our products and services to you | No | We don't share |
For joint marketing with other financial companies | No | We don't share |
For our affiliates’ everyday business purposes – information about your transactions and experiences | No | We don't share |
For our affiliates’ everyday business purposes – information about your creditworthiness | No | We don't share |
| For nonaffiliates to market to you | No | We don't share |
| QUESTIONS? | Call 1-855-838-9485 |
| | |
| RiverNorth Opportunities Fund, Inc. | Data Privacy Policies and Procedures | |
| WHO WE ARE |
| Who is providing this notice? | RiverNorth Opportunities Fund |
| WHAT WE DO |
How does RiverNorth Opportunities Fund protect my personal information? | To protect your personal information from unauthorized access and use, we use security measures that comply with federal law. These measures include computer safeguards and secured files and buildings. Our service providers are held accountable for adhering to strict policies and procedures to prevent any misuse of your nonpublic personal information. |
How does RiverNorth Opportunities Fund collect my personal information? | We collect your personal information, for example, when you • Open an account • Provide account information • Give us your contact information • Make deposits or withdrawals from your account • Make a wire transfer • Tell us where to send the money • Tells us who receives the money • Show your government-issued ID • Show your driver’s license We also collect your personal information from other companies. |
Why can’t I limit all sharing? | Federal law gives you the right to limit only: • Sharing for affiliates’ everyday business purposes – information about your creditworthiness • Affiliates from using your information to market to you • Sharing for nonaffiliates to market to you State laws and individual companies may give you additional rights to limit sharing. |
| DEFINITIONS |
Affiliates | Companies related by common ownership or control. They can be financial and nonfinancial companies. • RiverNorth Opportunities Fund does not share with our affiliates for marketing purposes. |
Nonaffiliates | Companies not related by common ownership or control. They can be financial and nonfinancial companies. • RiverNorth Opportunities Fund does not share with nonaffiliates so they can market to you. |
Joint marketing | A formal agreement between nonaffiliated financial companies that together market financial products or services to you. • RiverNorth Opportunities Fund does not jointly market. |
| Semi-Annual Report | January 31, 2022 | 53 |
 |  |
| | |
RiverNorth Capital Management, LLC | ALPS Advisors, Inc. |
| 433 W. Van Buren Street, 1150-E | 1290 Broadway, Suite 1000 |
| Chicago, IL 60607 | Denver, CO 80203 |
Secondary market support provided to the Fund by ALPS Advisors Inc.’s
affiliate, ALPS Portfolio Solutions Distributor, Inc., a FINRA member.
Not applicable to semi-annual report.
| Item 3. | Audit Committee Financial Expert. |
Not applicable to semi-annual report.
| Item 4. | Principal Accountant Fees and Services. |
Not applicable to semi-annual report.
| Item 5. | Audit Committee of Listed Registrants. |
Not applicable.
| Item 6. | Schedule of Investments. |
| (a) | Schedule of Investments is included as part of the Report to Stockholders filed under Item 1 of this form. |
| (b) | Not applicable to the Registrant. |
| Item 7. | Disclosure of Proxy Voting Policies and Procedures for Closed-End Management Investment Companies. |
Not applicable to semi-annual report.
| Item 8. | Portfolio Managers of Closed-End Management Investment Companies. |
| (a) | Not applicable to semi-annual report. |
| Item 9. | Purchases of Equity Securities by Closed-End Management Company and Affiliated Purchasers. |
Not applicable.
| Item 10. | Submission of Matters to a Vote of Security Holders. |
There have been no material changes to the procedures by which shareholders may recommend nominees to the Board of Directors of the Registrant.
| Item 11. | Controls and Procedures. |
| (a) | The Registrant’s principal executive officer and principal financial officer have concluded that the Registrant’s disclosure controls and procedures (as defined in Rule 30a-3(c) under the Investment Company Act of 1940, as amended) are effective based on their evaluation of these controls and procedures as of a date within 90 days of the filing date of this document. |
| (b) | There was no change in the Registrant's internal control over financial reporting (as defined in Rule 30a-3(d) under the Investment Company Act of 1940, as amended) during the period covered by this report that has materially affected, or is reasonably likely to materially affect, the Registrant's internal control over financial reporting. |
| Item 12. | Disclosure of Securities Lending Activities for Closed-End Management Investment Companies. |
Not applicable.
| (a)(1) | Not applicable to semi-annual report. |
SIGNATURES
Pursuant to the requirements of the Securities Exchange Act of 1934 and the Investment Company Act of 1940, the registrant has duly caused this report to be signed on its behalf by the undersigned, thereunto duly authorized.
RIVERNORTH OPPORTUNITIES FUND, INC.
| By: | /s/ Kathryn A. Burns | |
| | Kathryn A. Burns | |
| | President (Principal Executive Officer) | |
| | | |
| Date: | April 1, 2022 | |
| | | |
Pursuant to the requirements of the Securities Exchange Act of 1934 and the Investment Company Act of 1940, this report has been signed below by the following persons on behalf of the registrant and in the capacities and on the dates indicated.
| By: | /s/ Kathryn A. Burns | |
| | Kathryn A. Burns | |
| | President (Principal Executive Officer) | |
| | | |
| Date: | April 1, 2022 | |
| | | |
| By: | /s/ Erich Rettinger | |
| | Erich Rettinger | |
| | Treasurer (Principal Financial Officer) | |
| | | |
| Date: | April 1, 2022 | |
| | | |