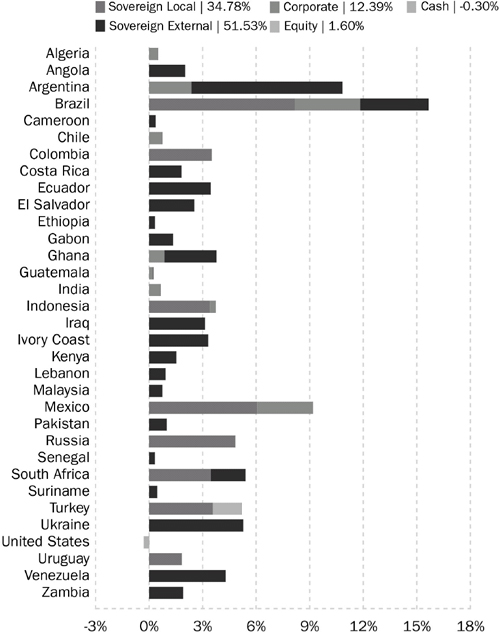
Sector Allocation(2) | |
| Sovereign Local | 34.78% |
| Sovereign External | 51.53% |
| Corporate | 12.39% |
| Equity | 1.60% |
| Cash & Equivalents/U.S. Treasuries | ‐0.30% |
Regional Breakdown(2) | |
| Latin America | 54.36% |
| Africa | 20.13% |
| Europe | 15.24% |
| Asia | 6.06% |
| Middle East | 4.51% |
| Cash & Equivalents/ U.S. Treasuries | ‐0.30% |
Sovereign Local Currency Breakdown(2) | |
| Brazilian Real | 8.15% |
| Mexican Peso | 6.06% |
| Russian Ruble | 4.82% |
| Turkish New Lira | 3.56% |
| Colombian Peso | 3.49% |
| South African Rand | 3.45% |
| Indonesian Rupiah | 3.41% |
| Uruguayan Peso | 1.84% |
| Total | 34.78% |
(1) | Current Distribution Rate is based on the Fund’s current annualized monthly distribution divided by the Fund’s current market price. The Fund’s monthly distributions to its shareholders may be comprised of ordinary income, net realized capital gains and return of capital in order to maintain a level distribution. |
(2) | Based on managed assets and investment manager’s sector classifications including derivative exposure. For purposes of this example, managed assets include total net assets plus any borrowings attributed to the use of reverse repurchase agreements and the notional values of interest rate swaps as described on page 12. |
(3) | Country refers to country of primary risk exposure, as determined by Stone Harbor. In certain instances, a security’s country of incorporation may be different from its country of risk. |
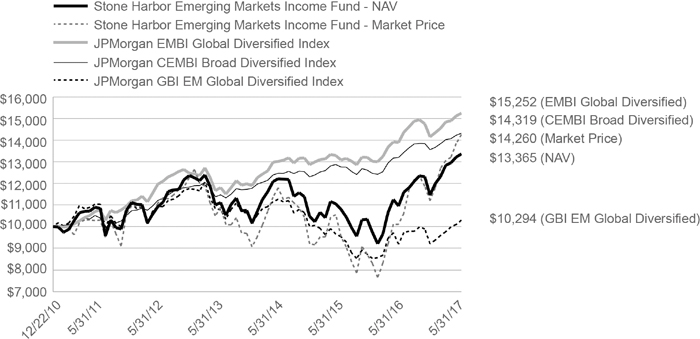
| Stone Harbor Emerging Markets Income Fund | Growth of $10,000 Investment |
Comparison of Change in Value of $10,000 Investment in Stone Harbor Emerging Markets Income Fund and the JPMorgan Emerging Markets Bond Indices: EMBI Global Diversified, CEMBI Broad Diversified, and GBI EM Global Diversified (Please refer to the Additional Information section for detailed benchmark descriptions).
Total Returns as of May 31, 2017 (Inception Date December 22, 2010)
| | | Average Annual Return |
| | 6 Month | One Year | Three Year | Five Year | Since Inception |
| Stone Harbor Emerging Markets Income Fund – NAV | 16.71% | 22.08% | 3.43% | 5.64% | 4.61% |
| Stone Harbor Emerging Markets Income Fund – Market Price | 27.32% | 41.16% | 7.89% | 6.88% | 5.67% |
| JPMorgan CEMBI Broad Diversified Index | 5.61% | 8.50% | 4.96% | 5.90% | 5.73% |
| JPMorgan EMBI Global Diversified Index | 7.76% | 9.77% | 5.55% | 6.48% | 6.78% |
| JPMorgan GBI EM Global Diversified Index | 11.91% | 12.17% | ‐2.63% | 0.32% | 0.45% |
Past performance is no guarantee of future results. Current performance may be lower or higher than the performance shown. Total return is calculated by determining the percentage change in NAV or market price (as applicable) in the specified period. The calculation assumes that all income dividends, capital gain and return of capital distributions, if any, have been reinvested and includes all fee waivers and expense reimbursements. Total return does not reflect the deduction of taxes that a shareholder would pay on Fund distributions or broker commissions or sales charges in connection with the purchase or sale of Fund shares. Investment return and principal value will vary, and shares, when sold, may be worth more or less than their original cost. Total returns for a period of less than one year are not annualized. Index returns do not include the effects of sales charges or management fees. It is not possible to invest directly in an index.
Performance at market price will differ from its results at NAV. Although market price returns typically reflect investment results over time, during shorter periods returns at market price can also be influenced by factors such as changing views about the Fund, market conditions, supply and demand for the Fund’s shares, or changes in Fund dividends.
An investment in the Fund involves risk, including the loss of principal. Total return, market price, market price yield and NAV will fluctuate with changes in market conditions. This data is provided for information purposes only and is not intended for trading purposes. Closed‐end funds, unlike open‐end funds, are not continuously offered. There is a onetime public offering and once issued, shares of closed‐end funds are traded in the open market through a stock exchange. NAV is equal to total assets attributable to common shareholders less total liabilities divided by the number of common shares outstanding. Holdings are subject to change daily.
| Semi-Annual Report | May 31, 2017 | 5 |
| Stone Harbor Emerging Markets Income Fund | Statement of Investments |
May 31, 2017 (Unaudited)
| | | Reference Rate | | Currency | | Rate | | Maturity Date | | Principal Amount/Shares* | | Value Expressed (in USD) | |
| | | | | | | | | | | | | | |
| SOVEREIGN DEBT OBLIGATIONS - 105.36% | | | | | | | | | | | |
| Angola - 2.93% | | | | | | | | | | | | | |
| Republic of Angola: | | | | | | | | | | | | | |
| | | | | USD | | | 9.50 | % | 11/12/25 | | | 2,689,000 | | $ | 2,887,314 | (1)(2) |
| | | | | USD | | | 9.50 | % | 11/12/25 | | | 3,798,000 | | | 4,078,102 | (2)(3) |
| | | | | | | | | | | | | | | | 6,965,416 | |
| | | | | | | | | | | | | | | | | |
| Argentina - 12.94% | | | | | | | | | | | | | | | | |
| Provincia del Chaco | | | | USD | | | 9.38 | % | 08/18/24 | | | 2,360,000 | | | 2,365,900 | (2)(3) |
| Republic of Argentina: | | | | | | | | | | | | | | | | |
| | | | | EUR | | | 7.82 | % | 12/31/33 | | | 3,283,422 | | | 3,960,456 | |
| | | | | EUR | | | 7.82 | % | 12/31/33 | | | 6,447,712 | | | 7,686,677 | |
| | | | | USD | | | 8.28 | % | 12/31/33 | | | 13,007,618 | | | 14,275,861 | (2) |
| | | | | EUR | | | 0.00 | % | 12/15/35 | | | 20,140,897 | | | 2,132,434 | (4) |
| | | | | EUR | | | 2.26 | % | 12/31/38 | | | 509,052 | | | 359,690 | (5) |
| | | | | | | | | | | | | | | | 30,781,018 | |
| | | | | | | | | | | | | | | | | |
| Brazil - 16.33% | | | | | | | | | | | | | | | | |
| Brazil Minas SPE via State of Minas Gerais | | | | USD | | | 5.33 | % | 02/15/28 | | | 11,827,000 | | | 11,472,190 | (2)(3) |
| Nota Do Tesouro Nacional: | | | | | | | | | | | | | | | | |
| | | | | BRL | | | 10.00 | % | 01/01/21 | | | 49,200,000 | | | 15,121,437 | |
| | | | | BRL | | | 10.00 | % | 01/01/23 | | | 40,500,000 | | | 12,251,028 | |
| | | | | | | | | | | | | | | | 38,844,655 | |
| | | | | | | | | | | | | | | | | |
| Cameroon - 0.52% | | | | | | | | | | | | | | | | |
| Republic of Cameroon | | | | USD | | | 9.50 | % | 11/19/25 | | | 1,030,000 | | | 1,226,987 | (1) |
| | | | | | | | | | | | | | | | | |
| Colombia - 4.52% | | | | | | | | | | | | | | | | |
| Bogota Distrio Capital | | | | COP | | | 9.75 | % | 07/26/28 | | | 8,000,000,000 | | | 2,911,809 | (3) |
| Republic of Colombia | | | | COP | | | 7.50 | % | 08/26/26 | | | 21,000,000,000 | | | 7,830,896 | |
| | | | | | | | | | | | | | | | 10,742,705 | |
| | | | | | | | | | | | | | | | | |
| Costa Rica - 2.61% | | | | | | | | | | | | | | | | |
| Republic of Costa Rica: | | | | | | | | | | | | | | | | |
| | | | | USD | | | 7.00 | % | 04/04/44 | | | 1,485,000 | | | 1,546,256 | (3) |
| | | | | USD | | | 7.00 | % | 04/04/44 | | | 2,853,000 | | | 2,970,686 | (1)(2) |
| | | | | USD | | | 7.16 | % | 03/12/45 | | | 1,602,000 | | | 1,684,103 | (2)(3) |
| | | | | | | | | | | | | | | | 6,201,045 | |
| | | | | | | | | | | | | | | | | |
| Ecuador - 1.37% | | | | | | | | | | | | | | | | |
| Republic of Ecuador: | | | | | | | | | | | | | | | | |
| | | | | USD | | | 7.95 | % | 06/20/24 | | | 1,300,000 | | | 1,238,250 | (3) |
| | | | | USD | | | 9.65 | % | 12/13/26 | | | 1,998,000 | | | 2,027,970 | (1)(2) |
| | | | | | | | | | | | | | | | 3,266,220 | |
| | | | | | | | | | | | | | | | | |
| El Salvador - 3.62% | | | | | | | | | | | | | | | | |
| Republic of El Salvador: | | | | | | | | | | | | | | | | |
| | | | | USD | | | 7.75 | % | 01/24/23 | | | 357,000 | | | 362,801 | (3) |
| | | | | USD | | | 8.25 | % | 04/10/32 | | | 4,108,000 | | | 4,077,190 | (2)(3) |
| | | | | USD | | | 7.65 | % | 06/15/35 | | | 3,735,000 | | | 3,482,888 | (2)(3) |
| | | | | USD | | | 7.63 | % | 02/01/41 | | | 750,000 | | | 690,000 | (3) |
| | | | | | | | | | | | | | | | 8,612,879 | |
See Notes to Financial Statements.
| Stone Harbor Emerging Markets Income Fund | Statement of Investments |
May 31, 2017 (Unaudited)
| | | Reference Rate | | Currency | | Rate | | Maturity Date | | Principal Amount/Shares* | | Value Expressed (in USD) | |
| Ethiopia - 0.44% | | | | | | | | | | | | | |
| Federal Democratic Republic of Ethiopia | | | | USD | | | 6.63 | % | 12/11/24 | | | 1,028,000 | | $ | 1,036,995 | (1) |
| | | | | | | | | | | | | | | | | |
| Gabon - 1.90% | | | | | | | | | | | | | | | | |
| Republic of Gabon: | | | | | | | | | | | | | | | | |
| | | | | USD | | | 6.38 | % | 12/12/24 | | | 1,709,000 | | | 1,702,591 | (1) |
| | | | | USD | | | 6.95 | % | 06/16/25 | | | 2,775,000 | | | 2,816,625 | (1)(2) |
| | | | | | | | | | | | | | | | 4,519,216 | |
| | | | | | | | | | | | | | | | | |
| Ghana - 4.20% | | | | | | | | | | | | | | | | |
| Republic of Ghana: | | | | | | | | | | | | | | | | |
| | | | | USD | | | 9.25 | % | 09/15/22 | | | 5,525,000 | | | 5,994,625 | (1)(2) |
| | | | | USD | | | 7.88 | % | 08/07/23 | | | 2,244,000 | | | 2,288,880 | (2)(3) |
| | | | | USD | | | 10.75 | % | 10/14/30 | | | 1,366,000 | | | 1,704,085 | (1)(2) |
| | | | | | | | | | | | | | | | 9,987,590 | |
| | | | | | | | | | | | | | | | | |
| Indonesia - 4.91% | | | | | | | | | | | | | | | | |
| Republic of Indonesia: | | | | | | | | | | | | | | | | |
| | | | | IDR | | | 8.25 | % | 07/15/21 | | | 75,881,000,000 | | | 6,015,791 | |
| | | | | IDR | | | 8.38 | % | 09/15/26 | | | 68,900,000,000 | | | 5,664,077 | |
| | | | | | | | | | | | | | | | 11,679,868 | |
| | | | | | | | | | | | | | | | | |
| Iraq - 1.33% | | | | | | | | | | | | | | | | |
| Republic of Iraq | | | | USD | | | 5.80 | % | 01/15/28 | | | 3,440,000 | | | 3,156,200 | (2)(3) |
| | | | | | | | | | | | | | | | | |
| Ivory Coast - 4.73% | | | | | | | | | | | | | | | | |
| Ivory Coast Government | | | | USD | | | 5.75 | % | 12/31/32 | | | 11,567,920 | | | 11,249,802 | (2)(3)(5) |
| | | | | | | | | | | | | | | | | |
| Kenya - 2.14% | | | | | | | | | | | | | | | | |
| Republic of Kenya: | | | | | | | | | | | | | | | | |
| | | | | USD | | | 6.88 | % | 06/24/24 | | | 2,350,000 | | | 2,420,500 | (2)(3) |
| | | | | USD | | | 6.88 | % | 06/24/24 | | | 2,596,000 | | | 2,673,880 | (1)(2) |
| | | | | | | | | | | | | | | | 5,094,380 | |
| | | | | | | | | | | | | | | | | |
| Lebanon - 1.32% | | | | | | | | | | | | | | | | |
| Lebanese Republic: | | | | | | | | | | | | | | | | |
| | | | | USD | | | 6.25 | % | 11/04/24 | | | 712,000 | | | 712,890 | |
| | | | | USD | | | 6.75 | % | 11/29/27 | | | 2,400,000 | | | 2,427,600 | (2) |
| | | | | | | | | | | | | | | | 3,140,490 | |
| | | | | | | | | | | | | | | | | |
| Malaysia - 1.05% | | | | | | | | | | | | | | | | |
| 1MDB Global Investments Ltd. | | | | USD | | | 4.40 | % | 03/09/23 | | | 2,700,000 | | | 2,511,000 | (2)(3) |
| | | | | | | | | | | | | | | | | |
| Mexico - 4.91% | | | | | | | | | | | | | | | | |
| Mexican Bonos: | | | | | | | | | | | | | | | | |
| | | | | MXN | | | 8.50 | % | 12/13/18 | | | 52,440,000 | | | 2,865,265 | |
| | | | | MXN | | | 6.50 | % | 06/10/21 | | | 129,500,000 | | | 6,758,857 | |
| | | | | MXN | | | 5.75 | % | 03/05/26 | | | 42,480,000 | | | 2,047,474 | |
| | | | | | | | | | | | | | | | 11,671,596 | |
| | | | | | | | | | | | | | | | | |
| Pakistan - 1.42% | | | | | | | | | | | | | | | | |
| Republic of Pakistan | | | | USD | | | 8.25 | % | 09/30/25 | | | 3,000,000 | | | 3,388,125 | (2)(3) |
| | | | | | | | | | | | | | | | | |
| Russia - 6.91% | | | | | | | | | | | | | | | | |
| Russian Federation | | | | RUB | | | 7.40 | % | 12/07/22 | | | 947,000,000 | | | 16,445,610 | |
| | | | | | | | | | | | | | | | | |
| Senegal - 0.43% | | | | | | | | | | | | | | | | |
| Republic of Senegal | | | | USD | | | 6.25 | % | 05/23/33 | | | 1,024,000 | | | 1,036,298 | (1) |
See Notes to Financial Statements.
| Semi-Annual Report | May 31, 2017 | 7 |
| Stone Harbor Emerging Markets Income Fund | Statement of Investments |
May 31, 2017 (Unaudited)
| | | Reference Rate | | Currency | | Rate | | Maturity Date | | Principal Amount/Shares* | | Value Expressed (in USD) | |
| South Africa - 4.77% | | | | | | | | | | | | | |
| Republic of South Africa | | | | ZAR | | | 10.50 | % | 12/21/26 | | | 132,440,000 | | $ | 11,341,493 | |
| | | | | | | | | | | | | | | | | |
| Suriname - 0.62% | | | | | | | | | | | | | | | | |
| Republic of Suriname | | | | USD | | | 9.25 | % | 10/26/26 | | | 1,438,000 | | | 1,477,545 | (1) |
| | | | | | | | | | | | | | | | | |
| Turkey - 5.05% | | | | | | | | | | | | | | | | |
| Republic of Turkey: | | | | | | | | | | | | | | | | |
| | | | | TRY | | | 10.50 | % | 01/15/20 | | | 24,520,000 | | | 6,948,573 | |
| | | | | TRY | | | 9.00 | % | 07/24/24 | | | 19,000,000 | | | 5,057,116 | |
| | | | | | | | | | | | | | | | 12,005,689 | |
| | | | | | | | | | | | | | | | | |
| Ukraine - 7.20% | | | | | | | | | | | | | | | | |
| Ukraine Government: | | | | | | | | | | | | | | | | |
| | | | | USD | | | 7.75 | % | 09/01/19 | | | 51,000 | | | 52,453 | (1) |
| | | | | USD | | | 7.75 | % | 09/01/20 | | | 2,966,000 | | | 3,022,354 | (1)(2) |
| | | | | USD | | | 7.75 | % | 09/01/21 | | | 7,216,000 | | | 7,327,848 | (1)(2) |
| | | | | USD | | | 7.75 | % | 09/01/22 | | | 1,886,000 | | | 1,897,316 | (3) |
| | | | | USD | | | 7.75 | % | 09/01/23 | | | 1,427,000 | | | 1,424,146 | (1) |
| | | | | USD | | | 7.75 | % | 09/01/23 | | | 2,458,000 | | | 2,453,084 | (2)(3) |
| | | | | USD | | | 7.75 | % | 09/01/25 | | | 972,000 | | | 957,420 | (1) |
| | | | | | | | | | | | | | | | 17,134,621 | |
| | | | | | | | | | | | | | | | | |
| Uruguay - 2.63% | | | | | | | | | | | | | | | | |
| Oriental Republic of Uruguay | | | | UYU | | | 4.38 | % | 12/15/28 | | | 95,742,550 | | | 3,620,002 | |
| Uruguay Notas del Tesoro | | | | UYU | | | 13.90 | % | 07/29/20 | | | 69,000,000 | | | 2,642,419 | |
| | | | | | | | | | | | | | | | 6,262,421 | |
| | | | | | | | | | | | | | | | | |
| Venezuela - 1.82% | | | | | | | | | | | | | | | | |
| Republic of Venezuela: | | | | | | | | | | | | | | | | |
| | | | | USD | | | 13.63 | % | 08/15/18 | | | 518,000 | | | 409,867 | (3) |
| | | | | USD | | | 7.75 | % | 10/13/19 | | | 7,059,200 | | | 3,926,680 | (2) |
| | | | | | | | | | | | | | | | 4,336,547 | |
| | | | | | | | | | | | | | | | | |
| Zambia - 2.74% | | | | | | | | | | | | | | | | |
| Republic of Zambia: | | | | | | | | | | | | | | | | |
| | | | | USD | | | 5.38 | % | 09/20/22 | | | 204,000 | | | 195,075 | (3) |
| | | | | USD | | | 8.50 | % | 04/14/24 | | | 1,169,000 | | | 1,249,369 | (3) |
| | | | | USD | | | 8.50 | % | 04/14/24 | | | 2,280,000 | | | 2,436,750 | (1)(2) |
| | | | | USD | | | 8.97 | % | 07/30/27 | | | 2,435,000 | | | 2,631,322 | (2)(3) |
| | | | | | | | | | | | | | | | 6,512,516 | |
| | | | | | | | | | | | | | | | | |
| TOTAL SOVEREIGN DEBT OBLIGATIONS | | | | | | | | | | | | | 250,628,927 | |
| (Cost $243,382,265) | | | | | | | | | | | | | | | | |
| | | | | | | | | | | | | | | | | |
| BANK LOANS - 0.69% | | | | | | | | | | | | | | | | |
| Brazil - 0.69% | | | | | | | | | | | | | | | | |
| Banco de Investimentos Credit Suisse Brasil SA - Brazil Loan Tranche A | | | | USD | | | 6.25 | % | 01/10/18 | | | 500,000 | | | 503,325 | (6) |
| Banco de Investimentos Credit Suisse Brasil SA - Brazil Loan Tranche B | | | | USD | | | 6.25 | % | 01/10/18 | | | 1,125,000 | | | 1,132,482 | (6) |
| | | | | | | | | | | | | | | | 1,635,807 | |
| | | | | | | | | | | | | | | | | |
Indonesia - 0.00%(7) | | | | | | | | | | | | | | | | |
| PT Bakrie & Brothers TBK | | | | USD | | | 0.00 | % | 11/25/14 | | | 2,515,676 | | | 252 | (6)(8) |
| | | | | | | | | | | | | | | | | |
| TOTAL BANK LOANS | | | | | | | | | | | | | | | 1,636,059 | |
| (Cost $2,631,271) | | | | | | | | | | | | | | | | |
See Notes to Financial Statements.
| Stone Harbor Emerging Markets Income Fund | Statement of Investments |
May 31, 2017 (Unaudited)
| | | Reference Rate | | Currency | | Rate | | Maturity Date | | Principal Amount/Shares* | | | Value Expressed (in USD) | |
| CORPORATE BONDS - 32.40% | | | | | | | | | | | | | | |
| Algeria - 0.72% | | | | | | | | | | | | | | |
| GTH Finance BV | | | | USD | | | 7.25 | % | 04/26/23 | | | 1,534,000 | | | $ | 1,706,575 | (1) |
| | | | | | | | | | | | | | | | | | |
| Argentina - 2.53% | | | | | | | | | | | | | | | | | |
| Pampa Energia SA | | | | USD | | | 7.50 | % | 01/24/27 | | | 2,500,000 | | | | 2,646,250 | (1)(2) |
| Petrobras Argentina SA | | | | USD | | | 7.38 | % | 07/21/23 | | | 1,000,000 | | | | 1,060,000 | (1) |
| YPF SA | | | | USD | | | 8.75 | % | 04/04/24 | | | 2,003,000 | | | | 2,311,963 | (1)(2) |
| | | | | | | | | | | | | | | | | 6,018,213 | |
| | | | | | | | | | | | | | | | | | |
| Brazil - 5.32% | | | | | | | | | | | | | | | | | |
| Cosan Luxembourg SA | | | | USD | | | 7.00 | % | 01/20/27 | | | 1,000,000 | | | | 1,040,000 | (1) |
| ESAL GmbH | | | | USD | | | 6.25 | % | 02/05/23 | | | 2,145,000 | | | | 1,966,697 | (1) |
| GTL Trade Finance Inc. | | | | USD | | | 7.25 | % | 04/16/44 | | | 1,000,000 | | | | 981,000 | (1) |
| MARB BondCo PLC | | | | USD | | | 7.00 | % | 03/15/24 | | | 655,000 | | | | 647,631 | (1) |
| Marfrig Holdings Europe BV | | | | USD | | | 8.00 | % | 06/08/23 | | | 2,000,000 | | | | 2,079,000 | (1) |
| Minerva Luxembourg SA | | | | USD | | | 6.50 | % | 09/20/26 | | | 2,000,000 | | | | 1,990,000 | (1) |
| Petrobras Global Finance BV | | | | USD | | | 8.75 | % | 05/23/26 | | | 2,252,000 | | | | 2,626,395 | |
| Rumo Luxembourg Sarl | | | | USD | | | 7.38 | % | 02/09/24 | | | 750,000 | | | | 775,313 | (1) |
| Votorantim Cimentos SA | | | | USD | | | 7.25 | % | 04/05/41 | | | 550,000 | | | | 542,850 | (1) |
| | | | | | | | | | | | | | | | | 12,648,886 | |
| | | | | | | | | | | | | | | | | | |
| Chile - 1.04% | | | | | | | | | | | | | | | | | |
| GeoPark Latin America Ltd. Agencia en Chile | | | | USD | | | 7.50 | % | 02/11/20 | | | 855,000 | | | | 863,550 | (1) |
| VTR Finance BV | | | | USD | | | 6.88 | % | 01/15/24 | | | 1,500,000 | | | | 1,599,375 | (1) |
| | | | | | | | | | | | | | | | | 2,462,925 | |
| | | | | | | | | | | | | | | | | | |
| Colombia - 0.36% | | | | | | | | | | | | | | | | | |
| Emgesa SA ESP | | | | COP | | | 8.75 | % | 01/25/21 | | | 911,000,000 | | | | 324,694 | (1) |
| Empresas Publicas de Medellin ESP: | | | | | | | | | | | | | | | | | |
| | | | | COP | | | 8.38 | % | 02/01/21 | | | 500,000,000 | | | | 176,524 | (3) |
| | | | | COP | | | 8.38 | % | 02/01/21 | | | 1,030,000,000 | | | | 363,640 | (1) |
| | | | | | | | | | | | | | | | | 864,858 | |
| | | | | | | | | | | | | | | | | | |
| Ecuador - 3.57% | | | | | | | | | | | | | | | | | |
| EP PetroEcuador via Noble Sovereign Funding I Ltd. | | | | USD | | | 6.78 | % | 09/24/19 | | | 6,250,000 | | | | 6,312,500 | (2)(4) |
| Petroamazonas EP | | | | USD | | | 4.63 | % | 02/16/20 | | | 2,338,000 | | | | 2,179,519 | (1)(2) |
| | | | | | | | | | | | | | | | | 8,492,019 | |
| | | | | | | | | | | | | | | | | | |
| Ghana - 1.25% | | | | | | | | | | | | | | | | | |
| Tullow Oil PLC: | | | | | | | | | | | | | | | | | |
| | | | | USD | | | 6.00 | % | 11/01/20 | | | 1,218,000 | | | | 1,184,505 | (3) |
| | | | | USD | | | 6.25 | % | 04/15/22 | | | 1,883,000 | | | | 1,784,142 | (3) |
| | | | | | | | | | | | | | | | | 2,968,647 | |
| | | | | | | | | | | | | | | | | | |
| Guatemala - 0.34% | | | | | | | | | | | | | | | | | |
| Comcel Trust via Comunicaciones Celulares SA | | | | USD | | | 6.88 | % | 02/06/24 | | | 750,000 | | | | 802,425 | (1) |
| | | | | | | | | | | | | | | | | | |
| India - 0.90% | | | | | | | | | | | | | | | | | |
| Vedanta Resources PLC: | | | | | | | | | | | | | | | | | |
| | | | | USD | | | 8.25 | % | 06/07/21 | | | 347,000 | | | | 371,290 | (1) |
| | | | | USD | | | 6.38 | % | 07/30/22 | | | 1,562,000 | | | | 1,562,000 | (1) |
| | | | | USD | | | 7.13 | % | 05/31/23 | | | 210,000 | | | | 216,038 | (1) |
| | | | | | | | | | | | | | | | | 2,149,328 | |
See Notes to Financial Statements.
| Semi-Annual Report | May 31, 2017 | 9 |
| Stone Harbor Emerging Markets Income Fund | Statement of Investments |
May 31, 2017 (Unaudited)
| | | Reference Rate | | Currency | | Rate | | Maturity Date | | Principal Amount/Shares* | | | Value Expressed (in USD) | |
| Indonesia - 0.44% | | | | | | | | | | | | | |
| Indika Energy Capital II Pte Ltd. | | | | USD | | | 6.88 | % | 04/10/22 | | | 1,078,000 | | | $ | 1,053,745 | (1) |
| | | | | | | | | | | | | | | | | | |
| Mexico - 8.40% | | | | | | | | | | | | | | | | | |
| Cemex SAB de CV | | | | USD | | | 7.75 | % | 04/16/26 | | | 2,000,000 | | | | 2,276,000 | (1)(2) |
| Metalsa SA de CV | | | | USD | | | 4.90 | % | 04/24/23 | | | 468,000 | | | | 469,170 | (1) |
| Mexichem SAB de CV: | | | | | | | | | | | | | | | | | |
| | | | | USD | | | 6.75 | % | 09/19/42 | | | 2,181,000 | | | | 2,355,589 | (1)(2) |
| | | | | USD | | | 5.88 | % | 09/17/44 | | | 500,000 | | | | 498,750 | (1) |
| Petroleos Mexicanos: | | | | | | | | | | | | | | | | | |
| | | | | MXN | | | 7.65 | % | 11/24/21 | | | 87,000,000 | | | | 4,418,868 | (3) |
| | | | | MXN | | | 7.47 | % | 11/12/26 | | | 98,000,000 | | | | 4,564,364 | |
| | | | | USD | | | 5.50 | % | 06/27/44 | | | 281,000 | | | | 253,153 | |
| Sixsigma Networks Mexico SA de CV | | | | USD | | | 8.25 | % | 11/07/21 | | | 2,305,000 | | | | 2,309,149 | (1)(2) |
| Southern Copper Corp. | | | | USD | | | 6.75 | % | 04/16/40 | | | 2,500,000 | | | | 2,846,875 | (2) |
| | | | | | | | | | | | | | | | | 19,991,918 | |
| | | | | | | | | | | | | | | | | | |
| South Africa - 2.77% | | | | | | | | | | | | | | | | | |
| Eskom Holdings SOC Ltd. | | | | USD | | | 7.13 | % | 02/11/25 | | | 6,258,000 | | | | 6,591,238 | (1)(2) |
| | | | | | | | | | | | | | | | | | |
| Ukraine - 0.37% | | | | | | | | | | | | | | | | | |
| Oschadbank Via SSB #1 PLC | | | | USD | | | 9.63 | % | 03/20/25 | | | 872,000 | | | | 891,402 | (3)(5) |
| | | | | | | | | | | | | | | | | | |
| Venezuela - 4.39% | | | | | | | | | | | | | | | | | |
| Petroleos de Venezuela | | | | USD | | | 6.00 | % | 05/16/24 | | | 26,445,227 | | | | 10,443,220 | (2)(3) |
| | | | | | | | | | | | | | | | | | |
| TOTAL CORPORATE BONDS | | | | | | | | | | | | | | | | 77,085,399 | |
| (Cost $75,281,536) | | | | | | | | | | | | | | | | | |
| | | | | | | | | | | | | | | | | | |
| CREDIT LINKED NOTES - 3.17% | | | | | | | | | | | | | | | | | |
| Iraq - 3.17% | | | | | | | | | | | | | | | | | |
| Republic of Iraq (Counterparty: Bank of America - Merrill Lynch) | | | | JPY | | | 2.86 | % | 01/01/28 | | | 1,084,960,540 | | | | 7,541,333 | (4)(6) |
| | | | | | | | | | | | | | | | | | |
| TOTAL CREDIT LINKED NOTES | | | | | | | | | | | | | | | | 7,541,333 | |
| (Cost $10,228,133) | | | | | | | | | | | | | | | | | |
| | | | | | | | | | | | | | | | | | |
EXCHANGE TRADED FUNDS ‐ 2.35% | | | | | | | | | | | | | | | | | |
iShares® MSCI Turkey ETF | | | | USD | | | N/A | | N/A | | | 135,893 | | | | 5,598,792 | |
| | | | | | | | | | | | | | | | | | |
| TOTAL EXCHANGE TRADED FUNDS | | | | | | | | | | | | | | | | 5,598,792 | |
| (Cost $6,401,702) | | | | | | | | | | | | | | | | | |
| | | | | | | | | | | | | | | | | | |
| SHORT TERM INVESTMENTS - 0.18% | | | | | | | | | | | | | | | | | |
| Money Market Mutual Funds - 0.18% | | | | | | | | | | | | | | | | | |
| State Street Institutional Liquid Reserves Fund (7-Day Yield) | | | | USD | | | 0.94 | % | N/A | | | 428,041 | | | | 428,083 | |
| | | | | | | | | | | | | | | | | | |
| TOTAL SHORT TERM INVESTMENTS | | | | | | | | | | | | | | | | 428,083 | |
| (Cost $428,083) | | | | | | | | | | | | | | | | | |
| | | | | | | | | | | | | | | | | | |
| Total Investments - 144.15% | | | | | | | | | | | | | | | | 342,918,593 | |
| (Cost $338,352,990) | | | | | | | | | | | | | | | | | |
| Liabilities in Excess of Other Assets - (44.15)% | | | | | | | | | | | | | | (105,035,728 | )(9) |
| | | | | | | | | | | | | | | | | | |
| Net Assets - 100.00% | | | | | | | | | | | | | | | $ | 237,882,865 | |
See Notes to Financial Statements.
| Stone Harbor Emerging Markets Income Fund | Statement of Investments |
May 31, 2017 (Unaudited)
| * | The principal amount/shares of each security is stated in the currency in which the security is denominated. |
| Currency Abbreviations: |
| ARS | - | Argentine Peso |
| BRL | - | Brazilian Real |
| COP | - | Colombian Peso |
| EUR | - | Euro Currency |
| IDR | - | Indonesian Rupiah |
| JPY | - | Japanese Yen |
| MXN | - | Mexican Peso |
| RUB | - | Russian Ruble |
| TRY | - | New Turkish Lira |
| USD | - | United States Dollar |
| UYU | - | Uruguayan Peso |
| ZAR | - | South African Rand |
(1) | Security exempt from registration under Rule 144A of the Securities Act of 1933. Such securities may normally be sold to qualified institutional buyers in transactions exempt from registration. Total market value of Rule 144A securities amounts to $84,360,023, which represents approximately 35.46% of net assets as of May 31, 2017. |
(2) | On May 31, 2017, securities valued at $146,437,665 were pledged as collateral for reverse repurchase agreements. |
(3) | Securities were originally issued pursuant to Regulation S under the Securities Act of 1933, which exempts securities offered and sold outside of the United States from registration. Such securities cannot be sold in the United States without either an effective registration statement filed pursuant to the Securities Act of 1933, or pursuant to an exemption from registration. As of May 31, 2017, the aggregate market value of those securities was $86,658,690, which represents approximately 36.43% of net assets. |
(4) | Floating or variable rate security. Interest rate disclosed is that which is in effect as of May 31, 2017. |
(5) | Step bond. Coupon changes periodically based upon a predetermined schedule. Interest rate disclosed is that which is in effect as of May 31, 2017. |
(6) | The level 3 assets were a result of unavailable quoted prices from an active market or the unavailability of other significant observable inputs. |
(7) | Amount represents less than 0.005% of net assets. |
(8) | Security is in default and therefore is non-income producing. |
(9) | Includes cash which is being held as collateral for derivatives. |
See Notes to Financial Statements.
| Semi-Annual Report | May 31, 2017 | 11 |
| Stone Harbor Emerging Markets Income Fund | Statement of Investments |
May 31, 2017 (Unaudited)
OUTSTANDING FORWARD FOREIGN CURRENCY CONTRACTS
| Counterparty | Foreign Currency | | Contracted Amount** | | Purchase/Sale Contract | Settlement Date | | Current Value | | | Unrealized Appreciation/ (Depreciation) | |
| J.P. Morgan Chase & Co. | ARS | | | 65,072,000 | | Sale | 06/01/17 | | $ | 4,039,021 | | | $ | 129,589 | |
| J.P. Morgan Chase & Co. | EUR | | | 12,849,600 | | Purchase | 06/09/17 | | | 14,441,853 | | | | 16,898 | |
| J.P. Morgan Chase & Co. | JPY | | | 834,862,200 | | Sale | 07/10/17 | | | 7,551,963 | | | | 9,975 | |
| | | | | | | | | | | | | | $ | 156,462 | |
| J.P. Morgan Chase & Co. | ARS | | | 65,072,000 | | Purchase | 06/01/17 | | $ | 4,039,021 | | | $ | (5,230 | ) |
| J.P. Morgan Chase & Co. | EUR | | | 12,849,600 | | Sale | 06/09/17 | | | 14,441,853 | | | | (374,381 | ) |
| J.P. Morgan Chase & Co. | EUR | | | 12,768,700 | | Sale | 07/10/17 | | | 14,374,505 | | | | (15,502 | ) |
| J.P. Morgan Chase & Co. | JPY | | | 812,430,400 | | Sale | 06/09/17 | | | 7,338,806 | | | | (37,485 | ) |
| J.P. Morgan Chase & Co. | JPY | | | 812,430,400 | | Purchase | 06/09/17 | | | 7,338,806 | | | | (9,043 | ) |
| | | | | | | | | | | | | | $ | (441,641 | ) |
| ** | The contracted amount is stated in the currency in which the contract is denominated. |
REVERSE REPURCHASE AGREEMENTS
| Counterparty | | Interest Rate | | Acquisition Date | | Amount | |
| Credit Suisse First Boston | | | 1.750 | % | 03/17/2017 | | $ | 24,999,480 | |
| Credit Suisse First Boston | | | 2.000 | % | 03/17/2017 | | | 2,273,620 | |
| Credit Suisse First Boston | | | 1.750 | % | 03/20/2017 | | | 13,826,821 | |
| Credit Suisse First Boston | | | 2.000 | % | 03/20/2017 | | | 11,381,821 | |
| Credit Suisse First Boston | | | 1.750 | % | 03/21/2017 | | | 1,676,261 | |
| Credit Suisse First Boston | | | 2.000 | % | 03/21/2017 | | | 9,751,132 | |
| Credit Suisse First Boston | | | 1.750 | % | 03/31/2017 | | | 7,920,000 | |
| Credit Suisse First Boston | | | 1.750 | % | 04/20/2017 | | | 2,641,061 | |
| Credit Suisse First Boston | | | 2.000 | % | 04/27/2017 | | | 1,510,000 | |
| Credit Suisse First Boston | | | 1.750 | % | 05/12/2017 | | | 1,897,078 | |
| Credit Suisse First Boston | | | 1.750 | % | 05/25/2017 | | | 2,157,923 | |
| Credit Suisse First Boston | | | 2.000 | % | 05/25/2017 | | | 5,467,492 | |
| J.P. Morgan Chase & Co. | | | 1.800 | % | 02/02/2017 | | | 1,821,889 | |
| J.P. Morgan Chase & Co. | | | 1.000 | % | 03/17/2017 | | | 1,276,145 | |
| J.P. Morgan Chase & Co. | | | 1.950 | % | 04/17/2017 | | | 3,599,252 | |
| J.P. Morgan Chase & Co. | | | 1.850 | % | 04/20/2017 | | | 4,661,736 | |
| J.P. Morgan Chase & Co. | | | 1.650 | % | 04/25/2017 | | | 7,940,376 | |
| J.P. Morgan Chase & Co. | | | 1.650 | % | 05/03/2017 | | | 5,631,463 | |
| | | | | | | | $ | 110,433,550 | |
All agreements can be terminated by either party on demand at value plus accrued interest.
INTEREST RATE SWAP CONTRACTS
| Pay/Receive Floating Rate | | Clearing House | | Floating Rate | | Expiration Date | | Notional Amount | | | Fixed Rate | | | Value | | | Unrealized Appreciation/(Depreciation) | |
| Receive | | Chicago Mercantile Exchange | | 3 month LIBOR | | 02/06/2025 | | $ | 26,600,000 | | | | 1.975 | % | | $ | 114,686 | | | $ | 114,686 | |
| | | | | | | | | | | | | | | | | $ | 114,686 | | | $ | 114,686 | |
| Receive | | Chicago Mercantile Exchange | | 3 month LIBOR | | 02/01/2027 | | $ | 20,400,000 | | | | 2.427 | % | | $ | (504,694 | ) | | $ | (504,694 | ) |
| Receive | | Chicago Mercantile Exchange | | 3 month LIBOR | | 02/21/2022 | | | 27,000,000 | | | | 2.051 | % | | | (293,851 | ) | | | (293,851 | ) |
| Receive | | Chicago Mercantile Exchange | | 3 month LIBOR | | 02/21/2027 | | | 13,500,000 | | | | 2.427 | % | | | (332,936 | ) | | | (332,936 | ) |
| | | | | | | | | | | | | | | | | $ | (1,131,481 | ) | | $ | (1,131,481 | ) |
See Notes to Financial Statements.
| Stone Harbor Emerging Markets Income Fund | Statement of Assets & Liabilities |
May 31, 2017 (Unaudited)
| ASSETS: | | | |
Investments, at value(1) | | $ | 342,918,593 | |
| Cash | | | 374,993 | |
| Foreign currency, at value (Cost $186,501) | | | 198,487 | |
| Unrealized appreciation on forward foreign currency contracts | | | 156,462 | |
| Deposits with brokers for interest rate swap contracts | | | 2,112,672 | |
| Deposits with brokers for forward foreign currency contracts | | | 270,000 | |
| Interest receivable | | | 8,081,494 | |
| Prepaid and other assets | | | 28,736 | |
| Total Assets | | | 354,141,437 | |
| | | | | |
| LIABILITIES: | | | | |
| Payable for reverse repurchase agreements | | | 110,433,550 | |
| Interest payable on reverse repurchase agreements | | | 319,923 | |
| Payable due to brokers for reverse repurchase agreements collateral | | | 3,060,000 | |
| Payable for investments purchased | | | 1,421,233 | |
| Unrealized depreciation on forward foreign currency contracts | | | 441,641 | |
| Variation margin payable on interest rate swap contracts | | | 94,946 | |
| Payable to adviser | | | 290,645 | |
| Payable to administrator | | | 88,333 | |
| Other payables | | | 108,301 | |
| Total Liabilities | | | 116,258,572 | |
| Net Assets | | $ | 237,882,865 | |
| | | | | |
| NET ASSETS CONSIST OF: | | | | |
| Paid‐in capital | | $ | 316,019,627 | |
| Distribution in excess of net investment income | | | (9,244,075 | ) |
| Accumulated net realized loss | | | (72,204,910 | ) |
| Net unrealized appreciation | | | 3,312,223 | |
| Net Assets | | $ | 237,882,865 | |
| | | | | |
| PRICING OF SHARES: | | | | |
| Net Assets | | $ | 237,882,865 | |
| Shares of beneficial interest outstanding (unlimited number of shares, par value of $0.001 per share authorized) | | | 15,907,664 | |
| Net assets value, offering and redemption price per share | | $ | 14.95 | |
| | | | | |
(1) Cost of Investments | | $ | 338,352,990 | |
See Notes to Financial Statements.
| Semi-Annual Report | May 31, 2017 | 13 |
| Stone Harbor Emerging Markets Income Fund | Statement of Operations |
For the Six Months Ended May 31, 2017 (Unaudited)
| INVESTMENT INCOME: | | | |
| Interest (net of foreign withholding tax of $167,519) | | $ | 13,799,445 | |
| Dividends | | | 41,398 | |
| Total Investment Income | | | 13,840,843 | |
| | | | | |
| EXPENSES: | | | | |
| Investment advisory fees | | | 1,648,547 | |
| Interest on reverse repurchase agreements | | | 830,252 | |
| Administration fees | | | 253,695 | |
| Custodian fees | | | 49,921 | |
| Professional fees | | | 82,594 | |
| Printing fees | | | 45,089 | |
| Trustee fees | | | 13,813 | |
| Transfer agent fees | | | 10,559 | |
| Insurance fees | | | 12,943 | |
| Other | | | 29,091 | |
| Total Expenses | | | 2,976,504 | |
| Net Investment Income | | | 10,864,339 | |
| | | | | |
| REALIZED AND UNREALIZED GAIN/(LOSS) ON INVESTMENTS: | | | | |
| Net realized gain/(loss) on: | | | | |
| Investments | | | 2,091,647 | |
| Credit default swap contracts | | | 1,092,128 | |
| Interest rate swap contracts | | | (340,308 | ) |
| Forward foreign currency contracts | | | 439,795 | |
| Foreign currency transactions | | | 28,463 | |
| Net realized gain | | | 3,311,725 | |
| Net change in unrealized appreciation/(depreciation) on: | | | | |
| Investments | | | 25,754,758 | |
| Credit default swap contracts | | | (1,474,561 | ) |
| Interest rate swap contracts | | | (1,315,573 | ) |
| Forward foreign currency contracts | | | (1,196,458 | ) |
| Translation of assets and liabilities denominated in foreign currencies | | | 170,789 | |
| Net change in unrealized appreciation | | | 21,938,955 | |
| Net Realized and Unrealized Gain on Investments | | | 25,250,680 | |
| Net Increase in Net Assets Resulting from Operations | | $ | 36,115,019 | |
See Notes to Financial Statements.
| Stone Harbor Emerging Markets Income Fund | Statements of Changes in Net Assets |
| | | For the Six Months Ended May 31, 2017 (Unaudited) | | | For the Year Ended November 30, 2016 | |
| OPERATIONS: | | | | | | |
| Net investment income | | $ | 10,864,339 | | | $ | 22,481,383 | |
| Net realized gain/(loss) | | | 3,311,725 | | | | (27,570,340 | ) |
| Net change in unrealized appreciation | | | 21,938,955 | | | | 26,652,520 | |
| Net increase in net assets resulting from operations | | | 36,115,019 | | | | 21,563,563 | |
| | | | | | | | | |
| DISTRIBUTIONS TO SHAREHOLDERS: | | | | | | | | |
| From net investment income | | | (17,139,852 | ) | | | (5,518,170 | ) |
| From tax return of capital | | | – | | | | (28,610,475 | ) |
| Net decrease in net assets from distributions to shareholders | | | (17,139,852 | ) | | | (34,128,645 | ) |
| | | | | | | | | |
| Net asset value of common shares issued to stockholders from reinvestment of dividends | | | 959,633 | | | | 770,031 | |
| Net increase in net assets from capital share transactions | | | 959,633 | | | | 770,031 | |
| | | | | | | | | |
| Net Increase/(Decrease) in Net Assets | | | 19,934,800 | | | | (11,795,051 | ) |
| | | | | | | | | |
| NET ASSETS: | | | | | | | | |
| Beginning of period | | | 217,948,065 | | | | 229,743,116 | |
| End of period (including distribution in excess of net investment income of $(9,244,075) and $(2,968,562)) | | $ | 237,882,865 | | | $ | 217,948,065 | |
| | | | | | | | | |
| OTHER INFORMATION: | | | | | | | | |
| Share Transactions: | | | | | | | | |
| Beginning shares | | | 15,843,749 | | | | 15,791,688 | |
| Shares issued as reinvestment of dividends | | | 63,915 | | | | 52,061 | |
| Shares outstanding ‐ end of period | | | 15,907,664 | | | | 15,843,749 | |
See Notes to Financial Statements.
| Semi-Annual Report | May 31, 2017 | 15 |
| Stone Harbor Emerging Markets Income Fund | Statement of Cash Flows |
For the Six Months Ended May 31, 2017 (Unaudited)
| CASH FLOWS FROM OPERATING ACTIVITIES: | | | |
| Net increase in net assets from operations | | $ | 36,115,019 | |
| Purchase of investment securities | | | (192,783,391 | ) |
| Proceeds from disposition of investment securities | | | 189,184,607 | |
| Net purchase of short‐term investment securities | | | (428,104 | ) |
| Net amortization of discounts and accretion of premiums | | | (1,512,598 | ) |
| Net realized (gain)/loss on: | | | | |
| Investments | | | (2,091,647 | ) |
| Net change in unrealized (appreciation)/depreciation on: | | | | |
| Investments | | | (25,754,758 | ) |
| Credit default swap contracts | | | 1,474,561 | |
| Forward foreign currency contracts | | | 1,196,458 | |
| Decrease in deposits with brokers for credit default swap contracts, interest rate swap contracts, reverse repurchase agreements | | | 897,088 | |
| Increase in interest receivable | | | (1,529,620 | ) |
| Decrease in receivable on credit default swap contracts | | | 40,000 | |
| Decrease in variation margin receivable | | | 122,624 | |
| Increase in prepaid and other assets | | | (8,511 | ) |
| Increase in payable due to brokers for reverse repurchase agreements, credit default swaps and forward foreign currency contracts | | | 2,080,000 | |
| Increase in variation margin payable on interest rate swap contracts | | | 94,946 | |
| Increase in payable to adviser | | | 25,240 | |
| Increase in payable to administrator | | | 41,680 | |
| Decrease in other payables | | | (42,774 | ) |
| Decrease in interest due on reverse repurchase agreements | | | (203,873 | ) |
| Decrease in premiums received for credit default swap contracts | | | (1,004,672 | ) |
| Net cash provided by operating activities | | | 5,912,275 | |
| | | | | |
| CASH FLOWS FROM FINANCING ACTIVITIES: | | | | |
| Cash payments for reverse repurchase agreements | | | (261,248,573 | ) |
| Cash payments from reverse repurchase agreements | | | 270,841,137 | |
| Cash distributions paid | | | (16,180,219 | ) |
| Net cash used in financing activities | | | (6,587,655 | ) |
| | | | | |
| Effect of exchange rates on cash | | | 11,190 | |
| | | | | |
| Net decrease in cash | | | (664,190 | ) |
| Cash, beginning balance | | | 1,237,670 | |
| Cash, ending balance | | $ | 573,480 | |
| | | | | |
| SUPPLEMENTAL DISCLOSURE OF CASH FLOW INFORMATION: | | | | |
| Cash paid during the period for interest expense on reverse repurchase agreements: | | $ | 1,034,125 | |
| Non‐cash financing activities not included herein consist of reinvestment of dividends and distributions of: | | $ | 959,633 | |
See Notes to Financial Statements.
| Stone Harbor Emerging Markets Income Fund | Financial Highlights |
For a share outstanding throughout the periods presented.
| | | For the Six Months Ended May 31, 2017 (Unaudited) | | | For the Year Ended November 30, 2016 | | | For the Year Ended November 30, 2015 | | | For the Year Ended November 30, 2014 | | | For the Year Ended November 30, 2013 | | | For the Year Ended November 30, 2012 | |
| Net asset value ‐ beginning of period | | $ | 13.76 | | | $ | 14.55 | | | $ | 18.56 | | | $ | 19.60 | | | $ | 23.61 | | | $ | 22.03 | |
| Income/(loss) from investment operations: | | | | | | | | | | | | | | | | | | | | | | | | |
Net investment income(1) | | | 0.68 | | | | 1.42 | | | | 2.24 | | | | 2.05 | | | | 1.67 | | | | 2.20 | |
| Net realized and unrealized gain/(loss) on investments | | | 1.59 | | | | (0.05 | ) | | | (4.09 | ) | | | (0.93 | ) | | | (3.52 | ) | | | 1.54 | |
| Total income/(loss) from investment operations | | | 2.27 | | | | 1.37 | | | | (1.85 | ) | | | 1.12 | | | | (1.85 | ) | | | 3.74 | |
| | | | | | | | | | | | | | | | | | | | | | | | | |
| Less distributions to common shareholders: | | | | | | | | | | | | | | | | | | | | | | | | |
| From net investment income | | | (1.08 | ) | | | (0.35 | ) | | | (0.33 | ) | | | (1.90 | ) | | | (1.90 | ) | | | (2.16 | ) |
| From net realized gains | | | – | | | | – | | | | – | | | | – | | | | (0.26 | ) | | | – | |
| From tax return of capital | | | – | | | | (1.81 | ) | | | (1.83 | ) | | | (0.26 | ) | | | – | | | | – | |
| Total distributions | | | (1.08 | ) | | | (2.16 | ) | | | (2.16 | ) | | | (2.16 | ) | | | (2.16 | ) | | | (2.16 | ) |
| Net Increase/(Decrease) in Net Asset Value | | | 1.19 | | | | (0.79 | ) | | | (4.01 | ) | | | (1.04 | ) | | | (4.01 | ) | | | 1.58 | |
| Net asset value ‐ end of period | | $ | 14.95 | | | $ | 13.76 | | | $ | 14.55 | | | $ | 18.56 | | | $ | 19.60 | | | $ | 23.61 | |
| Market price ‐ end of period | | $ | 16.70 | | | $ | 14.09 | | | $ | 12.86 | | | $ | 17.80 | | | $ | 18.55 | | | $ | 24.70 | |
| | | | | | | | | | | | | | | | | | | | | | | | | |
Total Return - Net Asset
Value(2) | | | 16.71 | % | | | 10.87 | % | | | (9.27 | %) | | | 6.03 | % | | | (8.37 | %) | | | 17.71 | % |
Total Return - Market Price(2) | | | 27.32 | % | | | 28.45 | % | | | (16.38 | %) | | | 7.45 | % | | | (17.10 | %) | | | 21.22 | % |
| | | | | | | | | | | | | | | | | | | | | | | | | |
| Ratios/Supplemental Data: | | | | | | | | | | | | | | | | | | | | | | | | |
| Net assets, end of period (in millions) | | $ | 238 | | | $ | 218 | | | $ | 230 | | | $ | 293 | | | $ | 309 | | | $ | 371 | |
| Ratio of expenses to average net assets | | | 2.58 | %(3)(4) | | | 2.18 | %(4) | | | 2.13 | %(4) | | | 2.07 | % | | | 1.88 | % | | | 1.83 | % |
| Ratio of net investment income to average net assets | | | 9.40 | %(3) | | | 10.03 | % | | | 14.08 | % | | | 10.42 | % | | | 7.43 | % | | | 9.59 | % |
Ratio of expenses to average managed assets(5) | | | 1.81 | %(3)(4) | | | 1.62 | %(4) | | | 1.46 | %(4) | | | 1.44 | % | | | 1.42 | % | | | 1.40 | % |
| Portfolio turnover rate | | | 55 | % | | | 105 | % | | | 89 | % | | | 97 | % | | | 157 | % | | | 122 | % |
| | | | | | | | | | | | | | | | | | | | | | | | | |
| Borrowings at End of Period | | | | | | | | | | | | | | | | | | | | | | | | |
| Aggregate Amount Outstanding (in millions) | | $ | 110 | | | $ | 101 | | | $ | 90 | | | $ | 137 | | | $ | 120 | | | $ | 134 | |
| Asset Coverage (000s) | | $ | 3 | | | $ | 3 | | | $ | 4 | | | $ | 3 | | | $ | 4 | | | $ | 4 | |
(1) | Calculated using average shares throughout the period. |
(2) | Total investment return is calculated assuming a purchase of common share at the opening on the first day and a sale at closing on the last day of each period reported. Dividends and distributions, if any, are assumed for purposes of this calculation to be reinvested at prices obtained under the Fund’s dividend reinvestment plan. Total investment returns do not reflect brokerage commissions, if any. |
(4) | For the six months ended 2017 and years ended 2016 and 2015, includes borrowing costs of 0.72%, 0.41% and 0.30% to average net assets and 0.51%, 0.30% and 0.21% to average managed assets, respectively. |
(5) | Average managed assets represent average net assets applicable to common shares plus average amount of borrowings during the period. |
See Notes to Financial Statements.
| Semi-Annual Report | May 31, 2017 | 17 |
| Stone Harbor Emerging Markets Income Fund | Notes to Financial Statements |
May 31, 2017 (Unaudited)
1. ORGANIZATION
Stone Harbor Emerging Markets Income Fund (the “Fund”) is a closed‐end management investment company registered under the Investment Company Act of 1940, as amended (the “1940 Act”). The Fund is organized as a Massachusetts business trust pursuant to an Agreement and Declaration of Trust governed by the laws of The Commonwealth of Massachusetts (the “Declaration of Trust”). The Fund’s inception date is December 22, 2010. Prior to that, the Fund had no operations other than matters relating to its organization and the sale and issuance of 4,188 shares of beneficial interest (“Common Shares”) in the Fund to the Stone Harbor Investment Partners LP (the “Adviser” or “Stone Harbor”) at a price of $23.88 per share. The Fund’s common shares are listed on the New York Stock Exchange (the “Exchange”) and trade under the ticker symbol “EDF”.
The Fund’s investment objective is to maximize total return, which consists of income on its investments and capital appreciation. The Fund will normally invest at least 80% of its net assets (plus any borrowings made for investment purposes) in emerging markets securities. Emerging markets securities include fixed income securities and other instruments (including derivatives) that are economically tied to emerging market countries, which are denominated in the predominant currency of the local market of an emerging market country or whose performance is linked to those countries’ markets, currencies, economies or ability to repay loans. A security or instrument is economically tied to an emerging market country if it is principally traded on the country’s securities markets or if the issuer is organized or principally operates in the country, derives a majority of its income from its operations within the country or has a majority of its assets within the country.
The Fund is classified as “non‐diversified” under the 1940 Act. As a result, it can invest a greater portion of its assets in obligations of a single issuer than a “diversified” fund. The Fund may therefore be more susceptible than a diversified fund to being adversely affected by any single corporate, economic, political or regulatory occurrence.
2. SIGNIFICANT ACCOUNTING POLICIES AND RISK DISCLOSURES
The following is a summary of significant accounting policies consistently followed by the Fund in the preparation of its financial statements. The Fund is considered an investment company for financial reporting purposes under generally accepted accounting principles in the United States of America (“GAAP”). The policies are in conformity with GAAP. The preparation of the financial statements in accordance with GAAP requires management to make estimates and assumptions that affect the reported amounts of assets and liabilities at the date of the financial statements and the reported amounts of income and expenses during the reporting period. Actual results could differ from those estimates.
Investment Valuation: Sovereign debt obligations, corporate bonds, and convertible corporate bonds, are generally valued at the mean between the closing bid and asked prices provided by an independent pricing service. The pricing service generally uses market models that consider trade data, yields, spreads, quotations from dealers and active market makers, credit worthiness, market information on comparable securities, and other relevant security specific information. Bank Loans are primarily valued by a loan pricing provider using a composite loan price at the mean of the bid and ask prices from one or more brokers of dealers. Credit Linked securities are generally valued using quotations from the broker through which the Fund executed the transaction. The broker’s quotation considers cash flows, default and recovery rates, and other security specific information. Equity securities for which market quotations are available are generally valued at the last sale price or official closing price on the primary market or exchange on which they trade. If on a given day, a closing price is not available on the exchange, the equity security is valued at the mean between the closing bid and ask prices, as such prices are provided by a pricing service. Publicly traded foreign government debt securities are typically traded internationally in the over the counter market and are valued at the mean between the bid and asked prices as of the close of business of that market. When prices are not readily available, or are determined not to reflect fair value, such as when the value of a security has been significantly affected by events after the close of the exchange or market on which the security is principally traded, but before the Fund calculates its net asset value, the Fund may value these investments at fair value as determined in accordance with the procedures approved by the Fund’s Board of Trustees (the “Board”). Short term obligations with maturities of 60 days or less are valued at amortized cost, which approximates market value. Exchange Traded Funds (“ETFs”) are valued at the close price on the exchange it is listed. Money market mutual funds are valued at their net asset value. Over the counter traded derivatives (primarily swaps and foreign currency options) are generally priced by an independent pricing service. OTC traded credit default swaps are valued by the independent pricing source using a mid price that is calculated based on data an independent pricing source receives from dealers. OTC traded foreign currency options are valued by an independent pricing source using mid foreign exchange rates against USD for all currencies at 4:00 p.m. EST. Derivatives which are cleared by an exchange are priced by using the last price on such exchange. Foreign currency positions including forward currency contracts are priced at the mean between the closing bid and asked prices at 4:00 p.m. Eastern time.
A three-tier hierarchy has been established to measure fair value based on the extent of use of “observable inputs” as compared to “unobservable inputs” for disclosure purposes and requires additional disclosures about these valuations measurements. Inputs refer broadly to the assumptions that market participants would use in pricing a security. Observable inputs are inputs that reflect the assumptions market participants would use in pricing the security developed based on market data obtained from sources independent of the reporting entity. Unobservable inputs are inputs that reflect the reporting entity’s own assumptions about the assumptions market participants would use in pricing the security developed based on the best information available in the circumstances.
| Stone Harbor Emerging Markets Income Fund | Notes to Financial Statements |
May 31, 2017 (Unaudited)
The three‐tier hierarchy is summarized as follows:
| Level 1 | Unadjusted quoted prices in active markets for identical assets or liabilities that the Fund has the ability to access. |
| Level 2 | Observable inputs other than quoted prices included in Level 1 that are observable for the asset or liability, either directly or indirectly. These inputs may include quoted prices for the identical instrument on an inactive market, prices for similar instruments, interest rates, prepayment speeds, credit risk, yield curves, default rates and similar data. |
| Level 3 | Unobservable inputs for the asset or liability, to the extent relevant observable inputs are not available, representing the Fund’s own assumptions about the assumptions a market participant would use in valuing the asset or liability and would be based on the best information available. |
The following is a summary of the Fund’s investment and financial instruments based on the three‐tier hierarchy as of May 31, 2017:
Investments in Securities at Value* | | Level 1 | | | Level 2 | | | Level 3 | | | Total | |
| Sovereign Debt Obligations | | $ | – | | | $ | 250,628,927 | | | $ | – | | | $ | 250,628,927 | |
| Bank Loans | | | – | | | | – | | | | 1,636,059 | | | | 1,636,059 | |
| Corporate Bonds | | | – | | | | 77,085,399 | | | | – | | | | 77,085,399 | |
| Credit Linked Notes | | | – | | | | – | | | | 7,541,333 | | | | 7,541,333 | |
| Exchange Traded Funds | | | 5,598,792 | | | | – | | | | – | | | | 5,598,792 | |
| Short Term Investments | | | 428,083 | | | | – | | | | – | | | | 428,083 | |
| Total | | $ | 6,026,875 | | | $ | 327,714,326 | | | $ | 9,177,392 | | | $ | 342,918,593 | |
| | | | | | | | | | | | | | | | | |
Other Financial Instruments** | | | | | | | | | | | | | | | | |
| Assets | | | | | | | | | | | | | | | | |
| Forward Foreign Currency Contracts | | $ | – | | | $ | 156,462 | | | $ | – | | | $ | 156,462 | |
| Interest Rate Swap Contracts | | | – | | | | 114,686 | | | | – | | | | 114,686 | |
| | | | | | | | | | | | | | | | | |
| Liabilities | | | | | | | | | | | | | | | | |
| Forward Foreign Currency Contracts | | | – | | | | (441,641 | ) | | | – | | | | (441,641 | ) |
| Interest Rate Swap Contracts | | | – | | | | (1,131,481 | ) | | | – | | | | (1,131,481 | ) |
| Total | | $ | – | | | $ | (1,301,974 | ) | | $ | – | | | $ | (1,301,974 | ) |
| * | For detailed country descriptions, see accompanying Statement of Investments. |
| ** | Other financial instruments are derivative instruments reflected in the Statement of Investments. The derivatives shown in this table are reported at their unrealized appreciation/(depreciation) at measurement date, which represents the change in the contract's value from trade date. |
There were no transfers in or out of Levels 1 and 2 during the period ended May 31, 2017. It is the Fund’s policy to recognize transfers into and out of all levels at the end of the reporting period.
| Semi-Annual Report | May 31, 2017 | 19 |
| Stone Harbor Emerging Markets Income Fund | Notes to Financial Statements |
May 31, 2017 (Unaudited)
The following is a reconciliation of assets in which significant unobservable inputs (Level 3) were used in determining fair value:
| Investments in Securities | | Balance as of November 30, 2016 | | | Accrued discount/ premium | | | Realized Gain/ (Loss) | | | Change in Unrealized Appreciation/ (Depreciation) | | | Purchases | | | Sales Proceeds | | | Balance as of May 31, 2017 | | | Net change in unrealized appreciation/ (depreciation) included in the Statements of Operations at May 31, 2017 | |
| Bank Loans | | $ | 3,662,236 | | | $ | – | | | $ | – | | | $ | (401,177 | ) | | $ | – | | | $ | (1,625,000 | ) | | $ | 1,636,059 | | | $ | (401,177 | ) |
| Credit Linked | | | | | | | | | | | | | | | | | | | | | | | | | | | | | | | | |
| Notes | | | 6,846,248 | | | | 67,809 | | | | (32,249 | ) | | | 1,091,726 | | | | – | | | | (432,201 | ) | | | 7,541,333 | | | | 1,091,726 | |
| Total | | $ | 10,508,484 | | | $ | 67,809 | | | $ | (32,249 | ) | | $ | 690,549 | | | $ | – | | | $ | (2,057,201 | ) | | $ | 9,177,392 | | | $ | 690,549 | |
All level 3 investments have values determined utilizing third‐party pricing information without adjustment.
The inputs or methodology used for valuing securities are not necessarily an indication of the risk associated with investing in those securities.
In the event a Board approved independent pricing service is unable to provide an evaluated price for a security or the Adviser believes the price provided is not reliable, securities of the Fund may be valued at fair value as described above. In these instances the Adviser may seek to find an alternative independent source, such as a broker/dealer to provide a price quote, or use evaluated pricing models similar to the techniques and models used by the independent pricing service. These fair value measurement techniques may utilize unobservable inputs (Level 3).
On at least a quarterly basis, the Adviser presents the factors considered in determining the fair value measurements and presents that information to the Board which meets at least quarterly.
Security Transactions and Investment Income: Security transactions are accounted for on a trade date basis. Interest income, adjusted for amortization of premium and accretion of discount, is recorded on the accrual basis. Dividend income is recorded on the ex‐dividend date. Foreign dividend income is recorded on the ex‐dividend date or as soon as practical after the Fund determines the existence of a dividend declaration after exercising reasonable due diligence. If applicable, any foreign capital gains taxes are accrued, net of unrealized gains, and are payable upon the sale of such investments. The cost of investments sold is determined by use of the specific identification method. To the extent any issuer defaults on an expected interest payment, the Fund’s policy is to generally halt any additional interest income accruals and consider the realizability of interest accrued up to the date of default.
Foreign Currency Translation: The books and records of the Fund are maintained in U.S. dollars. Investment valuations and other assets and liabilities initially expressed in foreign currencies are converted each business day into U.S. dollars based upon current exchange rates. Prevailing foreign exchange rates may generally be obtained at the close of the NYSE (normally 4:00 p.m. Eastern time).
The portion of realized and unrealized gains or losses on investments due to fluctuations in foreign currency exchange rates is not separately disclosed and is included in realized and unrealized gains or losses on investments, when applicable.
Foreign Securities: The Fund may directly purchase securities of foreign issuers. Investing in securities of foreign issuers involves special risks not typically associated with investing in securities of U.S. issuers. The risks include possible revaluation of currencies, the ability to repatriate funds, less complete financial information about companies and possible future adverse political and economic developments. Moreover, securities of many foreign issuers and their markets may be less liquid and their prices more volatile than those of securities of comparable U.S. issuers.
Credit Linked Notes: The Fund may invest in credit linked notes to obtain economic exposure to high yield, emerging markets or other securities. Investments in a credit linked note typically provide the holder with a return based on the return of an underlying reference instrument, such as an emerging market bond. Like an investment in a bond, investments in credit linked securities represent the right to receive periodic income payments (in the form of distributions) and payment of principal at the end of the term of the security. In addition to the risks associated with the underlying reference instrument, an investment in a credit linked note is also subject to liquidity risk, market risk, interest rate risk and the risk that the counterparty will be unwilling or unable to meet its obligations under the note.
| Stone Harbor Emerging Markets Income Fund | Notes to Financial Statements |
May 31, 2017 (Unaudited)
Loan Participations and Assignments: The Fund may invest in loans arranged through private negotiation between one or more financial institutions. The Fund’s investment in any such loan may be in the form of a participation in or an assignment of the loan. In connection with purchasing participations, the Fund generally will have no right to enforce compliance by the borrower with the terms of the loan agreement relating to the loan, or any rights of set‐off against the borrower, and the Fund may not benefit directly from any collateral supporting the loan in which it has purchased the participation.
While some loans are collateralized and senior to an issuer’s other debt securities, other loans may be unsecured and/or subordinated to other securities. Some senior loans, such as bank loans, may be illiquid and generally tend to be less liquid than many other debt securities.
The Fund assumes the credit risk of the borrower, the lender that is selling the participation and any other persons interpositioned between the Fund and the borrower. In the event of the insolvency of the lender selling the participation, the Fund may be treated as a general creditor of the lender and may not benefit from any set‐off between the lender and the borrower. Loans may not be considered “securities”, and purchasers, such as the Fund, therefore may not be entitled to rely on the anti‐fraud protections of the federal securities laws.
Segregation and Collateralization: In cases in which the 1940 Act and the interpretive positions of the U.S. Securities and Exchange Commission (“SEC”) require that the Fund either delivers collateral or segregates assets in connection with certain investments (e.g., foreign currency exchange contracts, securities with extended settlement periods, and swaps) or certain borrowings (e.g., reverse repurchase agreements), the Fund will segregate collateral or designate on its books and record cash or other liquid securities having a value at least equal to the amount that is required to be physically segregated for the benefit of the counterparty. Furthermore, based on requirements and agreements with certain exchanges and third party broker‐dealers, each party has requirements to deliver/deposit cash or securities as collateral for certain investments. Cash collateral that has been pledged to cover obligations of the Fund and cash collateral received from the counterparty, if any, is reported separately on the Statement of Assets and Liabilities as “Deposits with brokers” or “Payable due to brokers”, respectively. Securities collateral pledged for the same purpose is noted on the Statement of Investments.
Leverage: The Fund may borrow from banks and other financial institutions and may also borrow additional funds by entering into reverse repurchase agreements or the issuance of debt securities (collectively, “Borrowings”) in an amount that does not exceed 33 1/3% of the Fund’s Managed Assets (defined in Note 4) immediately after such transactions. It is possible that following such Borrowings, the assets of the Fund will decline due to market conditions such that this 33 1/3% limit will be exceeded. In that case, the leverage risk to Common Shareholders will increase.
In a reverse repurchase agreement, the Fund delivers a security in exchange for cash to a financial institution, the counterparty, with a simultaneous agreement to repurchase the same or substantially the same security at an agreed upon price and date. The Fund is entitled to receive principal and interest payments, if any, made on the security delivered to the counterparty during the term of the agreement. Cash received in exchange for securities delivered plus accrued interest payments to be made by the Fund to counterparties are reflected as a liability on the Statement of Assets and Liabilities. Interest payments made by the Fund to counterparties are recorded as a component of interest expense on the Statement of Operations. In periods of increased demand for the security, the Fund may receive a fee for use of the security by the counterparty, which may result in interest income to the Fund. The Fund will segregate assets determined to be liquid to cover its obligations under reverse repurchase agreements. As all agreements can be terminated by either party on demand, face value approximates fair value at May 31, 2017. This fair value is based on Level 2 inputs under the three‐tier fair valuation hierarchy described above. For the period ended May 31, 2017, the average amount of reverse repurchase agreements outstanding was $98,841,050, at a weighted average interest rate of 1.68%.
Emerging Market Risk: Emerging market countries often experience instability in their political and economic structures. Government actions could have a great effect on the economic conditions in these countries, which can affect the value and liquidity of the assets of a Fund. Specific risks that could decrease a Fund’s return include seizure of a company’s assets, restrictions imposed on payments as a result of blockages on foreign currency exchanges, expropriation, confiscatory taxation and unanticipated social or political occurrences. In addition, the ability of an emerging market government to make timely payments on its debt obligations will depend on the extent of its reserves, interest rate fluctuations and access to international credit and investments. A country with non‐diversified exports or that relies on specific imports will be subject to a greater extent to fluctuations in the pricing of those commodities. Failure to generate adequate earnings from foreign trade would make it difficult for an emerging market country to service foreign debt. Disruptions resulting from social and political factors may cause the securities markets of emerging market countries to close. If this were to occur, the liquidity and value of a Fund’s assets invested in corporate debt obligations of emerging market companies would decline. Foreign investment in debt securities of emerging market countries may be restricted or controlled to varying degrees. These restrictions can limit or preclude foreign investment in debt securities of certain emerging market countries. In addition, certain emerging market countries may also restrict investment opportunities in issuers in industries deemed important to national interests.
Interest Rate Risk: Changes in interest rates will affect the value of the Fund’s investments. In general, as interest rates rise, bond prices fall, and as interest rates fall, bond prices rise. Interest rate risk is generally greater for funds that invest a significant portion of their assets in high yield securities. However, funds that generally invest a significant portion of their assets in higher‐rated fixed income securities are also subject to this risk. The Fund also faces increased interest rate risk if it invests in fixed income securities paying no current interest (such as zero coupon securities and principal‐only securities), interest‐only securities and fixed income securities paying non‐cash interest in the form of other securities.
| Semi-Annual Report | May 31, 2017 | 21 |
| Stone Harbor Emerging Markets Income Fund | Notes to Financial Statements |
May 31, 2017 (Unaudited)
Liquidity Risk: Liquidity risk exists when particular investments are difficult to purchase or sell at the time that the Fund would like or at the price that the Fund believes such investments are currently worth. Certain of the Fund’s investments may be illiquid. Illiquid securities may become harder to value, especially in changing markets. The Fund’s investments in illiquid securities may reduce the returns of the Fund because it may be unable to sell the illiquid securities at an advantageous time or price or possibly require the Fund to dispose of other investments at unfavorable times or prices in order to satisfy its obligations, which could prevent the Fund from taking advantage of other investment opportunities. Additionally, the market for certain investments may become illiquid under adverse market or economic conditions independent of any specific adverse changes in the conditions of a particular issuer. Derivatives, securities that involve substantial interest rate or credit risk and bank loans tend to involve greater liquidity risk. In addition, liquidity risk tends to increase to the extent the Fund invests in securities whose sale may be restricted by law or by contract, such as Rule 144A and Regulation S securities.
Foreign Investment Risk: The securities markets of many foreign countries are relatively small, with a limited number of companies representing a small number of industries. Additionally, issuers of foreign (non‐U.S.) securities are usually not subject to the same degree of regulation as U.S. issuers. Reporting, accounting, auditing and custody standards of foreign countries differ, in some cases significantly, from U.S. standards. Global economies and financial markets are becoming increasingly interconnected, and conditions and events in one country, region or financial market may adversely impact issuers in a different country, region or financial market. Also, nationalization, expropriation or confiscatory taxation, currency blockage, political changes or diplomatic developments could adversely affect the Fund’s investments in a foreign country. In the event of nationalization, expropriation or other confiscation, the Fund could lose its entire investment in foreign (non‐U.S.) securities. Adverse conditions in a certain region can adversely affect securities of other countries whose economies appear to be unrelated. Foreign (non‐U.S.) securities may also be less liquid and more difficult to value than securities of U.S. issuers.
Leverage Risk: Leverage creates risks for Common Shareholders, including the likelihood of greater volatility of NAV per share and market price of, and dividends paid on, the Common Shares. There is a risk that fluctuations in the interest rates on any Borrowings held by the Fund may adversely affect the return to the Common Shareholders. If the income from the securities purchased with the proceeds of leverage is not sufficient to cover the cost of leverage, the return on the Fund will be less than if leverage had not been used, and therefore the amount available for distribution to the Common Shareholders as dividends and other distributions will be reduced.
The Fund may choose not to use leverage at all times. The amount and composition of leverage used may vary depending upon a number of factors, including economic and market conditions in the relevant emerging market countries, the availability of relatively attractive investment opportunities not requiring leverage and the costs and risks that the Fund would incur as a result of leverage.
Credit and Market Risk: The Fund invests in high yield and emerging market instruments that are subject to certain credit and market risks. The yields of high yield and emerging market debt obligations reflect, among other things, perceived credit and market risks. The Fund’s investment in securities rated below investment grade typically involves risks not associated with higher rated securities including, among others, greater risk related to timely and ultimate payment of interest and principal, greater market price volatility and less liquid secondary market trading. The consequences of political, social, economic or diplomatic changes may have disruptive effects on the market prices of investments held by the Fund. The Fund’s investment in non‐dollar denominated securities may also result in foreign currency losses caused by devaluations and exchange rate fluctuations. Investments in derivatives are also subject to credit and market risks.
ETFs and Other Investment Companies Risk: The Fund may invest in an ETF or other investment company. The Fund will be subject to the risks of the underlying securities in which the other investment company invests. In addition, as a shareholder in an ETF or other investment company, the Fund will bear its ratable share of that investment company's expenses, and would remain subject to payment of the Fund's investment management fees with respect to the assets so invested. Common Shareholders would therefore be subject to duplicative expenses to the extent the Fund invests in other investment companies. In addition, these other investment companies may use leverage, in which case an investment would subject the Fund to additional risks associated with leverage. The Fund may invest in other investment companies for which the Adviser or an affiliate serves as investment manager or with which the Adviser is otherwise affiliated. The relationship between the Adviser and any such other investment company could create a conflict of interest between the Adviser and the Fund.
In addition to the risks related to investing in investment companies generally, investments in ETFs involve the risk that the ETF's performance may not track the performance of the index or markets the ETF is designed to track. In addition, ETFs often use derivatives to track the performance of the relevant index and, therefore, investments in those ETFs are subject to the same derivatives risks discussed below.
Distributions to Shareholders: The Fund intends to make a level dividend distribution each month to Common Shareholders. The level dividend rate may be modified by the Board of Trustees from time to time. Any net capital gains earned by the Fund are distributed at least annually. Income and capital gain distributions are determined in accordance with federal income tax regulations, which may differ from GAAP. Distributions to shareholders are recorded by the Fund on the ex‐dividend date. A portion of the Fund’s distributions made for a taxable year may be recharacterized as a return of capital to shareholders. This may occur, for example, if the Fund’s distributions exceed its “earnings and profits” for the taxable year or because certain foreign currency losses may reduce the Fund’s income. This recharacterization may be retroactive. A return of capital will generally not be taxable, but will reduce a shareholder’s basis in his or her Fund shares and therefore result in a higher gain or lower loss when the shareholder sells the shares.
| Stone Harbor Emerging Markets Income Fund | Notes to Financial Statements |
May 31, 2017 (Unaudited)
Federal and Other Taxes: No provision for income taxes is included in the accompanying financial statements, as the Fund intends to distribute to shareholders all taxable investment income and realized gains and otherwise comply with Subchapter M of the Code applicable to regulated investment companies.
The Fund evaluates tax positions taken (or expected to be taken) in the course of preparing the Fund’s tax returns to determine whether these positions meet a “more‐likely‐than‐not” standard that, based on the technical merits, have more than a 50 percent likelihood of being sustained by a taxing authority upon examination. A tax position that meets the “more‐likely‐than‐not” recognition threshold is measured to determine the amount of benefit to recognize in the financial statements.
As of and during the year ended November 30, 2016, the Fund did not have a liability for any unrecognized tax benefits. The Fund files U.S. federal, state, and local tax returns as required. The Fund’s tax returns are subject to examination by the relevant tax authorities until expiration of the applicable statute of limitations which is generally three years after the filing of the tax return for federal purposes and four years for most state returns. Tax returns for open years have incorporated no uncertain tax positions that require a provision for income taxes.
3. DERIVATIVE INSTRUMENTS
Risk Exposure and the Use of Derivative Instruments: The Fund’s investment objectives not only permit the Fund to purchase investment securities, they also allow the Fund to enter in various types of derivatives contracts. In doing so, the Fund will employ strategies in differing combinations to permit it to increase, decrease or change the level or types of exposure to market factors. Central to those strategies are features inherent to derivatives that may make them more attractive for this purpose than equity or debt securities: they require little or no initial cash investment; they can focus exposure on only certain selected risk factors; and they may not require the ultimate receipt or delivery of the underlying security (or securities) to the contract. This may allow the Fund to pursue its objectives more quickly and efficiently than if the Fund were to make direct purchases or sales of securities capable of effecting a similar response to market factors.
The Fund’s use of derivatives can result in losses due to unanticipated changes in the risk factors described in Note 2 and the overall market. In instances where the Fund is using derivatives to decrease, or hedge, exposures to market risk factors for securities held by the Fund, there are also risks that those derivatives may not perform as expected resulting in losses for the combined or hedged positions.
Derivatives may have little or no initial cash investment relative to their market value exposure and therefore can produce significant gains or losses in excess of their cost. This use of embedded leverage allows the Fund to increase its market value exposure relative to its net assets and can substantially increase the volatility of the Fund’s performance.
Additional associated risks from investing in derivatives also exist and potentially could have significant effects on the valuation of the derivative and the Fund. Typically, the associated risks are not the risks that the Fund is attempting to increase or decrease exposure to, per its investment objectives, but are the additional risks from investing in derivatives.
Examples of these associated risks are liquidity risk, which is the risk that the Fund will not be able to sell or close out the derivative in a timely manner, and counterparty credit risk, which is the risk that the counterparty will not fulfill its obligation to the Fund. Associated risks can be different for each type of derivative and are discussed by each derivative type below and in the notes that follow.
Derivatives are also subject to the risk of possible regulatory changes, which could adversely affect the availability and performance of derivative securities, make them more costly and limit or restrict their use by the Fund, which could prevent the Fund from implementing its investment strategies and adversely affect returns.
Forward Foreign Currency Contracts: The Fund engaged in currency transactions with counterparties during the period ended May 31, 2017 to hedge the value of portfolio securities denominated in particular currencies against fluctuations in relative value, to gain or reduce exposure to certain currencies or to generate income or gains. A forward foreign currency contract is an agreement between two parties to buy and sell a currency at a set price on a future date. The contract is marked‐to‐market daily, and the change in value is recorded by the Fund as an unrealized gain or loss. When a forward foreign currency contract is closed, the Fund records a realized gain or loss equal to the difference between the value of the contract at the time it was opened and the value of the contract at the time it was closed.
| Semi-Annual Report | May 31, 2017 | 23 |
| Stone Harbor Emerging Markets Income Fund | Notes to Financial Statements |
May 31, 2017 (Unaudited)
Forward foreign currency contracts involve elements of market risk in excess of the amounts reflected in the Statement of Assets & Liabilities. The Fund bears the risk of an unfavorable change in the foreign exchange rate underlying the forward foreign currency contract. Risks may also arise upon entering into these contracts from the potential inability of the counterparties to meet the terms of their contracts.
Swap Agreements: The Fund invested in swap agreements during the period ended May 31, 2017. Swap agreements are bilaterally negotiated agreements between the Fund and a counterparty to exchange or swap investment cash flows, assets, or market‐linked returns at specified, future intervals. Swap agreements are privately negotiated in the over‐the‐counter market (“OTC swaps”) or may be executed in a multilateral or other trade facility platform, such as a registered exchange (“centrally cleared swaps”). In a centrally cleared swap, immediately following execution of the swap agreement, the swap agreement is novated to a central counterparty (the “CCP”) and the Fund’s counterparty on the swap agreement becomes the CCP. The Fund may enter into credit default swaps, interest rate swaps, total return swaps on individual securities or groups or indices of securities for hedging, investment or leverage purposes. In connection with these agreements, securities or cash may be identified as collateral or margin in accordance with the terms of the respective swap agreements to provide assets of value and recourse in the event of default or bankruptcy/insolvency.
Swaps are marked‐to‐market daily and changes in value, including the accrual of periodic amounts of interest, are recorded daily. Daily changes in valuation of centrally cleared swaps, if any, are recorded as a receivable or payable for the change in value as appropriate (“variation margin”). Each day the Fund may pay or receive cash, equal to the variation margin of the centrally cleared swap. OTC swap payments received or paid at the beginning of the measurement period represent premiums paid or received upon entering into the swap agreement to compensate for differences between the stated terms of the swap agreement and prevailing market conditions (credit spreads, interest rates, and other relevant factors). Generally, the basis of the OTC swaps is the unamortized premium received or paid. The periodic swap payments received or made by the Fund are recorded in the Statement of Operations as realized gains or losses, respectively. Any upfront fees paid are recorded as assets and any upfront fees received are recorded as liabilities. When the swap is terminated, the Fund will record a realized gain or loss equal to the difference between the proceeds from (or cost of) the closing transaction and the Fund’s basis in the contract, if any.
Credit Default Swap Contracts: The Fund entered into credit default swap contracts during the period ended May 31, 2017 for hedging purposes to gain market exposure or to add leverage to its portfolio. When used for hedging purposes, the Fund is the buyer of a credit default swap contract. In that case, the Fund is entitled to receive the par (or other agreed upon) value of a referenced debt obligation, index or other investment from the counterparty to the contract in the event of a default by a third party, such as a U.S. or foreign issuer, on the referenced debt obligation. In return, the Fund pays to the counterparty a periodic stream of payments over the term of the contract provided that no event of default has occurred. If no event of default occurs, the Fund has spent the stream of payments and received no benefit from the contract. When the Fund is the seller of a credit default swap contract, the Fund receives the stream of payments but is obligated to pay upon default of the referenced debt obligation. As the seller, the Fund effectively adds leverage to its portfolio because, in addition to its total assets, the Fund is subject to investment exposure on the notional amount of the swap.
In addition to the risks applicable to derivatives generally, credit default swaps involve special risks because they may be difficult to value, are highly susceptible to liquidity and credit risk and generally pay a return to the counterparty only in the event of an actual default by the issuer of the underlying obligation, as opposed to a credit downgrade or other indication of financial difficulty.
Interest Rate Swap Contracts: The Fund engaged in interest rate swap contracts during the period ended May 31, 2017. Interest rate swap agreements involve the exchange by the Fund with another party for their respective commitment to pay or receive interest on the notional amount of principal. Certain forms of interest rate swap agreements may include: (i) interest rate caps, under which, in return for a premium, one party agrees to make payments to the other to the extent that interest rates exceed a specified rate, or “cap”, (ii) interest rate floors, under which, in return for a premium, one party agrees to make payments to the other to the extent that interest rates fall below a specified rate, or “floor”, (iii) interest rate collars, under which a party sells a cap and purchases a floor or vice versa in an attempt to protect itself against interest rate movements exceeding given minimum or maximum levels, (iv) callable interest rate swaps, under which the buyer pays an upfront fee in consideration for the right to early terminate the swap transaction in whole, at zero costs and at a predetermined date and time prior to the maturity date, (v) spreadlocks, which allow the interest rate swap users to lock in the forward differential (or spread) between the interest rate swap rate and a specified benchmark, or (vi) basis swaps, under which two parties can exchange variable interest rates based on different segments of money markets.
| Stone Harbor Emerging Markets Income Fund | Notes to Financial Statements |
May 31, 2017 (Unaudited)
The tables below are a summary of the fair valuations of derivative instruments categorized by risk exposure.
Fair Values of derivative instruments on the Statement of Assets & Liabilities as of May 31, 2017:
| Risk Exposure | | Location | | Fair Value | | Location | | Fair Value | |
Interest Rate Risk (Swap Contracts)* | | Unrealized appreciation on interest rate swap contracts | | $ | 114,686 | | Unrealized depreciation on interest rate swap contracts | | $ | (1,131,481 | ) |
| Foreign Exchange Rate Risk (Forward Foreign Currency Contracts) | | Unrealized appreciation on forward foreign currency contracts | | | 156,462 | | Unrealized depreciation on forward foreign currency contracts | | | (441,641 | ) |
| Total | | | | $ | 271,148 | | | | $ | (1,573,122 | ) |
| * | The value presented includes cumulative gain/(loss) on open interest rate swap contracts; however, the value reflected on the accompanying Statement of Assets and Liabilities is only the unsettled variation margin receivable/(payable) as of May 31, 2017. |
The forward foreign currency contracts, credit default swaps, and interest rate swaps average value during the period ended May 31, 2017 is noted below:
| | Forward Foreign Currency Contracts | | Credit Default Swap Contracts | | | Interest Rate Swap Contracts | |
| | $ | (18,998,866) | | $ | (442,904 | ) | | $ | 100,073 | |
For the period ended May 31, 2017, the effect of derivative instruments on the Statement of Operations were as follows:
| Risk Exposure | | Location | | Realized Gain/(Loss) on Derivatives | | | Change in Unrealized Appreciation/(Depreciation) on Derivatives Recognized in Income | |
| Foreign Exchange Rate Risk (Forward Foreign Currency Contracts) | | Net realized gain/(loss) on forward foreign currency contracts/Net change in unrealized appreciation/(depreciation) on forward foreign currency contracts | | $ | 439,795 | | | $ | (1,196,458 | ) |
| Credit Risk (Swap Contracts) | | Net realized gain/(loss) on credit default swap contracts/Net change in unrealized appreciation/(depreciation) on credit default swap contracts | | | 1,092,128 | | | | (1,474,561 | ) |
| Interest Rate Risk (Swap Contracts) | | Net realized gain/(loss) on interest rate swap contracts/Net change in unrealized appreciation/(depreciation) on interest rate swap contracts | | | (340,308 | ) | | | (1,315,573 | ) |
| Total | | | | $ | 1,191,615 | | | $ | (3,986,592 | ) |
Offsetting Arrangements: Certain derivative contracts and reverse repurchase agreements are executed under standardized netting agreements. A derivative netting arrangement creates an enforceable right of set‐off that becomes effective, and affects the realization of settlement on individual assets, liabilities and collateral amounts, only following a specified event of default or early termination. Default events may include the failure to make payments or deliver securities timely, material adverse changes in financial condition or insolvency, the breach of minimum regulatory capital requirements, or loss of license, charter or other legal authorization necessary to perform under the contract. These agreements mitigate counterparty credit risk by providing for a single net settlement with a counterparty of all financial transactions covered by the agreement in an event of default as defined under such agreement.
| Semi-Annual Report | May 31, 2017 | 25 |
| Stone Harbor Emerging Markets Income Fund | Notes to Financial Statements |
May 31, 2017 (Unaudited)
The following table presents derivative financial instruments and reverse repurchase arrangements that are subject to enforceable netting arrangements, collateral arrangements or other similar agreements as of May 31, 2017.
Offsetting of Derivatives Assets
May 31, 2017
| | | | | | | | | | | | Gross Amounts Not Offset in the Statements of Assets and Liabilities | |
| | | Gross Amounts of Recognized Assets | | | Gross Amounts Offset in the Statements of Assets and Liabilities | | | Net Amounts Presented in the Statements of Assets and Liabilities | | | Financial Instruments Available for Offset(a) | | | Cash Collateral Received(a) | | | Net Amount Receivable | |
| Forward foreign currency contracts | | $ | 156,462 | | | $ | – | | | $ | 156,462 | | | $ | (156,462 | ) | | $ | – | | | $ | – | |
| Total | | $ | 156,462 | | | $ | – | | | $ | 156,462 | | | $ | (156,462 | ) | | $ | – | | | $ | – | |
Offsetting of Derivatives Liabilities
May 31, 2017
| | | | | | | | | | | | Gross Amounts Not Offset in the Statements of Assets and Liabilities | |
| | | Gross Amounts of Recognized Liabilities | | | Gross Amounts Offset in the Statements of Assets and Liabilities | | | Net Amounts Presented in the Statements of Assets and Liabilities | | | Financial Instruments Available for Offset(a) | | | Cash Collateral Pledged(a) | | | Net Amount Payable | |
| Forward foreign currency contracts | | $ | 441,641 | | | $ | – | | | $ | 441,641 | | | $ | (156,462 | ) | | $ | (270,000 | ) | | $ | 15,179 | |
| Reverse repurchase agreements | | | 110,433,550 | | | | – | | | | 110,433,550 | | | | (110,433,550 | ) | | | – | | | | – | |
| Total | | $ | 110,875,191 | | | $ | – | | | $ | 110,875,191 | | | $ | (110,590,012 | ) | | $ | (270,000 | ) | | $ | 15,179 | |
(a) | These amounts are limited to the derivatives asset/liability balance and, accordingly, do not include excess collateral received/pledged. |
4. TAX BASIS INFORMATION
Tax Basis of Distributions to Shareholders: Net investment income (loss) and net realized gain (loss) may differ for financial statement and tax purposes. The character of distributions made during the year from net investment income or net realized gains may differ from its ultimate characterization for federal income tax purposes. Also, due to the timing of dividend distributions, the fiscal year in which amounts are distributed may differ from the fiscal year in which the income or realized gain was recorded by the Fund.
The tax character of the distributions paid by the Fund during the fiscal year ended November 30, 2016 was as follows:
| Ordinary Income | | $ | 5,518,170 | |
| Return of Capital | | | 28,610,475 | |
| Total | | $ | 34,128,645 | |
| Stone Harbor Emerging Markets Income Fund | Notes to Financial Statements |
May 31, 2017 (Unaudited)
Components of Distributable Earnings on a Tax Basis: As of November 30, 2016, the components of distributable earnings on a tax basis were as follows:
| Accumulated Capital Loss | | $ | (75,516,256 | ) |
| Unrealized Depreciation | | | (18,627,111 | ) |
| Cumulative Effect of Other Timing Difference* | | | (2,968,562 | ) |
| Total | | $ | (97,111,929 | ) |
| * | Other temporary differences primarily due to deferred losses on straddles and amortization of credit default swap expenses |
The tax components of distributable earnings are determined in accordance with income tax regulations which may differ from the composition of net assets reported under GAAP. Accordingly, for the year ended November 30, 2016, certain differences were reclassified. These differences were primarily due to the differing tax treatment of certain investments and the amounts reclassified did not affect net assets.
The reclassifications were as follows:
| Fund | | Paid-in Capital | | | Accumulated Net Investment Income/(Loss) | | | Accumulated Net Realized Gain/(Loss) on Investments | |
| Stone Harbor Emerging Markets Income Fund | | $ | – | | | $ | (8,063,199 | ) | | $ | 8,063,199 | |
Unrealized Appreciation and Depreciation on Investments: At May 31, 2017, the aggregate gross unrealized appreciation and depreciation of investments for federal income tax purposes were as follows:
| Stone Harbor Emerging Markets Income Fund | | | |
| Gross appreciation on investments (excess of value over tax cost) | | $ | 12,834,792 | |
| Gross depreciation on investments (excess of tax cost over value) | | | (8,269,568 | ) |
| Net unrealized appreciation | | $ | 4,565,224 | |
| Cost of investments for income tax purposes | | $ | 338,353,369 | |
Capital Losses: As of November 30, 2016 the Fund had capital loss carryforwards which may reduce the Fund’s taxable income arising from future net realized gains on investments, if any, to the extent permitted by the Code and thus may reduce the amount of the distributions to shareholders which would otherwise be necessary to relieve the Fund of any liability for federal tax pursuant to the Code.
Capital losses deferred to next tax year were as follows:
| Fund | | Short-Term | | | Long-Term | |
| Stone Harbor Emerging Markets Income Fund | | $ | 24,859,450 | | | $ | 50,656,806 | |
5. ADVISORY FEES, TRUSTEE FEES, ADMINISTRATION FEES, CUSTODY FEES AND TRANSFER AGENT FEES
The Adviser receives a monthly fee at the annual rate of 1.00% of the average daily value of the Fund’s total assets (including any assets attributable to any leverage used) minus the Fund’s accrued liabilities (other than Fund liabilities incurred for any leverage) (“Managed Assets”).
ALPS Fund Services, Inc. (“ALPS”) serves as administrator to the Fund. Under the administration agreement, ALPS is responsible for calculating the net asset value of the common shares and generally managing the administrative affairs of the Fund. ALPS receives a monthly fee based on the average daily value of the Fund’s Managed Assets.
State Street Bank and Trust Company serves as the Fund’s custodian. Computershare, Inc. serves as the Fund’s transfer agent.
The Fund, along with the Stone Harbor Emerging Markets Total Income Fund and the Stone Harbor Investment Funds (collectively, the “Stone Harbor Fund Complex”) paid each Trustee who is not an interested person of the Investment Adviser or any of its affiliates an aggregate fee of $84,000 per year. The Chair of the Audit Committee of the Board receives additional compensation of $5,000 per year for his service as chair. These fees are allocated over the Stone Harbor Fund Complex based on the average net assets of each fund. Interested Trustees (as defined below) of the Trust are not compensated by the Stone Harbor Fund Complex. All Trustees are reimbursed for reasonable travel and out‐of‐pocket expenses incurred to attend such meetings. Officers of the Fund do not receive compensation for performing the duties of their office.
| Semi-Annual Report | May 31, 2017 | 27 |
| Stone Harbor Emerging Markets Income Fund | Notes to Financial Statements |
May 31, 2017 (Unaudited)
6. SECURITIES TRANSACTIONS
The cost of purchases and proceeds from sales of securities (excluding short‐term securities) during the period ended May 31, 2017, were as follows:
| | | Purchases | | Sales | |
| | $ | 184,347,171 | | $ | 174,612,848 | |
7. INDEMNIFICATIONS
Under the Trust’s organizational documents, its officers and Trustees are indemnified against certain liability arising out of the performance of their duties to the Trust. Additionally, in the normal course of business, the Trust enters into contracts with service providers that may contain general indemnification clauses. The Trust’s maximum exposure under these arrangements is unknown, as this would involve future claims that may be made against the Trust that have not yet occurred.
8. SUBSEQUENT EVENTS
Shareholder Distributions: On June 30, 2017, the Fund paid the regularly scheduled distribution in the amount of $0.18 per share to shareholders of record as of June 19, 2017. On July 27, 2017, the Fund paid the regularly scheduled distribution in the amount of $0.18 per share to shareholders of record as of July 17, 2017.
| Stone Harbor Emerging Markets Income Fund | Summary of Dividend Reinvestment Plan |
May 31, 2017 (Unaudited)
Unless the registered owner of Common Shares elects to receive cash by contacting Computershare (the “Plan Administrator”), all dividends declared on Common Shares will be automatically reinvested by the Plan Administrator for shareholders in the Fund’s Automatic Dividend Reinvestment Plan (the “Plan”), in additional Common Shares. Common Shareholders who elect not to participate in the Plan will receive all dividends and other distributions in cash paid by check mailed directly to the shareholder of record (or, if the Common Shares are held in street or other nominee name, then to such nominee) by the Plan Administrator as dividend disbursing agent. Participation in the Plan is completely voluntary and may be terminated or resumed at any time without penalty by notice if received and processed by the Plan Administrator prior to the dividend record date; otherwise such termination or resumption will be effective with respect to any subsequently declared dividend or other distribution. Such notice will be effective with respect to a particular dividend or other distribution (together, a “Dividend”). Some brokers may automatically elect to receive cash on behalf of Common Shareholders and may re‐invest that cash in additional Common Shares.
The Plan Administrator will open an account for each Common Shareholder under the Plan in the same name in which such Common Shareholder’s Common Shares are registered. Whenever the Fund declares a Dividend payable in cash, non‐participants in the Plan will receive cash and participants in the Plan will receive the equivalent in Common Shares. The Common Shares will be acquired by the Plan Administrator for the participants’ accounts, depending upon the circumstances described below, either (i) through receipt of additional unissued but authorized Common Shares from the Fund (“Newly Issued Common Shares”) or (ii) by purchase of outstanding Common Shares on the open market (“Open‐ Market Purchases”) on the NYSE or elsewhere. If, on the payment date for any Dividend, the closing market price plus estimated brokerage commissions per Common Share is equal to or greater than the NAV per Common Share, the Plan Administrator will invest the Dividend amount in Newly Issued Common Shares on behalf of the participants. The number of Newly Issued Common Shares to be credited to each participant’s account will be determined by dividing the dollar amount of the Dividend by the NAV per Common Share on the payment date; provided that, if the NAV is less than or equal to 95% of the closing market value on the payment date, the dollar amount of the Dividend will be divided by 95% of the closing market price per Common Share on the payment date. If, on the payment date for any Dividend, the NAV per Common Share is greater than the closing market value plus estimated brokerage commissions, the Plan Administrator will invest the Dividend amount in Common Shares acquired on behalf of the participants in Open‐Market Purchases.
In the event of a market discount on the payment date for any Dividend, the Plan Administrator will have until the last business day before the next date on which the Common Shares trade on an “ex‐dividend” basis or 30 days after the payment date for such Dividend, whichever is sooner (the “Last Purchase Date”), to invest the Dividend amount in Common Shares acquired in Open‐Market Purchases. It is contemplated that the Fund will pay monthly income Dividends. If, before the Plan Administrator has completed its Open‐Market Purchases, the market price per Common Share exceeds the NAV per Common Share, the average per Common Share purchase price paid by the Plan Administrator may exceed the NAV of the Common Shares, resulting in the acquisition of fewer Common Shares than if the Dividend had been paid in Newly Issued Common Shares on the Dividend payment date. Because of the foregoing difficulty with respect to Open‐Market Purchases, the Plan provides that if the Plan Administrator is unable to invest the full Dividend amount in Open‐Market Purchases during the purchase period or if the market discount shifts to a market premium during the purchase period, the Plan Administrator may cease making Open‐Market Purchases and may invest the uninvested portion of the Dividend amount in Newly Issued Common Shares at the NAV per Common Share at the close of business on the Last Purchase Date provided that, if the NAV is less than or equal to 95% of the then current market price per Common Share, the dollar amount of the Dividend will be divided by 95% of the market price on the payment date for purposes of determining the number of shares issuable under the Plan.
The Plan Administrator maintains all shareholders’ accounts in the Plan and furnishes written confirmation of all transactions in the accounts, including information needed by shareholders for tax records. Common Shares in the account of each Plan participant will be held by the Plan Administrator on behalf of the Plan participant, and each shareholder proxy will include those shares purchased or received pursuant to the Plan. The Plan Administrator will forward all proxy solicitation materials to participants and vote proxies for shares held under the Plan in accordance with the instructions of the participants.
In the case of Common Shareholders such as banks, brokers or nominees which hold shares for others who are the beneficial owners, the Plan Administrator will administer the Plan on the basis of the number of Common Shares certified from time to time by the record shareholder’s name and held for the account of beneficial owners who participate in the Plan.
There will be no brokerage charges with respect to Common Shares issued directly by the Fund. However, each participant will pay a pro rata share of brokerage commissions incurred in connection with Open‐Market Purchases. The automatic reinvestment of Dividends will not relieve participants of any federal, state or local income tax that may be payable (or required to be withheld) on such Dividends. Participants that request a sale of Common Shares through the Plan Administrator are subject to brokerage commissions.
The Fund reserves the right to amend or terminate the Plan. There is no direct service charge to participants with regard to purchases in the Plan; however, the Fund reserves the right to amend the Plan to include a service charge payable by the participants.
All correspondence or questions concerning the Plan should be directed to the Plan Administrator at 1‐866‐390‐3910.
| Semi-Annual Report | May 31, 2017 | 29 |
| Stone Harbor Emerging Markets Income Fund | Additional Information |
May 31, 2017 (Unaudited)
FUND PORTFOLIO HOLDINGS
The Fund files its complete schedule of portfolio holdings with the Securities and Exchange Commission (the “SEC”) for the first and third quarters of each fiscal year on Form N‐Q. The Fund’s Forms N‐Q are available (1) on the SEC’s website at http://www.sec.gov, or (2) they may be reviewed and copied at the SEC’s Public Reference Room in Washington DC (call 1‐800‐732‐0330 for information on the operation of the Public Reference Room).
PROXY VOTING
The policies and procedures used to determine how to vote proxies relating to securities held by the Fund are available (1) without charge, upon request, by calling 1‐877‐206‐0791, or (2) on the SEC’s website at http://www.sec.gov. Information regarding how the Fund voted proxies relating to portfolio securities during the most recent twelve‐month period ended June 30 is available by August 31 of each year (1) without charge, upon request, by calling 1‐877‐206‐0791, or (2) on the SEC’s website at http://www.sec.gov.
SHAREHOLDER MEETING
On March 10, 2017, the Stone Harbor Emerging Markets Income Fund (the “Fund”) held its Annual Meeting of Shareholders to consider the proposal set forth below. The results of the proposal were as follows:
Proposal: To Elect two (2) Trustees of the Fund
| | | Patrick Sheehan | |
| For | | | 14,037,230.451 | |
| Withheld | | | 214,563.520 | |
| | | Bruce Speca | |
| For | | | 14,071,790.917 | |
| Withheld | | | 180,003.054 | |
SENIOR OFFICER CODE OF ETHICS
The Fund files a copy of its code of ethics that applies to the Fund’s principal executive officer, principal financial officer or controller, or persons performing similar functions, with the SEC as an exhibit to its annual report on Form N‐CSR. This will be available on the SEC’s website at http://www.sec.gov.
BENCHMARK DESCRIPTIONS
| Index | Description |
| JPMorgan EMBI Global Diversified Index | The JPMorgan EMBI Global Diversified Index (EMBI Global Diversified) tracks total returns for U.S. dollar‐denominated debt instruments issued by emerging markets sovereign and quasi‐sovereign entities: Brady bonds, loans, and Eurobonds. The index limits the weights of those index countries with larger debt stocks by only including specified portions of these countries’ eligible current face amounts outstanding. The countries covered in the EMBI Global Diversified are identical to those covered by the EMBI Global. |
| JPMorgan CEMBI Broad Diversified Index | The JPMorgan CEMBI Broad Diversified Index (CEMBI Broad Diversified) tracks total returns of U.S. dollar‐denominated debt instruments issued by corporate entities in emerging market countries and consists of an investable universe of corporate bonds. The minimum amount outstanding required is $350 mm for the CEMBI Broad Diversified. The CEMBI Broad Diversified limits the weights of those index countries with larger corporate debt stocks by only including a specified portion of these countries’ eligible current face amounts of debt outstanding. |
| JPMorgan GBI EM Global Diversified Index | The JPMorgan GBI EM Global Diversified Index consists of regularly traded, liquid fixed‐rate, domestic currency government bonds to which international investors can gain exposure. The weightings among the countries are more evenly distributed within this index. |
| Stone Harbor Emerging Markets Income Fund | Additional Information |
May 31, 2017 (Unaudited)
PRIVACY POLICY
Stone Harbor Emerging Markets Income Fund (the “Fund”) has adopted the following privacy policies in order to safeguard the personal information of the Fund's customers and consumers in accordance with Regulation S‐P as promulgated by the U.S. Securities and Exchange Commission.
Fund officers are responsible for ensuring that the following policies and procedures are implemented:
| 1. | The Fund is committed to protecting the confidentiality and security of the information they collect and will handle personal customer and consumer information only in accordance with Regulation S‐P and any other applicable laws, rules and regulations(1). The Fund will ensure: (a) the security and confidentiality of customer records and information; (b) that customer records and information are protected from any anticipated threats and hazards; and (c) that customer records and information are protected from unauthorized access or use. |
| 2. | The Fund conducts its business affairs through its trustees, officers and third parties that provide services pursuant to agreements with the Fund. The Fund does not have any employees. It is anticipated that the trustees and officers of the Fund who are not employees of service providers will not have access to customer records and information in the performance of their normal responsibilities for the Fund. |
| 3. | The Fund may share customer information with its affiliates, subject to the customers' right to prohibit such sharing. |
| 4. | The Fund may share customer information with unaffiliated third parties only in accordance with the requirements of Regulation S‐P. Pursuant to this policy, the Fund will not share customer information with unaffiliated third parties other than as permitted by law, unless authorized to do so by the customer. |
Consistent with these policies, the Fund adopts the following procedures:
| 1. | The Fund will determine that the policies and procedures of its affiliates and Service Providers are reasonably designed to safeguard customer information and only permit appropriate and authorized access to and use of customer information through the application of appropriate administrative, technical and physical protections. |
| 2. | The Fund will direct each of its Service Providers to adhere to the privacy policy of the Fund and to their respective privacy policies with respect to the Fund's customer information and to take all action reasonably necessary so that the Fund is in compliance with the provisions of Regulation S‐P, including, as applicable, the development and delivery of privacy notices and the maintenance of appropriate and adequate records. |
| 3. | Each Service Provider is required to promptly report to the officers of the Fund any material changes to its privacy policy before, or promptly after, the adoption of such changes. |
(1) | Generally, shares of the Fund are held through financial intermediaries which are not considered "customers" of the Fund for purposes of Regulation S-P. |
This report, including the financial information herein, is transmitted to the shareholders of Stone Harbor Emerging Markets Income Fund for their information. It is not a prospectus, circular or representation intended for use in the purchase of shares of the Fund or any securities mentioned in this report.
Notice is hereby given in accordance with Section 23(c) of the Investment Company Act of 1940, as amended, that from time to time the Fund may purchase its common shares in the open market.
Information on the Fund is available at www.shiplpcef.com or by calling the Fund’s shareholder servicing agent at 1‐866‐390‐3910.
SPECIAL RISKS RELATED TO CYBER SECURITY
With the increased use of technologies such as the Internet and the dependence on computer systems to perform necessary business functions, the Fund and its service providers are susceptible to operational and information security risks. In general, cyber incidents can result from deliberate attacks or unintentional events. Cyber attacks include, but are not limited to, gaining unauthorized access to digital systems for purposes of misappropriating assets or sensitive information, corrupting data, or causing operational disruption. Cyber attacks may also be carried out in a manner that does not require gaining unauthorized access, such as causing denial of service attacks on websites. Cyber security and other operational and technology failures or breaches of the Fund’s service providers (including, but not limited to, the Adviser, the administrator, the transfer agent and the custodian) or the issuers of securities in which the Fund invests, have the ability to cause disruptions and impact business operations, potentially resulting in financial losses, the inability of Fund shareholders to transact business, delays or mistakes in the calculation of the Fund’s NAV or other materials provided to shareholders, violations of applicable privacy and other laws, regulatory fines, penalties, reputational damage, reimbursement or other compensation costs, and/or additional compliance costs. In addition, substantial costs may be incurred in order to prevent any cyber incidents in the future. The Fund and its shareholders could be negatively impacted as a result. While the Fund has established business continuity plans and systems designed to prevent such cyber attacks, there are inherent limitations in such plans and systems including the possibility that certain risks have not been identified. Furthermore, the Fund cannot control the cyber security plans and systems put in place by its service providers, financial intermediaries and issuers in which the Fund invests.
| Semi-Annual Report | May 31, 2017 | 31 |
| Stone Harbor Emerging Markets Income Fund | Additional Information |
May 31, 2017 (Unaudited)
ADDITIONAL INFORMATION
The Fund enters into contractual arrangements with various parties, including, among others, the Funds’ Adviser, shareholder service provider, custodian, transfer agent and administrator, who provide services to the Fund. Shareholders are not parties to, or intended (or “third‐party”) beneficiaries of, any of those contractual arrangements, and those contractual arrangements are not intended to create in any individual shareholder or group of shareholders any right to enforce them against the service providers or to seek any remedy under them against the service providers, either directly or on behalf of the Fund.
Neither the Fund's original or any subsequent prospectus or statement of additional information, any press release or shareholder report or any contracts filed as exhibits to the Fund's registration statement, is intended to, nor does it, give rise to an agreement or contract between the Fund and any investor, or give rise to any contract or other rights in any individual shareholder, group of shareholders or other person other than any rights conferred explicitly by applicable federal or state securities laws that may not be waived.
| Stone Harbor Emerging Markets Income Fund | Board Approval of Investment Advisory Agreement |
The investment advisory agreement (the “Agreement”) for Stone Harbor Emerging Markets Income Fund (the “Fund”) is subject to annual approval by (i) the vote of a majority of the entire Board of Trustees, or of a majority of the outstanding voting securities (as defined in the Investment Company Act of 1940, as amended (the “1940 Act”)), of the Fund, and (ii) the vote of a majority of the Trustees who are not interested persons of the Fund (the “Independent Trustees”). The Agreement is terminable with respect to the Fund by Stone Harbor Investment Partners LP, the Fund’s investment adviser (the “Adviser”), a majority of the Trustees, or a vote of a majority of the outstanding voting securities of the Fund, without penalty, by not less than 60 days’ prior written notice. The Agreement will terminate automatically in the event of its assignment (as defined for purposes of the 1940 Act).
The Board of Trustees, including the Independent Trustees, meets over the course of the year with representatives of the Adviser, including the Fund’s portfolio managers, and regularly reviews detailed information regarding the investment program and performance of the Fund. The Board of Trustees also receives periodic updates between meetings. The Trustees, including the Independent Trustees, met on April 19, 2017 to review the Agreement for the Fund and to determine whether to approve the continuation of the Agreement for an additional one‐year period. The Trustees considered all information they deemed reasonably necessary to evaluate the terms thereof. In connection with this meeting, the Trustees received materials to assist them with their review. These materials included, among other things, (i) information provided in response to a request for information from the Independent Trustees’ independent legal counsel; (ii) information about the Adviser, including the Adviser’s financial results and financial condition, and the services provided by the Adviser; (iii) information on the Fund’s investment objective and strategies and the size, education and experience of the Adviser’s investment staff; (iv) information on the Fund’s investment performance and the performance of a group of similar funds (some of which was prepared by a third party); (v) information on the Fund’s advisory fee and other expenses, including information about the fees charged to institutional accounts managed by the Adviser and comparisons of the Fund’s fees to the fees of a group of similar funds prepared by a third party; (vi) information about the profitability of the Agreement to the Adviser; and (vii) information regarding the Fund’s use of leverage. Throughout the process, the Independent Trustees were afforded the opportunity to ask questions and request additional information. In addition, the Independent Trustees were assisted by independent legal counsel throughout the process.
In considering whether to approve the continuation of the Agreement, the Board of Trustees, including the Independent Trustees, did not identify any single factor as determinative. Individual Trustees may have evaluated the information presented differently from one another, giving different weights to various factors. Matters considered by the Trustees, including the Independent Trustees, in connection with their approval of the Agreement included, but were not limited to, the following:
The nature, extent and quality of the services provided to the Fund under the Agreement.
The Trustees considered the nature, extent and quality of the services provided by the Adviser to the Fund. In this regard, the Trustees took into account the experience of the Fund’s portfolio management team and of the Adviser’s senior management, and the time and attention they devote to the Fund. The Trustees also considered the Fund’s record of compliance with its investment restrictions and the compliance programs of the Fund and the Adviser. They also considered the compliance‐related resources the Adviser provided to the Fund, including resources designed to ensure compliance with the investment objectives, policies and restrictions of the Fund.
After reviewing these and related factors, the Trustees concluded, within the context of their overall conclusions regarding the Agreement, that the nature, extent and quality of the services provided by the Adviser supported the renewal of the Agreement.
Investment performance of the Fund and the Adviser.
The Trustees reviewed performance information, including information prepared by a third party, for the Fund for various time periods since the Fund’s inception. The review included a comparison of the Fund’s performance to the performance of a group of comparable funds selected by a third party and the Fund’s benchmark. The Trustees also considered the Adviser’s performance and reputation generally and its investment techniques, risk management controls and decision‐making processes. The Trustees noted that although the Fund’s performance lagged the relevant benchmark and peer group median for the five‐year period, the Fund’s performance exceeded that of its benchmark and peer group median for the three‐year and one‐year periods. The Trustees concluded that other factors relevant to performance supported renewal, including that the Fund’s more recent performance had shown improvement when compared to relevant performance benchmarks and categories.
After reviewing these and related factors, the Trustees concluded, within the context of their overall conclusions regarding the Agreement, that these factors supported the renewal of the Agreement.
The costs of the services to be provided and profits to be realized by the Adviser from its relationship with the Fund.
The Trustees considered the fee charged to the Fund for advisory services as well as the total expense level of the Fund. The Adviser furnished information to the Trustees compiled by a third party showing a comparison of the Fund’s advisory fee and total expense levels compared to a group of comparable funds selected by the third party. The Trustees noted that the Fund’s advisory fee and total expenses align competitively with comparable groups of funds. The Trustees noted that the Fund’s total expenses, measured both on common assets and common and leveraged assets, were below the median total expenses of the comparable funds selected by the third party. The Adviser also provided information about the costs to it of providing services to the Fund, including information about how such costs are determined, and information about its profitability with respect to its management of the Fund, as well as information about the advisory fees it charges to other funds and institutional separate accounts with similar strategies and information about differences in such fees, as well as information about the differences between those funds and accounts and the Fund. The Trustees also considered the Adviser’s description of how profitability is determined and the reason for differences in profitability between funds in the Stone Harbor fund complex and from year to year. The Trustees also considered the demands and complexity of the investment management of the Fund as compared to the complexity of managing other funds and separate accounts, in particular representations from management about the complexities associated with managing the Fund’s strategy allocations, distributions and leverage. The Trustees also considered the complexity and obligations associated with managing an NYSE‐traded fund such as the Fund. The Trustees also considered the Adviser’s representation that it does not sub‐advise any third party funds whose strategies utilize leverage and combine investing in emerging market corporate debt, emerging market hard dollar debt and emerging market local currency debt. The Trustees also considered the conflicts of interest associated with the Fund’s use of leverage (including the fact that the advisory fee is charged on total assets), as well as the effect of leverage on the Fund’s yield and total return.
| Semi-Annual Report | May 31, 2017 | 33 |
| Stone Harbor Emerging Markets Income Fund | Board Approval of Investment Advisory Agreement |
May 31, 2017 (Unaudited)
After reviewing these and related factors, the Trustees concluded, within the context of their overall conclusions regarding the Agreement, that the advisory fee for the Fund was fair and reasonable, and that the costs of these services generally and the related profitability of the Adviser in respect of its relationship with the Fund supported the renewal of the Agreement.
Economies of Scale.
The Trustees considered to what extent economies of scale would likely be realized as the Fund grows and whether those economies would be shared with the Fund through breakpoints in its investment advisory fee or other means. The Trustees noted that because the Fund is a closed‐end fund and does not have any plans to offer more shares to the public, it is unlikely to grow significantly.
After reviewing these and related factors, the Trustees concluded, within the context of their overall conclusions regarding the Agreement, that the extent to which economies of scale would be shared with the Fund supported the approval of the Agreement.
The Trustees also considered other factors, which included but were not limited to the following:
| • | So‐called “fallout benefits” to the Adviser, such as the benefits from being associated with an NYSE‐traded investment company. The Trustees also considered the possible conflicts of interest associated with these fallout and other benefits, and the reporting, disclosure and other processes in place to disclose and monitor such possible conflicts of interest. |
| • | The Trustees’ review and discussion of the Fund’s advisory arrangements in prior years, and management’s record of responding to Trustee concerns raised during the year and in prior years. |
Based on their evaluation of all factors they deemed to be material, including those factors described above, the Trustees, including the Independent Trustees, concluded that the existing investment advisory agreement for Stone Harbor Emerging Markets Income Fund should be continued through June 20, 2018.
| Stone Harbor Emerging Markets Income Fund | Trustees & Officers |
May 31, 2017 (Unaudited)
The business and affairs of the Fund are managed under the direction of its Board of Trustees. The Board of Trustees approves all significant agreements between the Fund and the persons or companies that furnish services to the Fund, including agreements with its distributor, investment adviser, administrator, custodian and transfer agent. The day to day operations of the Fund are delegated to the Fund’s Adviser and administrator.
The name, age and principal occupations for the past five years of the Trustees and officers of the Fund are listed below, along with the number of portfolios in the Fund complex overseen by and the other directorships held by each Trustee. The Fund’s Statement of Additional Information includes additional information about the Trustees and is available without a charge, upon request, by calling 1‐866‐699‐8158.
INDEPENDENT TRUSTEES
Name and Year of Birth(1) | Position(s) Held with the Fund | Term of Office And Length of Time Served(2) | Principal Occupation(s) During Past 5 Years | Number of Portfolios in Fund Complex Overseen by Trustee(3) | Other Directorships Held by Trustee |
Alan Brott
1942
Class I | Chairman of the
Audit Committee;
Trustee | Trustee:
Since 2010 Term Expires:
2018 | Columbia University ‐ Associate Professor, 2000‐Present; Consultant, 1991‐Present. | 11 | Stone Harbor Investment Funds, Stone Harbor Emerging Markets Total Income Fund, Grosvenor Registered Multi‐Strategy Fund, Man FRM Alternative Multi‐Strategy Fund, Excelsior Private Markets Fund II, Excelsior Private Markets Fund III, Excelsior Venture Partners III, UST Global Private Markets and NB CrossRoads Private Markets Fund. |
Heath B. McLendon
1933
Class II | Trustee | Trustee:
Since 2010 Term Expires:
2019 | Retired since 2006; formerly Citigroup ‐ Chairman of Equity Research Oversight Committee. | 11 | Stone Harbor Investment Funds and Stone Harbor Emerging Markets Total Income Fund. |
Patrick Sheehan
1947
Class III | Trustee | Trustee:
Since 2010 Term Expires:
2020 | Retired since 2002; formerly, Citigroup Asset Management‐ Managing Director and Fixed Income Portfolio Manager. | 11 | Stone Harbor Investment Funds and Stone Harbor Emerging Markets Total Income Fund. |
Glenn Marchak
1956
Class II | Trustee | Trustee:
Since 2015 Term Expires:
2019 | Consultant and Private Investor. | 11 | Stone Harbor Investment Funds, Stone Harbor Emerging Markets Total Income Fund, Apollo Tactical Income Fund Inc. and Apollo Senior Floating Rate Fund Inc. |
Bruce Speca
1956
Class III | Trustee | Trustee:
Since 2016 Term Expires:
2020 | Trustee, The Advisors’ Inner Circle Fund, The Advisors’ Inner Circle Fund II, Bishop Street Funds and The KP Funds (November 2011‐Present); Global Head of Asset Allocation, Manulife Asset Management (subsidiary of Manulife Financial), 2010 to 2011. Executive Vice President – Investment Management Services, John Hancock Financial Services (subsidiary of Manulife Financial), 2003 to 2010. | 11 | Stone Harbor Investment Funds, Stone Harbor Emerging Markets Total Income Fund, The Advisors’ Inner Circle Fund, The Advisors’ Inner Circle Fund II, Bishop Street Funds and The KP Funds. |
| Semi-Annual Report | May 31, 2017 | 35 |
| Stone Harbor Emerging Markets Income Fund | Trustees & Officers |
May 31, 2017 (Unaudited)
INTERESTED TRUSTEE
Name and Year of Birth(1) | Position(s) Held with the Fund | Term of Office And Length of Time Served(2) | Principal Occupation(s) During Past 5 Years | Number of Portfolios in Fund Complex Overseen by Trustee(3) | Other Directorships Held by Trustee |
Thomas K.
Flanagan*
1953
Class I | Chairman and
Trustee | Trustee:
Since 2012 Term Expires:
2018 | Since April 2006, Portfolio Manager of Stone Harbor; prior to April 2006, Managing Director and Senior Portfolio Manager for emerging markets debt portfolios at Salomon Brothers Asset Management Inc.; joined Salomon Brothers Asset Management Inc. in 1991. | 11 | Stone Harbor Investment Funds and Stone Harbor Emerging Markets Total Income Fund. |
OFFICERS
Name and Year of Birth(1) | Position(s) Held with the Fund | Term of Office And Length of Time Served(2) | Principal Occupation(s) During Past 5 Years |
Peter J. Wilby
1958 | President and Chief Executive Officer | Since 2010 | Co‐portfolio manager of the Fund; since April 2006, Chief Investment Officer of Stone Harbor; prior to April 2006, Chief Investment Officer — North American Fixed Income at Citigroup Asset Management; joined Citigroup or its predecessor firms in 1989. |
Pablo Cisilino
1967 | Executive Vice President | Since 2010 | Co‐portfolio manager of the Fund; since July 2006, Portfolio Manager of Stone Harbor; from June 2004 to July 2006, Executive Director for Sales and Trading in Emerging Markets at Morgan Stanley Inc.; prior to June 2004, Vice President for local markets and FX sales and trading, Goldman Sachs; joined Goldman Sachs in 1994. |
James E. Craige
1967 | Executive Vice President | Since 2010 | Co‐portfolio manager of the Fund; since April 2006, Portfolio Manager of Stone Harbor; prior to April 2006, Managing Director and Senior Portfolio Manager for emerging markets debt portfolios at Salomon Brothers Asset Management Inc.; joined Salomon Brothers Asset Management Inc. in 1992. |
David Griffiths
1964 | Executive Vice President | Since 2010 | Co‐portfolio manager of the Fund; since April 2006, Portfolio Manager of Stone Harbor; prior to April 2006, Senior Portfolio Manager and economist responsible for market opportunity analysis, hedging and alternative asset allocation strategies; joined Salomon Brothers Asset Management Limited in 1993. |
David A. Oliver
1959 | Executive Vice President | Since 2010 | Co‐portfolio manager of the Fund; since June 2008, Portfolio Manager of Stone Harbor; from 1986 to June 2008, Managing Director in Emerging Market sales and trading at Citigroup. |
William Perry
1962 | Executive Vice President | Since 2012 | Co‐portfolio manager of the Fund; since September 2012, Portfolio Manager of Stone Harbor; from August 2010 to August 2012, Emerging Markets Corporate Portfolio Manager at Morgan Stanley Investment Management; prior to 2010, Managing Director/Portfolio Manager in the Global Special Opportunities Group for Latin American Special Situations at JPMorgan/Chase. |
| Stone Harbor Emerging Markets Income Fund | Trustees & Officers |
May 31, 2017 (Unaudited)
OFFICERS (CONTINUED)
Name and Year of Birth(1) | Position(s) Held with the Fund | Term of Office And Length of Time Served(2) | Principal Occupation(s) During Past 5 Years |
David Scott
1961 | Executive Vice President | Since 2010 | Co‐portfolio manager of the Fund; since April 2006, Portfolio Manager of Stone Harbor; prior to April 2006, Managing Director and Head of Traditional Investment Group responsible for the global bond portfolios at Salomon Brothers Asset Management Limited; joined Salomon Brothers Asset Management Limited in 1983. |
Thomas M.
Reynolds
1960 | Principal Financial and
Accounting Officer | Since 2014 | Since February 2008, Controller of Stone Harbor; from February 2006 to February 2008, Vice President of Portfolio Administration for Goldman Sachs Asset Management; from 1991 to 2006, Citigroup Asset Management. |
Adam J. Shapiro
1963 | Chief Legal Officer and Secretary | Since 2010 | Since April 2006, General Counsel of Stone Harbor; from April 2004 to March 2006, General Counsel, North American Fixed Income, Salomon Brothers Asset Management Inc.; from August 1999 to March 2004, Director of Product and Business Development, Citigroup Asset Management. |
Jeffrey S. Scott
1959 | Chief Compliance Officer and
Assistant Secretary | Since 2010 | Since April 2006, Chief Compliance Officer of Stone Harbor; from October 2006 to March 2007, Director of Compliance, New York Life Investment Management LLC; from July 1998 to September 2006, Chief Compliance Officer, Salomon Brothers Asset Management Inc. |
Amanda Suss
1969 | Treasurer | Since 2014 | Since July 2011, Senior Finance Associate of Stone Harbor; from 2000 to July 2006, Director of Business Operations at Citigroup Asset Management; From April 1994 to April 2000, Mutual Fund Accounting Manager at Smith Barney Asset Management. |
Vilma V. DeVooght
1977 | Assistant Secretary | Since 2015 | Senior Counsel, ALPS, since 2014; Associate Counsel, First Data Corporation 2012 to 2014; Legal Counsel, Invesco 2009 to 2011. |
Erich Rettinger
1985 | Assistant Treasurer | Since 2016 | Fund Controller, since 2013, and Fund Accountant, 2007 to 2013, ALPS. |
| * | Mr. Flanagan is an interested person of the Trust (as defined in the 1940 Act) (an “Interested Trustee”) because of his position with the Adviser. |
(1) | The business address of each Trustee and Officer of the Fund is c/o Stone Harbor Investment Partners LP, 31 West 52nd Street, 16th Floor, New York, NY 10019. |
(2) | Each Trustee serves until retirement, resignation or removal from the Board. Officers are typically elected every year, unless an officer earlier retires, resigns or is removed from office. |
(3) | The term “Fund Complex” as used in this table includes the Fund and the following registered investment companies: Stone Harbor Emerging Markets Debt Fund, Stone Harbor High Yield Bond Fund, Stone Harbor Local Markets Fund, Stone Harbor Emerging Markets Corporate Debt Fund, Stone Harbor Investment Grade Fund, Stone Harbor Strategic Income Fund, Stone Harbor Emerging Markets Debt Allocation Fund, Stone Harbor Emerging Markets Debt Blend Fund, Stone Harbor 500 Plus Fund and Stone Harbor Emerging Markets Total Income Fund. As of May 31, 2017, the Stone Harbor Emerging Markets Debt Blend Fund had not commenced operations. |
| Semi-Annual Report | May 31, 2017 | 37 |
| | INVESTMENT ADVISER |
| | Stone Harbor Investment Partners LP |
| | 31 W. 52nd Street 16th Floor |
| | New York, New York 10019 |
| | |
| | ADMINISTRATOR & FUND ACCOUNTANT |
| | ALPS Fund Services, Inc. |
| | 1290 Broadway, Suite 1100 |
| | Denver, Colorado 80203 |
| | |
| | TRANSFER AGENT |
| | Computershare, Inc. |
| | 480 Washington Blvd. |
| | Jersey City, NJ 07310 |
| | |
| | CUSTODIAN |
| | State Street Bank and Trust Company |
| | One Iron Street |
| | Boston, MA 02210 |
| | |
| | LEGAL COUNSEL |
| | Ropes & Gray LLP |
| | 1211 Avenue of the Americas |
| | New York, New York 10036 |
| | |
| | INDEPENDENT REGISTERED PUBLIC ACCOUNTING FIRM |
| | Deloitte & Touche LLP |
| | 555 17th Street, Suite 3600 |
| | Denver, Colorado 80202 |
Not applicable to this Report.
| Item 3. | Audit Committee Financial Expert. |
Not applicable to this Report.
| Item 4. | Principal Accountant Fees and Services. |
Not applicable to this Report.
| Item 5. | Audit Committee of Listed Registrants. |
Not applicable to this Report.
| (a) | Schedule of Investments in securities of unaffiliated issuers as of the close of the reporting period is included as part of the Report to Stockholders filed under Item 1 of this Form N-CSR. |
| Item 7. | Disclosure of Proxy Voting Policies and Procedures for Closed-End Management Investment Companies. |
Not applicable to this Report.
| Item 8. | Portfolio Managers of Closed-End Management Investment Companies. |
Not applicable to this Report.
| Item 9. | Purchases of Equity Securities by Closed-End Management Investment Company and Affiliated Purchasers. |
Not applicable to this Report.
| Item 10. | Submission of Matters to a Vote of Security Holders. |
There have been no material changes to the procedures by which shareholders may recommend nominees to the Registrant’s Board of Trustees, where those changes were implemented after the Registrant last provided disclosure in response to the requirements of Item 407(c)(2) of Regulation S-K, or this Item.
| Item 11. | Controls and Procedures. |
| (a) | The Registrant’s principal executive officer and principal financial officer have concluded that the Registrant’s disclosure controls and procedures (as defined in Rule 30a-3(c) under the Investment Company Act of 1940, as amended) are effective as of a date within 90 days of the filing date of this Report. |
| (b) | There was no change in the Registrant’s internal control over financial reporting (as defined in Rule 30a-3(d) under the Investment Company Act of 1940, as amended) that occurred during the second fiscal quarter of the period covered by this Report that has materially affected, or is reasonably likely to materially affect, the Registrant’s internal control over financial reporting. |
| (a)(1) | Not applicable to this Report. |
| (a)(2) | The certifications required by Rule 30a-2(a) of the Investment Company Act of 1940, as amended, and Section 302 of the Sarbanes-Oxley Act of 2002 are attached hereto as Exhibit 99.Cert. |
| (a)(3) | Not applicable to Registrant. |
| (b) | The certifications by the Registrant’s principal executive officer and principal financial officer, as required by Rule 30a-2(b) of the Investment Company Act of 1940, as amended, and Section 906 of the Sarbanes-Oxley Act of 2002 are attached hereto as Exhibit 99.906Cert. |
| (c) | Pursuant to the Securities and Exchange Commission’s Order granting relief from Section 19(b) of the Investment Company Act of 1940, as amended, dated October 12, 2011, the form of Section 19(a) Notices to Beneficial Owners are attached hereto as Exhibit 12(c). |
SIGNATURES
Pursuant to the requirements of the Securities Exchange Act of 1934 and the Investment Company Act of 1940, the Registrant has duly caused this report to be signed on its behalf by the undersigned, thereunto duly authorized.
Stone Harbor Emerging Markets Income Fund
By: | /s/ Peter J. Wilby | |
| Peter J. Wilby | |
| President and Chief Executive Officer/Principal Executive Officer |
| | | |
| Date: | August 10, 2017 | |
Pursuant to the requirements of the Securities Exchange Act of 1934 and the Investment Company Act of 1940, this report has been signed below by the following persons on behalf of the Registrant and in the capacities and on the dates indicated.
Stone Harbor Emerging Markets Income Fund
By: | /s/ Peter J. Wilby | |
| Peter J. Wilby | |
| President and Chief Executive Officer/Principal Executive Officer |
| | | |
| Date: | August 10, 2017 | |
By: | /s/ Thomas M. Reynolds | |
| Thomas M. Reynolds | |
| Principal Financial Officer/Principal Accounting Officer |
| | | |
| Date: | August 10, 2017 | |