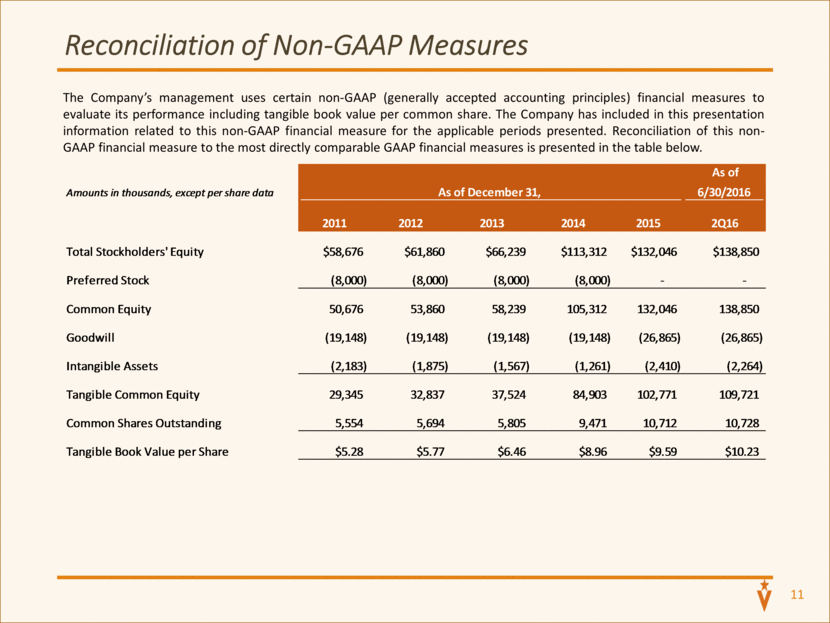
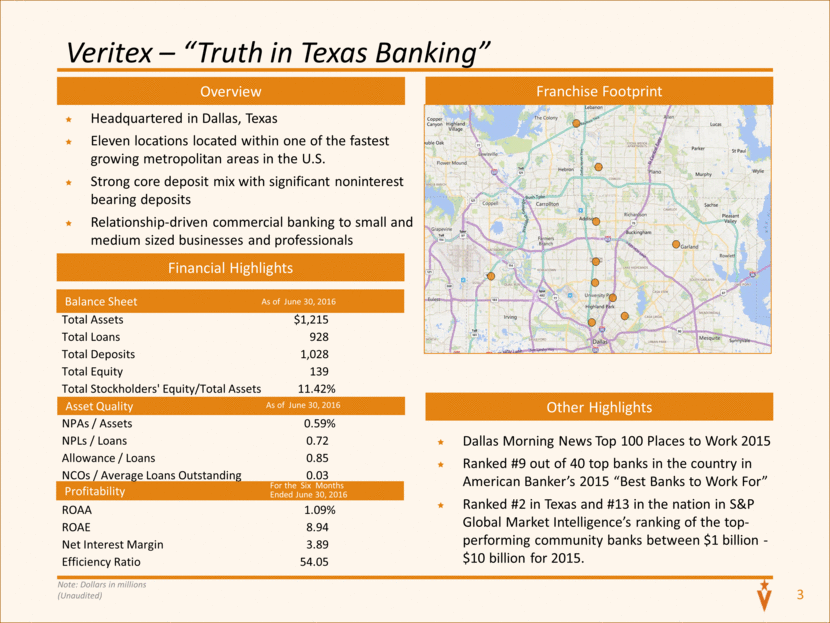
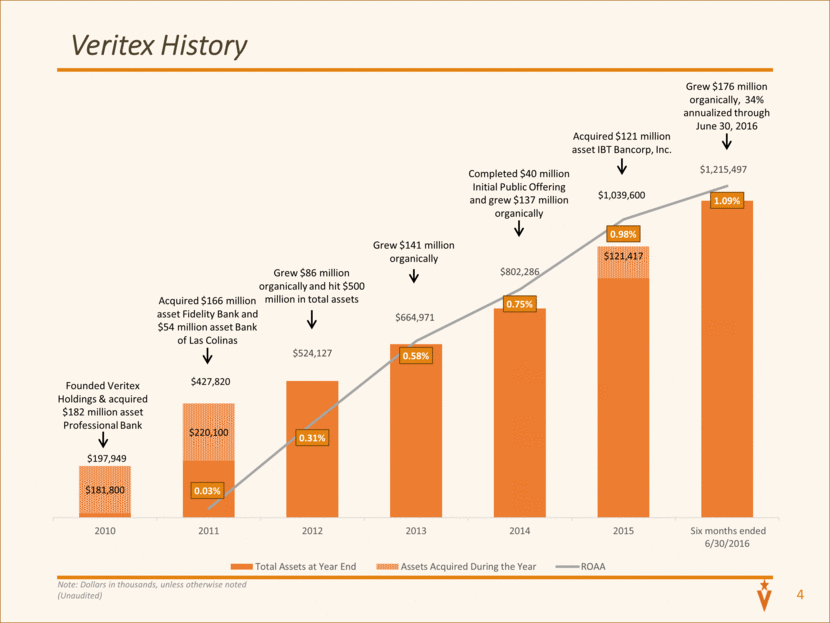
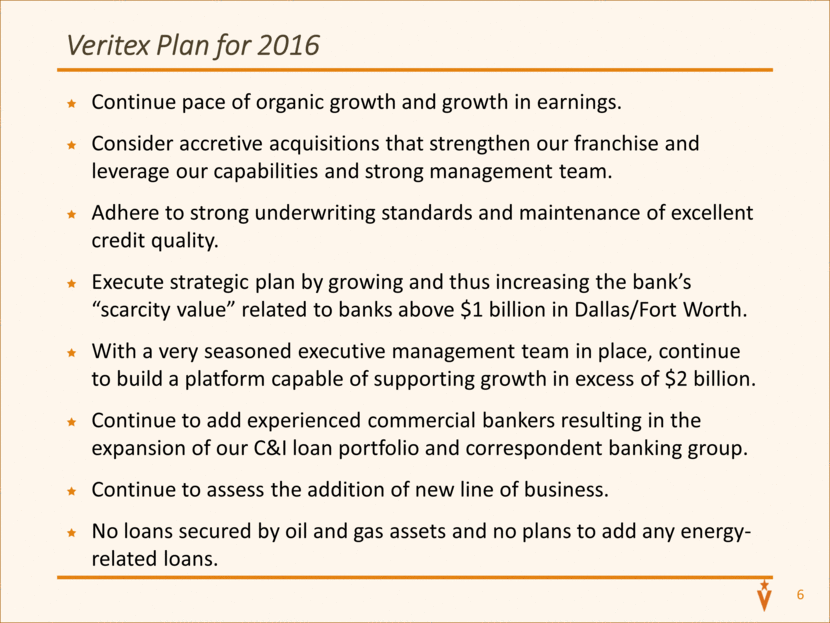
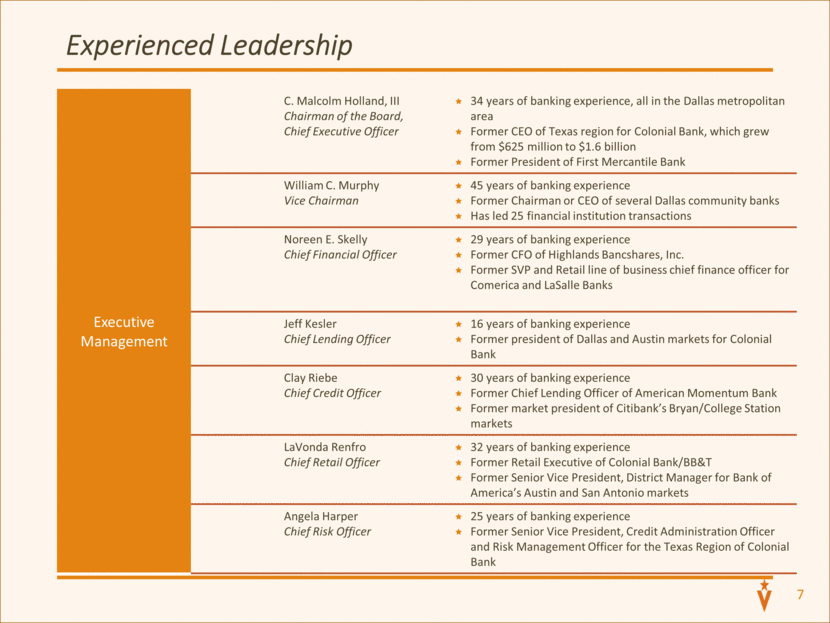
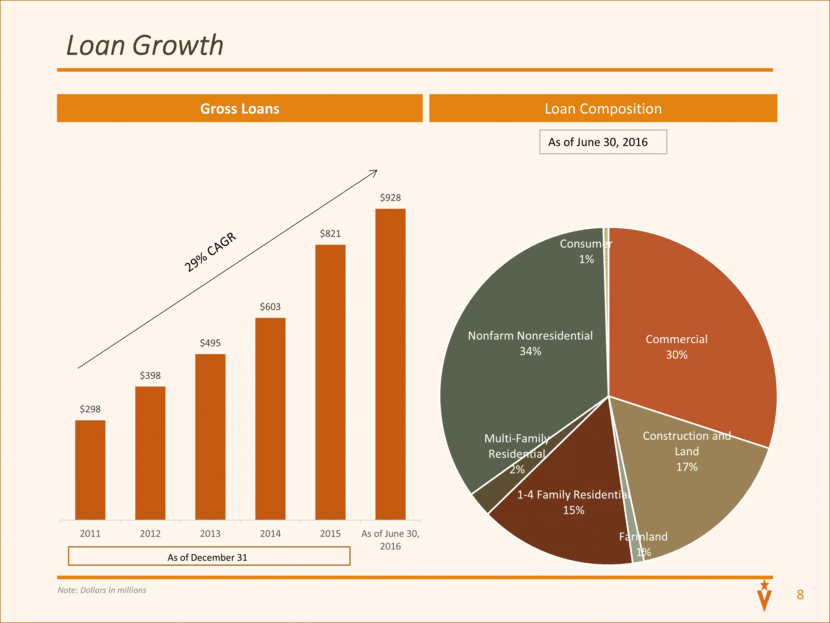
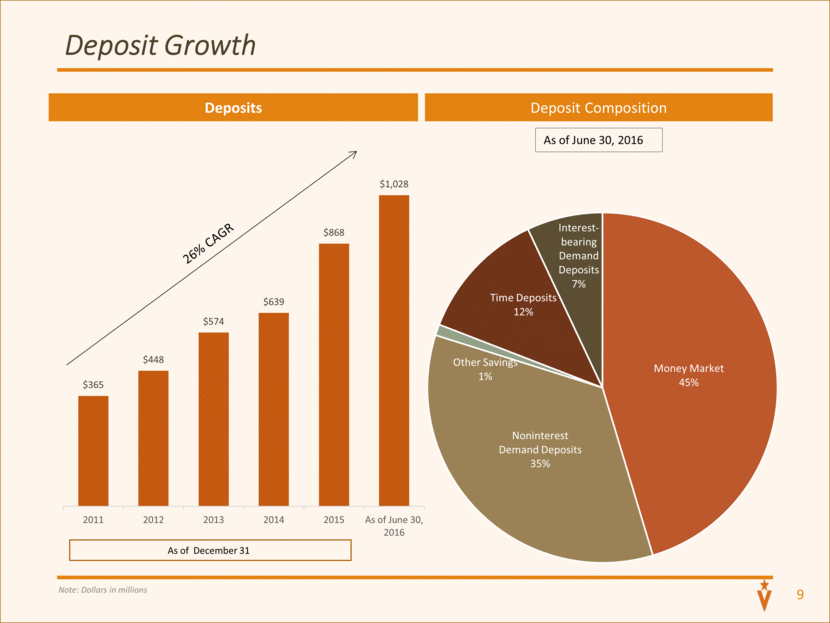
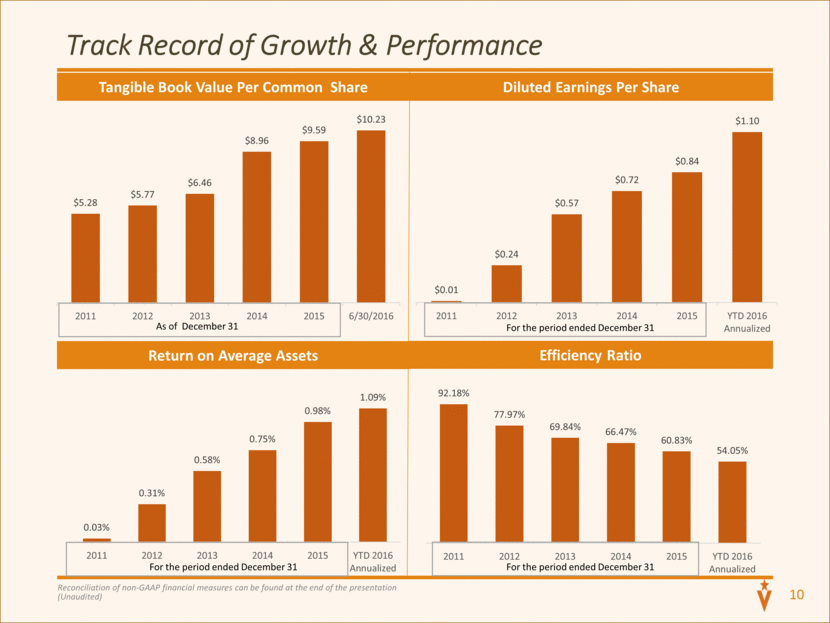
11 Reconciliation of Non-GAAP Measures The Company’s management uses certain non-GAAP (generally accepted accounting principles) financial measures to evaluate its performance including tangible book value per common share. The Company has included in this presentation information related to this non-GAAP financial measure for the applicable periods presented. Reconciliation of this non-GAAP financial measure to the most directly comparable GAAP financial measures is presented in the table below. Commercial 264,492 Construction and Land 143,405 Farmland 11,288 1-4 Family Residential 136,734 Multi-Family Residential 16,594 Nonfarm Nonresidential 37,949 Consumer 4,953 615,415 Money Market 457,887 Noninterest Demand Deposits 310,818 Other Savings 10,189 Time Deposits 106,921 Interest-bearing Demand Deposits 74,580 960,395 ROAA ER Diluted Earnings Per Share 2011 0.03% 92.18% $0.01 103.23% -10.14% 2012 0.31% 77.97% $0.24 2013 0.58% 69.84% $0.57 2014 0.75% 66.47% $0.72 2015 0.98% 60.83% $0.84 1Q16 1.04% 54.01% $1.04 Amounts in thousands, except per share data As of December 31, As of 6/30/2016 2011 2012 2013 2014 2015 2Q16 Total Stockholders' Equity $58,676 $61,860 $66,239 $113,312 $132,046 $138,850 Preferred Stock (8,000) (8,000) (8,000) (8,000) - - Common Equity 50,676 53,860 58,239 105,312 132,046 138,850 Goodwill (19,148) (19,148) (19,148) (19,148) (26,865) (26,865) Intangible Assets (2,183) (1,875) (1,567) (1,261) (2,410) (2,264) Tangible Common Equity 29,345 32,837 37,524 84,903 102,771 109,721 Common Shares Outstanding 5,554 5,694 5,805 9,471 10,712 10,728 1,000 Tangible Book Value per Share $5.28 $5.77 $6.46 $8.96 $9.59 $10.23 Total Loans $298 $398 $495 $603 $821 $885 29% Total Deposits $365 $448 $574 $639 $868 $946 25% 2010 2011 2012 2013 2014 2015 QTD 3/31/2016 Total Assets at Year End $16,149 $217,720 $524,127 $664,971 $802,286 $918,183 $1,130,480 Assets Acquired During the Year $181,800 $220,100 $121,417 Total Assets at Year End $197,949 $437,820 $524,127 $664,971 $802,286 $1,039,600 $1,130,480 ROAA 0.03% 0.31% 0.58% 0.75% 0.98% 1.04% Commercial 43% Construction and Land 23% Farmland 2% 1 - 4 Family Residential 22% Multi - Family Residential 3% Nonfarm Nonresidential 6% Consumer 1% Money Market 48% Noninterest Demand Deposits Other Savings 1% Time Deposits 11% Interest - bearing Demand Deposits 8%
