
Sandler O’Neill East Coast Financial Services Conference November 6-7, 2018
Safe Harbor Statement NO OFFER OR SOLICITATION Important Additional Information will be Filed with the SEC This presentation does not constitute an offer to sell or the solicitation of an offer to buy any securities or a solicitation of any vote or approval with respect to the proposed acquisition by Veritex of Green. No offer of securities shall be made except by means of a prospectus meeting the requirements of the Securities Act of 1933, as amended, and no offer to sell or solicitation of an offer to buy shall be made in any jurisdiction in which such offer, solicitation or sale would be unlawful. In connection with the proposed transaction, Veritex has filed with the U.S. Securities and Exchange Commission (the “SEC”) a Registration Statement on Form S-4 (File No. 333-227161) containing a joint proxy statement of Veritex and Green and a prospectus of Veritex (the “Joint Proxy/Prospectus”), and each of Veritex and Green may file with the SEC other documents regarding the proposed transaction. The definitive Joint Proxy/Prospectus has been mailed to shareholders of Veritex and Green. SHAREHOLDERS ARE URGED TO READ THE REGISTRATION STATEMENT AND THE JOINT PROXY/PROSPECTUS REGARDING THE TRANSACTION CAREFULLY AND IN THEIR ENTIRETY AND ANY OTHER DOCUMENTS FILED WITH THE SEC BY VERITEX AND GREEN, AS WELL AS ANY AMENDMENTS OR SUPPLEMENTS TO THOSE DOCUMENTS, BECAUSE THEY WILL CONTAIN IMPORTANT INFORMATION ABOUT THE PROPOSED TRANSACTION. Investors can obtain free copies of the Registration Statement and the Joint Proxy/Prospectus and other documents filed with the SEC by Veritex and Green through the website maintained by the SEC at www.sec.gov. Free copies of the Registration Statement and the Joint Proxy/Prospectus and other documents filed with the SEC can also be obtained by directing a request to Veritex Holdings, Inc., 8214 Westchester Drive, Suite 400, Dallas, Texas 75225, or by directing a request to Green Bancorp, Inc., 4000 Greenbriar Street, Houston, Texas 77098. Participants in the Solicitation Veritex, Green and their respective directors and certain of their executive officers and employees may be deemed to be participants in the solicitation of proxies from the shareholders of Green or Veritex in respect of the proposed transaction. Information regarding Veritex’s directors and executive officers is available in its proxy statement for its 2018 annual meeting of shareholders, which was filed with the SEC on April 3, 2018, and information regarding Green’s directors and executive officers is available in its proxy statement for its 2018 annual meeting of shareholders, which was filed with the SEC on April 13, 2018. Information regarding the persons who may, under the rules of the SEC, be deemed participants in the proxy solicitation and a description of their direct and indirect interests, by security holdings or otherwise, is contained in the Joint Proxy/Prospectus and other relevant materials to be filed with the SEC when they become available. Free copies of this document may be obtained as described in the preceding paragraph. 2
Forward Looking Statements This presentation contains certain forward-looking statements within the meaning of the Private Securities Litigation Reform Act of 1995. Forward-looking statements are based on various facts and derived utilizing important assumptions, current expectations, estimates and projections and are subject to known and unknown risks, uncertainties and other factors that may cause actual results, performance or achievements to be materially different from any future results, performance or achievements expressed or implied by such forward-looking statements. Forward-looking statements include, without limitation, statements relating to the impact Veritex expects its proposed acquisition of Green to have on the combined entity’s operations, financial condition, and financial results, and Veritex’s expectations about its ability to successfully integrate the combined businesses and the amount of cost savings and overall operational efficiencies Veritex expects to realize as a result of the proposed acquisition. The forward-looking statements also include statements about Veritex’s future financial performance, business and growth strategy, projected plans and objectives, as well as other projections based on macroeconomic and industry trends, which are inherently unreliable due to the multiple factors that impact economic trends, and any such variations may be material. Statements preceded by, followed by or that otherwise include the words “believes,” “expects,” “anticipates,” “intends,” “projects,” “estimates,” “plans” and similar expressions or future or conditional verbs such as “will,” “should,” “would,” “may” and “could” are generally forward-looking in nature and not historical facts, although not all forward-looking statements include the foregoing. Further, certain factors that could affect future results and cause actual results to differ materially from those expressed in the forward-looking statements include, but are not limited to, the possibility that the proposed acquisition does not close when expected or at all because required regulatory, shareholder or other approvals and other conditions to closing are not received or satisfied on a timely basis or at all, the failure to close for any other reason, changes in Veritex’s share price before closing, that the businesses of Veritex and Green will not be integrated successfully, that the cost savings and any synergies from the proposed acquisition may not be fully realized or may take longer to realize than expected, disruption from the proposed acquisition making it more difficult to maintain relationships with employees, customers or other parties with whom Veritex or Green have business relationships, diversion of management time on merger-related issues, risks relating to the potential dilutive effect of shares of Veritex common stock to be issued in the transaction, the reaction to the transaction of the companies’ customers, employees and counterparties and other factors, many of which are beyond the control of Veritex and Green. We refer you to the “Risk Factors” and “Management’s Discussion and Analysis of Financial Condition and Results of Operations” sections of Veritex’s Annual Report on Form 10-K for the year ended December 31, 2017, the Annual Report on Form 10-K filed by Green for the year ended December 31, 2017 and any updates to those risk factors set forth in Veritex’s and Green’s Quarterly Reports on Form 10-Q, Current Reports on Form 8-K and other filings, which have been filed with the SEC and are available on the SEC’s website at www.sec.gov. If one or more events related to these or other risks or uncertainties materialize, or if Veritex’s underlying assumptions prove to be incorrect, actual results may differ materially from what Veritex or Green anticipates. Accordingly, you should not place undue reliance on any such forward-looking statements. Any forward-looking statement speaks only as of the date on which it is made. Neither Veritex nor Green undertakes any obligation, and specifically declines any obligation, to update or revise any forward-looking statements, whether as a result of new information, future developments or otherwise. All forward-looking statements, expressed or implied, included in this communication are expressly qualified in their entirety by this cautionary statement. This cautionary statement should also be considered in connection with any subsequent written or oral forward- looking statements that Veritex or persons acting on Veritex’s behalf may issue. Annualized, pro forma, projected and estimated numbers are used for illustrative purpose only, are not forecasts and may not reflect actual results. 3

VBTX Third Quarter 2018 Summary 4

Third Quarter 2018 Summary Organic deposit growth of $165.8 million, or 6.7% compared to prior quarter, STRATEGIC represents best quarterly increase in deposits life-to-date. GROWTH Record new loan commitments for the quarter and continued strong pipeline underscore ability to execute on organic growth strategy. Recovered $2.0 million in the quarter from non-accretable purchased loans previously discounted for credit impairment. CREDIT Increased loan loss provision by $0.9 million primarily due to a single acquired MANAGEMENT loan that demonstrated further credit impairment. Increase in nonperforming loans to total loans to 1.07% solely driven by three acquired loans. Reported net income of $8.9 million or $0.36 diluted earnings per share (EPS) was impacted by costs associated with the acquisition of Green Bancorp, Inc. EARNINGS (Green). Acquisition-related costs were $2.7 million in the quarter, representing a $0.09 impact to diluted EPS, net of taxes. Announced the Green acquisition on July 24, 2018, which will create the tenth largest Texas-based banking institution by deposit market share with 43 branches ACQUISITIONS primarily in the greater Dallas/Fort Worth and Houston metropolitan areas Engaged teams in the integration and conversion planning process. 5
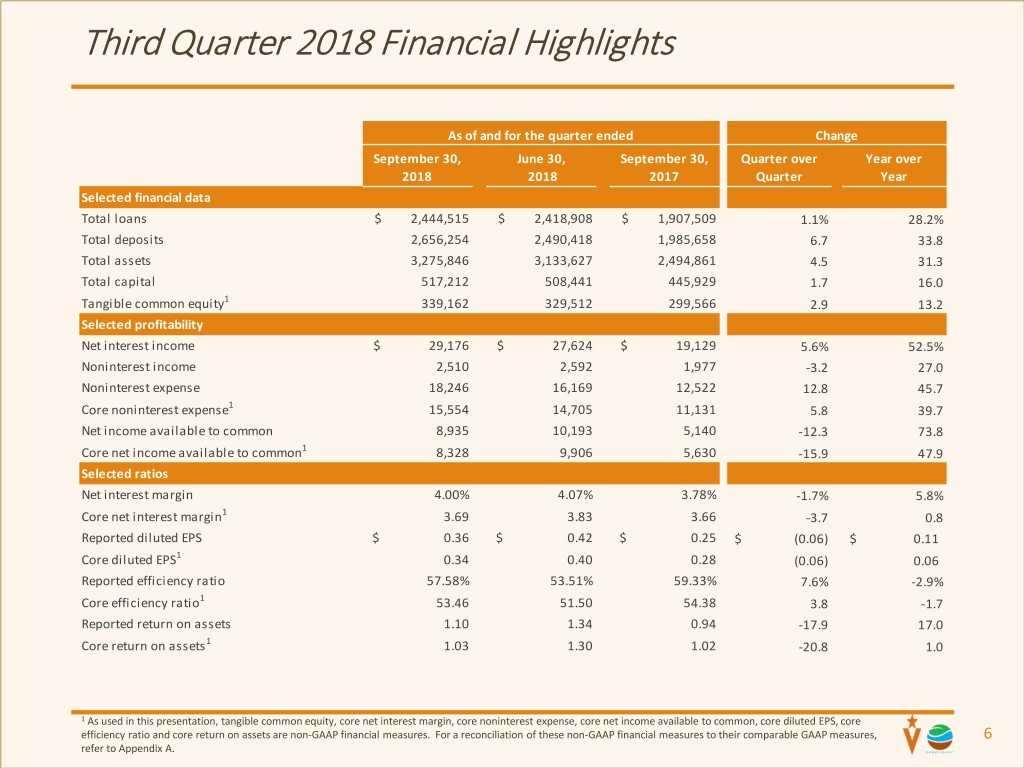
Third Quarter 2018 Financial Highlights As of and for the quarter ended Change September 30, June 30, September 30, Quarter over Year over 2018 2018 2017 Quarter Year Selected financial data Total loans $ 2,444,515 $ 2,418,908 $ 1,907,509 1.1% 28.2% Total deposits 2,656,254 2,490,418 1,985,658 6.7 33.8 Total assets 3,275,846 3,133,627 2,494,861 4.5 31.3 Total capital 517,212 508,441 445,929 1.7 16.0 Tangible common equity1 339,162 329,512 299,566 2.9 13.2 Selected profitability Net interest income $ 29,176 $ 27,624 $ 19,129 5.6% 52.5% Noninterest income 2,510 2,592 1,977 -3.2 27.0 Noninterest expense 18,246 16,169 12,522 12.8 45.7 Core noninterest expense1 15,554 14,705 11,131 5.8 39.7 Net income available to common 8,935 10,193 5,140 -12.3 73.8 Core net income available to common1 8,328 9,906 5,630 -15.9 47.9 Selected ratios Net interest margin 4.00% 4.07% 3.78% -1.7% 5.8% Core net interest margin1 3.69 3.83 3.66 -3.7 0.8 Reported diluted EPS $ 0.36 $ 0.42 $ 0.25 $ (0.06) $ 0.11 Core diluted EPS1 0.34 0.40 0.28 (0.06) 0.06 Reported efficiency ratio 57.58% 53.51% 59.33% 7.6% -2.9% Core efficiency ratio1 53.46 51.50 54.38 3.8 -1.7 Reported return on assets 1.10 1.34 0.94 -17.9 17.0 Core return on assets 1 1.03 1.30 1.02 -20.8 1.0 1 As used in this presentation, tangible common equity, core net interest margin, core noninterest expense, core net income available to common, core diluted EPS, core efficiency ratio and core return on assets are non-GAAP financial measures. For a reconciliation of these non-GAAP financial measures to their comparable GAAP measures, 6 refer to Appendix A.
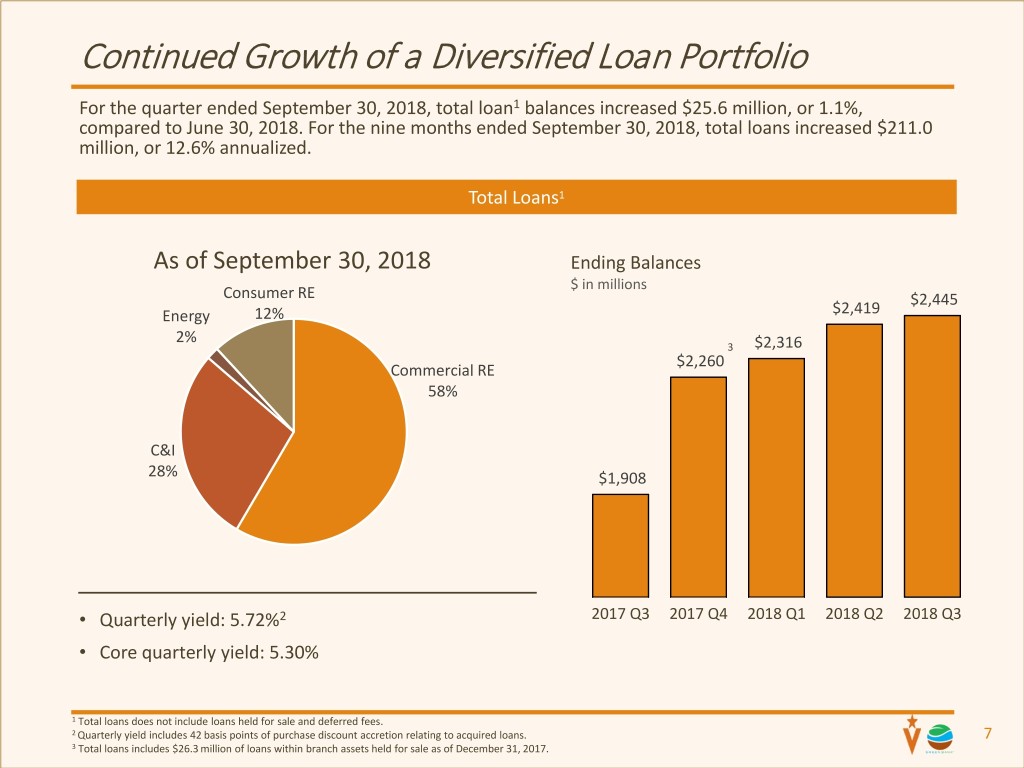
Continued Growth of a Diversified Loan Portfolio For the quarter ended September 30, 2018, total loan1 balances increased $25.6 million, or 1.1%, compared to June 30, 2018. For the nine months ended September 30, 2018, total loans increased $211.0 million, or 12.6% annualized. Total Loans1 As of September 30, 2018 Ending Balances $ in millions Consumer RE $2,445 Energy 12% $2,419 2% 3 $2,316 $2,260 Commercial RE 58% C&I 28% $1,908 • Quarterly yield: 5.72%2 2017 Q3 2017 Q4 2018 Q1 2018 Q2 2018 Q3 • Core quarterly yield: 5.30% 1 Total loans does not include loans held for sale and deferred fees. 2 Quarterly yield includes 42 basis points of purchase discount accretion relating to acquired loans. 7 3 Total loans includes $26.3 million of loans within branch assets held for sale as of December 31, 2017.

New Commitments, Payoffs and Pay-downs $ in millions Quarter-end Loan Balances vs. New Commitments 2018 YTD New Commitments: $1,279 $2,419 $2,445 $2,260 $2,316 $1,908 $358 $443 $478 $163 $276 2017 Q3 2017 Q4 2018 Q1 2018 Q2 2018 Q3 Quarter-end Balances New Commitments Quarter-end Payoffs and Pay Downs vs. Loan Balances 2018 YTD Payoffs and Paydowns: $710 11% 9% 8% 10% 5% $260 $248 $211 $202 $104 2017 Q3 2017 Q4 2018 Q1 2018 Q2 2018 Q3 Quarter-end Payoffs / Pay-downs Pay downs/offs % of ending balances 8
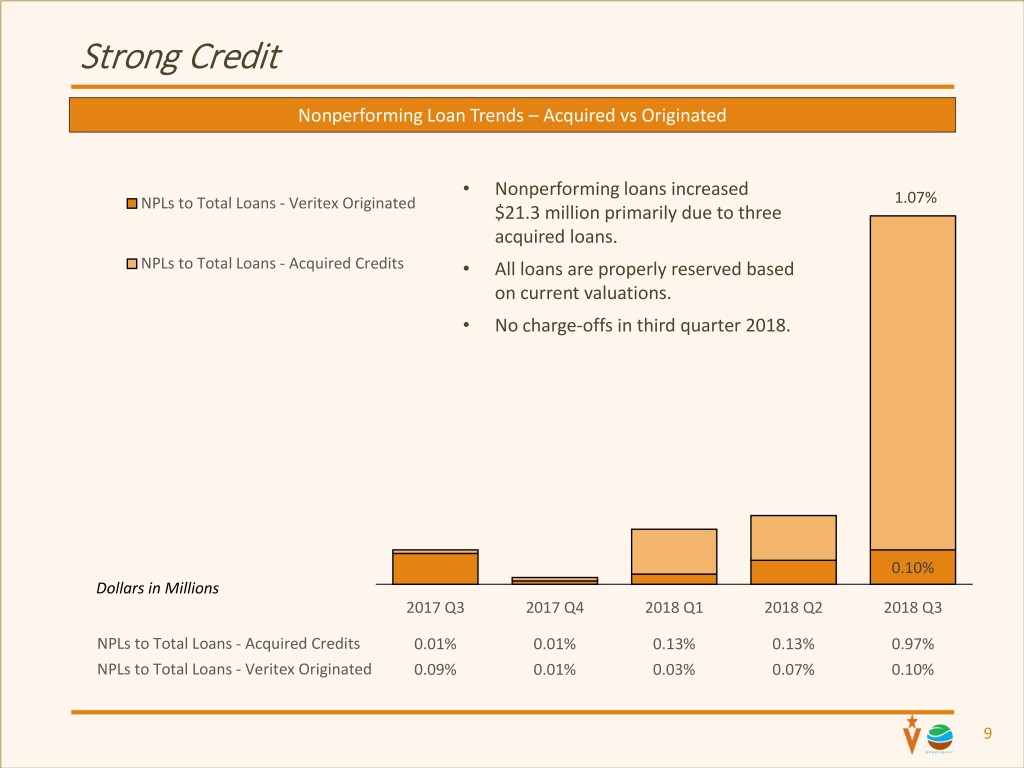
Strong Credit Nonperforming Loan Trends – Acquired vs Originated • Nonperforming loans increased 1.07% NPLs to Total Loans - Veritex Originated $21.3 million primarily due to three acquired loans. NPLs to Total Loans - Acquired Credits • All loans are properly reserved based on current valuations. • No charge-offs in third quarter 2018. 0.10% Dollars in Millions 2017 Q3 2017 Q4 2018 Q1 2018 Q2 2018 Q3 NPLs to Total Loans - Acquired Credits 0.01% 0.01% 0.13% 0.13% 0.97% NPLs to Total Loans - Veritex Originated 0.09% 0.01% 0.03% 0.07% 0.10% 9
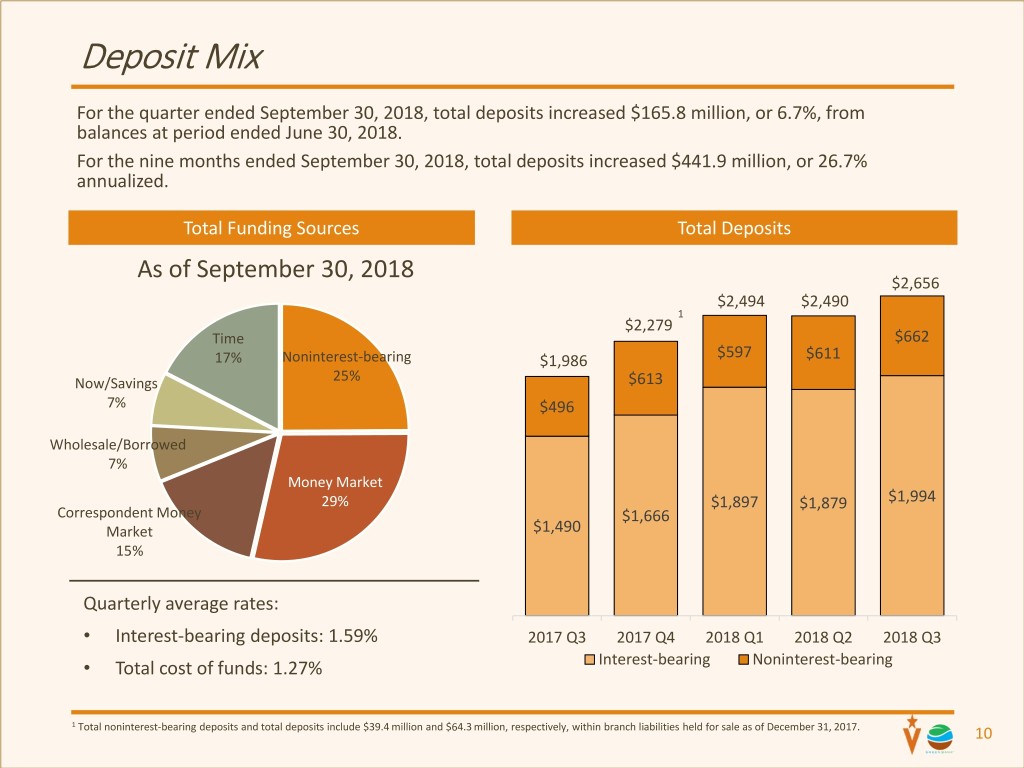
Deposit Mix For the quarter ended September 30, 2018, total deposits increased $165.8 million, or 6.7%, from balances at period ended June 30, 2018. For the nine months ended September 30, 2018, total deposits increased $441.9 million, or 26.7% annualized. Total Funding Sources Total Deposits As of September 30, 2018 $2,656 $2,494 $2,490 1 $2,279 Time $662 $597 17% Noninterest-bearing $1,986 $611 Now/Savings 25% $613 7% $496 Wholesale/Borrowed 7% Money Market 29% $1,897 $1,879 $1,994 Correspondent Money $1,666 Market $1,490 15% Quarterly average rates: • Interest-bearing deposits: 1.59% 2017 Q3 2017 Q4 2018 Q1 2018 Q2 2018 Q3 • Total cost of funds: 1.27% Interest-bearing Noninterest-bearing 1 Total noninterest-bearing deposits and total deposits include $39.4 million and $64.3 million, respectively, within branch liabilities held for sale as of December 31, 2017. 10
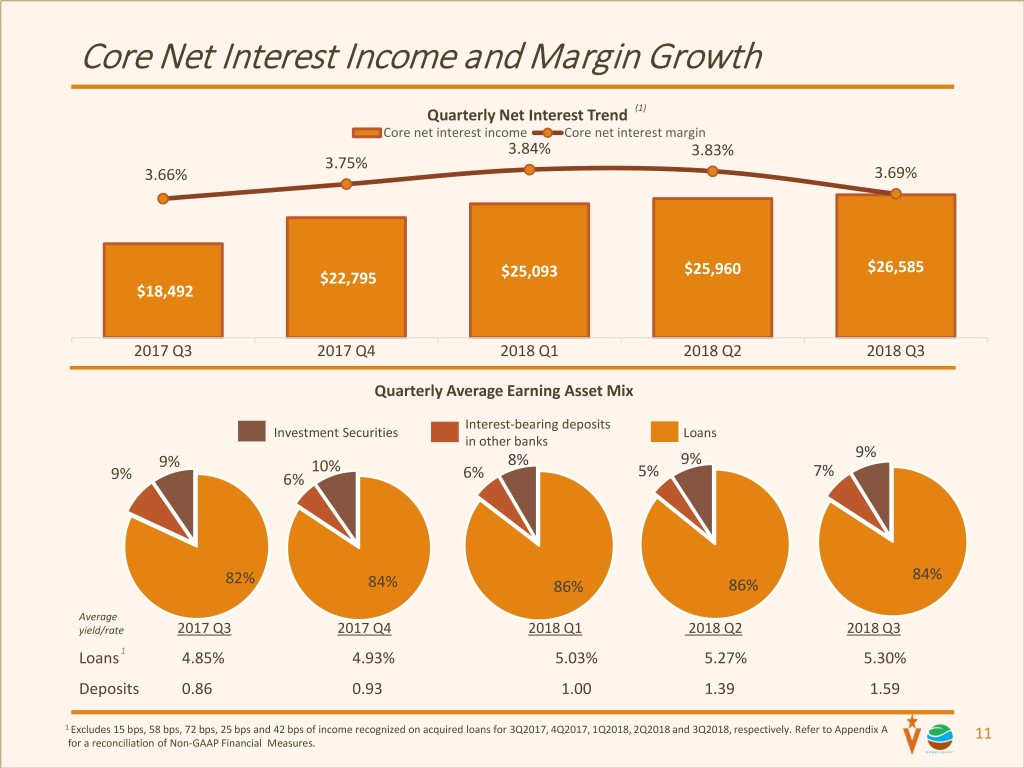
Core Net Interest Income and Margin Growth Quarterly Net Interest Trend (1) Core net interest income Core net interest margin 3.84% 3.83% 3.75% 3.66% 3.69% $25,960 $26,585 $22,795 $25,093 $18,492 2017 Q3 2017 Q4 2018 Q1 2018 Q2 2018 Q3 Quarterly Average Earning Asset Mix Interest-bearing deposits Investment Securities Loans in other banks 9% 9% 8% 9% 10% 7% 9% 6% 6% 5% 82% 84% 84% 86% 86% Average yield/rate 2017 Q3 2017 Q4 2018 Q1 2018 Q2 2018 Q3 Loans 1 4.85% 4.93% 5.03% 5.27% 5.30% Deposits 0.86 0.93 1.00 1.39 1.59 1 Excludes 15 bps, 58 bps, 72 bps, 25 bps and 42 bps of income recognized on acquired loans for 3Q2017, 4Q2017, 1Q2018, 2Q2018 and 3Q2018, respectively. Refer to Appendix A 11 for a reconciliation of Non-GAAP Financial Measures.
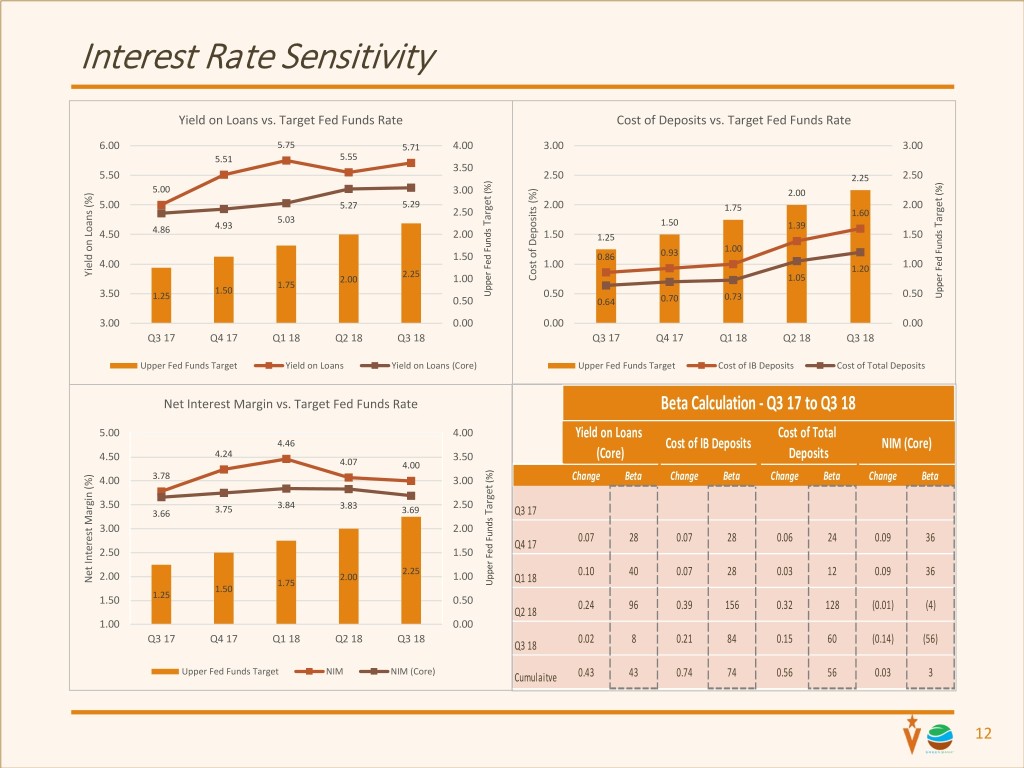
Interest Rate Sensitivity Yield on Loans vs. Target Fed Funds Rate Cost of Deposits vs. Target Fed Funds Rate 6.00 5.75 5.71 4.00 3.00 3.00 5.51 5.55 3.50 5.50 2.50 2.25 2.50 5.00 (%) 3.00 2.00 (%) 5.00 5.27 5.29 2.00 1.75 2.00 2.50 1.60 5.03 Target 1.50 Target 4.86 4.93 1.39 4.50 2.00 1.50 1.25 1.50 1.00 1.50 0.86 0.93 4.00 1.00 1.20 1.00 Yield on Loans (%) 2.25 2.00 1.00 Depositsof (%)Cost 1.05 1.75 1.50 Upper Fed Funds 3.50 1.25 0.50 0.73 0.50 Upper Fed Funds 0.50 0.64 0.70 3.00 0.00 0.00 0.00 Q3 17 Q4 17 Q1 18 Q2 18 Q3 18 Q3 17 Q4 17 Q1 18 Q2 18 Q3 18 Upper Fed Funds Target Yield on Loans Yield on Loans (Core) Upper Fed Funds Target Cost of IB Deposits Cost of Total Deposits Net Interest Margin vs. Target Fed Funds Rate Beta Calculation - Q3 17 to Q3 18 5.00 4.00 Yield on Loans Cost of Total 4.46 Cost of IB Deposits NIM (Core) 4.50 4.24 3.50 (Core) Deposits 4.07 4.00 3.78 4.00 3.00 (%) Change Beta Change Beta Change Beta Change Beta 3.50 3.84 3.83 2.50 3.66 3.75 3.69 Target Q3 17 3.00 2.00 0.07 28 0.07 28 0.06 24 0.09 36 Q4 17 2.50 1.50 2.25 2.00 0.10 40 0.07 28 0.03 12 0.09 36 Net InterestNet Margin(%) 2.00 1.00 1.75 Upper Fed Funds Q1 18 1.50 1.25 1.50 0.50 0.24 96 0.39 156 0.32 128 (0.01) (4) Q2 18 1.00 0.00 Q3 17 Q4 17 Q1 18 Q2 18 Q3 18 0.02 8 0.21 84 0.15 60 (0.14) (56) Q3 18 Upper Fed Funds Target NIM NIM (Core) Cumulaitve 0.43 43 0.74 74 0.56 56 0.03 3 12

Impact of core adjustments on Q3 2018 The effects of core adjustments including accretion income on acquired loans, corporate development costs, and the impact of fair value measurement continued to impact results in the third quarter 2018. These items are isolated below: For the three months ended September 30, 2018 A B C D A-B-C-D Tax Act Re- Purchase Corporate measurement accounting development and Income/Expense Total impact from accretion income other related less adjustments Income/Expense return to on acquired loans expenses Dollars in thousands (as reported) provision Net interest income 29,176 (2,591) - - 26,585 Noninterest income 2,510 - - - 2,510 Noninterest expense 18,246 - (2,692) - 15,554 Income tax expense 1,448 (524) 544 688 2,156 Net income 8,935 (2,067) 2,148 (688) 8,328 13
GBNC Third Quarter 2018 Summary 14
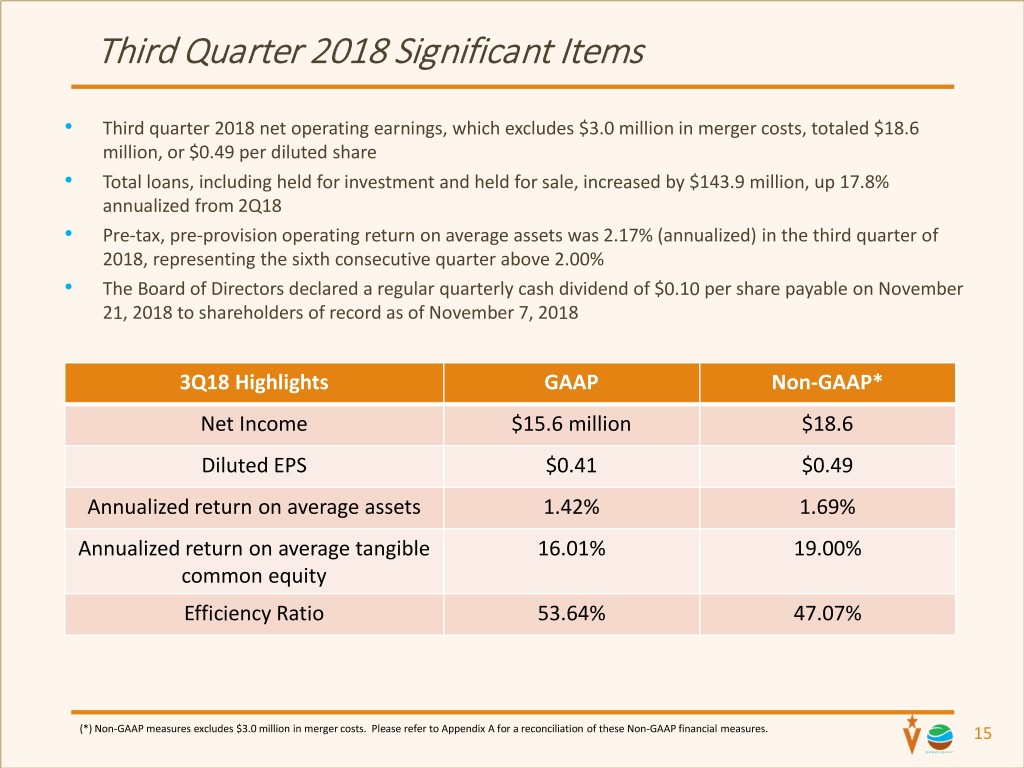
Third Quarter 2018 Significant Items • Third quarter 2018 net operating earnings, which excludes $3.0 million in merger costs, totaled $18.6 million, or $0.49 per diluted share • Total loans, including held for investment and held for sale, increased by $143.9 million, up 17.8% annualized from 2Q18 • Pre-tax, pre-provision operating return on average assets was 2.17% (annualized) in the third quarter of 2018, representing the sixth consecutive quarter above 2.00% • The Board of Directors declared a regular quarterly cash dividend of $0.10 per share payable on November 21, 2018 to shareholders of record as of November 7, 2018 3Q18 Highlights GAAP Non-GAAP* Net Income $15.6 million $18.6 Diluted EPS $0.41 $0.49 Annualized return on average assets 1.42% 1.69% Annualized return on average tangible 16.01% 19.00% common equity Efficiency Ratio 53.64% 47.07% (*) Non-GAAP measures excludes $3.0 million in merger costs. Please refer to Appendix A for a reconciliation of these Non-GAAP financial measures. 15

Fully Diluted EPS and TBVPS Earnings Per Share $0.60 $0.49 $0.50 $0.44 $0.44 $0.41 $0.40 $0.31 $0.33 $0.30 $0.25 $0.26 $0.20 $0.14 $0.10 $0.07 $0.00 3Q17 4Q17 1Q18 2Q18 3Q18 Reported Operating Tangible Book Value Per Share $11.00 $10.75 $10.63 $10.50 $10.36 $10.25 $10.10 $9.93 $9.97 $10.00 $9.75 $9.50 $9.25 $9.00 3Q17 4Q17 1Q18 2Q18 3Q18 16
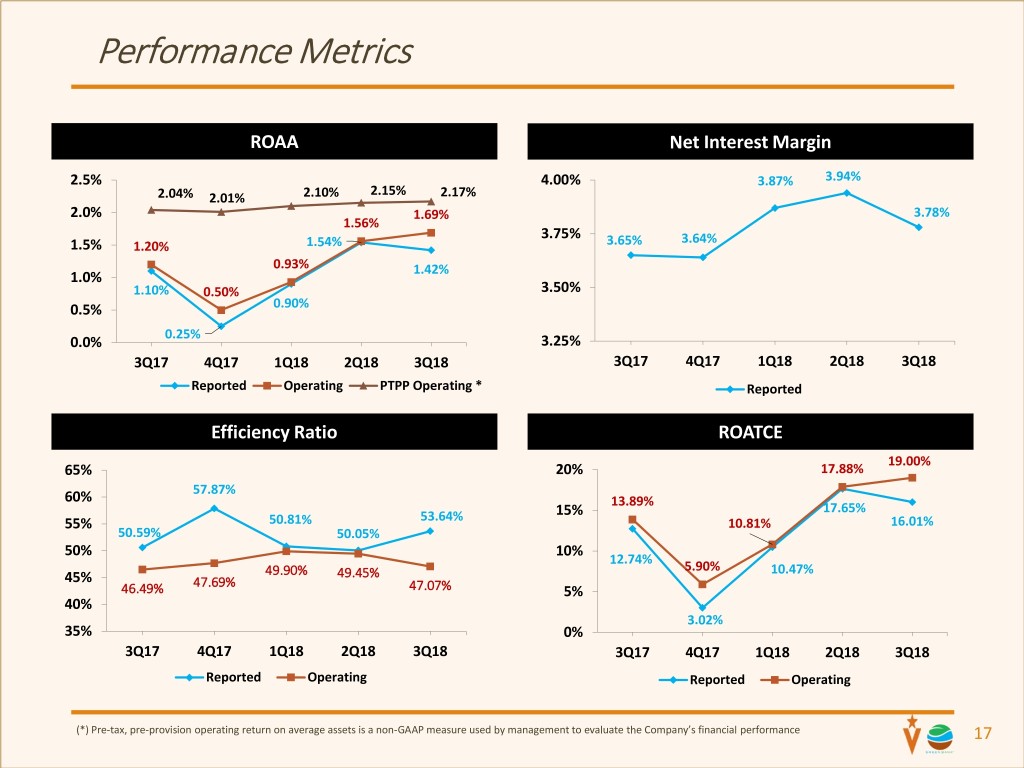
Performance Metrics ROAA Net Interest Margin 2.5% 4.00% 3.87% 3.94% 2.15% 2.04% 2.01% 2.10% 2.17% 2.0% 1.69% 3.78% 1.56% 3.75% 3.64% 1.5% 1.20% 1.54% 3.65% 0.93% 1.42% 1.0% 1.10% 0.50% 3.50% 0.5% 0.90% 0.25% 0.0% 3.25% 3Q17 4Q17 1Q18 2Q18 3Q18 3Q17 4Q17 1Q18 2Q18 3Q18 Reported Operating PTPP Operating * Reported Efficiency Ratio ROATCE 19.00% 65% 20% 17.88% 60% 57.87% 13.89% 17.65% 53.64% 15% 55% 50.81% 10.81% 16.01% 50.59% 50.05% 50% 10% 12.74% 49.90% 49.45% 5.90% 10.47% 45% 47.69% 46.49% 47.07% 5% 40% 3.02% 35% 0% 3Q17 4Q17 1Q18 2Q18 3Q18 3Q17 4Q17 1Q18 2Q18 3Q18 Reported Operating Reported Operating (*) Pre-tax, pre-provision operating return on average assets is a non-GAAP measure used by management to evaluate the Company’s financial performance 17

Loan Portfolio Overview Highlights Loan Portfolio Composition • Q318 loan growth of $144 mm or 17.8% annualized; with 50% of the growth was in C&I and 45% in CRE • Annualized 2018 YTD loan production up 45% over 2017 • Commercial-focused loan portfolio with 99% of the loan portfolio focused on non-energy loans • In-footprint focus with portfolio primarily distributed across Houston 52% and Dallas 23% • Diversified loan portfolio with no concentration to any single industry in excess of 10% of total loans Loan Portfolio Production Commitments Regulatory CRE/Total Risk Based Capital $1,500 400% 400,000 367,178 $1,289 348,057 $1,252 $1,224 $1,209 $1,222 $1,250 375% 285,404 300,000 254,109 $1,000 350% 195,483 200,000 $750 325% $500 288% 300% 100,000 276% $494 $465 $477 $250 $435 256% 261% 275% - $444 260% 3Q17 4Q17 1Q18 2Q18 3Q18 $0 250% 3Q17 4Q17 1Q18 2Q18 3Q18 Loan Commitments Total RBC CRE Ratio $ in millions, loan balance and corresponding percentages exclude HFS loans, (*) Central TX denotes Austin, San Antonio and San Marcos 18
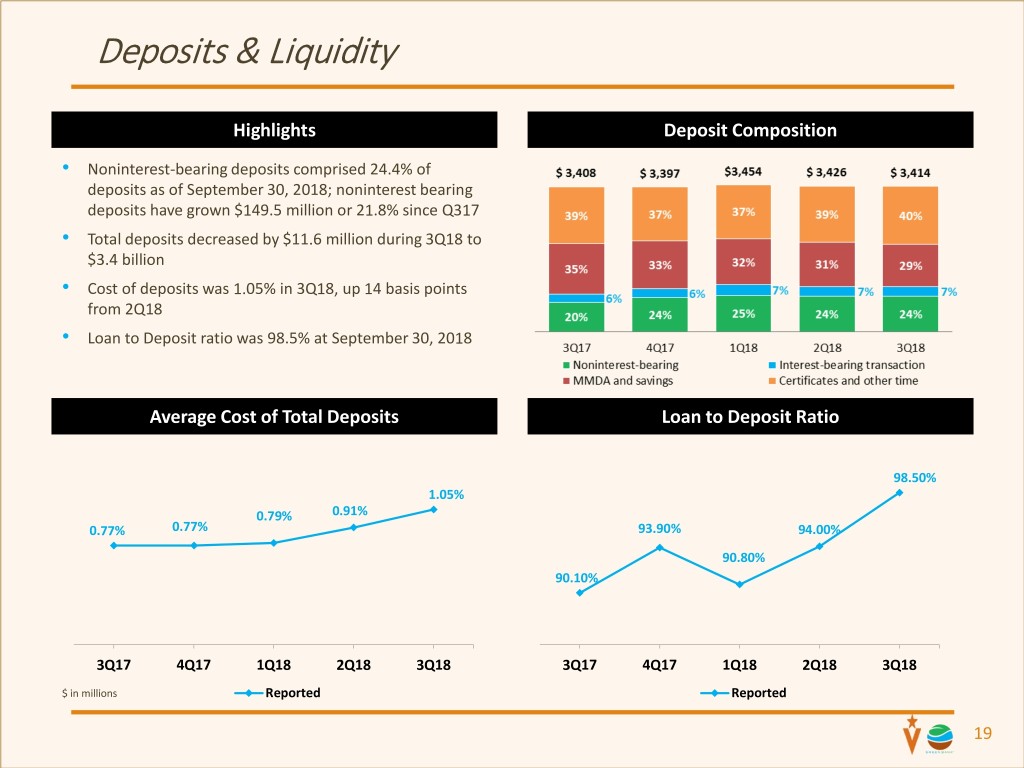
Deposits & Liquidity Highlights Deposit Composition • Noninterest-bearing deposits comprised 24.4% of deposits as of September 30, 2018; noninterest bearing deposits have grown $149.5 million or 21.8% since Q317 • Total deposits decreased by $11.6 million during 3Q18 to $3.4 billion • Cost of deposits was 1.05% in 3Q18, up 14 basis points from 2Q18 • Loan to Deposit ratio was 98.5% at September 30, 2018 Average Cost of Total Deposits Loan to Deposit Ratio 98.50% 1.05% 0.79% 0.91% 0.77% 0.77% 93.90% 94.00% 90.80% 90.10% 3Q17 4Q17 1Q18 2Q18 3Q18 3Q17 4Q17 1Q18 2Q18 3Q18 $ in millions Reported Reported 19
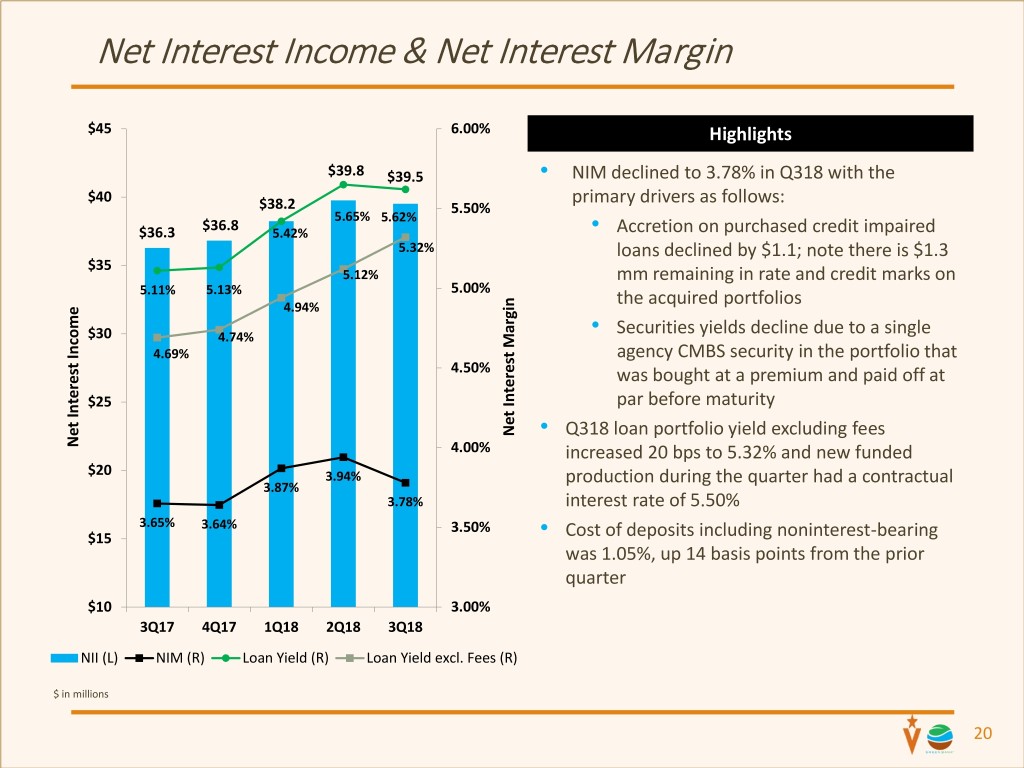
Net Interest Income & Net Interest Margin $45 6.00% Highlights $39.8 $39.5 • NIM declined to 3.78% in Q318 with the $40 primary drivers as follows: $38.2 5.50% 5.65% 5.62% $36.8 $36.3 5.42% • Accretion on purchased credit impaired 5.32% loans declined by $1.1; note there is $1.3 $35 5.12% mm remaining in rate and credit marks on 5.11% 5.13% 5.00% 4.94% the acquired portfolios $30 4.74% • Securities yields decline due to a single 4.69% agency CMBS security in the portfolio that 4.50% was bought at a premium and paid off at $25 par before maturity Net Interest Margin • Q318 loan portfolio yield excluding fees Net Interest Income Income Net Interest 4.00% increased 20 bps to 5.32% and new funded $20 3.94% production during the quarter had a contractual 3.87% 3.78% interest rate of 5.50% 3.65% 3.64% 3.50% $15 • Cost of deposits including noninterest-bearing was 1.05%, up 14 basis points from the prior quarter $10 3.00% 3Q17 4Q17 1Q18 2Q18 3Q18 NII (L) NIM (R) Loan Yield (R) Loan Yield excl. Fees (R) $ in millions 20
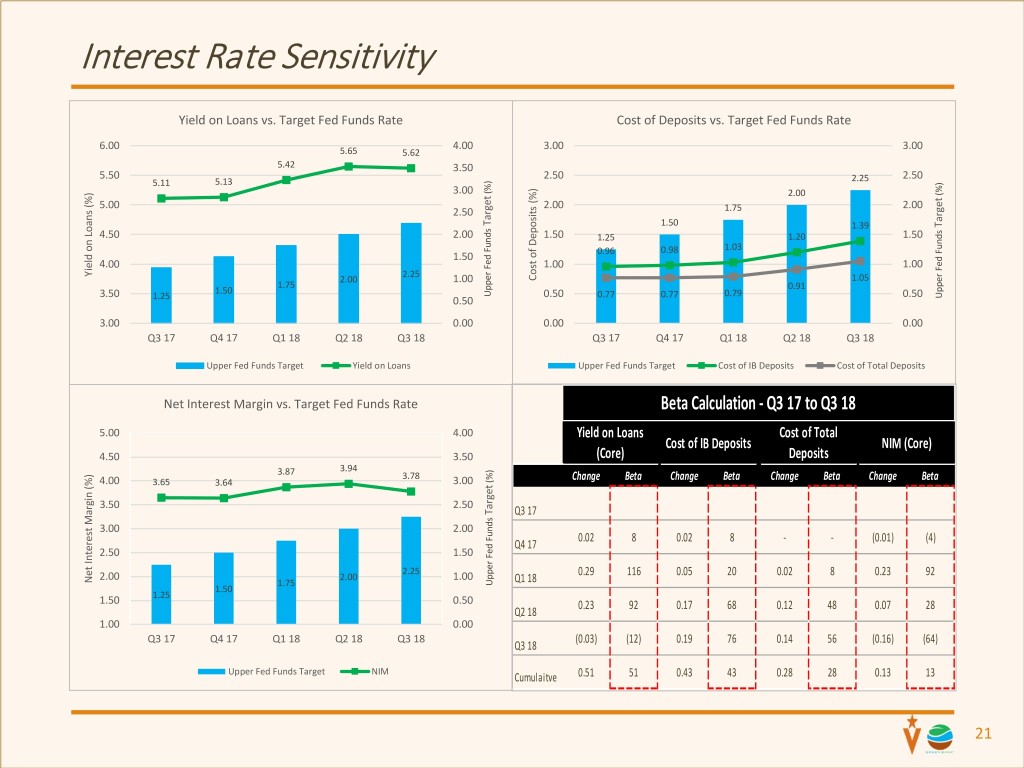
Interest Rate Sensitivity Yield on Loans vs. Target Fed Funds Rate Cost of Deposits vs. Target Fed Funds Rate 6.00 4.00 3.00 3.00 5.65 5.62 5.42 3.50 5.50 2.50 2.50 5.11 5.13 2.25 (%) 3.00 2.00 (%) 5.00 2.00 2.00 2.50 1.75 Target 1.50 1.39 Target 4.50 2.00 1.50 1.25 1.20 1.50 0.98 1.03 1.50 0.96 4.00 1.00 1.00 Yield on Loans (%) 2.25 2.00 1.00 Depositsof (%)Cost 1.05 1.75 1.50 0.91 Upper Fed Funds 3.50 0.50 0.77 0.77 0.79 0.50 Upper Fed Funds 1.25 0.50 3.00 0.00 0.00 0.00 Q3 17 Q4 17 Q1 18 Q2 18 Q3 18 Q3 17 Q4 17 Q1 18 Q2 18 Q3 18 Upper Fed Funds Target Yield on Loans Upper Fed Funds Target Cost of IB Deposits Cost of Total Deposits Net Interest Margin vs. Target Fed Funds Rate Beta Calculation - Q3 17 to Q3 18 5.00 4.00 Yield on Loans Cost of Total Cost of IB Deposits NIM (Core) 4.50 3.50 (Core) Deposits 3.94 3.87 3.78 4.00 3.65 3.64 3.00 (%) Change Beta Change Beta Change Beta Change Beta 3.50 2.50 Target Q3 17 3.00 2.00 0.02 8 0.02 8 - - (0.01) (4) Q4 17 2.50 1.50 2.25 2.00 0.29 116 0.05 20 0.02 8 0.23 92 Net InterestNet Margin(%) 2.00 1.00 1.75 Upper Fed Funds Q1 18 1.50 1.25 1.50 0.50 0.23 92 0.17 68 0.12 48 0.07 28 Q2 18 1.00 0.00 Q3 17 Q4 17 Q1 18 Q2 18 Q3 18 (0.03) (12) 0.19 76 0.14 56 (0.16) (64) Q3 18 Upper Fed Funds Target NIM Cumulaitve 0.51 51 0.43 43 0.28 28 0.13 13 21
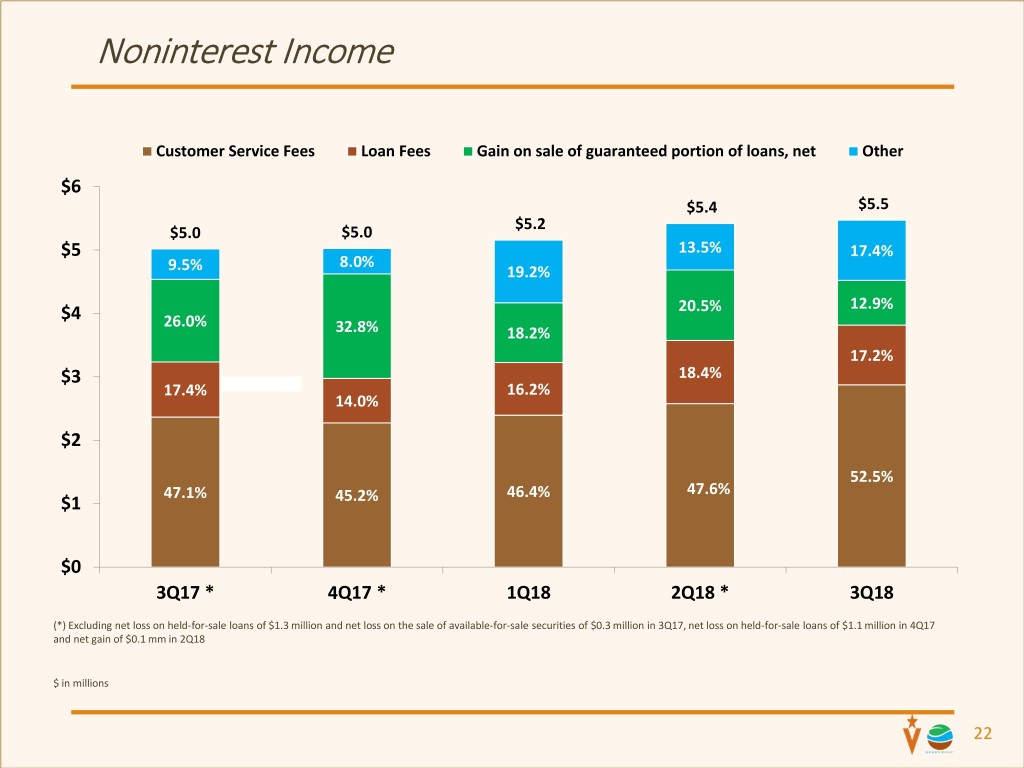
Noninterest Income Customer Service Fees Loan Fees Gain on sale of guaranteed portion of loans, net Other $6 $5.4 $5.5 $5.2 $5.0 $5.0 $5 13.5% 17.4% 8.0% 9.5% 19.2% 20.5% 12.9% $4 26.0% 32.8% 18.2% 17.2% $3 18.4% 17.4% 16.2% 14.0% $2 52.5% 47.1% 46.4% 47.6% $1 45.2% $0 3Q17 * 4Q17 * 1Q18 2Q18 * 3Q18 (*) Excluding net loss on held-for-sale loans of $1.3 million and net loss on the sale of available-for-sale securities of $0.3 million in 3Q17, net loss on held-for-sale loans of $1.1 million in 4Q17 and net gain of $0.1 mm in 2Q18 $ in millions 22
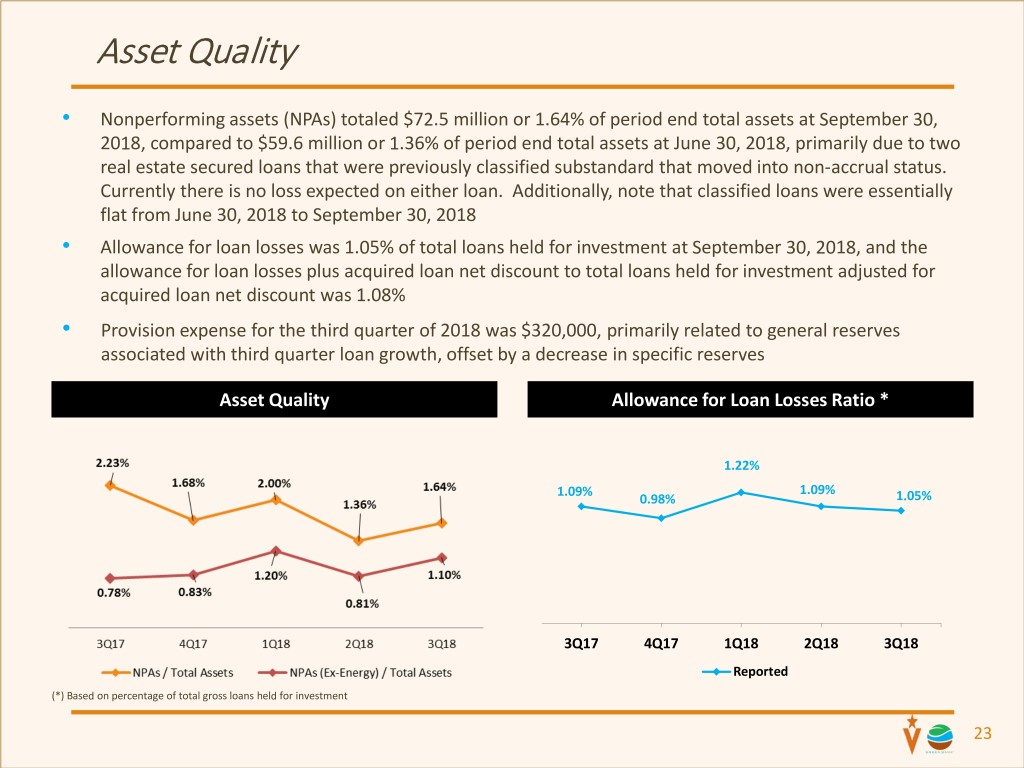
Asset Quality • Nonperforming assets (NPAs) totaled $72.5 million or 1.64% of period end total assets at September 30, 2018, compared to $59.6 million or 1.36% of period end total assets at June 30, 2018, primarily due to two real estate secured loans that were previously classified substandard that moved into non-accrual status. Currently there is no loss expected on either loan. Additionally, note that classified loans were essentially flat from June 30, 2018 to September 30, 2018 • Allowance for loan losses was 1.05% of total loans held for investment at September 30, 2018, and the allowance for loan losses plus acquired loan net discount to total loans held for investment adjusted for acquired loan net discount was 1.08% • Provision expense for the third quarter of 2018 was $320,000, primarily related to general reserves associated with third quarter loan growth, offset by a decrease in specific reserves Asset Quality Allowance for Loan Losses Ratio * 1.22% 1.09% 1.09% 0.98% 1.05% 3Q17 4Q17 1Q18 2Q18 3Q18 Reported (*) Based on percentage of total gross loans held for investment 23
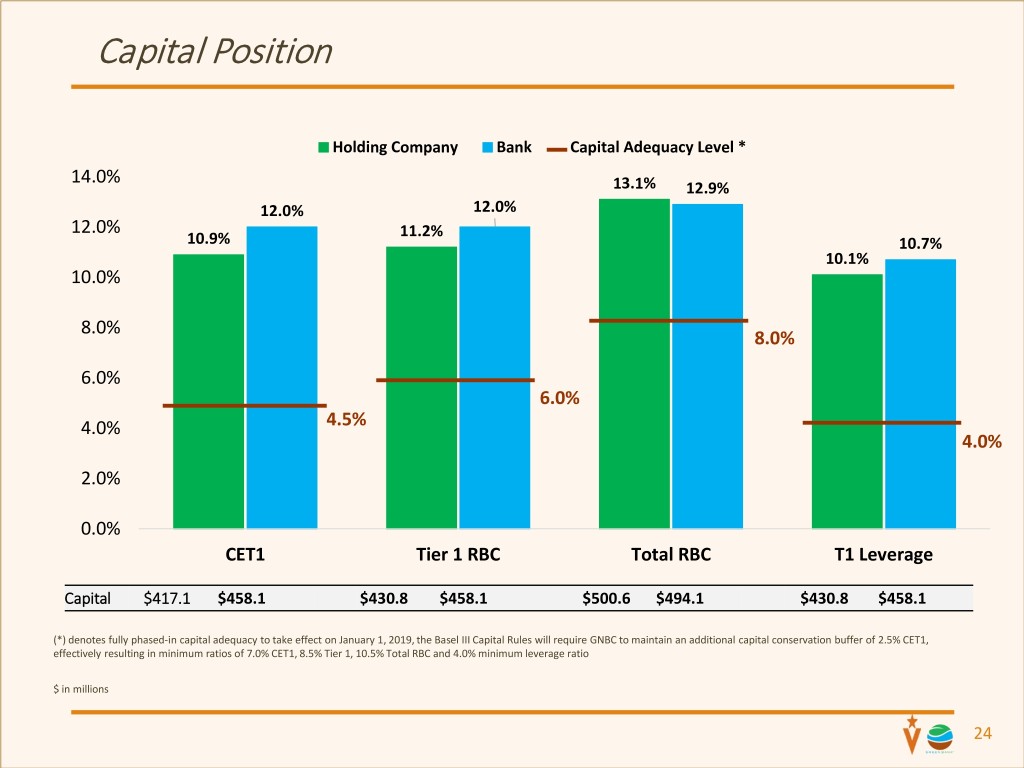
Capital Position Holding Company Bank Capital Adequacy Level * 14.0% 13.1% 12.9% 12.0% 12.0% 12.0% 11.2% 10.9% 10.7% 10.1% 10.0% 8.0% 8.0% 6.0% 6.0% 4.0% 4.5% 4.0% 2.0% 0.0% CET1 Tier 1 RBC Total RBC T1 Leverage Capital $417.1 $458.1 $430.8 $458.1 $500.6 $494.1 $430.8 $458.1 (*) denotes fully phased-in capital adequacy to take effect on January 1, 2019, the Basel III Capital Rules will require GNBC to maintain an additional capital conservation buffer of 2.5% CET1, effectively resulting in minimum ratios of 7.0% CET1, 8.5% Tier 1, 10.5% Total RBC and 4.0% minimum leverage ratio $ in millions 24

Merger Integration Update
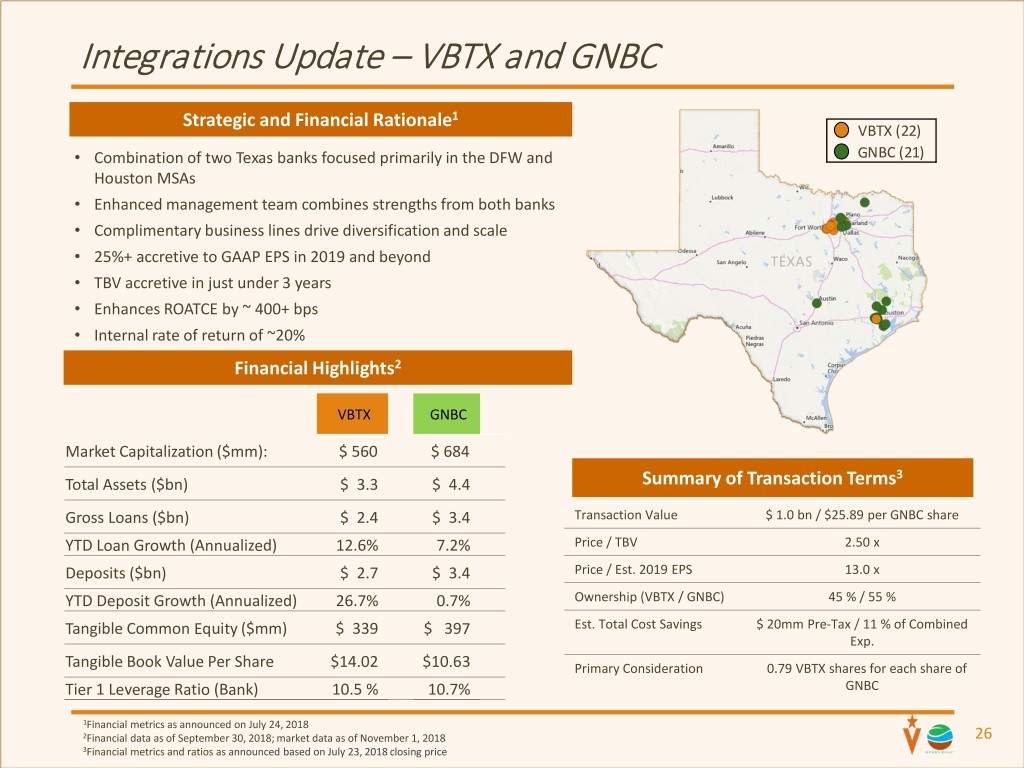
Integrations Update – VBTX and GNBC Strategic and Financial Rationale1 VBTX (22) • Combination of two Texas banks focused primarily in the DFW and GNBC (21) Houston MSAs • Enhanced management team combines strengths from both banks • Complimentary business lines drive diversification and scale • 25%+ accretive to GAAP EPS in 2019 and beyond • TBV accretive in just under 3 years • Enhances ROATCE by ~ 400+ bps • Internal rate of return of ~20% Financial Highlights2 VBTX GNBC Market Capitalization ($mm): $ 560 $ 684 3 Total Assets ($bn) $ 3.3 $ 4.4 Summary of Transaction Terms Gross Loans ($bn) $ 2.4 $ 3.4 Transaction Value $ 1.0 bn / $25.89 per GNBC share YTD Loan Growth (Annualized) 12.6% 7.2% Price / TBV 2.50 x Deposits ($bn) $ 2.7 $ 3.4 Price / Est. 2019 EPS 13.0 x YTD Deposit Growth (Annualized) 26.7% 0.7% Ownership (VBTX / GNBC) 45 % / 55 % Tangible Common Equity ($mm) $ 339 $ 397 Est. Total Cost Savings $ 20mm Pre-Tax / 11 % of Combined Exp. Tangible Book Value Per Share $14.02 $10.63 Primary Consideration 0.79 VBTX shares for each share of Tier 1 Leverage Ratio (Bank) 10.5 % 10.7% GNBC 1Financial metrics as announced on July 24, 2018 2Financial data as of September 30, 2018; market data as of November 1, 2018 26 3Financial metrics and ratios as announced based on July 23, 2018 closing price

Integrations Update – VBTX and GNBC Integration Approach Integration Approach Town hall meetings with Green colleagues in DFW and Guiding Principles Houston • Leverage best people, practices and technology on both Highly successful talent and client retention to date; focused Veritex and Green teams on maintaining positive growth momentum through closing and conversion • Enterprise-wide focus on execution, customer experience, key employee retention and value creation Finalized critical business model decisions and leadership Talent selection underway • Strong risk oversight governance by Board and executive management steering committee Highly engaged and collaborative integration leadership teams representing both companies • Well-informed, quick and timely decisions Decision made to migrate to Green’s technology platform • Consistent messaging and communication between (Jack Henry) with select enhancements companies executive and management levels Re-confirmed net expense synergies (65% 2019; 100% 2020) Integration Management Office with Dedicated Enterprise Key Dates Integration and Technology Integration Coordinators July 24 • Dedicated project teams led by members of Veritex and 2018 Announcement Green Sept. 13 2018 Regulatory Application Submitted • Project teams include sales and service delivery, Oct. 12 technology, credit, operations, risk, finance and other 2018 S-4 Effective support teams. 4Q18 Regulatory Approval • Supported by third-party experts and resources Nov. 15 Disciplined approach to conversion 2018 VBTX and GNBC Shareholder Votes Early • Single conversion event for branches and core systems 1Q19 Expected Transaction Close • Optimize distribution network at conversion Late 2Q19 Scheduled Core System Conversion 27

Appendix A

VBTX Reconciliation of Non-GAAP Financial Measures (S in Thousands, Except Per Share) VBTX’s management uses certain non-GAAP (generally accepted accounting principles) financial measures to evaluate its performance. VBTX has included in this presentation information related to these non-GAAP financial measures for the applicable periods presented. Reconciliation of these non-GAAP financial measures to the most directly comparable GAAP financial measures are presented in the table below. As of or For the Quarter Ended September 30, 2018 June 30, 2018 March 31, 2018 December 31, 2017 September 30, 2017 Net interest income (as reported) $ 29,176 $ 27,624 $ 29,102 $ 25,750 $ 19,129 Adjustment: Income recognized on acquired loans (2,591) (1,664) (4,009) (2,955) (637) Core net interest income 26,585 25,960 25,093 22,795 18,492 Provision for loan losses (as reported) 3,057 1,504 678 2,529 752 Noninterest income (as reported) 2,510 2,592 2,781 2,298 1,977 Adjustment: Gain on sale of branch locations - - (388) - - Core noninterest income 2,510 2,592 2,393 2,298 1,977 Noninterest expense (as reported) 18,246 16,169 17,306 15,035 12,522 Adjustment: Sublease one-time consent fee, net - - (1,071) - - Branch closure expenses - - (172) - - One-time issuance of shares to all employees - (421) - - - Corporate development and other related expenses (2,692) (1,043) (335) (1,018) (1,391) Core noninterest expense 15,554 14,705 15,728 14,017 11,131 Core net income from operations 10,484 12,343 11,080 8,547 8,586 Income tax expense (as reported) 1,448 2,350 3,511 7,227 2,650 Adjustment: Tax impact of adjustments 20 (40) (579) (678) 264 Deferred tax asset re-measurement due to Tax Act 688 127 (820) (3,051) - Other corporate development discrete tax items - - - (398) - Core income tax expense 2,156 2,437 2,112 3,100 2,914 Net income (as reported) 8,935 10,193 10,388 3,257 5,182 Core net income 8,328 9,906 8,968 5,447 5,672 Core net income available to common stockholders 8,328 9,906 $ 8,968 $ 5,447 $ 5,630 Weighted average diluted shares outstanding 24,613 24,546 24,539 23,524 20,392 Earnings Per Share Diluted earnings per share (as reported) $ 0.36 $ 0.42 $ 0.42 $ 0.14 $ 0.25 Core diluted earnings per share 0.34 0.40 0.37 0.23 0.28 Efficiency Ratio Efficiency Ratio (as reported) 57.58% 53.51% 54.28% 53.60% 59.33% Core Efficiency Ratio 53.46% 51.50% 57.22% 55.86% 54.38% Net Interest Margin Net interest margin (as reported) 4.00% 4.07% 4.46% 4.24% 3.78% Core net interest margin 3.69% 3.83% 3.84% 3.75% 3.66% Net Interest Margin Return on average assets (as reported) 1.10% 1.34% 1.41% 0.48% 0.94% Core return on average assets 1.03% 1.30% 1.22% 0.80% 1.02% . 29

VBTX Reconciliation of Non-GAAP Financial Measures ($ in Thousands, Except Per Share) VBTX’s management uses certain non-GAAP (generally accepted accounting principles) financial measures to evaluate its performance including tangible book value per common share and tangible common equity to tangible assets. VBTX has included in this presentation information related to these non-GAAP financial measures for the applicable periods presented. Reconciliation of these non-GAAP financial measures to the most directly comparable GAAP financial measures are presented in the table below. For the Three Months Ended September 30, June 30, March 31, December 31, September 30, 2018 2018 2018 2017 2017 Tangible Common Equity Total stockholders’ equity $ 517,212 $ 508,441 $ 497,433 $ 488,929 $ 445,929 Adjustments: Goodwill (161,447) (161,447) (161,685) (159,452) (135,832) Intangible assets (16,603) (17,482) (18,372) (22,165) (10,531) Total tangible common equity $ 339,162 $ 329,512 $ 317,376 $ 307,312 $ 299,566 Tangible Assets Total assets $ 3,275,846 $ 3,133,627 $ 3,063,319 $ 2,945,583 $ 2,494,861 Adjustments: Goodwill (161,447) (161,447) (161,685) (159,452) (135,832) Intangible assets (16,603) (17,482) (18,372) (22,165) (10,531) Total tangible assets $ 3,097,796 $ 2,954,698 $ 2,883,262 $ 2,763,966 $ 2,348,498 Tangible Common Equity to Tangible Assets 10.95% 11.15% 11.01% 11.12% 12.76% Common shares outstanding 24,192 24,181 24,149 24,110 22,644 Book value per common share $ 21.38 $ 21.03 $ 20.60 $ 20.28 $ 19.69 Tangible book value per common share 14.02 13.63 13.14 12.75 13.23 30

GNBC Reconciliation of Non-GAAP Financial Measures (Dollars in Thousands, Except per Share) GNBC’s management uses certain non-GAAP (generally accepted accounting principles) financial measures to evaluate its performance including tangible book value per common share and tangible common equity to tangible assets. GNBC has included in this presentation information related to these non-GAAP financial measures for the applicable periods presented. Reconciliation of these non-GAAP financial measures to the most directly comparable GAAP financial measures are presented in the table below. As of and for the Quarter Ended Sep 30, 2018 Jun 30, 2018 Mar 31, 2018 Dec 31, 2017 Sep 30, 2017 Tangible Common Equity Total shareholders’ equity $ 490,204 479,493 $ 468,878 $ 463,795 $ 462,311 Adjustments: Goodwill 85,291 85,291 85,291 85,291 85,291 Core deposit intangibles 7,584 7,881 8,187 8,503 8,835 Tangible common equity $ 397,329 386,321 $ 375,400 $ 370,001 $ 368,185 Common shares outstanding(1) 37,368 37,289 37,163 37,103 37,096 Book value per common share(1) $ 13.12 12.86 $ 12.62 $ 12.50 $ 12.46 Tangible book value per common share(1) $ 10.63 10.36 $ 10.10 $ 9.97 $ 9.93 31

GNBC Reconciliation of Non-GAAP Financial Measures (Dollars in Thousands, Except per Share) GNBC’s management uses certain non-GAAP (generally accepted accounting principles) financial measures to evaluate its performance including tangible book value per common share and tangible common equity to tangible assets. GNBC has included in this presentation information related to these non-GAAP financial measures for the applicable periods presented. Reconciliation of these non-GAAP financial measures to the most directly comparable GAAP financial measures are presented in the table below. As of and for the Quarter Ended For the Nine Months Ended Sep 30, 2018 Jun 30, 2018 Mar 31, 2018 Dec 31, 2017 Sep 30, 2017 Sep 30, 2018 Sep 30, 2017 Operating earnings adjusted for amortization of core deposit intangibles Operating earnings $ 15,597 $ 16,421 $ 9,362 $ 2,619 $ 11,407 $ 41,380 $ 31,517 Adjustments: Plus: Amortization of core deposit 297 306 316 330 380 919 1,140 intangibles Less: Tax benefit at the statutory rate 62 64 66 116 133 193 399 Operating earnings adjusted for amortization $ 15,832 $ 16,663 $ 9,612 $ 2,833 $ 11,654 $ 42,106 $ 32,258 of core deposit intangibles Average Tangible Common Equity Total average shareholders’ equity $ 485,377 $ 471,958 $ 466,015 $ 465,859 $ 457,303 $ 474,520 $ 446,190 Adjustments: Average goodwill 85,291 85,291 85,291 85,291 85,291 85,291 85,291 Average core deposit intangibles 7,726 8,029 8,343 8,661 9,065 8,030 9,454 Average tangible common equity $ 392,360 $ 378,638 $ 372,381 $ 371,907 $ 362,947 $ 381,199 $ 351,445 Operating Return on Average Tangible Common Equity (Annualized), Operating 16.01 % 17.65 % 10.47 % 3.02 % 12.74 % 14.77 % 12.27 % Earnings Efficiency ratio 53.64 % 50.05 % 50.81 % 57.87 % 50.59 % 51.50 % 50.94 % Operating efficiency ratio 47.07 % 49.45 % 49.90 % 47.69 % 46.49 % 48.79 % 49.89 % 32

GNBC Reconciliation of Non-GAAP Financial Measures (Dollars in Thousands, Except per Share) GNBC’s management uses certain non-GAAP (generally accepted accounting principles) financial measures to evaluate its performance including tangible book value per common share and tangible common equity to tangible assets. GNBC has included in this presentation information related to these non-GAAP financial measures for the applicable periods presented. Reconciliation of these non-GAAP financial measures to the most directly comparable GAAP financial measures are presented in the table below. As of and for the Quarter Ended For the Nine Months Ended Sep 30, 2018 Jun 30, 2018 Mar 31, 2018 Dec 31, 2017 Sep 30, 2017 Sep 30, 2018 Sep 30, 2017 Operating Earnings Net Income (loss) $ 15,597 $ 16,421 $ 9,362 $ 2,619 $ 11,407 41,380 31,517 Plus: Loss (gain) on sale of securities available-for- sale, net — (66) — — 332 (66) 38 Plus: Loss (gain) on held for sale loans, net — — — 1,098 1,294 — 1,210 Plus: Stock based compensation expense for performance option vesting — — — 3,051 — — — Plus: Shelf and secondary offering expenses — 337 397 — — 734 — Less: Tax benefit at the statutory rate — 57 83 $ 1,452 569 $ 140 $ 437 Plus: Non-deductible merger costs 2,955 — — — — 2,955 — Net operating earnings $ 18,552 $ 16,635 $ 9,676 $ 5,316 $ 12,464 $ 44,863 $ 32,328 Weighted average diluted shares outstanding 37,726 37,646 37,586 37,393 37,332 37,652 37,273 Diluted earnings per share $ 0.41 $ 0.44 $ 0.25 $ 0.07 $ 0.31 1.10 0.85 Diluted operating earnings per share 0.49 0.44 0.26 0.14 0.33 1.19 0.87 Pre-Tax, Pre-Provision Operating Earnings Net Income (loss) $ 15,597 $ 16,421 $ 9,362 $ 2,619 $ 11,407 $ 41,380 $ 31,517 Plus: Provision (benefit) for income taxes 4,943 4,283 2,322 10,142 5,895 11,548 16,822 Plus: Provision for loan losses 320 1,897 9,663 4,405 2,300 11,880 9,955 Plus: Loss (gain) on sale of securities available-for- sale, net — (66) — — 332 (66) 38 Plus: Loss (gain) on held for sale loans, net — — — 1,098 1,294 — 1,210 Plus: Stock based compensation expense for performance option vesting — — — 3,051 — — — Plus: Shelf and secondary offering expenses — 337 397 — — 734 — Plus: Non-deductible merger costs 2,955 — — — — 2,955 — Net pre-tax, pre-provision operating earnings $ 23,815 $ 22,872 $ 21,744 $ 21,315 $ 21,228 $ 68,431 $ 59,542 Total average assets $ 4,360,244 $ 4,253,357 $ 4,204,200 $ 4,204,105 $ 4,131,706 $ 4,273,171 $ 4,082,033 Pre-tax, pre-provision operating return on average assets (annualized) 2.17 % 2.15 % 2.10 % 2.01 % 2.04 % 2.14 % 1.95 % Average Total Assets $ 4,360,244 $ 4,253,357 $ 4,204,200 $ 4,204,105 $ 4,131,706 $ 4,273,171 $ 4,082,033 Return on average assets 1.42 % 1.54 % 0.90 % 0.25 % 1.10 % 1.29 % 1.03 % Operating return on average assets (annualized) 1.69 % 1.56 % 0.93 % 0.50 % 1.20 % 1.40 % 1.06 % 33

34