
Veritex Holdings, Inc. To Acquire North Avenue Capital The Leading Non-Bank USDA Lender September 21, 2021 Exhibit 99.2
2 Forward Looking Statements This presentation includes “forward-looking statements,” within the meaning of the Private Securities Litigation Reform Act of 1995. Forward-looking statements are based on various facts and derived utilizing important assumptions, current expectations, estimates and projections and are subject to known and unknown risks, uncertainties and other factors that may cause actual results, performance or achievements to be materially different from any future results, performance or achievements expressed or implied by such forward-looking statements. Forward-looking statements include, without limitation, statements relating to the impact Veritex expects its proposed acquisition of North Avenue Capital, LLC (“NAC”) to have on its operations, financial condition, and financial results, and Veritex’s expectations about its ability to successfully integrate the combined businesses and the amount of cost savings and overall operational efficiencies Veritex expects to realize as a result of the proposed acquisition. The forward-looking statements also include statements about Veritex’s future financial performance, business and growth strategy, projected plans and objectives, as well as other projections based on macroeconomic and industry trends, which are inherently unreliable due to the multiple factors that impact economic trends, and any such variations may be material. Statements preceded by, followed by or that otherwise include the words “believes,” “expects,” “anticipates,” “intends,” “projects,” “estimates,” “plans” and similar expressions or future or conditional verbs such as “will,” “should,” “would,” “may” and “could” are generally forward-looking in nature and not historical facts, although not all forward-looking statements include the foregoing. Further, certain important factors could affect future results and cause actual results to differ materially from those expressed in the forward-looking statements, including, but not limited to, the possibility that the proposed acquisition does not close when expected or at all because required regulatory, shareholder or other approvals and other conditions to closing are not received or satisfied on a timely basis or at all, the failure to close for any other reason, that the businesses of Veritex and NAC will not be integrated successfully, that the cost savings and any synergies from the proposed acquisition may not be fully realized or may take longer to realize than expected, disruption from the proposed acquisition making it more difficult to maintain relationships with employees, customers or other parties with whom Veritex or NAC have business relationships, diversion of management time on acquisition- related issues, the reaction to the transaction of the companies’ customers, employees and counterparties and other factors, many of which are beyond the control of Veritex and NAC. We refer you to the “Risk Factors” and “Management’s Discussion and Analysis of Financial Condition and Results of Operations” sections of Veritex’s Annual Report on Form 10-K for the year ended December 31, 2020 and any updates to those risk factors set forth in Veritex’s Quarterly Reports on Form 10-Q, Current Reports on Form 8-K and other filings, which have been filed with the SEC and are available on the SEC’s website at www.sec.gov. If one or more events related to these or other risks or uncertainties materialize, or if Veritex’s underlying assumptions prove to be incorrect, actual results may differ materially from what Veritex or NAC anticipates. Accordingly, you should not place undue reliance on any such forward-looking statements. Any forward-looking statement speaks only as of the date on which it is made. Neither Veritex nor NAC undertakes any obligation, and specifically declines any obligation, to update or revise any forward-looking statements, whether as a result of new information, future developments or otherwise. All forward-looking statements, expressed or implied, included in this presentation are expressly qualified in their entirety by the cautionary statements contained or referred to herein.

3 Strategic Rationale and Transaction Overview • 100% cash transaction • Purchase price is based on minimum closing tangible equity of $25 million, where any shortfall would be deducted from the purchase price dollar for dollar • $5 million in cash to be held in escrow and paid out on the third anniversary of close based on the asset quality performance of the existing portfolio and pipeline at close • Transaction is expected to close in Q4 2021 Transaction Overview Valuation ($ in millions) Purchase Price (including holdback) $62.5 Deal Value / Tangible Common Equity1 2.50x Deal Value / 2022E Net Income 5.4x Transaction Impact 2022E EPS Accretion 8.1% Change in 2022E ROATCE +178bps TBV Dilution2 | Earnback (4.3%) | 3.3 yrs Internal Rate of Return >20% Change in CET1 Ratio at Close (43bps) 1. Based on $25 million minimum equity requirement. 2. Assumes full payout of the $5 million holdback at close. • Meaningful strategic expansion into the fragmented USDA lending space • Experienced origination and servicing team with extensive third-party network and industry-leading underwriting expertise • Strong loan production pipeline in Business & Industry program with a solid foundation to expand and grow into similar sectors • Ability to leverage NAC’s technology for existing Veritex products and services • Diversification of Veritex’s revenue streams • Consistently high gain on sale premiums in the secondary market for guaranteed loans (approximately 20% premium in 2021) • Stable proprietary secondary market for unguaranteed portion of loans • Servicing portfolio growth provides an attractive boost to recurring revenue • SBA revenue synergies identified but not modeled • Enhanced profitability outlook • Ability to support NAC’s strong loan production pipeline with Veritex’s stable, low cost funding • Meaningful opportunity to deploy excess liquidity and capital • Strong cultural fit • Both leadership teams are dedicated to creating strong relationships with their customers and local communities • Continuity and retention of experienced management team through employment agreements with key NAC employees

4 Company Overview Loan Origination Map2 North Avenue Capital Overview 1. As of the last twelve months ended 6/30/2021. 2. Active loan balances as of 8/9/2021. 3. Other services include construction, educational services, wholesale trade and other services. • Founded in 2015, NAC is a regulated, non-depository government guaranteed lender • Originates and services loans primarily through the USDA Business & Industry (B&I) guaranteed loan program • Headquartered in Ponte Vedra, FL with regional offices in Georgia, Nevada, and Texas • Leading market position as “America’s Rural Lender” • Loan sizes range from $2 – $35 million • Sells ~90% of loans into the secondary market, while retaining ~10% of all loans • Services 100% of all loans originated Loan Originations by Industry2 Select Financial Highlights1 $26.1M Revenue $18.8M EBITDA $17.1M Net Income $160.5M Loan Originations 103% Return on Equity 293% YoY Rev. Growth NAC Top 5 Markets NAC Presence 22.1% 5.1% 5.4% 9.7%17.4% 22.4% 15.9% 12.7% 11.8% 8.8% 8.7% 8.4% 6.4% 4.9% Manufacturing Entertainment Healthcare Real Estate Hospitality Other Energy and Natural Resources Agriculture Waste Management 3
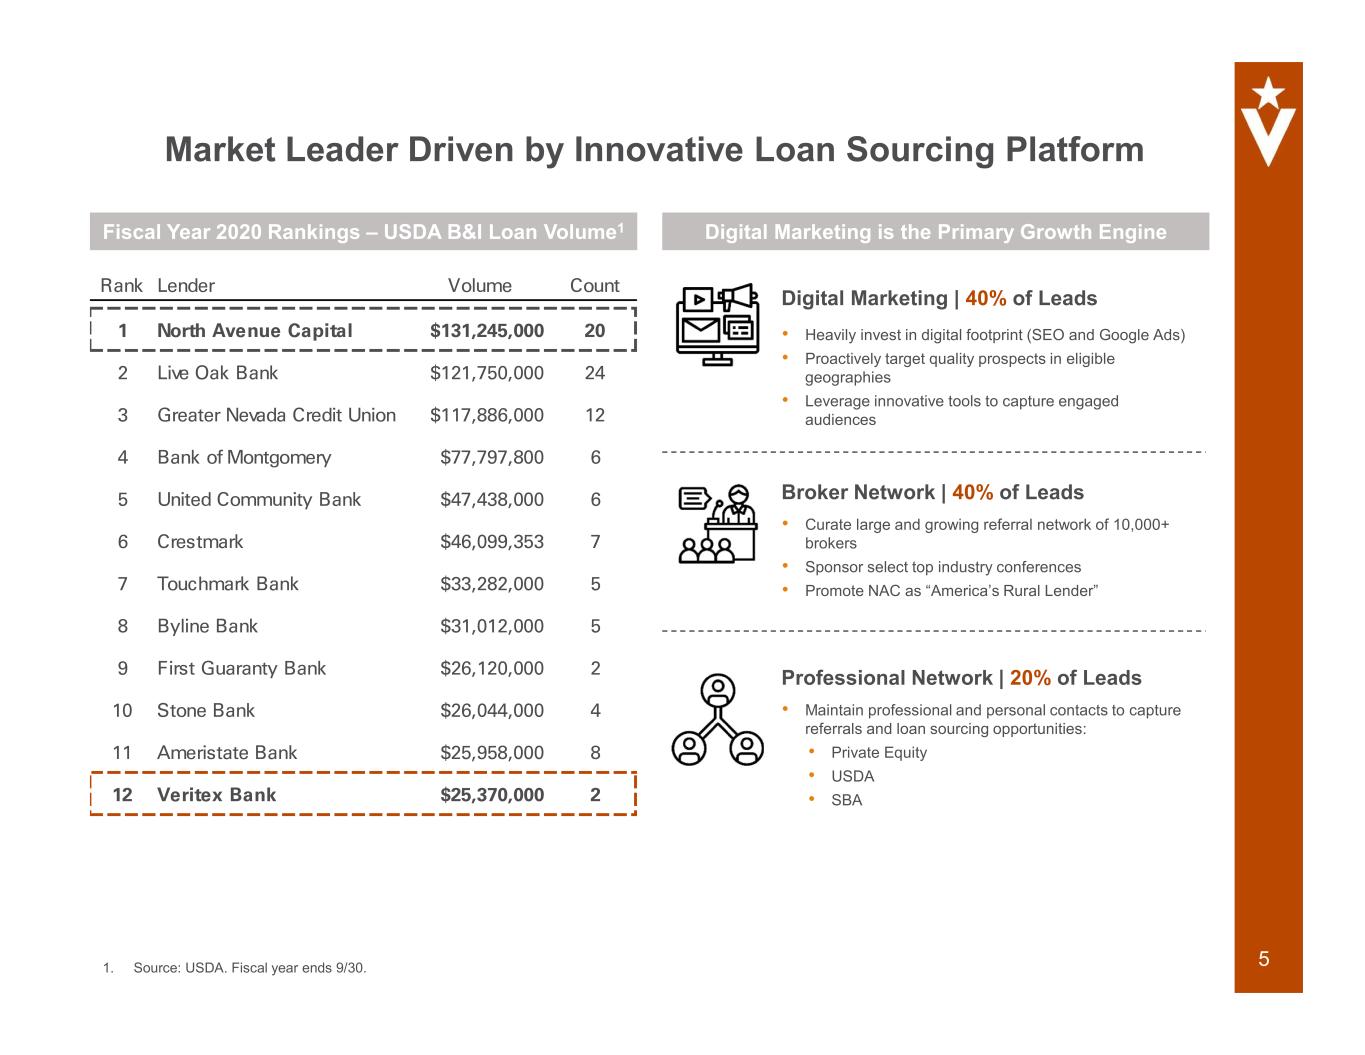
5 Fiscal Year 2020 Rankings – USDA B&I Loan Volume1 Digital Marketing is the Primary Growth Engine Market Leader Driven by Innovative Loan Sourcing Platform 1. Source: USDA. Fiscal year ends 9/30. Rank Lender Volume Count 1 North Avenue Capital $131,245,000 20 2 Live Oak Bank $121,750,000 24 3 Greater Nevada Credit Union $117,886,000 12 4 Bank of Montgomery $77,797,800 6 5 United Community Bank $47,438,000 6 6 Crestmark $46,099,353 7 7 Touchmark Bank $33,282,000 5 8 Byline Bank $31,012,000 5 9 First Guaranty Bank $26,120,000 2 10 Stone Bank $26,044,000 4 11 Ameristate Bank $25,958,000 8 12 Veritex Bank $25,370,000 2 Digital Marketing | 40% of Leads • Heavily invest in digital footprint (SEO and Google Ads) • Proactively target quality prospects in eligible geographies • Leverage innovative tools to capture engaged audiences Broker Network | 40% of Leads • Curate large and growing referral network of 10,000+ brokers • Sponsor select top industry conferences • Promote NAC as “America’s Rural Lender” Professional Network | 20% of Leads • Maintain professional and personal contacts to capture referrals and loan sourcing opportunities: • Private Equity • USDA • SBA

6 Diversification of Revenue Streams Note I: Financial data for the quarter ended 6/30/2021. Dollars in thousands. Note II: Veritex revenue streams does not include revenue from the Thrive Mortgage investment. 1. Excludes purchase accounting adjustments. Pro Forma Company1Veritex Holdings, Inc. Noninterest Income $12,456 16% Net Interest Income $67,131 84% Noninterest Income $25,469 27% Net Interest Income $67,370 73% Service charges and fees on deposit accounts 31% Government guaranteed loan income, net 28% Loan fees 14% Gain on sale of mortgage loans HFS 3% Other 24% Service charges and fees on deposit accounts 15% Government guaranteed loan income, net 58% Loan fees 12% Gain on sale of mortgage loans HFS 1% Servicing Income, net 2% Other 12%
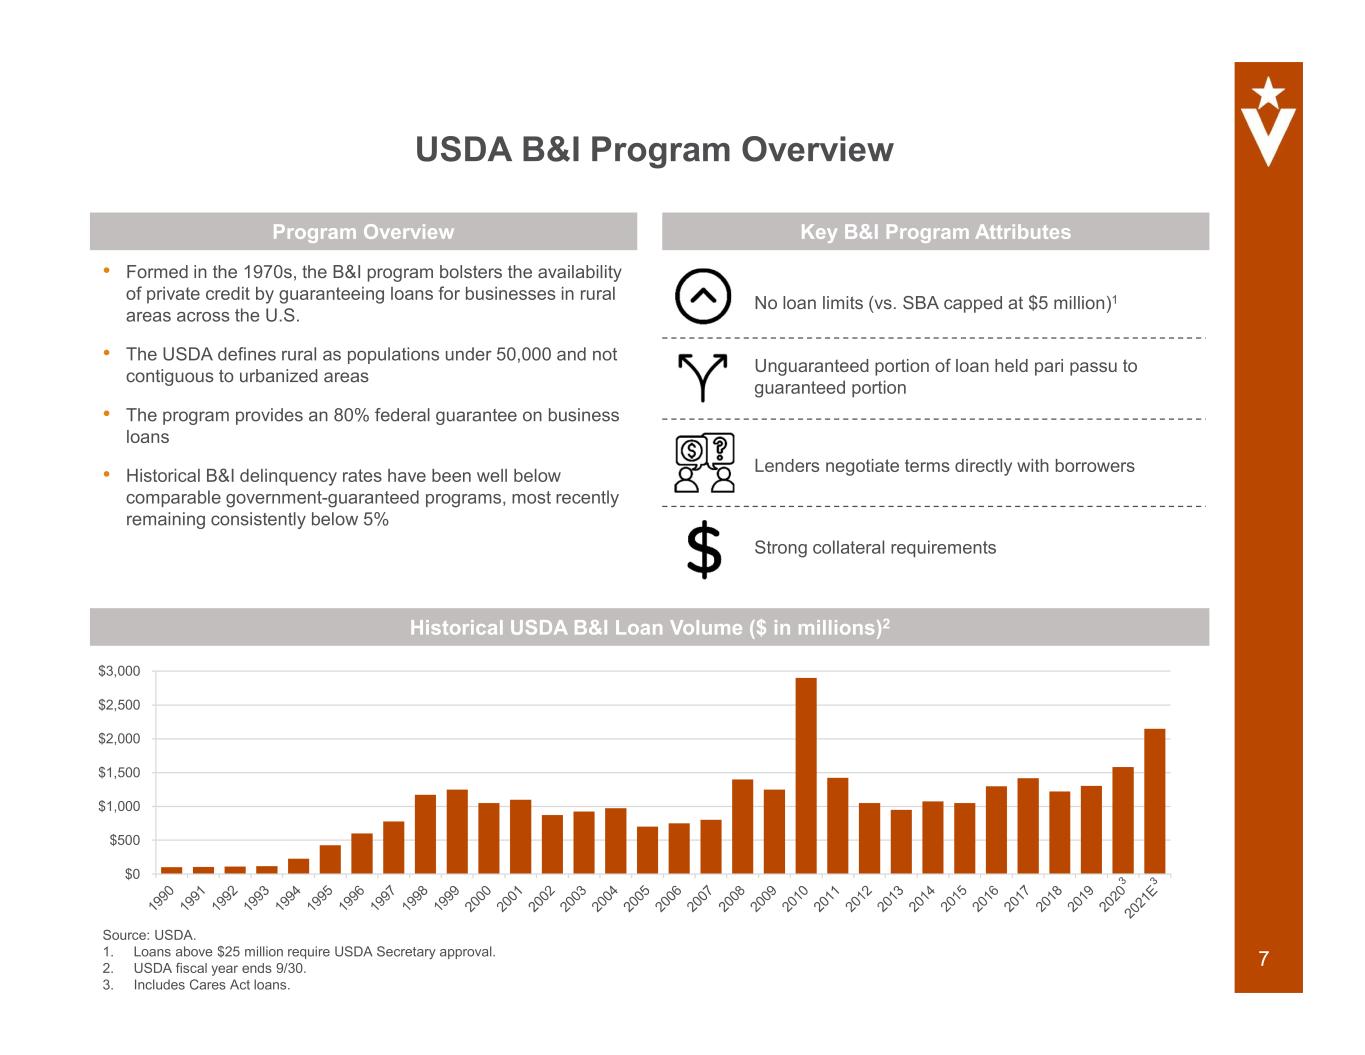
7 • Formed in the 1970s, the B&I program bolsters the availability of private credit by guaranteeing loans for businesses in rural areas across the U.S. • The USDA defines rural as populations under 50,000 and not contiguous to urbanized areas • The program provides an 80% federal guarantee on business loans • Historical B&I delinquency rates have been well below comparable government-guaranteed programs, most recently remaining consistently below 5% Program Overview Key B&I Program Attributes USDA B&I Program Overview Historical USDA B&I Loan Volume ($ in millions)2 No loan limits (vs. SBA capped at $5 million)1 Unguaranteed portion of loan held pari passu to guaranteed portion Lenders negotiate terms directly with borrowers Strong collateral requirements Source: USDA. 1. Loans above $25 million require USDA Secretary approval. 2. USDA fiscal year ends 9/30. 3. Includes Cares Act loans. $0 $500 $1,000 $1,500 $2,000 $2,500 $3,000
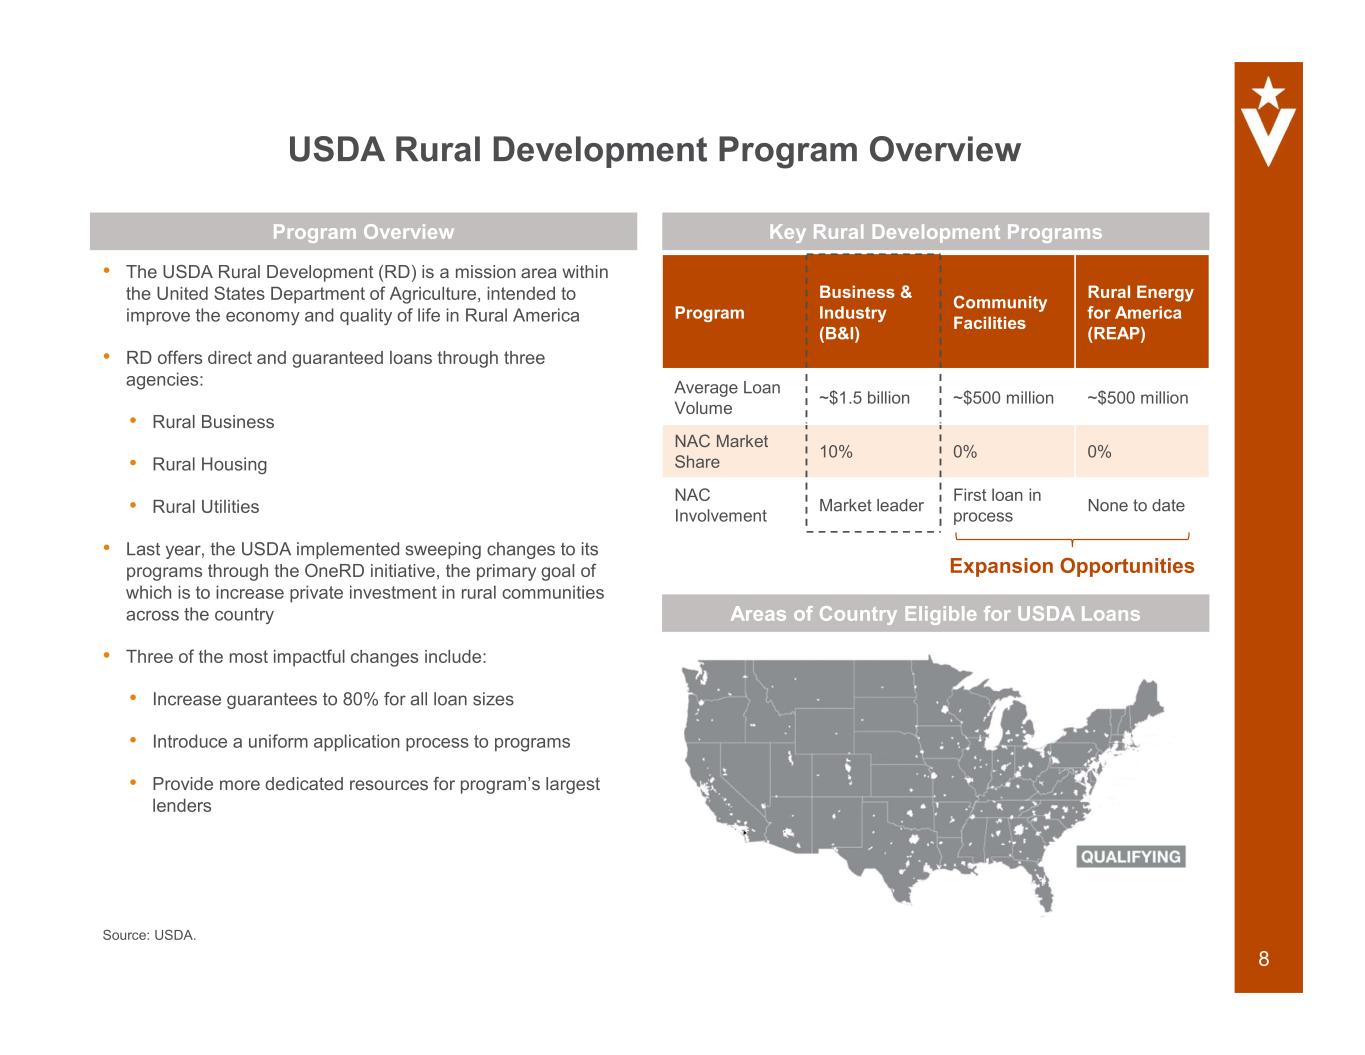
8 • The USDA Rural Development (RD) is a mission area within the United States Department of Agriculture, intended to improve the economy and quality of life in Rural America • RD offers direct and guaranteed loans through three agencies: • Rural Business • Rural Housing • Rural Utilities • Last year, the USDA implemented sweeping changes to its programs through the OneRD initiative, the primary goal of which is to increase private investment in rural communities across the country • Three of the most impactful changes include: • Increase guarantees to 80% for all loan sizes • Introduce a uniform application process to programs • Provide more dedicated resources for program’s largest lenders Program Overview Key Rural Development Programs Program Business & Industry (B&I) Community Facilities Rural Energy for America (REAP) Average Loan Volume ~$1.5 billion ~$500 million ~$500 million NAC Market Share 10% 0% 0% NAC Involvement Market leader First loan in process None to date USDA Rural Development Program Overview Expansion Opportunities Areas of Country Eligible for USDA Loans Source: USDA.

$10.0 $11.6 $0.3 $1.0 $3.0 $1.3 $6.8 $7.9 2016A 2017A 2018A 2019A 2020A 2021E 2022E $125.0 $150.0 $20.3 $19.6 $60.0 $33.3 $127.6 $62.5 2016A 2017A 2018A 2019A 2020A 2021E 2022E $24.5 $27.0 $2.2 $3.7 $8.5 $6.9 $15.8 $16.1 2016A 2017A 2018A 2019A 2020A 2021E 2022E 9 North Avenue Capital Historical Growth Total Loan Volume ($ in millions) Consolidated Revenue ($ in millions) Net Income2 ($ in millions) Actuals Projections Actuals Projections Actuals Projections 1 1 1. 2021 actuals as of the 8 months ended 8/31/2021. 2. Assumes a 35% tax rate before 2018 and a 21% tax rate starting in 2018. 1 Loan Pipeline ($ in millions) Prospects $280.1 Term Sheet Issued $87.6 Underwriting $117.0 Approved $61.2 Total Pipeline: $545.9 million
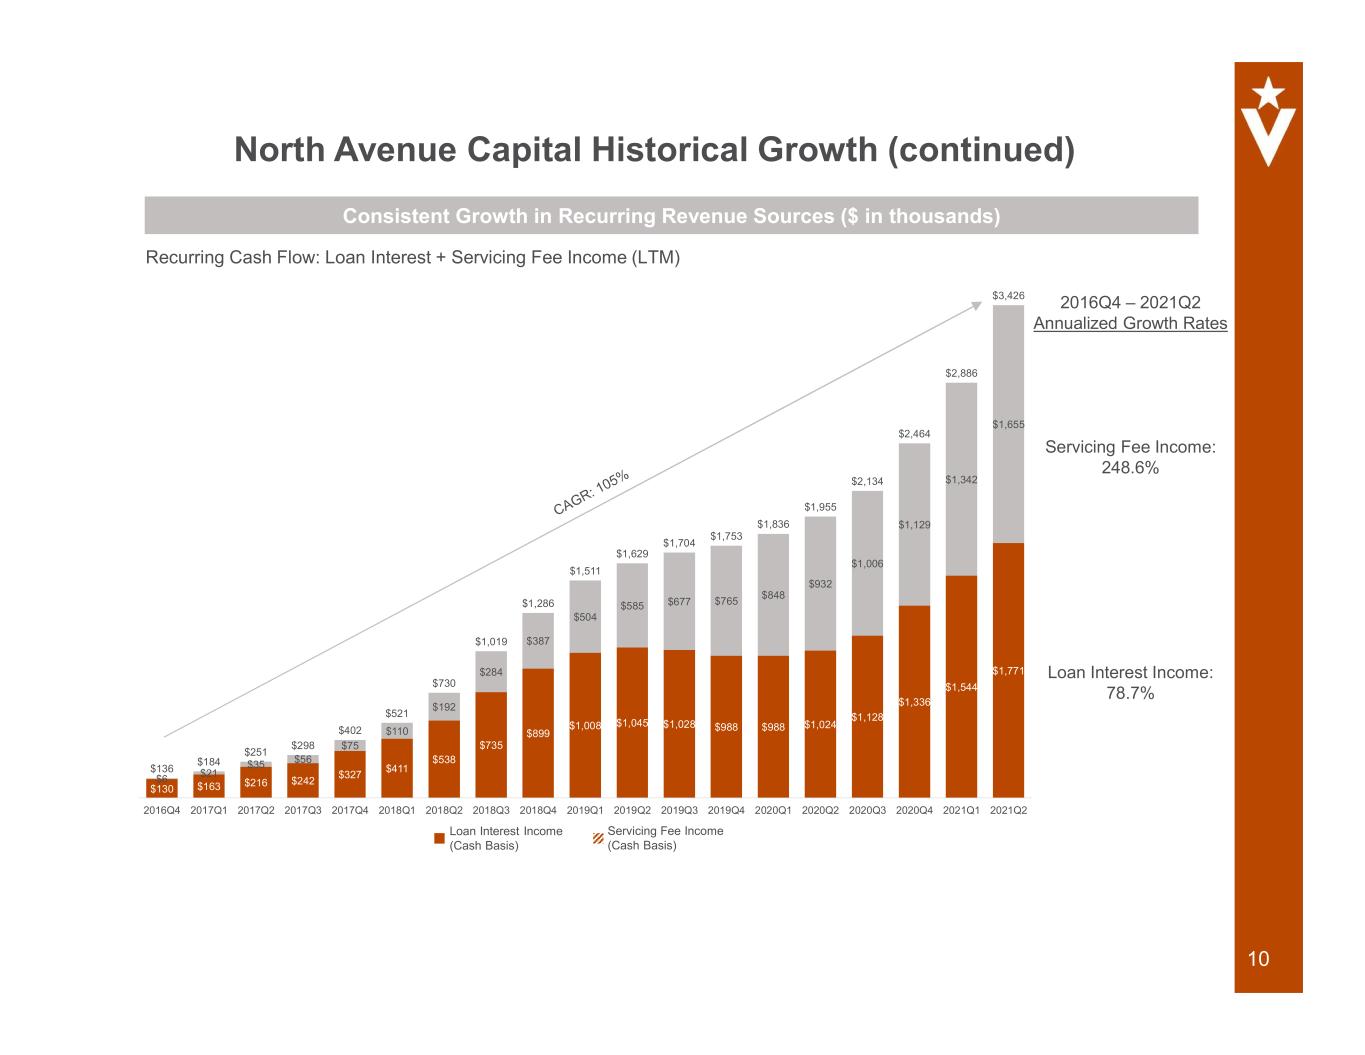
10 North Avenue Capital Historical Growth (continued) $130 $163 $216 $242 $327 $411 $538 $735 $899 $1,008 $1,045 $1,028 $988 $988 $1,024 $1,128 $1,336 $1,544 $1,771 $6 $21 $35 $56 $75 $110 $192 $284 $387 $504 $585 $677 $765 $848 $932 $1,006 $1,129 $1,342 $1,655 $136 $184 $251 $298 $402 $521 $730 $1,019 $1,286 $1,511 $1,629 $1,704 $1,753 $1,836 $1,955 $2,134 $2,464 $2,886 $3,426 2016Q4 2017Q1 2017Q2 2017Q3 2017Q4 2018Q1 2018Q2 2018Q3 2018Q4 2019Q1 2019Q2 2019Q3 2019Q4 2020Q1 2020Q2 2020Q3 2020Q4 2021Q1 2021Q2 Consistent Growth in Recurring Revenue Sources ($ in thousands) Loan Interest Income (Cash Basis) Servicing Fee Income (Cash Basis) 2016Q4 – 2021Q2 Annualized Growth Rates Servicing Fee Income: 248.6% Loan Interest Income: 78.7% Recurring Cash Flow: Loan Interest + Servicing Fee Income (LTM)
11 Concluding Observations • North Avenue Capital is a meaningful strategic expansion for Veritex into the fragmented USDA lending space • High gain on sale premiums in the secondary market for guaranteed loans and loan servicing income generates a diversified, recurring revenue stream for Veritex • NAC’s strong loan pipeline creates an opportunity for Veritex to deploy its excess liquidity and capital • NAC management and staff provides Veritex with industry-leading expertise and extensive third-party networks • Regulatory tailwinds from USDA OneRD increase in loan guarantees support increased growth and profitability in the industry • Attractive internal rate of return along with earnings accretion and manageable TBV dilution • The transaction will further enhance Veritex’s long-term track record of creating shareholder value


