Exhibit 99.2 Q3 2019 Earnings Presentation November 7, 2019 Mike Petters President and Chief Executive Officer Chris Kastner Executive Vice President, Business Management and Chief Financial Officer
2 Forward-Looking Statements Exhibit 99.2 Statements in this presentation, other than statements of historical fact, constitute "forward-looking statements" within the meaning of the Private Securities Litigation Reform Act of 1995. Forward-looking statements involve risks and uncertainties that could cause our actual results to differ materially from those expressed in these statements. Factors that may cause such differences include: changes in government and customer priorities and requirements (including government budgetary constraints, shifts in defense spending, and changes in customer short-range and long-range plans); our ability to estimate our future contract costs and perform our contracts effectively; changes in procurement processes and government regulations and our ability to comply with such requirements; our ability to deliver our products and services at an affordable life cycle cost and compete within our markets; natural and environmental disasters and political instability; our ability to execute our strategic plan, including with respect to share repurchases, dividends, capital expenditures, and strategic acquisitions; adverse economic conditions in the United States and globally; changes in key estimates and assumptions regarding our pension and retiree health care costs; security threats, including cyber security threats, and related disruptions; and other risk factors discussed in our filings with the U.S. Securities and Exchange Commission. There may be other risks and uncertainties that we are unable to predict at this time or that we currently do not expect to have a material adverse effect on our business, and we undertake no obligation to update any forward-looking statements. You should not place undue reliance on any forward-looking statements that we may make. This presentation also contains non-GAAP financial measures and includes a GAAP reconciliation of these financial measures. Non-GAAP financial measures should not be construed as being more important than comparable GAAP measures.
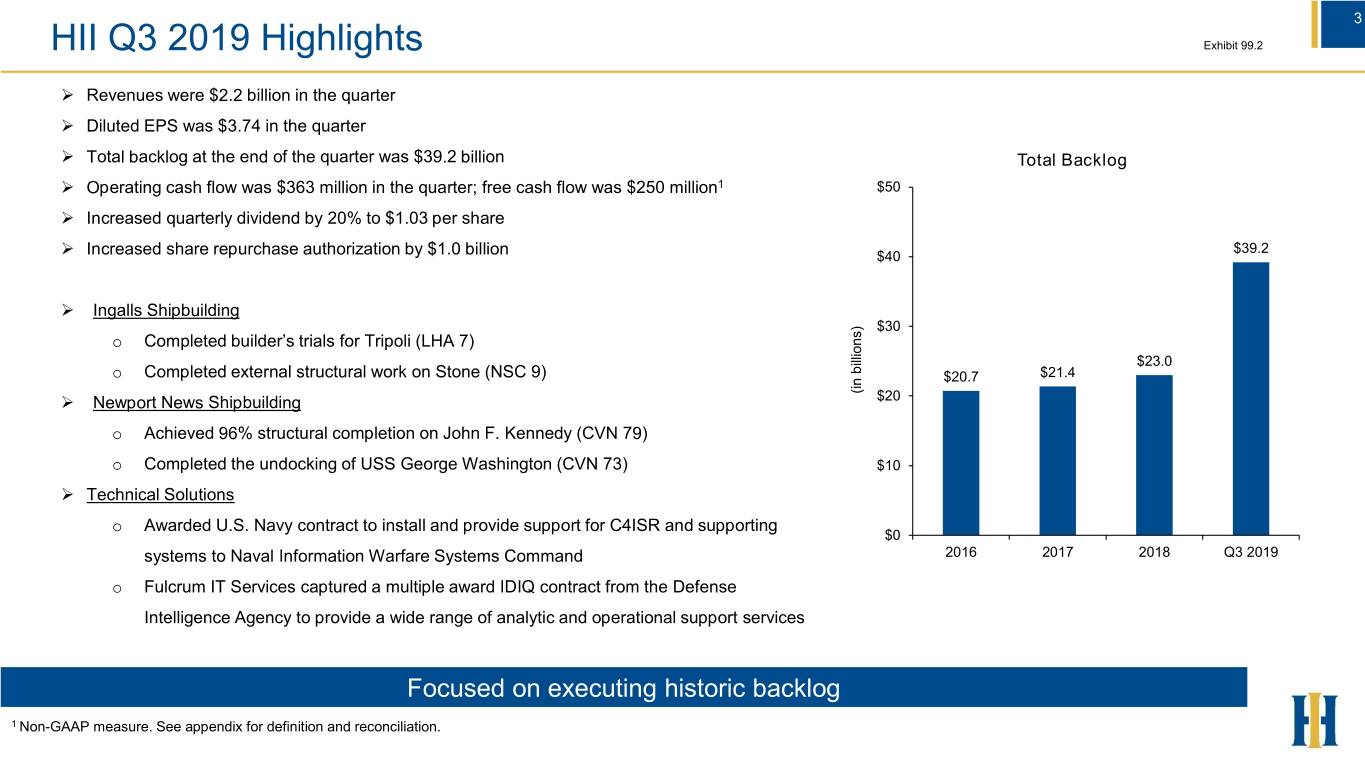
3 HII Q3 2019 Highlights Exhibit 99.2 Revenues were $2.2 billion in the quarter Diluted EPS was $3.74 in the quarter Total backlog at the end of the quarter was $39.2 billion Total Backlog Operating cash flow was $363 million in the quarter; free cash flow was $250 million1 $50 Increased quarterly dividend by 20% to $1.03 per share $39.2 Increased share repurchase authorization by $1.0 billion $40 Ingalls Shipbuilding $30 o Completed builder’s trials for Tripoli (LHA 7) $23.0 o Completed external structural work on Stone (NSC 9) $20.7 $21.4 (in (in billions) Newport News Shipbuilding $20 o Achieved 96% structural completion on John F. Kennedy (CVN 79) o Completed the undocking of USS George Washington (CVN 73) $10 Technical Solutions o Awarded U.S. Navy contract to install and provide support for C4ISR and supporting $0 systems to Naval Information Warfare Systems Command 2016 2017 2018 Q3 2019 o Fulcrum IT Services captured a multiple award IDIQ contract from the Defense Intelligence Agency to provide a wide range of analytic and operational support services Focused on executing historic backlog 1 Non-GAAP measure. See appendix for definition and reconciliation.
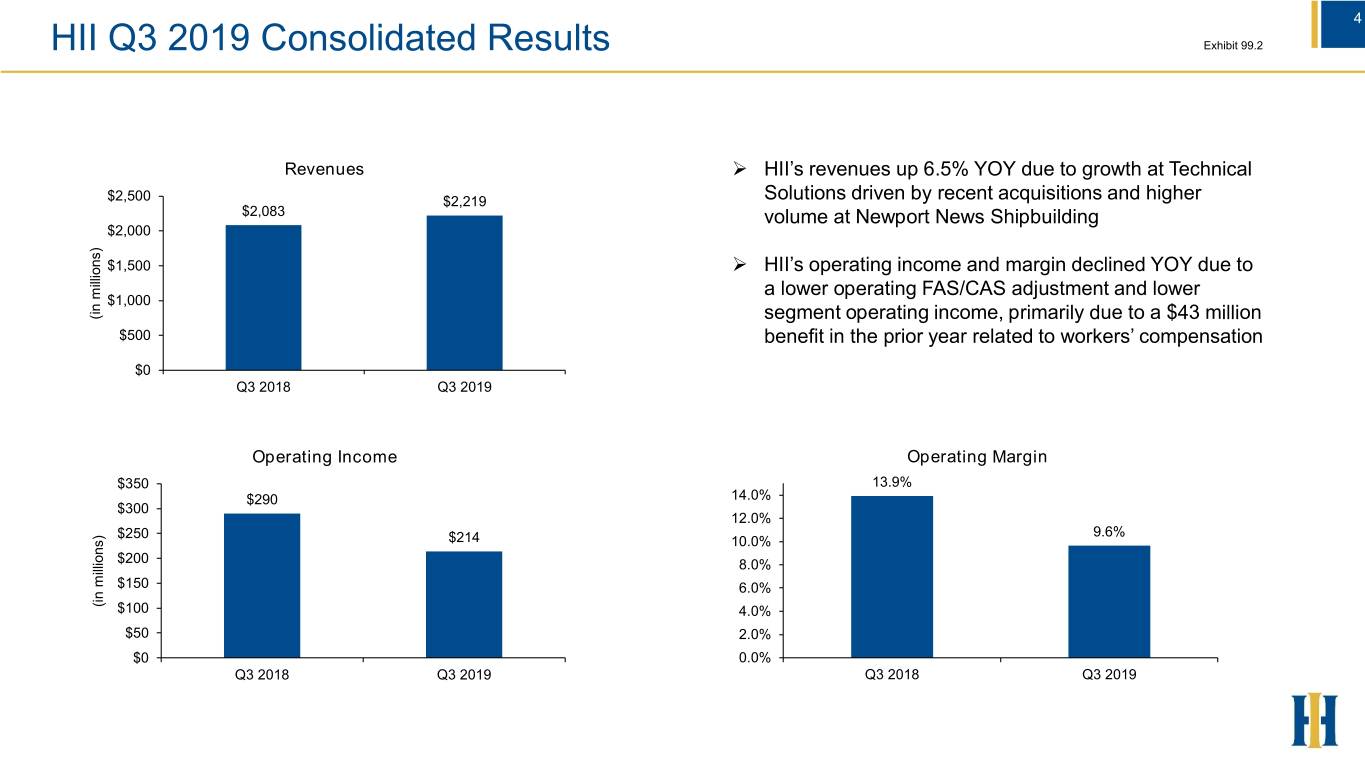
4 HII Q3 2019 Consolidated Results Exhibit 99.2 Revenues HII’s revenues up 6.5% YOY due to growth at Technical $2,500 $2,219 Solutions driven by recent acquisitions and higher $2,083 volume at Newport News Shipbuilding $2,000 $1,500 HII’s operating income and margin declined YOY due to a lower operating FAS/CAS adjustment and lower $1,000 (in (in millions) segment operating income, primarily due to a $43 million $500 benefit in the prior year related to workers’ compensation $0 Q3 2018 Q3 2019 Operating Income Operating Margin $350 13.9% $290 14.0% $300 12.0% $250 9.6% $214 10.0% $200 8.0% $150 6.0% (in (in millions) $100 4.0% $50 2.0% $0 0.0% Q3 2018 Q3 2019 Q3 2018 Q3 2019
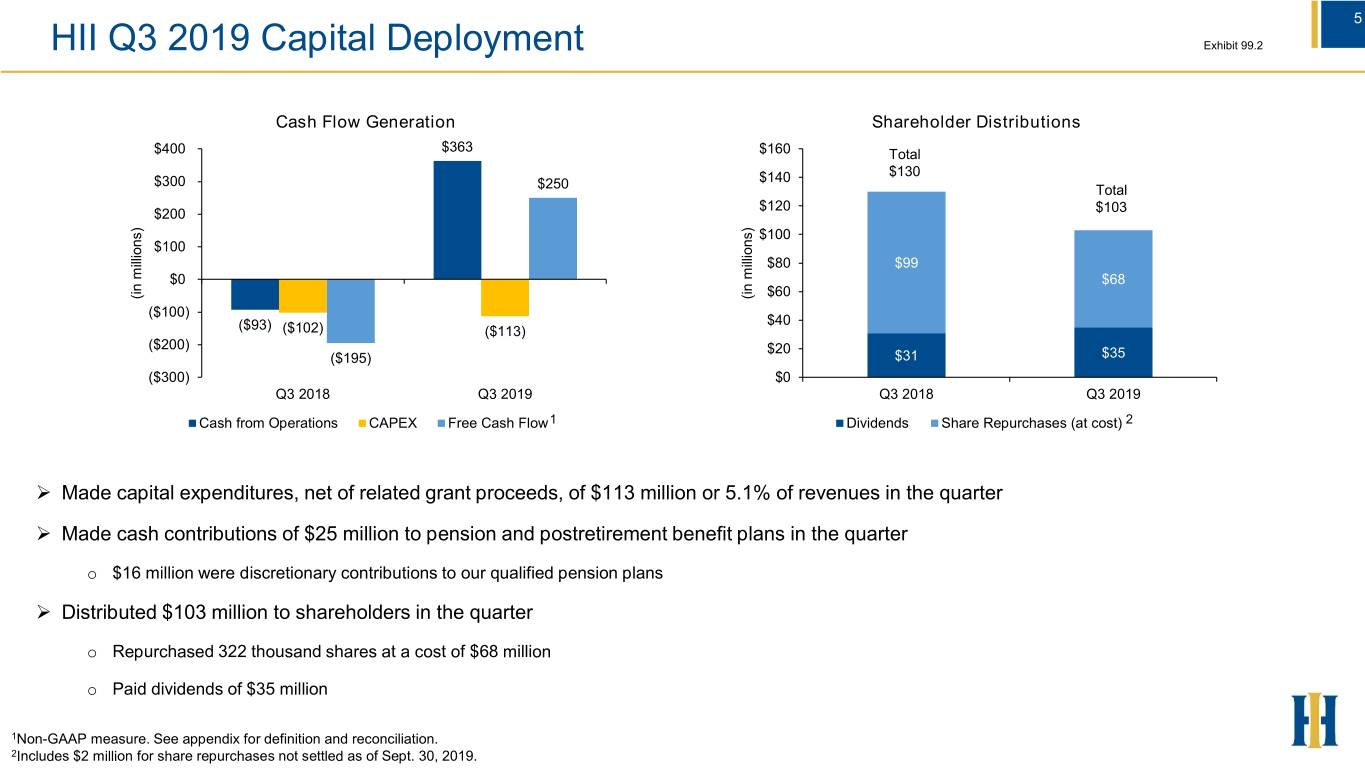
5 HII Q3 2019 Capital Deployment Exhibit 99.2 Cash Flow Generation Shareholder Distributions $363 $400 $160 Total $130 $300 $140 $250 Total $120 $200 $103 $100 $100 $80 $99 $0 $68 $60 (in (in millions) (in millions) ($100) $40 ($93) ($102) ($113) ($200) $20 ($195) $31 $35 ($300) $0 Q3 2018 Q3 2019 Q3 2018 Q3 2019 Cash from Operations CAPEX Free Cash Flow1 Dividends Share Repurchases (at cost) 2 Made capital expenditures, net of related grant proceeds, of $113 million or 5.1% of revenues in the quarter Made cash contributions of $25 million to pension and postretirement benefit plans in the quarter o $16 million were discretionary contributions to our qualified pension plans Distributed $103 million to shareholders in the quarter o Repurchased 322 thousand shares at a cost of $68 million o Paid dividends of $35 million 1Non-GAAP measure. See appendix for definition and reconciliation. 2Includes $2 million for share repurchases not settled as of Sept. 30, 2019.
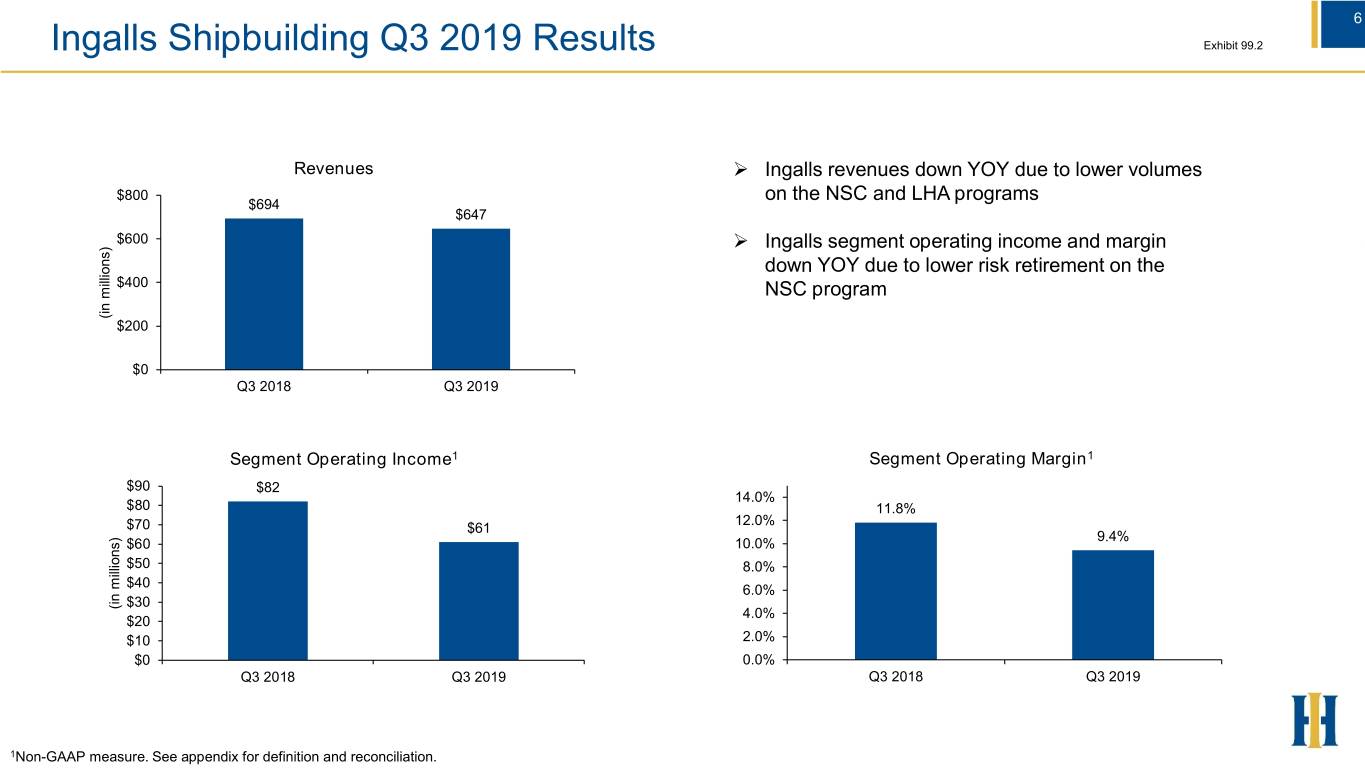
6 Ingalls Shipbuilding Q3 2019 Results Exhibit 99.2 Revenues Ingalls revenues down YOY due to lower volumes $800 on the NSC and LHA programs $694 $647 $600 Ingalls segment operating income and margin down YOY due to lower risk retirement on the $400 NSC program (in (in millions) $200 $0 Q3 2018 Q3 2019 Segment Operating Income1 Segment Operating Margin1 $90 $82 14.0% $80 11.8% 12.0% $70 $61 9.4% $60 10.0% $50 8.0% $40 6.0% (in (in millions) $30 4.0% $20 $10 2.0% $0 0.0% Q3 2018 Q3 2019 Q3 2018 Q3 2019 1Non-GAAP measure. See appendix for definition and reconciliation.
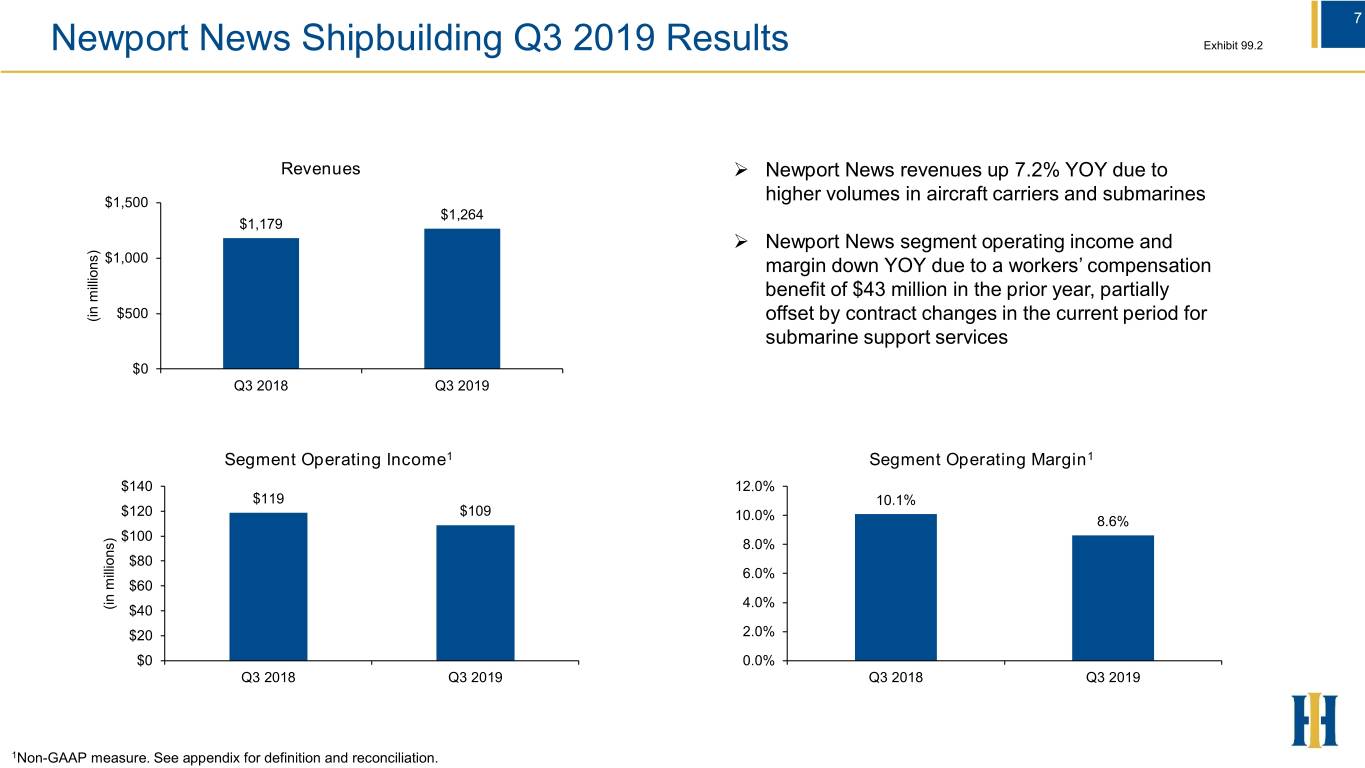
7 Newport News Shipbuilding Q3 2019 Results Exhibit 99.2 Revenues Newport News revenues up 7.2% YOY due to $1,500 higher volumes in aircraft carriers and submarines $1,264 $1,179 Newport News segment operating income and $1,000 margin down YOY due to a workers’ compensation benefit of $43 million in the prior year, partially $500 (in (in millions) offset by contract changes in the current period for submarine support services $0 Q3 2018 Q3 2019 Segment Operating Income1 Segment Operating Margin1 $140 12.0% $119 10.1% $120 $109 10.0% 8.6% $100 8.0% $80 6.0% $60 (in (in millions) 4.0% $40 $20 2.0% $0 0.0% Q3 2018 Q3 2019 Q3 2018 Q3 2019 1Non-GAAP measure. See appendix for definition and reconciliation.

8 Technical Solutions Q3 2019 Results Exhibit 99.2 Revenues Technical Solutions revenues up 41.6% YOY due $400 to higher mission driven innovative solutions $347 $350 revenues following the acquisitions of G2, Inc. and $300 $245 Fulcrum, as well as higher fleet support and oil $250 and gas services revenues $200 $150 (in (in millions) Technical Solutions segment operating income up $100 YOY primarily due to improved performance on $50 nuclear and environmental contracts $0 Q3 2018 Q3 2019 Segment Operating Income1 Segment Operating Margin1 $25 7.0% 6.5% $21 6.1% 6.0% $20 $16 5.0% $15 4.0% $10 3.0% (in (in millions) 2.0% $5 1.0% $0 0.0% Q3 2018 Q3 2019 Q3 2018 Q3 2019 1Non-GAAP measure. See appendix for definition and reconciliation.
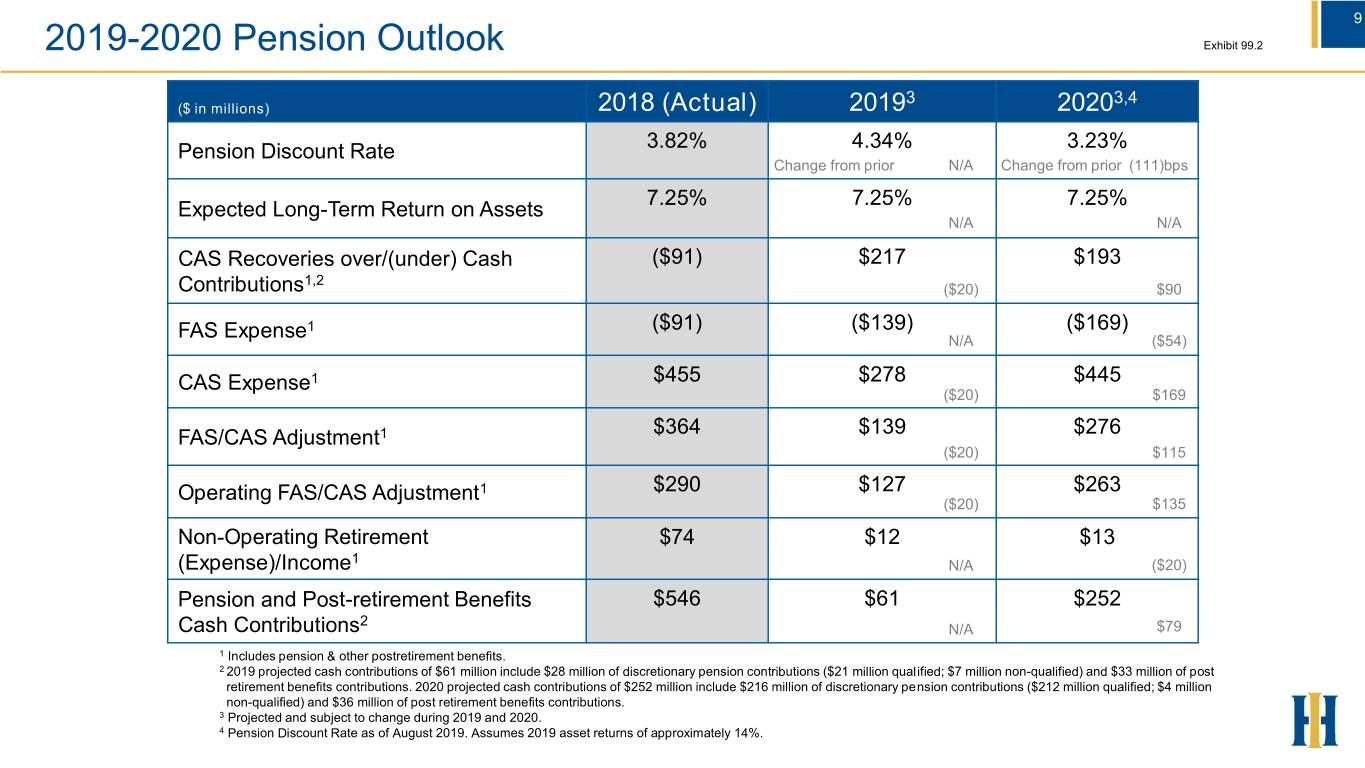
9 2019-2020 Pension Outlook Exhibit 99.2 3 3,4 ($ in millions) 2018 (Actual) 2019 2020 Pension Discount Rate 3.82% 4.34% 3.23% Change from prior N/A Change from prior (111)bps 7.25% 7.25% 7.25% Expected Long-Term Return on Assets N/A N/A CAS Recoveries over/(under) Cash ($91) $217 $193 1,2 Contributions ($20) $90 1 ($91) ($139) ($169) FAS Expense N/A ($54) CAS Expense1 $455 $278 $445 ($20) $169 $364 $139 $276 FAS/CAS Adjustment1 ($20) $115 Operating FAS/CAS Adjustment1 $290 $127 $263 ($20) $135 Non-Operating Retirement $74 $12 $13 (Expense)/Income1 N/A ($20) Pension and Post-retirement Benefits $546 $61 $252 2 Cash Contributions N/A $79 1 Includes pension & other postretirement benefits. 2 2019 projected cash contributions of $61 million include $28 million of discretionary pension contributions ($21 million qualified; $7 million non-qualified) and $33 million of post retirement benefits contributions. 2020 projected cash contributions of $252 million include $216 million of discretionary pension contributions ($212 million qualified; $4 million non-qualified) and $36 million of post retirement benefits contributions. 3 Projected and subject to change during 2019 and 2020. 4 Pension Discount Rate as of August 2019. Assumes 2019 asset returns of approximately 14%.
10 Exhibit 99.2 Appendix
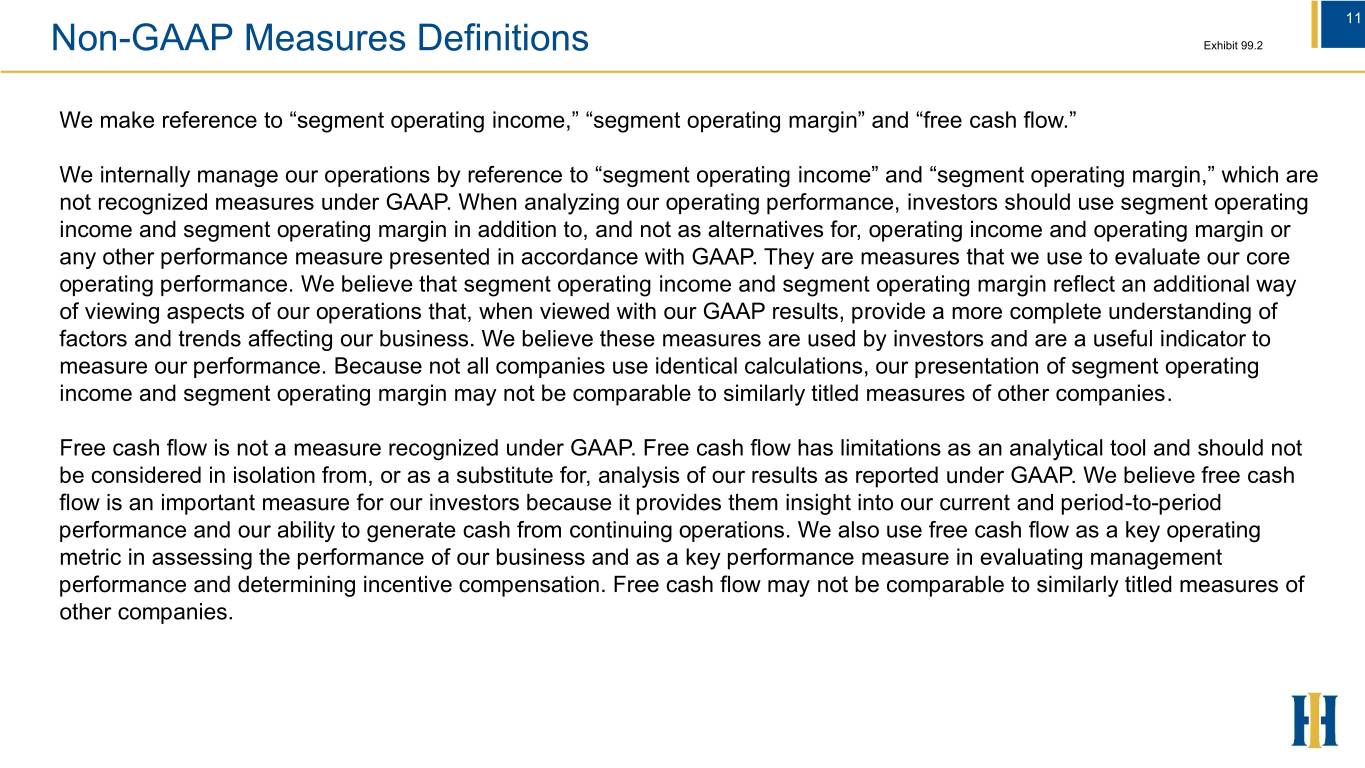
11 Non-GAAP Measures Definitions Exhibit 99.2 We make reference to “segment operating income,” “segment operating margin” and “free cash flow.” We internally manage our operations by reference to “segment operating income” and “segment operating margin,” which are not recognized measures under GAAP. When analyzing our operating performance, investors should use segment operating income and segment operating margin in addition to, and not as alternatives for, operating income and operating margin or any other performance measure presented in accordance with GAAP. They are measures that we use to evaluate our core operating performance. We believe that segment operating income and segment operating margin reflect an additional way of viewing aspects of our operations that, when viewed with our GAAP results, provide a more complete understanding of factors and trends affecting our business. We believe these measures are used by investors and are a useful indicator to measure our performance. Because not all companies use identical calculations, our presentation of segment operating income and segment operating margin may not be comparable to similarly titled measures of other companies. Free cash flow is not a measure recognized under GAAP. Free cash flow has limitations as an analytical tool and should not be considered in isolation from, or as a substitute for, analysis of our results as reported under GAAP. We believe free cash flow is an important measure for our investors because it provides them insight into our current and period-to-period performance and our ability to generate cash from continuing operations. We also use free cash flow as a key operating metric in assessing the performance of our business and as a key performance measure in evaluating management performance and determining incentive compensation. Free cash flow may not be comparable to similarly titled measures of other companies.
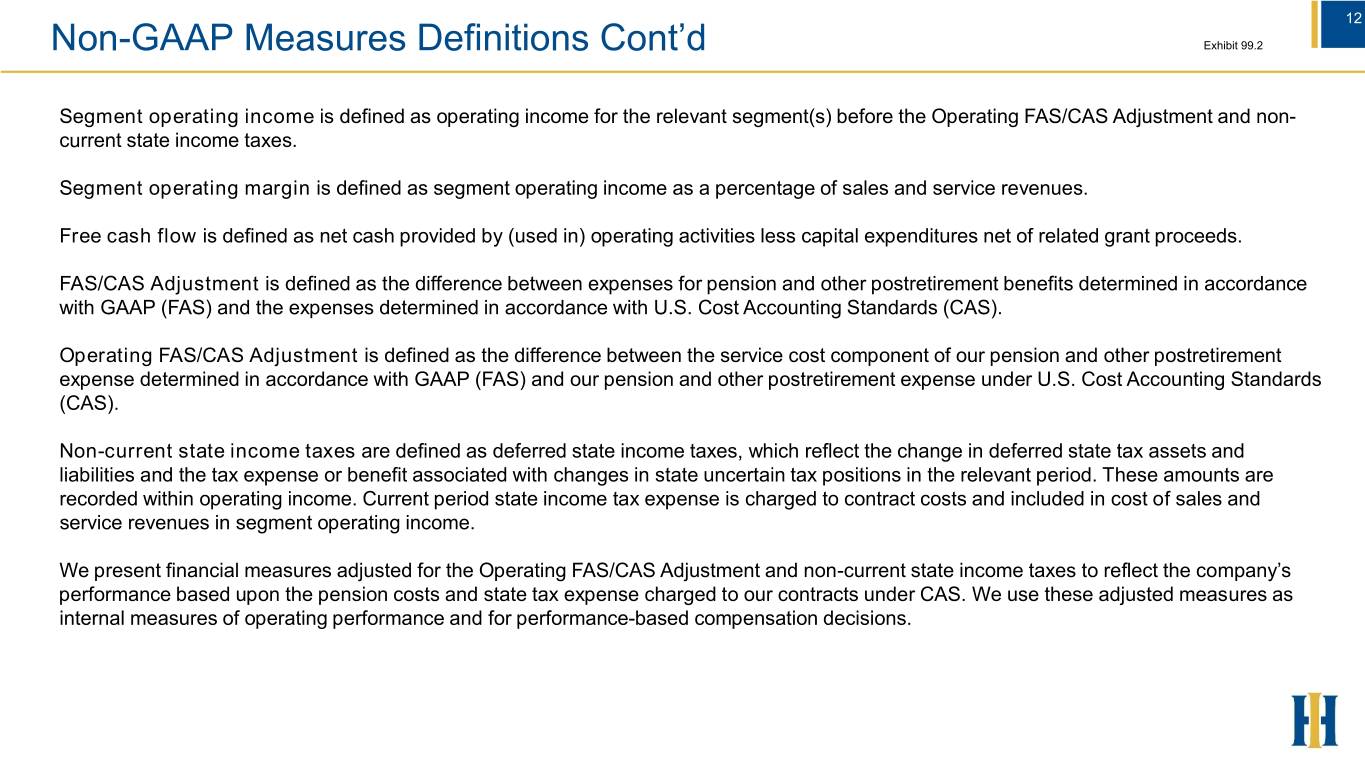
12 Non-GAAP Measures Definitions Cont’d Exhibit 99.2 Segment operating income is defined as operating income for the relevant segment(s) before the Operating FAS/CAS Adjustment and non- current state income taxes. Segment operating margin is defined as segment operating income as a percentage of sales and service revenues. Free cash flow is defined as net cash provided by (used in) operating activities less capital expenditures net of related grant proceeds. FAS/CAS Adjustment is defined as the difference between expenses for pension and other postretirement benefits determined in accordance with GAAP (FAS) and the expenses determined in accordance with U.S. Cost Accounting Standards (CAS). Operating FAS/CAS Adjustment is defined as the difference between the service cost component of our pension and other postretirement expense determined in accordance with GAAP (FAS) and our pension and other postretirement expense under U.S. Cost Accounting Standards (CAS). Non-current state income taxes are defined as deferred state income taxes, which reflect the change in deferred state tax assets and liabilities and the tax expense or benefit associated with changes in state uncertain tax positions in the relevant period. These amounts are recorded within operating income. Current period state income tax expense is charged to contract costs and included in cost of sales and service revenues in segment operating income. We present financial measures adjusted for the Operating FAS/CAS Adjustment and non-current state income taxes to reflect the company’s performance based upon the pension costs and state tax expense charged to our contracts under CAS. We use these adjusted measures as internal measures of operating performance and for performance-based compensation decisions.
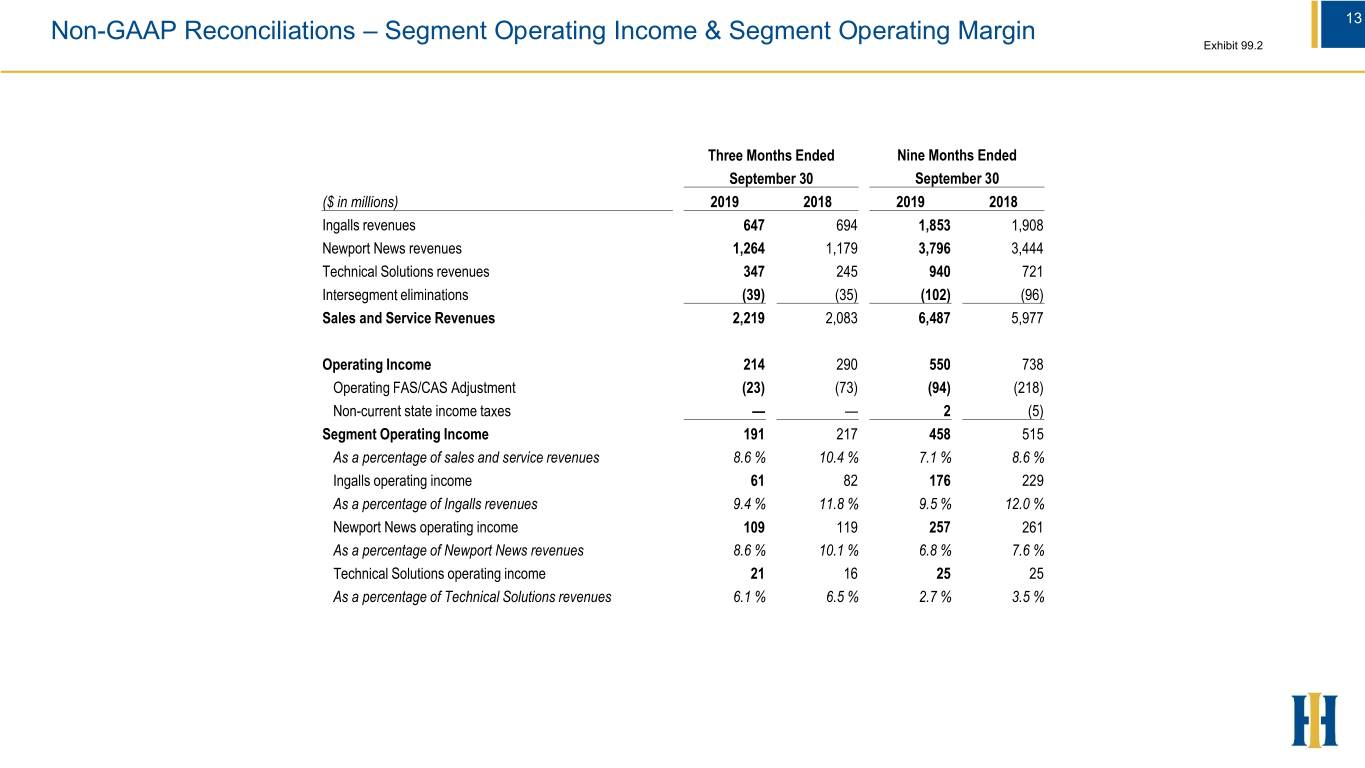
13 Non-GAAP Reconciliations – Segment Operating Income & Segment Operating Margin Exhibit 99.2 Three Months Ended Nine Months Ended September 30 September 30 ($ in millions) 2019 2018 2019 2018 Ingalls revenues 647 694 1,853 1,908 Newport News revenues 1,264 1,179 3,796 3,444 Technical Solutions revenues 347 245 940 721 Intersegment eliminations (39) (35) (102) (96) Sales and Service Revenues 2,219 2,083 6,487 5,977 Operating Income 214 290 550 738 Operating FAS/CAS Adjustment (23) (73) (94) (218) Non-current state income taxes — — 2 (5) Segment Operating Income 191 217 458 515 As a percentage of sales and service revenues 8.6 % 10.4 % 7.1 % 8.6 % Ingalls operating income 61 82 176 229 As a percentage of Ingalls revenues 9.4 % 11.8 % 9.5 % 12.0 % Newport News operating income 109 119 257 261 As a percentage of Newport News revenues 8.6 % 10.1 % 6.8 % 7.6 % Technical Solutions operating income 21 16 25 25 As a percentage of Technical Solutions revenues 6.1 % 6.5 % 2.7 % 3.5 %
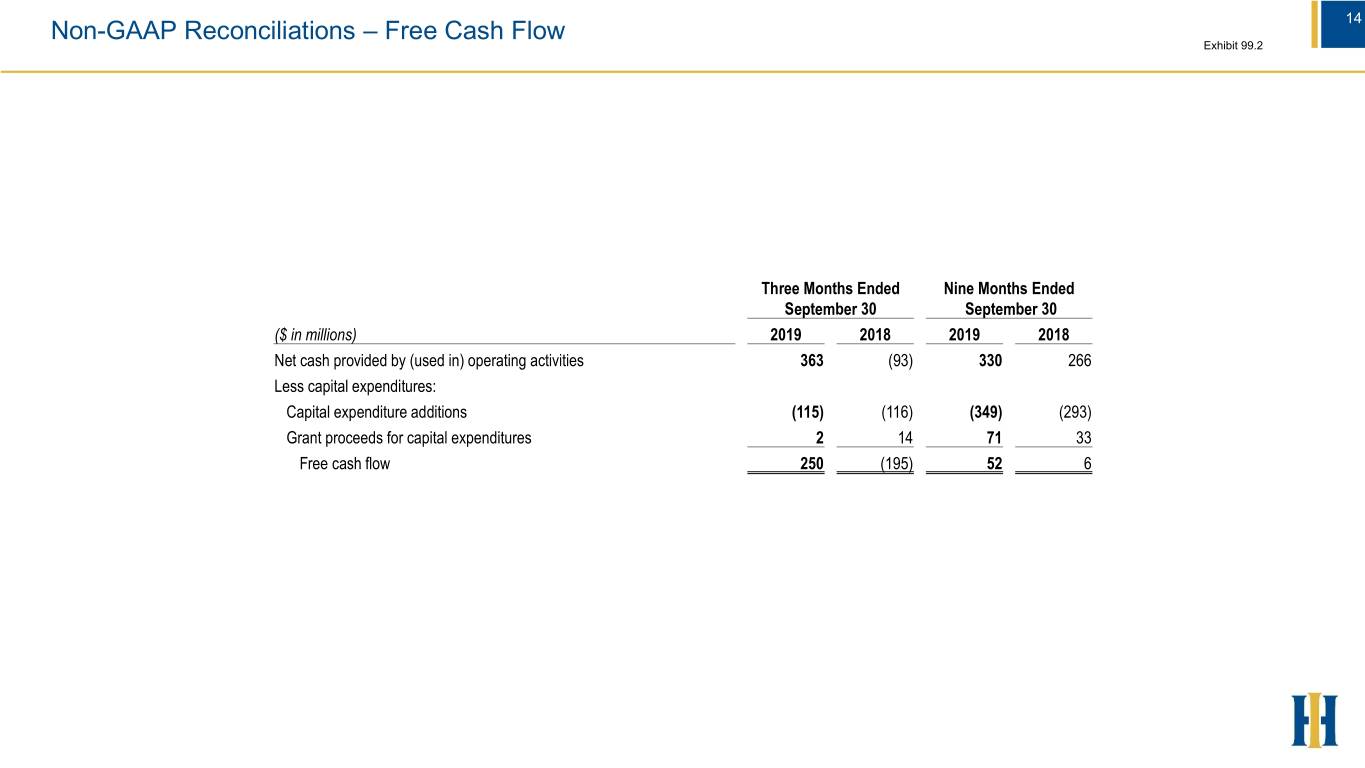
14 Non-GAAP Reconciliations – Free Cash Flow Exhibit 99.2 Three Months Ended Nine Months Ended September 30 September 30 ($ in millions) 2019 2018 2019 2018 Net cash provided by (used in) operating activities 363 (93) 330 266 Less capital expenditures: Capital expenditure additions (115) (116) (349) (293) Grant proceeds for capital expenditures 2 14 71 33 Free cash flow 250 (195) 52 6

Exhibit 99.2


