Exhibit (c)(2)
Draft – for discussion only CORPORATE FINANCE FINANCIAL ADVISORY SERVICES FINANCIAL RESTRUCTURING STRATEGIC CONSULTING HL.com Project Beauty Presentation to the Special Committee of the Board of Directors December 22, 2015 Confidential

Draft – for discussion only Table of Contents Page Merger Overview 2 Financial Analysis 10 Appendix 18 Additional Financial Data 19 Disclaimer 25 Project Beauty 1

Draft – for discussion only Merger Overview
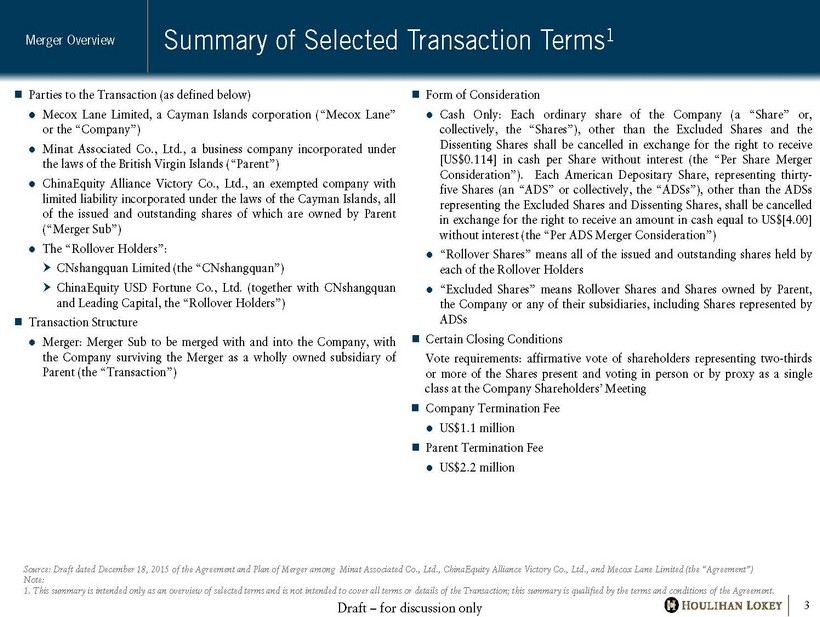
Draft – for discussion only Summary of Selected Transaction Terms 1 Parties to the Transaction (as defined below) Mecox Lane Limited, a Cayman Islands corporation (“ Mecox Lane” or the “Company ”) Minat Associated Co . , Ltd . , a business company incorporated under the laws of the British Virgin Islands (“ Parent”) ChinaEquity Alliance Victory Co . , Ltd . , an exempted company with limited liability incorporated under the laws of the Cayman Islands, all of the issued and outstanding shares of which are owned by Parent (“Merger Sub ”) The “Rollover Holders” : CNshangquan Limited (the “CNshangquan”) ChinaEquity USD Fortune Co . , Ltd . (together with CNshangquan and Leading Capital, the “Rollover Holders”) Transaction Structure Merger : Merger Sub to be merged with and into the Company, with the Company surviving the Merger as a wholly owned subsidiary of Parent (the “Transaction ”) 3 Form of Consideration Cash Only : Each ordinary share of the Company (a “Share” or, collectively, the “Shares”), other than the Excluded Shares and the Dissenting Shares shall be cancelled in exchange for the right to receive [US $ 0 . 114 ] in cash per Share without interest (the “Per Share Merger Consideration”) . Each American Depositary Share, representing thirty - five Shares (an “ADS” or collectively, the “ADSs”), other than the ADSs representing the Excluded Shares and Dissenting Shares, shall be cancelled in exchange for the right to receive an amount in cash equal to US $ [ 4 . 00 ] without interest (the “Per ADS Merger Consideration”) “ Rollover Shares ” means all of the issued and outstanding shares held by each of the Rollover Holders “Excluded Shares” means Rollover Shares and Shares owned by Parent, the Company or any of their subsidiaries, including Shares represented by ADSs Certain Closing Conditions Vote requirements : affirmative vote of shareholders representing two - thirds or more of the Shares present and voting in person or by proxy as a single class at the Company Shareholders’ Meeting Company Termination Fee US $ 1 . 1 million Parent Termination Fee US $ 2 . 2 million Source: Draft dated December 18, 2015 of the Agreement and Plan of Merger among Minat Associated Co., Ltd., ChinaEquity Alliance Victory Co., Ltd., and Mecox Lane Limited (the “Agreement”) Note: 1. This summary is intended only as an overview of selected terms and is not intended to cover all terms or details of the Transaction; this summary is qualified by the terms and conditions of the Agreement. Merger Overview
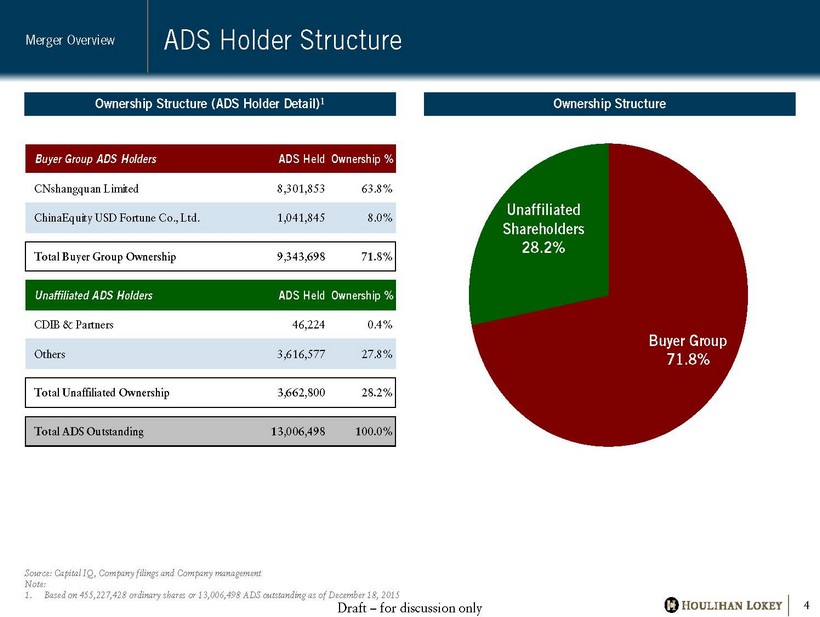
Draft – for discussion only Buyer Group ADS Holders ADS HeldOwnership % CNshangquan Limited 8,301,853 63.8% ChinaEquity USD Fortune Co., Ltd. 1,041,845 8.0% Total Buyer Group Ownership 9,343,698 71.8% Unaffiliated ADS Holders ADS HeldOwnership % CDIB & Partners 46,224 0.4% Others 3,616,577 27.8% Total Unaffiliated Ownership 3,662,800 28.2% Total ADS Outstanding 13,006,498 100.0% Unaffiliated Shareholders 28.2% Buyer Group 71.8% ADS H older Structure Merger Overview 4 Ownership Structure (ADS H older Detail) 1 Source: Capital IQ, Company filings and Company management Note: 1. Based on 455,227,428 ordinary shares or 13,006,498 ADS outstanding as of December 18, 2015 Ownership Structure

Draft – for discussion only (dollars and ADSs in millions, except per ADS values) Per ADS ADS Transaction Security Outstanding 1 Consideration 2 ADS 13.0 $4.00 Implied Values Implied Common Equity $52.0 Adjustments: Add: Total Debt 3 0.0 Add: Noncontrolling Interest 0.1 Less: Cash and Cash Equivalents 4 (20.6) Implied Enterprise Value $31.6 Implied Transaction Multiples Implied Revenues, Net Multiple LTM 9/30/15 0.56x NFY 2015E 0.57x NFY+1 2016E 0.51x EBITDA LTM 9/30/15 4.8x NFY 2015E 5.0x NFY+1 2016E 5.1x Implied Premium of Per ADS Trading Period Closing Transaction Consideration over Prior to Announcement ADS Price Average Closing ADS Price 1-Day $3.40 17.6% 5-Day Average $3.26 22.5% 10-Day Average $3.19 25.4% 1-Month Average $3.27 22.3% 3-Month Average $3.63 10.1% 6-Month Average $3.70 8.2% 1-Year Average 5 $3.73 7.1% 52-Week High 5 7/22/14 $4.69 -14.7% 52-Week Low 5 7/8/15 $2.60 53.8% Transaction Value Overview 5 Source: Company filings; LTM financial per Company filings, NFY and NFY+1 financials per Company management Notes: 1. Based on 455,227,428 ordinary shares or 13,006,498 ADS outstanding as of December 18, 2015 2. The Company received an offer from the Buyer Group on 7/21/2015 at $4.00 per ADS for all the outstanding ADSs of the Company 3. Total debt includes zero short - term and long - term debt as of 9/30/2015 per unaudited figures provided by Company management 4. Cash and cash equivalents and short - term investment as of 9/30/2015 per unaudited figures provided by Company management 5. Includes pricing prior to the spin - off of Giosis Mecoxlane Limited and Mixblu Limited LTM refers to the most recently completed twelve month period for which financial information has been made public, NFY refers to ne xt fiscal year, NFY+1 refers to the year after next fiscal year E refers to Estimated Summary of Proposed Transaction Value Implied Premiums to Historical ADS Trading Prices Merger Overview
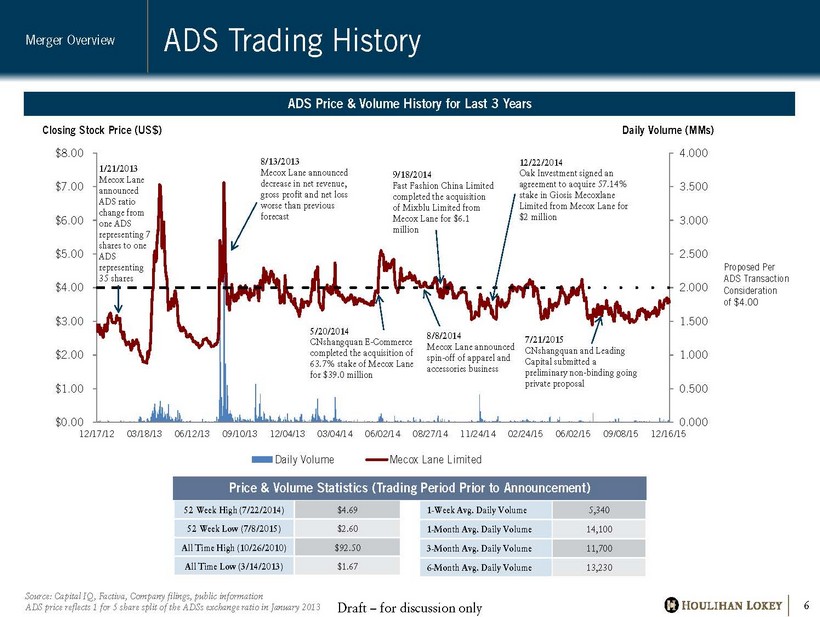
Draft – for discussion only 0.000 0.500 1.000 1.500 2.000 2.500 3.000 3.500 4.000 $0.00 $1.00 $2.00 $3.00 $4.00 $5.00 $6.00 $7.00 $8.00 12/17/12 03/18/13 06/12/13 09/10/13 12/04/13 03/04/14 06/02/14 08/27/14 11/24/14 02/24/15 06/02/15 09/08/15 12/16/15 Daily Volume (MMs) Closing Stock Price (US$) Daily Volume Mecox Lane Limited ADS Trading History 6 1 - Week Avg. Daily Volume 5,340 1 - Month Avg. Daily Volume 14,100 3 - Month Avg. Daily Volume 11,700 6 - Month Avg. Daily Volume 13,230 52 Week High (7/22/2014) $4.69 52 Week Low (7/8/2015) $2.60 All Time High (10/26/2010) $92.50 All Time Low (3/14/2013) $1.67 Source: Capital IQ, Factiva, Company filings, public information ADS price reflects 1 for 5 share split of the ADSs exchange ratio in January 2013 ADS Price & Volume History for Last 3 Years Proposed Per ADS Transaction Consideration of $4.00 Price & Volume Statistics (Trading Period P rior to Announcement) 7/21/2015 CNshangquan and Leading Capital submitted a preliminary non - binding going private proposal 12/22/2014 Oak Investment signed an agreement to acquire 57.14% stake in Giosis Mecoxlane Limited from Mecox Lane for $2 million 9/18/2014 Fast Fashion China Limited completed the acquisition of Mixblu Limited from Mecox Lane for $6.1 million 5/20/2014 CNshangquan E - Commerce completed the acquisition of 63.7% stake of Mecox Lane for $39.0 million 8/13/2013 Mecox Lane announced decrease in net revenue, gross profit and net loss worse than previous forecast 8/8/2014 Mecox Lane announced spin - off of apparel and accessories business 1/21/2013 Mecox Lane announced ADS ratio change from one ADS representing 7 shares to one ADS representing 35 shares Merger Overview
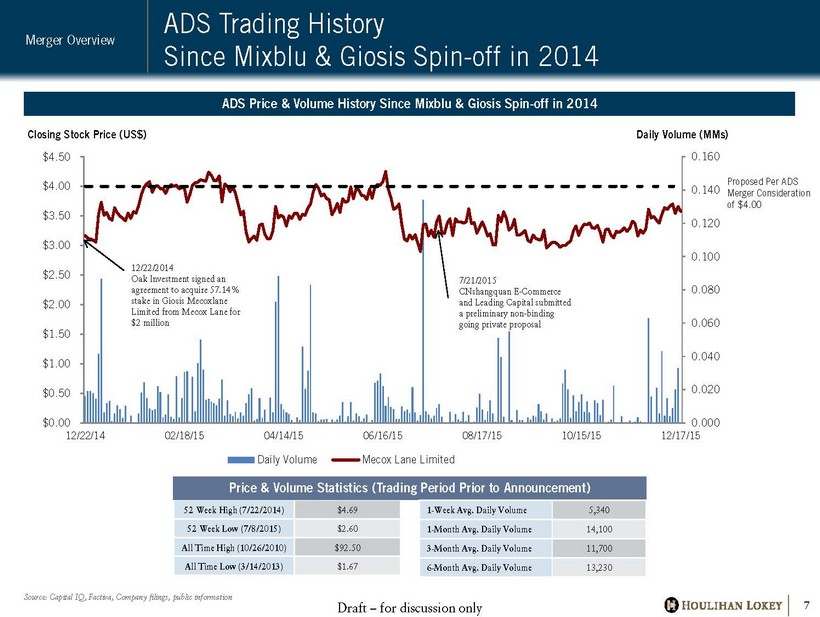
Draft – for discussion only 0.000 0.020 0.040 0.060 0.080 0.100 0.120 0.140 0.160 $0.00 $0.50 $1.00 $1.50 $2.00 $2.50 $3.00 $3.50 $4.00 $4.50 12/22/14 02/18/15 04/14/15 06/16/15 08/17/15 10/15/15 12/17/15 Daily Volume (MMs) Closing Stock Price (US$) Daily Volume ADS Trading History Since Mixblu & Giosis Spin - off in 2014 7 52 Week High (7/22/2014) $4.69 52 Week Low (7/8/2015) $2.60 All Time High (10/26/2010) $92.50 All Time Low (3/14/2013) $1.67 Source: Capital IQ, Factiva, Company filings, public information ADS Price & Volume History Since Mixblu & Giosis Spin - off in 2014 Price & Volume Statistics (Trading Period P rior to Announcement) 7/21/2015 CNshangquan E - Commerce and Leading Capital submitted a preliminary non - binding going private proposal 12/22/2014 Oak Investment signed an agreement to acquire 57.14% stake in Giosis Mecoxlane Limited from Mecox Lane for $2 million Proposed Per ADS Merger Consideration of $4.00 1 - Week Avg. Daily Volume 5,340 1 - Month Avg. Daily Volume 14,100 3 - Month Avg. Daily Volume 11,700 6 - Month Avg. Daily Volume 13,230 Merger Overview
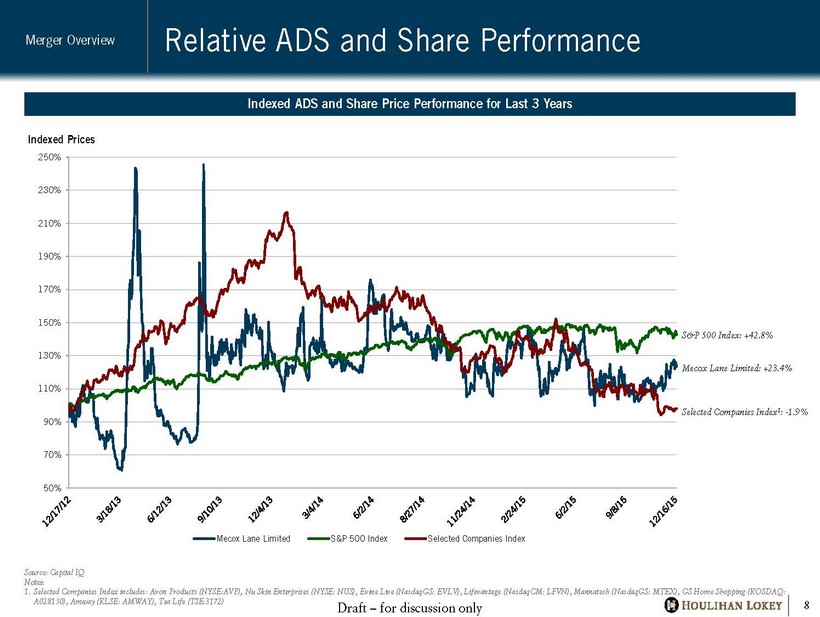
Draft – for discussion only 50% 70% 90% 110% 130% 150% 170% 190% 210% 230% 250% Indexed Prices Mecox Lane Limited S&P 500 Index Selected Companies Index Relative ADS and Share Performance 8 Indexed ADS and Share Price Performance for Last 3 Years S&P 500 Index: +42.8% Mecox Lane Limited: +23.4% Selected Companies Index 1 : - 1.9% Merger Overview Source: Capital IQ Notes: 1. Selected Companies Index includes: Avon Products (NYSE:AVP), Nu Skin Enterprises (NYSE: NUS), Evine Live ( NasdaqGS : EVLV), Lifevantage ( NasdaqCM : LFVN), Mannatech ( NasdaqGS : MTEX), GS Home Shopping (KOSDAQ: A028150), Amway (KLSE: AMWAY), Tea Life (TSE:3172)
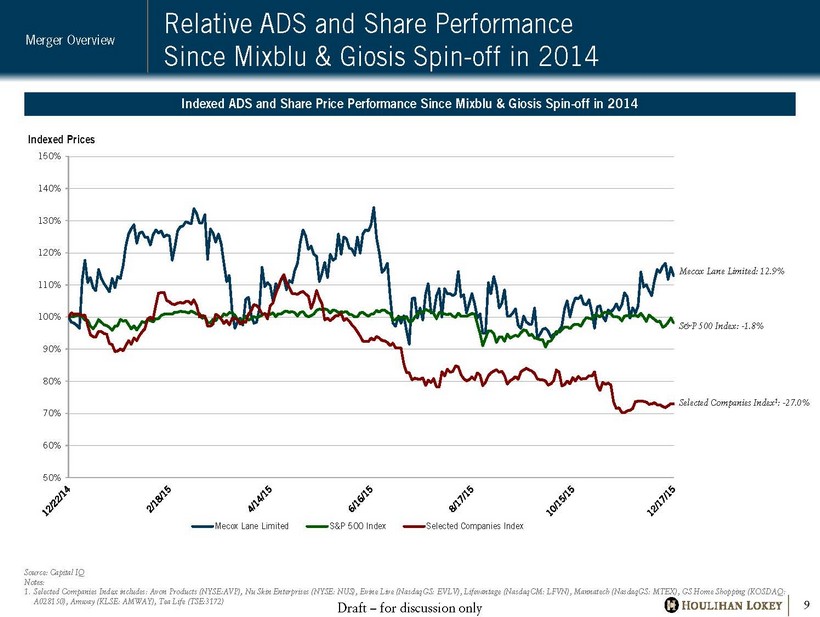
Draft – for discussion only 50% 60% 70% 80% 90% 100% 110% 120% 130% 140% 150% Indexed Prices Mecox Lane Limited S&P 500 Index Selected Companies Index Relative ADS and Share Performance Since Mixblu & Giosis Spin - off in 2014 9 Indexed ADS and Share Price Performance Since Mixblu & Giosis Spin - off in 2014 Mecox Lane Limited: 12.9% S&P 500 Index: - 1.8% Selected Companies Index 1 : - 27.0% Merger Overview Source: Capital IQ Notes: 1. Selected Companies Index includes: Avon Products (NYSE:AVP), Nu Skin Enterprises (NYSE: NUS), Evine Live ( NasdaqGS : EVLV), Lifevantage ( NasdaqCM : LFVN), Mannatech ( NasdaqGS : MTEX), GS Home Shopping (KOSDAQ: A028150), Amway (KLSE: AMWAY), Tea Life (TSE:3172)

Draft – for discussion only Financial Analysis
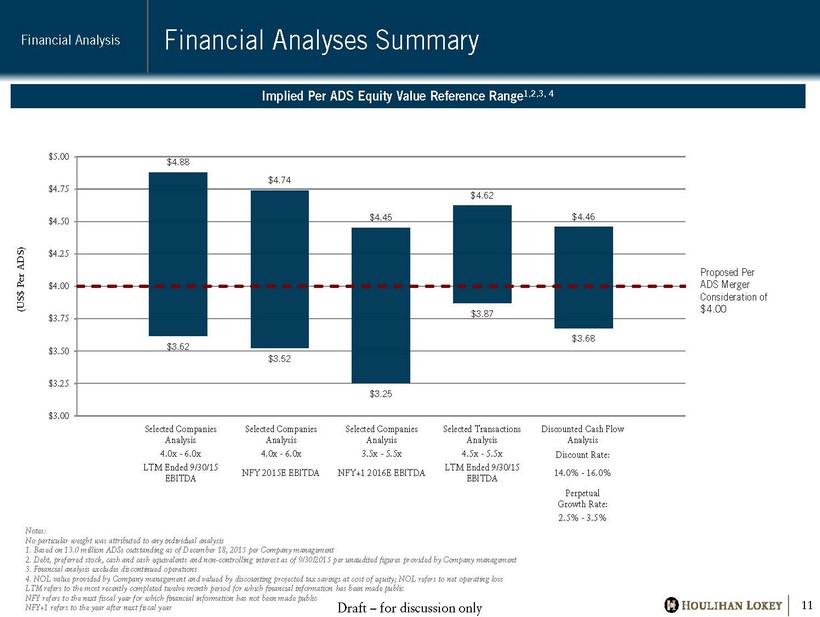
Draft – for discussion only $3.62 $3.52 $3.25 $3.87 $3.68 $4.88 $4.74 $4.45 $4.62 $4.46 $3.00 $3.25 $3.50 $3.75 $4.00 $4.25 $4.50 $4.75 $5.00 Selected Companies Analysis Selected Companies Analysis Selected Companies Analysis Selected Transactions Analysis Discounted Cash Flow Analysis 4.0x - 6.0x 4.0x - 6.0x 3.5x - 5.5x 4.5x - 5.5x Discount Rate: LTM Ended 9/30/15 EBITDA NFY 2015E EBITDA NFY+1 2016E EBITDA LTM Ended 9/30/15 EBITDA 14.0% - 16.0% Perpetual Growth Rate: 2.5% - 3.5% Financial Analyses S ummary Financial Analysis 11 Notes: No particular weight was attributed to any individual analysis 1. Based on 13.0 million ADSs outstanding as of December 18 , 2015 per Company management 2 . Debt, preferred stock, cash and cash equivalents and non - controlling interest as of 9 / 30 / 2015 per unaudited figures provided by Company management 3 . Financial analysis excludes discontinued operations 4 . NOL value provided by Company management and valued by discounting projected tax savings at cost of equity ; NOL refers to net operating loss LTM refers to the most recently completed twelve month period for which financial information has been made public NFY refers to the next fiscal year for which financial information has not been made public NFY+1 refers to the year after next fiscal year Proposed Per ADS Merger Consideration of $4.00 (US$ P er ADS) Implied Per ADS Equity Value Reference Range 1,2,3, 4
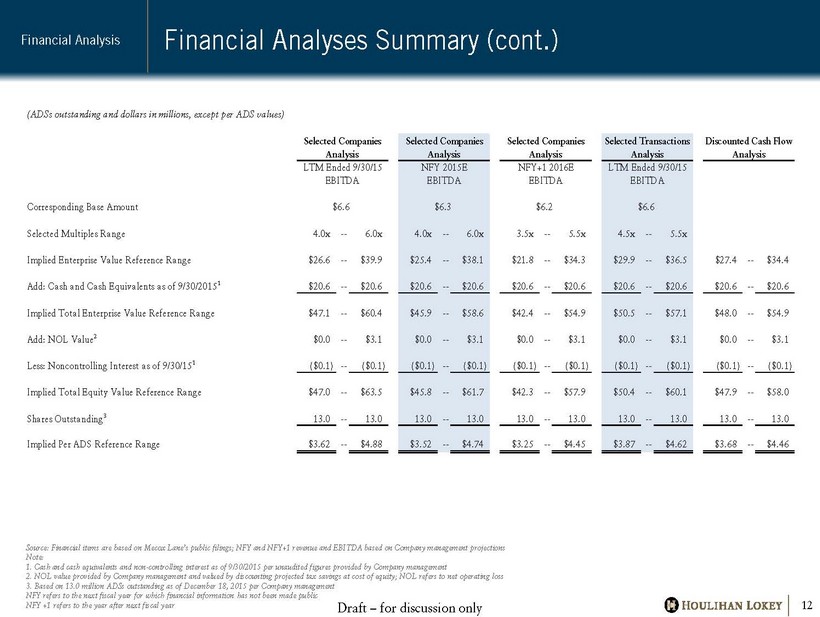
Draft – for discussion only (ADSs outstanding and dollars in millions, except per ADS values) Selected Companies Selected Companies Selected Companies Selected Transactions Discounted Cash Flow Analysis Analysis Analysis Analysis Analysis LTM Ended 9/30/15 NFY 2015E NFY+1 2016E LTM Ended 9/30/15 EBITDA EBITDA EBITDA EBITDA Corresponding Base Amount $6.6 $6.3 $6.2 $6.6 Selected Multiples Range 4.0x -- 6.0x 4.0x -- 6.0x 3.5x -- 5.5x 4.5x -- 5.5x Implied Enterprise Value Reference Range $26.6 -- $39.9 $25.4 -- $38.1 $21.8 -- $34.3 $29.9 -- $36.5 $27.4 -- $34.4 Add: Cash and Cash Equivalents as of 9/30/2015 1 $20.6 -- $20.6 $20.6 -- $20.6 $20.6 -- $20.6 $20.6 -- $20.6 $20.6 -- $20.6 Implied Total Enterprise Value Reference Range $47.1 -- $60.4 $45.9 -- $58.6 $42.4 -- $54.9 $50.5 -- $57.1 $48.0 -- $54.9 Add: NOL Value 2 $0.0 -- $3.1 $0.0 -- $3.1 $0.0 -- $3.1 $0.0 -- $3.1 $0.0 -- $3.1 Less: Noncontrolling Interest as of 9/30/15 1 ($0.1) -- ($0.1) ($0.1) -- ($0.1) ($0.1) -- ($0.1) ($0.1) -- ($0.1) ($0.1) -- ($0.1) Implied Total Equity Value Reference Range $47.0 -- $63.5 $45.8 -- $61.7 $42.3 -- $57.9 $50.4 -- $60.1 $47.9 -- $58.0 Shares Outstanding 3 13.0 -- 13.0 13.0 -- 13.0 13.0 -- 13.0 13.0 -- 13.0 13.0 -- 13.0 Implied Per ADS Reference Range $3.62 -- $4.88 $3.52 -- $4.74 $3.25 -- $4.45 $3.87 -- $4.62 $3.68 -- $4.46 Financial Analyses Summary (cont.) Financial Analysis 12 Source : Financial items are based on Mecox Lane’s public filings ; NFY and NFY+ 1 revenue and EBITDA based on Company management projections Note : 1. Cash and cash equivalents and non - controlling interest as of 9 / 30 / 2015 per unaudited figures provided by Company management 2. NOL value provided by Company management and valued by discounting projected tax savings at cost of equity ; NOL refers to net operating loss 3. Based on 13 . 0 million ADSs outstanding as of December 18 , 2015 per Company management NFY refers to the next fiscal year for which financial information has not been made public NFY +1 refers to the year after next fiscal year
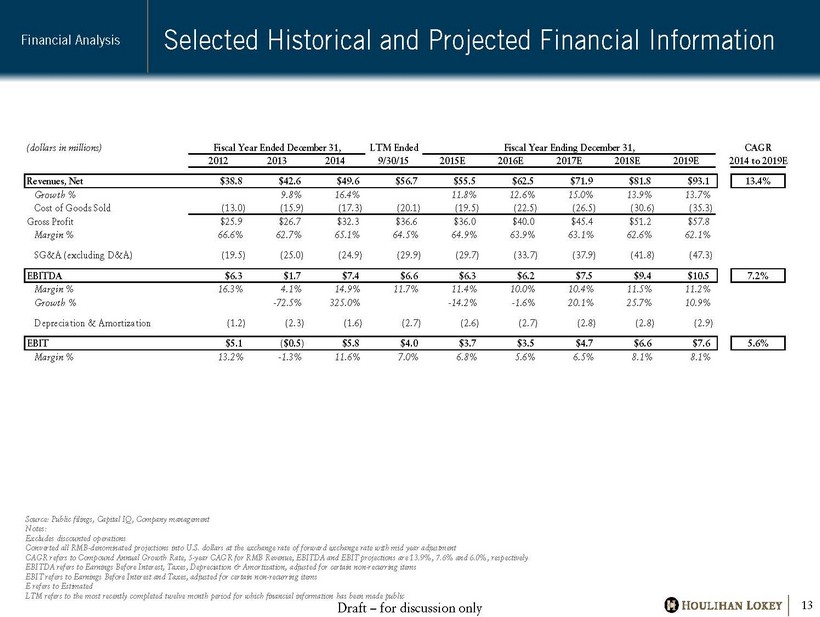
Draft – for discussion only (dollars in millions) Fiscal Year Ended December 31, LTM Ended Fiscal Year Ending December 31, CAGR 2012 2013 2014 9/30/15 2015E 2016E 2017E 2018E 2019E 2014 to 2019E Revenues, Net $38.8 $42.6 $49.6 $56.7 $55.5 $62.5 $71.9 $81.8 $93.1 13.4% Growth % #VALUE! 9.8% 16.4% 11.8% 12.6% 15.0% 13.9% 13.7% Cost of Goods Sold (13.0) (15.9) (17.3) (20.1) (19.5) (22.5) (26.5) (30.6) (35.3) Gross Profit $25.9 $26.7 $32.3 $36.6 $36.0 $40.0 $45.4 $51.2 $57.8 Margin % 66.6% 62.7% 65.1% 64.5% 64.9% 63.9% 63.1% 62.6% 62.1% SG&A (excluding D&A) (19.5) (25.0) (24.9) (29.9) (29.7) (33.7) (37.9) (41.8) (47.3) EBITDA $6.3 $1.7 $7.4 $6.6 $6.3 $6.2 $7.5 $9.4 $10.5 7.2% Margin % 16.3% 4.1% 14.9% 11.7% 11.4% 10.0% 10.4% 11.5% 11.2% Growth % #DIV/0! -72.5% 325.0% -14.2% -1.6% 20.1% 25.7% 10.9% Depreciation & Amortization (1.2) (2.3) (1.6) (2.7) (2.6) (2.7) (2.8) (2.8) (2.9) EBIT $5.1 ($0.5) $5.8 $4.0 $3.7 $3.5 $4.7 $6.6 $7.6 5.6% Margin % 13.2% -1.3% 11.6% 7.0% 6.8% 5.6% 6.5% 8.1% 8.1% Selected Historical and Projected Financial Information Financial Analysis 13 Source: Public filings, Capital IQ, Company management Notes: Excludes discounted operations Converted all RMB - denominated projections into U.S. dollars at the exchange rate of forward exchange rate with mid year adjustme nt CAGR refers to Compound Annual Growth Rate, 5 - year CAGR for RMB Revenue, EBITDA and EBIT projections are 13.9%, 7.6% and 6.0%, respectively EBITDA refers to Earnings Before Interest, Taxes, Depreciation & Amortization, adjusted for certain non - recurring items EBIT refers to Earnings Before Interest and Taxes, adjusted for certain non - recurring items E refers to Estimated LTM refers to the most recently completed twelve month period for which financial information has been made public
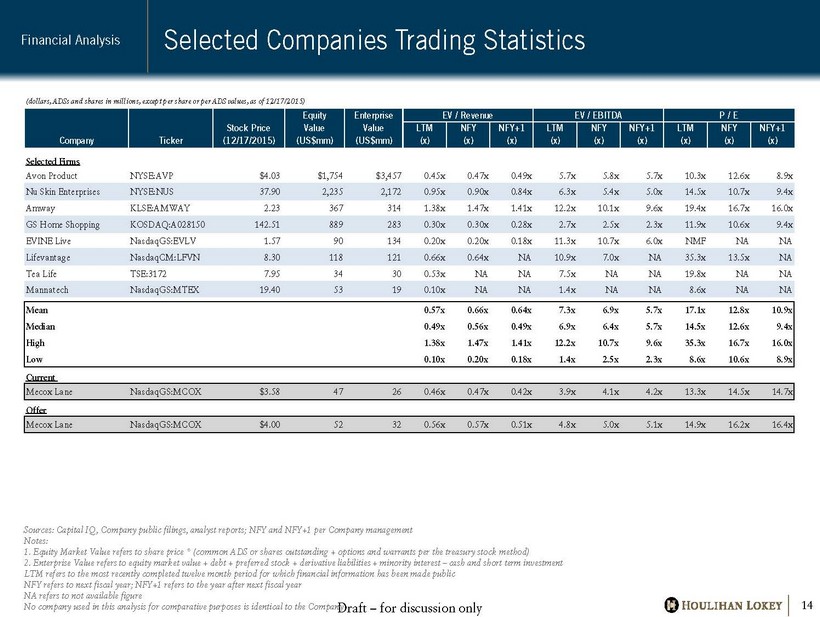
Draft – for discussion only (dollars, ADSs and shares in millions, except per share or per ADS values, as of 12/17/2015) Equity Enterprise EV / Revenue EV / EBITDA P / E Stock Price Value Value LTM NFY NFY+1 LTM NFY NFY+1 LTM NFY NFY+1 Company Ticker (12/17/2015) (US$mm) (US$mm) (x) (x) (x) (x) (x) (x) (x) (x) (x) Selected Firms Avon Product NYSE:AVP $4.03 $1,754 $3,457 0.45x 0.47x 0.49x 5.7x 5.8x 5.7x 10.3x 12.6x 8.9x Nu Skin Enterprises NYSE:NUS 37.90 2,235 2,172 0.95x 0.90x 0.84x 6.3x 5.4x 5.0x 14.5x 10.7x 9.4x Amway KLSE:AMWAY 2.23 367 314 1.38x 1.47x 1.41x 12.2x 10.1x 9.6x 19.4x 16.7x 16.0x GS Home Shopping KOSDAQ:A028150 142.51 889 283 0.30x 0.30x 0.28x 2.7x 2.5x 2.3x 11.9x 10.6x 9.4x EVINE Live NasdaqGS:EVLV 1.57 90 134 0.20x 0.20x 0.18x 11.3x 10.7x 6.0x NMF NA NA Lifevantage NasdaqCM:LFVN 8.30 118 121 0.66x 0.64x NA 10.9x 7.0x NA 35.3x 13.5x NA Tea Life TSE:3172 7.95 34 30 0.53x NA NA 7.5x NA NA 19.8x NA NA Mannatech NasdaqGS:MTEX 19.40 53 19 0.10x NA NA 1.4x NA NA 8.6x NA NA Mean 0.57x 0.66x 0.64x 7.3x 6.9x 5.7x 17.1x 12.8x 10.9x Median 0.49x 0.56x 0.49x 6.9x 6.4x 5.7x 14.5x 12.6x 9.4x High 1.38x 1.47x 1.41x 12.2x 10.7x 9.6x 35.3x 16.7x 16.0x Low 0.10x 0.20x 0.18x 1.4x 2.5x 2.3x 8.6x 10.6x 8.9x Current Mecox Lane NasdaqGS:MCOX $3.58 47 26 0.46x 0.47x 0.42x 3.9x 4.1x 4.2x 13.3x 14.5x 14.7x Offer Mecox Lane NasdaqGS:MCOX $4.00 52 32 0.56x 0.57x 0.51x 4.8x 5.0x 5.1x 14.9x 16.2x 16.4x Selected Companies Trading Statistics Financial Analysis 14 Sources: Capital IQ, Company public filings, analyst reports; NFY and NFY+1 per Company management Notes: 1 . Equity Market Value refers to share price * (common ADS or shares outstanding + options and warrants per the treasury stock m eth od) 2. Enterprise Value refers to equity market value + debt + preferred stock + derivative liabilities + minority interest – cash and short term investment LTM refers to the most recently completed twelve month period for which financial information has been made public NFY refers to next fiscal year; NFY+1 refers to the year after next fiscal year NA refers to not available figure No company used in this analysis for comparative purposes is identical to the Company
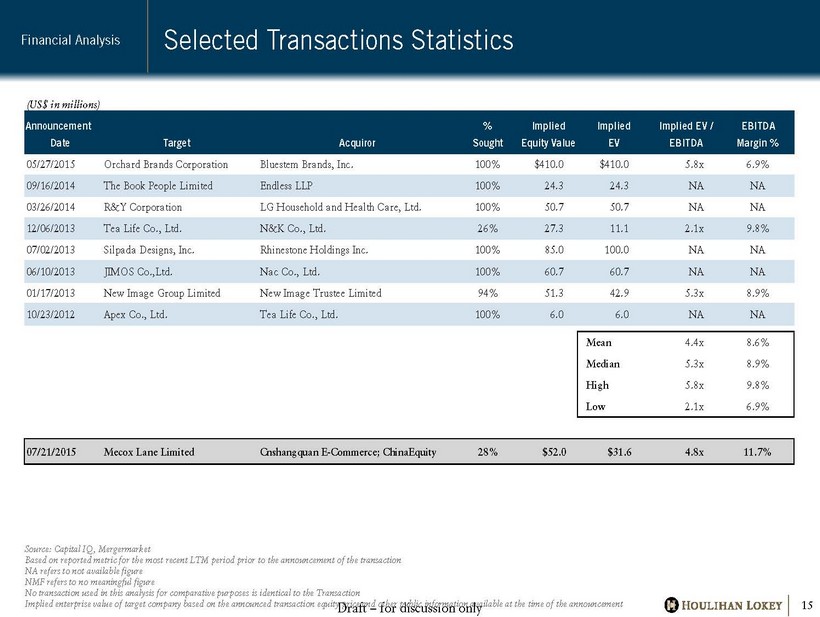
Draft – for discussion only (US$ in millions) Announcement % Implied Implied Implied EV / EBITDA Date Target Acquiror Sought Equity Value EV EBITDA Margin % 05/27/2015 Orchard Brands Corporation Bluestem Brands, Inc. 100% $410.0 $410.0 5.8x NA 6.9% 09/16/2014 The Book People Limited Endless LLP 100% 24.3 24.3 NA NANA NA NA 03/26/2014 R&Y Corporation LG Household and Health Care, Ltd. 100% 50.7 50.7 NA NA NA NA 12/06/2013 Tea Life Co., Ltd. N&K Co., Ltd. 26% 27.3 11.1 2.1x 9.8% 07/02/2013 Silpada Designs, Inc. Rhinestone Holdings Inc. 100% 85.0 100.0 NA NA NANA NA NA 06/10/2013 JIMOS Co.,Ltd. Nac Co., Ltd. 100% 60.7 60.7 NA NA NA NA 01/17/2013 New Image Group Limited New Image Trustee Limited 94% 51.3 42.9 5.3x NMF 8.9% 10/23/2012 Apex Co., Ltd. Tea Life Co., Ltd. 100% 6.0 6.0 NA NA NA NA Mean 4.4x 8.6% Median 5.3x 8.9% High 5.8x 9.8% Low 2.1x 6.9% 07/21/2015 Mecox Lane Limited Cnshangquan E-Commerce; ChinaEquity 28% $52.0 $31.6 4.8x 11.7% Selected Transactions Statistics Financial Analysis 15 Source: Capital IQ, Mergermarket Based on reported metric for the most recent LTM period prior to the announcement of the transaction NA refers to not available figure NMF refers to no meaningful figure No transaction used in this analysis for comparative purposes is identical to the Transaction Implied enterprise value of target company based on the announced transaction equity price and other public information avail abl e at the time of the announcement
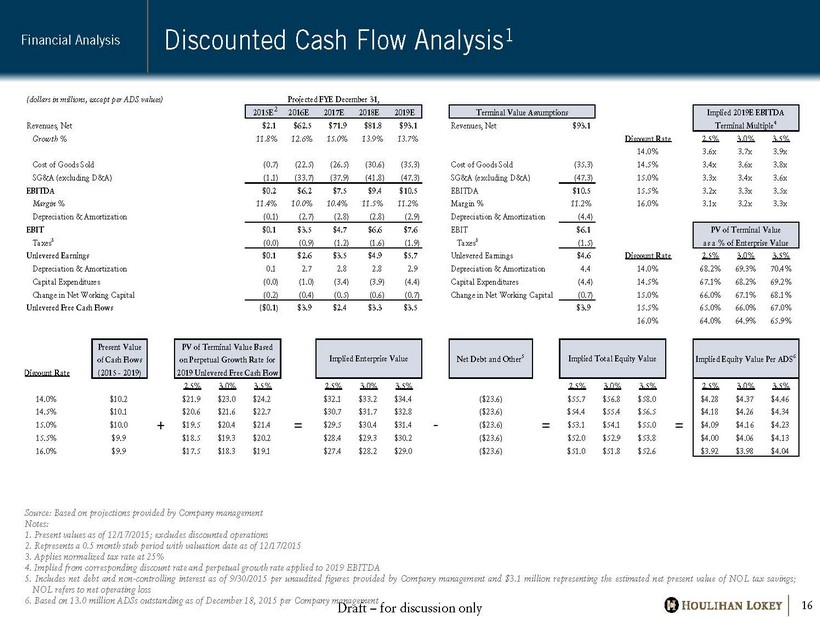
Draft – for discussion only (dollars in millions, except per ADS values) Projected FYE December 31, 2015E 2016E 2017E 2018E 2019E Terminal Value Assumptions Implied 2019E EBITDA Revenues, Net $2.1 $62.5 $71.9 $81.8 $93.1 Revenues, Net $93.1 Terminal Multiple 4 Growth % 11.8% 12.6% 15.0% 13.9% 13.7% Discount Rate 2.5% 3.0% 3.5% 14.0% 3.6x 3.7x 3.9x Cost of Goods Sold (0.7) (22.5) (26.5) (30.6) (35.3) Cost of Goods Sold (35.3) 14.5% 3.4x 3.6x 3.8x SG&A (excluding D&A) (1.1) (33.7) (37.9) (41.8) (47.3) SG&A (excluding D&A) (47.3) 15.0% 3.3x 3.4x 3.6x EBITDA $0.2 $6.2 $7.5 $9.4 $10.5 EBITDA $10.5 15.5% 3.2x 3.3x 3.5x Margin % 11.4% 10.0% 10.4% 11.5% 11.2% Margin % 11.2% 16.0% 3.1x 3.2x 3.3x Depreciation & Amortization (0.1) (2.7) (2.8) (2.8) (2.9) Depreciation & Amortization (4.4) EBIT $0.1 $3.5 $4.7 $6.6 $7.6 EBIT $6.1 PV of Terminal Value Taxes 3 (0.0) (0.9) (1.2) (1.6) (1.9) Taxes 3 (1.5) as a % of Enterprise Value Unlevered Earnings $0.1 $2.6 $3.5 $4.9 $5.7 Unlevered Earnings $4.6 Discount Rate 2.5% 3.0% 3.5% Depreciation & Amortization 0.1 2.7 2.8 2.8 2.9 Depreciation & Amortization 4.4 14.0% 68.2% 69.3% 70.4% Capital Expenditures (0.0) (1.0) (3.4) (3.9) (4.4) Capital Expenditures (4.4) 14.5% 67.1% 68.2% 69.2% Change in Net Working Capital (0.2) (0.4) (0.5) (0.6) (0.7) Change in Net Working Capital (0.7) 15.0% 66.0% 67.1% 68.1% Unlevered Free Cash Flows ($0.1) $3.9 $2.4 $3.3 $3.5 $3.9 15.5% 65.0% 66.0% 67.0% 16.0% 64.0% 64.9% 65.9% Present Value PV of Terminal Value Based of Cash Flows on Perpetual Growth Rate for Implied Enterprise Value Net Debt and Other 5 Implied Total Equity Value Implied Equity Value Per ADS 6 Discount Rate (2015 - 2019) 2019 Unlevered Free Cash Flow 2.5% 3.0% 3.5% 2.5% 3.0% 3.5% 2.5% 3.0% 3.5% 2.5% 3.0% 3.5% 14.0% $10.2 $21.9 $23.0 $24.2 $32.1 $33.2 $34.4 ($23.6) $55.7 $56.8 $58.0 $4.28 $4.37 $4.46 14.5% $10.1 $20.6 $21.6 $22.7 $30.7 $31.7 $32.8 ($23.6) $54.4 $55.4 $56.5 $4.18 $4.26 $4.34 15.0% $10.0 + $19.5 $20.4 $21.4 = $29.5 $30.4 $31.4 - ($23.6) = $53.1 $54.1 $55.0 = $4.09 $4.16 $4.23 15.5% $9.9 $18.5 $19.3 $20.2 $28.4 $29.3 $30.2 ($23.6) $52.0 $52.9 $53.8 $4.00 $4.06 $4.13 16.0% $9.9 $17.5 $18.3 $19.1 $27.4 $28.2 $29.0 ($23.6) $51.0 $51.8 $52.6 $3.92 $3.98 $4.04 Source : Based on projections provided by Company management Notes : 1 . Present values as of 12 / 17 / 2015 ; excludes discounted operations 2 . Represents a 0 . 5 month stub period with valuation date as of 12 / 17 / 2015 3 . Applies normalized tax rate at 25 % 4 . Implied from corresponding discount rate and perpetual growth rate applied to 2019 EBITDA 5 . Includes net debt and non - controlling interest as of 9 / 30 / 2015 per unaudited figures provided by Company management and $ 3 . 1 million representing the estimated net present value of NOL tax savings ; NOL refers to net operating loss 6 . Based on 13 . 0 million ADSs outstanding as of December 18 , 2015 per Company management Discounted Cash Flow Analysis 1 Financial Analysis 16 2

Draft – for discussion only (dollars in millions, except per ADS values) Projected FYE December 31, 2015E 2016E 2017E 2018E 2019E 2020E NOL Schedule Beginning Balance $16.5 $12.2 $9.8 $8.0 $5.9 $3.4 Less: Annual Usage (4.3) (2.4) (1.7) (2.1) (2.5) (3.4) Ending Balance $12.2 $9.8 $8.0 $5.9 $3.4 $0.0 Present Value Discounted at Ke NOL Usage $4.3 $2.4 $1.7 $2.1 $2.5 $3.4 Multiply: PRC Corporate Income Tax Rate 3 25.0% 25.0% 25.0% 25.0% 25.0% 25.0% NOL Value $1.1 $0.6 $0.4 $0.5 $0.6 $0.9 Discount Period 0.02 0.54 1.54 2.54 3.54 4.54 Discounted Value at 17.0% (Ke) $1.1 $0.6 $0.3 $0.4 $0.4 $0.4 Discounted Value at 16.0% (Ke) $1.1 $0.6 $0.3 $0.4 $0.4 $0.4 Discounted Value at 15.0% (Ke) $1.1 $0.6 $0.4 $0.4 $0.4 $0.5 Net Present Value at 17.0% (Ke) $3.103 Net Present Value at 16.0% (Ke) $3.146 Net Present Value at 15.0% (Ke) $3.191 Source : Based on projections and expected usage per Company management Notes : 1 . Present values as of 12 / 17 / 2015 2 . Represents a 0 . 5 month stub period with valuation date as of 12 / 17 / 2015 4 . Applies normalized tax rate at 25 % Ke refers to cost of equity NOL Tax Savings 1 Financial Analysis 17 2

Draft – for discussion only Appendix
Draft – for discussion only Appendix Additional Financial Data
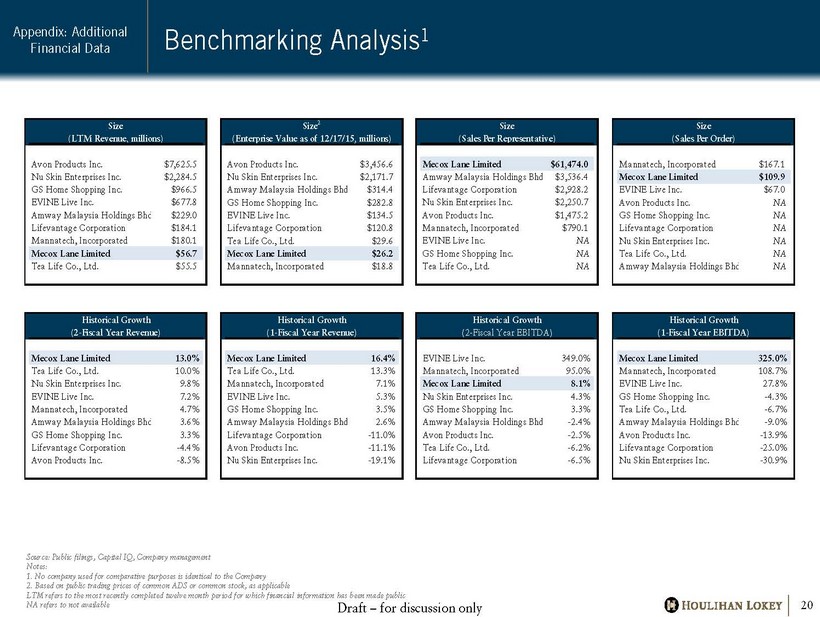
Draft – for discussion only Size 2 Historical Growth (Enterprise Value as of 12/17/15, millions) (2-Fiscal Year Revenue) Name Value Avon Products Inc. $3,456.6 Nu Skin Enterprises Inc. $2,171.7 Amway Malaysia Holdings Bhd $314.4 GS Home Shopping Inc. $282.8 EVINE Live Inc. $134.5 Lifevantage Corporation $120.8 Tea Life Co., Ltd. $29.6 Mecox Lane Limited $26.2 Mannatech, Incorporated $18.8 Size Size (Sales Per Representative) (Sales Per Order) Name Value Mecox Lane Limited $61,474.0 Amway Malaysia Holdings Bhd $3,536.4 Lifevantage Corporation $2,928.2 Nu Skin Enterprises Inc. $2,250.7 Avon Products Inc. $1,475.2 Mannatech, Incorporated $790.1 EVINE Live Inc. NA GS Home Shopping Inc. NA Tea Life Co., Ltd. NA Size Size 2 (LTM Revenue, millions) (Enterprise Value as of 11/20/15, millions) Name Value Avon Products Inc. $7,625.5 Nu Skin Enterprises Inc. $2,284.5 GS Home Shopping Inc. $966.5 EVINE Live Inc. $677.8 Amway Malaysia Holdings Bhd $229.0 Lifevantage Corporation $184.1 Mannatech, Incorporated $180.1 Mecox Lane Limited $56.7 Tea Life Co., Ltd. $55.5 Benchmarking Analysis 1 Appendix: Additional Financial Data 20 Size Industry Metric 3 (Sales Per Order) (Metric) Name Value Mannatech, Incorporated $167.1 Mecox Lane Limited $109.9 EVINE Live Inc. $67.0 Avon Products Inc. NA GS Home Shopping Inc. NA Lifevantage Corporation NA Nu Skin Enterprises Inc. NA Tea Life Co., Ltd. NA Amway Malaysia Holdings Bhd NA Historical Growth Historical Growth (2-Fiscal Year Revenue) (1-Fiscal Year Revenue) Name Value Mecox Lane Limited 13.0% Tea Life Co., Ltd. 10.0% Nu Skin Enterprises Inc. 9.8% EVINE Live Inc. 7.2% Mannatech, Incorporated 4.7% Amway Malaysia Holdings Bhd 3.6% GS Home Shopping Inc. 3.3% Lifevantage Corporation -4.4% Avon Products Inc. -8.5% Historical Growth Projected Growth (1-Fiscal Year Revenue) (1-Fiscal Year Revenue) Name Value Mecox Lane Limited 16.4% Tea Life Co., Ltd. 13.3% Mannatech, Incorporated 7.1% EVINE Live Inc. 5.3% GS Home Shopping Inc. 3.5% Amway Malaysia Holdings Bhd 2.6% Lifevantage Corporation -11.0% Avon Products Inc. -11.1% Nu Skin Enterprises Inc. -19.1% Historical Growth Historical Growth (2-Fiscal Year EBITDA) (1-Fiscal Year EBITDA) Name Value EVINE Live Inc. 349.0% Mannatech, Incorporated 95.0% Mecox Lane Limited 8.1% Nu Skin Enterprises Inc. 4.3% GS Home Shopping Inc. 3.3% Amway Malaysia Holdings Bhd -2.4% Avon Products Inc. -2.5% Tea Life Co., Ltd. -6.2% Lifevantage Corporation -6.5% Historical Growth Projected Growth (1-Fiscal Year EBITDA) (1-Fiscal Year EBITDA) Name Value Mecox Lane Limited 325.0% Mannatech, Incorporated 108.7% EVINE Live Inc. 27.8% GS Home Shopping Inc. -4.3% Tea Life Co., Ltd. -6.7% Amway Malaysia Holdings Bhd -9.0% Avon Products Inc. -13.9% Lifevantage Corporation -25.0% Nu Skin Enterprises Inc. -30.9% Source: Public filings, Capital IQ, Company management Notes: 1. No company used for comparative purposes is identical to the Company 2. Based on public trading prices of common ADS or common stock, as applicable LTM refers to the most recently completed twelve month period for which financial information has been made public NA refers to not available
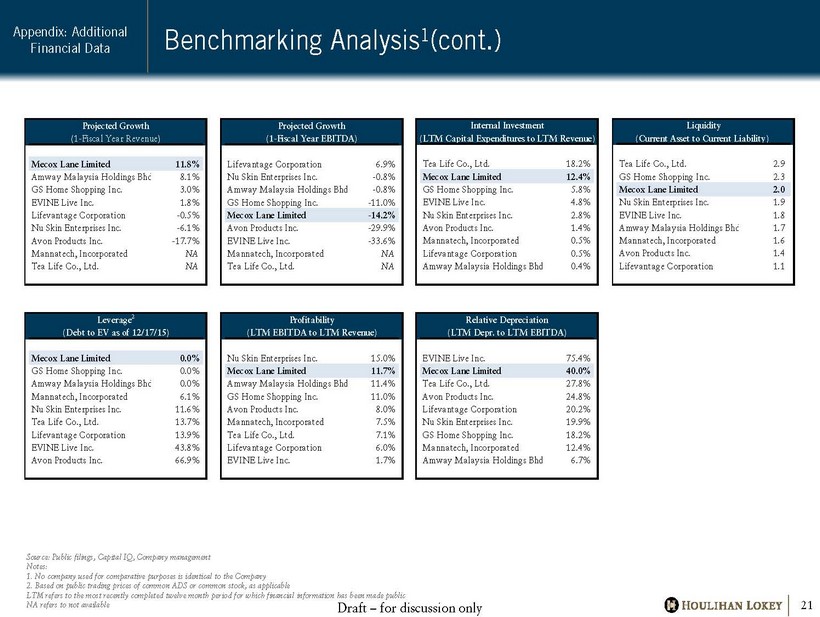
Draft – for discussion only Leverage 2 (Debt to EV as of 12/17/15) Name Value Mecox Lane Limited 0.0% GS Home Shopping Inc. 0.0% Amway Malaysia Holdings Bhd 0.0% Mannatech, Incorporated 6.1% Nu Skin Enterprises Inc. 11.6% Tea Life Co., Ltd. 13.7% Lifevantage Corporation 13.9% EVINE Live Inc. 43.8% Avon Products Inc. 66.9% Relative Depreciation Internal Investment (LTM Depr. to LTM EBITDA) (LTM Capital Expenditures to LTM Revenue) Name Value EVINE Live Inc. 75.4% Mecox Lane Limited 40.0% Tea Life Co., Ltd. 27.8% Avon Products Inc. 24.8% Lifevantage Corporation 20.2% Nu Skin Enterprises Inc. 19.9% GS Home Shopping Inc. 18.2% Mannatech, Incorporated 12.4% Amway Malaysia Holdings Bhd 6.7% Profitability Relative Depreciation (LTM EBITDA to LTM Revenue) (LTM Depr. to LTM EBITDA) Name Value Nu Skin Enterprises Inc. 15.0% Mecox Lane Limited 11.7% Amway Malaysia Holdings Bhd 11.4% GS Home Shopping Inc. 11.0% Avon Products Inc. 8.0% Mannatech, Incorporated 7.5% Tea Life Co., Ltd. 7.1% Lifevantage Corporation 6.0% EVINE Live Inc. 1.7% Liquidity Leverage 2 (Current Asset to Current Liability) (Debt to EV as of 11/20/15) Name Value Tea Life Co., Ltd. 2.9 GS Home Shopping Inc. 2.3 Mecox Lane Limited 2.0 Nu Skin Enterprises Inc. 1.9 EVINE Live Inc. 1.8 Amway Malaysia Holdings Bhd 1.7 Mannatech, Incorporated 1.6 Avon Products Inc. 1.4 Lifevantage Corporation 1.1 Internal Investment Liquidity (LTM Capital Expenditures to LTM Revenue) (Current Asset to Current Liability) Name Value Tea Life Co., Ltd. 18.2% Mecox Lane Limited 12.4% GS Home Shopping Inc. 5.8% EVINE Live Inc. 4.8% Nu Skin Enterprises Inc. 2.8% Avon Products Inc. 1.4% Mannatech, Incorporated 0.5% Lifevantage Corporation 0.5% Amway Malaysia Holdings Bhd 0.4% Projected Growth Projected Growth (1-Fiscal Year EBITDA) (5-Fiscal Year EPS) Name Value Lifevantage Corporation 6.9% Nu Skin Enterprises Inc. -0.8% Amway Malaysia Holdings Bhd -0.8% GS Home Shopping Inc. -11.0% Mecox Lane Limited -14.2% Avon Products Inc. -29.9% EVINE Live Inc. -33.6% Mannatech, Incorporated NA Tea Life Co., Ltd. NA Projected Growth (1-Fiscal Year Revenue) Name Value Mecox Lane Limited 11.8% Amway Malaysia Holdings Bhd 8.1% GS Home Shopping Inc. 3.0% EVINE Live Inc. 1.8% Lifevantage Corporation -0.5% Nu Skin Enterprises Inc. -6.1% Avon Products Inc. -17.7% Mannatech, Incorporated NA Tea Life Co., Ltd. NA Benchmarking Analysis 1 (cont.) 21 Source: Public filings, Capital IQ, Company management Notes: 1. No company used for comparative purposes is identical to the Company 2. Based on public trading prices of common ADS or common stock, as applicable LTM refers to the most recently completed twelve month period for which financial information has been made public NA refers to not available Appendix: Additional Financial Data

Draft – for discussion only 7/21/2015 - Mecox Lane Limited $4.00 17.6% 12.2% 11.6% 9.7% 10.5% 7.4% (14.7%) Price Premium 1-Day Prior 30-Day VWAP 2 60-Day VWAP 2 90 -Day VWAP 2 180-Day VWAP 2 52-Week VWAP 2 52-Week High 3 On-Going Deals 12/14/2015 - Trina Solar Limited $11.60 21.5% 17.7% 17.0% 20.6% 9.0% 11.4% (13.0%) 11/2/2015 - China Ming Yang Wind Power Group Ltd. 2.51 13.1% 19.3% 17.8% 11.2% (8.5%) (5.5%) (34.3%) 10/30/2015 - SORL Auto Parts, Inc. 2.84 21.9% 33.5% 38.9% 26.0% (6.7%) (9.7%) (36.7%) 10/16/2015 - Youku Tudou Inc. 27.60 35.1% 53.7% 51.6% 32.0% 31.9% 35.1% (12.4%) 9/15/2015 - Jinpan International Limited 4.50 24.3% 11.4% 3.7% (0.1%) (4.9%) (17.6%) (47.6%) 8/31/2015 - iKang Healthcare Group, Inc. 17.80 10.8% 9.6% 0.0% (3.0%) 0.1% (0.8%) (21.5%) 8/14/2015 - Country Style Cooking Restaurant Chain Co. Ltd. 5.23 18.9% 9.8% 2.5% 0.5% (0.4%) (4.4%) (29.8%) 8/3/2015 - eLong Inc. 18.00 24.1% 20.3% (8.5%) (7.7%) (5.6%) (5.4%) (33.9%) 8/3/2015 - Global-Tech Advanced Innovations 8.85 195.0% 162.2% 148.5% 147.3% 69.3% 68.8% 0.6% 7/21/2015 - Mecox Lane Limited 4.00 17.6% 12.2% 11.6% 9.7% 10.5% 7.4% (14.7%) 7/9/2015 - YY Inc. 68.50 17.4% (1.2%) 2.2% 8.3% 3.5% (2.7%) (28.9%) 7/9/2015 - E-Commerce China Dangdang Inc. 7.81 20.0% (15.9%) (16.6%) (15.6%) (19.8%) (29.8%) (52.4%) 7/6/2015 - China Nepstar Chain Drugstore Ltd. 2.60 18.2% (1.7%) (2.2%) 2.2% 14.0% 14.3% (21.2%) 6/29/2015 - Kongzhong Corp. 8.56 21.8% 11.5% 19.7% 27.0% 32.1% 27.3% (7.9%) 6/23/2015 - Momo Inc. 18.90 20.5% 147.0% 167.9% 183.4% 34.6% 11.2% (5.0%) 6/22/2015 - Vimicro International Corp. 13.50 9.5% 3.4% 9.8% 15.4% 38.8% 50.9% (18.1%) 6/22/2015 - China Information Technology, Inc. 4.43 31.1% 18.0% 12.7% 13.0% 13.3% 8.1% (39.7%) 6/19/2015 - AirMedia Group Inc. 6.00 70.5% 10.8% 30.2% 31.3% 46.2% 52.3% (22.1%) 6/17/2015 - Qihoo 360 Technology Co. Ltd. 77.00 16.6% 30.3% 31.6% 39.2% 29.4% 12.0% (26.5%) 6/15/2015 - iDreamSky Technology Limited 14.00 (3.8%) 24.5% 39.9% 41.5% 11.7% (6.8%) (46.1%) 6/12/2015 - Bona Film Group Limited 13.70 6.5% 20.4% 28.7% 34.6% 45.5% 55.2% 3.2% 6/11/2015 - Homeinns Hotel Group 35.80 18.7% 29.0% 36.4% 36.8% 31.3% 23.9% (2.8%) 6/10/2015 - Renren Inc. 4.20 2.2% 13.6% 24.6% 29.6% 35.5% 32.5% (5.6%) 6/10/2015 - 21Vianet Group, Inc. 23.00 15.5% 48.2% 36.4% 35.1% 28.1% 16.1% (28.9%) 6/9/2015 - E-House China Holdings Limited 6.64 (1.0%) 4.5% 8.4% 6.0% (9.9%) (21.5%) (46.8%) 6/5/2015 - JA Solar Holdings Co., Ltd. 9.69 19.9% 2.6% 1.7% 4.3% 10.2% 5.9% (14.3%) 6/4/2015 - Mindray Medical International Limited 28.00 1.9% (3.1%) (2.3%) (2.4%) (2.6%) (4.2%) (17.2%) 6/1/2015 - Taomee Holdings Ltd. 3.77 26.1% 17.3% 20.9% 13.7% 6.0% (7.1%) (31.8%) 4/27/2015 - China Cord Blood Corporation 6.40 (11.4%) 7.6% 11.0% 13.1% 17.5% 21.8% (11.6%) 4/20/2015 - Xueda Education Group 5.50 95.0% 86.4% 94.0% 100.2% 89.7% 76.7% (2.8%) 3/3/2015 - Jiayuan.com International Ltd. 7.56 62.9% 58.7% 60.6% 52.3% 39.4% 26.9% (14.6%) 8/19/2013 - Exceed Company Ltd. 1.78 19.5% 24.4% 27.9% 30.4% 30.2% 24.0% (6.3%) Mean 26.9% 27.7% 29.0% 29.2% 19.4% 14.6% (21.6%) Median 19.2% 17.5% 18.8% 18.0% 13.6% 11.3% (19.7%) High 195.0% 162.2% 167.9% 183.4% 89.7% 76.7% 3.2% Low (11.4%) (15.9%) (16.6%) (15.6%) (19.8%) (29.8%) (52.4%) Announced Date Closing Date Offer Price 1 (US$) Company Name Implied Premiums Paid in Selected Going - Private Transactions Involving US - Listed Chinese Companies 22 Source: Capital IQ, Company Filings Note: 1. As of announcement date or any revised offers received after announcement date 2. VWAP refers to Volume Weighted Average Price 3. 52 - Week High prior to going private announcement Appendix: Additional Financial Data
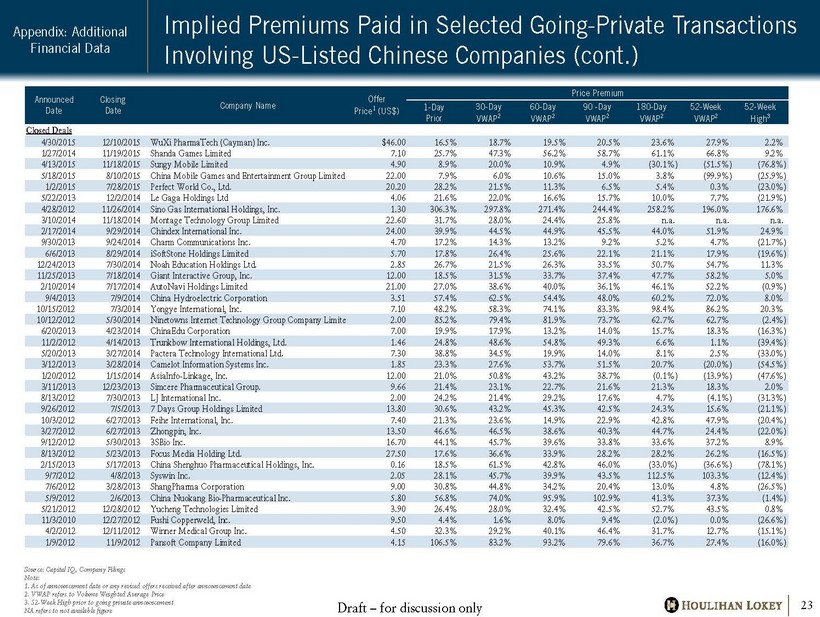
Draft – for discussion only Price Premium 1-Day Prior 30-Day VWAP 2 60-Day VWAP 2 90 -Day VWAP 2 180-Day VWAP 2 52-Week VWAP 2 52-Week High 3 Closed Deals 4/30/2015 12/10/2015 WuXi PharmaTech (Cayman) Inc. $46.00 16.5% 18.7% 19.5% 20.5% 23.6% 27.9% 2.2% 1/27/2014 11/19/2015 Shanda Games Limited 7.10 25.7% 47.3% 56.2% 58.7% 61.1% 66.8% 9.2% 4/13/2015 11/18/2015 Sungy Mobile Limited 4.90 8.9% 20.0% 10.9% 4.9% (30.1%) (51.5%) (76.8%) 5/18/2015 8/10/2015 China Mobile Games and Entertainment Group Limited 22.00 7.9% 6.0% 10.6% 15.0% 3.8% (99.9%) (25.9%) 1/2/2015 7/28/2015 Perfect World Co., Ltd. 20.20 28.2% 21.5% 11.3% 6.5% 5.4% 0.3% (23.0%) 5/22/2013 12/2/2014 Le Gaga Holdings Ltd 4.06 21.6% 22.0% 16.6% 15.7% 10.0% 7.7% (21.9%) 4/28/2012 11/26/2014 Sino Gas International Holdings, Inc. 1.30 306.3% 297.8% 271.4% 244.4% 258.2% 196.0% 176.6% 3/10/2014 11/18/2014 Montage Technology Group Limited 22.60 31.7% 28.0% 24.4% 25.8% n.a. n.a. n.a. 2/17/2014 9/29/2014 Chindex International Inc. 24.00 39.9% 44.5% 44.9% 45.5% 44.0% 51.9% 24.9% 9/30/2013 9/24/2014 Charm Communications Inc. 4.70 17.2% 14.3% 13.2% 9.2% 5.2% 4.7% (21.7%) 6/6/2013 8/29/2014 iSoftStone Holdings Limited 5.70 17.8% 26.4% 25.6% 22.1% 21.1% 17.9% (19.6%) 12/24/2013 7/30/2014 Noah Education Holdings Ltd. 2.85 26.7% 21.5% 26.3% 33.5% 50.7% 54.7% 11.3% 11/25/2013 7/18/2014 Giant Interactive Group, Inc. 12.00 18.5% 31.5% 33.7% 37.4% 47.7% 58.2% 5.0% 2/10/2014 7/17/2014 AutoNavi Holdings Limited 21.00 27.0% 38.6% 40.0% 36.1% 46.1% 52.2% (0.9%) 9/4/2013 7/9/2014 China Hydroelectric Corporation 3.51 57.4% 62.5% 54.4% 48.0% 60.2% 72.0% 8.0% 10/15/2012 7/3/2014 Yongye International, Inc. 7.10 48.2% 58.3% 74.1% 83.3% 98.4% 86.2% 20.3% 10/12/2012 5/30/2014 Ninetowns Internet Technology Group Company Limited 2.00 85.2% 79.4% 81.9% 73.7% 62.7% 62.7% (2.4%) 6/20/2013 4/23/2014 ChinaEdu Corporation 7.00 19.9% 17.9% 13.2% 14.0% 15.7% 18.3% (16.3%) 11/2/2012 4/14/2013 Trunkbow International Holdings, Ltd. 1.46 24.8% 48.6% 54.8% 49.3% 6.6% 1.1% (39.4%) 5/20/2013 3/27/2014 Pactera Technology International Ltd. 7.30 38.8% 34.5% 19.9% 14.0% 8.1% 2.5% (33.0%) 3/12/2013 3/28/2014 Camelot Information Systems Inc. 1.85 23.3% 27.6% 53.7% 51.5% 20.7% (20.0%) (54.5%) 1/20/2012 1/15/2014 AsiaInfo-Linkage, Inc. 12.00 21.0% 50.8% 43.2% 38.7% (0.1%) (13.9%) (47.6%) 3/11/2013 12/23/2013 Simcere Pharmaceutical Group. 9.66 21.4% 23.1% 22.7% 21.6% 21.3% 18.3% 2.0% 8/13/2012 7/30/2013 LJ International Inc. 2.00 24.2% 21.4% 29.2% 17.6% 4.7% (4.1%) (31.3%) 9/26/2012 7/5/2013 7 Days Group Holdings Limited 13.80 30.6% 43.2% 45.3% 42.5% 24.3% 15.6% (21.1%) 10/3/2012 6/27/2013 Feihe International, Inc. 7.40 21.3% 23.6% 14.9% 22.9% 42.8% 47.9% (20.4%) 3/27/2012 6/27/2013 Zhongpin, Inc. 13.50 46.6% 46.5% 38.6% 40.3% 44.7% 24.4% (22.0%) 9/12/2012 5/30/2013 3SBio Inc. 16.70 44.1% 45.7% 39.6% 33.8% 33.6% 37.2% 8.9% 8/13/2012 5/23/2013 Focus Media Holding Ltd. 27.50 17.6% 36.6% 33.9% 28.2% 28.2% 26.2% (16.5%) 2/15/2013 5/17/2013 China Shenghuo Pharmaceutical Holdings, Inc. 0.16 18.5% 61.5% 42.8% 46.0% (33.0%) (36.6%) (78.1%) 9/7/2012 4/8/2013 Syswin Inc. 2.05 28.1% 45.7% 39.9% 43.5% 112.5% 103.3% (12.4%) 7/6/2012 3/28/2013 ShangPharma Corporation 9.00 30.8% 44.8% 34.2% 20.4% 13.0% 4.8% (26.5%) 5/9/2012 2/6/2013 China Nuokang Bio-Pharmaceutical Inc. 5.80 56.8% 74.0% 95.9% 102.9% 41.3% 37.3% (1.4%) 5/21/2012 12/28/2012 Yucheng Technologies Limited 3.90 26.4% 28.0% 32.4% 42.5% 52.7% 43.5% 0.8% 11/3/2010 12/27/2012 Fushi Copperweld, Inc. 9.50 4.4% 1.6% 8.0% 9.4% (2.0%) 0.0% (26.6%) 4/2/2012 12/11/2012 Winner Medical Group Inc. 4.50 32.3% 29.2% 40.1% 46.4% 31.7% 12.7% (15.1%) 1/9/2012 11/9/2012 Pansoft Company Limited 4.15 106.5% 83.2% 93.2% 79.6% 36.7% 27.4% (16.0%) Announced Date Closing Date Company Name Offer Price 1 (US$) Implied Premiums Paid in Selected Going - Private Transactions Involving US - Listed Chinese Companies (cont.) 23 Source: Capital IQ, Company Filings Note: 1. As of announcement date or any revised offers received after announcement date 2. VWAP refers to Volume Weighted Average Price 3. 52 - Week High prior to going private announcement NA refers to not available figure Appendix: Additional Financial Data
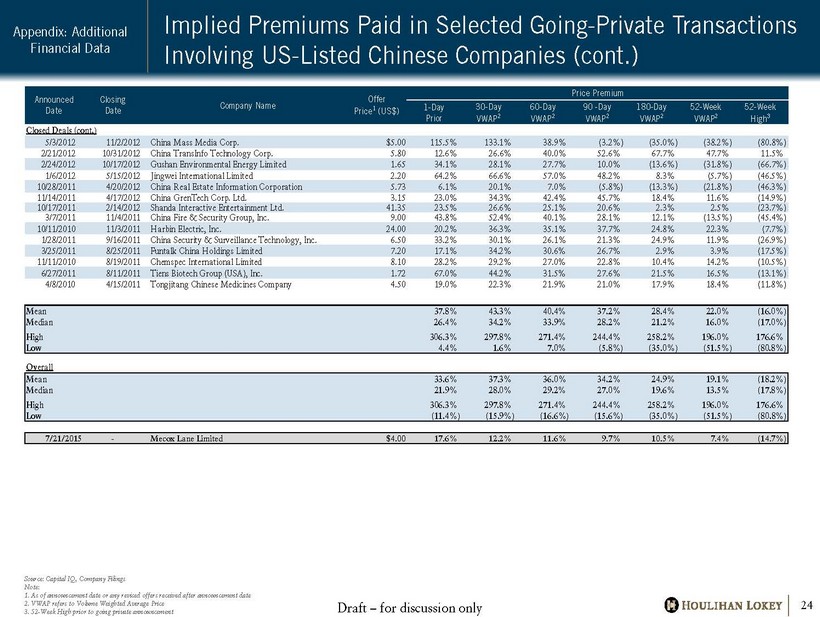
Draft – for discussion only Price Premium 1-Day Prior 30-Day VWAP 2 60-Day VWAP 2 90 -Day VWAP 2 180-Day VWAP 2 52-Week VWAP 2 52-Week High 3 Closed Deals (cont.) 5/3/2012 11/2/2012 China Mass Media Corp. $5.00 115.5% 133.1% 38.9% (3.2%) (35.0%) (38.2%) (80.8%) 2/21/2012 10/31/2012 China TransInfo Technology Corp. 5.80 12.6% 26.6% 40.0% 52.6% 67.7% 47.7% 11.5% 2/24/2012 10/17/2012 Gushan Environmental Energy Limited 1.65 34.1% 28.1% 27.7% 10.0% (13.6%) (31.8%) (66.7%) 1/6/2012 5/15/2012 Jingwei International Limited 2.20 64.2% 66.6% 57.0% 48.2% 8.3% (5.7%) (46.5%) 10/28/2011 4/20/2012 China Real Estate Information Corporation 5.73 6.1% 20.1% 7.0% (5.8%) (13.3%) (21.8%) (46.3%) 11/14/2011 4/17/2012 China GrenTech Corp. Ltd. 3.15 23.0% 34.3% 42.4% 45.7% 18.4% 11.6% (14.9%) 10/17/2011 2/14/2012 Shanda Interactive Entertainment Ltd. 41.35 23.5% 26.6% 25.1% 20.6% 2.3% 2.5% (23.7%) 3/7/2011 11/4/2011 China Fire & Security Group, Inc. 9.00 43.8% 52.4% 40.1% 28.1% 12.1% (13.5%) (45.4%) 10/11/2010 11/3/2011 Harbin Electric, Inc. 24.00 20.2% 36.3% 35.1% 37.7% 24.8% 22.3% (7.7%) 1/28/2011 9/16/2011 China Security & Surveillance Technology, Inc. 6.50 33.2% 30.1% 26.1% 21.3% 24.9% 11.9% (26.9%) 3/25/2011 8/25/2011 Funtalk China Holdings Limited 7.20 17.1% 34.2% 30.6% 26.7% 2.9% 3.9% (17.5%) 11/11/2010 8/19/2011 Chemspec International Limited 8.10 28.2% 29.2% 27.0% 22.8% 10.4% 14.2% (10.5%) 6/27/2011 8/11/2011 Tiens Biotech Group (USA), Inc. 1.72 67.0% 44.2% 31.5% 27.6% 21.5% 16.5% (13.1%) 4/8/2010 4/15/2011 Tongjitang Chinese Medicines Company 4.50 19.0% 22.3% 21.9% 21.0% 17.9% 18.4% (11.8%) Mean 37.8% 43.3% 40.4% 37.2% 28.4% 22.0% (16.0%) Median 26.4% 34.2% 33.9% 28.2% 21.2% 16.0% (17.0%) High 306.3% 297.8% 271.4% 244.4% 258.2% 196.0% 176.6% Low 4.4% 1.6% 7.0% (5.8%) (35.0%) (51.5%) (80.8%) Overall Mean 33.6% 37.3% 36.0% 34.2% 24.9% 19.1% (18.2%) Median 21.9% 28.0% 29.2% 27.0% 19.6% 13.5% (17.8%) High 306.3% 297.8% 271.4% 244.4% 258.2% 196.0% 176.6% Low (11.4%) (15.9%) (16.6%) (15.6%) (35.0%) (51.5%) (80.8%) Announced Date Closing Date Company Name Offer Price 1 (US$) Implied Premiums Paid in Selected Going - Private Transactions Involving US - Listed Chinese Companies (cont.) 24 Source: Capital IQ, Company Filings Note: 1. As of announcement date or any revised offers received after announcement date 2. VWAP refers to Volume Weighted Average Price 3. 52 - Week High prior to going private announcement Appendix: Additional Financial Data 7/21/2015 - Mecox Lane Limited $4.00 17.6% 12.2% 11.6% 9.7% 10.5% 7.4% (14.7%)

Draft – for discussion only Appendix Disclaimer
Draft – for discussion only Disclaimer Project Beauty 26 This presentation, and any supplemental information (written or oral) or other documents provided in connection therewith (collectively, the “materials”), are provided solely for the information of the Special Committee of the Board of Directors (the “Committee”) of Mecox Lane Limited (the “Company”) by Houlihan Lokey in connection with the Committee’s consideration of a potential transaction (the “Transaction”) involving the Company . This presentation is incomplete without reference to, and should be considered in conjunction with, any supplemental information provided by and discussions with Houlihan Lokey in connection therewith . Any defined terms used herein shall have the meanings set forth herein, even if such defined terms have been given different meanings elsewhere in the materials . The materials are for discussion purposes only and may not be relied upon by any person or entity for any purpose except as expressly permitted by Houlihan Lokey’s engagement letter . The materials were prepared for specific persons familiar with the business and affairs of the Company for use in a specific context and were not prepared with a view to public disclosure or to conform with any disclosure standards under any state, federal or international securities laws or other laws, rules or regulations, and none of the Committee, the Company or Houlihan Lokey takes any responsibility for the use of the materials by persons other than the Committee . The materials are provided on a confidential basis solely for the information of the Committee and may not be disclosed, summarized, reproduced, disseminated or quoted or otherwise referred to, in whole or in part, without Houlihan Lokey’s express prior written consent . Notwithstanding any other provision herein, the Company (and each employee, representative or other agent of the Company) may disclose to any and all persons without limitation of any kind, the tax treatment and tax structure of any transaction and all materials of any kind (including opinions or other tax analyses, if any) that are provided to the Company relating to such tax treatment and structure . However, any information relating to the tax treatment and tax structure shall remain confidential (and the foregoing sentence shall not apply) to the extent necessary to enable any person to comply with securities laws . For this purpose, the tax treatment of a transaction is the purported or claimed U . S . income or franchise tax treatment of the transaction and the tax structure of a transaction is any fact that may be relevant to understanding the purported or claimed U . S . income or franchise tax treatment of the transaction . If the Company plans to disclose information pursuant to the first sentence of this paragraph, the Company shall inform those to whom it discloses any such information that they may not rely upon such information for any purpose without Houlihan Lokey’s prior written consent . Houlihan Lokey is not an expert on, and nothing contained in the materials should be construed as advice with regard to, legal, accounting, regulatory, insurance, tax or other specialist matters . Houlihan Lokey’s role in reviewing any information is limited solely to performing such a review as it shall deem necessary to support its own advice and analysis and shall not be on behalf of the Committee . Any statement contained in the materials as to tax matters was neither written nor intended by Houlihan Lokey or any of its affiliates to be used, and cannot be used by any taxpayer, for the purpose of avoiding tax penalties that may be imposed on such taxpayer . If any person uses or refers to any such tax statement in promoting, marketing or recommending a partnership or other entity, investment Program or arrangement to any taxpayer, then such statement is being delivered to support the promotion or marketing of the transaction or matter addressed and such person should seek advice based on its particular circumstances from an independent tax advisor . The materials necessarily are based on financial, economic, market and other conditions as in effect on, and the information available to Houlihan Lokey as of, the date of the materials . Although subsequent developments may affect the contents of the materials, Houlihan Lokey has not undertaken, and is under no obligation, to update, revise or reaffirm the materials, except as expressly contemplated by Houlihan Lokey’s engagement letter . The materials are not intended to provide the sole basis for evaluation of the Transaction and do not purport to contain all information that may be required . The materials do not address the underlying business decision of the Company or any other party to proceed with or effect the Transaction . The materials do not constitute any opinion, nor do the materials constitute a recommendation to the Committee, any security holder of the Company or any other party as to how to vote or act with respect to any matter relating to the Transaction or otherwise or whether to buy or sell any assets or securities of any company . Houlihan Lokey’s only opinion is the opinion, if any, that is actually delivered to the Committee . The materials may not reflect information known to other professionals in other business areas of Houlihan Lokey and its affiliates . The analyses contained in the materials must be considered as a whole . Selecting portions of the analyses, analytic methods and factors without considering all analyses and factors could create a misleading or incomplete view . The materials reflect judgments and assumptions with regard to industry performance, general business, economic, regulatory, market and financial conditions and other matters, many of which are beyond the control of the participants in the Transaction . Any estimates of value contained in the materials are not necessarily indicative of actual value or predictive of future results or values, which may be significantly more or less favorable . Any analyses relating to the value of assets, businesses or securities do not purport to be appraisals or to reflect the prices at which any assets, businesses or securities may actually be sold . The materials do not constitute a valuation opinion or credit rating . In preparing the materials, Houlihan Lokey has not conducted any physical inspection or independent appraisal or evaluation of any of the assets, properties or liabilities (contingent or otherwise) of the Company or any other party and has no obligation to evaluate the solvency of the Company or any other party under any law . All budgets, projections, estimates, financial analyses, reports and other information with respect to operations (including estimates of potential cost savings and expenses) reflected in the materials have been prepared by management of the relevant party or are derived from such budgets, projections, estimates, financial analyses, reports and other information or from other sources, which involve numerous and significant subjective determinations made by management of the relevant party and/or which such management has reviewed and found reasonable . The budgets, projections and estimates contained in the materials may or may not be achieved and differences between projected results and those actually achieved may be material . Houlihan Lokey has relied upon, with the consent of the Committee, representations made by management of Company that such budgets, projections and estimates have been reasonably prepared in good faith on bases reflecting the best currently available estimates and judgments of such management (or, with respect to information obtained from public sources, represent reasonable estimates), and Houlihan Lokey expresses no opinion with respect to such budgets, projections or estimates or the assumptions on which they are based . The scope of the financial analysis contained herein is based on discussions with the Company (including, without limitation, regarding the methodologies to be utilized), and Houlihan Lokey does not make any representation, express or implied, as to the sufficiency or adequacy of such financial analysis or the scope thereof for any particular purpose . Houlihan Lokey has assumed and relied upon the accuracy and completeness of the financial and other information provided to, discussed with or reviewed by it without (and without assuming responsibility for) independent verification of such information, makes no representation or warranty (express or implied) in respect of the accuracy or completeness of such information and has further relied upon the assurances of the Company that it is not aware of any facts or circumstances that would make such information inaccurate or misleading . In addition, Houlihan Lokey has relied upon and assumed, without independent verification, that there has been no change in the business, assets, liabilities, financial condition, results of operations, cash flows or prospects of the Company since the respective dates of the most recent financial statements and other information, financial or otherwise, provided to Houlihan Lokey that would be material to its analyses . Furthermore, and without prejudice to liability for fraud, Houlihan Lokey , its affiliates, and their respective directors, officers, employees and agents, to the extent allowed under applicable law disclaim any liability, responsibility or obligation (whether in contract, tort or otherwise) in relation to the foregoing matters . The materials are not an offer to sell or a solicitation of an indication of interest to purchase any security, option, commodity, future, loan or currency . The materials do not constitute a commitment by Houlihan Lokey or any of its affiliates to underwrite, subscribe for or place any securities, to extend or arrange credit, or to provide any other services . In the ordinary course of business, certain of Houlihan Lokey’s affiliates and employees, as well as investment funds in which they may have financial interests or which they may co - invest, may acquire, hold or sell, long or short positions, or trade or otherwise effect transactions, in debt, equity, and other securities and financial instruments (including loans and other obligations) of, or investments in, one or more parties that may be involved in the Transaction and their respective affiliates or any currency or commodity that may be involved in the Transaction . Houlihan Lokey provides mergers and acquisitions, restructuring and other advisory services to clients . Houlihan Lokey’s personnel may make statements or provide advice that is contrary to information contained in the materials . Houlihan Lokey’s or its affiliates’ proprietary interests may conflict with the Company’s interests . Houlihan Lokey may have advised, may seek to advise and may in the future advise companies mentioned in the materials .