
CNFR ANNUAL SHAREHOLDER MEETING MAY 17, 2017
1 SAFE HARBOR STATEMENT This presentation contains “forward-looking” statements within the meaning of Section 27A of the Securities Act of 1933, as amended, and Section 21E of the Securities Exchange Act of 1934, as amended, that are based on our management’s beliefs and assumptions and on information currently available to management. These forward-looking statements include, without limitation, statements regarding our industry, business strategy, plans, goals and expectations concerning our market position, product expansion, future operations, margins, profitability, future efficiencies, and other financial and operating information. When used in this discussion, the words “may,” “believes,” “intends,” “seeks,” “anticipates,” “plans,” “estimates,” “expects,” “should,” “assumes,” “continues,” “potential,” “could,” “will,” “future” and the negative of these or similar terms and phrases are intended to identify forward-looking statements. Forward-looking statements involve known and unknown risks, uncertainties, inherent risks and other factors that may cause our actual results, performance or achievements to be materially different from any future results, performance or achievements expressed or implied by the forward-looking statements. Forward-looking statements represent our management’s beliefs and assumptions only as of the date of this presentation. Our actual future results may be materially different from what we expect due to factors largely outside our control, including the occurrence of severe weather conditions and other catastrophes, the cyclical nature of the insurance industry, future actions by regulators, our ability to obtain reinsurance coverage at reasonable rates and the effects of competition. These and other risks and uncertainties associated with our business are described under the heading “Risk Factors” in our Annual Report on Form 10-K, filed on March 15, 2017, which should be read in conjunction with this presentation. The company and subsidiaries operate in a dynamic business environment, and therefore the risks identified are not meant to be exhaustive. Risk factors change and new risks emerge frequently. Except as required by law, we assume no obligation to update these forward-looking statements publicly, or to update the reasons actual results could differ materially from those anticipated in the forward-looking statements, even if new information becomes available in the future.
CONIFER: AT A GLANCE 2 Exchange / Ticker Nasdaq: CNFR Share Price (at 5/1/2017): $7.95 Shares Outstanding*: 7.6M Market Capitalization: $60M GAAP Equity*: $68M Book Value per Share*: $8.88 Conifer Holdings, Inc. Conifer Insurance Company MI Domicile A.M. Best: B++ Demotech: A White Pine Insurance Company MI Domicile A.M. Best: B+ Demotech: A Sycamore Insurance Agency MI Domicile A.M. Best: NR Demotech: NR * as of 12/31/2016 COMPANY HISTORY 2008 North Pointe (founded by Conifer founder Jim Petcoff) sold to QBE for $146 million, or approximately 1.7X book value 2012 Non-compete agreements expire and Conifer is founded, bringing together successful executives with new, state-of-the- art processing systems August 2015 Conifer completes IPO on Nasdaq, further expands as a specialty niche writer of P&C products 2015 Company makes strategic decision to slow growth in homeowners product in Florida; Commences new specialty products in security guards and low-value dwelling with historically strong loss ratios 2016 Conifer continues to lessen exposure to Florida market; Ramps up new lines; reports favorable underwriting trends in new lines; grows GWP by 22.6% 2017 Lower expense ratio as GWP continues to grow; focus on enhancing underwriting profit in core specialty commercial lines
3 CNFR 2016: YEAR IN REVIEW Maintained Focus on Writing Core Lines of Business Shifted Business Mix to Improve Profitability Achieved Additional Expense Efficiencies across Organization Balance Sheet Remains Well-Positioned to Support Companies 2017: Drive Positive Bottom Line
4 BUSINESS MIX – GROSS WRITTEN PREMIUM 2015 & 2016 2015 2016
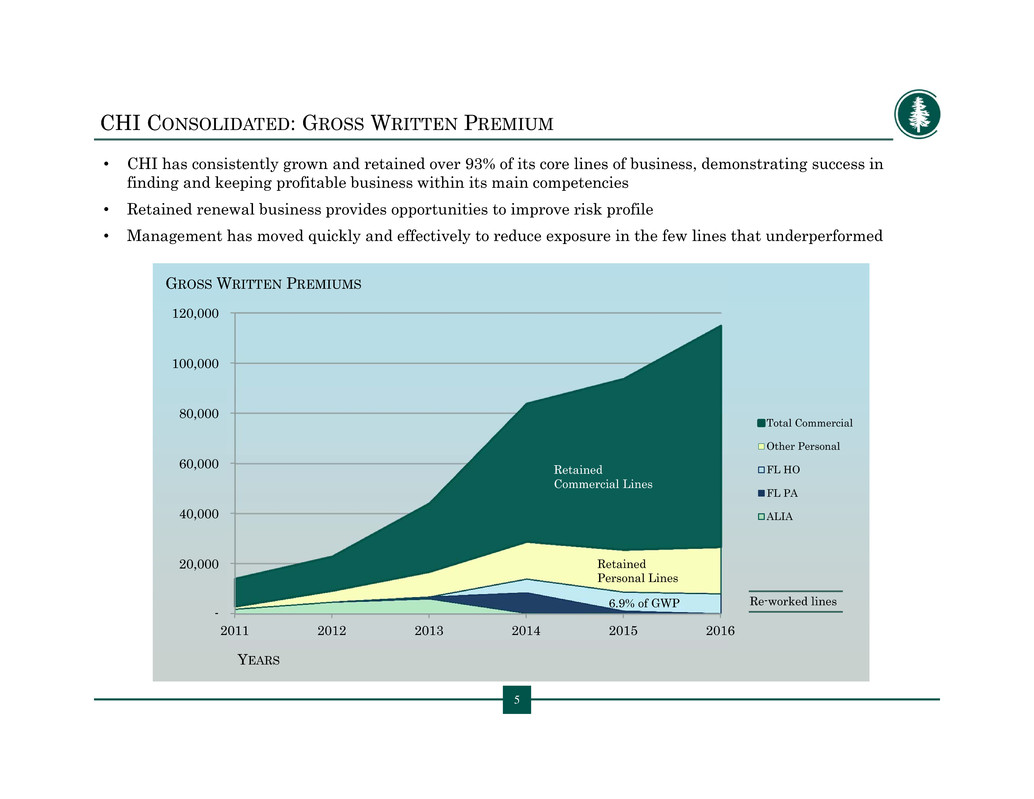
5 CHI CONSOLIDATED: GROSS WRITTEN PREMIUM • CHI has consistently grown and retained over 93% of its core lines of business, demonstrating success in finding and keeping profitable business within its main competencies • Retained renewal business provides opportunities to improve risk profile • Management has moved quickly and effectively to reduce exposure in the few lines that underperformed - 20,000 40,000 60,000 80,000 100,000 120,000 2011 2012 2013 2014 2015 2016 Total Commercial Other Personal FL HO FL PA ALIA GROSS WRITTEN PREMIUMS YEARS Retained Commercial Lines Re-worked lines6.9% of GWP Retained Personal Lines
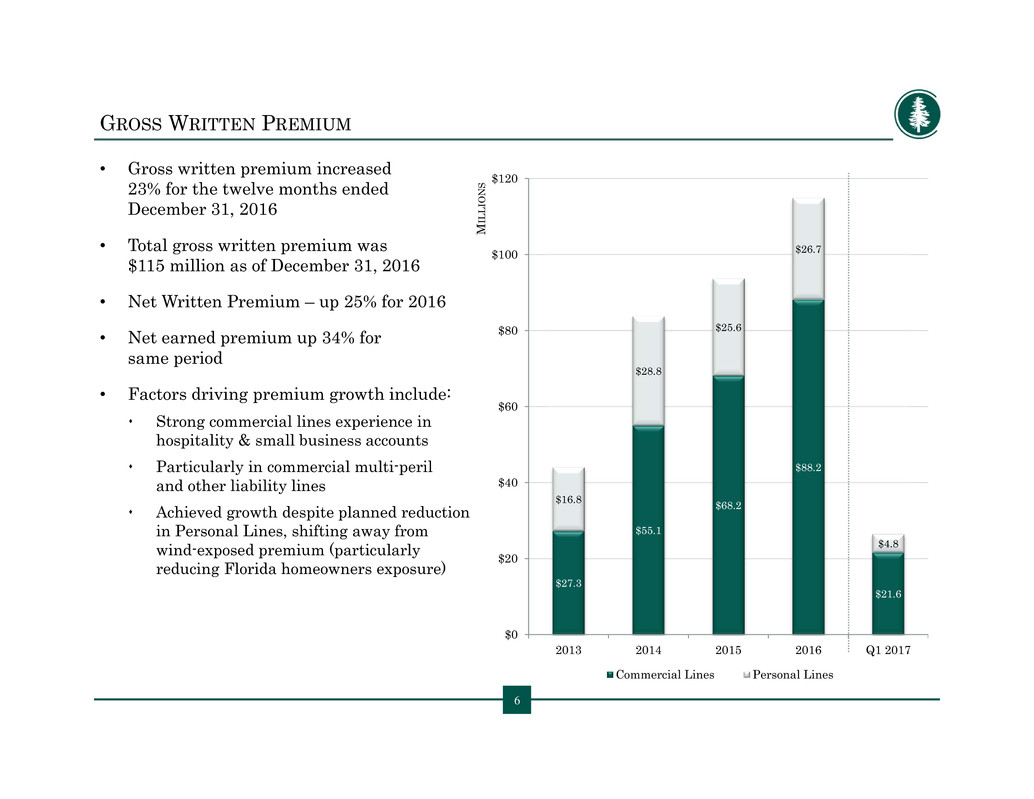
$27.3 $55.1 $68.2 $88.2 $21.6 $16.8 $28.8 $25.6 $26.7 $4.8 $0 $20 $40 $60 $80 $100 $120 2013 2014 2015 2016 Q1 2017 M I L L I O N S Commercial Lines Personal Lines GROSS WRITTEN PREMIUM • Gross written premium increased 23% for the twelve months ended December 31, 2016 • Total gross written premium was $115 million as of December 31, 2016 • Net Written Premium – up 25% for 2016 • Net earned premium up 34% for same period • Factors driving premium growth include: Strong commercial lines experience in hospitality & small business accounts Particularly in commercial multi-peril and other liability lines Achieved growth despite planned reduction in Personal Lines, shifting away from wind-exposed premium (particularly reducing Florida homeowners exposure) 6
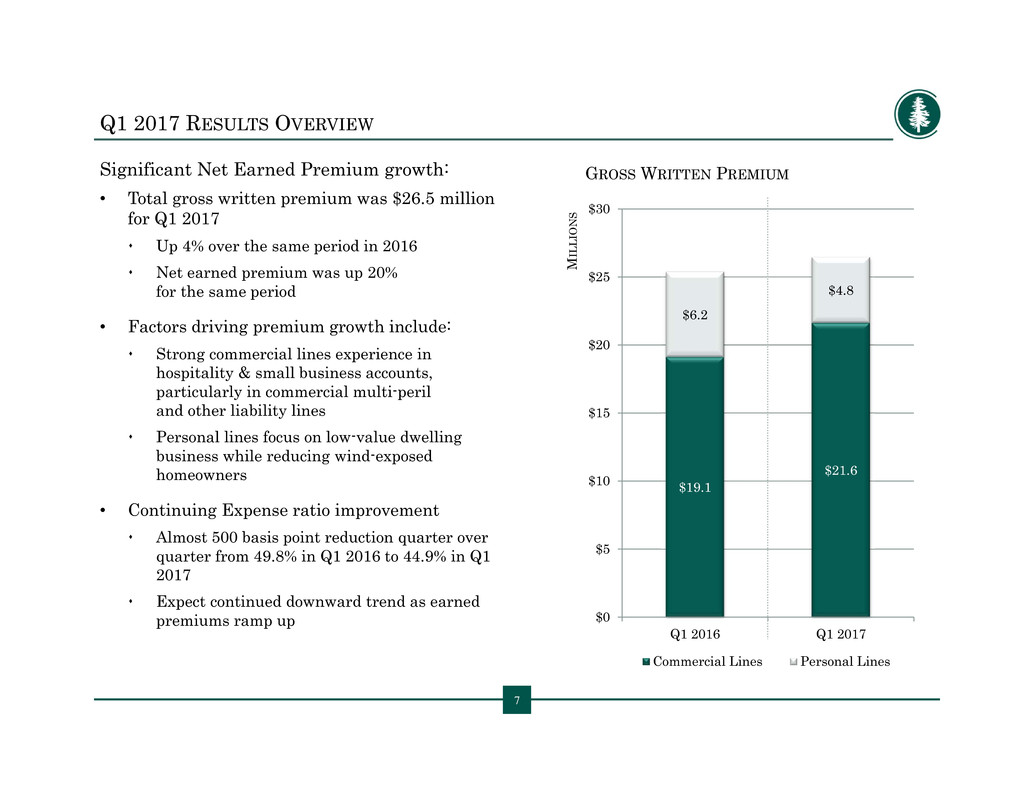
$19.1 $21.6 $6.2 $4.8 $0 $5 $10 $15 $20 $25 $30 Q1 2016 Q1 2017 M I L L I O N S Commercial Lines Personal Lines Q1 2017 RESULTS OVERVIEW Significant Net Earned Premium growth: • Total gross written premium was $26.5 million for Q1 2017 Up 4% over the same period in 2016 Net earned premium was up 20% for the same period • Factors driving premium growth include: Strong commercial lines experience in hospitality & small business accounts, particularly in commercial multi-peril and other liability lines Personal lines focus on low-value dwelling business while reducing wind-exposed homeowners • Continuing Expense ratio improvement Almost 500 basis point reduction quarter over quarter from 49.8% in Q1 2016 to 44.9% in Q1 2017 Expect continued downward trend as earned premiums ramp up 7 GROSS WRITTEN PREMIUM
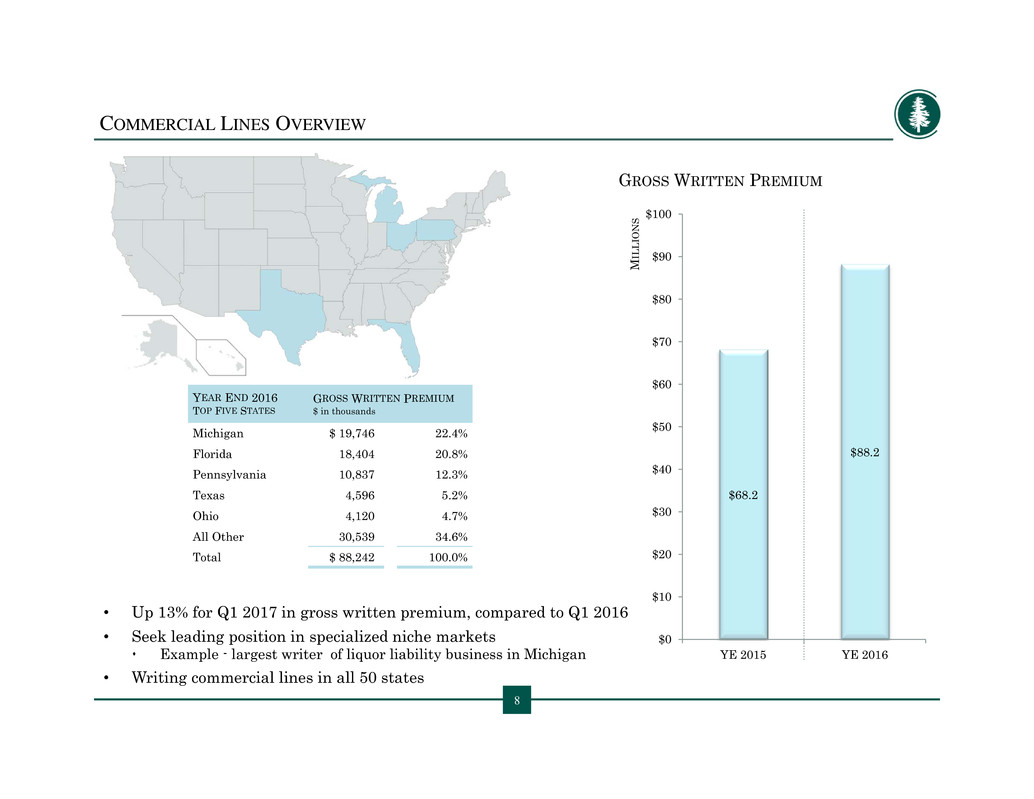
COMMERCIAL LINES OVERVIEW • Up 13% for Q1 2017 in gross written premium, compared to Q1 2016 • Seek leading position in specialized niche markets Example - largest writer of liquor liability business in Michigan • Writing commercial lines in all 50 states 8 GROSS WRITTEN PREMIUM YEAR END 2016 TOP FIVE STATES GROSS WRITTEN PREMIUM $ in thousands Michigan $ 19,746 22.4% Florida 18,404 20.8% Pennsylvania 10,837 12.3% Texas 4,596 5.2% Ohio 4,120 4.7% All Other 30,539 34.6% Total $ 88,242 100.0% $68.2 $88.2 $0 $10 $20 $30 $40 $50 $60 $70 $80 $90 $100 YE 2015 YE 2016 M I L L I O N S

$25.6 $26.7 $0 $5 $10 $15 $20 $25 $30 YE 2015 YE 2016 M I L L I O N S • While gross written premium for Personal Lines increased 4% year over year, it was down 23% in Q1 2017, compared to Q1 2016 • Decrease in wind-exposed homeowners - specifically Florida homeowners • Low-value dwelling ramp-up in Texas and northern Louisiana PERSONAL LINES: LOW-VALUE DWELLING & WIND-EXPOSED HOMEOWNERS GROSS WRITTEN PREMIUM $ in thousands YTD 2016 Top Five States Texas $ 10,425 39.1% Florida 7,944 29.8% Hawaii 3,885 14.6% Indiana 3,383 12.7% Illinois 712 2.7% All Other 330 1.1% Total $ 26,681 100.0% 9 GROSS WRITTEN PREMIUM
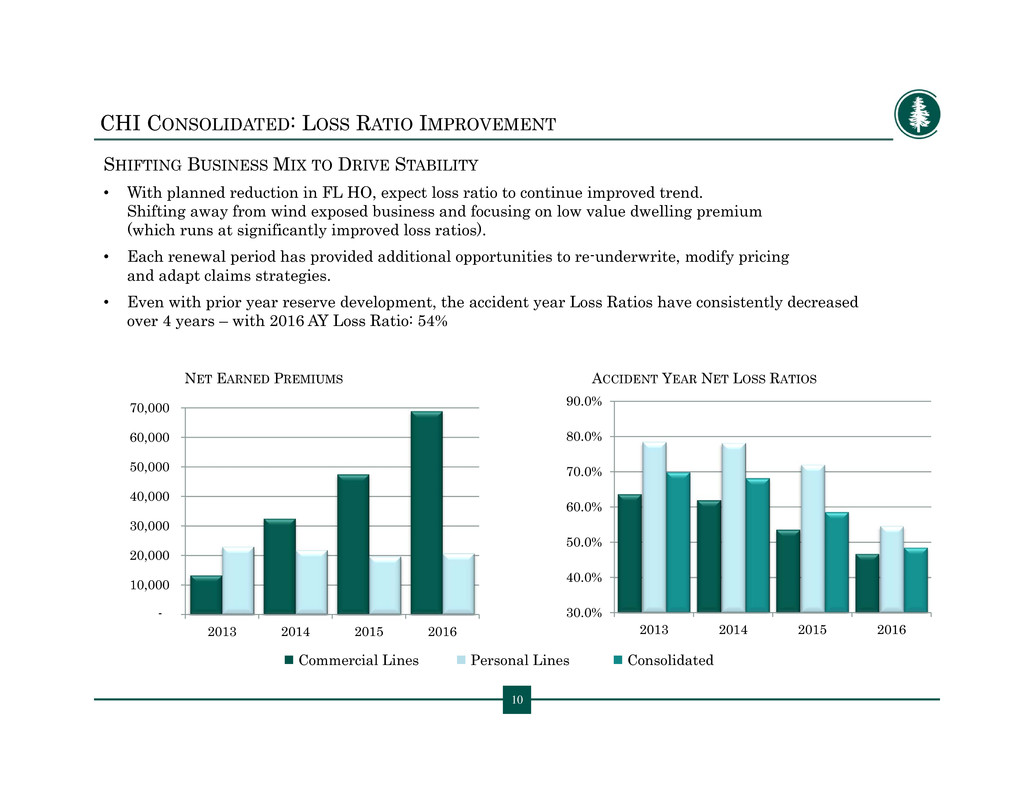
10 CHI CONSOLIDATED: LOSS RATIO IMPROVEMENT SHIFTING BUSINESS MIX TO DRIVE STABILITY • With planned reduction in FL HO, expect loss ratio to continue improved trend. Shifting away from wind exposed business and focusing on low value dwelling premium (which runs at significantly improved loss ratios). • Each renewal period has provided additional opportunities to re-underwrite, modify pricing and adapt claims strategies. • Even with prior year reserve development, the accident year Loss Ratios have consistently decreased over 4 years – with 2016 AY Loss Ratio: 54% NET EARNED PREMIUMS ACCIDENT YEAR NET LOSS RATIOS Commercial Lines Personal Lines Consolidated 30.0% 40.0% 50.0% 60.0% 70.0% 80.0% 90.0% 2013 2014 2015 2016 - 10,000 20,000 30,000 40,000 50,000 60,000 70,000 2013 2014 2015 2016
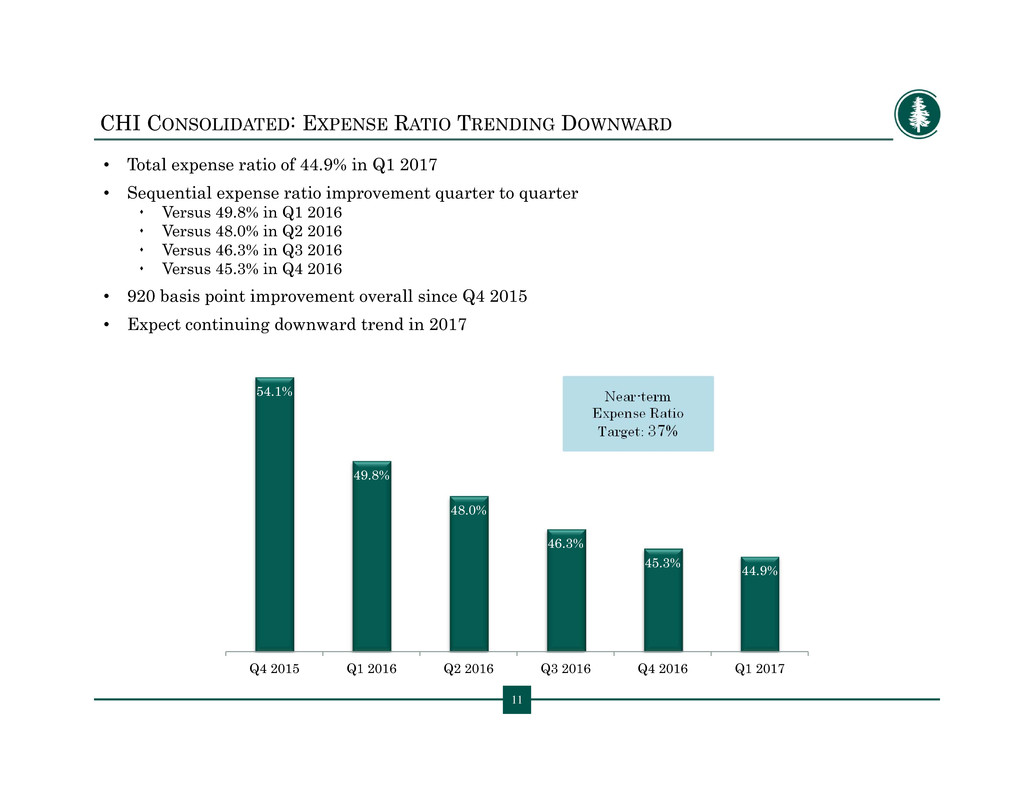
11 CHI CONSOLIDATED: EXPENSE RATIO TRENDING DOWNWARD • Total expense ratio of 44.9% in Q1 2017 • Sequential expense ratio improvement quarter to quarter Versus 49.8% in Q1 2016 Versus 48.0% in Q2 2016 Versus 46.3% in Q3 2016 Versus 45.3% in Q4 2016 • 920 basis point improvement overall since Q4 2015 • Expect continuing downward trend in 2017 Near-term Expense Ratio Target: 37% 54.1% 49.8% 48.0% 46.3% 45.3% 44.9% Q4 2015 Q1 2016 Q2 2016 Q3 2016 Q4 2016 Q1 2017
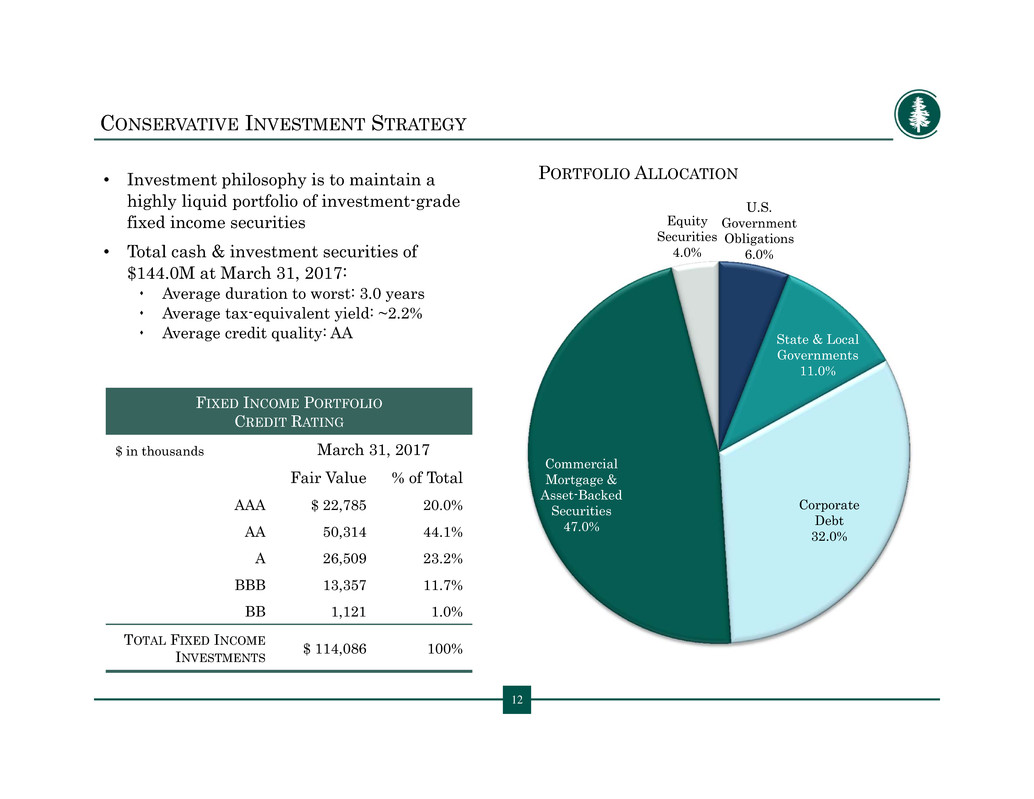
12 CONSERVATIVE INVESTMENT STRATEGY • Investment philosophy is to maintain a highly liquid portfolio of investment-grade fixed income securities • Total cash & investment securities of $144.0M at March 31, 2017: Average duration to worst: 3.0 years Average tax-equivalent yield: ~2.2% Average credit quality: AA FIXED INCOME PORTFOLIO CREDIT RATING $ in thousands March 31, 2017 Fair Value % of Total AAA $ 22,785 20.0% AA 50,314 44.1% A 26,509 23.2% BBB 13,357 11.7% BB 1,121 1.0% TOTAL FIXED INCOME INVESTMENTS $ 114,086 100% PORTFOLIO ALLOCATION U.S. Government Obligations 6.0% State & Local Governments 11.0% Corporate Debt 32.0% Commercial Mortgage & Asset-Backed Securities 47.0% Equity Securities 4.0%
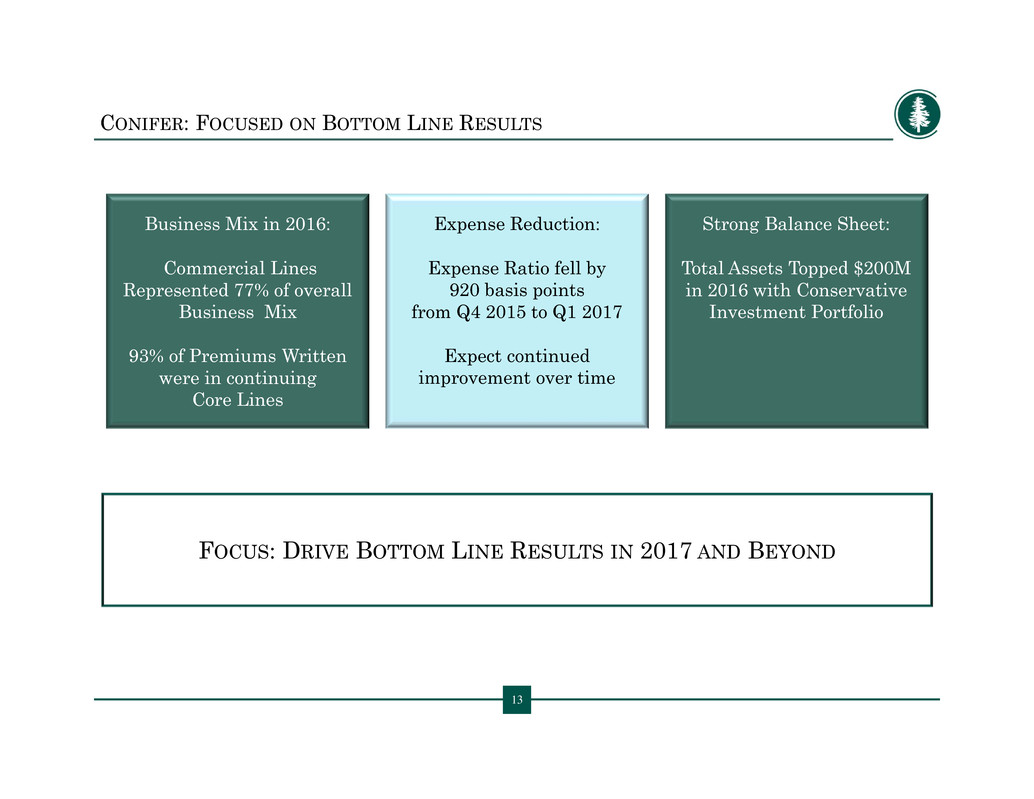
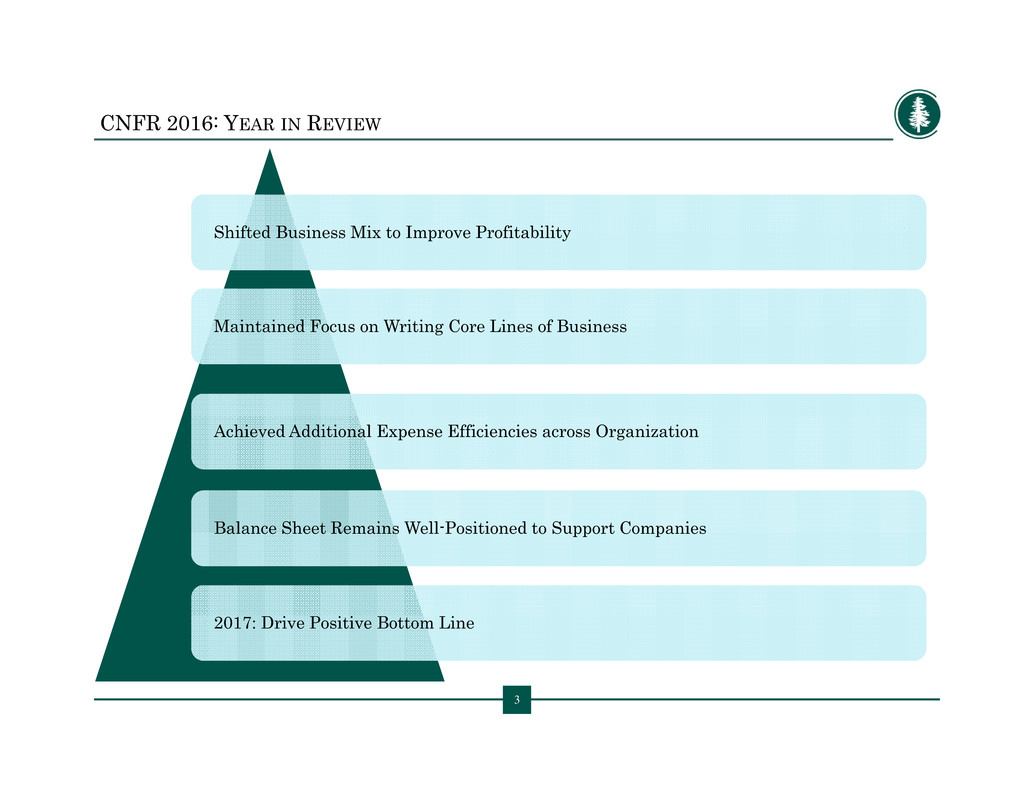
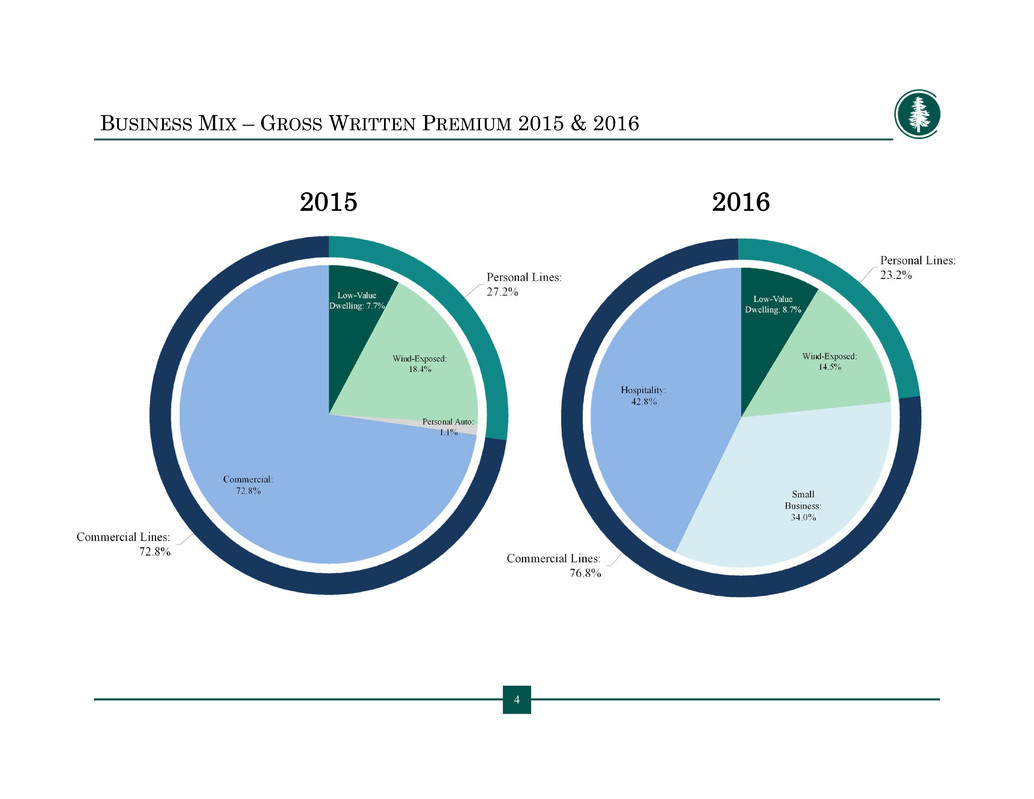
13 CONIFER: FOCUSED ON BOTTOM LINE RESULTS 13 Business Mix in 2016: Commercial Lines Represented 77% of overall Business Mix 93% of Premiums Written were in continuing Core Lines Expense Reduction: Expense Ratio fell by 920 basis points from Q4 2015 to Q1 2017 Expect continued improvement over time Strong Balance Sheet: Total Assets Topped $200M in 2016 with Conservative Investment Portfolio FOCUS: DRIVE BOTTOM LINE RESULTS IN 2017 AND BEYOND


