
FOURTH QUARTER 2018 INVESTOR CONFERENCE CALL February 28, 2019

SAFE HARBOR STATEMENT This presentation contains “forward-looking” statements within the meaning of Section 27A of the Securities Act of 1933, as amended, and Section 21E of the Securities Exchange Act of 1934, as amended, that are based on our management’s beliefs and assumptions and on information currently available to management. These forward-looking statements include, without limitation, statements regarding our industry, business strategy, plans, goals and expectations concerning our market position, product expansion, future operations, margins, profitability, future efficiencies, and other financial and operating information. When used in this discussion, the words “may,” “believes,” “intends,” “seeks,” “anticipates,” “plans,” “estimates,” “expects,” “should,” “assumes,” “continues,” “potential,” “could,” “will,” “future” and the negative of these or similar terms and phrases are intended to identify forward-looking statements. Forward-looking statements involve known and unknown risks, uncertainties, inherent risks and other factors that may cause our actual results, performance or achievements to be materially different from any future results, performance or achievements expressed or implied by the forward-looking statements. Forward-looking statements represent our management’s beliefs and assumptions only as of the date of this presentation. Our actual future results may be materially different from what we expect due to factors largely outside our control, including the occurrence of severe weather conditions and other catastrophes, the cyclical nature of the insurance industry, future actions by regulators, our ability to obtain reinsurance coverage at reasonable rates and the effects of competition. These and other risks and uncertainties associated with our business are described under the heading “Risk Factors” in our most recently filed Annual Report on Form 10-K/A and our Quarterly Report on Form 10-Q for the quarter ended September 30, 2018, which should be read in conjunction with this presentation. The company and subsidiaries operate in a dynamic business environment, and therefore the risks identified are not meant to be exhaustive. Risk factors change and new risks emerge frequently. Except as required by law, we assume no obligation to update these forward-looking statements publicly, or to update the reasons actual results could differ materially from those anticipated in the forward-looking statements, even if new information becomes available in the future. 1 1

2018: ANNUAL HIGHLIGHTS CONTINUED GROWTH IN SUCCESSFUL PUBLIC DEBT SHARE BUYBACK PROGRAM CORE COMMERCIAL OFFERING Implemented Share BUSINESS Recently completed offering Repurchase Plan in Commercial Lines of $25M in 6.75% December 2018 gross written premium Senior Unsecured Notes, increased 6% over 2017 lowering annual interest expenses FOCUS: STRIVE FOR CONTINUED GROWTH AND PROFITABILITY 2
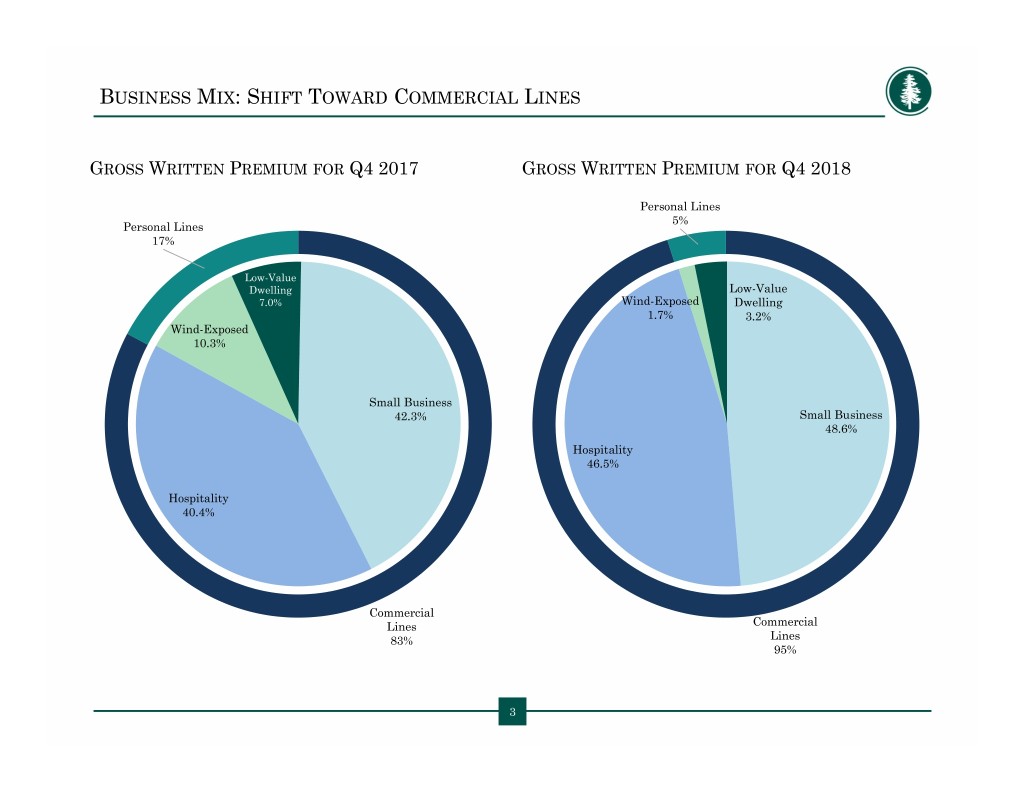
BUSINESS MIX: SHIFT TOWARD COMMERCIAL LINES GROSS WRITTEN PREMIUM FOR Q4 2017 GROSS WRITTEN PREMIUM FOR Q4 2018 Personal Lines 5% Personal Lines 17% Low-Value Dwelling Low-Value 7.0% Wind-Exposed Dwelling 1.7% 3.2% Wind-Exposed 10.3% Small Business 42.3% Small Business 48.6% Hospitality 46.5% Hospitality 40.4% Commercial Lines Commercial 83% Lines 95% 3

COMMERCIAL LINES OVERVIEW GROSS WRITTEN PREMIUM $30 0.9% Increase ILLIONS M $25 $20 $13.2 $13.3 YTD December 31, 2018 Gross Written Premium $15 Top Five States $ in thousands Florida $ 21,870 22.4% $10 Michigan 19,822 20.3% Pennsylvania 6,339 6.5% $12.8 California 5,691 5.8% $12.7 $5 Texas 5,344 5.5% All Other 38,628 39.5% Total $ 97,694 100.0% $0 Q4 2017 Q4 2018 Hospitality Small Business • Commercial Lines represented roughly 95% of the premium written in Q4 2018, compared to 83% in the same period 2017 • Quarter over quarter, Commercial Lines gross written premium increased slightly in Q4 2018 • Conifer continues to write Commercial Lines in all 50 states 4 4
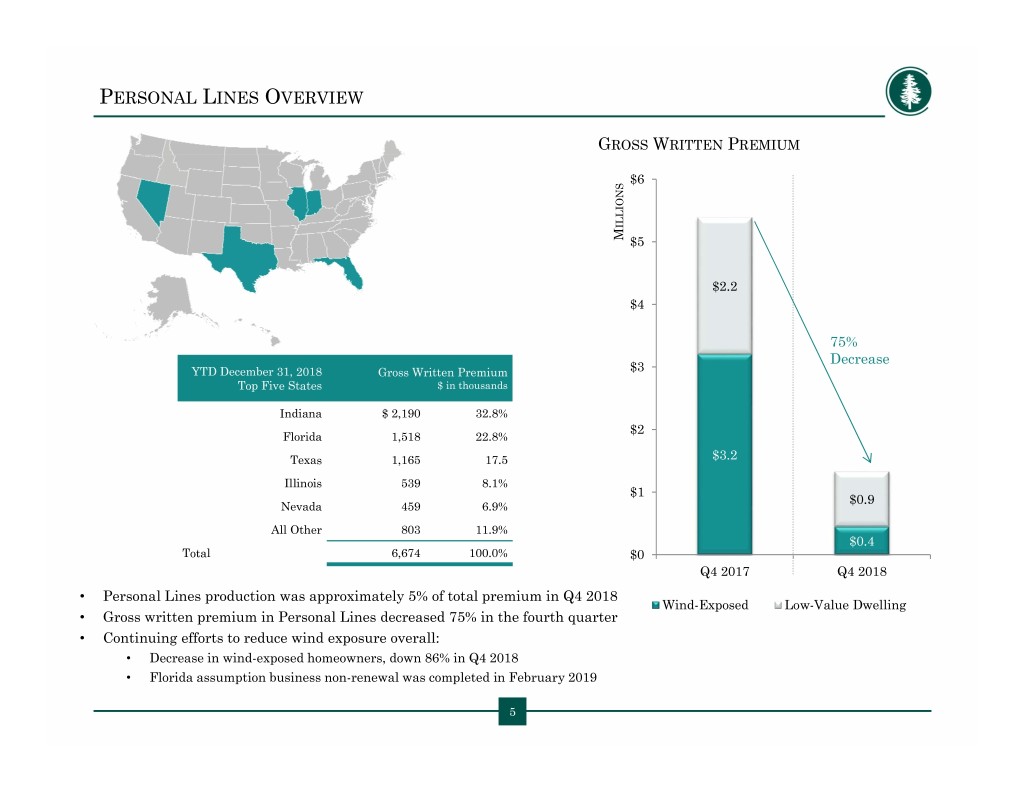
PERSONAL LINES OVERVIEW GROSS WRITTEN PREMIUM $6 ILLIONS M $5 $2.2 $4 75% Decrease YTD December 31, 2018 Gross Written Premium $3 Top Five States $ in thousands Indiana $ 2,190 32.8% $2 Florida 1,518 22.8% Texas 1,165 17.5 $3.2 Illinois 539 8.1% $1 $0.9 Nevada 459 6.9% All Other 803 11.9% $0.4 Total 6,674 100.0% $0 Q4 2017 Q4 2018 • Personal Lines production was approximately 5% of total premium in Q4 2018 Wind-Exposed Low-Value Dwelling • Gross written premium in Personal Lines decreased 75% in the fourth quarter • Continuing efforts to reduce wind exposure overall: • Decrease in wind-exposed homeowners, down 86% in Q4 2018 • Florida assumption business non-renewal was completed in February 2019 5 5

Q4 2018 RESULTS OVERVIEW: REFLECTS CONTINUED LOB REPOSITIONING Gross Written Premium: GROSS WRITTEN PREMIUM • GWP was $27.4M in Q4 2018 $35 Commercial Lines GWP increased 0.9% from Q4 2017 ILLIONS • Small Business segment performed well M $30 in the period $5.4 • Commercial Lines accident year combined ratio $1.3 was 102.0% before impact of hurricanes $25 Personal Lines GWP decreased 75% from Q4 2017 – aligned with the Company’s plan to focus on core lines of business $20 • Florida homeowners business was down 81% Net Earned Premium: $15 • NEP was $22.6M in Q4 2018, a decrease due to $25.9 $26.1 lower written premiums in personal lines $10 Commercial Lines NEP remained relatively flat at $21.1 million for Q4 2018, compared to $21.3 million in Q4 2017 $5 Personal Lines NEP decreased 62.3% in Q4 2018 $0 Q4 2017 Q4 2018 Commercial Lines Personal Lines 6 6
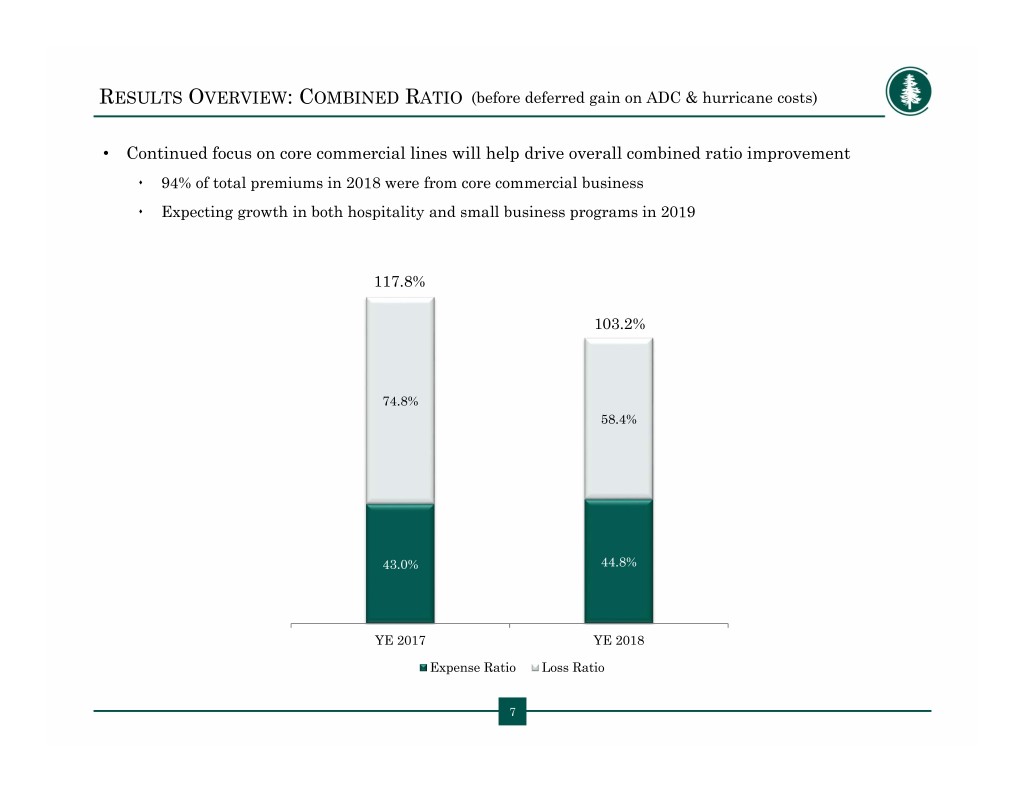
RESULTS OVERVIEW: COMBINED RATIO (before deferred gain on ADC & hurricane costs) • Continued focus on core commercial lines will help drive overall combined ratio improvement 94% of total premiums in 2018 were from core commercial business Expecting growth in both hospitality and small business programs in 2019 117.8% 103.2% 74.8% 58.4% 43.0% 44.8% YE 2017 YE 2018 Expense Ratio Loss Ratio 7
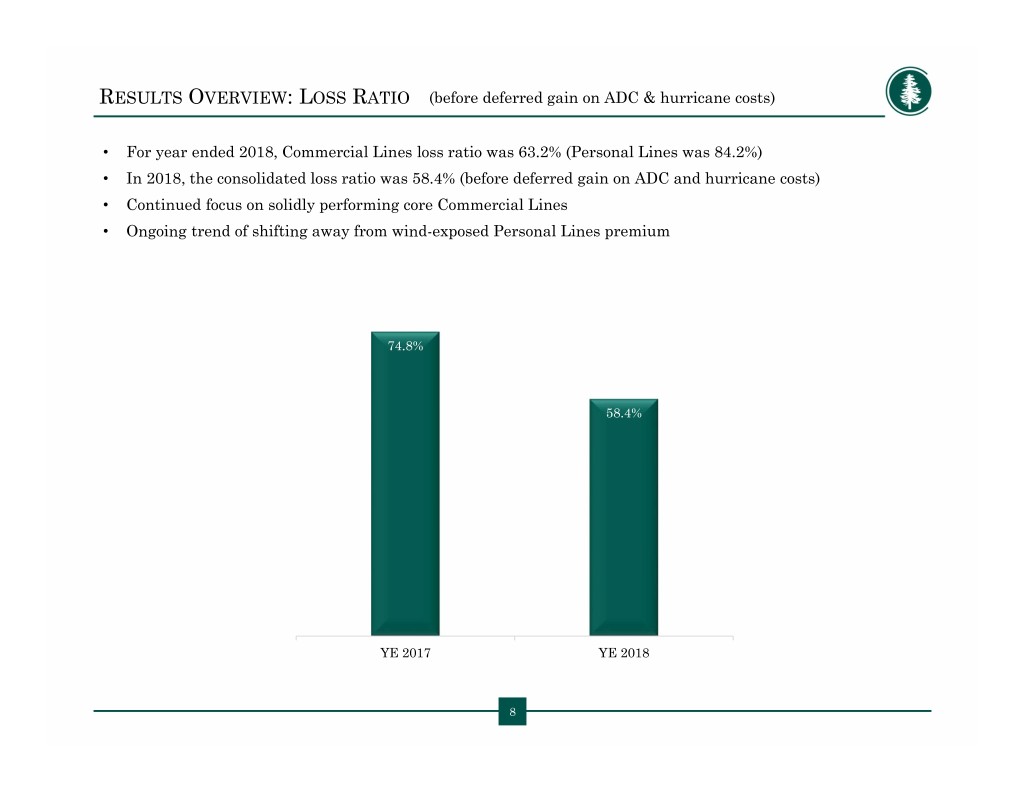
RESULTS OVERVIEW: LOSS RATIO (before deferred gain on ADC & hurricane costs) • For year ended 2018, Commercial Lines loss ratio was 63.2% (Personal Lines was 84.2%) • In 2018, the consolidated loss ratio was 58.4% (before deferred gain on ADC and hurricane costs) • Continued focus on solidly performing core Commercial Lines • Ongoing trend of shifting away from wind-exposed Personal Lines premium 74.8% 58.4% YE 2017 YE 2018 8
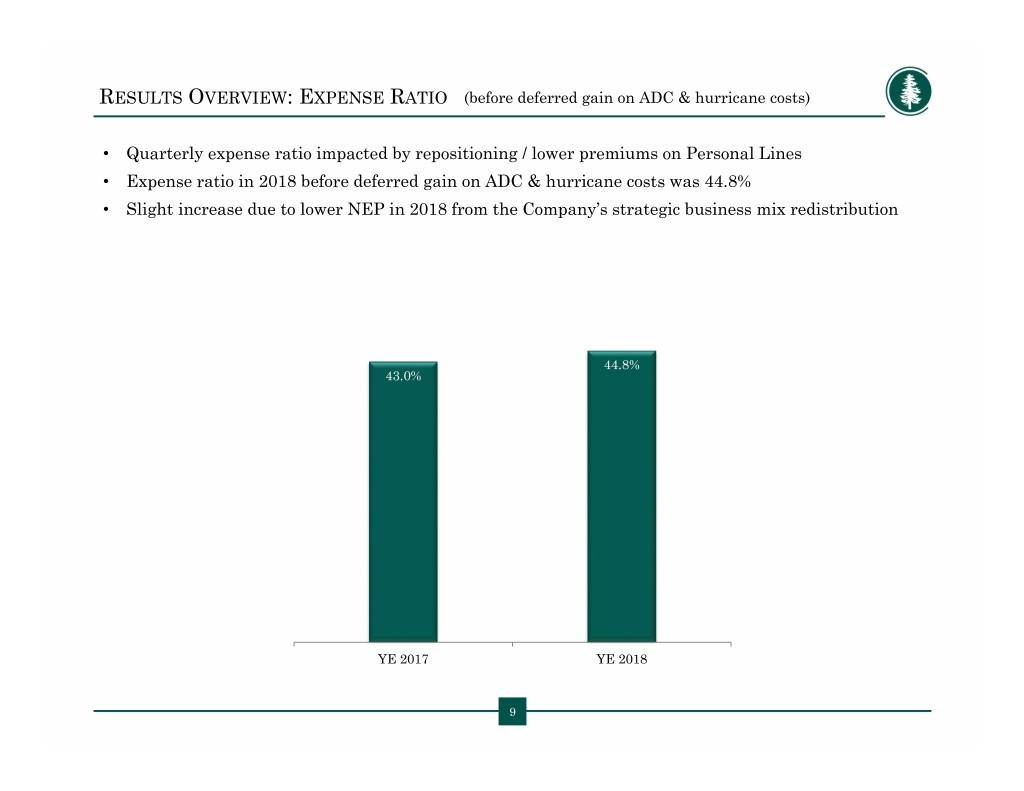
RESULTS OVERVIEW: EXPENSE RATIO (before deferred gain on ADC & hurricane costs) • Quarterly expense ratio impacted by repositioning / lower premiums on Personal Lines • Expense ratio in 2018 before deferred gain on ADC & hurricane costs was 44.8% • Slight increase due to lower NEP in 2018 from the Company’s strategic business mix redistribution 44.8% 43.0% YE 2017 YE 2018 9
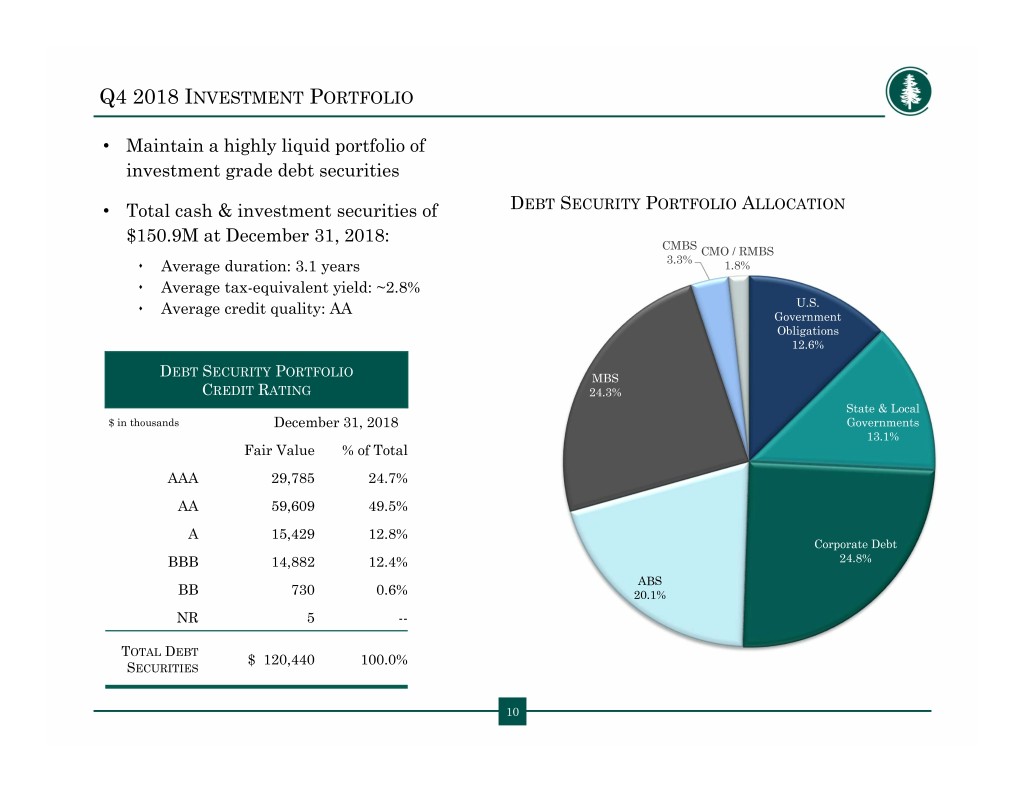
Q4 2018 INVESTMENT PORTFOLIO • Maintain a highly liquid portfolio of investment grade debt securities • Total cash & investment securities of DEBT SECURITY PORTFOLIO ALLOCATION $150.9M at December 31, 2018: CMBS CMO / RMBS 3.3% Average duration: 3.1 years 1.8% Average tax-equivalent yield: ~2.8% Average credit quality: AA U.S. Government Obligations 12.6% DEBT SECURITY PORTFOLIO MBS CREDIT RATING 24.3% State & Local $ in thousands December 31, 2018 Governments 13.1% Fair Value % of Total AAA 29,785 24.7% AA 59,609 49.5% A 15,429 12.8% Corporate Debt BBB 14,882 12.4% 24.8% ABS BB 730 0.6% 20.1% NR 5 -- TOTAL DEBT $ 120,440 100.0% SECURITIES 10

FINANCIAL RESULTS: Q4 2018 INCOME STATEMENT • Operating loss reflects the impact of the Company’s decision to implement an adverse development cover in Q3 2017 (see table in appendix) • Company reported net loss of $4.8 million, or $0.56 per share for Q4 2018 • For Q4 2018, adjusted operating loss was $4.2 million, or $0.49 per share Three Months Ended December 31, ($ in thousands, except per share data) 2018 2017 Gross Written Premium $27,440 $31,247 Net Written Premium 23,800 27,439 Net Earned Premium 22,623 25,433 Net Income (Loss) (4,776) 221 EPS, Basic and Diluted $(0.56) $0.03 Adjusted Operating Income (Loss) (4,178) 161 Adjusted Operating Income (Loss) per share $(0.49) $0.02 11 11

FINANCIAL RESULTS: CONSOLIDATED BALANCE SHEET • Shareholders’ equity of $42.2 million • $2.02 not reflected in book value: $1.49 per share full valuation allowance against deferred tax assets $0.53 per share deferred gain on ADC, net of tax • Book value of $4.97 as of quarter ended December 31, 2018 SUMMARY BALANCE SHEET December 31, 2018 December 31, 2017 $ in thousands Cash and Invested Assets $ 150,894 $ 169,518 Reinsurance Recoverables 34,745 24,539 Goodwill and Intangible Assets 985 987 Total Assets $ 232,752 $ 239,032 Unpaid Losses and Loss Adjustment Expenses 92,807 87,896 Unearned Premiums 52,852 57,672 Debt 33,502 29,027 Total Liabilities $ 190,589 $ 186,206 Total Shareholders' Equity $ 42,163 $ 52,826 12

APPENDIX
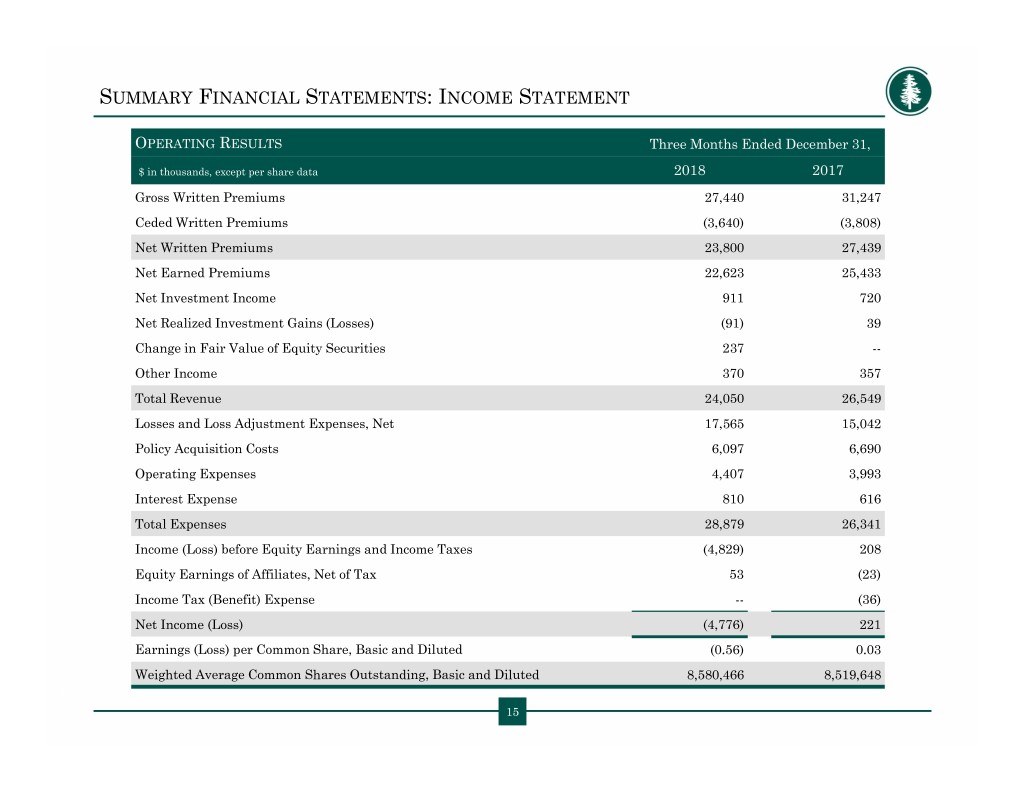
SUMMARY FINANCIAL STATEMENTS: INCOME STATEMENT OPERATING RESULTS Three Months Ended December 31, $ in thousands, except per share data 2018 2017 Gross Written Premiums 27,440 31,247 Ceded Written Premiums (3,640) (3,808) Net Written Premiums 23,800 27,439 Net Earned Premiums 22,623 25,433 Net Investment Income 911 720 Net Realized Investment Gains (Losses) (91) 39 Change in Fair Value of Equity Securities 237 -- Other Income 370 357 Total Revenue 24,050 26,549 Losses and Loss Adjustment Expenses, Net 17,565 15,042 Policy Acquisition Costs 6,097 6,690 Operating Expenses 4,407 3,993 Interest Expense 810 616 Total Expenses 28,879 26,341 Income (Loss) before Equity Earnings and Income Taxes (4,829) 208 Equity Earnings of Affiliates, Net of Tax 53 (23) Income Tax (Benefit) Expense -- (36) Net Income (Loss) (4,776) 221 Earnings (Loss) per Common Share, Basic and Diluted (0.56) 0.03 Weighted Average Common Shares Outstanding, Basic and Diluted 8,580,466 8,519,648 15 15
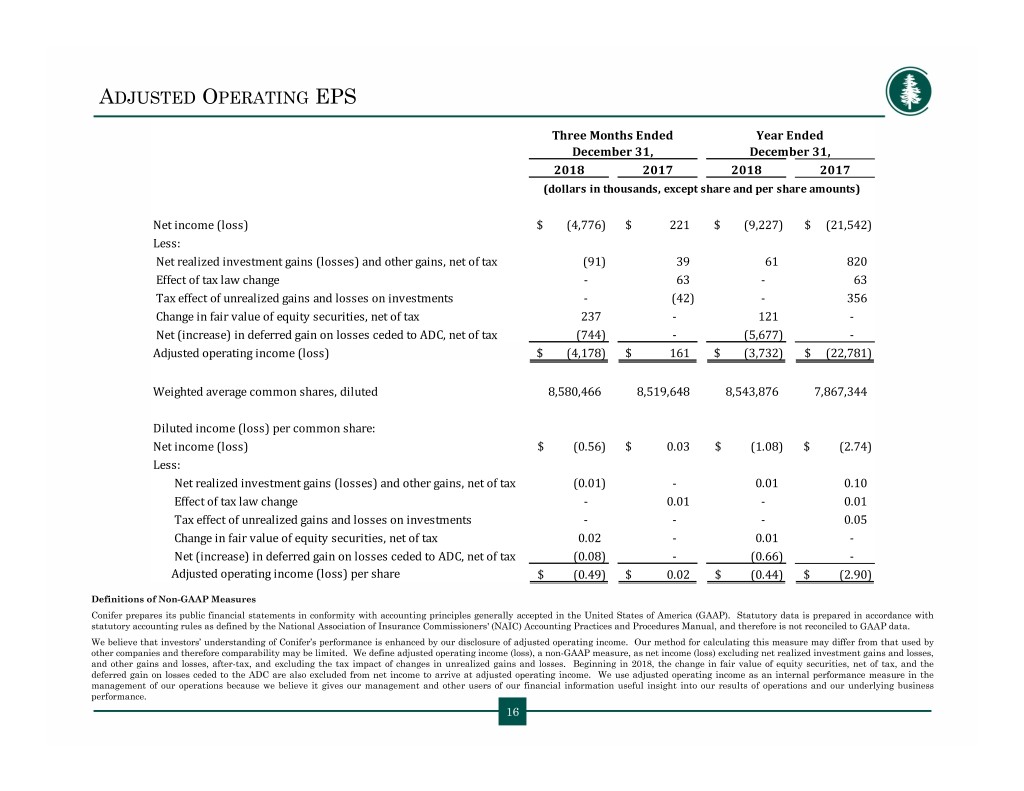
ADJUSTED OPERATING EPS Three Months Ended Year Ended December 31, December 31, 2018 2017 2018 2017 (dollars in thousands, except share and per share amounts) Net income (loss) $ (4,776) $ 221 $ (9,227) $ (21,542) Less: Net realized investment gains (losses) and other gains, net of tax (91) 39 61 820 Effect of tax law change - 63 - 63 Tax effect of unrealized gains and losses on investments - (42) - 356 Change in fair value of equity securities, net of tax 237 - 121 - Net (increase) in deferred gain on losses ceded to ADC, net of tax (744) - (5,677) - Adjusted operating income (loss)$ (4,178) $ 161 $ (3,732) $ (22,781) Weighted average common shares, diluted 8,580,466 8,519,648 8,543,876 7,867,344 Diluted income (loss) per common share: Net income (loss)$ (0.56) $ 0.03 $ (1.08) $ (2.74) Less: Net realized investment gains (losses) and other gains, net of tax (0.01) - 0.01 0.10 Effect of tax law change - 0.01 - 0.01 Tax effect of unrealized gains and losses on investments - - - 0.05 Change in fair value of equity securities, net of tax 0.02 - 0.01 - Net (increase) in deferred gain on losses ceded to ADC, net of tax (0.08) - (0.66) - Adjusted operating income (loss) per share $ (0.49) $ 0.02 $ (0.44) $ (2.90) Definitions of Non-GAAP Measures Conifer prepares its public financial statements in conformity with accounting principles generally accepted in the United States of America (GAAP). Statutory data is prepared in accordance with statutory accounting rules as defined by the National Association of Insurance Commissioners' (NAIC) Accounting Practices and Procedures Manual, and therefore is not reconciled to GAAP data. We believe that investors’ understanding of Conifer’s performance is enhanced by our disclosure of adjusted operating income. Our method for calculatingthismeasuremaydifferfromthatusedby other companies and therefore comparability may be limited. We define adjusted operating income (loss), a non-GAAP measure, as net income (loss) excluding net realized investment gains and losses, and other gains and losses, after-tax, and excluding the tax impact of changes in unrealized gains and losses. Beginning in 2018, the change in fair value of equity securities, net of tax, and the deferred gain on losses ceded to the ADC are also excluded from net income to arrive at adjusted operating income. We use adjusted operating income as an internal performance measure in the management of our operations because we believe it gives our management and other users of our financial information useful insight into our results of operations and our underlying business performance. 16


