LAND DEVELOPER & HOMEBUILDER

Brookfield Residential entitles and develops master-planned communities and sells lots to third-party builders. We also build homes and develop commercial properties in our communities.
FINANCIAL PERFORMANCE
| | | | | | | | |
As at and for the years ended December 31 (US$ millions, except unit activity and per share amounts) | | 2011 | | | 2010 | |
RESULTS OF OPERATIONS | | | | | | | | |
Total revenue | | $ | 1,008 | | | $ | 954 | |
Land revenue | | | 524 | | | | 355 | |
Housing revenue | | | 484 | | | | 599 | |
Gross margin – $ | | | 268 | | | | 267 | |
Gross margin – % | | | 27 | % | | | 28 | % |
Income before income taxes | | | 130 | | | | 189 | |
Income tax expense | | | (125 | ) | | | (58 | ) |
Net income attributable to Brookfield Residential | | | 7 | | | | 132 | |
Basic earnings per share | | $ | 0.07 | | | $ | 1.11 | |
Diluted earnings per share | | $ | 0.07 | | | $ | 1.11 | |
| | |
FINANCIAL POSITION | | | | | | | | |
Total assets | | $ | 2,579 | | | $ | 2,636 | |
Total financings | | | 1,295 | | | | 1,025 | |
| | |
OPERATING DATA | | | | | | | | |
Lot closings (units) | | | 3,474 | | | | 2,548 | |
Average land selling price (per lot equivalent) | | $ | 151,000 | | | $ | 139,000 | |
Home closings (units) | | | 1,295 | | | | 1,600 | |
Average home selling price (per unit) | | $ | 374,000 | | | $ | 375,000 | |
Net new orders (units) | | | 1,584 | | | | 1,400 | |
Backlog (units at end of period) | | | 645 | | | | 376 | |
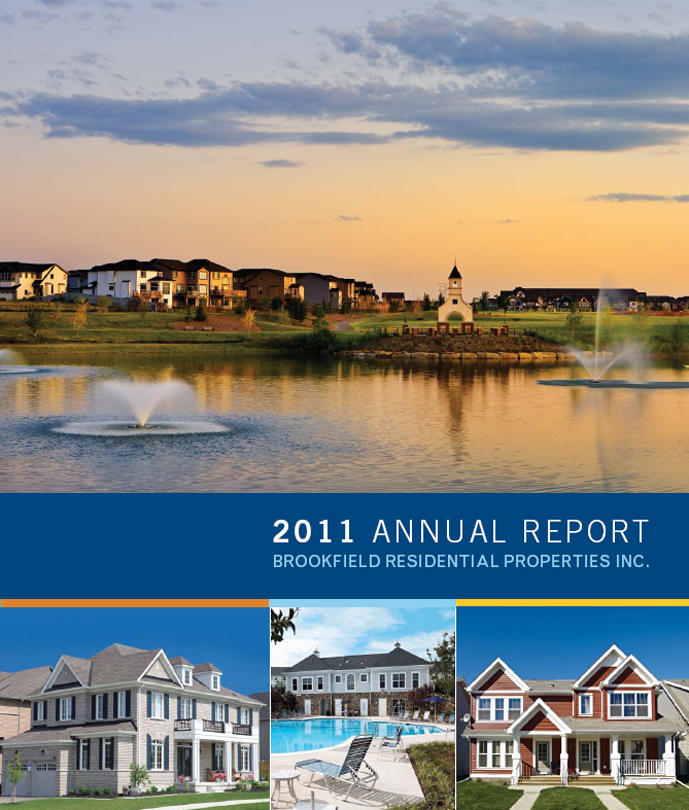
Front cover (top):
New Brighton, Calgary, Alberta:This master-planned community is reminiscent of the English countryside, featuring a beautiful 32-acre central park with a private residents club. It is one of the city’s top five best selling new home communities with 292 sales recorded in 2011.
Bottom row from left to right:
Grand Central, Bradford, Ontario: This family friendly community opened in 2006 and is home to more than 750 growing families. The most powerful draw to Grand Central is the sense of community that permeates the place, making it a popular choice for both first-time and move-up homebuyers.
Melody Landing, Woodbridge, Virginia:The pool house recreation centre was built and opened in 2011. The luxury townhomes yielded an above average sales volume, each with a 2,100 sq. ft. living space, at a competitive price.
Axio Lake Summerside, Edmonton, Alberta:The innovative and affordable semi-detached homes cater to a wide range of demographics from first-time to move-down buyers. With functional new home designs up to 1,400 sq. ft., they truly reflect the community’s architectural style.
UNIQUELY POSITIONED

• Geographically diverse portfolio
With assets split almost equally between Canada and the United States, our North American portfolio provides the benefits of a strong and profitable Canadian market while positioned for a recovery in future growth markets in the U.S.
• We sell more lots than homes
We sell lots to third-party builders after we have created value through the entitlement and development stages. In markets where we develop master-planned communities, our homebuilding operation also builds on up to 20% of the lots we produce.
• Value creation in land development
Each market functions differently. We control raw land in markets that have barriers to entry and strategically increase asset values through the entitlement and development stages.
• Strong capital structure
We have a strong balance sheet and the financial flexibility to take advantage of growth opportunities. Our progressive and disciplined approach allows us to strategically develop the current assets and purchase new ones to enhance our portfolio.
• Best-in-class operating expertise
Continuity of the management team is key to building relationships with our local stakeholders and business partners. With an average of 20 years��� experience and in-depth local industry knowledge, we can identify prime opportunities to capture homebuyers effectively in each of our markets.
• Awards for homebuilding excellence
Brookfield Residential rates highly on customer satisfaction surveys and has won numerous awards from industry peers and consumer groups for green building and energy efficiency, design, marketing, and company achievement.
Diverse portfolio with over 100,000 lots concentrated in dynamic and resilient cities in Canada & the United States

LETTER TO SHAREHOLDERS

This was a transformational year for our company. We have created a one-of-a-kind North American land developer and homebuilder with geographic diversity, and financial strength that is well positioned for growth as the U.S. economy recovers.
Our performance in the fourth quarter was extremely positive, particularly due to our Canadian operations. As anticipated, a significant portion of our 2011 income before taxes was back-end loaded to the fourth quarter, with $49 million of our income before taxes occurring in this quarter.
Given the state of the North American market and the impact of the merger, our overall performance for the year was reasonably positive. Our overall income before taxes of $130 million is broken down as follows: $81 million of income from normal recurring operations and $49 million of income from a non-recurring change in business practice as a result of the merger. Minority interest and tax provision of $123 million, including writing off the U.S. deferred tax asset, brought our net income down to $7 million. Results in 2012 should be more straightforward as these non-recurring items are now behind us.
MARKETS
As I explained in previous “Letters,” our markets in Canada and the United States remain very different. Our Canadian operations continue to perform well with strong sales carry-forward into 2012. Our future looks good also, with Alberta’s unemployment rate now at only 4.9%. Given the normal time lag between job creation and home ownership, this augers very well for our future in Alberta. While we see some signs of optimism, the U.S. still remains challenging. However, we are well positioned in our targeted real estate markets, and where good acquisition opportunities exist.
ACCOMPLISHMENTS
It is worth reflecting on our many accomplishments since the merger on March 31, 2011:
| • | | We effected the management changeover seamlessly and have our “next generation” leaders in place while our seasoned managers are still available to coach and mentor. |
| • | | We amended the terms of two of our related party debt obligations to ensure that there is sufficient liquidity for future opportunities. As at December 31, 2011, we have over $144 million of available lines of credit in Canada and $74 million available in the U.S. |
| • | | We acquired $140 million of land in Canada and the U.S., which we believe will provide an appropriate return based on using today’s pricing and absorptions. The vast majority of these lands are short-term in nature and will provide returns over the next one to three years. |
PROJECTS
Our overall asset portfolio of $2.6 billion, in ten regions of North America, is represented by 81 communities / projects. Our core business is Land and Housing. While the bulk of these projects are residential in nature, we also create commercial / industrial lands that may form part of several of our master-planned communities. We generally build homes on 15 to 20% of our own land, with the remaining lots and parcels being sold to third-party builders. It is our intention to profile one or two projects each quarter in our Letter to Shareholders to describe the types of assets that we own and how we apply our philosophy of development. The two projects profiled in this report are Rosedale, in Azusa, California and Seton, in Calgary, Alberta.
Rosedale – a stalled California master-plan becomes Community of the Year
Rosedale, in Azusa, California, transformed from a bankrupt and neglected 518-acre master-planned community of 1,250 lots under the previous ownership to Southern California’s Community of the Year in just 12 months.
We were in a position to move quickly to purchase this asset and successfully overcame enormous obstacles. With the participation of Christopher Development Group and Starwood Capital, radical community improvements were made that included a positive liaison with existing residents, completion of the unfinished community resort facility, subdivision clean-up, rebranding and marketing. This significantly turned Rosedale into a vibrant and attractive place to live – resulting in over 100 new home sales during 2011.
Seton – one of North America’s largest mixed-use developments
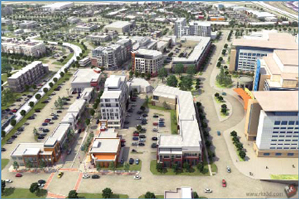
Seton, in Calgary, Alberta, is a prime example of adding value to a master plan through proper mixed-use planning and building on our own land. This 365-acre mixed-use development is one of the largest and most exciting opportunities of its kind in North America. It sits in the center of the fastest growing sector in the city accommodating a future trade area of over 100,000 people.
Our vision began years ago but came to fruition when construction began on the $1.4 billion, 70-acre South Health Campus, a facility that will open in the summer of 2012. Seton’s development plan includes 2.5 million square feet of office and retail space, light rail transit, a regional park, a public library, high school, regional recreation facility, hotel and 1,300 multi-family residences. Brookfield Residential is currently developing four residential master-planned communities in proximity to Seton. With the anticipated completion of the South Health Campus, investment activity in Seton and buying interest in our master-planned communities have rapidly gained momentum.
OUTLOOK
Our view for 2012 is for similar, but marginally improving markets in North America. We are hopeful that with the opening of several new communities in the U.S., some commercial parcel sales and executing on our excellent sales backlog, our 2012 normal operating income will improve and replace some of the non-recurring income of 2011.
Our portfolio is unique in the North American marketplace and places us in the advantageous position of having solid cash flows and performance from our Canadian operations with good optionality and upside from a U.S. housing recovery. Our discipline and in-depth knowledge of the North American market bodes well for this to occur.
Thanks to all our employees, building partners, trade partners, consultants, lenders and shareholders. It is an exciting time to be in this business and we look forward to sharing our journey with you.
|
 |
|
| Alan Norris |
| President & Chief Executive Officer |
|
| February 14, 2012 |

Location matters. So too does exceptional quality, customer satisfaction, and award winning design. At Brookfield Residential, we remain true to our vision of passion, integrity and community to create great places to live and are committed to increasing the value of each asset.
Brookfield Residential Properties Inc.
| | | | |
Residential Properties Portfolio | | | 2 | |
Management’s Discussion & Analysis, Financial Statements and Other Information
| | | | |
Cautionary Statement Regarding Forward-Looking Statements | | | 3 | |
| | | | |
Management’s Discussion and Analysis of Financial Condition and Results of Operations | | | 4 | |
| |
Business Environment and Risks | | | 21 | |
| | | | |
Consolidated Financial Statements | | | | |
| |
Management’s Responsibility for Financial Reporting | | | 25 | |
| |
Report of Independent Registered Chartered Accountants | | | 26 | |
| |
Management’s Report on Internal Control Over Financial Reporting | | | 27 | |
| |
Report of Independent Registered Chartered Accountants | | | 28 | |
| |
Consolidated Balance Sheets – December 31, 2011 and December 31, 2010 | | | 29 | |
| |
Consolidated Statements of Operations – Years Ended December 31, 2011 and 2010 | | | 30 | |
| |
Consolidated Statements of Equity – Years Ended December 31, 2011 and 2010 | | | 31 | |
| |
Consolidated Statements of Cash Flows – Years Ended December 31, 2011 and 2010 | | | 32 | |
| |
Notes to the Consolidated Financial Statements | | | 33 | |
| | |
| Brookfield Residential Properties Inc. | | 1 |
RESIDENTIAL PROPERTIES PORTFOLIO
Our business is focused on land development and single-family and multi-family homebuilding in the markets in which we operate. Our assets consist primarily of land and housing inventory and investments in unconsolidated entities. Our total assets as at December 31, 2011 were $2.6 billion.
As of December 31, 2011, we controlled 108,197 lots. Controlled lots include those we directly own and our share of those owned by unconsolidated entities. Our controlled lots provide a strong foundation for our future lot sales and homebuilding business as well as visibility on our future cash flow. Approximately 50% of our owned lots are entitled. The number of building lots we control in each of our primary markets as of December 31, 2011 follows:
| | | | | | | | | | | | | | | | | | | | | | | | | | | | | | | | |
| | | | | | Unconsolidated | | | Total Lots | | | | | | Total Lots | |
| | | Land & Housing | | | Entities | | | December 31,
2011 | | | Status of Lots | | | December 31,
2010 | |
| | | Owned | | | Options | | | Owned | | | Options | | | | Entitled | | | Unentitled | | |
| | | | | | | | |
Calgary | | | 27,963 | | | | — | | | | 1,064 | | | | — | | | | 29,027 | | | | 8,853 | | | | 20,174 | | | | 28,643 | |
Edmonton | | | 17,331 | | | | — | | | | — | | | | — | | | | 17,331 | | | | 10,551 | | | | 6,780 | | | | 18,229 | |
Toronto | | | 9,461 | | | | — | | | | — | | | | — | | | | 9,461 | | | | 720 | | | | 8,741 | | | | 9,320 | |
| | | | | | | | | | | | | | | | | | | | | | | | | | | | | | | | |
Canada | | | 54,755 | | | | — | | | | 1,064 | | | | — | | | | 55,819 | | | | 20,124 | | | | 35,695 | | | | 56,192 | |
| | | | | | | | | | | | | | | | | | | | | | | | | | | | | | | | |
| | | | | | | | |
Northern California | | | 3,338 | | | | 4,950 | | | | — | | | | — | | | | 8,288 | | | | 2,138 | | | | 6,150 | | | | 8,223 | |
Los Angeles / Southland | | | 848 | | | | — | | | | 1,526 | | | | 1,842 | | | | 4,216 | | | | 1,876 | | | | 2,340 | | | | 4,734 | |
San Diego / Riverside | | | 8,966 | | | | — | | | | 33 | | | | — | | | | 8,999 | | | | 6,199 | | | | 2,800 | | | | 8,761 | |
Other | | | 194 | | | | — | | | | 55 | | | | — | | | | 249 | | | | 249 | | | | — | | | | 253 | |
| | | | | | | | | | | | | | | | | | | | | | | | | | | | | | | | |
California | | | 13,346 | | | | 4,950 | | | | 1,614 | | | | 1,842 | | | | 21,752 | | | | 10,462 | | | | 11,290 | | | | 21,971 | |
| | | | | | | | | | | | | | | | | | | | | | | | | | | | | | | | |
| | | | | | | | |
Denver | | | 10,620 | | | | — | | | | — | | | | — | | | | 10,620 | | | | 10,620 | | | | — | | | | 10,828 | |
Austin | | | 14,921 | | | | — | | | | — | | | | — | | | | 14,921 | | | | 5,373 | | | | 9,548 | | | | 15,870 | |
Washington D.C. Area | | | 2,994 | | | | 1,066 | | | | 1,025 | | | | — | | | | 5,085 | | | | 4,838 | | | | 247 | | | | 4,846 | |
| | | | | | | | | | | | | | | | | | | | | | | | | | | | | | | | |
Central and Eastern U.S. | | | 28,535 | | | | 1,066 | | | | 1,025 | | | | — | | | | 30,626 | | | | 20,831 | | | | 9,795 | | | | 31,544 | |
| | | | | | | | | | | | | | | | | | | | | | | | | | | | | | | | |
Total | | | 96,636 | | | | 6,016 | | | | 3,703 | | | | 1,842 | | | | 108,197 | | | | 51,417 | | | | 56,780 | | | | 109,707 | |
| | | | | | | | | | | | | | | | | | | | | | | | | | | | | | | | |
| | | | | | | | |
Entitled lots | | | 48,210 | | | | 1,066 | | | | 1,678 | | | | 463 | | | | 51,417 | | | | | | | | | | | | | |
| | | | | | | | |
Unentitled lots | | | 48,426 | | | | 4,950 | | | | 2,025 | | | | 1,379 | | | | 56,780 | | | | | | | | | | | | | |
| | | | | | | | | | | | | | | | | | | | | | | | | | | | | | | | |
| | | | | | | | |
Total December 31, 2011 | | | 96,636 | | | | 6,016 | | | | 3,703 | | | | 1,842 | | | | 108,197 | | | | | | | | | | | | | |
| | | | | | | | | | | | | | | | | | | | | | | | | | | | | | | | |
| | | | | | | | |
Total December 31, 2010 | | | 97,381 | | | | 6,435 | | | | 3,132 | | | | 2,759 | | | | 109,707 | | | | | | | | | | | | | |
| | | | | | | | | | | | | | | | | | | | | | | | | | | | | | | | |
CAUTIONARY STATEMENT REGARDING FORWARD-LOOKING STATEMENTS
This annual report contains “forward-looking statements” within the meaning of applicable Canadian securities laws and United States federal securities laws. The words “may,” “believe,” “will,” “anticipate,” “expect,” “planned,” “estimate,” “project,” “future,” and other expressions that are predictions of or indicate future events and trends and that do not relate to historical matters identify forward-looking statements. Such statements reflect management’s current beliefs and are based on information currently available to management. The forward-looking statements in this annual report include, among others, statements with respect to:
| • | | the current business environment and outlook; |
| • | | possible or assumed future results; |
| • | | ability to create shareholder value; |
| • | | business goals, strategy and growth plans; |
| • | | strategies for shareholder value creation; |
| • | | plans for the Seton development in Calgary, Alberta; |
| • | | the stability of home prices; |
| • | | effect of challenging conditions on us; |
| • | | factors affecting our competitive position within the homebuilding industry; |
| • | | ability to generate sufficient cash flow from our assets in 2012, 2013 and 2014 to repay maturing project specific financings; |
| • | | the visibility of our future cash flow; |
| • | | expected backlog and closings; |
| • | | sufficiency of our access to capital resources; |
| • | | the impact of foreign exchange on our financial performance; |
| • | | the timing of the effect of interest rate changes on our cash flows; and |
| • | | the effect on our business of existing lawsuits. |
Reliance should not be placed on forward-looking statements because they involve known and unknown risks, uncertainties and other factors, which may cause the actual results to differ materially from the anticipated future results expressed or implied by such forward-looking statements. Factors that could cause actual results to differ materially from those set forth in the forward-looking statements include, but are not limited to:
| • | | changes in general economic, real estate and other conditions; |
| • | | mortgage rate and availability changes; |
| • | | availability of suitable undeveloped land at acceptable prices; |
| • | | adverse legislation or regulation; |
| • | | ability to obtain necessary permits and approvals for the development of our land; |
| • | | availability of labour or materials or increases in their costs; |
| • | | ability to develop and market our master-planned communities successfully; |
| • | | ability to obtain regulatory approvals; |
| • | | confidence levels of consumers; |
| • | | ability to raise capital on favourable terms; |
| • | | adverse weather conditions and natural disasters; |
| • | | relations with the residents of our communities; |
| • | | risks associated with increased insurance costs or unavailability of adequate coverage; |
| • | | ability to obtain surety bonds; |
| • | | competitive conditions in the homebuilding industry, including product and pricing pressures; |
| • | | ability to retain our executive officers; |
| • | | relationships with our affiliates; and |
| • | | additional risks and uncertainties, many of which are beyond our control, referred to in this annual report and our other public filings with the applicable Canadian regulatory authorities and the United States Securities and Exchange Commission. |
Except as required by law, we undertake no obligation to publicly update any forward-looking statements whether as a result of new information, future events or otherwise. However, any further disclosures made on related subjects in subsequent reports should be consulted.
| | |
| Brookfield Residential Properties Inc. | | 3 |
MANAGEMENT’S DISCUSSION AND ANALYSIS OF FINANCIAL CONDITION AND RESULTS OF OPERATIONS
About this Management’s Discussion and Analysis
This management’s discussion and analysis relates to the year ended December 31, 2011, which reflects the twelve month period from January 1, 2011 to December 31, 2011, and has been prepared with an effective date of February 17, 2012. It should be read in conjunction with the annual consolidated financial statements and the related notes thereto included elsewhere in this annual report. All dollar amounts discussed herein are in U.S. dollars, unless otherwise stated. Amounts in Canadian dollars are identified as “C$.” The financial statements referenced herein have been prepared in accordance with accounting principles generally accepted in the United States of America (“U.S. GAAP”). Additional information can be found on our website at www.brookfieldrp.com, or on SEDAR at www.sedar.com or on EDGAR at www.sec.gov.
Overview
Brookfield Residential Properties Inc. (unless the context requires otherwise, references in this report to “we,” “our,” “us,” “the Company” and “Brookfield Residential” refer to Brookfield Residential Properties Inc. and the subsidiaries through which it conducts all of its land development and homebuilding operations) is a publicly traded North American land development and homebuilding company listed on the New York Stock Exchange and the Toronto Stock Exchange under the symbol “BRP.”
The Company became a public company on March 31, 2011, by combining the former business of Brookfield Homes Corporation (“Brookfield Homes”) and the residential land and housing division (“BPO Residential”) of Brookfield Office Properties Inc. (“Brookfield Office Properties”) into a single residential land and housing company, which was achieved through a merger and series of related transactions completed on March 31, 2011 (the “Transactions”). Pursuant to the merger and contribution agreement entered into by the Company, Brookfield Homes, Brookfield Office Properties and Brookfield Residential Acquisition Corp. on October 4, 2010 in respect of the Transactions: (a) Brookfield Residential Acquisition Corp., a direct wholly-owned subsidiary of the Company, merged with and into Brookfield Homes, with the result that Brookfield Homes became a wholly-owned subsidiary of the Company; and (b) Brookfield Office Properties’ and certain of its subsidiaries contributed to the Company equity interests in certain entities that, prior to the completion of the transactions, owned all or substantially all of the assets of BPO Residential. Each outstanding share of Brookfield Homes common stock was converted into 0.764900530 of a share of the Company’s common shares (the “Common Shares”), and each outstanding share of Brookfield Homes 8% convertible preferred stock was converted into one share of the Company’s 8% Convertible Preferred Shares, Series A (“Preferred Shares”). In connection with the closing of the Transactions, the Company issued: (i) 51,500,000 Common Shares to Brookfield Office Properties, (ii) 8,685,066 Common Shares to holders of shares of Brookfield Homes’ common stock, and (iii) 70,002 Preferred Shares, to holders of Brookfield Homes’ 8% convertible preferred stock, which Preferred Shares are convertible into Common Shares in accordance with their terms, at an issue price of $25 per Preferred Share. In exchange for its contribution of BPO Residential, Brookfield Office Properties also received two promissory notes totalling C$480 million (US$494 million).
This transaction took place between entities under common control and, as a result, has been accounted for as a continuity of interest using the carried amounts of assets and liabilities of both BPO Residential and Brookfield Homes for comparative purposes. Through these predecessor entities, Brookfield Residential has been developing land and building homes for over 50 years.
We currently focus on the following markets: Canada, California and Central and Eastern United States. Our Canadian operations operate primarily in the Alberta and Ontario markets. The California operations include our operations in Northern California (San Francisco Bay Area and Sacramento), and Southern California (Los Angeles / Southland and San Diego / Riverside). The Central and Eastern United States operations include the Washington D.C. Area, Colorado and Texas operations. We target these markets as we believe over the longer term they offer the following positive characteristics: strong housing demand, barriers to entry and close proximity to areas where we expect strong employment growth.
Principal Business Activities
Through the activities of our operating subsidiaries, we develop land for our own communities and sell lots to other homebuilders and third parties. We may also design, construct and market single-family and multi-family homes in our own and others’ communities. In each of our markets, we operate through local business units which are involved in all phases of the planning and building of our master-planned communities, infill and mixed-use developments. These operations include sourcing and evaluating land acquisitions, site planning, obtaining entitlements, developing the land, product design, constructing, marketing and selling homes and homebuyer customer service. These business units may also sell land for the construction of, or construct commercial shopping centres in our communities.
Brookfield Residential has developed a reputation for delivering first class master-planned communities and infill developments. Master-planned communities are new home communities that typically feature community centres, parks, recreational areas, schools, commercial areas and other amenities. In an infill development, Brookfield Residential develops land and constructs homes in previously urbanized areas on underutilized land.
Land Acquisition and Development
The residential land development and homebuilding industry involves converting raw or undeveloped land into residential housing. This process begins with the purchase or control of raw land and is followed by the entitlement and development of the land, and the marketing and sale of homes constructed on the land.
Our unique approach to land development begins with our disciplined approach to acquiring land in the path of growth in dynamic and resilient markets in North America that have barriers to entry caused by infrastructure or entitlement processes. We create value through the planning and entitlement process, developing and marketing residential lots and commercial sites and working with industry partners who share the same vision and values. We plan to continue to grow this business over time by selectively acquiring land that either enhances our existing inventory or provides attractive projects that are consistent with our overall strategy and management expertise.
Where market conditions permit, we prefer to purchase larger tracts of land with equity and then finance the development costs. These larger tracts afford us a true “master-planned” development opportunity that, following entitlement and assuming market conditions allow, creates a multi-year stream of cash flow. Master-planning is a long-term view of how each piece of land should be developed with a vision of how our customers live in each of our communities. One of our master-planned communities, McKenzie Towne in Calgary, Alberta, is the pioneer of new urbanism in Canada. It garnered international recognition after being named one of the top 26 master-planned communities in the world by the Urban Land Institute.
Mixed-use development is also a focus of the Company. We have been developing commercial properties within our master-planned communities for decades. Developing a mixed-use community provides a place where people can not only live, but work and play as well. Seton, in Calgary, Alberta, is a prime example of adding value to a master plan through appropriate mixed-use planning and building on our own land. This 365-acre mixed-use development is one of the largest opportunities of its kind in North America. It sits in the centre of the fastest growing sector in the city accommodating a future trade area of over 100,000 people. Our vision began years ago but came to fruition when construction began on the $1.4 billion, 70-acre South Health Campus, a facility that is expected to open in the summer of 2012. Seton’s development plan includes 2.5 million square feet of office and retail space, light rail transit, a regional park, a public library, high school, regional recreation facility, hotel and 1,300 multi-family residences. Brookfield Residential is currently developing four residential master-planned communities in proximity to Seton. With the anticipated completion of the South Health Campus, investment activity in Seton and buying interest in our master-planned communities have rapidly gained momentum.
We may also purchase smaller infill or re-use parcels, or in some cases finished lots for housing. As a city grows and intensifies, so do its development opportunities. Inner city revitalization opportunities contribute to the strategic expansion of our business. We develop and construct homes in previously urbanized areas on underutilized land. Urban developments provide quick turnarounds from acquisition to completion, create new revenue streams, and infuse new ideas and energy into the Company.
Home Construction
We may construct homes on lots that have been developed by us or that are purchased from others. Having a homebuilding operation allows us the opportunity to extract the value from the land and provides us with market knowledge through our direct contact with the homebuyers. In markets where the Company has significant land holdings, homebuilding is carried out on a portion of the land in specific market segments and the balance of lots are sold to and built on by third party builders. In these markets, we generally build homes on 15% to 20% of our own land, with the remaining lots sold to third party builders.
| | |
| Brookfield Residential Properties Inc. | | 5 |
Results of Operations
Key financial results as of and for our year ended December 31, 2011 compared to 2010 were as follows:
| | | | | | | | |
| | | Years Ended December 31 | |
| (US$ millions, except per share amounts) | | 2011 | | | 2010 | |
| | |
Land revenue | | $ | 524 | | | $ | 355 | |
Housing revenue | | | 484 | | | | 599 | |
Gross margin | | | 268 | | | | 267 | |
Income before income taxes | | | 130 | | | | 189 | |
Income tax expense | | | (125 | ) | | | (58 | ) |
Net income | | | 5 | | | | 131 | |
Net income attributable to Brookfield Residential | | | 7 | | | | 132 | |
Basic earnings per share | | $ | 0.07 | | | $ | 1.11 | |
Diluted earnings per share | | $ | 0.07 | | | $ | 1.11 | |
Segmented Information
We operate in three operating segments in North America: Canada, California and Central and Eastern U.S. Each of the Company’s segments specializes in lot entitlement and development and the construction of single-family and multi-family homes. The Company evaluates performance and allocates capital based primarily on return on assets together with a number of other risk factors. The following tables summarize information relating to revenues, income and assets by operating segment for the years ended December 31, 2011 and 2010.
| | | | | | | | | | | | | | | | |
| | | Years Ended December 31 | |
| | | 2011 | | | 2010 | |
| (US$ millions, except unit activity and average selling price) | | Units | | | $ | | | Units | | | $ | |
Land revenue: | | | | | | | | | | | | | | | | |
Canada | | | 2,940 | | | $ | 444 | | | | 1,990 | | | $ | 292 | |
California | | | 317 | | | | 56 | | | | 192 | | | | 31 | |
Central and Eastern U.S. | | | 217 | | | | 24 | | | | 366 | | | | 32 | |
| | | | | | | | | | | | | | | | |
Total | | | 3,474 | | | $ | 524 | | | | 2,548 | | | $ | 355 | |
| | | | | | | | | | | | | | | | |
| | | | |
Housing revenue: | | | | | | | | | | | | | | | | |
Canada | | | 941 | | | $ | 323 | | | | 1,025 | | | $ | 307 | |
California | | | 220 | | | | 107 | | | | 365 | | | | 212 | |
Central and Eastern U.S. | | | 134 | | | | 54 | | | | 210 | | | | 80 | |
| | | | | | | | | | | | | | | | |
Total | | | 1,295 | | | $ | 484 | | | | 1,600 | | | $ | 599 | |
| | | | | | | | | | | | | | | | |
| | | | |
Gross margin: | | | | | | | | | | | | | | | | |
Canada | | | | | | $ | 261 | | | | | | | $ | 220 | |
California | | | | | | | 4 | | | | | | | | 38 | |
Central and Eastern U.S. | | | | | | | 3 | | | | | | | | 9 | |
| | | | | | | | | | | | | | | | |
Total | | | | | | $ | 268 | | | | | | | $ | 267 | |
| | | | | | | | | | | | | | | | |
| | | | |
Average lot selling price(US$): | | | | | | | | | | | | | | | | |
Canada | | | | | | $ | 151,000 | | | | | | | $ | 147,000 | |
California | | | | | | | 178,000 | | | | | | | | 159,000 | |
Central and Eastern U.S. | | | | | | | 108,000 | | | | | | | | 88,000 | |
| | | | | | | | | | | | | | | | |
Average | | | | | | $ | 151,000 | | | | | | | $ | 139,000 | |
| | | | | | | | | | | | | | | | |
| | | | |
Average home selling price(US$): | | | | | | | | | | | | | | | | |
Canada | | | | | | $ | 343,000 | | | | | | | $ | 300,000 | |
California | | | | | | | 486,000 | | | | | | | | 581,000 | |
Central and Eastern U.S. | | | | | | | 405,000 | | | | | | | | 381,000 | |
| | | | | | | | | | | | | | | | |
Average | | | | | | $ | 374,000 | | | | | | | $ | 375,000 | |
| | | | | | | | | | | | | | | | |
| | | | |
Total Assets: | | | | | | | | | | | | | | | | |
Canada | | | | | | $ | 1,172 | | | | | | | $ | 1,170 | |
California | | | | | | | 692 | | | | | | | | 751 | |
Central and Eastern U.S. | | | | | | | 712 | | | | | | | | 715 | |
Corporate and other | | | | | | | 3 | | | | | | | | — | |
| | | | | | | | | | | | | | | | |
Total | | | | | | $ | 2,579 | | | | | | | $ | 2,636 | |
| | | | | | | | | | | | | | | | |
For more detailed financial information with respect to our revenues, earnings and assets, please refer to the accompanying consolidated financial statements and related notes included elsewhere in this annual report.
Year Ended December 31, 2011 Compared with Year Ended December 31, 2010
Net Income
| | | | | | | | |
| | | Years Ended December 31 | |
| (US$ millions, except per share amounts) | | 2011 | | | 2010 | |
Net income attributable to Brookfield Residential | | $ | 7 | | | $ | 132 | |
Basic earnings per share | | $ | 0.07 | | | $ | 1.11 | |
Diluted earnings per share | | $ | 0.07 | | | $ | 1.11 | |
Net income totalled $7 million for the year ended December 31, 2011 compared to $132 million for 2010. The decrease in net income was primarily a result of the increase in interest expense of $37 million, a decrease in other income of $25 million and the income tax valuation allowance of $71 million recorded in the first quarter of 2011. On the completion of the merger, we reviewed the ability of the Company on a combined entity basis to realize the U.S. deferred tax asset. The three-year cumulative loss of the U.S. operations of the combined Company, together with the continued uncertainty in the U.S. housing market, was evidence of a need for a valuation allowance against the U.S. deferred tax asset. The Company has the ability to reverse the valuation allowance in any future period upon utilization of the losses, which can be carried forward for up to 15 years, or when a valuation allowance is no longer deemed necessary.
A breakdown of the revenue and direct cost of sales for the years ended December 31, 2011 and 2010 is as follows:
| | | | | | | | |
| | | Years Ended December 31 | |
| (US$ millions) | | 2011 | | | 2010 | |
Revenue | | | | | | | | |
Land | | $ | 524 | | | $ | 355 | |
Housing | | | 484 | | | | 599 | |
| | | | | | | | |
| | $ | 1,008 | | | $ | 954 | |
| | | | | | | | |
Direct Cost of Sales | | | | | | | | |
Land | | $ | 327 | | | $ | 194 | |
Housing | | | 413 | | | | 493 | |
| | | | | | | | |
| | $ | 740 | | | $ | 687 | |
| | | | | | | | |
Results of Operations – Land
Land revenue totalled $524 million for the year ended December 31, 2011, an increase of $169 million when compared to the same period in 2010. Our land revenue may vary significantly from period to period due to the timing and nature of land sales. Revenues are also affected by local market conditions. A significant portion of the increase in land revenue for the year ended December 31, 2011 is a result of a change in business practice in Alberta to implement title transfer on lot sales at the time of sale to the builder and not the ultimate consumer. This change in business practice resulted in a one-time increase in revenue of $189 million for the year ended December 31, 2011.
A breakdown of the land operations for the years ended December 31, 2011 and 2010 is as follows:
Consolidated
| | | | | | | | | | | | | | | | |
| | | Years Ended December 31 | |
| | | | | | Non-Recurring | | | | | | | |
| (US$ millions, except unit activity) | | 2011 | | | Timing
Difference | | | Adjusted
2011 | | | 2010 | |
Lot closings | | | 3,474 | | | | 1,173 | | | | 2,301 | | | | 2,548 | |
Revenue | | $ | 524 | | | $ | 189 | | | $ | 335 | | | $ | 355 | |
Direct cost of sales | | $ | 327 | | | $ | 140 | | | $ | 187 | | | $ | 194 | |
| | |
| Brookfield Residential Properties Inc. | | 7 |
A breakdown of our results from land operations for our three operating segments is as follows:
Canada
| | | | | | | | |
| | | Years Ended December 31 | |
| (US$ millions, except unit activity) | | 2011 | | | 2010 | |
Lot closings | | | 2,940 | | | | 1,990 | |
Revenue | | $ | 444 | | | $ | 292 | |
Direct cost of sales | | $ | 238 | | | $ | 129 | |
The strength of our Canadian residential segment continued in 2011 with an increase in lot closings and average lot selling prices. 2,940 lots were closed during the year ended December 31, 2011, an increase of 950 lots when compared to the same period in 2010. The increase in revenue of $152 million is primarily due to the non-recurring timing difference resulting from the change in business practice in Alberta and higher average lot selling prices for the year ended December 31, 2011. Excluding the non-recurring lot closings of 1,173 lots, land revenue for the year ended December 31, 2011 decreased by $37 million, when compared to the year ended December 31, 2010 largely due to increased collections in Canada at the end of 2010. Land cost of sales increased $109 million for the year ended December 31, 2011 when compared to the same period in 2010. The increase in land cost of sales primarily relates to higher lot closings.
California
| | | | | | | | |
| | | Years Ended December 31 | |
| (US$ millions, except unit activity) | | 2011 | | | 2010 | |
Lot closings | | | 317 | | | | 192 | |
Revenue | | $ | 56 | | | $ | 31 | |
Direct cost of sales | | $ | 61 | | | $ | 28 | |
For the year ended December 31, 2011, revenue of $56 million is mainly the result of bulk lot sales in the second and fourth quarters totalling 317 lots. The increase in land cost of sales for the year ended December 31, 2011 is a result of completing such bulk lot sales. The bulk lot sales made during 2011 is a result of a change in approach and strategy for these specific assets.
Central and Eastern U.S.
| | | | | | | | |
| | | Years Ended December 31 | |
| (US$ millions, except unit activity) | | 2011 | | | 2010 | |
Lot closings | | | 217 | | | | 366 | |
Revenue | | $ | 24 | | | $ | 32 | |
Direct cost of sales | | $ | 28 | | | $ | 38 | |
A challenging market resulting in lower lot closings was partially offset by a change in product mix for the year ended December 31, 2011, which resulted in land revenues declining by $8 million when compared to the same period in 2010.
Results of Operations – Housing
Housing revenue was $484 million for the year ended December 31, 2011, compared to $599 million for the same period in 2010. The decline was the result of fewer home closings partially offset by higher average home selling prices for the year ended December 31, 2011.
A breakdown of housing operations for the years ended December 31, 2011 and 2010 is as follows:
Consolidated
| | | | | | | | |
| | | Years Ended December 31 | |
| (US$ millions, except unit activity) | | 2011 | | | 2010 | |
Home closings | | | 1,295 | | | | 1,600 | |
Revenue | | $ | 484 | | | $ | 599 | |
Direct cost of sales | | $ | 413 | | | $ | 493 | |
A breakdown of our results from housing operations for our three operating segments is as follows:
Canada
| | | | | | | | |
| | | Years Ended December 31 | |
| (US$ millions, except unit activity) | | 2011 | | | 2010 | |
Home closings | | | 941 | | | | 1,025 | |
Revenue | | $ | 323 | | | $ | 307 | |
Direct cost of sales | | $ | 268 | | | $ | 250 | |
Housing revenue in Canada for the year ended December 31, 2011 increased $16 million when compared to the same period in 2010. The increase in housing revenue is due to a 14% increase in the average home selling price due to the mix of products closed for the year ended December 31, 2011 when compared to the same period in 2010.
California
| | | | | | | | |
| | | Years Ended December 31 | |
| (US$ millions, except unit activity) | | 2011 | | | 2010 | |
Home closings | | | 220 | | | | 365 | |
Revenue | | $ | 107 | | | $ | 212 | |
Direct cost of sales | | $ | 99 | | | $ | 178 | |
Fewer home closings resulted from a reduced backlog entering into 2011 combined with a slow spring selling season in the California market. Housing revenue was $107 million for the year ended December 31, 2011, a decrease of $105 million when compared to the same period in 2010. The decline is a result of fewer home closings, decreased average selling prices and product mix.
Central and Eastern U.S.
| | | | | | | | |
| | | Years Ended December 31 | |
| (US$ millions, except unit activity) | | 2011 | | | 2010 | |
Home closings | | | 134 | | | | 210 | |
Revenue | | $ | 54 | | | $ | 80 | |
Direct cost of sales | | $ | 47 | | | $ | 65 | |
Housing revenue decreased $26 million for the year ended December 31, 2011 when compared to the same period in 2010. The market in the Central and Eastern U.S. segment continues to remain difficult where fewer home closings are the primary reason for the decrease in housing revenue. This was partially offset by an increase in the average home selling price during the period due to product mix. Cost of sales decreased $18 million as a result of lower home closings for the year ended December 31, 2011, when compared to the same periods in 2010.
Home Sales – Incentives
We grant our homebuyers sales incentives from time-to-time in order to promote sales of our homes. These incentives will vary by type of incentive and by amount on a community-by-community and home-by-home basis. Incentives that impact the value of the home or the sales price paid, such as additional options, are reflected as a reduction to sales revenue. Incentives that we pay to an outside party, such as paying some or all of a homebuyer’s closing costs, are recorded as cost of sales. Incentives are recognized at the time the home is delivered to the homebuyer and we receive the sales proceeds. Our incentives on homes closed by reportable segment for the years ended December 31, 2011 and 2010 were as follows:
| | | | | | | | | | | | | | | | |
| | | Years Ended December 31 | |
| | | 2011 | | | 2010 | |
| (US$ millions) | | Incentives
Recognized | | | % of Gross
Revenues | | | Incentives
Recognized | | | % of Gross
Revenues | |
Canada | | $ | 11 | | | | 3 | % | | $ | 9 | | | | 3 | % |
California | | | 7 | | | | 6 | % | | | 15 | | | | 7 | % |
Central and Eastern U.S. | | | 6 | | | | 10 | % | | | 7 | | | | 8 | % |
| | | | | | | | | | | | | | | | |
| | $ | 24 | | | | 5 | % | | $ | 31 | | | | 5 | % |
| | | | | | | | | | | | | | | | |
Home Sales – Net New Home Orders
Net new home orders for the year ended December 31, 2011 totalled 1,635 units, an increase of 233 units when compared to the same period in 2010. Net new home orders for any period represent the aggregate of all homes ordered by customers, net of cancellations. The increase is a result of continued strong Canadian market performance partially offset by a slow spring selling season in the U.S. Average monthly sales per community by reportable segment for the year ended December 31, 2011,
| | |
| Brookfield Residential Properties Inc. | | 9 |
were: Canada – 7.2 units (2010 – 6.0 units); California – 2.2 units (2010 – 2.5 units); and Central and Eastern U.S. – 1.7 units (2010 – 2.1 units). We were selling from 33 active housing communities at December 31, 2011 compared to 32 at December 31, 2010. The net new home orders for the years ended December 31, 2011 and 2010 by reportable segment were as follows:
| | | | | | | | |
| | | Years Ended December 31 | |
| (Units) | | 2011 | | | 2010 | |
| | |
Canada | | | 1,205 | | | | 930 | |
California | | | 215 | | | | 294 | |
Central and Eastern U.S. | | | 164 | | | | 176 | |
Unconsolidated Entities | | | 51 | | | | 2 | |
| | | | | | | | |
| | | 1,635 | | | | 1,402 | |
| | | | | | | | |
The cancellation rates for the years ended December 31, 2011 and 2010 by reportable segment were as follows:
| | | | | | | | | | | | | | | | |
| | | Years Ended December 31 | |
| | | 2011 | | | 2010 | |
| (Units) | | Units | | | % | | | Units | | | % | |
| | | | |
Canada | | | 5 | | | | < 1 | % | | | 11 | | | | 1 | % |
California | | | 46 | | | | 18 | % | | | 62 | | | | 18 | % |
Central and Eastern U.S. | | | 52 | | | | 24 | % | | | 62 | | | | 26 | % |
| | | | | | | | | | | | | | | | |
| | | 103 | | | | 6 | % | | | 135 | | | | 9 | % |
| | | | | | | | | | | | | | | | |
Home Sales – Backlog
Our backlog, which represents the number of new homes subject to sales contracts, at December 31, 2011 and 2010 by reportable segment, was as follows:
| | | | | | | | | | | | | | | | |
| | | At December 31 | |
| | | 2011 | | | 2010 | |
| (US$ millions, except unit activity) | | Units | | | $ millions | | | Units | | | $ millions | |
| | | | |
Canada | | | 554 | | | $ | 215 | | | | 292 | | | $ | 106 | |
California | | | 24 | | | | 10 | | | | 47 | | | | 27 | |
Central and Eastern U.S. | | | 67 | | | | 39 | | | | 37 | | | | 18 | |
Unconsolidated Entities | | | 14 | | | | — | | | | 1 | | | | — | |
| | | | | | | | | | | | | | | | |
| | | 659 | | | $ | 264 | | | | 377 | | | $ | 151 | |
| | | | | | | | | | | | | | | | |
We expect all 659 units of our backlog to close in 2012 and 2013, subject to future cancellations. The units and value of our backlog at December 31, 2011 is higher when compared to the prior period due to stronger sales.
Selling, General and Administrative Expense
Selling, general and administrative expense was $101 million for the year ended December 31, 2011, compared to $99 million for the same period in 2010. The components of the expense for the years ended December 31, 2011 and 2010 are summarized as follows:
| | | | | | | | |
| | | Years Ended December 31 | |
| (US$ millions) | | 2011 | | | 2010 | |
| | |
General and administrative expense | | $ | 70 | | | $ | 64 | |
Sales and marketing expense | | | 30 | | | | 33 | |
Share-based compensation | | | (2 | ) | | | 3 | |
Change in fair value of equity swap contracts | | | 3 | | | | (1 | ) |
| | | | | | | | |
| | $ | 101 | | | $ | 99 | |
| | | | | | | | |
The $2 million increase in selling, general and administrative expense relates to the fair value adjustment of the equity swap contracts related to the deferred share unit plan, partially offset by the decrease in the liability related to share-based compensation plans.
Equity in Earnings from Unconsolidated Entities
Equity in earnings from unconsolidated entities for the year ended December 31, 2011 totalled $4 million compared to nil for the same period in 2010.
Other (Expense) / Income
Other (expense) / income for the year ended December 31, 2011 was an expense of nil, a decrease of $25 million when compared to the same period in 2010. The decrease is a result of a reduction of interest income within the Canadian operations and fee income from California for the year ended December 31, 2011.
The components of other (expense) / income for years ended December 31, 2011 and 2010 are summarized as follows:
| | | | | | | | |
| | | Years Ended December 31 | |
| (US$ millions) | | 2011 | | | 2010 | |
| | |
Change in fair value of interest rate swap contracts | | $ | (7 | ) | | $ | (1 | ) |
Other | | | 7 | | | | 26 | |
| | | | | | | | |
| | $ | — | | | $ | 25 | |
| | | | | | | | |
Income Tax Expense
Income tax expense for the year ended December 31, 2011 was $125 million, an increase of $67 million when compared to the same period in 2010. The increase is primarily due to the valuation allowance taken on the U.S. deferred tax asset in the first quarter of 2011 of $71 million, partially offset by a reduction in current taxes due to lower income before taxes.
Foreign Exchange Translation
The consolidated financial statements are presented in U.S. dollars, which is the functional currency of the Company and the presentation currency of the consolidated financial statements.
Assets and liabilities of subsidiaries or equity accounted investees having a functional currency other than the U.S. dollar are translated at the rate of exchange on the balance sheet date. Revenues and expenses are translated at average rates for the period, unless exchange rates fluctuated significantly during the period, in which case the exchange rates at the dates of the transaction are used. The resulting foreign currency translation adjustments are recognized in other comprehensive income (“OCI”).
The financial results of our Canadian operations are translated into U.S. dollars for financial reporting purposes. Foreign currency translation gains and losses are recorded as the exchange rate between the two currencies fluctuates. These gains and losses are included in comprehensive income and accumulated other comprehensive income. The translation of our Canadian results yields a gain of $11 million for the year ended December 31, 2011 compared to a gain of $35 million in the same period of 2010. Foreign translation consequently results in a $24 million reduction of year over year comprehensive income.
Quarterly Financial Data
| | | | | | | | | | | | | | | | | | | | | | | | | | | | | | | | |
| | | 2011 | | | 2010 | |
| (US$ millions, except per share amounts) | | Q4 | | | Q3 | | | Q2 | | | Q1 | | | Q4 | | | Q3 | | | Q2 | | | Q1 | |
| | | | | | | | |
Revenue | | $ | 364.5 | | | $ | 227.9 | | | $ | 235.5 | | | $ | 180.1 | | | $ | 299.5 | | | $ | 240.2 | | | $ | 273.1 | | | $ | 141.4 | |
Direct cost of sales | | | (276.7 | ) | | | (157.8 | ) | | | (180.7 | ) | | | (124.8 | ) | | | (227.5 | ) | | | (166.4 | ) | | | (193.4 | ) | | | (99.9 | ) |
| | | | | | | | | | | | | | | | | | | | | | | | | | | | | | | | |
Gross margin | | | 87.8 | | | | 70.1 | | | | 54.8 | | | | 55.3 | | | | 72.0 | | | | 73.8 | | | | 79.7 | | | | 41.5 | |
Selling, general and administrative expense | | | (28.7 | ) | | | (26.7 | ) | | | (19.2 | ) | | | (26.4 | ) | | | (26.8 | ) | | | (23.7 | ) | | | (25.6 | ) | | | (23.2 | ) |
Other income | | | 1.5 | | | | (3.1 | ) | | | 1.5 | | | | 0.3 | | | | 14.3 | | | | 2.2 | | | | 3.1 | | | | 2.1 | |
Interest expense | | | (11.6 | ) | | | (11.3 | ) | | | (10.9 | ) | | | (3.3 | ) | | | — | | | | — | | | | — | | | | — | |
| | | | | | | | | | | | | | | | | | | | | | | | | | | | | | | | |
Income before income taxes | | | 49.0 | | | | 29.0 | | | | 26.2 | | | | 25.9 | | | | 59.5 | | | | 52.3 | | | | 57.2 | | | | 20.4 | |
Income tax expense | | | (24.0 | ) | | | (10.3 | ) | | | (7.4 | ) | | | (83.7 | ) | | | (18.7 | ) | | | (17.9 | ) | | | (17.9 | ) | | | (4.0 | ) |
| | | | | | | | | | | | | | | | | | | | | | | | | | | | | | | | |
Net income / (loss) | | | 25.0 | | | | 18.7 | | | | 18.8 | | | | (57.8 | ) | | | 40.8 | | | | 34.4 | | | | 39.3 | | | | 16.4 | |
Net (income) / loss attributable to non-controlling interest and other interest in consolidated subsidiaries | | | 0.8 | | | | 0.5 | | | | 0.4 | | | | 0.8 | | | | 0.2 | | | | 0.1 | | | | (0.1 | ) | | | 1.3 | |
| | | | | | | | | | | | | | | | | | | | | | | | | | | | | | | | |
Net income / (loss) attributable to Brookfield Residential | | $ | 25.8 | | | $ | 19.2 | | | $ | 19.2 | | | $ | (57.0 | ) | | $ | 41.0 | | | $ | 34.5 | | | $ | 39.2 | | | $ | 17.7 | |
| | | | | | | | | | | | | | | | | | | | | | | | | | | | | | | | |
Foreign currency translation | | | 1.5 | | | | (4.0 | ) | | | 0.3 | | | | 13.4 | | | | 18.2 | | | | 26.0 | | | | (35.6 | ) | | | 26.5 | |
| | | | | | | | | | | | | | | | | | | | | | | | | | | | | | | | |
Comprehensive income / (loss) | | $ | 27.3 | | | $ | 15.2 | | | $ | 19.5 | | | $ | (43.6 | ) | | $ | 59.2 | | | $ | 60.5 | | | $ | 3.6 | | | $ | 44.2 | |
| | | | | | | | | | | | | | | | | | | | | | | | | | | | | | | | |
| | | | | | | | |
Earnings / (loss) per common share | | | | | | | | | | | | | | | | | | | | | | | | | | | | | | | | |
Basic | | $ | 0.25 | | | $ | 0.19 | | | $ | 0.19 | | | $ | (0.56 | ) | | $ | 0.36 | | | $ | 0.29 | | | $ | 0.34 | | | $ | 0.13 | |
Diluted | | $ | 0.25 | | | $ | 0.19 | | | $ | 0.19 | | | $ | (0.56 | ) | | $ | 0.35 | | | $ | 0.29 | | | $ | 0.34 | | | $ | 0.13 | |
We have historically experienced variability in our results of operations from quarter to quarter due to the seasonal nature of the homebuilding business and the timing of new community openings and the closing out of projects. We typically experience the highest rate of orders for new homes and lots in the first six months of the calendar year, although the rate of orders for
| | |
| Brookfield Residential Properties Inc. | | 11 |
new homes is highly dependent upon the number of active communities. As new home deliveries trail orders for new homes by several months, we typically deliver a greater percentage of new homes in the second half of the year compared with the first half of the year. As a result, our revenues from sales of homes are generally higher in the second half of the year.
Fourth Quarter
Net income for the three months ended December 31, 2011 totalled $26 million, compared to net income of $41 million for the three months ended December 31, 2010. The decrease was primarily a result of the interest expense of $12 million with the addition of the notes that were issued to Brookfield Office Properties in connection with the merger.
For the three months ended December 31, 2011, land revenue totalled $165 million, compared to $108 million for the same period of 2010. Approximately $36 million of the increase was due to the change in business practice under U.S. GAAP. Excluding the non-recurring lot closings, land revenue for the three months ended December 31, 2011 increased by $21 million in comparison to the same period of 2010.
For the three months ended December 31, 2011, housing revenue totalled $199 million, compared to $191 million for the same period of 2010. Home closings for the three months ended December 31, 2011 increased by approximately 5% in comparison to the same period in 2010. The revenue increase was due to increased volumes. The increase in home orders in the fourth quarter, particularly in Canada, has resulted in a higher backlog of 659 homes entering 2012, a 75% increase over the same period in 2010.
Due to inclement weather in the spring of 2011 pushing a significant amount of home closings to December, the revenue in the last quarter of 2011 was higher than in 2010. Cost of sales rose correspondingly with the increase in revenue and gross margin as a percentage of revenue was consistent at 24%.
The decrease in net income of $15 million is the result of higher selling, general and administrative expense of $2 million mainly resulting from an increase in share-based compensation expense of $1 million and a reduction of income on the equity swap of $1 million, a decrease in other income of $13 million stemming from reduced interest and fee income, an increase in interest expense of $12 million mainly from interest on the transaction debt note payable and an increase in income tax expense of $5 million. This was offset by an increase in gross margin of $16 million from the increase in revenue.
Liquidity and Capital Resources
Financial Position
The following is a summary of the consolidated balance sheets as of December 31, 2011 and December 31, 2010:
| | | | | | | | |
| | | December 31 | |
| | | 2011 | | | 2010 | |
Land and housing inventory | | $ | 2,113 | | | $ | 2,194 | |
Investments in unconsolidated entities | | | 144 | | | | 137 | |
Receivables and other assets | | | 311 | | | | 218 | |
Cash and restricted cash | | | 11 | | | | 12 | |
Deferred income tax assets | | | — | | | | 75 | |
| | | | | | | | |
| | $ | 2,579 | | | $ | 2,636 | |
| | | | | | | | |
| | |
Project specific and other financings | | $ | 826 | | | $ | 1,025 | |
Notes payable | | | 470 | | | | — | |
Accounts payable and other liabilities | | | 247 | | | | 289 | |
Deferred income tax liabilities | | | 28 | | | | — | |
Other interests in consolidated subsidiaries | | | 32 | | | | 42 | |
Total equity | | | 976 | | | | 1,280 | |
| | | | | | | | |
| | $ | 2,579 | | | $ | 2,636 | |
| | | | | | | | |
Assets
Our assets as of December 31, 2011 totalled $2,579 million, a decrease of $57 million compared to December 31, 2010. The decrease was due primarily to the translation of the Canadian operations’ assets at the lower exchange rate at December 31, 2011 and the previously disclosed valuation allowance against the U.S. deferred tax asset of $71 million recorded in the first quarter of 2011. Our land and housing inventory and investments in unconsolidated entities are our most significant assets with a combined book value of $2,257 million, or approximately 88% of our total assets. Our land and housing assets include land under and land held for development, lots ready for construction, homes completed and under construction and model homes.
A summary of our lots owned, excluding lot options, and their stage of development at December 31, 2011 compared with December 31, 2010 follows:
| | | | | | | | |
| | | December 31 | |
| | | 2011 | | | 2010 | |
Land held for future development | | | 91,446 | | | | 90,123 | |
Land under development and finished lots | | | 8,096 | | | | 9,377 | |
Housing units, including models | | | 797 | | | | 1,013 | |
| | | | | | | | |
| | | 100,339 | | | | 100,513 | |
| | | | | | | | |
Project Specific and Other Financings
Our project specific and other financings as of December 31, 2011 were $826 million, a decrease of $199 million from December 31, 2010. Our project specific and other financings represent construction and development loans and facilities that are used to fund the operations of our communities as new homes are constructed. Interest charged under project specific and other financings include LIBOR and prime rate pricing options. As of December 31, 2011, the weighted average interest rate on our project specific and other financings was 4.15%.
Our net debt to total capitalization ratio as of December 31, 2011, which we define as total interest-bearing debt less cash divided by total interest-bearing debt less cash plus equity and other interests in consolidated subsidiaries was 56%, compared to 44% at December 31, 2010. The increase was due to the addition of the transaction notes payable discussed below.
The debt maturing in 2012 and 2013 onwards is expected to be repaid from home and/or lot deliveries over this period or extended. Additionally, as of December 31, 2011, we had project specific debt and bank indebtedness of $339 million that was available to complete land development and construction activities. The “Cash Flow” section below discusses future available capital resources should proceeds from our future home and/or lot closings not be sufficient to repay our debt obligations.
Project specific and other financings consist of the following:
| | | | | | | | |
| | | December 31 | |
| | | 2011 | | | 2010 | |
| | |
Project specific financings (a) | | $ | 249 | | | $ | 240 | |
Bank indebtedness (b) | | | 351 | | | | 421 | |
Due to affiliates (c) | | | 226 | | | | 364 | |
| | | | | | | | |
| | $ | 826 | | | $ | 1,025 | |
| | | | | | | | |
| (a) | Project specific financings |
Project specific financings of $249 million (December 31, 2010 – $240 million) provided by a variety of lenders are revolving, bear interest at floating and fixed interest rates at a weighted average rate of 4.0% as at December 31, 2011 (December 31, 2010 – 3.9%) and are secured by land and housing inventory. The weighted average rate was calculated as of the end of each period, based upon the amount of debt balances outstanding and the related interest rates applicable on that date. Project specific financings consist of the following:
| | | | | | | | |
| | | December 31 | |
| | | 2011 | | | 2010 | |
| | |
Secured facilities (i) | | $ | 201 | | | $ | 217 | |
Secured VTB mortgages (ii) | | | 48 | | | | 23 | |
| | | | | | | | |
| | $ | 249 | | | $ | 240 | |
| | | | | | | | |
| (i) | Project specific financings totalling $174 million (December 31, 2010 – $170 million) have variable interest rates ranging from prime to LIBOR plus 3.5% and fixed rates ranging from 1.5% to 6.0%. The facilities are secured by the land and housing inventory assets to which the borrowings relate. These facilities require Brookfield Homes Holdings LLC, an indirect wholly-owned subsidiary of the Company, to maintain a tangible net worth of at least $325 million, a net indebtedness to capitalization ratio of no greater than 65% and a net indebtedness to tangible net worth ratio of no greater than 2.50 to 1. Indebtedness is defined as total interest-bearing debt plus non-interest bearing liabilities less cash. At December 31, 2011, we were in compliance with all of our project specific financing covenants. The following are computations of the most restrictive of Brookfield Homes Holdings LLC’s tangible net worth, net indebtedness to capitalization ratio, and net indebtedness to tangible net worth debt ratio covenants: |
| | | | | | | | |
| | | Covenant | | | Actual as at
December 31
2011 | |
| | |
Tangible net worth(US$ millions) | | $ | 325 | | | $ | 514 | |
Net indebtedness to capitalization | | | 65 | % | | | 50 | % |
Net indebtedness to tangible net worth | | | 2.50 to 1 | | | | 1 to 1 | |
| | | | | | | | |
| | |
| Brookfield Residential Properties Inc. | | 13 |
Project specific financings totalling $19 million (December 31, 2010 – $47 million) have floating interest rates ranging from the lower of prime less 0.5% to prime, with some facilities having a floor of 5.0% to 5.3%. The remainder of this debt bears fixed interest rates ranging from 5.5% to 6.0% and is secured by land and water rights to which the borrowings relate. These credit facilities require Brookfield Residential (US) LLC, an indirect wholly-owned subsidiary of the Company, to maintain a tangible net worth of at least $80 million and a debt to tangible net worth ratio of no greater than 1.25 to 1. At December 31, 2011, we were in compliance with all of our project specific financing covenants.
The following are computations of Brookfield Residential (US) LLC’s tangible net worth and debt to tangible net worth ratio covenants:
| | | | | | | | |
| | | Covenant | | | Actual as at
December 31
2011 | |
| | |
Tangible net worth(US$ millions) | | $ | 80 | | | $ | 391 | |
Debt to tangible net worth | | | 1.25 to 1 | | | | 0.09 to 1 | |
| | | | | | | | |
Project specific financings totalling $8 million (December 31, 2010 – nil) have floating interest rates ranging from the lower of LIBOR plus 3.0% and a floor of 3.3% and are secured by land and water rights to which the borrowings relate. These credit facilities require Brookfield Residential (US) LLC, an indirect wholly-owned subsidiary of the Company, to maintain a tangible net worth of at least $200 million and a net indebtedness to capitalization ratio of no greater than 65%. Indebtedness is defined as total interest-bearing debt plus non-interest bearing liabilities less cash. At December 31, 2011, we were in compliance with all of our project specific financing covenants. The following are computations of Brookfield Residential (US) LLC’s tangible net worth and debt to tangible net worth ratio covenants:
| | | | | | | | |
| | | Covenant | | | Actual as at
December 31
2011 | |
| | |
Tangible net worth(US$ millions) | | $ | 200 | | | $ | 391 | |
Net indebtedness to capitalization | | | 65 | % | | | 18 | % |
| | | | | | | | |
| (ii) | $48 million (December 31, 2010 – $23 million) of project specific financings consist of 14 secured VTB mortgages (December 31, 2010 – 11 secured VTB mortgages). |
Eleven secured VTB mortgages (December 31, 2010 – nine secured VTB mortgages) in the amount of $42 million (December 31, 2010 – $20 million) relate to raw land held for development by Brookfield Residential (Alberta) LP and Brookfield Homes (Ontario) Limited. This debt is repayable in Canadian dollars of C$43 million (December 31, 2010 – C$19 million). The interest rate on this debt ranges from 3.3% to 6.0% and the debt is secured by related lands. As at December 31, 2011, these borrowings have not been subject to financial covenants.
Two secured VTB mortgages (December 31, 2010 – one secured VTB mortgage) in the amount of $5 million (December 31, 2010 – $2 million) relates to raw land held for development by Brookfield Homes Holdings LLC. The interest rate on this debt is fixed at 5.0% and 10.0% and the debt is secured by related lands. As at December 31, 2011, these borrowings have not been subject to any financial covenants.
One secured VTB mortgage (December 31, 2010 – one secured VTB mortgage) in the amount of $1 million (December 31, 2010 – $1 million) relates to raw land held for development by Brookfield Residential (US) LLC. The interest rate on this debt is fixed at 6.0% and the debt is secured by related lands. As at December 31, 2011, these borrowings have not been subject to financial covenants.
The Company has four secured credit facilities with various Canadian banking lenders totalling $342 million (December 31, 2010 – $421 million) and one unsecured credit facility with a U.S. bank totalling $9 million (December 31, 2010 – nil). Based on the borrowing-base calculations at December 31, 2011, the availability on our bank indebtedness was $144 million. Bank indebtedness consists of the following:
| | | | | | | | |
| | | December 31 | |
| | | 2011 | | | 2010 | |
| | |
Secured credit facilities (i) | | $ | 342 | | | $ | 421 | |
Unsecured credit facility (ii) | | | 9 | | | | — | |
| | | | | | | | |
| | $ | 351 | | | $ | 421 | |
| | | | | | | | |
| (i) | Bank indebtedness totalling $342 million (December 31, 2010 – $421 million) is repayable in Canadian dollars in the amount of C$349 million (December 31, 2010 – C$421 million) and allows the Company to borrow up to approximately C$534 million (US$522 million) as at December 31, 2011 (December 31, 2010 – C$517 million (US$517 million)). The credit facilities bear interest between Canadian prime plus 0.5% to 1.0% for any amounts drawn and are repayable on demand with a term out period ranging from 90 to 364 days. The secured facilities are secured by fixed and floating charges over the land and housing inventory assets of the Canadian operations, a general charge over all assets relating to Canadian operations and a general charge over Brookfield Residential (Alberta) LP and Brookfield Homes (Ontario) Limited. |
These facilities require Brookfield Residential (Alberta) LP, an indirect wholly-owned subsidiary of the Company, to maintain a minimum tangible net worth of $294 million and a debt to equity ratio of no greater than 1.75 to 1. At December 31, 2011, we were in compliance with all of our covenants relating to bank indebtedness. The following are computations of Brookfield Residential (Alberta) LP’s tangible net worth and debt to equity ratio covenants:
| | | | | | | | |
| | | | | | Actual as at | |
| | | Covenant | | | December 31
2011 | |
| | |
Tangible net worth(US$ millions) | | $ | 294 | | | $ | 490 | |
Debt to equity | | | 1.75 to 1 | | | | 0.70 to 1 | |
| | | | | | | | |
The facilities also require Brookfield Homes (Ontario) Limited, an indirect wholly-owned subsidiary of the Company, to maintain a minimum tangible net worth of $78 million and a debt to tangible net worth ratio of no greater than 2.00 to 1. At December 31, 2011, we were in compliance with all of our covenants relating to bank indebtedness. The following are computations of Brookfield Homes (Ontario) Limited’s tangible net worth and debt to tangible net worth covenants:
| | | | | | | | |
| | | | | | Actual as at | |
| | | Covenant | | | December 31
2011 | |
| | |
Tangible net worth(US$ millions) | | $ | 78 | | | $ | 110 | |
Debt to tangible net worth | | | 2.00 to 1 | | | | 0.82 to 1 | |
| | | | | | | | |
| (ii) | Bank indebtedness totalling $9 million (December 31, 2010 – nil) is repayable in U.S. dollars and allows the Company to borrow up to $10 million as at December 31, 2011. The credit facility bears an interest rate of LIBOR plus 3%. The facility requires Brookfield Homes Holdings LLC, an indirect wholly-owned subsidiary of the Company, to maintain a tangible net worth of at least $300 million and a net indebtedness to tangible net worth ratio of no greater than 2.50 to 1. Indebtedness is defined as total interest-bearing debt plus non-interest bearing liabilities less cash. At December 31, 2011, we were in compliance with all of our project specific financing covenants. The following are computations of Brookfield Homes Holdings LLC’s tangible net worth and net indebtedness to tangible net worth debt ratio covenants: |
| | | | | | | | |
| | | | | | Actual as at | |
| | | Covenant | | | December 31
2011 | |
| | |
Tangible net worth(US$ millions) | | $ | 300 | | | $ | 514 | |
Net indebtedness to tangible net worth | | | 2.50 to 1 | | | | 1 to 1 | |
| | | | | | | | |
Amounts due to affiliates include $226 million (December 31, 2010 – $364 million) on an unsecured revolving operating facility with a subsidiary of our largest shareholder, Brookfield Asset Management Inc. At December 31, 2011, the availability on this facility was $74 million. The revolving operating facility is in a principal amount not to exceed $300 million. This facility matures December 2015, bears interest at LIBOR plus 4.5% and could be fully drawn upon without violation of any covenants.
At December 31, 2011, our revolving operating facility with a subsidiary of Brookfield Asset Management Inc. required Brookfield Residential US Corporation, a direct wholly-owned subsidiary of the Company, to maintain minimum shareholders’ equity of $300 million and a consolidated net debt to capitalization ratio of no greater than 65%. At December 31, 2011, we were in compliance with all of our covenants. The following are computations of Brookfield Residential US Corporation’s minimum shareholders’ equity and net debt to capitalization ratio covenants:
| | | | | | | | |
| | | | | | Actual as at | |
| | | Covenant | | | December 31
2011 | |
| | |
Minimum shareholders’ equity(US$ millions) | | $ | 300 | | | $ | 589 | |
Net debt to capitalization | | | 65 | % | | | 54 | % |
| | | | | | | | |
| | |
| Brookfield Residential Properties Inc. | | 15 |
Notes Payable
Notes payable consists of the following:
| | | | | | | | |
| | | December 31 | |
| (US$ millions) | | 2011 | | | 2010 | |
| | |
Senior note payable (a) | | $ | 259 | | | $ | — | |
Junior note payable (b) | | | 211 | | | | — | |
| | | | | | | | |
| | $ | 470 | | | $ | — | |
| | | | | | | | |
On March 31, 2011, the Company issued two promissory notes payable to Brookfield Office Properties, a C$265 million (US$273 million) senior note and a C$215 million (US$222 million) junior subordinated note.
| (a) | The senior note had a fixed rate of interest of 6.5% and a term to December 31, 2015 with principal payments of C$50 million due on each of the last business days of 2012, 2013 and 2014 and the balance of C$115 million to be paid on December 31, 2015. On November 2, 2011, Brookfield Office Properties and the Company agreed to amend the terms of the $265 million of senior note transaction debt such that the scheduled principal payments of C$50 million during each of the next three years will be due along with the final payment of C$115 million on December 31, 2015. These extended payments will bear interest from the date of the amendment at a fixed rate of 7.5%. |
| (b) | The C$215 million junior subordinated note bears a fixed rate of interest of 8.5% and is payable in full on December 31, 2020. |
At December 31, 2011, our notes payable due to Brookfield Office Properties required Brookfield Residential to maintain minimum shareholders’ equity of $750 million and a consolidated net debt to capitalization ratio of no greater than 65%. At December 31, 2011, we were in compliance with all of our covenants relating to notes payable. The following are computations of Brookfield Residential’s minimum shareholders’ equity and net debt to capitalization ratio covenants:
| | | | | | | | |
| | | | | | Actual as at | |
| | | Covenant | | | December 31
2011 | |
| | |
Minimum shareholders’ equity(US$ millions) | | $ | 750 | | | $ | 976 | |
Net debt to capitalization | | | 65 | % | | | 56 | % |
| | | | | | | | |
Cash Flow
Our principal uses of working capital include purchases of land, land development and home construction. Cash flows for each of our communities depend upon the applicable stage of the development cycle and can differ substantially from reported earnings. Early stages of development require significant cash outlays for land acquisitions, site approvals and entitlements, construction of model homes, roads, certain utilities and other amenities and general landscaping. As these costs are capitalized, earnings reported for financial statement purposes during such early stages may significantly exceed cash flows. Later, cash flows can exceed earnings reported for financial statement purposes, as cost of sales includes charges for substantial amounts of previously expended costs.
We believe that we currently have sufficient access to capital resources and will continue to use our available capital resources to fund our operations. Our future capital resources include cash flow from operations, borrowings under project and other credit facilities and proceeds from potential future debt issues or equity offerings, if required.
The net cash flows for the years ended December 31, 2011 and 2010 are as follows:
| | | | | | | | |
| | | Years Ended December 31 | |
| (US$ millions) | | 2011 | | | 2010 | |
| | |
Cash flows from operating activities | | $ | 23 | | | $ | 215 | |
Cash flows used in investing activities | | | (6 | ) | | | (34 | ) |
Cash flows used in financing activities | | | (19 | ) | | | (185 | ) |
Cash flow from operating activities during the twelve months ended December 31, 2011 totalled $23 million, which included $140 million of acquisitions made during the period. The Company works to balance being opportunistic on new acquisitions together with debt reduction.
Cash used in our investing activities for the year ended December 31, 2011 was $6 million, a decrease of $28 million when compared to the same period in 2010. The decrease was primarily a result of a decrease in investments in unconsolidated entities of $26 million, an increase in distributions from unconsolidated entities of $5 million offset by an increase in restricted cash of $3 million.
Cash used in our financing activities for the year ended December 31, 2011 was $19 million, compared with cash used by financing activities of $185 million for the same period in 2010. The cash used in the year ended December 31, 2011 was primarily from net drawings under project specific and other financings of $187 million offset by cash used to pay the 2010 preferred stock dividends of $10 million in the first quarter of 2011 and $19 million to fund the repurchase of common shares for the escrowed stock plan described in Note 12(a) of the consolidated financial statements included elsewhere in this annual report.
Contractual Obligations and Other Commitments
A summary of our contractual obligations and purchase agreements as of December 31, 2011 is as follows:
| | | | | | | | | | | | | | | | | | | | |
| | | Payment Due by Period | |
| (US$ millions) | | Total | | | Less than
1 Year | | | 1 – 3
Years | | | 3 – 5
Years | | | More than
5 Years | |
| | | | | |
Project specific and other financings(1)(2) | | $ | 826 | | | $ | 482 | | | $ | 108 | | | $ | 230 | | | $ | 6 | |
Operating lease obligations(3) | | | 27 | | | | 5 | | | | 10 | | | | 6 | | | | 6 | |
Purchase agreements(4) | | | 70 | | | | 49 | | | | 14 | | | | 7 | | | | — | |
| | | | | | | | | | | | | | | | | | | | |
| | $ | 923 | | | $ | 536 | | | $ | 132 | | | $ | 243 | | | $ | 12 | |
| | | | | | | | | | | | | | | | | | | | |
| (1) | Amounts are included on the consolidated balance sheets. See Note 6 to the consolidated financial statements for additional information regarding project specific and other financings and related matters. |
| (2) | Amounts do not include interest due to the floating nature of our debt. See Note 6 to the consolidated financial statements for additional information regarding our floating rate debt. |
| (3) | Amounts relate to non-cancellable operating leases involving office space, design centres and model homes. |
| (4) | Amounts represent our expected acquisition of land under options or purchase agreements. See Note 14 to the consolidated financial statements for additional information regarding purchase agreements. |
Shareholders’ Equity
At February 17, 2012, 101,592,718 common shares and 70,002 preferred shares in the capital of the Company were issued and outstanding. In addition, Brookfield Residential has a stock option plan under which key officers and employees are granted options to purchase Brookfield Residential common shares. Each option granted can be exercised for one common share. At February 17, 2012, 2,923,426 options were outstanding under the stock option plan.
Off-Balance Sheet Arrangements
In the ordinary course of business, and where market conditions permit, we use land and lot option contracts and unconsolidated entities to acquire control of land to mitigate the risk of declining land values. Option contracts for the purchase of land permit us to control the land for an extended period of time until options expire. This reduces our financial risk associated with land holdings. As of December 31, 2011, we had $58 million of primarily non-refundable option deposits and advanced costs. The total remaining exercise price of these options was $144 million. Pursuant to the guidance now incorporated in ASC Topic 810Consolidation, as described in Note 2 to our consolidated financial statements included elsewhere in this annual report, we have consolidated $16 million of these option contracts where we consider we have the majority economic interest in the assets held under the options.
We also own 3,703 lots and control under option 1,842 lots through our proportionate share of unconsolidated entities. As of December 31, 2011, our investment in unconsolidated entities totalled $144 million. We have provided varying levels of guarantees of debt in our unconsolidated entities. As of December 31, 2011, we had completion guarantees of $4 million and limited maintenance guarantees of $12 million with respect to debt in our unconsolidated entities. During the year ended December 31, 2011, we did not make any loan re-margin repayments on the debt in our unconsolidated entities. Please refer to Note 3 to our consolidated financial statements included elsewhere in this annual report for additional information about our investments in unconsolidated entities.
We obtain letters of credit, performance bonds and other bonds to support our obligations with respect to the development of our projects. The amount of these obligations outstanding at any time varies in accordance with our development activities. If these letters of credit or bonds are drawn upon, we will be obligated to reimburse the issuer of the letter of credit or bonds. As of December 31, 2011, we had $49 million in letters of credit outstanding and $189 million in performance bonds for these purposes. The costs to complete related to our letters of credit and performance bonds are $21 million and $98 million, respectively.
| | |
| Brookfield Residential Properties Inc. | | 17 |
Transactions Between Related Parties
There are agreements among our affiliates to which we are a party or subject to, including a name license, one unsecured revolving credit facility and two notes payable. Related parties include the directors, executive officers, director nominees or 5% shareholders, and their respective immediate family members. The Company’s significant related party transactions as of December 31, 2011 were:
| • | | Notes payable of $470 million (December 31, 2010 – nil) are due to Brookfield Office Properties, an affiliate of the Company. The notes consist of a C$265 million senior unsecured promissory note and a C$215 million junior unsecured promissory note. For the years ended December 31, 2011 and 2010, interest of $27 million and nil, respectively, was incurred relating to these facilities. |
| • | | Unsecured revolving operating facility in the aggregate principal amount of $226 million (December 31, 2010 – $160 million) with a subsidiary of Brookfield Asset Management Inc. For the years ended December 31, 2011 and 2010, interest of $15 million and $10 million, respectively, was incurred relating to this facility. |
| • | | A subsidiary of the Company entered into an agreement to purchase two million common shares of the Company from Brookfield Asset Management Inc. in order to fund an escrowed stock plan without dilution to shareholders on June 23, 2011. The total consideration relating to the purchase of the shares was $19 million (2010 – nil). |
Critical Accounting Policies and Estimates
The discussion and analysis of our financial condition and results of operations is based upon the consolidated financial statements of Brookfield Residential, which have been prepared in accordance with accounting principles generally accepted in the United States. The preparation of these financial statements requires us to make assumptions, estimates and judgments that affect the carrying amounts of assets, liabilities, revenues and expenses, and the related disclosure of contingent assets and liabilities. Significant areas where judgment is applied include asset valuations, investments in unconsolidated entities, assessment of variable interest entities, tax provisions, warranty costs, valuation of financial instruments, deferred income tax assets and liabilities, accrued liabilities and contingent liabilities including litigation. Our actual results may differ materially from these estimates under different assumptions or conditions.
Our most critical accounting policies are those that we believe are the most important in portraying our financial condition and results of operations, and require the most subjectivity and estimates by our management. A summary of our significant accounting policies, including the critical accounting policies discussed below, is provided in the notes to the consolidated financial statements of the Company included elsewhere in this annual report.
Revenue Recognition
Revenues from the sale of homes are recognized when title passes to the purchaser upon closing, wherein all proceeds are received or collectability is evident. Land sales are recognized when title passes to the purchaser upon closing, all material conditions of the sales contract have been met and a significant cash down payment or appropriate security is received and collectability is evident.
Carrying Values
In accordance with the United States Financial Accounting Standards Board (“FASB”) Accounting Standards Codification (“ASC”) Topic 360Property, Plant and Equipment, housing and land assets that we own directly and through unconsolidated entities are reviewed for recoverability on a regular basis and whenever events or changes in circumstances indicate that the carrying amount of an asset may not be recoverable. Recoverability is measured by comparing the carrying amount of an asset to future undiscounted cash flows expected to be generated by the asset. To arrive at the estimated fair value of housing and land inventory impaired, we estimate the cash flow for the life of each project. Specifically, on a housing project, we evaluate the margins on homes that have been closed, margins on sales contracts which are in backlog and estimated margins with regard to future home sales over the life of the project. On a land project, we estimate the timing of future land sales and the estimated revenue per lot, as well as estimated margins with respect to future land sales. For the housing and land inventory, we continuously evaluate projects where inventory is turning over more slowly than expected or whose average sales price and margins are declining and are expected to continue to decline. These projections take into account the specific business plans for each project and management’s best estimate of the most probable set of economic conditions anticipated to prevail in the market area. Such projections generally assume current home selling prices, cost estimates and sales rates for short-term projects are consistent with recent sales activity. For longer-term projects, planned sales rates for 2012 and 2013 assume recent sales activity and normalized sales rates beyond 2013. We identify potentially impaired housing and land projects based on these quantitative factors as well as qualitative factors obtained from the local market areas. If the future undiscounted cash flows are less than the carrying amount, the asset is considered to be impaired and is then written down to fair value less estimated selling costs using a discounted cash flow methodology which incorporates market based assumptions.
All projects were reviewed for impairment charges and option write-offs for the year ended December 31, 2011 and no impairment charges were required. This is consistent with the year ended December 31, 2010.
The locations of the projects reviewed were as follows:
| | | | |
| | | (Number of projects) | |
Canada | | | 32 | |
California | | | 27 | |
Central and Eastern U.S. | | | 13 | |
Unconsolidated entities | | | 9 | |
| | | | |
| | | 81 | |
| | | | |
We have also entered into a number of option contracts to acquire land or lots in the future in accordance with specific terms and conditions. A majority of our option contracts require a non-refundable cash deposit based on a percentage of the purchase price of the property. The option contracts are recorded at cost. In determining whether to pursue an option contract, we assess the option primarily based upon the expected cash flows from the optioned property. If our intent is to no longer pursue an option contract, we record a charge to earnings of the deposit amounts and any other related pre-acquisition entitlement costs in the period the decision is made.
Capitalized Costs
Our housing and land inventory on our consolidated balance sheet includes the costs of acquiring land, development and construction costs, interest, property taxes and overhead directly related to the development of the land and housing. Direct costs are capitalized to individual homes and lots and other costs are allocated to each lot proportionately.
Income Taxes
Income taxes are accounted for in accordance with ASC Topic 740Income Taxes. Under ASC Topic 740, deferred tax assets and liabilities are determined based on differences between financial reporting and tax bases of assets and liabilities, and are measured by using enacted tax rates expected to apply to taxable income in the years in which those differences are expected to reverse.
In accordance with the provisions of ASC Topic 740, the Company assesses, on a quarterly basis, its ability to realize its deferred tax assets. In determining the need for a valuation allowance, the Company considers the following significant factors: an assessment of recent years’ profitability and losses, which considers the nature, frequency and severity of current and cumulative losses and its forecasts or expectation of profits based on margins and volumes expected to be realized (which are based on current pricing and volume trends). The assessment of recent years’ losses and the resulting three-year cumulative loss of the U.S. operations of the Company, together with the uncertainty in the U.S. housing market, was evidence of the need for a valuation allowance against the Company’s net U.S. deferred tax asset. Refer to Note 9 of our consolidated financial statements included elsewhere in this report for further discussion.
ASC Topic 740 clarifies the accounting for uncertainty in income taxes recognized and prescribes a recognition threshold and measurement for the financial statement recognition and measurement of a tax position taken or expected to be taken in a tax return. It requires that a company determine whether it is more-likely-than-not that a position will be sustained upon examination by taxation authorities, based upon the technical merits of the position. A tax position that meets the more-likely-than-not threshold is then measured to determine the amount of the tax benefit to recognize in the financial statements.
The Company recognizes interest and penalties accrued related to unrecognized tax benefits or liabilities in income tax (expense) / recovery.
Derivative Financial Instruments
We revalue our equity swap contract each reporting period. The fair value of the equity swap contract is determined based on the notional amount, share price, the number of underlying shares and the three month LIBOR rate. We performed a sensitivity analysis of the estimated fair value and the impact to the financial statements using alternative reasonably likely assumptions on December 31, 2011 and the impact to the financial statements was nominal. However, future fluctuations in share price could have a significant impact on net income.
The interest rate swaps are revalued at each reporting period. The fair value of interest rate swaps is determined based on the notional amount, term to maturity and the three month LIBOR rate. The LIBOR rates vary depending on the term to maturity and the conditions set out in the underlying swap agreements.
Fair Value Instruments
The FASB’s authoritative guidance for fair value measurements establishes a three-level hierarchy based upon the inputs to the valuation model of an asset or liability. The fair value hierarchy and its application to our assets and liabilities is as follows:
| | • | | Level 1 – Valuation is based on quoted prices in active markets for identical assets and liabilities. |
| | • | | Level 2 – Valuation is determined from quoted prices for similar assets or liabilities in active markets, quoted prices for identical or similar instruments in markets that are not active, or by model-based techniques in which all significant inputs are observable in the market. |
| | • | | Level 3 – Valuation is derived from model-based techniques in which at least one significant input is unobservable and based on our own estimates about the assumptions that market participants would use to value the asset or liability. |
| | |
| Brookfield Residential Properties Inc. | | 19 |
When available, we use quoted market prices in active markets to determine fair value. We consider the principal market and non-performance risks associated with our counterparties when determining the fair value measurements, if applicable. Fair value measurements are used for our interest rate and equity swaps and fair value debt, as well as for inventories when events and circumstances indicate that the carrying value may not be recoverable.
Recent Accounting Pronouncements
In May 2011, the FASB issued Accounting Standards Update (“ASU”) 2011-04,Amendments to Achieve Common Fair Value Measurement and Disclosure Requirements in US GAAP and IFRS, which provides a consistent definition of fair value and ensure that the fair value measurement and disclosure requirements are similar between U.S. GAAP and International Financial Reporting Standards (“IFRS”). The guidance changes certain fair value measurement principles and expands the disclosure requirements particularly for Level 3 fair value measurements. The guidance is effective for the Company beginning January 1, 2012 and is to be applied prospectively. The adoption of this guidance, which relates primarily to disclosure, is not expected to have a material impact on the Company’s consolidated financial position, results of operations or cash flows.
In December 2011, the FASB issued ASU 2011-05,Presentation of Comprehensive Income, which requires an entity to report comprehensive income in either a single continuous statement of comprehensive income which contains two sections, net income and other comprehensive income, or in two separate but continuous statements. As permitted, the Company elected to prepare a single continuous statement. The adoption of this guidance, which relates to presentation only, did not impact the Company’s consolidated financial position, results of operations or cash flows.
Business Environment and Risks
The following is a review of certain risks that could adversely impact our financial condition and results of operations. Additional risks and uncertainties not previously known to the Company, or that the Company currently deems immaterial, may also impact our operations and financial results. A more detailed description of the Company’s business environment and risks is provided in the Annual Information Form and is available on our website at www.brookfieldrp.com, or on SEDAR at www.sedar.com or on EDGAR at www.sec.gov.
General Business Risks
The business and results of operations of Brookfield Residential will be materially and adversely affected by weakness in general economic, real estate and other conditions.
The land development and homebuilding industry is cyclical and is significantly affected by changes in general and local economic and industry conditions, such as employment levels, availability of financing for homebuyers, interest rates, consumer confidence, levels of new and existing homes for sale, demographic trends and housing demand. In addition, an oversupply of alternatives to new homes, such as resale homes, including homes held for sale by investors and speculators, foreclosed homes and rental properties may reduce Brookfield Residential’s ability to sell new homes, depress prices and reduce margins from the sale of new homes. The United States and Canadian homebuilding industry continues to face a number of challenges, with home foreclosures and tight credit standards continuing to have an effect on inventory and new home sale rates and prices.
Homebuilders are also subject to risks related to the availability and cost of materials and labour, and adverse weather conditions that can cause delays in construction schedules and cost overruns. Furthermore, the market value of undeveloped land, buildable lots and housing inventories held by Brookfield Residential can fluctuate significantly as a result of changing economic and real estate market conditions and may result in inventory impairment charges or putting deposits for lots controlled under option at risk. If there are significant adverse changes in economic or real estate market conditions, Brookfield Residential may have to sell homes at a loss or hold land in inventory longer than planned. Inventory carrying costs can be significant and can result in losses in a poorly performing project or market. If market conditions deteriorate, some of Brookfield Residential’s assets may be subject to impairments and option write-off charges adversely affecting its operations and financial results.
Rising mortgage rates or decreases in the availability of mortgage financing will discourage people from buying new homes.
Virtually all of Brookfield Residential’s customers finance their home acquisitions through lenders providing mortgage financing. Prior to the recent volatility in the financial markets in the United States, a variety of mortgage products were available. As a result, more homebuyers were able to qualify for mortgage financing. Increases in mortgage rates or decreases in the availability of mortgage financing could depress the market for new homes because of the increased monthly mortgage costs to potential homebuyers. Even if potential customers do not need financing, changes in mortgage interest rates and mortgage availability could make it harder for them to sell their homes to potential buyers who need financing, which would result in reduced demand for new homes. As a result, rising mortgage rates and reduced mortgage availability could adversely affect Brookfield Residential’s ability to sell new homes and the price at which it can sell them.
In the United States, since 2007, there has been a significant decrease in the type of mortgage products available and a general increase in the qualification requirements for mortgages. Fewer loan products and tighter loan qualifications make it more difficult for some borrowers to finance the purchase of new homes. This, coupled with higher mortgage interest rates for some mortgage products, has reduced demand for new homes. These reductions in demand could adversely affect Brookfield Residential’s operations and financial results, and the duration and severity of the effects are uncertain.
Laws and regulations related to property development and related to the environment subject Brookfield Residential to additional costs and delays which could adversely affect its business and results of operations.
Brookfield Residential must comply with extensive and complex regulations affecting the land development and homebuilding process. These regulations could impose on Brookfield Residential additional costs and delays, which will adversely affect its business and results of operations. In particular, Brookfield Residential is required to obtain the approval of numerous governmental authorities regulating matters such as permitted land uses, levels of density, the installation of utility services, zoning and building standards. These regulations often provide broad discretion to the administering governmental authorities as to the conditions Brookfield Residential must meet prior to being approved for a particular development or project, if approved at all. In addition, new development projects may be subject to various assessments for schools, parks, streets and highways and other public improvements, the costs of which can be substantial. When made, these assessments can have a negative impact on sales by raising the price that homebuyers must pay for Brookfield Residential’s homes. Brookfield Residential must also comply with a variety of local, state, provincial and federal laws and regulations concerning the protection of health and the environment, including with respect to hazardous or toxic substances. These environmental laws sometimes
| | |
| Brookfield Residential Properties Inc. | | 21 |
result in delays and could cause Brookfield Residential to incur additional costs, or severely restrict land development and homebuilding activity in environmentally sensitive regions or areas.
If Brookfield Residential is not able to develop and market its master-planned communities successfully, its business and results of operations will be adversely affected.
Before a master-planned community generates any revenues, material expenditures are incurred to acquire land, obtain development approvals and construct significant portions of project infrastructure, amenities, model homes and sales facilities. It generally takes several years for a master-planned community development to achieve cumulative positive cash flow. If Brookfield Residential is unable to develop and market its master-planned communities successfully and to generate positive cash flows from these operations in a timely manner, it will have a material adverse effect on the business and results of operations of Brookfield Residential.
Difficulty in retaining qualified trades workers, or obtaining required materials and supplies, will adversely affect the business and results of operations of Brookfield Residential.
The homebuilding industry has from time to time experienced significant difficulties in the supply of materials and services, including with respect to: shortages of qualified trades people; labour disputes; shortages of building materials; unforeseen environmental and engineering problems; and increases in the cost of certain materials (particularly increases in the price of lumber, wall board and cement, which are significant components of home construction costs). When any of these difficulties occur, it will cause delays and increase the cost of constructing Brookfield Residential’s homes.
Homebuilding is subject to home warranty and construction defect claims in the ordinary course of business and furthermore Brookfield Residential will sometimes face liabilities when it acts as a general contractor, and Brookfield Residential will sometimes be responsible for losses when it hires general contractors.
As a homebuilder, Brookfield Residential is subject to construction defect and home warranty claims arising in the ordinary course of its business. These claims are common in the homebuilding industry and can be costly. Further, where Brookfield Residential acts as the general contractor, it will be responsible for the performance of the entire contract, including work assigned to subcontractors. Claims may be asserted against Brookfield Residential for construction defects, personal injury or property damage caused by the subcontractors, and if successful these claims give rise to liability. Where Brookfield Residential hires general contractors, if there are unforeseen events like the bankruptcy of, or an uninsured or under-insured loss claimed against its general contractors, Brookfield Residential will sometimes become responsible for the losses or other obligations of the general contractors. The cost of insuring against construction defect and product liability claims are high, and the amount of coverage offered by insurance companies may be limited. There can be no assurance that this coverage will not be further restricted and become more costly. If Brookfield Residential is not able to obtain adequate insurance against these claims in the future, its business and results of operations will be adversely affected.
If Brookfield Residential is not able to raise capital on favourable terms or at all, its business and results of operations will be adversely affected.
Brookfield Residential operates in a capital intensive industry and requires capital to maintain its competitive position. The failure to secure additional debt or equity financing or the failure to do so on favourable terms will limit Brookfield Residential’s ability to grow its business, which in turn will adversely affect Brookfield Residential’s business and results of operations. Brookfield Residential expects to make significant capital expenditures in the future to enhance and maintain the operations of its properties and to expand and develop its real estate inventory. If Brookfield Residential’s plans or assumptions change or prove to be inaccurate, or if cash flow from operations proves to be insufficient due to unanticipated expenses or otherwise, Brookfield Residential will likely seek to minimize cash expenditures and/or obtain additional financing in order to support its plan of operations.
The availability of financing from banks and the public debt markets has declined significantly in the United States. Due to the deterioration of the credit markets and the uncertainties that exist in the economy and for homebuilders in general, Brookfield Residential cannot be certain that it will be able to replace existing financing or find additional sources of financing. If sufficient funding, whether obtained through public or private debt, equity financing or from strategic alliances is not available when needed or is not available on acceptable terms, Brookfield Residential’s business and results of operations will be adversely affected.
Brookfield Residential’s debt and leverage could adversely affect its financial condition.
Brookfield Residential’s total debt as of December 31, 2011 was $1,295 million. Brookfield Residential’s leverage could have important consequences, including the following: the ability to obtain additional financing for working capital, capital expenditures or acquisitions may be impacted in the future; a substantial portion of Brookfield Residential’s cash flow from operations must be dedicated to the payment of principal and interest on its debt, thereby reducing the funds available for other purposes; some of Brookfield Residential’s borrowings are and will continue to be at variable rates of interest, which will expose it to the risk of increased interest rates; and Brookfield Residential’s substantial leverage may limit its flexibility to adjust to changing economic or market conditions, reduce the ability to withstand competitive pressures and make Brookfield Residential more vulnerable to a general economic downturn.
If any of these conditions occur, or should Brookfield Residential be unable to repay these obligations as they become due, Brookfield Residential’s financial condition will be adversely affected. In addition, Brookfield Residential’s various debt instruments contain financial and other restrictive covenants that may limit its ability to, among other things, borrow additional funds that might be needed in the future. Brookfield Residential also guarantees shortfalls under some of its community bond debt, when the revenues, fees and assessments which are designed to cover principal and interest and other operating costs of the bonds are not paid.
Brookfield Residential finances many of its projects located in the United States individually. As a result, to the extent Brookfield Residential increases the number of projects and its related investment, its total debt obligations may increase. In general, Brookfield Residential repays the principal of its debt from the proceeds of home and lot closings.
Based on Brookfield Residential’s interest rate sensitive net debt levels, as of December 31, 2011, a 1% change up or down in interest rates could have either a negative or positive effect of approximately $7 million on its cash flows.
Brookfield Residential’s business and results of operations will be adversely affected if poor relations with the residents of its communities negatively impact it sales.
As a master-planned community developer, Brookfield Residential will sometimes be expected by community residents to resolve any issues or disputes that arise in connection with the development of its communities. Brookfield Residential’s sales may be negatively affected if any efforts made by it to resolve these issues or disputes are unsatisfactory to the affected residents, which in turn would be adversely affect Brookfield Residential’s results of operations. In addition, Brookfield Residential’s business and results of operations would be adversely affected if it is required to make material expenditures related to the settlement of these issues or disputes, or to modify its community development plans.
Brookfield Residential’s business is susceptible to adverse weather conditions and natural disaster.
Adverse weather conditions and natural disasters such as hurricanes, tornadoes, earthquakes, droughts, floods, fires and snow can have a significant effect on Brookfield Residential’s ability to develop its communities. These adverse weather conditions and natural disasters can cause delays and increased costs in the construction of new homes and the development of new communities. If insurance is unavailable to Brookfield Residential or is unavailable on acceptable terms, or if Brookfield Residential’s insurance is not adequate to cover business interruption or losses resulting from adverse weather or natural disasters, its business and results of operations will be adversely affected. In addition, damage to new homes caused by adverse weather or natural disaster may cause Brookfield Residential’s insurance costs to increase.
Increased insurance risk will adversely affect Brookfield Residential’s business.
Brookfield Residential is confronting reduced insurance capacity, and generally lower limits for insurance against some of the risks associated with its business. Some of the actions that have been or could be taken by insurance companies include: increasing insurance premiums; requiring higher self-insured retention and deductibles; requiring collateral on surety bonds; imposing additional exclusions, such as with respect to sabotage and terrorism; and refusing to underwrite certain risks and classes of business. The imposition of any of the preceding actions will adversely affect Brookfield Residential’s ability to obtain appropriate insurance coverage at reasonable costs.
Tax law changes in the United States could make home ownership more expensive or less attractive.
Tax law changes in the United States could make home ownership more expensive or less attractive. In the United States, significant expenses of owning a home, including mortgage interest expense and real estate taxes, generally are deductible expenses for an individual’s federal and, in some cases, state income taxes subject to various limitations under current tax law and policy. If the federal government or a state government changes income tax laws to eliminate or substantially modify these income tax deductions, then the after-tax cost of owning a new home would increase substantially. This could adversely impact demand for, and/or sales prices of, new homes.
| | |
| Brookfield Residential Properties Inc. | | 23 |
Residential homebuilding is a competitive industry, and competitive conditions may adversely affect Brookfield Residential’s results of operations.
The residential homebuilding industry is highly competitive. Residential homebuilders compete not only for homebuyers, but also for desirable properties, building materials, labour and capital. Brookfield Residential competes with other local, regional and national homebuilders, often within larger communities designed, planned and developed by such homebuilders. Any improvement in the cost structure or service of these competitors will increase the competition Brookfield Residential faces. Brookfield Residential also competes with the resale of existing homes including foreclosed homes, sales by housing speculators and investors and rental housing. Competitive conditions in the homebuilding industry could result in: difficulty in acquiring suitable land at acceptable prices; increased selling incentives; lower sales volumes and prices; lower profit margins; impairments in the value of Brookfield Residential’s inventory and other assets; increased construction costs; and delays in construction.
If Brookfield Residential is not able to retain its executive officers, the business and results of operations of Brookfield Residential could be adversely affected.
Brookfield Residential does not have employment agreements with any of its executive officers, which could affect Brookfield Residential’s ability to retain their services. Should Brookfield Residential lose the services of one or all of its executive officers and they cannot be adequately replaced, Brookfield Residential’s ability to accomplish the objectives set forth in its business plan could be adversely affected.
Quantitative and Qualitative Disclosure about Market Risk
Exchange Rates
We conduct business in both Canadian and U.S. dollars, therefore we are exposed to currency risks. Our cash flows from Canadian and U.S. operations are exposed to foreign exchange risk as sales and operating expenses are denominated in local currencies.
We have operations with a Canadian dollar functional currency, whose net assets are exposed to foreign currency translation risk. This currently is managed in part through our Canadian dollar denominated debt as a hedge against these operations. As at December 31, 2011, C$480 million of debt was designated in this manner.
Interest Rates
We are exposed to financial risks that arise from the fluctuations in interest rates. Our interest-bearing assets and liabilities are mainly at floating rates, so we would be negatively impacted, on balance, if interest rates increase. In addition, at December 31, 2011, we had interest rate swap contracts totalling $100 million at an average rate of 5% per annum. Based on our net debt levels as of December 31, 2011, a 1% change in interest rates would have either a negative or positive effect of approximately $7 million on our cash flows.
Our interest rate swaps are not designed as hedges under ASC Topic 815Derivatives and Hedging. We are exposed to market risk associated with changes in the fair values of the swaps, and such changes must be reflected in our consolidated statements of operations. As of December 31, 2011, the fair value of the interest rate swaps totalled a liability of $16 million.
Management’s Responsibility for Financial Reporting
Management of Brookfield Residential Properties Inc. (“Brookfield Residential”) is responsible for the integrity and fair presentation of the financial information, including the consolidated financial statements and management’s discussion and analysis and review, contained in this annual report. To fulfill this responsibility, the Company maintains a system of internal controls to ensure that its reporting practices and accounting and administrative procedures are appropriate and provide assurance that relevant and reliable information is produced. The consolidated financial statements have been prepared in accordance with accounting principles generally accepted in the United States (“U.S. GAAP”) and include some amounts based on management’s best estimates and careful judgment in the circumstances. The consolidated financial statements include the accounts of Brookfield Residential and all of its subsidiaries (collectively, the “Company”). The financial information of the Company included in the Company’s Annual Report is consistent with that in the consolidated financial statements.
Deloitte & Touche LLP, the independent registered chartered accountants appointed by the shareholders, have audited the consolidated financial statements in accordance with the standards of the Public Company Accounting Oversight Board (United States) standards to enable them to express to the Board of Directors and shareholders their opinion on the consolidated financial statements. Their report as independent registered chartered accounts is set out on the following page.
The Board of Directors is responsible for reviewing and approving the consolidated financial statements and for overseeing management’s performance of its financial reporting. The Board of Directors carries out these responsibilities primarily through an Audit Committee, which is composed entirely of independent directors. The Audit Committee meets periodically with management, our internal auditors and independent auditors to review the scope and results of the annual audit and to review the consolidated financial statements and related reporting and internal control matters before the financial statements are approved by the Board of Directors and submitted to the shareholders.
|
| /s/ Alan Norris |
|
| Alan Norris |
| President and Chief Executive Officer |
|
| /s/ Craig J. Laurie |
|
| Craig J. Laurie |
| Executive Vice-President and Chief Financial Officer |
|
| Calgary, Canada |
| February 13, 2012 |
| | |
| Brookfield Residential Properties Inc. | | 25 |
Report of Independent Registered Chartered Accountants
To the Board of Directors and Shareholders of Brookfield Residential Properties Inc.
We have audited the accompanying consolidated financial statements of Brookfield Residential Properties Inc. and subsidiaries, which comprise the consolidated balance sheets as of December 31, 2011 and 2010, and the consolidated statements of operations, equity, and cash flows for the years then ended, and a summary of significant accounting policies and other explanatory information.
Management’s Responsibility for the Consolidated Financial Statements
Management is responsible for the preparation and fair presentation of these consolidated financial statements in accordance with accounting principles generally accepted in the United States of America, and for such internal control as management determines is necessary to enable the preparation of consolidated financial statements that are free from material misstatement, whether due to fraud or error.
Auditor’s Responsibility
Our responsibility is to express an opinion on these consolidated financial statements based on our audits. We conducted our audits in accordance with Canadian generally accepted auditing standards and the standards of the Public Company Accounting Oversight Board (United States). Those standards require that we comply with ethical requirements and plan and perform the audit to obtain reasonable assurance about whether the consolidated financial statements are free from material misstatement.
An audit involves performing procedures to obtain audit evidence about the amounts and disclosures in the consolidated financial statements. The procedures selected depend on the auditor’s judgment, including the assessment of the risks of material misstatement of the consolidated financial statements, whether due to fraud or error. In making those risk assessments, the auditor considers internal control relevant to the entity’s preparation and fair presentation of the consolidated financial statements in order to design audit procedures that are appropriate in the circumstances. An audit also includes evaluating the appropriateness of accounting policies used and the reasonableness of accounting estimates made by management, as well as evaluating the overall presentation of the consolidated financial statements.
We believe that the audit evidence we have obtained in our audits is sufficient and appropriate to provide a basis for our audit opinion.
Opinion
In our opinion, the consolidated financial statements present fairly, in all material respects, the financial position of Brookfield Residential Properties Inc. and subsidiaries as of December 31, 2011 and 2010, and the results of their operations and their cash flows for the years then ended in accordance with accounting principles generally accepted in the United States of America.
Emphasis of Matter
As discussed in Note 1 to these consolidated financial statements, on March 31, 2011, the Company became a public company pursuant to the contribution of Brookfield Office Properties’ residential land and housing division and the merger of Brookfield Homes Corporation with a subsidiary of the Company. This transaction took place between entities under common control and therefore these consolidated financial statements have been presented giving retroactive effect to the transaction for all periods presented. Our opinion is not qualified in respect of this matter.
Other Matter
We have also audited, in accordance with the standards of the Public Company Accounting Oversight Board (United States), the Company’s internal control over financial reporting as of December 31, 2011, based on the criteria established in Internal Control – Integrated Framework issued by the Committee of Sponsoring Organizations of the Treadway Commission and our report dated February 13, 2012 expressed an unqualified opinion on the Company’s internal control over financial reporting.
/s/ Deloitte & Touche LLP
Independent Registered Chartered Accountants
Calgary, Canada
February 13, 2012
Management’s Responsibility on Internal Control over Financial Reporting
Management of Brookfield Residential Properties Inc. is responsible for establishing and maintaining adequate internal control over financial reporting. Internal control over financial reporting is a process designed by, or under the supervision, of the President and Chief Executive Officer and Executive Vice-President and Chief Financial Officer and effected by the Board of Directors, management and other personnel to provide reasonable assurance regarding the reliability of financial reporting and preparation of financial statements for external purposes in accordance with accounting principles generally accepted in the United States (“U.S. GAAP”) as issued by the U.S. Financial Accounting Standard Board.
Due to its inherent limitations, internal control over financial reporting may not prevent or detect misstatements on a timely basis. Also, projections of any evaluation of the effective of internal control over the financial reporting to future periods are subject to the risk that the controls may become inadequate because of change in conditions, or that the degree of compliance with the policies or procedures may deteriorate.
Management has a process in place to evaluate internal control over financial reporting based on the criteria established by the Committee of Sponsoring Organizations of the Treadway Commission (“COSO”) in Internal Control-Integrated Framework. Management has assessed the effectiveness of the Company’s internal control over financial reporting. Based on this assessment, management determined that the Company maintained effective internal controls over financial reporting as of December 31, 2011. There are no material weaknesses that have been identified by management.
Brookfield Residential Properties Inc.’s internal control over financial reporting as at December 31, 2011 has been audited by Deloitte & Touche LLP, Independent Registered Chartered Accountants, who also audited the Company’s consolidated financial statements for the year ended December 31, 2011, and as stated in the Report of Independent Registered Chartered Accountants, Deloitte & Touche LLP, expressed an unqualified opinion on the effectiveness of Brookfield Residential Properties Inc.’s internal control over financial reporting.
|
| /s/ Alan Norris |
|
| Alan Norris |
| President and Chief Executive Officer |
|
| /s/ Craig J. Laurie |
|
| Craig J. Laurie |
| Executive Vice-President and Chief Financial Officer |
|
| Calgary, Canada |
| February 13, 2012 |
| | |
| Brookfield Residential Properties Inc. | | 27 |
Report of Independent Registered Chartered Accountants
To the Board of Directors and Shareholders of Brookfield Residential Properties Inc.
We have audited the internal control over financial reporting of Brookfield Residential Properties Inc. and subsidiaries (the “Company”) as of December 31, 2011, based on the criteria established in Internal Control – Integrated Framework issued by the Committee of Sponsoring Organizations of the Treadway Commission. The Company’s management is responsible for maintaining effective internal control over financial reporting and for its assessment of the effectiveness of internal control over financial reporting, included in the accompanying Management’s Report on Internal Control Over Financial Reporting. Our responsibility is to express an opinion on the Company’s internal control over financial reporting based on our audit.
We conducted our audit in accordance with the standards of the Public Company Accounting Oversight Board (United States). Those standards require that we plan and perform the audit to obtain reasonable assurance about whether effective internal control over financial reporting was maintained in all material respects. Our audit included obtaining an understanding of internal control over financial reporting, assessing the risk that a material weakness exists, testing and evaluating the design and operating effectiveness of internal control based on the assessed risk, and performing such other procedures as we considered necessary in the circumstances. We believe that our audit provides a reasonable basis for our opinion.
A company’s internal control over financial reporting is a process designed by, or under the supervision of, the company’s principal executive and principal financial officers, or persons performing similar functions, and effected by the company’s board of directors, management, and other personnel to provide reasonable assurance regarding the reliability of financial reporting and the preparation of financial statements for external purposes in accordance with generally accepted accounting principles. A company’s internal control over financial reporting includes those policies and procedures that (1) pertain to the maintenance of records that, in reasonable detail, accurately and fairly reflect the transactions and dispositions of the assets of the company; (2) provide reasonable assurance that transactions are recorded as necessary to permit preparation of financial statements in accordance with generally accepted accounting principles, and that receipts and expenditures of the company are being made only in accordance with authorizations of management and directors of the company; and (3) provide reasonable assurance regarding prevention or timely detection of unauthorized acquisition, use, or disposition of the company’s assets that could have a material effect on the financial statements.
Because of the inherent limitations of internal control over financial reporting, including the possibility of collusion or improper management override of controls, material misstatements due to error or fraud may not be prevented or detected on a timely basis. Also, projections of any evaluation of the effectiveness of the internal control over financial reporting to future periods are subject to the risk that the controls may become inadequate because of changes in conditions, or that the degree of compliance with the policies or procedures may deteriorate.
In our opinion, the Company maintained, in all material respects, effective internal control over financial reporting as of December 31, 2011, based on the criteria established in Internal Control – Integrated Framework issued by the Committee of Sponsoring Organizations of the Treadway Commission.
We have also audited, in accordance with the standards of the Public Company Accounting Oversight Board (United States), the consolidated financial statements as of and for the year ended December 31, 2011 of the Company and our report dated February 13, 2012 expressed an unqualified opinion on those consolidated financial statements.
/s/ Deloitte & Touche LLP
Independent Registered Chartered Accountants
Calgary, Canada
February 13, 2012
CONSOLIDATED FINANCIAL STATEMENTS
BROOKFIELD RESIDENTIAL PROPERTIES INC.
CONSOLIDATED BALANCE SHEETS
(all dollar amounts are in thousands of U.S. dollars)
| | | | | | | | | | | | |
| | | | | | As at December 31 | |
| | | Note | | | 2011 | | | 2010 | |
| | | |
Assets | | | | | | | | | | | | |
Land and housing inventory | | | 2 | | | $ | 2,113,245 | | | $ | 2,193,947 | |
Investments in unconsolidated entities | | | 3 | | | | 143,821 | | | | 137,203 | |
Receivables and other assets | | | 4 | | | | 310,443 | | | | 217,972 | |
Restricted cash | | | 5 | | | | 9,128 | | | | 7,366 | |
Cash and cash equivalents | | | | | | | 2,162 | | | | 4,345 | |
Deferred income tax assets | | | 9 | | | | — | | | | 75,225 | |
| | | | | | | | | | | | |
Total assets | | | | | | $ | 2,578,799 | | | $ | 2,636,058 | |
| | | | | | | | | | | | |
| | | |
Liabilities and Equity | | | | | | | | | | | | |
Project specific and other financings | | | 6 | | | $ | 825,687 | | | $ | 1,025,339 | |
Notes payable | | | 7 | | | | 469,776 | | | | — | |
Accounts payable and other liabilities | | | 8 | | | | 247,420 | | | | 288,456 | |
Deferred income tax liabilities | | | 9 | | | | 27,773 | | | | — | |
| | | | | | | | | | | | |
Total liabilities | | | | | | | 1,570,656 | | | | 1,313,795 | |
| | | | | | | | | | | | |
| | | |
Other interests in consolidated subsidiaries | | | 10 | | | | 32,434 | | | | 42,461 | |
| | | | | | | | | | | | |
| | | |
Preferred shares – 70,002 shares outstanding (December 31, 2010 – 9,995,739 shares outstanding) | | | 11 | | | | 1,748 | | | | 288,065 | |
Common shares – 99,342,718 shares outstanding (December 31, 2010 – 53,808,461 shares outstanding) | | | 11 | | | | 93,383 | | | | 183,803 | |
Additional paid-in-capital | | | | | | | 404,777 | | | | 151,617 | |
Treasury stock, at cost | | | 11 | | | | — | | | | (110,807 | ) |
Retained earnings | | | | | | | 390,429 | | | | 692,855 | |
Non-controlling interest | | | 10 | | | | 6,439 | | | | 6,456 | |
Accumulated other comprehensive income | | | | | | | 78,933 | | | | 67,813 | |
| | | | | | | | | | | | |
Total equity | | | | | | | 975,709 | | | | 1,279,802 | |
| | | | | | | | | | | | |
Total liabilities and equity | | | | | | $ | 2,578,799 | | | $ | 2,636,058 | |
| | | | | | | | | | | | |
| | | |
Commitments, contingent liabilities and other | | | 14 | | | | | | | | | |
Guarantees | | | 15 | | | | | | | | | |
See accompanying notes to consolidated financial statements
| | |
| Brookfield Residential Properties Inc. | | 29 |
BROOKFIELD RESIDENTIAL PROPERTIES INC.
CONSOLIDATED STATEMENTS OF OPERATIONS
(all dollar amounts are in thousands of U.S. dollars, except per share amounts)
| | | | | | | | | | | | |
| | | | | | Years Ended December 31 | |
| | | Note | | | 2011 | | | 2010 | |
| | | |
Revenues | | | | | | | | | | | | |
Land | | | | | | $ | 524,095 | | | $ | 354,822 | |
Housing | | | | | | | 483,990 | | | | 599,352 | |
| | | | | | | | | | | | |
Total revenues | | | | | | | 1,008,085 | | | | 954,174 | |
| | | | | | | | | | | | |
Direct Cost of Sales | | | | | | | | | | | | |
Land | | | | | | | (326,712 | ) | | | (194,313 | ) |
Housing | | | | | | | (413,429 | ) | | | (492,968 | ) |
| | | | | | | | | | | | |
Total direct cost of sales | | | | | | | (740,141 | ) | | | (687,281 | ) |
Selling, general and administrative expense | | | | | | | (101,030 | ) | | | (99,206 | ) |
Equity in earnings / (loss) from unconsolidated entities | | | 3 | | | | 4,119 | | | | (261 | ) |
Depreciation | | | | | | | (3,544 | ) | | | (3,107 | ) |
Interest expense | | | | | | | (37,077 | ) | | | — | |
Other (expense) / income | | | 14 | | | | (252 | ) | | | 25,111 | |
| | | | | | | | | | | | |
Income Before Income Taxes | | | | | | | 130,160 | | | | 189,430 | |
Current income tax expense | | | 9 | | | | (22,240 | ) | | | (42,782 | ) |
Deferred income tax expense | | | 9 | | | | (103,085 | ) | | | (15,633 | ) |
| | | | | | | | | | | | |
Net Income | | | | | | | 4,835 | | | | 131,015 | |
| | | | | | | | | | | | |
Other Comprehensive Income | | | | | | | | | | | | |
Unrealized foreign exchange gain / (loss) on: | | | | | | | | | | | | |
Translation of the net investment in Canadian subsidiaries | | | | | | | (13,648 | ) | | | 35,209 | |
Translation of the Canadian dollar denominated debt designated as a hedge of the net investment in Canadian subsidiaries | | | | | | | 24,768 | | | | — | |
| | | | | | | | | | | | |
Comprehensive Income | | | | | | $ | 15,955 | | | $ | 166,224 | |
| | | | | | | | | | | | |
| | | |
Net Income / (Loss) Attributable To: | | | | | | | | | | | | |
Consolidated | | | | | | $ | 4,835 | | | $ | 131,015 | |
Non-controlling interests and other interests in consolidated subsidiaries | | | 10 | | | | (2,453 | ) | | | (1,464 | ) |
| | | | | | | | | | | | |
Brookfield Residential | | | | | | $ | 7,288 | | | $ | 132,479 | |
| | | | | | | | | | | | |
| | | |
Comprehensive Income / (Loss) Attributable To: | | | | | | | | | | | | |
Consolidated | | | | | | $ | 15,955 | | | $ | 166,224 | |
Non-controlling interests and other interests in consolidated subsidiaries | | | 10 | | | | (2,453 | ) | | | (1,464 | ) |
| | | | | | | | | | | | |
Brookfield Residential | | | | | | $ | 18,408 | | | $ | 167,688 | |
| | | | | | | | | | | | |
| | | |
Common Shareholders Earnings / Per Share | | | | | | | | | | | | |
Basic | | | 13 | | | $ | 0.07 | | | $ | 1.11 | |
Diluted | | | 13 | | | $ | 0.07 | | | $ | 1.11 | |
| | | |
Weighted Average Common Shares Outstanding(in thousands) | | | | | | | | | | | | |
Basic | | | 13 | | | | 99,949 | | | | 101,343 | |
Diluted | | | 13 | | | | 100,217 | | | | 101,431 | |
See accompanying notes to consolidated financial statements
BROOKFIELD RESIDENTIAL PROPERTIES INC.
CONSOLIDATED STATEMENTS OF EQUITY
(all dollar amounts are in thousands of U.S. dollars)
| | | | | | | | |
| | | Years Ended December 31 | |
| | | 2011 | | | 2010 | |
Preferred Shares | | | | | | | | |
Opening balance | | $ | 288,065 | | | $ | 288,171 | |
Conversion of preferred shares upon merger transaction | | | (286,317 | ) | | | (106 | ) |
| | | | | | | | |
Ending balance | | | 1,748 | | | | 288,065 | |
| | | | | | | | |
Common Shares | | | | | | | | |
Opening balance | | | 183,803 | | | | 96,813 | |
Issuance of common shares | | | — | | | | 86,990 | |
Elimination of treasury stock upon merger transaction | | | (110,700 | ) | | | — | |
Preferred shares converted to common shares upon merger transaction | | | 38,838 | | | | — | |
Purchase of common shares for escrowed stock plan | | | (18,558 | ) | | | — | |
| | | | | | | | |
Ending balance | | | 93,383 | | | | 183,803 | |
| | | | | | | | |
Additional Paid-in-Capital | | | | | | | | |
Opening balance | | | 151,617 | | | | 150,406 | |
Share-based compensation costs | | | 5,680 | | | | 1,105 | |
Conversion of preferred shares upon merger transaction | | | 247,480 | | | | 106 | |
| | | | | | | | |
Ending balance | | | 404,777 | | | | 151,617 | |
| | | | | | | | |
Treasury Stock | | | | | | | | |
Opening balance | | | (110,807 | ) | | | (166,113 | ) |
Preferred share dividends | | | — | | | | 55,213 | |
Stock option exercises | | | 107 | | | | 93 | |
Cancellation of treasury stock upon merger transaction | | | 110,700 | | | | — | |
| | | | | | | | |
Ending balance | | | — | | | | (110,807 | ) |
| | | | | | | | |
Retained Earnings | | | | | | | | |
Opening balance | | | 692,855 | | | | 887,356 | |
Net income attributable to Brookfield Residential | | | 7,288 | | | | 132,479 | |
Preferred share dividends | | | (178 | ) | | | (19,995 | ) |
Conversion of equity to notes payable | | | (493,929 | ) | | | — | |
Issuance of equity for notes receivable | | | 200,000 | | | | — | |
Treasury stock issued | | | — | | | | (45,213 | ) |
Distributions | | | (15,607 | ) | | | (261,772 | ) |
| | | | | | | | |
Ending balance | | | 390,429 | | | | 692,855 | |
| | | | | | | | |
Accumulated Other Comprehensive Income | | | | | | | | |
Opening balance | | | 67,813 | | | | 32,604 | |
Other comprehensive income | | | 11,120 | | | | 35,209 | |
| | | | | | | | |
Ending balance | | | 78,933 | | | | 67,813 | |
| | | | | | | | |
Total Brookfield Residential Properties Inc. Equity | | $ | 969,270 | | | $ | 1,273,346 | |
| | | | | | | | |
Non-controlling Interest(Note 10) | | | | | | | | |
Opening balance | | $ | 6,456 | | | $ | 16,105 | |
Net income / (loss) attributable to non-controlling interest | | | — | | | | (1,620 | ) |
(Distributions) / contributions | | | (17 | ) | | | 271 | |
Non-controlling interest acquired | | | — | | | | (8,300 | ) |
| | | | | | | | |
Ending balance | | $ | 6,439 | | | $ | 6,456 | |
| | | | | | | | |
Total Equity | | $ | 975,709 | | | $ | 1,279,802 | |
| | | | | | | | |
See accompanying notes to consolidated financial statements
| | |
| Brookfield Residential Properties Inc. | | 31 |
BROOKFIELD RESIDENTIAL PROPERTIES INC.
CONSOLIDATED STATEMENTS OF CASH FLOWS
(all dollar amounts are in thousands of U.S. dollars)
| | | | | | | | |
| | | Years Ended December 31 | |
| | | 2011 | | | 2010 | |
Cash Flows From / (Used in) Operating Activities | | | | | | | | |
Net income | | $ | 4,835 | | | $ | 131,015 | |
Adjustments to reconcile net income to net cash from operating activities: | | | | | | | | |
(Undistributed) / distributed income from unconsolidated entities | | | (4,127 | ) | | | 204 | |
Deferred income taxes | | | 103,085 | | | | 15,633 | |
Non-cash interest converted into equity | | | 1,674 | | | | — | |
Share-based compensation costs | | | 5,680 | | | | 1,105 | |
Depreciation | | | 3,544 | | | | 3,107 | |
| | |
Changes in operating assets and liabilities: | | | | | | | | |
(Increase) / decrease in receivables and other assets | | | (119,298 | ) | | | 31,323 | |
Decrease in land and housing inventory | | | 70,860 | | | | 33,593 | |
Decrease in accounts payable and other liabilities | | | (40,347 | ) | | | (538 | ) |
Other | | | (2,909 | ) | | | (195 | ) |
| | | | | | | | |
Net cash from operating activities | | | 22,997 | | | | 215,247 | |
| | | | | | | | |
| | |
Cash Flows (Used in) / From Investing Activities | | | | | | | | |
Investments in unconsolidated entities | | | (16,102 | ) | | | (42,604 | ) |
Distributions from unconsolidated entities | | | 12,222 | | | | 7,668 | |
Change in restricted cash | | | (1,762 | ) | | | 1,155 | |
| | | | | | | | |
Net cash used in investing activities | | | (5,642 | ) | | | (33,781 | ) |
| | | | | | | | |
| | |
Cash Flows (Used in) / From Financing Activities | | | | | | | | |
Drawings under project specific and other financings | | | 187,097 | | | | 147,890 | |
Repayments under project specific and other financings | | | (176,314 | ) | | | (337,151 | ) |
(Repayments) / drawings on bank indebtedness | | | (63,819 | ) | | | 316,992 | |
Drawings from affiliate | | | 66,000 | | | | 10,000 | |
Net distributions to non-controlling interest and other interests in consolidated subsidiaries | | | (5,799 | ) | | | (3,492 | ) |
Exercise of stock options | | | 107 | | | | 93 | |
Purchase of common shares for escrowed stock plan | | | (19,280 | ) | | | — | |
Dividends paid to preferred shareholders | | | (10,062 | ) | | | (73 | ) |
Distributions | | | — | | | | (319,720 | ) |
Other | | | 2,532 | | | | — | |
| | | | | | | | |
Net cash used in financing activities | | | (19,538 | ) | | | (185,461 | ) |
| | | | | | | | |
| | |
Decrease in cash and cash equivalents | | | (2,183 | ) | | | (3,995 | ) |
Cash and cash equivalents at beginning of year | | | 4,345 | | | | 8,015 | |
Foreign exchange on cash | | | — | | | | 325 | |
| | | | | | | | |
Cash and cash equivalents at end of year | | $ | 2,162 | | | $ | 4,345 | |
| | | | | | | | |
| | |
Supplemental Cash Flow Information | | | | | | | | |
Interest paid | | $ | 77,420 | | | $ | 62,495 | |
Income taxes recovered | | $ | 2,736 | | | $ | 42,842 | |
See accompanying notes to consolidated financial statements
BROOKFIELD RESIDENTIAL PROPERTIES INC.
NOTES TO THE CONSOLIDATED FINANCIAL STATEMENTS
(all dollar amounts are in thousands of U.S. dollars)
Note 1. Significant Accounting Policies
Brookfield Residential Properties Inc. (the “Company” or “Brookfield Residential”) was incorporated in Ontario, Canada and became a public company on March 31, 2011 pursuant to the contribution of Brookfield Office Properties’ residential land and housing division (“BPO Residential”) and the merger of Brookfield Homes Corporation (“Brookfield Homes”) into a single residential land and housing company, which was achieved through a merger and series of related transactions completed on March 31, 2011 (the “Transactions”). Pursuant to the merger and contribution agreement entered into by the Company, Brookfield Homes, Brookfield Office Properties and Brookfield Residential Acquisition Corp. on October 4, 2010 in respect of the merger: (a) Brookfield Residential Acquisition Corp., a direct wholly-owned subsidiary of the Company, merged with and into Brookfield Homes, with the result that Brookfield Homes became a wholly-owned subsidiary of the Company; and (b) Brookfield Office Properties and certain of its subsidiaries contributed to the Company equity interests in certain entities that, prior to the completion of the Transactions, owned all or substantially all of the assets of BPO Residential. Each outstanding share of Brookfield Homes common stock was converted into 0.764900530 of a share of the Company’s common shares (“Common Shares”), and each outstanding share of Brookfield Homes 8% convertible preferred stock was converted into one share of the Company’s 8% Convertible Preferred Shares, Series A (“Preferred Shares”). In connection with the closing of the merger, the Corporation issued: (i) 51,500,000 Common Shares to Brookfield Office Properties, (ii) 8,685,066 Common Shares to holders of shares of Brookfield Homes’ common stock, and (iii) 70,002 Preferred Shares, to holders of Brookfield Homes’ 8% convertible preferred stock, which Preferred Shares are convertible into Common Shares in accordance with their terms, at an issue price of $25 per Preferred Share. In exchange for the contribution of BPO Residential, Brookfield Office Properties also received two promissory notes totalling C$480.0 million ($493.9 million) and Brookfield Residential Common Stock.
This transaction took place between entities under common control and, as a result, has been accounted for as continuity of interest using the carried amount of assets and liabilities of both Brookfield Office Properties’ residential land and housing division and Brookfield Homes for comparative purposes. The Company began trading on the New York Stock Exchange and the Toronto Stock Exchange under the symbol “BRP” on April 1, 2011.
The accompanying consolidated financial statements have been prepared in conformity with accounting principles generally accepted in the United States of America (“U.S. GAAP”) and include the consolidated accounts of Brookfield Residential, its subsidiaries, investments in unconsolidated entities and variable interest entities in which the Company is the primary beneficiary. All intercompany accounts, transactions and balances have been eliminated upon consolidation.
All dollar amounts discussed herein are in U.S. dollars and in thousands, unless otherwise stated. Amounts in Canadian dollars are identified as “C$.”
| (b) | Land and Housing Inventory |
(i) Revenue recognition:Land sales are recognized when title passes to the purchaser upon closing, all material conditions of the sales contract have been met and a significant cash down payment or appropriate security is received and collectability is evident. Revenues from the sale of homes are recognized when title passes to the purchaser upon closing, wherein all proceeds are received or collectability is evident.
(ii) Carrying values:In accordance with the United States Financial Accounting Standards Board (“FASB”) Accounting Standards Codification (“ASC”) Topic 360Property, Plant and Equipment, land and housing assets owned directly by the Company and through its unconsolidated entities, are reviewed for recoverability on a regular basis and whenever events or changes in circumstances indicate that the carrying amount of an asset may not be recoverable. Recoverability is measured by comparing the carrying amount of an asset to future undiscounted cash flows expected to be generated by the asset. To arrive at the estimated fair value of land and housing inventory, the Company estimates the cash flow for the life of each project. Specifically, on a land project, the Company estimates the timing of future land sales, the estimated revenue per lot, as well as estimated margins with respect to future land sales. On a housing project, the Company evaluates the margins on homes that have been closed, margins on sales contracts which are in backlog and estimated margins with regard to future home sales over the life of the project. For the land and housing inventory, the Company continuously evaluates projects where inventory is turning over more slowly than expected or whose average sales price and margins are declining and are expected to continue to decline. These projections take into account the specific business plans for each project and management’s best estimate of the most probable set of economic conditions anticipated to prevail in the market area. Such projections generally assume current home selling prices, cost estimates and sales rates for short-term projects are consistent with recent sales activity. For longer-term projects, planned sales rates for 2012 and 2013 generally assume recent sales activity and normalized sales rates beyond 2013. Management identifies potentially impaired land and housing projects based on these quantitative factors as well as qualitative factors obtained from the local market areas. If the future undiscounted cash flows are less than the carrying
| | |
| Brookfield Residential Properties Inc. | | 33 |
BROOKFIELD RESIDENTIAL PROPERTIES INC.
NOTES TO THE CONSOLIDATED FINANCIAL STATEMENTS
(all dollar amounts are in thousands of U.S. dollars)
amount, the asset is considered to be impaired and is then written down to fair value less estimated selling costs using a discounted cash flow methodology which incorporates market participant assumptions.
The Company has also entered into a number of option contracts to acquire land or lots in the future in accordance with specific terms and conditions. The majority of the option contracts require a non-refundable cash deposit based on a percentage of the purchase price of the property. Option contracts are recorded at cost. In determining whether to pursue an option contract, the Company estimates the option primarily based upon the expected cash flows from the optioned property. If the intent is to no longer pursue an option contract, the Company records a charge to earnings of the deposit amounts and any other related pre-acquisition entitlement costs in the period the decision is made.
(iii) Capitalized costs:Capitalized costs include the costs of acquiring land, development and construction costs, interest, property taxes and overhead related to the development of land and housing. Direct costs are capitalized to individual homes and lots and other costs are allocated to each lot proportionately.
| (c) | Unconsolidated Entities |
The Company participates in a number of unconsolidated entities in which it has less than a controlling interest to develop and sell land to the unconsolidated entity members and other third parties. These unconsolidated entities are accounted for using the equity method. The Company recognizes its proportionate share of the earnings from the sale of lots to other third parties. The Company does not recognize earnings from the purchase of lots from its unconsolidated entities and reduces its cost basis of the land purchased accordingly.
The preparation of financial statements, in conformity with U.S. GAAP, requires management to make estimates and assumptions that affect the carrying amounts of assets and liabilities and disclosure of contingent assets and liabilities at the date of the financial statements and the reported amounts of revenues and expenses during the reporting period. Significant areas where judgment is applied include asset valuations, investments in unconsolidated entities, assessment of variable interest entities, tax provisions, warranty costs, valuation of financial instruments, deferred income tax assets and liabilities, accrued liabilities and contingent liabilities including litigation. Actual results could differ materially from these estimates.
| (e) | Cash and Cash Equivalents |
Cash and cash equivalents include cash on hand, demand deposits, and all highly liquid short-term investments with original maturity less than 90 days. The carrying value of these investments approximates their fair value.
Restricted cash includes cash held on deposit with a financial institution in the form of collateral, required by terms outlined in the total return swap transaction entered into by the Company and the cash collateralization of development letters of credit.
Income taxes are accounted for in accordance with ASC Topic 740Income Taxes. Deferred tax assets and liabilities are determined based on temporary differences between the amounts reported for financial reporting purposes and the amounts deductible for income tax purposes. They are measured by using enacted tax rates expected to apply to taxable income in the years in which those differences are expected to reverse.
In accordance with ASC Topic 740, the Company assesses the realizability of its deferred tax assets. A valuation allowance must be established when, based upon available evidence, it is more-likely-than-not that all or a portion of the deferred tax assets will not be realized. The Company assesses, on a quarterly basis, its ability to realize its deferred tax asset.
Provisions (benefits) for federal and state income taxes are calculated on reported pretax earnings (losses) based on current tax law and also include, in the applicable period, the cumulative effect of any changes in tax rates from those used previously in determining deferred tax asset and liabilities. Such provisions (benefits) differ from the amounts currently receivable or payable because certain items of income and expense are recognized for financial reporting purposes in different periods than for income tax purposes. Significant judgment is required in determining income tax provisions (benefits) and evaluating tax positions. The Company establishes reserves for income taxes when, despite the belief that its tax positions are fully supportable, it believes that its positions may be challenged and disallowed by various tax authorities. The consolidated tax provision (benefits) and related accruals include the impact of such reasonably estimable disallowances as deemed appropriate. To the extent that the probable tax outcome of these matters changes, such changes in estimates will impact the income tax provision (benefit) in the period in which such determination is made.
BROOKFIELD RESIDENTIAL PROPERTIES INC.
NOTES TO THE CONSOLIDATED FINANCIAL STATEMENTS
(all dollar amounts are in thousands of U.S. dollars)
Significant judgment is required in estimating valuation allowances for deferred tax assets. In accordance with ASC Topic 740, a valuation allowance is established against a deferred tax asset if, based on the available evidence, it is more-likely-than-not that such asset will not be realized. The realization of a deferred tax asset ultimately depends on the existence of sufficient taxable income in either the carryback or carryforward periods under tax law. On a quarterly basis, the Company assesses the need for valuation allowances for deferred tax assets based on ASC Topic 740’s more-likely-than-not realization threshold criterion. In the Company’s assessment, appropriate consideration is given to all positive and negative evidence related to the realization of the deferred tax assets. This assessment considers, among other matters, the nature, frequency and severity of current and cumulative income and losses, forecasts of future profitability, the duration of statutory carryback or carryforward periods, its experience with operating loss and tax credit carryforwards being used before expiration and tax planning alternatives.
In accordance with ASC Topic 740, the Company assesses whether a valuation allowance should be established based on its determination of whether it is more-likely-than-not that some or all of the deferred tax assets will not be realized. The Company’s assessment of the need for a valuation allowance on its deferred tax assets includes assessing the following significant factors: an assessment of recent years’ profitability and losses which considers the nature, frequency, and severity of current and cumulative losses; management’s forecasts or expectation of profits based on margins and volumes expected to be realized (which are based on current pricing and volume trends); the long duration of ten to twenty years or more in all significant operating jurisdictions before the expiry of net operating losses, and taking into consideration that a substantial portion of the deferred tax asset is composed of deductible temporary differences that are not subject to an expiry period until realized under tax law.
The Company bases its estimate of deferred tax assets and liabilities on current tax laws and rates and, in certain cases, on business plans and other expectations about future outcomes. Changes in existing tax laws or rates could affect actual tax results, and future business results may affect the amount of deferred tax liabilities or the valuation of deferred tax assets over time. The Company’s accounting for deferred tax assets represents its best estimate of future events using the guidance provided by ASC Topic 740.
Due to uncertainties in the estimation process, particularly with respect to changes in facts and circumstances in future reporting periods (carryforward period assumptions), it is reasonably possible that actual results could differ from the estimates used in the Company’s historical analyses. The Company’s assumptions require significant judgment because the residential homebuilding industry is cyclical and is highly sensitive to changes in economic conditions. If the Company’s results of operations are less than projected and there is insufficient objectively verifiable evidence to support the likely realization of its deferred tax assets, a valuation allowance would be required to reduce or eliminate its deferred tax assets.
| (h) | Share-Based Compensation |
The Company accounts for stock option grants and deferred share unit grants in accordance with ASC Topic 718Compensation-Stock Compensation. All stock options granted have exercise prices equal to the market value of the common shares on the date of the grant, determined in accordance with the Company’s management share option plan (“option plan”). Participants in the option plan can exercise their options to purchase shares at the exercise price as options vest. All options vest over a period of five years.
The Company records the fair value of options using a Black-Scholes option pricing model. Options have been recorded in additional paid-in capital in 2011 as a result of an amendment to existing stock option awards made under the Brookfield Homes 2002 stock option plan and the approval and adoption of the Brookfield Residential option plan. In addition, the Company records the deferred share units as a liability as disclosed in accounts payable and other liabilities. See Note 12 “Share-Based Compensation” for further discussion.
| (i) | Foreign Currency Translation |
The consolidated financial statements are presented in U.S. dollars, which is the functional currency of the Company and the presentation currency of the consolidated financial statements.
Assets and liabilities of subsidiaries or equity accounted investees having a functional currency other than the U.S. dollar are translated at the rate of exchange on the balance sheet date. Revenues and expenses are translated at average rates for the period, unless exchange rates fluctuated significantly during the period, in which case the exchange rates at the dates of the transaction are used. The resulting foreign currency translation adjustments are recognized in other comprehensive income (“OCI”).
Foreign currency transactions are translated into the functional currency using exchange rates prevailing at the date of the transactions. At the end of each reporting period, foreign currency denominated monetary assets and liabilities are translated
| | |
| Brookfield Residential Properties Inc. | | 35 |
BROOKFIELD RESIDENTIAL PROPERTIES INC.
NOTES TO THE CONSOLIDATED FINANCIAL STATEMENTS
(all dollar amounts are in thousands of U.S. dollars)
to the functional currency using the prevailing rate of exchange at the balance sheet date. Gains and losses on translation of monetary items are recognized in the income statement as other income / (expense), except for those related to monetary liabilities qualifying as hedges of the company’s investment in foreign operations or certain intercompany loans to or from a foreign operation for which settlement is neither planned nor likely to occur in the foreseeable future, which are included in OCI.
Earnings per share is computed in accordance with ASC Topic 260Earnings Per Share. Basic earnings per share is calculated by dividing net earnings / (loss) attributable to Brookfield Residential less preferred share dividends by the weighted average number of common shares outstanding for the year. Diluted earnings / (loss) per share is calculated by dividing net income less preferred share dividends for the year by the average number of common shares outstanding including all potentially dilutive issuable shares under the option plan.
The Company expenses advertising costs as incurred and are included in the consolidated financial statements as selling, general and administrative expense.
Estimated future warranty costs are accrued and charged to cost of sales at the time the revenue associated with the sale of each home is recognized. Factors that affect the Company’s warranty liability include the number of homes sold, historical and anticipated rates of warranty claims, and cost per claim. Costs are accrued based upon historical experience.
| (m) | Variable Interest Entities |
The Company accounts for its variable interest entities (“VIEs”) in accordance with ASC Topic 810Consolidation. The decision to consolidate a VIE begins with establishing that a VIE exists. A VIE exists when either the total equity investment at risk is not sufficient to permit the entity to finance its activities by itself, or the equity investor lacks one of three characteristics associated with owning a controlling financial interest. Those characteristics are the power to direct the activities of an entity that most significantly impacts the entity’s economic performance, the obligation to absorb the expected losses of the entity, and the right to receive the expected residual returns of the entity. The entity that has the power to direct the activities of a VIE that most significantly impacts the VIE’s economic performance and the obligation to absorb losses or the right to receive benefits of the VIE that could potentially be significant to the VIE is considered to have a controlling financial interest in a VIE and is required to consolidate such entity. The Company has determined that it has a controlling financial interest in certain VIEs which are included in these financial statements as a component of “Land and housing inventory.” The interests of others included in accounts payable and other liabilities. See Notes 2 “Land and Housing Inventory” and 3 “Investments in Unconsolidated Entities” for further discussion on the consolidation of land option contracts and unconsolidated entities.
| (n) | Derivative Financial Instruments and Hedging Activities |
The Company accounts for its derivative and hedging activities in accordance with ASC Topic 815,Derivatives and Hedging. ASC Topic 815 requires the Company to recognize all derivative instruments at their fair values as either assets or liabilities on its balance sheet. The accounting for changes in fair value (i.e. gains or losses) of a derivative instrument depends on whether the Company has designated it, and whether it qualifies, as part of a hedging relationship and on the type of hedging relationship. For those derivative instruments that are designated and qualify as hedging instruments, the Company must designate the hedging instrument, based upon the exposure being hedged, as a fair value hedge, a cash flow hedge or a hedge of a net investment in a foreign operation. For derivative instruments that are designated and qualify as a cash flow hedge (i.e. hedging the exposure to variability in expected future cash flows that are attributable to a particular risk), the effective portion of the gain or loss on the derivative instrument is reported as a component of other comprehensive income and reclassified into earnings in the same line item associated with the forecasted transaction in the same period or periods during which the hedged transaction affects earnings (i.e. in “interest expense” when the hedged transactions are interest cash flows associated with floating-rate debt). The remaining gain or loss on the derivative instrument in excess of the cumulative changes in the present value of future cash flows of the hedged item, if any, is recognized in the realized and unrealized gain / (loss) on derivatives in current earnings during the period of change. For derivative instruments not designated as hedging instruments, the gain or loss is recognized in realized and unrealized gain / (loss) on derivatives in the current earnings during the period of change. Income and/or expense from interest rate swaps are recognized as an adjustment to other (expense) / income. The Company accounts for income and expense from interest rate swaps over the period to which the payments and/or receipts relate.
BROOKFIELD RESIDENTIAL PROPERTIES INC.
NOTES TO THE CONSOLIDATED FINANCIAL STATEMENTS
(all dollar amounts are in thousands of U.S. dollars)
| (o) | Fair Value Instruments |
The Financial Accounting Standard Board’s (“FASB”) authoritative guidance for fair value measurements establishes a three-level hierarchy based upon the inputs to the valuation model of an asset or liability. The fair value hierarchy and its application to the Company’s assets and liabilities, is as follows:
| | • | | Level 1 – Valuation is based on quoted prices in active markets for identical assets and liabilities. |
| | • | | Level 2 – Valuation is determined from quoted prices for similar assets or liabilities in active markets, quoted prices for identical or similar instruments in markets that are not active, or by model-based techniques in which all significant inputs are observable in the market. |
| | • | | Level 3 – Valuation is derived from model-based techniques in which at least one significant input is unobservable and based on management’s estimates about the assumptions that market participants would use to value the asset or liability. |
When available, the Company uses quoted market prices in active markets to determine fair value. The Company considers the principal market and non-performance risks associated with its counterparties when determining the fair value measurements, if applicable. Fair value measurements are used for its interest rate and equity swaps, as well as for inventories when events and circumstances indicate that the carrying value may not be recoverable.
| (p) | Recent Accounting Pronouncements |
In May 2011, the FASB issued Accounting Standards Update (“ASU”) 2011-04,Amendments to Achieve Common Fair Value Measurement and Disclosure Requirements in U.S. GAAP and IFRS, which provides a consistent definition of fair value and ensure that the fair value measurement and disclosure requirements are similar between U.S. GAAP and International Financial Reporting Standards (“IFRS”). The guidance changes certain fair value measurement principles and expands the disclosure requirements particularly for Level 3 fair value measurements. The guidance is effective for the Company beginning January 1, 2012 and is to be applied prospectively. The adoption of this guidance, which relates primarily to disclosure, is not expected to have a material impact on the Company’s consolidated financial position, results of operations or cash flows.
In December 2011, the FASB issued ASU 2011-05,Presentation of Comprehensive Income, which requires an entity to report comprehensive income in either a single continuous statement of comprehensive income which contains two sections, net income and other comprehensive income, or in two separate but continuous statements. As permitted, the Company elected to prepare a single continuous statement. The adoption of this guidance, which relates to presentation only, did not impact the Company’s consolidated financial position, results of operations or cash flows.
| Note 2. | Land and Housing Inventory |
Land and housing inventory includes land under development and land held for development which will be used in the Company’s homebuilding operations or sold as building lots to other homebuilders, homes completed or under construction and lots ready for construction and model homes. The following summarizes the components of land and housing inventory:
| | | | | | | | |
| | | December 31 | |
| | | 2011 | | | 2010 | |
Land and land under development | | $ | 1,948,857 | | | $ | 1,974,497 | |
Housing inventory | | | 138,034 | | | | 190,882 | |
Model homes | | | 26,354 | | | | 28,568 | |
| | | | | | | | |
Total | | $ | 2,113,245 | | | $ | 2,193,947 | |
| | | | | | | | |
The Company capitalizes interest which is expensed as housing units and building lots are sold. For the years ended December 31, 2011 and 2010, interest incurred and capitalized by the Company was $37.8 million and $61.6 million, respectively. Capitalized interest expensed as direct cost of sales for the same periods was $88.8 million and $49.6 million, respectively.
In the ordinary course of business, the Company has entered into a number of option contracts to acquire land or lots in the future in accordance with specific terms and conditions. As such, the Company has advanced deposits to secure these rights. The Company is required by ASC Topic 810Consolidationto qualitatively assess whether it is the primary beneficiary of these options based on whether it has the power over the significant activities of the VIE and an obligation to absorb losses or the right to receive benefits that could be potentially significant to the VIE. The Company has evaluated its option contracts in accordance with this guidance and determined that, for those entities considered to be VIEs, it is the primary beneficiary of options with an aggregate exercise price of $24.1 million (December 31, 2010 – $25.2 million), which are required to be consolidated. In these cases, the only asset recorded is the Company’s exercise price for the option to purchase, with an increase in accounts payable and other liabilities of $24.1 million (December 31, 2010 – $25.2 million) for the assumed third-
| | |
| Brookfield Residential Properties Inc. | | 37 |
BROOKFIELD RESIDENTIAL PROPERTIES INC.
NOTES TO THE CONSOLIDATED FINANCIAL STATEMENTS
(all dollar amounts are in thousands of U.S. dollars)
party investment in the VIE. Where the land sellers are not required to provide the Company financial information related to the VIE, certain assumptions by the Company were required in its assessment as to whether or not it is the primary beneficiary.
Land and housing inventory includes non-refundable deposits and other entitlement costs totalling $57.6 million (December 31, 2010 – $49.5 million) in connection with options that are not required to be consolidated in terms of the guidance incorporated in ASC Topic 810. The total remaining exercise price of these options is $143.6 million (December 31, 2010 – $151.6 million), including the non-refundable deposits and other entitlement costs identified above. The number of lots in which the Company has obtained an option to purchase, excluding those already consolidated and those held through unconsolidated entities, and their respective dates of expiry and aggregate exercise prices follow:
| | | | | | | | |
| Year of Expiry | | Number
of Lots | | | Total Exercise
Price | |
| | |
2012 | | | — | | | $ | — | |
2013 | | | — | | | | — | |
Thereafter | | | 6,016 | | | | 143,613 | |
| | | | | | | | |
| | | 6,016 | | | $ | 143,613 | |
| | | | | | | | |
The Company holds agreements for a further 4,878 acres (December 31, 2010 – 4,878 acres) of longer-term land, with non-refundable deposits and other entitlement costs of $6.2 million (December 31, 2010 – $5.8 million), which is included in land and housing inventory that may provide additional lots upon obtaining entitlements with an aggregate exercise price of $59.0 million (December 31, 2010 – $59.6 million). However, given that the Company is in the initial stage of land entitlement, the Company has concluded at this time that the level of uncertainty in entitling these properties does not warrant including them in the above totals.
| Note 3. | Investments in Unconsolidated Entities |
As part of its operations, the Company participates in joint ventures to explore opportunities while minimizing risk. As of December 31, 2011, the Company was involved with 14 unconsolidated entities in which it has less than a controlling interest. Investments in unconsolidated entities includes $28.3 million (December 31, 2010 – $26.4 million) of the Company’s share of non-refundable deposits and other entitlement costs in connection with 1,842 lots (December 31, 2010 – 2,759 lots) under option. The Company’s share of the total exercise price of these options is $95.3 million (December 31, 2010 – $93.2 million). Summarized condensed financial information on a combined 100% basis of the unconsolidated entities follows:
| | | | | | | | |
| | | December 31 | |
| | | 2011 | | | 2010 | |
Assets | | | | | | | | |
Land and housing | | $ | 341,246 | | | $ | 320,170 | |
Other assets | | | 8,707 | | | | 8,009 | |
| | | | | | | | |
| | $ | 349,953 | | | $ | 328,179 | |
| | | | | | | | |
| | |
Liabilities and Equity | | | | | | | | |
Project specific financings | | $ | 48,352 | | | $ | 33,173 | |
Accounts payable and other liabilities | | | 20,554 | | | | 22,371 | |
Equity | | | | | | | | |
Brookfield Residential’s interest | | | 143,821 | | | | 137,203 | |
Others’ interest | | | 137,226 | | | | 135,432 | |
| | | | | | | | |
| | $ | 349,953 | | | $ | 328,179 | |
| | | | | | | | |
BROOKFIELD RESIDENTIAL PROPERTIES INC.
NOTES TO THE CONSOLIDATED FINANCIAL STATEMENTS
(all dollar amounts are in thousands of U.S. dollars)
| | | | | | | | |
| | | Years Ended December 31 | |
| | | 2011 | | | 2010 | |
Revenue and Expenses | | | | | | | | |
Revenue | | $ | 42,354 | | | $ | 12,711 | |
Direct cost of sales | | | (38,379 | ) | | | (15,228 | ) |
Other income | | | 3,709 | | | | 2,776 | |
| | | | | | | | |
Net income | | $ | 7,684 | | | $ | 259 | |
| | | | | | | | |
Brookfield Residential’s share of net income / (loss) | | $ | 4,119 | | | $ | (261 | ) |
| | | | | | | | |
In reporting the Company’s share of net income, all inter-company profits or losses from unconsolidated entities are eliminated on lots purchased by the Company from unconsolidated entities.
Unconsolidated entities in which the Company has a non-controlling interest are accounted for using the equity method. In addition, the Company has performed an evaluation of its existing unconsolidated entity relationships by applying the provisions of ASC Topic 810.
The Company and/or its unconsolidated entity partners have provided varying levels of guarantees of debt in its unconsolidated entities. At December 31, 2011, the Company had completion guarantees of $4.1 million (December 31, 2010 – nil) and limited maintenance guarantees of $11.7 million (December 31, 2010 – $13.8 million) with respect to debt in its unconsolidated entities.
| Note 4. | Receivables and Other Assets |
The components of receivables and other assets included in the Company’s consolidated balance sheets are summarized as follows:
| | | | | | | | |
| | | December 31 | |
| | | 2011 | | | 2010 | |
| | |
Receivables | | $ | 279,083 | | | $ | 179,423 | |
Other assets | | | 31,360 | | | | 38,549 | |
| | | | | | | | |
| | $ | 310,443 | | | $ | 217,972 | |
| | | | | | | | |
The components of receivables included in the Company’s consolidated balance sheets are summarized as follows:
| | | | | | | | |
| | | December 31 | |
| | | 2011 | | | 2010 | |
| | |
Real estate receivables (a) | | $ | 167,376 | | | $ | 36,927 | |
Development recovery receivables (b) | | | 82,620 | | | | 83,404 | |
Sundry receivables (c) | | | 17,613 | | | | 30,872 | |
Notes receivable | | | — | | | | 19,000 | |
Proceeds and escrow receivables (d) | | | 9,491 | | | | 4,943 | |
Taxes receivable | | | 173 | | | | 3,288 | |
Refundable deposits | | | 1,810 | | | | 989 | |
| | | | | | | | |
| | $ | 279,083 | | | $ | 179,423 | |
| | | | | | | | |
| (a) | Real estate receivables include vendor take back (“VTB”) mortgages receivable. The VTB collection terms range from nine months to three years and bear variable interest from Canadian prime to prime plus 3% and fixed interest rates of 6% (December 31, 2010 – Canadian prime plus 1% and fixed interest rates between 7% and 8%). |
| (b) | The Company has entered into development and cost sharing arrangements for the recovery of development expenditures with certain Metro Districts and developers whereby the Company has undertaken to put in place the infrastructure costs for certain communities. These receivables will be collected over the development life of the community and bear interest rates ranging from U.S. prime plus 1% to 6% (December 31, 2010 – U.S. prime plus 1% to 6%). The fair value of these receivables is determined by discounting contractual principal and interest payments, where required, at estimated current market interest rates for the instrument. Current market interest rates are determined with reference to current benchmark rates for a similar term and credit spreads for instruments with similar terms and risk. |
| | |
| Brookfield Residential Properties Inc. | | 39 |
BROOKFIELD RESIDENTIAL PROPERTIES INC.
NOTES TO THE CONSOLIDATED FINANCIAL STATEMENTS
(all dollar amounts are in thousands of U.S. dollars)
| (c) | Sundry receivables are comprised of development recoveries, lot interest receivable, goods and services tax receivable and miscellaneous amounts. |
| (d) | Proceeds and escrow receivables relate to receivables held in trust due to timing of housing sales and lots that closed at the period end date. The collections of these receivables typically occur shortly after the period end once the funds are released by the trust or escrow company. |
As at December 31, 2011 and December 31, 2010, allowances for doubtful accounts of nil and $5.2 million, respectively, have been included in the totals above.
The components of other assets included in the Company’s consolidated balance sheets are summarized as follows:
| | | | | | | | |
| | | December 31 | |
| | | 2011 | | | 2010 | |
| | |
Non-refundable earnest funds and investigation fees (a) | | $ | 15,499 | | | $ | 19,721 | |
Capital assets (b) | | | 12,312 | | | | 13,762 | |
Prepaid expenses | | | 1,592 | | | | 1,963 | |
Swap contracts (Note 14 (c) and (d)) | | | 1,088 | | | | 2,238 | |
Other | | | 869 | | | | 865 | |
| | | | | | | | |
| | $ | 31,360 | | | $ | 38,549 | |
| | | | | | | | |
| (a) | Non-refundable earnest funds and investigation fees relate to non-refundable deposits and due-diligence costs on potential acquisition and options that are incurred prior to taking title of a property. |
| (b) | Capital assets are recorded at cost less accumulated amortization. The Company provides for amortization using the straight line method. Leasehold improvements are amortized over the term of the lease and equipment is amortized over three to five years. Included in capital assets is accumulated amortization of $10.8 million (December 31, 2010 – $8.5 million). |
At December 31, 2011, the Company had restricted cash of $9.1 million (December 31, 2010 – $7.4 million). The balance of $9.1 million (December 31, 2010 – nil) relates to cash collateralization of development letters of credit and nil (December 31, 2010 – $7.4 million) relates to cash collateralization of a total return swap transaction.
| Note 6. | Project Specific and Other Financings |
Project specific and other financings consist of the following:
| | | | | | | | |
| | | December 31 | |
| | | 2011 | | | 2010 | |
| | |
Project specific financings (a) | | $ | 249,185 | | | $ | 239,614 | |
Bank indebtedness (b) | | | 350,502 | | | | 421,685 | |
Due to affiliates (c) | | | 226,000 | | | | 364,040 | |
| | | | | | | | |
| | $ | 825,687 | | | $ | 1,025,339 | |
| | | | | | | | |
| (a) | Project Specific Financings |
Project specific financings of $249.2 million (December 31, 2010 – $239.6 million) provided by a variety of lenders are revolving, bear interest at floating and fixed interest rates at a weighted average rate of 3.99% as at December 31, 2011 (December 31, 2010 – 3.93%) and are secured by land and housing inventory. The weighted average rate was calculated as of the end of each period, based upon the amount of debt balances outstanding and the related interest rates applicable on that date. Project specific financings mature as follows: 2012 – $139.8 million; 2013 – $81.5 million; 2014 – $18.5 million; 2015 – $1.0 million and 2016 and onwards – $8.4 million.
Project specific financings consist of the following:
| | | | | | | | |
| | | December 31 | |
| | | 2011 | | | 2010 | |
| | |
Secured facilities (i) | | $ | 200,645 | | | $ | 216,858 | |
Secured VTB mortgages (ii) | | | 48,540 | | | | 22,756 | |
| | | | | | | | |
| | $ | 249,185 | | | $ | 239,614 | |
| | | | | | | | |
BROOKFIELD RESIDENTIAL PROPERTIES INC.
NOTES TO THE CONSOLIDATED FINANCIAL STATEMENTS
(all dollar amounts are in thousands of U.S. dollars)
| (i) | $174.1 million (December 31, 2010 – $170.0 million) of the Company’s project specific financings have variable interest rates ranging from prime to LIBOR plus 3.50% and fixed rates ranging from 1.50% to 6.00%. These facilities require Brookfield Homes Holdings LLC, an indirect wholly-owned subsidiary of the Company, to maintain a tangible net worth of at least $325.0 million, a net indebtedness to capitalization ratio of no greater than 65% and a net indebtedness to tangible net worth of no greater than 2.50 to 1.0. |
$18.8 million (December 31, 2010 – $46.8 million) of the Company’s project specific financings have floating interest rates ranging from the lower of prime less 0.50% to prime with some facilities having a floor of 5.00% to 5.25%. The remainder of this debt bears fixed interest rates ranging from 5.50% to 6.00% and is secured by land and water rights to which the borrowings relate. These credit facilities require Brookfield Residential (US) LLC, an indirect wholly-owned subsidiary of the Company, to maintain a minimum net worth of $80.0 million and a debt to net tangible worth ratio of not greater than 1.25 to 1.0.
$7.7 million (December 31, 2010 – nil) of the Company’s project specific financings have floating interest rates ranging from the lower of LIBOR plus 3.00% and a floor of 3.32% and are secured by land and water rights to which the borrowings relate. These credit facilities require Brookfield Residential (US) LLC, an indirect wholly-owned subsidiary of the Company, to maintain a tangible net worth of at least $200.0 million and a net indebtedness to capitalization ratio of no greater than 65%.
| (ii) | $48.5 million (December 31, 2010 – $22.8 million) of the Company’s project specific financings consist of 14 secured VTB mortgages (December 31, 2010 – 11 secured VTB mortgages). |
Eleven secured VTB mortgages (December 31, 2010 – nine secured VTB mortgages) in the amount of $42.2 million (December 31, 2010 – $19.5 million) relate to raw land held for development by Brookfield Residential (Alberta) LP and Brookfield Homes (Ontario) Limited. This debt is repayable in Canadian dollars of C$43.1 million (December 31, 2010 – C$19.5 million). The interest rate on this debt ranges from 3.25% to 6.00% and the debt is secured by related lands. As at December 31, 2011, these borrowings have not been subject to financial covenants.
Two secured VTB mortgages (December 31, 2010 – one secured VTB mortgage) in the amount of $4.8 million (December 31, 2010 – $1.8 million) relate to raw land held for development by Brookfield Homes Holdings LLC. The interest rate on this debt is fixed at 5.00% and 10.00% and the debt is secured by related lands. As at December 31, 2011, these borrowings have not been subject to any financial covenants.
One secured VTB mortgage (December 31, 2010 – one secured VTB mortgage) in the amount of $1.5 million (December 31, 2010 – $1.5 million) relates to raw land held for development by Brookfield Residential (US) LLC. The interest rate on this debt is fixed at 6.00% and the debt is secured by related lands. As at December 31, 2011, these borrowings have not been subject to financial covenants.
As at December 31, 2011, the Company was in compliance with all financial covenants related to project specific financings.
The Company has four secured credit facilities with various Canadian banking lenders totalling $341.5 million (December 31, 2010 – $421.7 million) and one unsecured credit facility with a U.S. bank totalling $9.0 million (December 31, 2010 – nil). Bank indebtedness consists of the following:
| | | | | | | | |
| | | December 31 | |
| | | 2011 | | | 2010 | |
| | |
Secured credit facilities (i) | | $ | 341,502 | | | $ | 421,685 | |
Unsecured credit facility (ii) | | | 9,000 | | | | — | |
| | | | | | | | |
| | $ | 350,502 | | | $ | 421,685 | |
| | | | | | | | |
| (i) | The secured facilities are repayable in Canadian dollars in the amount of C$348.9 million (US$341.5 million) at December 31, 2011 (December 31, 2010 – C$421.0 million (US$421.7 million)). These facilities allow the Company to borrow up to approximately C$533.5 million (US$522.1 million) as at December 31, 2011 (December 31, 2010 – C$516.5 million (US$517.4 million)). The credit facilities bear interest between Canadian prime plus 0.50% to 1.00% for any amounts drawn and are repayable on demand with a term out period ranging from 90 to 364 days. The secured facilities are secured by fixed and floating charges over the land and housing inventory assets of the Canadian operations, a general charge over all assets relating to Canadian operations and a general charge over all of Brookfield Residential (Alberta) LP and Brookfield Homes (Ontario) Limited. |
| | |
| Brookfield Residential Properties Inc. | | 41 |
BROOKFIELD RESIDENTIAL PROPERTIES INC.
NOTES TO THE CONSOLIDATED FINANCIAL STATEMENTS
(all dollar amounts are in thousands of U.S. dollars)
The Brookfield Residential (Alberta) LP facilities include a minimum net worth requirement of C$300.0 million (US$293.6 million) and a debt to equity covenant of no greater than 1.75 to 1.0 for its limited partnership. The Brookfield Homes (Ontario) Limited facility includes two covenants: a minimum debt to tangible net worth ratio of 2.0 to 1.0 and a net worth requirement of C$80.0 million (US$78.3 million).
| (ii) | The unsecured credit facility is repayable in U.S. dollars in the amount of $9.0 million at December 31, 2011 (December 31, 2010 – nil). The facility was entered into on April 6, 2011 and permits the Company to borrow up to $10.0 million as at December 31, 2011. The credit facility bears an interest rate of LIBOR plus 3%. The facility requires Brookfield Homes Holdings LLC, an indirect wholly-owned subsidiary of the Company, to maintain a tangible net worth of at least $300.0 million, and a net indebtedness to tangible net worth of no greater than 2.5 to 1.0. |
As at December 31, 2011, the Company was in compliance with all financial covenants related to bank indebtedness.
On November 2, 2011, Brookfield Residential reached an agreement with Brookfield Asset Management Inc. to consolidate its two existing lines of credit of $225.0 million into one $300.0 million line.
At December 31, 2011, amounts due to affiliates includes $226.0 million (December 31, 2010 – $364.0 million) on an unsecured revolving operating facility with a subsidiary of the Company’s largest shareholder, Brookfield Asset Management Inc. Prior to the March 31, 2011 merger, one unsecured facility due to a subsidiary of Brookfield Office Properties had a balance drawn of $204.0 million at December 31, 2010. The unsecured facility was eliminated on completion of the merger transaction. The revolving operating facility is in a principal amount, not to exceed $300 million. This facility matures December 2015, bears interest at LIBOR plus 4.5% and could be fully drawn upon without violation of any covenants. During the year ended December 31, 2011, interest of $14.8 million (2010 – $10.2 million) was incurred related to this facility and the previously facilities.
These facilities have covenants to maintain a minimum total equity of $300.0 million and a consolidated net debt to book capitalization ratio of no greater than 65%. As of December 31, 2011, the Company was in compliance with all financial covenants relating to amounts due to affiliates.
Notes payable consists of the following:
| | | | | | | | |
| | | December 31 | |
| | | 2011 | | | 2010 | |
| | |
Senior note payable (a) | | $ | 259,355 | | | $ | — | |
Junior note payable (b) | | | 210,421 | | | | — | |
| | | | | | | | |
| | $ | 469,776 | | | $ | — | |
| | | | | | | | |
On March 31, 2011, the Company entered into two unsecured promissory notes payable to Brookfield Office Properties, a C$265.0 million (US$273.0 million) senior note and a C$215.0 million (US$221.5 million) junior subordinated note.
| (a) | The senior note had a fixed rate of interest of 6.5% and a term to December 31, 2015 with principal payments of C$50.0 million due on each of the last business day of 2012, 2013 and 2014 and the balance of C$115.0 million to be paid on December 31, 2015. On November 2, 2011, Brookfield Office Properties and the Company agreed to amend the terms of the $265.0 million of senior note transaction debt such that the scheduled principal payments of C$50.0 million during each of the next three years will be due along with the final payment of C$115.0 on December 31, 2015. These extended payments will bear interest from the date of the amendment at a fixed rate of 7.5%. |
| (b) | The C$215.0 million junior subordinated note bears a fixed rate of interest of 8.5% and is payable in full on December 31, 2020. |
The covenants with respect to both of these notes payable are that the Company maintains total equity of $750.0 million and a consolidated net debt to book capitalization ratio of no greater than 65%. As of December 31, 2011, the Company was in compliance with both covenants relating to notes payable.
BROOKFIELD RESIDENTIAL PROPERTIES INC.
NOTES TO THE CONSOLIDATED FINANCIAL STATEMENTS
(all dollar amounts are in thousands of U.S. dollars)
| Note 8. | Accounts Payable and Other Liabilities |
The components of accounts payable and other liabilities included in the Company’s balance sheets are summarized as follows:
| | | | | | | | |
| | | December 31 | |
| | | 2011 | | | 2010 | |
| | |
Trade payables and other accruals | | $ | 64,681 | | | $ | 81,178 | |
Development costs payable (a) | | | 49,357 | | | | 51,040 | |
Accrued and deferred compensation | | | 25,117 | | | | 33,857 | |
Consolidated land option contracts (b) | | | 24,098 | | | | 25,206 | |
Current income taxes payable (Note 9) | | | 21,179 | | | | — | |
Customer deposits | | | 16,350 | | | | 47,559 | |
Swap contracts (Note 14 (c) and (d)) | | | 15,603 | | | | 15,206 | |
Loans from other interests in consolidated subsidiaries (c) | | | 14,255 | | | | 14,168 | |
Warranty costs (Note 14 (b)) | | | 11,161 | | | | 12,166 | |
Share-based compensation (Note 12) | | | 5,619 | | | | 8,076 | |
| | | | | | | | |
| | $ | 247,420 | | | $ | 288,456 | |
| | | | | | | | |
| (a) | Provisions accrued for costs yet to be incurred within a subdivision where sales have taken place. The provision is based on the sold lots pro rata share of costs to be incurred for specified areas within each subdivision phase. |
| (b) | Includes the total future purchase price of land options contracts required to be consolidated under ASC Topic 810Consolidation, with a corresponding amount recorded in Housing and Land Inventory. See Note 2 “Housing and Land Inventory.” |
| (c) | Includes monies held on deposit from certain non-controlling members. |
Deferred income taxes reflect the net tax effects of temporary differences between the carrying amounts of the assets and liabilities for financial reporting purposes and the amounts used for income tax purposes. The differences that give rise to the net deferred tax (liability) / assets are as follows:
| | | | | | | | |
| | | December 31 | |
| | | 2011 | | | 2010 | |
Net deferred tax (liabilities) / assets | | | | | | | | |
Differences relating to land and housing inventory | | $ | (22,123 | ) | | $ | 16,332 | |
Compensation deductible for tax purposes when paid | | | 1,868 | | | | 8,686 | |
Differences related to derivative instruments | | | 4,780 | | | | 4,927 | |
Loss carry-forwards | | | 79,714 | | | | 45,317 | |
Other | | | 268 | | | | (37 | ) |
| | | | | | | | |
Net deferred tax assets before valuation allowance | | | 64,507 | | | | 75,225 | |
Cumulative valuation allowance | | | (92,280 | ) | | | — | |
| | | | | | | | |
Net deferred tax (liabilities) / assets | | $ | (27,773 | ) | | $ | 75,225 | |
| | | | | | | | |
During the year, the Company has recorded significant deferred tax assets. These deferred tax assets were generated primarily by inventory impairments in prior periods. In accordance with ASC Topic 740, the Company assessed whether a valuation allowance should be established based on its determination of whether it is more-likely-than-not that some portion of all of the deferred tax assets will not be realized.
The provision for income taxes for each of the fiscal years ended December 31, 2011 and 2010 is set forth below:
| | | | | | | | |
| | | December 31 | |
| | | 2011 | | | 2010 | |
Current | | $ | (22,240 | ) | | $ | (42,782 | ) |
Deferred | | | (103,085 | ) | | | (15,633 | ) |
| | | | | | | | |
| | $ | (125,325 | ) | | $ | (58,415 | ) |
| | | | | | | | |
| | |
| Brookfield Residential Properties Inc. | | 43 |
BROOKFIELD RESIDENTIAL PROPERTIES INC.
NOTES TO THE CONSOLIDATED FINANCIAL STATEMENTS
(all dollar amounts are in thousands of U.S. dollars)
A reconciliation of the Company’s effective tax rate from the federal statutory tax rate for the fiscal year ended December 31, 2011 and 2010 is as follows:
| | | | | | | | |
| | | December 31 | |
| | | 2011 | | | 2010 | |
Statutory rate | | | 26.5 | % | | | 28.0 | % |
Non-temporary differences | | | 1.6 | | | | — | |
Return to provision | | | 4.9 | | | | — | |
Risk difference from statutory rate | | | (7.4 | ) | | | (0.6 | ) |
Change in tax rates on temporary differences | | | (0.2 | ) | | | — | |
Change in valuation allowance | | | 70.9 | | | | — | |
Other | | | — | | | | 3.2 | |
| | | | | | | | |
Effective tax rate | | | 96.3 | % | | | 30.6 | % |
| | | | | | | | |
The Company currently operates in four different states in the U.S. and therefore is subject to various state tax jurisdictions. The Company estimates its tax liability based upon the individual taxing authorities’ regulations, estimates of income by taxing jurisdiction and the Company’s ability to utilize certain tax-saving strategies. The Company also operates in Alberta and Ontario, Canada, and is therefore is subject to provincial tax jurisdictions as well as federal tax legislation. Based on the Company’s estimate of the allocation of income / loss, as the case may be, among the various taxing jurisdictions and changes in tax regulations and their impact on the Company’s tax strategies, the estimated effective tax rate for the Company is 96.3% and 30.6%, for fiscal years 2011 and 2010, respectively. The increase in the effective rate for 2011 is due in large part to the valuation allowance taken on its U.S. deferred tax assets.
In accordance with the provision of ASC Topic 740, the Company assesses, in each quarter and at each reporting period, its ability to realize its deferred tax assets. In determining the need for a valuation allowance, the Company considered the following significant factors: an assessment of recent years’ profitability and losses, the Company’s expectation of profits based on margins and volumes expected to be realized, the long period for 10 to 20 years or more in all significant operating jurisdictions before the expiry of net operating losses, noting further that a substantial portion of the deferred tax asset is composed of deductible temporary differences that are not subject to an expiry period until realized under tax law. The Company assesses the ability to realize its deferred tax assets by taxing jurisdiction and therefore includes both the Canadian jurisdiction as well as the U.S. jurisdiction. Canadian operations continue to be profitable in the Ontario and Alberta markets and as such, it is more-likely-than-not that the deferred tax assets related to the Canadian companies can be realized.
The Company has recorded significant deferred tax assets for its U.S. operations. These deferred assets were generated primarily by inventory impairments. The Company believes that the continued downturn in the housing market, the uncertainty as to its length and magnitude, are significant evidence of the need for a valuation allowance against its net deferred tax assets. The Company has therefore recorded a valuation allowance against its entire net deferred tax assets related to its U.S. operations.
The Company is allowed to carryforward tax losses for up to 20 years and apply such tax losses to future taxable income to realized federal deferred tax assets. As of December 31, 2011, the Company believes it will have approximately $80.0 million of tax loss carryforwards, resulting from losses that it recognized on its prior period tax returns. The Company will be able to reverse the previously recognized valuation allowances during any future period for which it reports book income before income taxes. The Company will continue to review its deferred tax assets in accordance with ASC Topic 740.
| Note 10. | Other Interests in Consolidated Subsidiaries, Unconsolidated Entities and Non-controlling Interest |
Other interests in consolidated subsidiaries include ownership interests of certain business unit presidents of the Company totalling $32.4 million (December 31, 2010 – $42.5 million). In the event that a business unit president (“Minority Member”) of the Company is no longer employed by an affiliate of the Company, the Company has the right to purchase the Minority Member’s interest and the Minority Member has the right to require the Company to purchase their interest. Should such rights be exercised, the purchase price will be based on the then estimated value of the business unit’s net assets.
The following table reflects the change in the Company’s other interests in consolidated subsidiaries for the years ended December 31, 2011 and 2010:
| | | | | | | | |
| | | December 31 | |
| | | 2011 | | | 2010 | |
| | |
Other interests in consolidated subsidiaries, beginning of year | | $ | 42,461 | | | $ | 47,011 | |
Net loss attributable to other interests in consolidated subsidiaries | | | (2,453 | ) | | | (976 | ) |
Distributions from other interests in consolidated subsidiaries | | | (7,574 | ) | | | (3,574 | ) |
| | | | | | | | |
Other interests in consolidated subsidiaries, end of year | | $ | 32,434 | | | $ | 42,461 | |
| | | | | | | | |
BROOKFIELD RESIDENTIAL PROPERTIES INC.
NOTES TO THE CONSOLIDATED FINANCIAL STATEMENTS
(all dollar amounts are in thousands of U.S. dollars)
Non-controlling interest includes third-party investments of consolidated entities of $6.4 million (December 31, 2010 – $6.5 million).
In accordance with ASC Topic 810, non-controlling interest has been classified as a component of total equity and the net income / (loss) on the consolidated statement of operations has been adjusted to include the net loss attributable to non-controlling interest, which for the year ended December 31, 2011 was nil (2010 – nil) and other interests in consolidated subsidiaries for the year ended December 31, 2011 was $7.6 million (2010 – $1.0 million).
As of January 1, 2010, the Company had a 50% non-controlling interest in a land development project with a third party where by the assets, liabilities and results of operations were consolidated into the financial statements with the corresponding non-controlling interest presented. On March 9, 2010, the Company acquired the remaining 50% non-controlling interest in the unconsolidated entity for a nominal dollar amount. The excess of the non-controlling interest acquired over the consideration was recorded as a deemed contribution to equity.
The following table reflects the changes in the Company’s non-controlling interest related to the unconsolidated entity for the year ended December 31, 2010:
| | | | |
| | | December 31 | |
| | | 2010 | |
| |
Balance, beginning of year | | $ | 8,788 | |
Net loss attributable to non-controlling interest | | | (488 | ) |
Non-controlling interest acquired | | | (8,300 | ) |
| | | | |
Balance, end of year | | $ | — | |
| | | | |
The Company has an unlimited number of preferred shares without par value are authorized, of which 70,002 shares are designated as Brookfield Residential 8% convertible preferred shares, series A.
Preferred shares issued and outstanding changed as follows:
| | | | |
| | | December 31 | |
| | | 2011 | |
| |
Preferred shares outstanding, beginning of year | | | 9,995,739 | |
Conversion of preferred shares | | | (9,925,737 | ) |
| | | | |
Preferred shares outstanding, end of year | | | 70,002 | |
| | | | |
The Brookfield Residential 8% convertible preferred shares are convertible at the option of the shareholder into common shares of the Company, at a conversion rate of 2.731787607 common shares per convertible preferred share, which is equivalent to a conversion price of $9.15 per share. Dividends on convertible preferred shares will be fully cumulative, without interest, from the date of original issuance of the convertible preferred shares and will be payable semi-annually in arrears. There were no preferred share dividends in arrears for the year ended December 31, 2011 (December 31, 2010 – nil). The 8% convertible preferred shares, series A are perpetual and do not have a maturity date; however, beginning June 30, 2014, if the 90-day volume weighted average market price of the Company’s common shares is greater than $18.30 per share, Brookfield Residential may, at its option, require all such preferred shares to be automatically converted into common shares.
As part of the merger transaction, $38.8 million of preferred shares issued by the Brookfield Office Properties’ residential division were eliminated upon the completion of the merger transaction.
| | |
| Brookfield Residential Properties Inc. | | 45 |
BROOKFIELD RESIDENTIAL PROPERTIES INC.
NOTES TO THE CONSOLIDATED FINANCIAL STATEMENTS
(all dollar amounts are in thousands of U.S. dollars)
The authorized common share capital consists of an unlimited number of common voting shares. Common shares issued and outstanding changed as follows:
| | | | |
| | | December 31
2011 | |
| |
Common shares outstanding, beginning of year | | | 53,808,461 | |
Conversion of common shares upon merger transaction | | | (12,650,341 | ) |
Issuance of common shares upon merger transaction | | | 60,184,598 | |
| | | | |
Common shares issued, end of year | | | 101,342,718 | |
| | | | |
Repurchase of common shares for escrowed stock plan (Note 12(a)) | | | (2,000,000 | ) |
| | | | |
Common shares outstanding, end of year | | | 99,342,718 | |
| | | | |
On March 31, 2011, Brookfield Residential consolidated its 53,808,461 common shares held by Brookfield Asset Management Inc. at the merger conversion ratio of 0.76490053 to 41,158,120 common shares.
On completion of the merger transaction, Brookfield Office Properties received 51,500,000 common shares of Brookfield Residential common shares for its contribution of BPO Residential. In addition 11,354,500 shares of Brookfield Homes common stock was converted at the merger exchange ratio of 0.76490053 to 8,684,598 common shares of Brookfield Residential.
Prior to March 31, 2011, Brookfield Homes had a share repurchase program that allowed Brookfield Homes to repurchase in aggregate up to $144.0 million of the Company’s outstanding common shares. During the year ended December 31, 2010, 1,213,393 treasury shares were issued pursuant to a stock dividend paid to the preferred stockholders. This issuance of treasury shares was accounted for on an average cost basis. The difference between the amount of the $10.0 million dividend and the average cost of the treasury shares of $55.2 million issued has been charged to retained earnings. At March 31, 2011, the treasury stock of Brookfield Homes of $110.7 million was cancelled as a result of the completion of the merger transaction.
| Note 12. | Share-Based Compensation |
Options issued under the Company’s Management Share Option Plan vest over a period of up to five years, expire 10 years after the grant date, and are settled through issuance of common shares. The exercise price is the volume-weighted average trading price for common shares on the New York Stock Exchange for the five business days preceding the effective grant date.
As a result of the merger transaction, the outstanding options of Brookfield Homes were exchanged for options under the Company’s share plan, exercisable upon the same terms and conditions as under the Brookfield Homes share plans. At March 31, 2011, the in-the-money Brookfield Homes options were converted at the merger exchange ratio of 0.76490053 Brookfield Residential options for each Brookfield Homes option. The out-of-the-money Brookfield Homes options were cancelled and replaced with new options of Brookfield Residential with an equivalent Black-Scholes value. All values and disclosures below relating to Brookfield Homes’ options have been converted at the above exchange ratio to disclose the Brookfield Residential equivalent.
Brookfield Residential grants options to purchase shares at the exercise price of the options, determined in accordance with the stock option plan. The fair value of the Company’s stock option awards is estimated at the grant date using the Black-Scholes option-pricing model that uses the assumptions noted in the table below. The fair value of the Company’s stock option awards are expensed over the vesting period of the stock options. Expected volatility is based on historical volatility of Brookfield Residential’s and Brookfield Homes Corporation’s common shares. The risk-free rate for periods within the contractual life of the stock option award is based on the yield curve of a zero-coupon U.S. Treasury bond with a maturity equal to the expected term of the stock option award granted. The Company uses historical data obtained from Brookfield Residential and Brookfield Homes to estimate stock option exercises and forfeitures within its valuation model. The expected term of stock option awards granted for some participants is derived from historical exercise experience under the Company’s stock option plan and represents the period of time that stock option awards granted are expected to be outstanding.
During the years ended December 31, 2011 and 2010, Brookfield Residential granted a total of 1,618,380, and 442,877 new share options, respectively, to eligible employees that are subject to graded vesting. The Company also granted 1,500,000 escrowed stock options to an executive. The significant weighted average assumptions relating to the valuation of the Company’s stock options granted during the years ended December 31, 2011 and 2010 are as follows:
BROOKFIELD RESIDENTIAL PROPERTIES INC.
NOTES TO THE CONSOLIDATED FINANCIAL STATEMENTS
(all dollar amounts are in thousands of U.S. dollars)
| | | | | | | | |
| | | December 31 | |
| | 2011 | | | 2010 | |
| | |
Dividend yield | | | — | | | | — | |
Volatility rate | | | 45 | % | | | 72 | % |
Risk-free interest rate | | | 2.5 | % | | | 3.7 | % |
Expected option life (years) | | | 7.5 | | | | 7.5 | |
The total compensation cost recognized in income relating to the Company’s stock options during the years ended December 31, 2011 and 2010 was an expense of $5.7 million and $1.1 million, respectively. The following tables set out the number of common shares that employees of the Company may acquire under options granted under the Company’s stock option plans:
| | | | | | | | | | | | | | | | |
| | | December 31, 2011 | | | December 31, 2010 | |
| | | Total
Shares | | | Total
Weighted
Average
per Share
Exercise
Price | | | Total
Shares | | | Total
Weighted
Average
per Share
Exercise
Price | |
| | | | |
Outstanding, beginning of year | | | 2,017,043 | | | $ | 12.92 | | | | 1,648,361 | | | $ | 13.35 | |
Granted | | | 3,118,380 | | | $ | 10.96 | | | | 442,877 | | | $ | 10.18 | |
Exercised | | | (34,421 | ) | | $ | 3.09 | | | | (29,066 | ) | | $ | 3.22 | |
Cancelled | | | (427,576 | ) | | $ | 41.52 | | | | (45,129 | ) | | $ | 8.05 | |
| | | | | | | | | | | | | | | | |
Outstanding, end of year | | | 4,673,426 | | | $ | 9.07 | | | | 2,017,043 | | | $ | 12.92 | |
| | | | | | | | | | | | | | | | |
Options exercisable, end of year | | | 217,844 | | | $ | 5.97 | | | | 387,805 | | | $ | 34.50 | |
| | | | | | | | | | | | | | | | |
At December 31, 2011, the aggregate intrinsic value of options currently exercisable is $0.6 million (December 31, 2010 – $0.8 million) and the aggregate intrinsic value of options outstanding is $3.0 million (December 31, 2010 – $5.0 million).
A summary of the status of the Company’s unvested options included in equity as of December 31, 2011 and 2010 and changes during the years ended December 31, 2011 and 2010 are as follows:
| | | | | | | | | | | | | | | | |
| | | December 31, 2011 | | | December 31, 2010 | |
| | | Shares | | | Weighted
Average
Fair Value
Per Share | | | Shares | | | Weighted
Average
Fair Value
Per Share | |
| | | | |
Unvested options outstanding, beginning of year | | | 1,629,238 | | | $ | 3.26 | | | | 1,388,906 | | | $ | 1.97 | |
Granted | | | 3,118,380 | | | $ | 5.35 | | | | 442,877 | | | $ | 7.03 | |
Vested | | | (223,198 | ) | | $ | 4.21 | | | | (158,181 | ) | | $ | 1.45 | |
Cancelled | | | (68,838 | ) | | $ | 0.53 | | | | (44,364 | ) | | $ | 4.50 | |
| | | | | | | | | | | | | | | | |
Unvested options outstanding, end of year | | | 4,455,582 | | | $ | 4.77 | | | | 1,629,238 | | | $ | 3.26 | |
| | | | | | | | | | | | | | | | |
At December 31, 2011, there was $11.7 million (December 31, 2010 – $3.6 million) of unrecognized expense related to unvested options, which is expected to be recognized over the remaining weighted average period of 4.1 years (December 31, 2010 – 2.8 years).
The Corporation’s Board of Directors approved an escrowed stock plan on June 16, 2011, which allows a certain executive to increase his ownership of Brookfield Residential’s common shares. Under the escrowed plan, a private company was capitalized with common shares (the “escrowed shares”) and preferred shares issued to Brookfield Residential for cash proceeds. On June 23, 2011, the initial proceeds were used to purchase 2 million common shares of the Corporation from Brookfield Asset Management Inc. with 75% of the escrowed shares granted to the executive. Awards under the escrowed stock plan will not vest until five years after the date of grant and will ultimately be received in the form of common shares. The escrowed shares vest on and must be held until the fifth anniversary of the grant date. At a date at least five years from and no more than ten years from the grant date, all escrowed shares held will be acquired by the Company in exchange for issuance of common shares from treasury of the Company, where the value of the common shares being issued is equal to the value of the escrowed shares being acquired. The value of the escrowed shares will be equal to the value of the common shares held by the private
| | |
| Brookfield Residential Properties Inc. | | 47 |
BROOKFIELD RESIDENTIAL PROPERTIES INC.
NOTES TO THE CONSOLIDATED FINANCIAL STATEMENTS
(all dollar amounts are in thousands of U.S. dollars)
company less the net liabilities and preferred share obligations of the private company. The private company will then be immediately wound up or merged into the Company and the common shares held by the private company will be cancelled, resulting in a reduction in the total number of common shares issued.
| (b) | Deferred Share Unit Plan |
Brookfield Homes had a Deferred Share Unit Plan (“DSUP”) under which certain of its executive officers and directors could, at their option, receive all or a portion of their annual bonus awards or retainers, respectively, in the form of deferred share units. Brookfield Homes could also make additional grants of units to its executives and directors pursuant to the DSUP. In addition, Brookfield Homes had a Senior Operating Management Deferred Share Unit Plan (“MDSUP”), under which certain senior operating management employees received a portion of their annual compensation in the form of deferred share units. At March 31, 2011, as a result of the merger transaction, the outstanding deferred share units of Brookfield Homes’ issued under the DSUP and MDSUP were exchanged for deferred share units of Brookfield Residential deferred share units at the merger exchange ratio of 0.76490053. All values and disclosures below relating to Brookfield Homes’ DSUPs and MDSUPs have been converted at the above exchange ratio to disclose the Brookfield Residential equivalent.
The following table sets out changes in and the number of deferred share units that executives, directors and senior operating management employees may redeem under the Brookfield Residential’s DSUP and MDSUP at December 31, 2011 and 2010:
| | | | | | | | |
| | | December 31 | |
| | | 2011 | | | 2010 | |
| | |
Outstanding, beginning of year | | | 723,747 | | | | 716,030 | |
Granted | | | 1,327,781 | | | | 18,240 | |
Redeemed | | | (180,428 | ) | | | (10,523 | ) |
| | | | | | | | |
Outstanding, end of year | | | 1,871,100 | | | | 723,747 | |
| | | | | | | | |
Deferred share units vested at December 31 | | | 520,574 | | | | 467,204 | |
| | | | | | | | |
Of the 1,871,100 units outstanding under the DSUP, 1,350,526 (December 31, 2010 – 256,543) units vest over the next five years. As of December 31, 2011, 26,020 (December 31, 2010 – 56,124) units are outstanding under the MDSUP.
The liability of $5.6 million (December 31, 2010 – $8.1 million) relating to the DSUP and MDSUP is included in accounts payable and other liabilities. The financial statement impact relating to the DSUP and MDSUP for years ended December 31, 2011 and 2010 was an expense of $0.3 million and expense of $2.3 million, respectively.
| Note 13. | Earnings Per Share |
Basic and diluted earnings per share for the years ended December 31, 2011 and 2010 were calculated as follows:
| | | | | | | | |
| | | Years Ended December 31 | |
| | | 2011 | | | 2010 | |
Numerator: | | | | | | | | |
Net income attributable to Brookfield Residential | | $ | 7,288 | | | $ | 132,479 | |
Less: Preferred share dividends | | | (178 | ) | | | (19,995 | ) |
| | | | | | | | |
Net income attributable to common shareholders | | $ | 7,110 | | | $ | 112,484 | |
| | | | | | | | |
Denominator: | | | | | | | | |
Basic weighted average shares outstanding | | | 99,949 | | | | 101,343 | |
Net effect of share options assumed to be exercised | | | 268 | | | | 88 | |
| | | | | | | | |
Diluted weighted average shares outstanding | | | 100,217 | | | | 101,431 | |
| | | | | | | | |
Basic earnings per share | | $ | 0.07 | | | $ | 1.11 | |
| | | | | | | | |
Diluted earnings per share | | $ | 0.07 | | | $ | 1.11 | |
| | | | | | | | |
As the merger transaction was deemed to take place between entities under common control and has been accounted for as continuity of interest, the years ended December 31, 2011 and 2010, use the basic and diluted average shares outstanding of the combined entities.
| Note 14. | Commitments, Contingent Liabilities and Other |
(a) A subsidiary of the Company is party to a lawsuit that has been filed in Delaware Chancery Court, alleging breach of fiduciary duties relating to the merger transaction. The subsidiary has filed a Motion to Dismiss the Complaint on the grounds that no fiduciary duties are owed and, if unsuccessful, management intends to vigorously defend these claims and believes the claims are without merit and that this action will not have a material adverse effect on the consolidated financial condition,
BROOKFIELD RESIDENTIAL PROPERTIES INC.
NOTES TO THE CONSOLIDATED FINANCIAL STATEMENTS
(all dollar amounts are in thousands of U.S. dollars)
results of operations or cash flows of the Company. An estimate of the possible loss or range of loss cannot be made at this time.
(b) When selling a home, the Company’s subsidiaries provide customers with a limited warranty. The Company estimates the costs that may be incurred under each limited warranty and records a liability in the amount of such costs at the time the revenue associated with the sale of each home is recognized. In addition, the Company has insurance in place where its subsidiaries are subject to the respective warranty statutes in the state or province where the Company conducts business, which range up to ten years for latent construction defects. Factors that affect the Company’s warranty liability include the number of homes sold, historical and anticipated rates of warranty claims, and cost per claim. The Company periodically assesses the adequacy of its recorded warranty liabilities and adjusts the amounts as necessary. The following table reflects the changes in the Company’s estimated warranty liability for the years ended December 31, 2011 and 2010:
| | | | | | | | |
| | | Years Ended December 31 | |
| | | 2011 | | | 2010 | |
| | |
Balance, beginning of year | | $ | 12,166 | | | $ | 13,892 | |
Payments and other adjustments made during the year | | | (3,948 | ) | | | (3,464 | ) |
Warranties issued during the year | | | 3,045 | | | | 3,783 | |
Adjustments made for pre-existing warranties | | | (102 | ) | | | (2,045 | ) |
| | | | | | | | |
Balance, end of year | | $ | 11,161 | | | $ | 12,166 | |
| | | | | | | | |
(c) The Company is exposed to financial risk that arises from fluctuations in interest rates. The interest-bearing assets and liabilities of the Company are mainly at floating rates and, accordingly, their fair values approximate their carrying value. The Company would be negatively impacted on balance, if interest rates were to increase. From time to time, the Company enters into interest rate swap contracts. As at December 31, 2011, the Company had four interest rate swap contracts outstanding totalling $100.0 million at an average rate of 4.9% per annum. The contracts expire between 2012 and 2017. At December 31, 2011, the fair market value of the contracts was a liability of $15.6 million (December 31, 2010 – liability of $15.2 million) and was included in accounts payable and other liabilities. Expense of $7.0 million and $1.0 million, respectively, was recognized during the years ended December 31, 2011 and 2010, respectively, and was included in other (expense) / income. All interest rate swaps are recorded at fair market value and fluctuations in fair market value are presented in the statements of operations as hedge accounting has not been applied.
The fair value measurements for the interest rate swap contracts are determined based on notional amounts, terms to maturity, and the LIBOR rates. The LIBOR rates vary depending on the term to maturity and the conditions set out in the underlying swap agreements.
(d) The Company is exposed to financial risk that arises from fluctuations in its common share price. To hedge against future deferred share unit payments, in September 2011, the Company entered into a total return swap transaction at an average cost of $6.42 per share on 782,483 shares, maturing in September 2016. In August 2010, the Company entered into a total return swap transaction at an average cost of $9.39 per share on 782,482 shares, which matured in August 2011. At December 31, 2011, the fair market value of the total return swap was an asset of $1.1 million and was included in accounts receivable and other assets (December 31, 2010 – asset of $2.2 million). Expense of $3.5 million and income of $1.4 million were recognized during the years ended December 31, 2011 and 2010, respectively, and were included in selling, general and administrative expense. Also included in selling, general and administrative expense for the years ended December 31, 2011 and 2010 was income of $2.4 million and expense of $3.4 million, respectively, relating to the Company’s share-based compensation plans. The total return swap is recorded at fair market value and is recorded through the statements of operations because hedge accounting has not been applied. See Note 16 for additional disclosure.
(e) The Company has committed to future minimum payments for lease and other obligations as follows:
| | | | |
| Year of Expiry | | | |
| |
2012 | | $ | 5,497 | |
2013 | | | 5,272 | |
2014 | | | 4,135 | |
2015 | | | 3,146 | |
2016 | | | 2,809 | |
Thereafter | | | 5,694 | |
| | | | |
| | $ | 26,553 | |
| | | | |
| | |
| Brookfield Residential Properties Inc. | | 49 |
BROOKFIELD RESIDENTIAL PROPERTIES INC.
NOTES TO THE CONSOLIDATED FINANCIAL STATEMENTS
(all dollar amounts are in thousands of U.S. dollars)
(f) As at December 31, 2011, $15.5 million (December 31, 2010 – $19.7 million) of the amount held in other assets related to land purchase obligations. The total amount owing on these obligations is $69.7 million (December 31, 2010 – $86.5 million).
(a) The Company has provided financial guarantees for bonds which, as at December 31, 2011, amount to $18.1 million (December 31, 2010 – $18.1 million), which have not been recognized in the consolidated financial statements. These guarantees arose from the issuance of tax-exempt municipal bonds for infrastructure construction in the Company’s U.S. operations. The terms of the guarantees span the life of the projects, which range from three to ten years. The values of the guarantees are reduced as completion milestones are achieved on the projects and is terminated on or before community build out. Payment of the guarantees is triggered in the event that the debt payments to the bondholders are not fulfilled. The Company has not been required to make any payments under these municipal bonds.
(b) In the ordinary course of business, the Company has provided construction guarantees in the form of letters of credit and performance bonds. As at December 31, 2011, these guarantees amounted to $238.3 million (December 31, 2010 – $236.1 million), which have not been recognized in the consolidated financial statements. However, the proportionate development costs that relate to lots that have been sold are accrued in Accounts Payable and Other Liabilities. Such guarantees are required by the municipalities in which the Company operates before construction permission is granted.
The scope of these guarantees covers specific construction obligations of individual projects as they are developed, and the term of these guarantees span the life of the projects, which range from three to ten years. The values of the guarantees are reduced as completion milestones are achieved on the projects.
These guarantees are terminated only when the municipality has issued conditions to release a Final Acceptance Certificate or similar document to the Company, which verifies that the Company has fulfilled all its contractual obligations. Payments of the guarantees are triggered in the event expired letters of credit or performance bonds are not renewed and the contractual obligations have not been fulfilled. The Company has not been required to make any payments under these construction guarantees.
| Note 16. | Fair Value Measurements |
ASC Topic 820Fair Value Measurements and Disclosures provides a framework for measuring fair value, expands disclosures about fair value measurements and establishes a fair value hierarchy which requires a company to prioritize the use of observable inputs and minimize the use of unobservable inputs in measuring fair value. The hierarchy is summarized as follows:
| | • | | Level 1 – Fair value determined based on quoted prices in active markets for identical assets. |
| | • | | Level 2 – Fair value determined using significant other observable inputs. |
| | • | | Level 3 – Fair value determined using significant unobservable inputs. |
The Company’s financial assets and liabilities are measured at fair value on a recurring basis and are as follows:
| | | | | | | | |
| | | Fair Value Measurements Using Significant
Observable Inputs (Level 2) | |
| | | 2011 | | | 2010 | |
| | |
Interest rate swap contracts at December 31 | | $ | (15,603 | ) | | $ | (15,206 | ) |
| | | | | | | | |
The fair value measurements for the interest rate swap contracts are determined based on notional amounts, terms to maturity, and the LIBOR rates. The LIBOR rates vary depending on the term to maturity and the conditions set out in the underlying swap agreements.
| | | | | | | | |
| | | Fair Value Measurements Using Significant
Unobservable Inputs (Level 3) | |
| | | 2011 | | | 2010 | |
| | |
Equity swap contract at December 31 | | $ | 1,088 | | | $ | 2,238 | |
| | | | | | | | |
The fair value measurement for the equity swap contract is determined based on the notional amount, share price, the number of underlying shares and the three month LIBOR rate.
BROOKFIELD RESIDENTIAL PROPERTIES INC.
NOTES TO THE CONSOLIDATED FINANCIAL STATEMENTS
(all dollar amounts are in thousands of U.S. dollars)
The following is a reconciliation of Level 3 (equity swaps) fair measurements:
| | | | | | | | |
| | | Year Ended December 31 | |
| | | 2011 | | | 2010 | |
Balance, beginning of year | | $ | 2,238 | | | $ | 674 | |
Total (losses) / gains for the year: | | | | | | | | |
Included in earnings (or changes in net assets) | | | (3,477 | ) | | | 1,564 | |
Purchases issues, sales, and settlements: | | | | | | | | |
Purchases | | | — | | | | — | |
Issues | | | — | | | | — | |
Sales | | | — | | | | — | |
Settlements | | | 2,327 | | | | — | |
| | | | | | | | |
Balance, end of year | | $ | 1,088 | | | $ | 2,238 | |
| | | | | | | | |
The fair value measurements for housing and land inventory were determined by comparing the carrying amount of an asset to its expected future cash flows. To arrive at the estimated fair value of land and housing inventory deemed to be impaired during the year ended December 31, 2011, the Company estimated the cash flow for the life of each project. Specifically, project by project, the Company evaluated the margins on homes that have been closed, margins on sales contracts which are in backlog, estimated margins with regard to future home sales over the life of the projects, as well as estimated margins with respect to future land sales. The Company evaluated and continues to evaluate projects where inventory is turning over more slowly than expected or whose average sales price and margins are declining and are expected to continue to decline. These projections take into account the specific business plans for each project and management’s best estimate of the most probable set of economic conditions anticipated to prevail in the market area. Such projections generally assume current home selling prices, with cost estimates and sales rates for short-term projects consistent with recent sales activity. For longer-term projects, planned sales rates for 2012 and 2013 generally assume recent sales activity and normalized sales rates beyond 2013. If the future undiscounted cash flows are less than the carrying amount, the asset is considered to be impaired and is then written down to fair value less estimated selling costs.
There are several factors that could lead to changes in the estimate of future cash flows for a given project. The most significant of these include the sales pricing levels actually realized by the project, the sales rate, and the costs incurred to construct the homes. The sales pricing levels are often inter-related with sales rates for a project, as a price reduction usually results in an increase in the sales rate. Further, pricing is heavily influenced by the competitive pressures facing a given community from both new homes and existing homes, including foreclosures.
The Company has reviewed all of its projects for impairment in accordance with the provisions of ASC Topic 360Property, Plant and Equipment and ASC Topic 820Fair Value Measurements and Disclosures. For the years ended December 31, 2011 and December 31, 2010, no impairment charge was recognized.
Receivables are measured at amortized cost. Carrying value approximates fair value due to the floating interest rates being charged or due to the short-term nature of the assets.
The Company’s financial liabilities, which include project specific and other financings, bank indebtedness, due to affiliates, notes payable and accounts payable and other liabilities, are measured at amortized cost.
The fair value of debt with fixed interest rates is determined by discounting contractual principal and interest payments at estimated current market interest rates determined with reference to current benchmark rates for a similar term and current credit spreads for debt with similar terms and risk. As at December 31, 2011, the fair value exceeded its book value of all outstanding debt by $55.9 million (December 31, 2010 – fair value of debt exceeded book value by $6.0 million). The lands to which these borrowings relate generally secure these principal amounts.
The carrying value of bank indebtedness approximates fair value due to its floating rate nature and the carrying value of accounts payable and other liabilities approximates fair value due to their short-term nature.
| Note 17. | Segmented Information |
As defined in ASC Topic 280,Segmented Reporting, the Company has the following segments: Canada, California and Central and Eastern U.S.
The Company is a land developer and residential homebuilder. The Company is organized and manages its business based on the geographical areas in which it operates. Each of the Company’s segments specializes in lot entitlement and development and the construction of single-family and multi-family homes. The Company evaluates performance and allocates capital based primarily on return on assets together with a number of other risk factors. Earnings performance is measured using segment
| | |
| Brookfield Residential Properties Inc. | | 51 |
BROOKFIELD RESIDENTIAL PROPERTIES INC.
NOTES TO THE CONSOLIDATED FINANCIAL STATEMENTS
(all dollar amounts are in thousands of U.S. dollars)
operating income. The accounting policies of the segments are the same as those referred to in Note 1, “Significant Accounting Policies.”
The following tables summarize select information on the Company’s statements of operations and balance sheets by reportable segments:
| | | | | | | | | | | | | | | | | | | | |
| | | Year Ended December 31, 2011 | |
| | | Canada | | | California | | | Central and
Eastern U.S. | | | Corporate
and Other | | | Total | |
| | | | | |
Revenues | | $ | 767,241 | | | $ | 163,244 | | | $ | 77,600 | | | $ | — | | | $ | 1,008,085 | |
Direct cost of sales | | | (505,820 | ) | | | (159,565 | ) | | | (74,756 | ) | | | — | | | | (740,141 | ) |
| | | | | | | | | | | | | | | | | | | | |
| | | 261,421 | | | | 3,679 | | | | 2,844 | | | | — | | | | 267,944 | |
Expenses | | | (44,265 | ) | | | (17,019 | ) | | | (21,056 | ) | | | (55,444 | ) | | | (137,784 | ) |
| | | | | | | | | | | | | | | | | | | | |
Income before income taxes | | $ | 217,156 | | | $ | (13,340 | ) | | $ | (18,212 | ) | | $ | (55,444 | ) | | $ | 130,160 | |
| | | | | | | | | | | | | | | | | | | | |
Total assets | | $ | 1,171,625 | | | $ | 692,017 | | | $ | 712,436 | | | $ | 2,721 | | | $ | 2,578,799 | |
| | | | | | | | | | | | | | | | | | | | |
| |
| | | Year Ended December 31, 2010 | |
| | | Canada | | | California | | | Central and
Eastern U.S. | | | Corporate
and Other | | | Total | |
Revenues | | $ | 599,316 | | | $ | 242,658 | | | $ | 112,200 | | | $ | — | | | $ | 954,174 | |
Direct cost of sales | | | (379,459 | ) | | | (204,826 | ) | | | (102,996 | ) | | | — | | | | (687,281 | ) |
| | | | | | | | | | | | | | | | | | | | |
| | | 219,857 | | | | 37,832 | | | | 9,204 | | | | — | | | | 266,893 | |
Expenses | | | (22,546 | ) | | | (25,036 | ) | | | (16,322 | ) | | | (13,559 | ) | | | (77,463 | ) |
| | | | | | | | | | | | | | | | | | | | |
Income before income taxes | | $ | 197,311 | | | $ | 12,796 | | | $ | (7,118 | ) | | $ | (13,559 | ) | | $ | 189,430 | |
| | | | | | | | | | | | | | | | | | | | |
Total assets | | $ | 1,170,310 | | | $ | 751,234 | | | $ | 714,514 | | | $ | — | | | $ | 2,636,058 | |
| | | | | | | | | | | | | | | | | | | | |
The following tables set forth information on unconsolidated entities by the Company’s reportable segments:
| | | | | | | | |
| | | Years Ended December 31 | |
| Equity in (Loss) / Earnings from Unconsolidated Entities | | 2011 | | | 2010 | |
| | |
Canada | | $ | — | | | $ | (69 | ) |
California | | | 4,256 | | | | 1,370 | |
Central and Eastern U.S. | | | (137 | ) | | | (604 | ) |
| | | | | | | | |
Subtotal | | | 4,119 | | | | 697 | |
| | | | | | | | |
Corporate and other | | | — | | | | (958 | ) |
| | | | | | | | |
Total | | $ | 4,119 | | | $ | (261 | ) |
| | | | | | | | |
| |
| | | Years Ended December 31 | |
| | 2011 | | | 2010 | |
| Investments in Unconsolidated Entities | | | | | | |
| | |
Canada | | $ | 12,537 | | | $ | 12,834 | |
California | | | 84,181 | | | | 77,790 | |
Central and Eastern U.S. | | | 47,103 | | | | 46,579 | |
| | | | | | | | |
Subtotal | | | 143,821 | | | | 137,203 | |
| | | | | | | | |
Corporate and other | | | — | | | | — | |
| | | | | | | | |
Total | | $ | 143,821 | | | $ | 137,203 | |
| | | | | | | | |
BROOKFIELD RESIDENTIAL PROPERTIES INC.
NOTES TO THE CONSOLIDATED FINANCIAL STATEMENTS
(all dollar amounts are in thousands of U.S. dollars)
| Note 18. | Related Party Transactions |
There are agreements among the Company’s affiliates to which we are a party or subject to, including a name license, one unsecured revolving credit facilities, and two notes payable. Related parties include the directors, executive officers, director nominees or 5% shareholders, and their respective immediate family members. The Company’s significant related party transactions as of December 31, 2011 were:
| • | | Notes payable of $469.8 million (December 31, 2010 – nil) are due to Brookfield Office Properties, an affiliate of the Company. The notes consist of a C$265.0 million senior unsecured promissory note and a C$215.0 million junior unsecured promissory note. For the years ended December 31, 2011 and 2010, interest of $27.4 million and nil, respectively, was incurred relating to these facilities. |
| • | | Unsecured revolving operating facility in the aggregate principal amount of $226.0 million (December 31, 2010 – $160.0 million) with a subsidiary of Brookfield Asset Management Inc. For the years ended December 31, 2011 and 2010, interest of $14.8 million and $10.2 million, respectively, was incurred relating to this facility. |
| • | | A subsidiary of the Company entered into an agreement to purchase two million common shares of the Company from Brookfield Asset Management Inc. in order to fund an escrowed stock plan without dilution to shareholders on June 23, 2011. The total consideration relating to the purchase of the shares was $19.3 million (2010 – nil). |
| | |
| Brookfield Residential Properties Inc. | | 53 |
SHAREHOLDER INFORMATION

Shareholder Inquiries
Brookfield Residential Properties Inc. welcomes inquiries from shareholders, analysts, media representatives and other interested parties. Questions relating to investor relations or media inquiries can be directed to:
Brookfield Residential Properties Inc.
4906 Richard Road SW, Calgary, Alberta, T3E 6L1
Shareholder Inquires: Tel: 403.231.8900 Fax: 403.231.8960
Email: investorrelations@brookfieldrp.com
Website: www.brookfieldrp.com
Shareholder questions relating to address changes and share certificates should be directed to the company’s Transfer Agent and Registrar (Canadian Stock Transfer Company Inc. acts as the Administrative Agent for CIBC Mellon Trust Company):
CIBC Mellon Trust Company
P.O. Box 700, Station B, Montreal, Quebec, H3B 3K3
Tel: 416-682-3860 or Toll-Free: 1-800-387-0825, Fax: 1-888-249-6189
Email: inquiries@canstockta.com
Website: www.canstockta.com
Annual Meeting of Shareholders
Brookfield Residential’s 2012 Annual and Special Meeting of Shareholders will be held on May 8, 2012 at 11:00 am (Pacific Time) at The Hilton Costa Mesa Hotel, 3050 Bristol Street, Costa Mesa, California 92626.
Stock Exchange Listings
| | |
| Ticker and Exchanges: | | BRP – New York (NYSE) and Toronto (TSX) |
| Shares Issued: | | 101,342,718 as of December 31, 2011 |
Forward-Looking Statements: This Annual Report, including the letter to shareholders contains forward-looking information within the meaning of Canadian securities laws and “forward-looking statements” within the meaning of Section 27A of the U.S. Securities Act of 1933, as amended, Section 21E of the U.S. Securities Exchange Act of 1934, as amended, “safe harbour” provisions of the United States Private Litigation Reform Act of 1995, and any applicable Canadian securities regulations. The words “may,” “believe,” “will,” “target,” “aim,” “goal,” “expect,” “estimate,” “project,” “future,” “plan” and other expressions which are predictions of or indicate future events and trends and which do not relate to historical matters identify forward-looking statements. The forward-looking statements in this Annual Report include statements with respect to: possible or assumed results of operations of the Company, our 2012 outlook and goals, lot acquisition opportunities, foundation for future growth, cash flow generation, future value creation, liquidity and development plans. Undue reliance should not be placed on forward-looking statements because they involve known and unknown risks, uncertainties and other factors, which may cause the actual results to differ materially from the anticipated future results expressed or implied by such forward-looking statements. Factors that could cause actual results to differ materially from those set forward in the forward-looking statements include, but are not limited to: changes in general economic, real estate and other conditions; mortgage rate and availability changes; availability of suitable undeveloped land at acceptable prices; adverse legislation or regulation; ability to obtain necessary permits and approvals for the development of our land; availability of labour or materials or increases in their costs; ability to develop and market our master-planned communities successfully; confidence levels of consumers; ability to raise capital on favourable terms; adverse weather conditions and natural disasters; relations with the residents of our communities; risks associated with increased insurance costs or unavailability of adequate coverage and ability to obtain surety bonds; competitive conditions in the homebuilding industry, including product and pricing pressures; our debt and leverage; ability to retain our executive officers, relationships with our affiliates, and additional risks and uncertainties referred to in our Form 40-F and other documents filed by the company with the securities regulators in Canada and the United States, including the Annual Information Form under the heading, “Risks Related to the Business of the Corporation,” many of which are beyond our control. Except as required by law, we undertake no obligation to publicly update any forward-looking statements, whether as a result of new information, future events or otherwise. However, any further disclosures made on related subjects in subsequent reports with the securities regulators in the United States and Canada should be consulted.
CORPORATE RESPONSIBILITY

Integrity comes from doing the right thing, not just doing things right. Brookfield Residential considers both the investors’ financial needs and an investment’s impact on society.
We take pride in building the best communities and homes on the market, but we are equally proud of the community we have created within our family of employees and the outside community at large – the places where we work and live.
Environmental Stewardship
We seek new ways to reduce the impact we have on the environment, from next generation master-planned communities to high energy and water efficient homes, from technical innovations of solar and geothermal power to more sustainable infrastructure. Our Director of Sustainability takes stock of current best practices, implements the corporate sustainability strategy, defines measurable targets and provides transparent reporting.
Community Engagement
Brookfield Residential inspires a culture of philanthropy and volunteerism among our workforce. In addition to the annual corporate giving, we support local charitable and community organizations through our locally managed donations committees across North America. We also encourage employees’ involvement in charitable activities by providing volunteer leave and a donations matching program.
Employee Development
Brookfield Residential is dedicated to the pursuit of lifelong learning because we look for future leaders and managers when we hire. We provide our employees the support they need to deliver on their individual potential. We offer a variety of programs such as employee development workshops, onboarding, mentorship, training and education as well as tuition assistance so that our employees can continue to foster our vision of creating great places to live.
Photos from left to right:
Brookfield Residential’s leadership teamsmake autonomous decisions under the strategic directives set by the company.
Wellspring Calgary is part of a Canadian network of community-based centres that provides programs and resources at no cost to individuals with cancer. Brookfield Residential, in concert with its trades partners, donated a total of $1.5 million towards the land purchase, design and building of its new facility.
Rockrose at The Foothills, Carlsbad, in North San Diego County was awarded in 2011 the Environmental Spirit Award by Carlsbad Chamber of Commerce. Brookfield Homes, a subsidiary of Brookfield Residential, is the first homebuilder to earn this award for the commitment to more sustainable homebuilding with its first eco-savvy neighbourhood.

CORPORATE INFORMATION

CORPORATE OFFICE – www.brookfieldrp.com
4906 Richard Road SW
Calgary, Alberta T3E 6L1
Tel: 403.231.8900 Fax: 403.231.8960
Email: info@brookfieldrp.com
REGIONAL OFFICES
| | | | |
ALBERTA, CANADA Calgary 4906 Richard Road SW Calgary, AB T3E 6L1 Tel: 403.231.8900 Fax: 403.231.8960 David Allen President, Calgary Land John Olson President, Alberta Housing Warren Paulsen Vice President, Calgary Commercial Edmonton 10414 103rd Avenue, Suite 200 Edmonton, AB T5J 0J1 Tel: 780.423.1910 Fax: 780.421.4653 Rich Westren Senior Vice President, Edmonton Land ONTARIO, CANADA Greater Toronto Area 7303 Warden Avenue, Suite 100 Markham, ON L3R 5Y6 Tel: 905.477.5111 Toll Free: 1.800.387.8545 Fax: 905.477.9001 Sid Kerrigan President, Ontario Housing | | CALIFORNIA, U.S. San Francisco Bay Area 500 La Gonda Way, Suite 100 Danville, CA 94526 Tel: 925.743.8000 Fax: 925.743.8050 John J. Ryan President, San Francisco Orange / Los Angeles / Ventura County 3090 Bristol Street, Suite 200 Costa Mesa, CA 92626 Tel: 714.427.6868 Fax: 714.427.6869 Adrian Foley President, Los Angeles San Diego / Riverside County 12865 Pointe Del Mar, Suite 200 Del Mar, CA 92014 Tel: 858.481.8500 Fax: 858.794.6185 Stephen P. Doyle President, San Diego Richard T. Whitney Senior Vice President, Southern California Land Sacramento 2271 Lava Ridge Court, Suite 220 Roseville, CA 95661 Tel: 916.783.1177 Fax: 916.783.1161 John Norman Vice President, Sacramento | | CENTRAL AND EASTERN U.S. Washington D.C. Area 8500 Executive Park Avenue Fairfax, VA 22031 Tel: 703.270.1400 Fax: 703.270.1401 Robert Hubbell President, Washington D.C. Area Denver, Colorado 188 Inverness Drive West Suite 150 Englewood, CO 80112 Tel: 303.706.9451 Fax: 303.706.9453 Tom Morton Senior Vice President, Denver Austin, Texas 9737 Great Hills Trail Suite 260 Austin, TX 78759 Tel: 512.391.1330 Fax: 512.391.1333 Shaun Cranston Vice President, Austin |
DIRECTORS
Bruce T. Lehman
Principal, Armada Real Estate Group, LLC
Patricia M. Newson
Chair of the Board of Directors
Heritage Gas Limited
Alan Norris
President & Chief Executive Officer
Brookfield Residential Properties Inc.
Allan S. Olson
President & Chief Executive Officer
First Industries Corporation
Timothy R. Price
Chairman, Brookfield Funds
David M. Sherman
Co-Managing Member
Metropolitan Real Estate Equity Management, LLC
Robert L. Stelzl
Chairman, Brookfield Residential Properties Inc.
& President, Rivas Capital
Michael D. Young
President
Quadrant Capital Partners, Inc.
Details on Brookfield Residential’s directors are provided in the Management Information Circular and on our website at www.brookfieldrp.com. To learn more about Brookfield Residential’s corporate governance practices, please visit our website and navigate to the Corporate Governance section. In that section, you will find charters for the committees, corporate governance guidelines, and policies on disclosure, business conduct and ethics.
OFFICERS
Corporate Executives:
Alan Norris
President & Chief Executive Officer
Craig Laurie
Executive Vice President & Chief Financial Officer
David Harvie
Executive Vice President, Corporate Development
Michael Dutczak
Executive Vice President, Special Situations
Shane Pearson
Senior Vice President & Corporate Counsel
Operating Executives:
Trent Edwards
Chief Operating Officer, Alberta
Peter Nesbitt
Chief Operating Officer, Eastern Region & Colorado
Adrian Foley
Chief Operating Officer, California
David Harvie
Executive Vice President, Texas
Number of Employees:
Brookfield Residential had 686 employees as of December 31, 2011.
Back cover (top):
Solterra, Aurora, Colorado:It is Denver’s best selling new home community priced above $400,000. The community is surrounded by open space, has tremendous Front Range views and a first-class resident use amenity.
Bottom row from left to right:
Cranston Market, Calgary, Alberta: When designing each master-planned community, Brookfield Residential considers size, location and customer needs for commercial development. As the community develops, we determine whether to build or sell the land.
Blanco Vista, San Marcos, Texas:This 575-acre master-planned community was opened in 2007. Austin metro area has a young, vibrant population of 1.7 million and a home base to many new economy industries.