UNITED STATES
SECURITIES AND EXCHANGE COMMISSION
Washington, D.C. 20549
FORM N-CSR
CERTIFIED SHAREHOLDER REPORT OF REGISTERED
MANAGEMENT INVESTMENT COMPANIES
| | |
Investment Company Act file number | | 811-22482 |
Nuveen Energy MLP Total Return Fund
(Exact name of registrant as specified in charter)
Nuveen Investments
333 West Wacker Drive
Chicago, IL 60606
(Address of principal executive offices) (Zip code)
Gifford R. Zimmerman
Nuveen Investments
333 West Wacker Drive
Chicago, IL 60606
(Name and address of agent for service)
Registrant’s telephone number, including area code: (312) 917-7700
Date of fiscal year end: November 30
Date of reporting period: November 30, 2017
Form N-CSR is to be used by management investment companies to file reports with the Commission not later than 10 days after the transmission to stockholders of any report that is required to be transmitted to stockholders under Rule 30e-1 under the Investment Company Act of 1940 (17 CFR 270.30e-1). The Commission may use the information provided on Form N-CSR in its regulatory, disclosure review, inspection, and policymaking roles.
A registrant is required to disclose the information specified by Form N-CSR, and the Commission will make this information public. A registrant is not required to respond to the collection of information contained in Form N-CSR unless the Form displays a currently valid Office of Management and Budget (“OMB”) control number. Please direct comments concerning the accuracy of the information collection burden estimate and any suggestions for reducing the burden to Secretary, Securities and Exchange Commission, 450 Fifth Street, NW, Washington, DC 20549-0609. The OMB has reviewed this collection of information under the clearance requirements of 44 U.S.C. ss. 3507.
ITEM 1. REPORTS TO STOCKHOLDERS.
| | |
| | |  |
| Closed-End Funds | |
| | | | | | |
| | | | | | | Annual Report November 30, 2017 |
| | | |
| | | | | | |
| | | | | | | |
| JMF | | | | | | |
| Nuveen Energy MLP Total Return Fund | | |
| | | | | | | |
| JMLP | | | | | | |
| Nuveen All Cap Energy MLP Opportunities Fund | | |
| | | | | | | |
| | | | | | | | | | | | |
| | | | | | |
| | | | |
| | | | | | | | |
| |
| | Life is Complex |
| |
| | Nuveen makes things e-simple. It only takes a minute to sign up for e-Reports. Once enrolled, you’ll receive an e-mail as soon as your Nuveen Fund information is ready – no more waiting for delivery by regular mail. Just click on the link within the e-mail to see the report and save it on your computer if you wish. |
| | |
| | Free e-Reports right to your e-mail! |
| |
| | www.investordelivery.com If you receive your Nuveen Fund dividends and statements from your financial advisor or brokerage account. |
| |
| or | | www.nuveen.com/accountaccess If you receive your Nuveen Fund dividends and statements directly from Nuveen. |
Table
of Contents
Chairman’s Letter
to Shareholders

Dear Shareholders,
Asset prices steadily climbed during 2017, propelled by a “Goldilocks” economic scenario that enabled markets to sidestep geopolitical tensions, natural disasters, terrorism events and political noise. The U.S. economy continued to run not too hot, not too cold, with steady growth and low levels of unemployment, inflation and interest rates. Corporate earnings have been healthy and recession risk appeared low. At the same time, growth across the rest of the world has improved as well, leading to upward revisions in global growth projections.
Yet, a global synchronized recovery also brings the prospect of higher inflation. Central banks have to manage the delicate balance between too-loose financial conditions, which risks economies overheating, and too-tight conditions, which could trigger recession. The nomination of Jerome Powell for Chairman of the U.S. Federal Reserve (Fed) is largely expected to maintain the course set by Chair Janet Yellen after her term expires in February 2018, and the much anticipated tax overhaul, passed at the end of December, may likely boost economic growth but could complicate the Fed’s job of managing interest rates in the years ahead.
Negotiations surrounding the budget showdown are in the forefront, as Congress debates the U.S. debt ceiling limit and spending related to the military, disaster relief, the Children’s Health Insurance Program and immigration policy. In addition, the ongoing “Brexit” negotiations and the North American Free Trade Agreement (NAFTA) talks may impact key trade and political partnerships. Tensions with North Korea may continue to flare.
The magnitude of the market’s bullishness during 2017 has been somewhat surprising, but gains may not be so easy in the coming years. Nobody can predict market shifts, and that is why Nuveen encourages you to talk to your financial advisor to ensure your investment portfolio is appropriately diversified for your objectives, time horizon and risk tolerance. On behalf of the other members of the Nuveen Fund Board, we look forward to continuing to earn your trust in the months and years ahead.
Sincerely,

William J. Schneider
Chairman of the Board
January 22, 2018
Portfolio Managers’
Comments
Nuveen Energy MLP Total Return Fund (JMF)
Nuveen All Cap Energy MLP Opportunities Fund (JMLP)
The Funds’ investment adviser is Nuveen Fund Advisors, LLC (NFAL), an affiliate of Nuveen, LLC. These Funds feature portfolio management by the MLP & Energy Infrastructure team of Advisory Research, Inc., which is a wholly-owned subsidiary of Piper Jaffray Companies. James J. Cunnane Jr., CFA, Managing Director and Chief Investment Officer for the MLP & Energy Infrastructure team and Quinn T. Kiley, Managing Director and Senior Portfolio Manager, manage the Funds.
Here they discuss economic and market conditions, their investment strategies and the performance of the Funds for the twelve-month reporting period ended November 30, 2017.
What factors affected the U.S. economy and financial markets during the twelve-month reporting period ended November 30, 2017?
The U.S. economy continued to expand at a below-trend pace in the reporting period overall but did mark two consecutive quarters of above 3% growth in the second and third quarters of 2017. The Bureau of Economic Analysis reported its “third” estimate of third-quarter gross domestic product (GDP) at an annualized rate of 3.2%, an increase from 3.1% in the second quarter, alleviating concerns that Hurricanes Harvey, Irma and Maria depressed the nation’s output. GDP is the value of goods and services produced by the nation’s economy less the value of the goods and services used up in production, adjusted for price changes. Despite some softening in shopping and dining out activity due to the hurricanes, consumer spending remained the main driver of demand in the economy. Business investment had been muted for most of the recovery but has accelerated in 2017, with the “hard” data now falling more in line with the highly optimistic business sentiment levels, or “soft” data, seen after President Trump won the election.
Elsewhere in the economy, the labor market continued to tighten, with unemployment staying below 5% over the course of the reporting period. As reported by the Bureau of Labor Statistics, the unemployment rate fell to 4.1% in November 2017 from 4.6% in November 2016 and job gains averaged around 172,000 per month for the past twelve months. Higher energy prices, especially gasoline, helped drive a steady increase in inflation over this reporting period. The Consumer Price Index (CPI) increased 2.2% over the twelve-month reporting period ended November 30, 2017 on a seasonally adjusted basis, as reported by the Bureau of Labor Statistics. The core CPI (which excludes food and energy) increased 1.7% during the same period, slightly below the Federal Reserve’s (Fed) unofficial longer term inflation objective of 2.0%. The housing market also continued to improve, with historically low mortgage rates and low inventory driving home prices higher. The S&P CoreLogic Case-Shiller U.S. National Home Price Index, which covers all nine U.S. census divisions, recorded a 6.2% annual gain in October 2017 (most recent data available at the time this report was prepared). The 10-City and 20-City Composites reported year-over-year increases of 6.0% and 6.4, respectively.
This material is not intended to be a recommendation or investment advice, does not constitute a solicitation to buy or sell securities, and is not provided in a fiduciary capacity. The information provided does not take into account the specific objectives or circumstances of any particular investor, or suggest any specific course of action. Investment decisions should be made based on an investor’s objectives and circumstances and in consultation with his or her advisors.
Certain statements in this report are forward-looking statements. Discussions of specific investments are for illustration only and are not intended as recommendations of individual investments. The forward-looking statements and other views expressed herein are those of the portfolio managers as of the date of this report. Actual future results or occurrences may differ significantly from those anticipated in any forward-looking statements and the views expressed herein are subject to change at any time, due to numerous market and other factors. The Funds disclaim any obligation to update publicly or revise any forward-looking statements or views expressed herein.
Refer to the Glossary of Terms Used in this report for further definition of the terms used within this section.
Portfolio Managers’ Comments (continued)
With the U.S. economy delivering a sustainable growth rate and employment strengthening, the Fed’s policy making committee raised its main benchmark interest rate in December 2016, March 2017, June 2017 and December 2017. These moves were widely expected by the markets, as were the Fed’s decisions to leave rates unchanged at the July, September and October/November 2017 meetings. (There was no August meeting.) The Fed also announced it would begin reducing its balance sheet in October 2017 by allowing a small amount of maturing Treasury and mortgage securities to roll off without reinvestment. The market expects the pace to remain moderate and predictable, with minimal market disruption.
While the markets remained comfortable with the course of monetary policy during this reporting period, the political environment was frequently a source of uncertainty. Markets were initially highly optimistic about pricing in the new administration’s “pro-growth” fiscal agenda after Donald Trump won the election. However, several attempts at health care reform were unable to pass in Congress, which weakened the outlook for the remainder of President Trump’s agenda. In the final months of 2017, legislators refocused their efforts on tax reform, ultimately passing a bill at the end of December (subsequent to the close of this reporting period) while postponing what are expected to be contentious budget talks into 2018. While the new tax law changes are widely considered stimulative to the economy, there are some concerns that it could pose challenges to the Fed’s ability to manage interest rates in the future. Although Fed Chairman nominee Jerome Powell is expected to maintain the course established by outgoing Chair Janet Yellen, after her term expires in February 2018, markets may deem this as another source of uncertainty. Geopolitical risks also remained prominent throughout the reporting period, with the ongoing renegotiation of the North American Free Trade Agreement (NAFTA); the start of “Brexit” talks between the U.K. and European Union; closely watched elections in the Netherlands, France and Germany; and escalating tensions between the U.S. and North Korea.
Strong economic activity drove prices for West Texas Intermediate (WTI) crude oil up 16.1% for the reporting period. Energy equities did not follow suit, with energy equities in the S&P 500® Index falling 4.2% and the Alerian MLP Index losing 6.8% over the same period. A closely watched indicator of the health of the energy industry is the active rig count which was up 36% and 44% for natural gas and crude oil, respectively. This disconnect between improving fundamentals and equity prices reflects investor exhaustion with the energy industry. As companies in the space recalibrate what exactly investors want, either growth in oil and gas production or for companies to live within cash flows, those investors were content to sit on the sideline (further discussion may be found on page seven of this report). Although early in the reporting period, we saw some flows into active master limited partnerships (MLP) products, as crude oil set an annual low in June 2017 those in-flows turned into out-flows as the reporting period progressed. Overall flows into MLP products, including passive vehicles, were down.
As the energy industry recovered from the 2016 bottom, many market participants expected to see consolidation among the group. These types of transactions are typically more difficult for MLPs because of their governance structure. The control of an MLP is typically not at the MLP itself; instead it is held at another entity that owns the general partner. These consolidated transactions between related entities are intended to simplify the MLP structure, and though control doesn’t actually change hands, the result is a form of consolidation. During the reporting period there were over $120 billion of these types of transactions; $77 billion were simplifying corporate restructuring deals and $44 billion were change of control, arms-length transactions. Both Funds were exposed to these transactions through their existing holdings and JMLP owned Arc Logistics Partners and Penntex Midstream Partners, which were outright purchases with premiums paid by the acquirers. We tendered our shares of Penntex Midstream Partners at zero commission in June 2017 and sold Arc Logistics Partners in October 2017.
How did the Funds perform during this twelve-month reporting period ended November 30, 2017?
The tables in each Fund’s Performance Overview and Holding Summaries section of this report provide total returns for the one-year, five-year and since inception periods, where applicable, ended November 30, 2017. Each Fund’s total returns at net asset value (NAV) are compared with the performance of a corresponding market index. JMF’s total return at NAV underperformed both the Alerian MLP Index (“Index”) and the S&P 500® Index during the twelve-month
reporting period, while JMLP’s total return at NAV outperformed the Index and underperformed the S&P 500® Index for the twelve-month reporting period.
The Funds are taxed as “C” corporations, and unlike most other investment companies, they pay taxes on their own income. Consequently, as explained more fully later in the report, the Funds’ adjustments to their assets and liabilities to reflect the Funds’ projected tax payments can significantly impact Fund share performance. In the most recent twelve-month reporting period, those tax adjustments had a positive impact on the share performance of JMF and no impact on the share performance of JMLP.
The Funds employ leverage. In the most recent twelve-month reporting period, this leverage had a negative impact on the Funds’ total return. You should consider the Funds’ tax adjustments and leverage when comparing each Fund’s performance to the Index and S&P 500® Index, as neither index is leveraged nor affected by the tax treatment of gains or losses. As a result, the Funds’ total return performance could differ significantly from the actual returns of its portfolio and that of the indexes, even if the pre-tax adjustment performance of the Funds’ portfolio assets and the performance of the indexes were similar. We will divide the discussion of the various strategies used by and features of the Funds, and how each of them impacted the performance of the Funds’ shares during the twelve-month reporting period ended November 30, 2017, into the following sub-sections:
| | • | | Impact of portfolio management strategies on Fund share performance |
| | • | | Impact of tax adjustments on Fund share performance |
| | • | | Impact of leverage on Fund share performance |
Impact of the Funds’ primary portfolio investment strategies on Fund share performance.
Both Funds continue to invest primarily in publicly traded MLPs operating in the energy sector with the main objective of providing a tax-advantaged total return.
During the reporting period, the Funds were primarily invested in midstream MLPs that own pipelines and other infrastructure facilities. These assets provide an essential service to our economy: procuring, processing, storing and transporting the commodities and products that fuel every aspect of our lives.
As mentioned earlier, fundamentals for MLPs improved during the reporting period. Nevertheless, while fundamentals improved, the reporting period was a frustrating one for investors as MLPs and energy infrastructure equities did not follow suit. Meager flows into the asset class were not sufficient to meet the equity needs of the companies in the space. Fund flows were approximately $4.3 billion for the reporting period, compared to new equity issuance of $15.8 billion. This over supply of equity resulted in many dedicated MLP investors selling one portion of their portfolios to buy these offerings, which can create negative price pressure. Furthermore, several management teams took the decision to change their company’s distribution policy during the reporting period. There remains a large portion of MLP investors, closed-end fund managers included, that view a higher yield as an attractive aspect of MLP securities. When distributions are reduced with the goal of funding growth in the future, there is typically some turnover in the unit holder base.
Conversely, there is a group of MLP investors who are drawn not just to the yield provided by distributions but the growth in that distribution over time. When a management team reduces the growth trajectory of the distribution to fund cash flow growth in the future, these growth-oriented investors may step away as well. Both of these sets of actions and reactions create selling pressure. Perhaps more importantly, these changes create confusion and that keeps opportunistic investors who might move into the asset class at these lower valuations on the sideline until they can better understand the distribution strategy these companies will employ. With regard to Fund flows, we think this scenario is the proximate cause of weak flows in the second half of the reporting period, despite crude oil rallying from June 2017 lows to new 52-week highs.
Portfolio Managers’ Comments (continued)
JMF’s portfolio performance underperformed the Index for the twelve-month reporting period ended November 30, 2017. The Fund’s allocation towards higher yielding MLPs, and away from faster growing MLPs, detracted from performance as the market favored growth during the reporting period. This is a reversal of what we saw in 2016 when yield meaningfully outperformed growth. The preference for growth was not that strong of a trend as the highest yielding MLPs also outperformed. Security selection among large-caps also added to underperformance. The Fund was underweight Enterprise Products Partners, the largest Index constituent, which posted gains in an otherwise negative environment. During the reporting period the Index provider capped positions at 10% weightings. While still concentrated among large-caps, the Index will present less single name risk going forward. Several MLPs have changed their distribution policies during the reporting period. Specifically, three surprised the market by implementing distribution cuts. Enbridge Energy Partners LP, Plains All American Pipeline LP, and Genesis Energy LP reduced their distribution and as a result were among the largest detractors from performance during the reporting period. The Fund held overweight positions in these names and that accounted for the majority of underperformance during the reporting period. All three of these names continue to pay attractive yields, have defensive distribution payout ratios, and will have minimal reliance on the capital markets to fund growth. Adding to relative performance for the Fund was overweight exposure to those MLPs with gathering and processing assets. These entities benefit when oil & gas production is growing and when the relative value of crude oil is much higher than the price of natural gas. That scenario played out during the reporting period and overweight positions in DCP Midstream LP, Williams Partners LP, and EnLink Midstream Partners LP were among the largest contributors to relative performance.
JMLP’s portfolio performance outperformed the Index for the twelve-month reporting period ended November 30, 2017. JMLP’s strategy is differentiated from JMF in the following ways: 1) JMLP will not own the top ten constituents in the Index, and 2) JMLP will not purchase securities in the bottom 30% of the universe, as defined by the sub-adviser’s “Quality Scorecard” process, which ranks each constituent of the investable MLP universe according to fundamental metrics. JMLP’s strategy worked with the investable universe outperforming the Index. Avoiding the top ten holdings in the Index was helpful in that the Fund avoided owning Plains All American Pipeline and Enbridge Energy Partners, both of which surprised the market with distribution cuts. The quality screen was helpful as well in that the MLPs we avoided underperformed the Index. The smaller capitalization of the Fund’s portfolio contributed to performance as this group posted gains in an otherwise down year. Similar to JMF, avoiding Enterprise Products Partners was a detractor from performance. The largest detractor from performance was Teekay Offshore Partners LP, which continues to struggle in the market due to confusion around its business model and a previous distribution cut. We sold our holding in Teekay Offshore Partners, LP during July through September 2017.
Impact of tax adjustments on the Funds’ share performance
Each Fund is treated as a “C” Corporation for U.S. federal income tax purposes and therefore is a taxable entity, meaning that in addition to recording a current tax expense on current year earnings and realized gains, they also record either a net deferred tax liability representing the future taxes projected to be payable on unrealized portfolio gains, or a net deferred tax asset representing the tax benefit projected to be associated with realized and unrealized portfolio losses. These tax adjustment entries on the Funds’ accounting records are intended to ensure that the Funds’ NAVs take into account the future income tax that the Funds may be liable for based on unrealized appreciation as well as the tax benefit of losses that may be used to offset future earnings. Such entries will often have a “moderating impact” on the total returns of investment of the Funds’ shares during a particular measurement period. An increase in the value of a Fund’s portfolio investments will typically trigger an increase to the deferred tax liability or a reduction to the deferred tax asset that would partially offset the portfolio value increases; in contrast, a decrease in value of the Fund’s portfolio investments will typically trigger a reduction in a deferred tax liability and/or an increase to the deferred tax asset, which again would tend to partially offset such portfolio value decreases.
During the reporting period for JMF, the projected future tax liability of the Fund decreased, resulting in a positive contribution to NAV performance.
To the extent that a Fund has a deferred tax asset, consideration is given to whether or not a valuation allowance is required that would offset the tax asset. Accounting principles dictate that the determination of such a valuation allowance is based on whether there is a more-likely-than-not probability that some portion or all of the deferred tax asset will not be realized.
At November 30, 2016, JMLP had a valuation allowance to offset the deferred tax asset. This allowance still existed at November 30, 2017. As a result, there was no impact to NAV performance associated with the deferred tax asset or liability.
Event subsequent to the close of this reporting period
In light of the passage and signing into law on December 22, 2017 of the Tax Cuts and Jobs Act of 2017, JMF made adjustments on that day to the Fund’s estimate of its deferred tax liability balance. The Fund’s deferred tax liability and/or asset balances are determined using estimates of effective tax rates expected to apply to taxable income in the years such balances are realized. The Tax Cuts and Jobs Act of 2017 reduced the statutory federal income tax rate applicable to corporations, such as JMF and JMLP, from 35% to 21%. JMF reduced the estimate of its net deferred tax liability balance to reflect this reduction in the corporate federal income tax rate; this reduced its net deferred tax liability balance as of December 22, 2017 from an amount that would have been somewhat in excess of $35 million to approximately $22 million. That adjustment in turn caused JMF’s net asset value to increase by $0.33 per common share.
JMLP, on the other hand, had a net deferred tax asset immediately prior to December 22, 2017, but that asset had a fully offsetting valuation allowance. The amount of JMLP’s net deferred tax asset decreased on December 22, 2017 due to the reduction in the income tax rate, but the valuation allowance was also reduced by the same amount, resulting in no impact to the net asset value of that Fund.
Further modifications of the Funds’ estimates or assumptions regarding its deferred tax liability and/or asset balances and any applicable valuation allowance could result in increases or decreases in the Fund’s net asset value per share, which could be material.
Impact of the Funds’ leverage strategies on performance
One important factor impacting the returns of the Funds relative to their comparative benchmarks was the Funds’ use of leverage through bank borrowings. The Funds use leverage because our research has shown that, over time, leveraging provides opportunities for additional income and total return for shareholders. However, use of leverage also can expose shareholders to additional volatility. For example, as the prices of securities held by a Fund decline, the negative impact of these valuation changes on NAV and total return is magnified by the use of leverage. Conversely, leverage may enhance returns during periods when the prices of securities held by a Fund generally are rising. For the twelve-month reporting period ended November 30, 2017, leverage had a negative impact on performance for both Funds.
The Funds employ regulatory leverage through the use of bank borrowings. As of November 30, 2017, the Funds had outstanding bank borrowings as shown in the accompanying table.
| | | | | | | | |
| | | JMF | | | JMLP | |
Bank Borrowings | | $ | 175,000,000 | | | $ | 41,500,000 | |
Portfolio Managers’ Comments (continued)
As of November 30, 2017, the Funds’ leverage, expressed as a percentage of total managed assets, were as shown in the accompanying table.
| | | | | | | | |
| | | JMF | | | JMLP | |
Effective Leverage* | | | 28.59 | % | | | 27.74 | % |
Regulatory Leverage* | | | 28.59 | % | | | 27.74 | % |
| * | Effective Leverage is a Fund’s effective economic leverage, and includes both regulatory leverage and the leverage effects of certain derivative and other investments in a Fund’s portfolio that increase the Fund’s investment exposure. Regulatory leverage consists of preferred shares issued or borrowings of a Fund. Both of these are part of a Fund’s capital structure. A Fund, however, may from time to time borrow on a typically transient basis in connection with its day-to-day operations, primarily in connection with the need to settle portfolio trades. Such incidental borrowings are excluded from the calculation of a Fund’s effective leverage ratio. Regulatory leverage is subject to asset coverage limits set forth in the Investment Company Act of 1940. |
Bank Borrowings
As noted above, the Funds employ leverage through the use of bank borrowings.
The Funds operate under established leverage guidelines. During the current reporting period, volatility in the MLP market caused the Funds to periodically reduce and increase the amount of their outstanding borrowings in order to maintain levels consistent with these guidelines. The Funds’ bank borrowing activities are as shown in the accompanying table.
| | | | | | | | | | | | | | | | | | | | | | | | | | | | | | | | | | | | |
| | | Current Reporting Period | | | | | | Subsequent to the Close of
the Reporting Period | |
| Fund | | December 1, 2016 | | | Draws | | | Paydowns | | | November 30, 2017 | | | Average Balance
Outstanding | | | | | | Draws | | | Paydowns | | | January 24, 2018 | |
JMF | | $ | 185,550,000 | | | $ | 6,450,000 | | | $ | (17,000,000 | ) | | $ | 175,000,000 | | | $ | 185,808,767 | | | | | | | $ | — | | | $ | — | | | $ | 175,000,000 | |
JMLP | | $ | 39,000,000 | | | $ | 6,000,000 | | | $ | (3,500,000 | ) | | $ | 41,500,000 | | | $ | 42,890,137 | | | | | | | $ | — | | | $ | — | | | $ | 41,500,000 | |
Refer to Notes to Financial Statements, Note 7 – Borrowing Arrangements for further details.
During the reporting period, JMF continued to utilize forward interest rate swap contracts and JMLP entered into forward interest rate swap contracts to hedge the future interest expense of its leverage. During the reporting period, these swaps had a marginally positive impact on the Funds’ overall performance.
Share
Information
DISTRIBUTION INFORMATION
The following information regarding the Funds’ distributions is current as of November 30, 2017, the Funds’ fiscal and tax year end, and may differ from previously issued distribution notifications.
The Funds have a cash flow-based distribution program. Under this program, each Fund seeks to maintain an attractive and stable regular distribution based on the Fund’s net cash flow received from its portfolio investments. Fund distributions are not intended to include expected portfolio appreciation; however, each Fund invests in securities that make payments which ultimately may be fully or partially treated as gains or return of capital for tax purposes. This tax treatment will generally “flow through” to the Fund’s distributions, but the specific tax treatment is often not known with certainty until after the end of the Fund’s tax year. As a result, regular distributions throughout the year are likely to be re-characterized for tax purposes as either long-term gains (both realized and unrealized), or as a non-taxable return of capital.
The figures in the table below provide the sources (for tax purposes) of each Fund’s distributions as of November 30, 2017. These sources include amounts attributable to realized gains and/or returns of capital. The Funds attribute these non-income sources equally to each regular distribution throughout the fiscal year. The information shown below is for the distributions paid on common shares for all prior months in the current fiscal year. These amounts should not be used for tax reporting purposes, and the distribution sources may differ for financial reporting than for tax reporting. The final determination of the tax characteristics of all distributions paid in 2017 will be made in early 2018 and reported to you on Form 1099-DIV. More details about the tax characteristics of each Fund’s distributions are available on www.nuveen.com/CEFdistributions.
Data as of November 30, 2017
| | | | | | | | | | | | | | | | | | | | | | | | | | | | |
| | | Fiscal YTD | | | Fiscal YTD | |
| | | Percentage of the Distribution | | | Per Share Amounts | |
| Fund | | Net
Investment
Income(1) | | | Realized
Gains | | | Return of
Capital(2) | | | Total
Distributions | | | Net
Investment
Income(1) | | | Realized
Gains | | | Return of
Capital(2) | |
JMF (FYE 11/30) | | | 13.30 | % | | | 0.00 | % | | | 86.70 | % | | $ | 1.3480 | | | $ | 0.1793 | | | $ | 0.0000 | | | $ | 1.1687 | |
JMLP (FYE 11/30) | | | 0.00 | % | | | 0.00 | % | | | 100 | % | | $ | 0.9840 | | | $ | 0.0000 | | | $ | 0.0000 | | | $ | 0.9840 | |
| (1) | The Funds may have current fiscal year earnings and profits, and if so, a portion or all of the distributions may be treated as ordinary dividend income. |
| (2) | Return of Capital may represent unrealized gains, return of shareholders’ principal, or both. |
The following table provides information regarding fund distributions and total return performance over various time periods. This information is intended to help you better understand whether fund returns for the specified time periods were sufficient to meet fund distributions.
Data as of November 30, 2017
| | | | | | | | | | | | | | | | | | | | | | | | | | | | |
| | | | | | | | | Annualized | | | Cumulative | |
| Fund | | Inception
Date | | | Latest
Quarterly
Per Share
Distribution | | | Current
Distribution
on
NAV | | | 1-Year
Return on
NAV | | | Since Inception
Return on
NAV | | | Calendar YTD
Distributions
on
NAV | | | Calendar
YTD
Return
on NAV | |
JMF (FYE 11/30) | | | 2/23/2011 | | | $ | 0.3370 | | | | 12.37 | % | | | (9.44 | )% | | | (0.18 | )% | | | 12.37 | % | | | (13.38 | )% |
JMLP (FYE 11/30) | | | 3/26/2014 | | | $ | 0.2460 | | | | 11.99 | % | | | (4.22 | )% | | | (11.37 | )% | | | 11.99 | % | | | (12.39 | )% |
Share Information (continued)
EQUITY SHELF PROGRAM
During the current reporting period, the Funds were authorized by the Securities and Exchange Commission (SEC) to issue additional shares through an equity shelf program (Shelf Offering). Under these programs, the Funds, subject to market conditions, may raise additional capital from time to time in varying amounts and offering methods at a net price at or above each Fund’s NAV per share. Under the Shelf Offerings, each Fund is authorized to issue additional shares as shown in the accompanying table:
| | | | | | | | |
| | | JMF | | | JMLP | |
Additional authorized shares | | | 9,800,000 | * | | | 3,100,000 | ** |
| * | Represents additional shares for the period October 17, 2017 through November 30, 2017. |
| ** | Represents additional shares for the period July 12, 2017 through Novemner 30, 2017. |
During the current reporting period, the Funds sold shares through their Shelf Offering at a weighted average premium to their NAV per share as shown in the accompanying table.
| | | | | | | | |
| | | JMF | | | JMLP | |
Shares sold through Shelf Offering | | | 450,848 | | | | 399,500 | |
Weighted average premium to NAV per share sold | | | 1.54 | % | | | 1.65 | % |
Refer to Notes to Financial Statements, Note 4 – Fund Shares, Shares Equity Shelf Programs and Offering Costs for further details of Shelf Offerings and each Fund’s respective transactions.
SHARE REPURCHASES
During August 2017, the Funds’ Board of Trustees reauthorized an open-market share repurchase program, allowing each Fund to repurchase an aggregate of up to approximately 10% of its outstanding shares.
As of November 30, 2017, and since the inception of the Funds’ repurchase programs, the Funds have cumulatively repurchased and retired their outstanding shares as shown in the accompanying table.
| | | | | | | | |
| | | JMF | | | JMLP | |
Shares cumulatively repurchased and retired | | | 0 | | | | 0 | |
Shares authorized for repurchase | | | 3,955,000 | | | | 1,285,000 | |
OTHER SHARE INFORMATION
As of November 30, 2017, and during the current reporting period, the Funds’ share prices were trading at a premium/(discount) to their NAVs as shown in the accompanying table.
| | | | | | | | |
| | | JMF | | | JMLP | |
NAV | | $ | 10.90 | | | $ | 8.21 | |
Share price | | $ | 10.57 | | | $ | 8.02 | |
Premium/(Discount) to NAV | | | (3.03 | )% | | | (2.31 | )% |
12-month average premium/(discount) to NAV | | | 1.11 | % | | | 0.95 | % |
Risk
Considerations
Fund shares are not guaranteed or endorsed by any bank or other insured depository institution, and are not federally insured by the Federal Deposit Insurance Corporation.
Nuveen Energy MLP Total Return Fund (JMF)
Investing in closed-end funds involves risk; principal loss is possible. There is no guarantee the Fund’s investment objectives will be achieved. Closed-end fund shares may frequently trade at a discount or premium to their net asset value. MLP Units are subject to energy sector concentration risk, limited voting rights, and heightened tax risk. Common stock returns often have experienced significant volatility. Leverage increases return volatility and magnifies the Fund’s potential return and its risks; there is no guarantee a fund’s leverage strategy will be successful. For these and other risks such as tax risk, please see the Fund’s web page at www.nuveen.com/JMF.
Nuveen All Cap Energy MLP Opportunities Fund (JMLP)
Investing in closed-end funds involves risk; principal loss is possible. There is no guarantee the Fund’s investment objectives will be achieved. Closed-end fund shares may frequently trade at a discount or premium to their net asset value. MLP Units are subject to energy sector concentration risk, limited voting rights, and heightened tax risk. Common stock returns often have experienced significant volatility. Leverage increases return volatility and magnifies the Fund’s potential return and its risks; there is no guarantee a fund’s leverage strategy will be successful. For these and other risks, including tax risk and small capitalization risk, please see the Fund’s web page at www.nuveen.com/JMLP.
JMF
Nuveen Energy MLP Total Return Fund
Performance Overview and Holding Summaries as of November 30, 2017
Refer to the Glossary of Terms Used in this Report for further definition of the terms used within this section.
Average Annual Total Returns as of November 30, 2017
| | | | | | | | | | | | |
| | | Average Annual | |
| | | 1-Year | | | 5-Year | | | Since
Inception | |
| JMF at NAV | | | (9.44)% | | | | (1.29)% | | | | (0.18)% | |
| JMF at Share Price | | | (11.44)% | | | | (1.91)% | | | | (0.87)% | |
| Alerian MLP Index | | | (6.83)% | | | | (1.61)% | | | | 1.23% | |
| S&P 500® Index | | | 22.87% | | | | 15.74% | | | | 13.38% | |
Since inception returns are from 2/23/11. Past performance is not predictive of future results. Current performance may be higher or lower than the data shown. Returns do not reflect the deduction of taxes that shareholders may have to pay on Fund distributions or upon the sale of Fund shares. Returns at NAV are net of Fund expenses, and assume reinvestment of distributions. Comparative index return information is provided for the Fund’s shares at NAV only. Indexes are not available for direct investment.
Share Price Performance — Weekly Closing Price
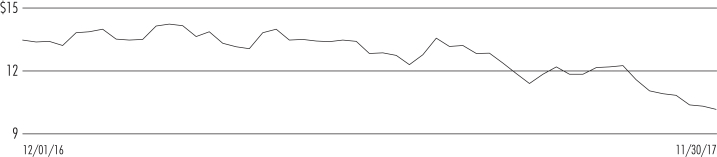
This data relates to the securities held in the Fund’s portfolio of investments as of the end of the reporting period. It should not be construed as a measure of performance for the Fund itself. Holdings are subject to change.
Fund Allocation
(% of net assets)
| | | | |
| Master Limited Partnerships & MLP Affiliates | | | 146.0% | |
| Repurchase Agreements | | | 0.3% | |
| Other Assets Less Liabilities | | | (0.1)% | |
| Net Assets Plus Borrowings and Deferred Tax Liability, net | | | 146.2% | |
| Borrowings | | | (40.0)% | |
| Deferred Tax Liability, net | | | (6.2)% | |
Net Assets | | | 100% | |
Portfolio Composition
(% of total investments)
| | | | |
| Oil, Gas & Consumable Fuels | | | 98.7% | |
| Energy Equipment & Services | | | 1.1% | |
| Repurchase Agreements | | | 0.2% | |
| Total | | | 100% | |
Top Ten Issuers
(% of total long-term
investments)
| | | | |
DCP Midstream LP | | | 9.1% | |
EnLink Midstream Partners LP | | | 8.7% | |
Williams Partners LP | | | 8.1% | |
Energy Transfer Partners LP | | | 6.2% | |
Buckeye Partners LP | | | 6.1% | |
MPLX LP | | | 4.8% | |
Enbridge Energy Partners LP | | | 4.3% | |
Enable Midstream Partners LP | | | 4.3% | |
Plains All American Pipeline LP | | | 3.9% | |
TC PipeLines LP | | | 3.9% | |
JMLP
Nuveen All Cap Energy MLP Opportunities Fund
Performance Overview and Holding Summaries as of
November 30, 2017
Refer to the Glossary of Terms Used in this Report for further definition of the terms used within this section.
Average Annual Total Returns as of November 30, 2017
| | | | | | | | |
| | | Average Annual | |
| | | 1-Year | | | Since
Inception | |
| JMLP at NAV | | | (4.22)% | | | | (11.37)% | |
| JMLP at Share Price | | | (8.91)% | | | | (12.97)% | |
| Alerian MLP Index | | | (6.83)% | | | | (7.69)% | |
| S&P 500® Index | | | 22.87% | | | | 12.52% | |
Since inception returns are from 3/26/14. Past performance is not predictive of future results. Current performance may be higher or lower than the data shown. Returns do not reflect the deduction of taxes that shareholders may have to pay on Fund distributions or upon the sale of Fund shares. Returns at NAV are net of Fund expenses, and assume reinvestment of distributions. Comparative index return information is provided for the Fund’s shares at NAV only. Indexes are not available for direct investment.
Share Price Performance — Weekly Closing Price
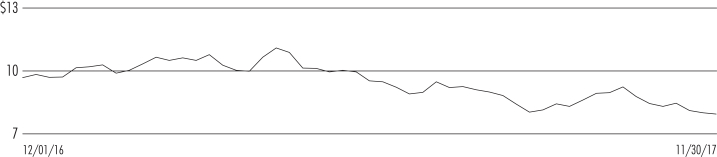
This data relates to the securities held in the Fund’s portfolio of investments as of the end of the reporting period. It should not be construed as a measure of performance for the Fund itself. Holdings are subject to change.
Fund Allocation
(% of net assets)
| | | | |
| Master Limited Partnerships & MLP Affiliates | | | 136.8% | |
| Repurchase Agreements | | | 1.5% | |
| Other Assets Less Liabilities | | | 0.1% | |
Net Assets Plus Borrowings | | | 138.4% | |
| Borrowings | | | (38.4)% | |
| Net Assets | | | 100% | |
Portfolio Composition
(% of total investments)
| | | | |
| Oil, Gas & Consumable Fuels | | | 93.2% | |
| Energy Equipment & Services | | | 3.2% | |
| Gas Utilities | | | 2.5% | |
| Repurchase Agreements | | | 1.1% | |
| Total | | | 100% | |
Top Ten Issuers
(% of total long-term investments)
| | | | |
Enable Midstream Partners LP | | | 9.6% | |
EnLink Midstream Partners LP | | | 8.2% | |
DCP Midstream LP | | | 8.1% | |
American Midstream Partners LP | | | 5.8% | |
KNOT Offshore Partners LP | | | 5.6% | |
NGL Energy Partners LP | | | 4.8% | |
Summit Midstream Partners LP | | | 4.8% | |
Crestwood Equity Partners LP | | | 4.6% | |
Golar LNG Partners LP | | | 4.3% | |
GasLog Partners LP | | | 4.2% | |
Report of
Independent Registered Public Accounting Firm
To the Board of Trustees and Shareholders of
Nuveen Energy MLP Total Return Fund
Nuveen All Cap Energy MLP Opportunities Fund:
In our opinion, the accompanying statements of assets and liabilities, including the portfolios of investments, and the related statements of operations, of changes in net assets, and of cash flows and the financial highlights present fairly, in all material respects, the financial position of Nuveen Energy MLP Total Return Fund and Nuveen All Cap Energy MLP Opportunities Fund (hereafter referred to as the “Funds”) as of November 30, 2017, the results of each of their operations and their cash flows for the year then ended, the changes in each of their net assets for each of the two years in the period then ended and the financial highlights for each of the periods indicated therein, in conformity with accounting principles generally accepted in the United States of America. These financial statements and financial highlights (hereafter referred to as “financial statements”) are the responsibility of the Funds’ management. Our responsibility is to express an opinion on these financial statements based on our audits. We conducted our audits of these financial statements in accordance with the standards of the Public Company Accounting Oversight Board (United States). Those standards require that we plan and perform the audit to obtain reasonable assurance about whether the financial statements are free of material misstatement. An audit includes examining, on a test basis, evidence supporting the amounts and disclosures in the financial statements, assessing the accounting principles used and significant estimates made by management, and evaluating the overall financial statement presentation. We believe that our audits, which included confirmation of securities as of November 30, 2017 by correspondence with the custodian and brokers, provide a reasonable basis for our opinion.
PricewaterhouseCoopers LLP
Chicago, IL
January 24, 2018
JMF
| | |
Nuveen Energy MLP Total Return Fund | | |
Portfolio of Investments | | November 30, 2017 |
| | | | | | | | | | | | | | | | |
| Shares/Units | | | Description (1) | | | | | | | | Value | |
| | | | |
| | | | LONG-TERM INVESTMENTS – 146.0% (99.8% of Total Investments) | | | | | | | | | | | | |
| | | |
| | | | MASTER LIMITED PARTNERSHIPS & MLP AFFILIATES – 146.0% (99.8% of Total Investments) | | | | | | | | | |
| | | | |
| | | | Energy Equipment & Services – 1.6% (1.1% of Total Investments) | | | | | | | | | |
| | | | |
| | 640,836 | | | Archrock Partners LP | | | | | | | | | | $ | 7,017,154 | |
| | | | |
| | | | Oil, Gas & Consumable Fuels – 144.4% (98.7% of Total Investments) | | | | | | | | | |
| | | | |
| | 491,568 | | | American Midstream Partners LP | | | | | | | | | | | 5,874,238 | |
| | 482,362 | | | Andeavor Logistics LP | | | | | | | | | | | 21,590,523 | |
| | 850,210 | | | Buckeye Partners LP | | | | | | | | | | | 39,050,145 | |
| | 825,434 | | | Crestwood Equity Partners LP | | | | | | | | | | | 19,769,144 | |
| | 1,651,790 | | | DCP Midstream LP | | | | | | | | | | | 58,043,901 | |
| | 474,653 | | | Delek Logistics Partners LP | | | | | | | | | | | 13,883,600 | |
| | 1,819,800 | | | Enable Midstream Partners LP | | | | | | | | | | | 27,260,604 | |
| | 941,747 | | | Enbridge Energy Management LLC, (2) | | | | | | | | | | | 12,713,585 | |
| | 1,888,940 | | | Enbridge Energy Partners LP | | | | | | | | | | | 27,616,303 | |
| | 2,394,876 | | | Energy Transfer Partners LP | | | | | | | | | | | 39,778,890 | |
| | 3,456,765 | | | EnLink Midstream Partners LP | | | | | | | | | | | 55,273,672 | |
| | 818,834 | | | Enterprise Products Partners LP | | | | | | | | | | | 20,167,881 | |
| | 781,827 | | | Genesis Energy, LP | | | | | | | | | | | 16,785,826 | |
| | 395,180 | | | Golar LNG Partners LP, (3) | | | | | | | | | | | 7,899,648 | |
| | 560,000 | | | KNOT Offshore Partners LP, (3) | | | | | | | | | | | 11,312,000 | |
| | 224,025 | | | Martin Midstream Partners LP | | | | | | | | | | | 3,013,136 | |
| | 863,415 | | | MPLX LP | | | | | | | | | | | 30,962,062 | |
| | 679,895 | | | Navios Maritime Midstream Partners LP, (3) | | | | | | | | | | | 5,500,351 | |
| | 1,541,550 | | | NGL Energy Partners LP | | | | | | | | | | | 19,269,375 | |
| | 43,085 | | | NuStar Energy LP | | | | | | | | | | | 1,252,050 | |
| | 389,473 | | | ONEOK, Inc. | | | | | | | | | | | 20,213,649 | |
| | 407,200 | | | PBF Logistics LP | | | | | | | | | | | 8,021,840 | |
| | 1,270,678 | | | Plains All American Pipeline LP | | | | | | | | | | | 24,778,221 | |
| | 958,122 | | | Summit Midstream Partners LP | | | | | | | | | | | 18,156,412 | |
| | 132,855 | | | Sunoco LP | | | | | | | | | | | 3,900,623 | |
| | 162,550 | | | Tallgrass Energy Partners LP | | | | | | | | | | | 7,139,196 | |
| | 479,635 | | | Targa Resources Corp. | | | | | | | | | | | 20,816,159 | |
| | 486,045 | | | TC PipeLines LP | | | | | | | | | | | 24,695,946 | |
| | 91,535 | | | The Williams Companies Inc., (3) | | | | | | | | | | | 2,659,092 | |
| | 980,540 | | | USD Partners LP | | | | | | | | | | | 9,952,481 | |
| | 50,000 | | | Western Gas Partners, LP | | | | | | | | | | | 2,241,000 | |
| | 1,413,385 | | | Williams Partners LP | | | | | | | | | | | 51,871,230 | |
| | | | Total Oil, Gas & Consumable Fuels | | | | | | | | | | | 631,462,783 | |
| | | | Total Long-Term Investments (cost $592,023,150) | | | | | | | | | | | 638,479,937 | |
| | | | |
Principal
Amount (000) | | | Description (1) | | Coupon | | | Maturity | | | Value | |
| | | | |
| | | | SHORT-TERM INVESTMENTS – 0.3% (0.2% of Total Investments) | | | | | | | | | | | | |
| | | | |
| | | | REPURCHASE AGREEMENTS – 0.3% (0.2% of Total Investments) | | | | | | | | | |
| | | | |
| $ | 1,178 | | | Repurchase Agreement with Fixed Income Clearing Corporation, dated 11/30/17,
repurchase price $1,178,426, collateralized by $1,130,000 U.S. Treasury Notes,
3.625%, due 2/15/21, value $1,202,294 | | | 0.120% | | | | 12/01/17 | | | $ | 1,178,422 | |
| | | | Total Short-Term Investments (cost $1,178,422) | | | | | | | | | | | 1,178,422 | |
| | | | Total Investments (cost $593,201,572) – 146.3% | | | | | | | | | | | 639,658,359 | |
| | | | Borrowings – (40.0)% (4), (5) | | | | | | | | | | | (175,000,000 | ) |
| | | | Deferred Tax Liability, net – (6.2)% | | | | | | | | | | | (26,943,912 | ) |
| | | | Other Assets Less Liabilities – (0.1)% (6) | | | | | | | | | | | (562,485 | ) |
| | | | Net Assets – 100% | | | | | | | | | | $ | 437,151,962 | |
| | | | |
| JMF | | Nuveen Energy MLP Total Return Fund | | |
| | Portfolio of Investments (continued) | | November 30, 2017 |
Investments in Derivatives as of November 30, 2017
Interest Rate Swaps – OTC Uncleared
| | | | | | | | | | | | | | | | | | | | | | | | | | | | | | | | | | | | | | | | |
| Counterparty | | Notional
Amount | | | Fund
Pay/Receive
Floating Rate | | | Floating Rate Index | | | Fixed Rate
(Annualized) | | | Fixed Rate
Payment
Frequency | | | Effective
Date (7) | | | Optional
Termination
Date | | | Maturity
Date | | | Value | | | Unrealized
Appreciation
(Depreciation) | |
JPMorgan Chase Bank, N.A. | | $ | 94,500,000 | | | | Receive | | | | 1-Month LIBOR | | | | 1.969 | % | | | Monthly | | | | 6/01/18 | | | | 7/01/25 | | | | 7/01/27 | | | $ | 1,130,986 | | | $ | 1,130,986 | |
For Fund portfolio compliance purposes, the Fund’s industry classifications refer to any one or more of the industry sub-classifications used by one or more widely recognized market indexes or ratings group indexes, and/or as defined by Fund management. This definition may not apply for purposes of this report, which may combine industry sub-classifications into sectors for reporting ease.
| (1) | All percentages shown in the Portfolio of Investments are based on net assets unless otherwise noted. |
| (2) | Payment-in-kind (“PIK”) security. Depending on the terms of the security, distributions may be received in the form of cash, securities, or a combination of both. |
| (3) | Distribution designated as ordinary income which is recognized as “Dividends” on the Statement of Operations. |
| (4) | Borrowings as a percentage of Total Investments is 27.4%. |
| (5) | The Fund segregates 100% of its eligible investments (excluding any investments separately pledged as collateral for specific investments in derivatives, when applicable) in the Portfolio of Investments as collateral for borrowings. As of the end of the reporting period, investments with a value of $479,638,302 have been pledged as collateral for borrowings. |
| (6) | Other assets less liabilities includes the unrealized appreciation (depreciation) of certain over-the-counter (“OTC”) derivatives as presented on the Statement of Assets and Liabilities, when applicable. The unrealized appreciation (depreciation) of OTC cleared and exchange-traded derivatives is recognized as part of the cash collateral at brokers and/or the receivable or payable for variation margin as presented on the Statement of Assets and Liabilities, when applicable. |
| (7) | Effective date represents the date on which both the Fund and counterparty commence interest payment accruals on each contract. |
| LIBOR | London Inter-Bank Offered Rate |
See accompanying notes to financial statements.
JMLP
| | |
Nuveen All Cap Energy MLP Opportunities Fund | | |
Portfolio of Investments | | November 30, 2017 |
| | | | | | | | | | | | | | | | |
| Shares/Units | | | Description (1) | | | | | | | | Value | |
| | | | |
| | | | LONG-TERM INVESTMENTS – 136.8% (98.9% of Total Investments) | | | | | | | | | | | | |
| | | |
| | | | MASTER LIMITED PARTNERSHIPS & MLP AFFILIATES – 136.8% (98.9% of Total Investments) | | | | | | | | | |
| | | | |
| | | | Energy Equipment & Services – 4.4% (3.2% of Total Investments) | | | | | | | | | |
| | | | |
| | 431,902 | | | Archrock Partners LP | | | | | | | | | | $ | 4,729,327 | |
| | | | |
| | | | Gas Utilities – 3.5% (2.5% of Total Investments) | | | | | | | | | |
| | | | |
| | 84,049 | | | AmeriGas Partners, LP | | | | | | | | | | | 3,772,960 | |
| | | | |
| | | | Oil, Gas & Consumable Fuels – 128.9% (93.2% of Total Investments) | | | | | | | | | |
| | | | |
| | 719,495 | | | American Midstream Partners LP | | | | | | | | | | | 8,597,965 | |
| | 285,129 | | | Crestwood Equity Partners LP | | | | | | | | | | | 6,828,840 | |
| | 343,048 | | | DCP Midstream LP | | | | | | | | | | | 12,054,706 | |
| | 153,650 | | | Delek Logistics Partners LP | | | | | | | | | | | 4,494,263 | |
| | 951,490 | | | Enable Midstream Partners LP | | | | | | | | | | | 14,253,319 | |
| | 319,521 | | | Enbridge Energy Management LLC, (2) | | | | | | | | | | | 4,313,534 | |
| | 368,305 | | | Enbridge Energy Partners LP | | | | | | | | | | | 5,384,619 | |
| | 760,630 | | | EnLink Midstream Partners LP | | | | | | | | | | | 12,162,473 | |
| | 279,685 | | | GasLog Partners LP, (3) | | | | | | | | | | | 6,181,039 | |
| | 176,840 | | | Genesis Energy, LP | | | | | | | | | | | 3,796,755 | |
| | 187,215 | | | Global Partners LP | | | | | | | | | | | 3,257,541 | |
| | 315,640 | | | Golar LNG Partners LP, (3) | | | | | | | | | | | 6,309,644 | |
| | 227,270 | | | Hoegh LNG Partners LP | | | | | | | | | | | 3,977,225 | |
| | 154,535 | | | Holly Energy Partners LP | | | | | | | | | | | 5,116,654 | |
| | 410,190 | | | KNOT Offshore Partners LP, (3) | | | | | | | | | | | 8,285,837 | |
| | 102,170 | | | Martin Midstream Partners LP | | | | | | | | | | | 1,374,187 | |
| | 238,485 | | | Navios Maritime Midstream Partners LP, (3) | | | | | | | | | | | 1,929,344 | |
| | 565,613 | | | NGL Energy Partners LP | | | | | | | | | | | 7,070,163 | |
| | 200,000 | | | Oasis Midstream Partners LP | | | | | | | | | | | 3,624,000 | |
| | 110,525 | | | PBF Logistics LP | | | | | | | | | | | 2,177,343 | |
| | 372,815 | | | Summit Midstream Partners LP | | | | | | | | | | | 7,064,844 | |
| | 28,915 | | | Sunoco LP | | | | | | | | | | | 848,944 | |
| | 102,095 | | | Tallgrass Energy Partners LP | | | | | | | | | | | 4,484,012 | |
| | 52,473 | | | TC PipeLines LP | | | | | | | | | | | 2,666,153 | |
| | 314,902 | | | USD Partners LP | | | | | | | | | | | 3,196,255 | |
| | | | Total Oil, Gas & Consumable Fuels | | | | | | | | | | | 139,449,659 | |
| | | | Total Long-Term Investments (cost $152,881,236) | | | | | | | | | | | 147,951,946 | |
| | | | |
Principal
Amount (000) | | | Description (1) | | Coupon | | | Maturity | | | Value | |
| | | | |
| | | | SHORT-TERM INVESTMENTS – 1.5% (1.1% of Total Investments) | | | | | | | | | | | | |
| | | | |
| | | | REPURCHASE AGREEMENTS – 1.5% (1.1% of Total Investments) | | | | | | | | | |
| | | | |
| $ | 1,611 | | | Repurchase Agreement with Fixed Income Clearing Corporation, dated 11/30/17,
repurchase price $1,610,867, collateralized by $1,665,000 U.S. Treasury Notes,
1.375%, due 1/31/21, value $1,645,408 | | | 0.120% | | | | 12/01/17 | | | $ | 1,610,862 | |
| | | | Total Short-Term Investments (cost $1,610,862) | | | | | | | | | | | 1,610,862 | |
| | | | Total Investments (cost $154,492,098) – 138.3% | | | | | | | | | | | 149,562,808 | |
| | | | Borrowings – (38.4)% (4), (5) | | | | | | | | | | | (41,500,000 | ) |
| | | | Other Assets Less Liabilities – 0.1% (6) | | | | | | | | | | | 65,753 | |
| | | | Net Assets – 100% | | | | | | | | | | $ | 108,128,561 | |
| | | | |
| JMLP | | Nuveen All Cap Energy MLP Opportunities Fund |
| | Portfolio of Investments (continued) | | November 30, 2017 |
Investments in Derivatives as of November 30, 2017
Interest Rate Swaps – OTC Uncleared
| | | | | | | | | | | | | | | | | | | | | | | | | | | | | | | | | | | | | | | | |
| Counterparty | | Notional
Amount | | | Fund
Pay/Receive
Floating Rate | | | Floating Rate Index | | | Fixed Rate
(Annualized) | | | Fixed Rate
Payment
Frequency | | | Effective
Date (7) | | | Optional
Termination
Date | | | Maturity
Date | | | Value | | | Unrealized
Appreciation
(Depreciation) | |
Morgan Stanley Capital Services LLC | | $ | 21,000,000 | | | | Receive | | | | 1-Month LIBOR | | | | 2.042 | % | | | Monthly | | | | 6/01/18 | | | | 7/01/25 | | | | 7/01/27 | | | $ | 141,632 | | | $ | 141,632 | |
For Fund portfolio compliance purposes, the Fund’s industry classifications refer to any one or more of the industry sub-classifications used by one or more widely recognized market indexes or ratings group indexes, and/or as defined by Fund management. This definition may not apply for purposes of this report, which may combine industry sub-classifications into sectors for reporting ease.
| (1) | All percentages shown in the Portfolio of Investments are based on net assets unless otherwise noted. |
| (2) | Payment-in-kind (‘PIK”) security. Depending on the terms of the security, distributions may be received in the form of cash, securities, or a combination of both. |
| (3) | Distribution designated as ordinary income which is recognized as “Dividends” on the Statement of Operations. |
| (4) | Borrowings as a percentage of Total Investments is 27.7%. |
��
| (5) | The Fund segregates 100% of its eligible investments (excluding any investments separately pledged as collateral for specific investments in derivatives, when applicable) in the Portfolio of Investments as collateral for borrowings. As of the end of the reporting period, investments with a value of $95,704,459 have been pledged as collateral for borrowings. |
| (6) | Other assets less liabilities includes the unrealized appreciation (depreciation) of certain over-the-counter (“OTC”) derivatives as presented on the Statement of Assets and Liabilities, when applicable. The unrealized appreciation (depreciation) of OTC cleared and exchange-traded derivatives is recognized as part of the cash collateral at brokers and/or the receivable or payable for variation margin as presented on the Statement of Assets and Liabilities, when applicable. |
| (7) | Effective date represents the date on which both the Fund and counterparty commence interest payment accruals on each contract. |
| LIBOR | London Inter-Bank Offered Rate |
See accompanying notes to financial statements.
| | | | | | |
Statement of Assets and Liabilities | | November 30, 2017 |
| | | | | | | | |
| | | JMF | | | JMLP | |
Assets | | | | | | | | |
Long-term investments, at value (cost $592,023,150 and $152,881,236, respectively) | | $ | 638,479,937 | | | $ | 147,951,946 | |
Short-term investments, at value (cost approximates value) | | | 1,178,422 | | | | 1,610,862 | |
Unrealized appreciation on interest rate swaps | | | 1,130,986 | | | | 141,632 | |
Receivable for shares sold | | | — | | | | 53,202 | |
Deferred offering costs | | | — | | | | 181,085 | |
Other assets | | | 61,771 | | | | 10,141 | |
Total assets | | | 640,851,116 | | | | 149,948,868 | |
Liabilities | | | | | | | | |
Borrowings | | | 175,000,000 | | | | 41,500,000 | |
Cash overdraft | | | 1,686 | | | | 1,633 | |
Payable for: | | | | | | | | |
Interest | | | 308,532 | | | | 57,264 | |
Interest rate swaps purchased | | | 210,079 | | | | — | |
State income tax | | | 258,505 | | | | 8,989 | |
Deferred tax liability, net | | | 26,943,912 | | | | — | |
Accrued expenses: | | | | | | | | |
State franchise tax | | | 41,009 | | | | 6,236 | |
Management fees | | | 528,809 | | | | 130,957 | |
Trustees fees | | | 61,382 | | | | 9,107 | |
Other | | | 345,240 | | | | 106,121 | |
Total Liabilities | | | 203,699,154 | | | | 41,820,307 | |
Net assets | | $ | 437,151,962 | | | $ | 108,128,561 | |
Shares outstanding | | | 40,097,949 | | | | 13,162,721 | |
Net asset value (“NAV”) per share outstanding | | $ | 10.90 | | | $ | 8.21 | |
Net assets consist of: | | | | | | | | |
Shares, $0.01 par value per share | | $ | 400,979 | | | $ | 131,627 | |
Paid-in surplus | | | 386,537,516 | | | | 193,329,754 | |
Accumulated net investment income (loss), net of tax | | | (83,163,451 | ) | | | (9,161,203 | ) |
Accumulated net realized gain (loss), net of tax | | | 58,622,830 | | | | (71,383,959 | ) |
Net unrealized appreciation (depreciation), net of tax | | | 74,754,088 | | | | (4,787,658 | ) |
Net assets | | $ | 437,151,962 | | | $ | 108,128,561 | |
Authorized shares | | | Unlimited | | | | Unlimited | |
See accompanying notes to financial statements.
| | | | | | |
Statement of Operations | | Year Ended November 30, 2017 |
| | | | | | | | |
| | | JMF | | | JMLP | |
Investment Income | | | | | | | | |
Distributions from Master Limited Partnerships (“MLPs”) | | $ | 57,311,108 | | | $ | 12,210,678 | |
Less: Return of capital on distributions from MLPs | | | (57,311,108 | ) | | | (12,210,678 | ) |
Dividends | | | 2,784,123 | | | | 1,870,071 | |
Interest | | | 10,395 | | | | 5,753 | |
Total investment income | | | 2,794,518 | | | | 1,875,824 | |
Expenses | | | | | | | | |
Management fees | | | (7,237,602 | ) | | | (1,730,436 | ) |
Interest expense on borrowings | | | (3,399,419 | ) | | | (747,759 | ) |
Custodian fees | | | (70,736 | ) | | | (23,417 | ) |
Trustees fees | | | (30,225 | ) | | | (7,102 | ) |
Professional fees | | | (121,992 | ) | | | (98,208 | ) |
Shareholder reporting expenses | | | (61,577 | ) | | | (21,673 | ) |
Shareholder servicing agent fees | | | (297 | ) | | | (143 | ) |
Stock exchange listing fees | | | (11,383 | ) | | | (7,042 | ) |
Investor relations expenses | | | (143,256 | ) | | | (41,435 | ) |
Franchise tax expenses | | | (28,675 | ) | | | (26,895 | ) |
Other | | | (67,095 | ) | | | (93,927 | ) |
Total expenses | | | (11,172,257 | ) | | | (2,798,037 | ) |
Net investment income (loss) before taxes | | | (8,377,739 | ) | | | (922,213 | ) |
Deferred tax benefit | | | 3,199,288 | | | | — | |
Current tax (expense)/benefit | | | (80,152 | ) | | | (6,775 | ) |
Net investment income (loss) | | | (5,258,603 | ) | | | (928,988 | ) |
Realized and Unrealized Gain (Loss) | | | | | | | | |
Net realized gain (loss) from: | | | | | | | | |
Investments before taxes | | | 20,321,577 | | | | (11,465,552 | ) |
Swaps before taxes | | | (7,220,235 | ) | | | — | |
Deferred tax (expense)/benefit | | | (5,003,135 | ) | | | — | |
Net realized gain (loss) from investments | | | 8,098,207 | | | | (11,465,552 | ) |
Change in net unrealized appreciation (depreciation) of: | | | | | | | | |
Investments before taxes | | | (88,780,203 | ) | | | 7,700,171 | |
Swaps before taxes | | | 9,413,579 | | | | 141,632 | |
Deferred tax (expense)/benefit | | | 30,308,490 | | | | — | |
Change in net unrealized appreciation (depreciation) of investments | | | (49,058,134 | ) | | | 7,841,803 | |
Net realized and unrealized gain (loss) | | | (40,959,927 | ) | | | (3,623,749 | ) |
Net increase (decrease) in net assets from operations | | $ | (46,218,530 | ) | | $ | (4,552,737 | ) |
See accompanying notes to financial statements.
| | | | | | |
Statement of Changes in Net Assets | | |
| | | | | | | | | | | | | | | | |
| | | JMF | | | JMLP | |
| | | Year
Ended
11/30/17 | | | Year
Ended
11/30/16 | | | Year
Ended
11/30/17 | | | Year
Ended
11/30/16 | |
Operations | | | | | | | | | | | | | | | | |
Net investment income (loss) | | $ | (5,258,603 | ) | | $ | (4,900,707 | ) | | $ | (928,988 | ) | | $ | (587,082 | ) |
Net realized gain (loss) from: | | | | | | | | | | | | | | | | |
Investments | | | 15,318,442 | | | | (53,597,931 | ) | | | (11,465,552 | ) | | | (43,674,877 | ) |
Swaps | | | (7,220,235 | ) | | | — | | | | — | | | | — | |
Change in net unrealized appreciation (depreciation) of: | | | | | | | | | | | | | | | | |
Investments | | | (58,471,713 | ) | | | 111,267,003 | | | | 7,700,171 | | | | 65,167,980 | |
Swaps | | | 9,413,579 | | | | (750,605 | ) | | | 141,632 | | | | — | |
Net increase (decrease) in net assets from operations | | | (46,218,530 | ) | | | 52,017,760 | | | | (4,552,737 | ) | | | 20,906,021 | |
Distributions to Shareholders | | | | | | | | | | | | | | | | |
From net investment income | | | (7,093,871 | ) | | | — | | | | — | | | | — | |
Return of capital | | | (46,224,336 | ) | | | (53,172,869 | ) | | | (12,646,074 | ) | | | (13,115,564 | ) |
Decrease in net assets from distributions to shareholders | | | (53,318,207 | ) | | | (53,172,869 | ) | | | (12,646,074 | ) | | | (13,115,564 | ) |
Fund Share Transactions | | | | | | | | | | | | | | | | |
Proceeds from shelf offering, net of offering costs | | | 4,819,170 | | | | — | | | | 3,479,922 | | | | — | |
Proceeds from shares issued to shareholders due to reinvestment of distributions | | | 1,737,280 | | | | 762,380 | | | | 24,162 | | | | 28,658 | |
Net increase (decrease) in net assets from Fund share transactions | | | 6,556,450 | | | | 762,380 | | | | 3,504,084 | | | | 28,658 | |
Net increase (decrease) in net assets | | | (92,980,287 | ) | | | (392,729 | ) | | | (13,694,727 | ) | | | 7,819,115 | |
Net assets at the beginning of period | | | 530,132,249 | | | | 530,524,978 | | | | 121,823,288 | | | | 114,004,173 | |
Net assets at the end of period | | $ | 437,151,962 | | | $ | 530,132,249 | | | $ | 108,128,561 | | | $ | 121,823,288 | |
Accumulated net investment income (loss), net of tax at the end of period | | $ | (83,163,451 | ) | | $ | (70,810,977 | ) | | $ | (9,161,203 | ) | | $ | (8,232,215 | ) |
See accompanying notes to financial statements.
| | | | | | |
Statement of Cash Flows | | Year Ended November 30, 2017 |
| | | | | | | | |
| | | JMF | | | JMLP | |
Cash Flows from Operating Activities: | | | | | | | | |
Net Increase (Decrease) in Net Assets from Operations | | $ | (46,218,530 | ) | | $ | (4,552,737 | ) |
Adjustments to reconcile the net increase (decrease) in net assets from operations to net cash provided by (used in) operating activities: | | | | | | | | |
Purchases of investments | | | (85,288,273 | ) | | | (44,871,272 | ) |
Proceeds from sales of investments | | | 98,643,395 | | | | 37,871,742 | |
Proceeds from (Purchases of) short-term investments, net | | | (467,756 | ) | | | 2,566,560 | |
Proceeds from (Payments for) swap contracts, net | | | (7,220,235 | ) | | | — | |
Premiums received (paid) for interest rate swaps | | | 2,996,828 | | | | — | |
Return of capital distributions from MLPs | | | 57,311,108 | | | | 12,210,678 | |
(Increase) Decrease in: | | | | | | | | |
Receivable for income tax refund | | | — | | | | 18,189 | |
Receivable for investments sold | | | 5,008,045 | | | | 6,869,003 | |
Other assets | | | (12,518 | ) | | | (2,996 | ) |
Increase (Decrease) in: | | | | | | | | |
Deferred tax liability, net | | | (28,504,644 | ) | | | — | |
Payable for interest | | | 105,716 | | | | 16,260 | |
Payable for interest rate swaps purchased | | | 210,079 | | | | — | |
Payable for federal income tax | | | (465,450 | ) | | | — | |
Payable for state income tax | | | (3,993 | ) | | | 1,023 | |
Accrued state franchise tax expense | | | (9,171 | ) | | | (8,527 | ) |
Accrued management fees | | | (74,203 | ) | | | (5,321 | ) |
Accrued Trustees fees | | | 6,417 | | | | 1,138 | |
Accrued other expenses | | | 37,636 | | | | 7,854 | |
Net realized (gain) loss from: | | | | | | | | |
Investments before taxes | | | (20,321,577 | ) | | | 11,465,552 | |
Swaps before taxes | | | 7,220,235 | | | | — | |
Change in net unrealized appreciation (depreciation) of: | | | | | | | | |
Investments before taxes | | | 88,780,203 | | | | (7,700,171 | ) |
Swaps before taxes | | | (9,413,579 | ) | | | (141,632 | ) |
Net cash provided by (used in) operating activities | | | 62,319,733 | | | | 13,745,343 | |
Cash Flows from Financing Activities | | | | | | | | |
Proceeds from borrowings | | | 6,450,000 | | | | 6,000,000 | |
Repayments of borrowings | | | (17,000,000 | ) | | | (3,500,000 | ) |
Proceeds from shelf offering, net of offering costs | | | 4,819,170 | | | | 3,426,720 | |
Increase (Decrease) in cash overdraft | | | (5,007,976 | ) | | | (6,869,066 | ) |
Cash distributions paid to shareholders | | | (51,580,927 | ) | | | (12,621,912 | ) |
(Payments for) deferred offering costs | | | — | | | | (181,085 | ) |
Net cash provided by (used in) financing activities | | | (62,319,733 | ) | | | (13,745,343 | ) |
Net Increase (Decrease) in Cash | | | — | | | | — | |
Cash at the beginning of period | | | — | | | | — | |
Cash at the end of period | | $ | — | | | $ | — | |
| | |
| Supplemental Disclosures of Cash Flow Information | | JMF | | | JMLP | |
Cash paid for interest on borrowings (excluding borrowing costs) | | $ | 3,293,703 | | | $ | 731,499 | |
Net cash paid (received) for taxes | | | 595,829 | | | | 40,682 | |
See accompanying notes to financial statements.
THIS PAGE INTENTIONALLY LEFT BLANK
Financial
Highlights
Selected data for a share outstanding throughout each period:
| | | | | | | | | | | | | | | | | | | | | | | | | | | | | | | | | | | | | | | | | | | | |
| | | | | | | |
| | | | | | Investment Operations | | | Less Distributions | | | | | | | | | | | | | |
| | | Beginning
NAV | | | Net
Investment
Income
(Loss)(a) | | | Net
Realized/
Unrealized
Gain (Loss) | | | Total | | | From
Net
Investment
Income | | | Return
of
Capital | | | Total | | | Offering
Costs | | | Premium
from
Shares
Sold
through
Shelf
Offering | | | Ending
NAV | | | Ending
Share
Price | |
|
JMF | |
Year Ended 11/30: | |
2017 | | $ | 13.42 | | | $ | (0.13 | ) | | $ | (1.04 | ) | | $ | (1.17 | ) | | $ | (0.18 | ) | | $ | (1.17 | ) | | $ | (1.35 | ) | | $ | — | | | $ | — | ** | | $ | 10.90 | | | $ | 10.57 | |
2016 | | | 13.45 | | | | (0.12 | ) | | | 1.44 | | | | 1.32 | | | | — | | | | (1.35 | ) | | | (1.35 | ) | | | — | | | | — | | | | 13.42 | | | | 13.32 | |
2015 | | | 22.10 | | | | (0.08 | ) | | | (7.23 | ) | | | (7.31 | ) | | | — | | | | (1.34 | ) | | | (1.34 | ) | | | — | | | | — | | | | 13.45 | | | | 11.91 | |
2014 | | | 20.22 | | | | (0.32 | ) | | | 3.48 | | | | 3.16 | | | | (0.12 | ) | | | (1.16 | ) | | | (1.28 | ) | | | — | | | | — | | | | 22.10 | | | | 20.72 | |
2013 | | | 17.73 | | | | (0.29 | ) | | | 4.04 | | | | 3.75 | | | | (1.14 | ) | | | (0.12 | ) | | | (1.26 | ) | | | — | | | | — | | | | 20.22 | | | | 19.40 | |
|
JMLP | |
Year Ended 11/30: | |
2017 | | | 9.55 | | | | (0.07 | ) | | | (0.29 | ) | | | (0.36 | ) | | | — | | | | (0.98 | ) | | | (0.98 | ) | | | — | | | | — | ** | | | 8.21 | | | | 8.02 | |
2016 | | | 8.94 | | | | (0.05 | ) | | | 1.69 | | | | 1.64 | | | | — | | | | (1.03 | ) | | | (1.03 | ) | | | — | | | | — | | | | 9.55 | | | | 9.80 | |
2015 | | | 18.52 | | | | (0.12 | ) | | | (8.09 | ) | | | (8.21 | ) | | | — | | | | (1.37 | ) | | | (1.37 | ) | | | — | | | | — | | | | 8.94 | | | | 8.35 | |
2014(g) | | | 19.10 | | | | (0.27 | ) | | | 0.73 | | | | 0.46 | | | | (0.21 | ) | | | (0.79 | ) | | | (1.00 | ) | | | (0.04 | ) | | | — | | | | 18.52 | | | | 16.35 | |
| | | | | | | | |
| | | Borrowings at the End of Period | |
| | | Aggregate
Amount
Outstanding
(000) | | | Asset
Coverage
Per $1,000 | |
|
JMF | |
Year Ended 11/30: | |
2017 | | $ | 175,000 | | | $ | 3,498 | |
2016 | | | 185,550 | | | | 3,857 | |
2015 | | | 199,000 | | | | 3,666 | |
2014 | | | 315,000 | | | | 3,768 | |
2013 | | | 283,000 | | | | 3,818 | |
|
JMLP | |
Year Ended 11/30: | |
2017 | | | 41,500 | | | | 3,606 | |
2016 | | | 39,000 | | | | 4,124 | |
2015 | | | 41,800 | | | | 3,727 | |
2014(g) | | | 85,000 | | | | 3,780 | |
| (a) | Per share Net Investment Income (Loss) is calculated using the average daily shares method. |
| (b) | Total Return Based on NAV is the combination of changes in NAV, reinvested dividend income at NAV and reinvested capital gains distributions at NAV, if any. The last dividend declared in the period, which is typically paid on the first business day of the following month, is assumed to be reinvested at the ending NAV. The actual reinvest price for the last dividend declared in the period may often be based on the Fund’s market price (and not its NAV), and therefore may be different from the price used in the calculation. Total returns are not annualized. |
Total Return Based on Share Price is the combination of changes in the market price per share and the effect of reinvested dividend income and reinvested capital gains distributions, if any, at the average price paid per share at the time of reinvestment. The last dividend declared in the period, which is typically paid on the first business day of the following month, is assumed to be reinvested at the ending market price. The actual reinvestment for the last dividend declared in the period may take place over several days, and in some instances may not be based on the market price, so the actual reinvestment price may be different from the price used in the calculation. Total returns are not annualized.
| | | | | | | | | | | | | | | | | | | | | | | | | | | | | | | | | | |
| | | | | | | Ratios/Supplemental Data | |
| Total Returns | | | | | | Ratios to Average Net Assets
Before Reimbursement/
Income Taxes/
Tax Benefit (Expense)(e) | | | Ratios to Average Net Assets
After Reimbursement/
Income Taxes/
Tax Benefit (Expense)(d)(e) | | | Ratios
to Average
Net Assets | | | | |
| | | | | | | | |
Based
on
NAV(b) | | | Based
on
Share
Price(b) | | | Ending
Net
Assets
(000) | | | Expenses | | | Net
Investment
Income (Loss) | | | Expenses | | | Net
Investment
Income (Loss) | | | Current and
Deferred Tax
Benefit
(Expense) | | | Portfolio
Turnover
Rate(f) | |
| | | | | | | | |
| | | | | | | | | | | | | | | | | | | | | | | | | | | | | | | | | | | |
| | | | | | | | | | | | | | | | | | | | | | | | | | | | | | | | | | |
| | (9.44 | )% | | | (11.44 | )% | | $ | 437,152 | | | | (2.23 | )% | | | (1.67 | )% | | | 3.45 | % | | | (1.05 | )% | | | 5.68 | % | | | 12 | % |
| | 12.27 | | | | 27.51 | | | | 530,132 | | | | (1.99 | ) | | | (1.46 | ) | | | (8.10 | ) | | | (1.05 | ) | | | (6.11 | ) | | | 28 | |
| | (34.43 | ) | | | (37.51 | ) | | | 530,525 | | | | (1.95 | ) | | | (0.68 | ) | | | 22.29 | (c) | | | (0.42 | )(c) | | | 24.23 | | | | 18 | |
| | 15.67 | | | | 13.67 | | | | 871,905 | | | | (1.84 | ) | | | (1.45 | ) | | | (10.38 | ) | | | (1.47 | ) | | | (8.54 | ) | | | 6 | |
| | 21.51 | | | | 13.20 | | | | 797,625 | | | | (1.98 | ) | | | (1.97 | ) | | | (13.22 | ) | | | (1.48 | ) | | | (11.25 | ) | | | 39 | |
| | | | | | | | |
| | | | | | | | | | | | | | | | | | | | | | | | | | | | | | | | | | | |
| | | | | | | | | | | | | | | | | | | | | | | | | | | | | | | | | | |
| | (4.22 | ) | | | (8.91 | ) | | | 108,129 | | | | (2.32 | ) | | | (0.76 | ) | | | (2.33 | ) | | | (0.77 | ) | | | (0.01 | ) | | | 24 | |
| | 22.62 | | | | 34.48 | | | | 121,823 | | | | (2.15 | ) | | | (0.59 | ) | | | (2.14 | ) | | | (0.58 | ) | | | 0.01 | | | | 37 | |
| | (46.47 | ) | | | (43.24 | ) | | | 114,004 | | | | (2.02 | ) | | | (1.42 | ) | | | (0.16 | ) | | | (0.85 | ) | | | 1.86 | | | | 37 | |
| | 1.97 | | | | (13.76 | ) | | | 236,281 | | | | (1.77 | )* | | | (1.40 | )* | | | (3.13 | )* | | | (1.82 | )* | | | (1.36 | ) | | | 25 | |
| (c) | During the fiscal year ended November 30, 2015, the Adviser voluntarily reimbursed the Fund for certain expenses incurred in connection with an equity shelf program. As a result, the Expenses and Net Investment Income (Loss) Ratios to Average Net Assets reflect this voluntary expense reimbursement from Adviser. The Expenses and Net Investment Income (Loss) Ratios to Average Net Assets excluding this expense reimbursement after income taxes/tax benefit (expenses) from the Adviser were as follows: |
| | | | | | | | |
| Ratios to Average Net Assets | |
| JMF | | Expenses | | | Net Investment
Income (Loss) | |
Year Ended 11/30: | | | | | | | | |
2015 | | | 22.27 | % | | | (0.44 | )% |
| (d) | Expense ratios include the current and deferred tax benefit (expense) allocated to net investment income (loss) and the deferred tax benefit (expense) allocated to realized and unrealized gain (loss). Net Investment Income (Loss) ratios exclude the deferred tax benefit (expense) allocated to realized and unrealized gain (loss). |
| (e) • | Net Investment Income (Loss) ratios reflect income earned and expenses incurred on assets attributable to borrowings, as described in Note 7 – Borrowing Arrangements. |
| | • | Each ratio includes the effect of all interest expense paid and other costs related to borrowings as follows: |
| | | | |
Ratios of Borrowings Interest Expense
to Average Net Assets | |
JMF | |
Year Ended 11/30: | |
2017 | | | (0.68 | )% |
2016 | | | (0.45 | ) |
2015 | | | (0.37 | ) |
2014 | | | (0.32 | ) |
2013 | | | (0.41 | ) |
| | | | |
Ratios of Borrowings Interest Expense
to Average Net Assets | |
JMLP | |
Year Ended 11/30: | |
2017 | | | (0.62 | )% |
2016 | | | (0.40 | ) |
2015 | | | (0.34 | ) |
2014(g) | | | (0.29 | )* |
| (f) | Portfolio Turnover Rate is calculated based on the lesser of long-term purchases or sales (as disclosed in Note 5 – Investment Transactions) divided by the average long-term market value during the period. |
| (g) | For the period March 26, 2014 (commencement of operations) through November 30, 2014. |
| ** | Rounds to less than $0.01. |
See accompanying notes to financial statements.
Notes to
Financial Statements
1. General Information and Significant Accounting Policies
General Information
Fund Information
The funds covered in this report and their corresponding New York Stock Exchange (“NYSE”) symbols are as follows (each a “Fund” and collectively, the “Funds”):
| | • | | Nuveen Energy MLP Total Return Fund (JMF) |
| | • | | Nuveen All Cap Energy MLP Opportunities Fund (JMLP) |
The Funds are registered under the Investment Company Act of 1940, as amended, as non-diversified closed-end management investment companies. JMF and JMLP were each organized as a Massachusetts business trust on September 27, 2010 and July 25, 2013, respectively.
The end of the reporting period for the Funds is November 30, 2017, and the period covered by these Notes to Financial Statements is the fiscal year ended November 30, 2017 (the “current fiscal period”).
Investment Adviser
The Funds’ investment adviser is Nuveen Fund Advisors, LLC (the “Adviser”), a subsidiary of Nuveen, LLC (“Nuveen”). Nuveen is the investment management arm of Teachers Insurance and Annuity Association of America (TIAA). The Adviser has overall responsibility for management of the Funds, oversees the management of the Funds’ portfolios, manages the Funds’ business affairs and provides certain clerical, bookkeeping and other administrative services, and, if necessary, asset allocation decisions. The Adviser has entered into sub-advisory agreements with Advisory Research Inc., (the “Sub-Adviser”), a wholly-owned subsidiary of Piper Jaffray Companies, under which the Sub-Adviser’s MLP & Energy Infrastructure team manages the investment portfolios of the Funds.
Investment Objectives and Principal Investment Strategies
JMF’s investment objective is to provide tax-advantaged total return. The Fund seeks to achieve its investment objective by investing primarily in a portfolio of master limited partnerships (“MLPs”) in the energy sector. Under normal market circumstances, the Fund will invest at least 80% of its managed assets (as defined in Note 6 – Management Fees and Other Transactions with Affiliates) in MLPs in the energy sector. The Fund considers investments in MLPs to include investments that offer economic exposure to publicly traded and private MLPs in the form of equity securities of MLPs, securities of entities holding primarily general partner or managing member interests in MLPs, securities that are derivatives of interests in MLPs and debt securities of MLPs. Further, the Fund considers an entity to be part of the energy sector if it derives at least 50% of its revenues from the business of exploring, developing, producing, gathering, transporting, processing, storing, refining, distributing, mining or marketing natural gas, natural gas liquids, crude oil, refined petroleum products or coal.
JMLP’s investment objective is to provide a high level of total return including current distributions and capital appreciation. Under normal circumstances, the Fund will invest at least 80% of its managed assets in energy MLPs. The Fund considers investments in MLPs to include investments that offer economic exposure to publicly traded MLPs and private investments that have MLP characteristics, but are not publicly traded. The Fund considers an MLP to be part of the energy sector if it derives at least 50% of its revenues from the business of exploring, developing, producing, transporting, gathering and processing, storing, refining, distributing, mining or marketing of natural gas, natural gas liquids (including propane), crude oil, refined petroleum products or coal. The Fund will invest at least 60% of its managed assets in small and mid cap energy MLPs. The Fund considers an MLP to be small cap if its market capitalization at the time of investment is less than the capitalization limit for the small cap MLPs included in the Solactive Junior MLP Composite Index immediately after its first reconstitution in each calendar quarter. The Fund considers an MLP to be large cap if its market capitalization at the time of investment is greater than the median market capitalization of the Alerian Large Cap MLP Index immediately after its first reconstitution in each calendar year. The Fund considers an MLP to be mid cap if its market capitalization at the time of investment is less than the median market capitalization of the Alerian Large Cap MLP Index and greater than the capitalization limit for the Solactive Junior MLP Composite Index. The Fund’s capitalization thresholds will change over time as the composition of these indices change.
Tax Cuts and Jobs Act of 2017
The Tax Cuts and Jobs Act of 2017 was signed into law on December 22, 2017. Prior to enactment, the statutory income tax rate on corporations was 35%. This law reduced the corporate income rate to 21% beginning on January 1, 2018. Therefore, the net deferred tax liability for JMF was adjusted on
December 22, 2017 to account for this rate reduction, which in turn increased the net asset value (“NAV”) of the Fund. If the 21% federal income tax rate was
effective for November 30, 2017, JMF’s net deferred tax liability would decrease by $10,388,782 as a result of this rate change, which would increase the Fund’s NAV by $0.26 per share.
JMLP, on the other hand, has a net deferred tax asset for which a full valuation allowance is applied as of November 30, 2017. While the net deferred tax asset would decrease due to the reduction in income tax rate, the valuation allowance would also be reduced by the same amount, resulting in no impact to the NAV of the Fund.
Significant Accounting Policies
Each Fund is an investment company and follows accounting and reporting guidance under Financial Accounting Standards Board (FASB) Accounting Standards Codification (ASC) Topic 946 “Financial Services-Investment Companies.” The following is a summary of significant accounting policies followed by the Funds in the preparation of their financial statements in accordance with accounting principles generally accepted in the United States of America (“U.S. GAAP”).
Investment Transactions
Investment transactions are recorded on a trade date basis. Realized gains and losses from investment transactions are determined on the specific identification method, which is the same basis used for federal income tax purposes.
Investment Income
Dividend income is recorded on the ex-dividend date or, for foreign securities, when information is available. Non-cash dividends received in the form of stock, if any, are recognized on the ex-dividend date and recorded at fair value. Interest income is recorded on an accrual basis.
Each Fund records the character of distributions received from MLPs based on estimates made at the time such distributions are received. These estimates are based upon a historical review of information available from each MLP and other industry sources. Each Fund’s characterization of the estimates may subsequently be revised based on information received from MLPs after their tax reporting periods conclude. Distributions, recognized as “Distributions from MLPs” on the Statement of Operations, are offset by amounts characterized as return of capital from the MLP entities, which are recognized as “Return of capital on distributions from MLPs” on the Statement of Operations. During the current fiscal period, each Fund estimated and characterized 100% of its distributions from MLPs as return of capital, unless otherwise noted in their Portfolio of Investments.
Professional Fees
Professional fees presented on the Statement of Operations consist of legal fees incurred in the normal course of operations, audit fees, tax consulting fees and, in some cases, workout expenditures. Workout expenditures are incurred in an attempt to protect or enhance an investment or to pursue other claims or legal actions on behalf of Fund shareholders. If a refund is received for workout expenditures paid in a prior reporting period, such amounts will be recognized as “Legal fee refund” on the Statement of Operations.
Income Taxes
Each Fund is treated as a regular corporation, or “C” corporation, for U.S. federal income tax purposes. Accordingly, each Fund is generally subject to U.S. federal income tax on its taxable income at statutory rates applicable to corporations (currently at a maximum rate of 35%). The estimated effective state income tax rate for JMF and JMLP are 1.82% and 2.43%, respectively. Each Fund may be subject to a 20% federal alternative minimum tax on its federal alternative minimum taxable income to the extent that its alternative minimum tax exceeds its regular federal income tax. Current tax expense may include non-deductible interest and penalties.
Each Fund’s income tax provision consists of the following as of the end of the reporting period:
| | | | | | | | |
| | | JMF | | | JMLP | |
Current tax expense (benefit): | | | | | | | | |
Federal | | $ | 4,915 | | | $ | — | |
State | | | 75,237 | | | | 6,775 | |
Total current tax expense (benefit) | | $ | 80,152 | | | $ | 6,775 | |
| | |
| | | JMF | | | JMLP | |
Deferred tax expense (benefit): | | | | | | | | |
Federal | | $ | (27,096,269 | ) | | $ | — | |
State | | | (1,408,374 | ) | | | — | |
Total deferred tax expense (benefit) | | $ | (28,504,643 | ) | | $ | — | |
Notes to Financial Statements (continued)
The reconciliation between the federal statutory income tax rate of 35% and the effective tax rate on net investment income (loss) and realized and unrealized gain (loss) follows:
| | | | | | | | | | | | | | | | | | | | |
| | | JMF | | | | | | JMLP | |
| Description | | Amount | | | Rate | | | | | | Amount | | | Rate | |
Application of statutory income tax rate | | $ | (26,125,057 | ) | | | 35.00 | % | | | | | | $ | (1,591,087 | ) | | | 35.00 | % |
State income taxes, net of federal benefit | | | (1,359,470 | ) | | | 1.82 | | | | | | | | (110,628 | ) | | | 2.43 | |
Effect of permanent differences – Dividends Received Deduction | | | (749,422 | ) | | | 1.00 | | | | | | | | (430,784 | ) | | | 9.48 | |
Effect of valuation allowance | | | — | | | | — | | | | | | | | 2,157,168 | | | | (47.45 | ) |
Other | | | (190,542 | ) | | | 0.26 | | | | | | | | (17,894 | ) | | | 0.39 | |
Total income tax expense (benefit) | | $ | (28,424,491 | ) | | | 38.08 | % | | | | | | $ | 6,775 | | | | (0.15 | )% |
Each Fund invests its assets primarily in MLPs, which generally are treated as partnerships for federal income tax purposes. As a limited partner in the MLPs, each Fund includes its allocable share of the MLPs’ taxable income in computing its own taxable income. Each Fund’s tax expense or benefit is recognized on the Statement of Operations based on the component of income or gains (losses) to which such expense or benefit relates. Deferred income taxes reflect the net tax effects of temporary differences between the carrying amounts of assets and liabilities for financial reporting purposes and the amounts used for income tax purposes. Such temporary differences are principally: (i) taxes on unrealized gains/(losses), which are attributable to the temporary difference between fair market value and tax basis, (ii) the net tax effects of temporary differences between the carrying amounts of assets and liabilities for financial reporting and income tax purposes and (iii) the net tax benefit of accumulated net operating losses. Deferred tax assets and liabilities are measured using effective tax rates expected to apply to taxable income in the years such temporary differences are realized or otherwise settled. To the extent a Fund has a deferred tax asset, consideration is given to whether or not a valuation allowance is required. The determination of whether a valuation allowance is required is based on the evaluation criterion provided by ASC 740, Income Taxes (“ASC 740”) that it is more-likely-than-not that some portion or all of the deferred tax asset will not be realized. Among the factors considered in assessing each Fund’s valuation allowance: the nature, frequency and severity of current and cumulative losses, forecasts of future profitability, the duration of statutory carryforward periods and the associated risk that operating and capital loss carryforwards may expire unused. Significant appreciation or depreciation of Fund assets subsequent to the reporting period can impact future determinations of whether a deferred tax asset is more-likely-than-not to be realized, which in turn may result in adjustments to the valuation allowance reported in the tables below.
Components of the Funds’ deferred tax assets and liabilities as of the end of the reporting period, are as follows:
| | | | | | | | |
| | | JMF | | | JMLP | |
| Description | | Deferred
Benefit
(Liability) | | | Deferred
Benefit
(Liability) | |
| Deferred tax assets: | | | | | | | | |
Federal net operating loss | | $ | 20,473,483 | | | $ | 13,105,038 | |
Federal capital loss carryforward | | | 9,419,198 | | | | 21,582,468 | |
State net operating and capital loss carryforward (tax basis) | | | 2,771,923 | | | | 1,826,126 | |
Accumulated net unrealized loss on investments (tax basis) | | | — | | | | — | |
Accumulated net unrealized loss on swaps (tax basis) | | | — | | | | — | |
Tax credit carryforward – AMT | | | 984,326 | | | | — | |
Foreign Tax Credit | | | 267,564 | | | | — | |
Other | | | 44,690 | | | | 5,676 | |
| | | $ | 33,961,184 | | | $ | 36,519,308 | |
| Deferred tax liabilities: | | | | | | | | |
Accumulated net unrealized gain on swaps (tax basis) | | $ | (420,315 | ) | | $ | (53,434 | ) |
Accumulated net unrealized gain on investments (tax basis) | | | (59,277,970 | ) | | | (4,770,390 | ) |
| | | $ | (59,698,285 | ) | | $ | (4,823,824 | ) |
| Net deferred taxes before valuation allowance | | $ | (25,737,101 | ) | | $ | 31,695,484 | |
Less: valuation allowance | | | (1,206,811 | ) | | | (31,695,484 | ) |
Net deferred tax assets (liabilities) | | $ | (26,943,912 | ) | | $ | — | |
| | |
| Changes in the valuation allowance were as follows: | | | | | | | | |
Balance at the beginning of period | | $ | 1,206,811 | | | $ | 29,538,317 | |
Initial allowance recorded | | | — | | | | — | |
Provision to return | | | — | | | | 87,336 | |
Increase of valuation allowance | | | — | | | | 2,089,631 | |
Change in state tax deferred rate | | | — | | | | (19,800 | ) |
Balance at the end of period | | $ | 1,206,811 | | | $ | 31,695,484 | |
As of November 30, 2017, the Funds had net operating loss carryforwards available for federal income tax purposes to be applied against future taxable income, if any. If not applied, the carryforwards will expire as follows:
| | | | | | | | |
| Net Operating Loss Carryforwards: | | JMF | | | JMLP | |
Expiration: | | | | | | | | |
November 30, 2034 | | $ | 7,143,293 | | | $ | — | |
November 30, 2035 | | | 13,680,649 | | | | 18,213,944 | |
November 30, 2036 | | | — | | | | 5,995,088 | |
November 30, 2037 | | | 37,671,724 | | | | 13,233,933 | |
Total | | $ | 58,495,666 | | | $ | 37,442,965 | |
As of November 30, 2017, the Funds had unused capital loss carryforwards available for federal income tax purposes to be applied against future capital gains, if any. If not applied, the carryforwards will expire as follows:
| | | | | | | | |
| | | JMF | | | JMLP | |
Expiration: | | | | | | | | |
November 30, 2020 | | $ | — | | | $ | 18,438,620 | |
November 30, 2021 | | | 26,911,995 | | | | 34,789,250 | |
November 30, 2022 | | | — | | | | 8,436,325 | |
Total | | $ | 26,911,995 | | | $ | 61,664,195 | |
As of November 30, 2017, JMF had AMT credit carryforwards of $984,326.
For all open tax years and all major taxing jurisdictions, management of the Funds has concluded that there are no significant uncertain tax positions that would require recognition in the financial statements. Open tax years are those that are open for examination by taxing authorities (i.e., generally the last four tax year ends and the interim tax period since then). Furthermore, management of the Funds is also not aware of any tax positions for which it is reasonably possible that the total amounts of unrecognized tax benefits will significantly change in the next twelve months.
The tables below present the cost and unrealized appreciation (depreciation) of each Fund’s investment portfolio, as determined on a federal income tax basis, as of November 30, 2017.
For purposes of this disclosure, derivative tax cost is generally the sum of any upfront fees or premiums exchanged and any amounts unrealized for income statement reporting but realized in income and/or capital gains for tax reporting. If a particular derivative category does not disclose any tax unrealized appreciation or depreciation, the change in value of those derivatives have generally been fully realized for tax purposes.
| | | | | | | | |
| | | JMF | | | JMLP | |
Tax cost of investments | | $ | 480,039,533 | | | $ | 136,918,197 | |
Gross unrealized: | | | | | | | | |
Appreciation | | $ | 243,736,742 | | | $ | 37,659,067 | |
Depreciation | | | (84,117,916 | ) | | | (25,014,456 | ) |
Net unrealized appreciation (depreciation) of investments | | $ | 159,618,826 | | | $ | 12,644,611 | |
| | |
| | | JMF | | | JMLP | |
Tax cost of swaps | | $ | — | | | $ | — | |
Net unrealized appreciation (depreciation) of swaps | | | 1,130,986 | | | | 141,632 | |
Dividends and Distributions to Shareholders
Distributions to shareholders are recorded on the ex-dividend date. The amount and timing of distributions are determined in accordance with federal income tax regulations, which may differ from U.S. GAAP.
Each Fund uses a cash flow-based distribution approach, designed to provide attractive quarterly distributions throughout the year, in amounts based on each Fund’s net cash flow received from portfolio investments. Net cash flow consists primarily of distributions received from each Fund’s investments in shares of energy MLPs, less payments on any of its leveraging instruments and other Fund expenses. Currently, each Fund intends to distribute substantially all of its net distributable cash flow received without sourcing incremental amounts from other components, such as realized or unrealized capital gains and/or returns of Fund principal.
For purposes of determining the income tax characterization of each Fund’s distributions, the amount of each Fund’s distributions attributable to each Fund’s earnings and profits for federal income tax purposes are characterized to Fund shareholders as taxable ordinary dividends, while the amount of
Notes to Financial Statements (continued)
distributions in excess of each Fund’s earnings and profits for federal income tax purposes are characterized as a return of capital. Each Fund will calculate its earnings and profits based on its taxable period ended November 30 and will report the character of its distributions to shareholders shortly after the end of the calendar year. The primary components of each Fund’s annual earnings and profits calculation are: income, loss and other flow-through items (including earnings and profits adjustments) reported by each MLP held by each Fund on the MLP’s Schedule K-1, realized gain or loss on sales of Fund investments and deductible operating expenses.
Each Fund treats distributions from any given MLP holding as a return of capital to the extent of each Fund’s income tax basis in that MLP, and will reduce its basis in that MLP holding by the amount of such distribution so treated as a return of capital. In contrast, each Fund will recognize income (and thereby increase its earnings and profits) if and to the extent that it receives a distribution from an MLP holding that exceeds its income tax basis in that MLP holding.
The character of each Fund’s distributions for U.S. GAAP purposes, which can often differ from the tax character, is based on estimates of the sources of those distributions (which can be from a combination of income and/or a return of capital) made at the time such distributions are received, which in turn are based upon a historical review of information available from each MLP and other industry sources. Each Fund’s accounting characterization of the estimates may subsequently be revised based on information received from MLPs after their tax reporting periods conclude. It is currently estimated that a significant portion of each Fund’s distributions during the current fiscal period, will be characterized for U.S. GAAP purposes as a return of capital.
Compensation
The Funds pay no compensation directly to those of its trustees who are affiliated with the Adviser or to its officers, all of whom receive remuneration for their services to the Funds from the Adviser or its affiliates. The Funds’ Board of Trustees (the “Board”) has adopted a deferred compensation plan for independent trustees that enables trustees to elect to defer receipt of all or a portion of the annual compensation they are entitled to receive from certain Nuveen-advised funds. Under the plan, deferred amounts are treated as though equal dollar amounts had been invested in shares of select Nuveen-advised funds.
Indemnifications
Under the Funds’ organizational documents, their officers and trustees are indemnified against certain liabilities arising out of the performance of their duties to the Funds. In addition, in the normal course of business, the Funds enter into contracts that provide general indemnifications to other parties. The Funds’ maximum exposure under these arrangements is unknown as this would involve future claims that may be made against the Funds that have not yet occurred. However, the Funds have not had prior claims or losses pursuant to these contracts and expect the risk of loss to be remote.
Netting Agreements
In the ordinary course of business, the Funds may enter into transactions subject to enforceable master repurchase agreements, International Swaps and Derivatives Association, Inc. (“ISDA”) master agreements or other similar arrangements (“netting agreements”). Generally, the right to offset in netting agreements allows each Fund to offset certain securities and derivatives with a specific counterparty, when applicable, with any collateral received or delivered to that counterparty based on the terms of the agreements. Generally, each Fund manages its cash collateral and securities collateral on a counterparty basis.
The Funds’ investments subject to netting agreements as of the end of the reporting period, if any, are further described in Note 3 – Portfolio Securities and Investments in Derivatives.
Use of Estimates
The preparation of financial statements in conformity with U.S. GAAP requires management to make estimates and assumptions that affect the reported amounts of assets and liabilities at the date of the financial statements and the reported amounts of increases and decreases in net assets from operations during the current fiscal period. Actual results may differ from those estimates.
2. Investment Valuation and Fair Value Measurements
The fair valuation input levels as described below are for fair value measurement purposes.
Fair value is defined as the price that would be received upon selling an investment or transferring a liability in an orderly transaction to an independent buyer in the principal or most advantageous market for the investment. A three-tier hierarchy is used to maximize the use of observable market data and minimize the use of unobservable inputs and to establish classification of fair value measurements for disclosure purposes. Observable inputs reflect the assumptions market participants would use in pricing the asset or liability. Observable inputs are based on market data obtained from sources independent of the reporting entity. Unobservable inputs reflect the reporting entity’s own assumptions about the assumptions market participants would use in pricing the asset or liability. Unobservable inputs are based on the best information available in the circumstances. The following is a summary of the three-tiered hierarchy of valuation input levels.
| | |
| Level 1 – | | Inputs are unadjusted and prices are determined using quoted prices in active markets for identical securities. |
| Level 2 – | | Prices are determined using other significant observable inputs (including quoted prices for similar securities, interest rates, prepayment speeds, credit risk, etc.). |
| Level 3 – | | Prices are determined using significant unobservable inputs (including management’s assumptions in determining the fair value of investments). |
Common stocks and other equity-type securities, such as MLPs, are valued at the last sales price on the securities exchange on which such securities are primarily traded and are generally classified as Level 1. Securities primarily traded on the NASDAQ National Market (“NASDAQ”) are valued at the NASDAQ Official Closing Price and are generally classified as Level 1. However, securities traded on a securities exchange or NASDAQ for which there were no transactions on a given day or securities not listed on a securities exchange or NASDAQ are valued at the quoted bid price and are generally classified as Level 2.
Prices of swap contracts are provided by an independent pricing service (“pricing service”) approved by the Board. The pricing service establishes a security’s fair value using methods that may include consideration of the following: evaluations of anticipated cash flows or collateral, general market conditions and other information and analysis, including the obligor’s credit characteristics considered relevant. These securities are generally classified as Level 2. In pricing certain securities, particularly less liquid and lower quality securities, the pricing service may consider information about a security, its issuer or market activity provided by the Adviser. These investments are generally classified as Level 2 or Level 3 depending on the observability of the significant inputs.
Repurchase agreements are valued at contract amount plus accrued interest, which approximates market value. These securities are generally classified as Level 2.
Certain securities may not be able to be priced by the pre-established pricing methods as described above. Such securities may be valued by the Board and/or its appointee at fair value. These securities generally include, but are not limited to, restricted securities (securities which may not be publicly sold without registration under the Securities Act of 1933, as amended) for which a pricing service is unable to provide a market price; securities whose trading has been formally suspended; debt securities that have gone into default and for which there is no current market quotation; a security whose market price is not available from a pre-established pricing source; a security with respect to which an event has occurred that is likely to materially affect the value of the security after the market has closed but before the calculation of a Fund’s NAV (as may be the case in non-U.S. markets on which the security is primarily traded) or make it difficult or impossible to obtain a reliable market quotation; and a security whose price, as provided by the pricing service, is not deemed to reflect the security’s fair value. As a general principle, the fair value of a security would appear to be the amount that the owner might reasonably expect to receive for it in a current sale. A variety of factors may be considered in determining the fair value of such securities, which may include consideration of the following: yields or prices of investments of comparable quality, type of issue, coupon, maturity and rating, market quotes or indications of value from security dealers, evaluations of anticipated cash flows or collateral, general market conditions and other information and analysis, including the obligor’s credit characteristics considered relevant. These securities are generally classified as Level 2 or Level 3 depending on the observability of the significant inputs. Regardless of the method employed to value a particular security, all valuations are subject to review by the Board and/or its appointee.
The inputs or methodologies used for valuing securities are not an indication of the risks associated with investing in those securities. The following is a summary of each Fund’s fair value measurements as of the end of the reporting period:
| | | | | | | | | | | | | | | | |
JMF | | Level 1 | | | Level 2 | | | Level 3 | | | Total | |
Long-Term Investments*: | | | | | | | | | | | | | | | | |
Master Limited Partnerships & MLP Affiliates | | $ | 638,479,937 | | | $ | — | | | $ | — | | | $ | 638,479,937 | |
| | | | |
Short-Term Investments: | | | | | | | | | | | | | | | | |
Repurchase Agreements | | | — | | | | 1,178,422 | | | | — | | | | 1,178,422 | |
| | | | |
Investments in Derivatives: | | | | | | | | | | | | | | | | |
Interest Rate Swaps** | | | — | | | | 1,130,986 | | | | — | | | | 1,130,986 | |
Total | | $ | 638,479,937 | | | $ | 2,309,408 | | | $ | — | | | $ | 640,789,345 | |
| JMLP | | | | | | | | | | | | |
Long-Term Investments*: | | | | | | | | | | | | | | | | |
Master Limited Partnerships & MLP Affiliates | | $ | 147,951,946 | | | $ | — | | | $ | — | | | $ | 147,951,946 | |
| | | | |
Short-Term Investments: | | | | | | | | | | | | | | | | |
Repurchase Agreements | | | — | | | | 1,610,862 | | | | — | | | | 1,610,862 | |
| | | | |
Investments in Derivatives: | | | | | | | | | | | | | | | | |
Interest Rate Swaps** | | | — | | | | 141,632 | | | | — | | | | 141,632 | |
Total | | $ | 147,951,946 | | | $ | 1,752,494 | | | $ | — | | | $ | 149,704,440 | |
| * | Refer to the Fund’s Portfolio of Investments for industry classifications. |
| ** | Represents net unrealized appreciation (depreciation) as reported in the Fund’s Portfolio of Investments. |
Notes to Financial Statements (continued)
The Board is responsible for the valuation process and has appointed the oversight of the daily valuation process to the Adviser’s Valuation Committee. The Valuation Committee, pursuant to the valuation policies and procedures adopted by the Board, is responsible for making fair value determinations, evaluating the effectiveness of the Funds’ pricing policies and reporting to the Board. The Valuation Committee is aided in its efforts by the Adviser’s dedicated Securities Valuation Team, which is responsible for administering the daily valuation process and applying fair value methodologies as approved by the Valuation Committee. When determining the reliability of independent pricing services for investments owned by the Funds, the Valuation Committee, among other things, conducts due diligence reviews of the pricing services and monitors the quality of security prices received through various testing reports conducted by the Securities Valuation Team.
The Valuation Committee will consider pricing methodologies it deems relevant and appropriate when making a fair value determination, based on the facts and circumstances specific to the portfolio instrument. Fair value determinations generally will be derived as follows, using public or private market information:
| | (i) | If available, fair value determinations shall be derived by extrapolating from recent transactions or quoted prices for identical or comparable securities. |
| | (ii) | If such information is not available, an analytical valuation methodology may be used based on other available information including, but not limited to: analyst appraisals, research reports, corporate action information, issuer financial statements and shelf registration statements. Such analytical valuation methodologies may include, but are not limited to: multiple of earnings, discount from market value of a similar freely-traded security, discounted cash flow analysis, book value or a multiple thereof, risk premium/yield analysis, yield to maturity and/or fundamental investment analysis. |
The purchase price of a portfolio instrument will be used to fair value the instrument only if no other valuation methodology is available or deemed appropriate, and it is determined that the purchase price fairly reflects the instrument’s current value.
For each portfolio security that has been fair valued pursuant to the policies adopted by the Board, the fair value price is compared against the last available and next available market quotations. The Valuation Committee reviews the results of such testing and fair valuation occurrences are reported to the Board.
3. Portfolio Securities and Investments in Derivatives
Portfolio Securities
Master Limited Partnerships
An MLP consists of a general partner and limited partners (or in the case of MLPs organized as limited liability companies, a managing member and members). The general partner or managing member typically controls the operations and management of the MLP and has an ownership stake in the MLP. The limited partners or members, through their ownership of limited partner or member interests, provide capital to the entity, which are intended to have no role in the operation and management of the entity and receive cash distributions.
Each Fund may purchase both domestic and international MLPs. Each Fund’s investment in MLPs may include ownership of MLP common units and MLP subordinated units. Each Fund also may purchase MLP I-Shares (together with the MLPs, the “MLP Entities”). MLP I-Shares are pay-in-kind securities created as a means to facilitate institutional ownership of MLPs by simplifying the tax and administrative implications of the MLP structure. Generally, when an MLP pays its quarterly cash distribution to unitholders, holders of I-Shares do not receive a cash distribution; rather, they receive a dividend of additional I-Shares from the MLP of comparable value to the cash distribution paid to each unitholder. Each Fund may purchase interests in MLP Entities on an exchange or may utilize non-public market transactions to obtain its holdings, including but not limited to privately negotiated purchases of securities from the issuers themselves, broker-dealers or other qualified institutional buyers.
Repurchase Agreements
In connection with transactions in repurchase agreements, it is each Fund’s policy that its custodian take possession of the underlying collateral securities, the fair value of which exceeds the principal amount of the repurchase transaction, including accrued interest, at all times. If the counterparty defaults, and the fair value of the collateral declines, realization of the collateral may be delayed or limited.
The following table presents the repurchase agreements for the Funds that are subject to netting agreements as of the end of the reporting period, and the collateral delivered related to those repurchase agreements.
| | | | | | | | | | | | | | |
| Fund | | Counterparty | | Short-Term
Investments, at Value | | | Collateral
Pledged (From)
Counterparty* | | | Net
Exposure | |
| JMF | | Fixed Income Clearing Corporation | | $ | 1,178,422 | | | $ | (1,178,422 | ) | | $ | — | |
| JMLP | | Fixed Income Clearing Corporation | | $ | 1,610,862 | | | $ | (1,610,862 | ) | | $ | — | |
| * | As of the end of the reporting period, the value of the collateral pledged from the counterparty exceeded the value of the repurchase agreements. Refer to the Fund’s Portfolio of Investments for details on the repurchase agreements. |
Investments in Derivatives
Each Fund is authorized to invest in certain derivative instruments such as futures, options and swap contracts. Each Fund limits its investments in futures, options on futures and swap contracts to the extent necessary for the Adviser to claim the exclusion from registration by the Commodity Futures Trading Commission as a commodity pool operator with respect to the Fund. The Funds record derivative instruments at fair value with changes in fair value recognized on the Statement of Operations, when applicable. Even though the Funds’ investments in derivatives may represent economic hedges, they are not considered to be hedge transactions for financial reporting purposes.
Interest Rate Swap Contracts
Interest rate swap contracts involve a Fund’s agreement with the counterparty to pay or receive a fixed rate payment in exchange for the counterparty receiving or paying a variable rate payment. Forward interest rate swap contracts involve a Fund’s agreement with a counterparty to pay, in the future, a fixed or variable rate payment in exchange for the counterparty paying the Fund a variable or fixed rate payment, the accruals for which begin at a specified date in the future (the “effective date”).
The amount of the payment obligation for an interest rate swap is based on the notional amount and the termination date of the swap contract. Interest rate swap contracts do not involve the delivery of securities or other underlying assets or principal. Accordingly, the risk of loss with respect to the swap counterparty on such transactions is limited to the net amount of interest payments that the Fund is to receive.
Interest rate swap contracts are valued daily. Upon entering into an interest rate swap contract (and beginning on the effective date for a forward interest rate swap contract), the Fund accrues the fixed rate payment expected to be paid or received and the variable rate payment expected to be received or paid on the interest rate swap contracts on a daily basis, and recognizes the daily change in the fair value of the Fund’s contractual rights and obligations under the contracts. For an over-the-counter (“OTC”) swap that is not cleared through a clearing house (“OTC Uncleared”), the amount recorded on these transactions is recognized on the Statement of Assets and Liabilities as a component of “Unrealized appreciation or depreciation on interest rate swaps.”
Upon the execution of an OTC swap cleared through a clearing house (“OTC Cleared”), the Fund is obligated to deposit cash or eligible securities, also known as “initial margin,” into an account at its clearing broker equal to a specified percentage of the contract amount. Cash deposited by the Fund to cover initial margin requirements on open swap contracts, if any, is recognized as a component of “Cash collateral at brokers for investments in swaps” on the Statement of Assets and Liabilities. Investments in OTC Cleared swaps obligate the Fund and the clearing broker to settle monies on a daily basis representing changes in the prior day’s “mark-to-market” of the swap contract. If the Fund has unrealized appreciation, the clearing broker will credit the Fund’s account with an amount equal to the appreciation. Conversely, if the Fund has unrealized depreciation, the clearing broker will debit the Fund’s account with an amount equal to the depreciation. These daily cash settlements are also known as “variation margin.” Variation margin for OTC Cleared swaps is recognized as a receivable and/or payable for “Variation margin on swap contracts” on the Statement of Assets and Liabilities. Upon the execution of an OTC Uncleared swap, neither the Fund nor the counterparty is required to deposit initial margin as the trades are recorded bilaterally between both parties to the swap contract, and the terms of the variation margin are subject to a predetermined threshold negotiated by the Fund and the counterparty. Variation margin for OTC Uncleared swaps is recognized as a component of “Unrealized appreciation or depreciation on interest rate swaps” as described in the preceding paragraph.
The net amount of periodic payments settled in cash are recognized as a component of “Net realized gain (loss) from swaps before taxes” on the Statement of Operations, in addition to the net realized gain or loss recorded upon the termination of the swap contract. For tax purposes, payments expected to be received or paid on the swap contracts are treated as ordinary income or expense, respectively. Changes in the value of the swap contracts during the fiscal period are recognized as a component of “Change in net unrealized appreciation (depreciation) of swaps before taxes” on the Statement of Operations. In certain instances, payments are made or received upon entering into the swap contract to compensate for differences between the stated terms of the swap agreements and prevailing market conditions (credit spreads, currency exchange rates, interest rates, and other relevant factors). Payments received or made at the beginning of the measurement period, if any, are recognized as “Interest rate swaps premiums paid and/or received” on the Statement of Assets and Liabilities.
During the current fiscal period, JMF continued to utilize forward interest rate swap contracts and JMLP entered into forward interest rate swap contracts to hedge the future interest expense of its leverage.
The average notional amount of interest rate swap contracts outstanding during the current fiscal period was as follows:
| | | | | | | | |
| | | JMF | | | JMLP | |
Average notional amount of interest rate swap contracts outstanding* | | $ | 172,725,000 | | | $ | 8,400,000 | |
| * | The average notional amount is calculated based on the outstanding notional at the beginning of the fiscal period and at the end of each fiscal quarter within the current fiscal period. |
Notes to Financial Statements (continued)
The following table presents the fair value of all swap contracts held by the Funds as of the end of the reporting period, the location of these instruments on the Statement of Assets and Liabilities and the primary underlying risk exposure.
| | | | | | | | | | | | | | | | | | |
| | | | | Location on the Statement of Assets and Liabilities | |
Underlying
Risk Exposure | | Derivative
Instrument | | Asset Derivatives | | | | | | (Liability) Derivatives | |
| | | Location | | Value | | | | | | Location | | Value | |
| JMF | | | | | | | | | | | | | | | | | | |
| Interest rate | | Swaps (OTC Uncleared) | | Unrealized appreciation on interest rate swaps | | $ | 1,130,986 | | | | | | | — | | $ | — | |
| JMLP | | | | | | | | | | | | | | | | | | |
| Interest rate | | Swaps (OTC Uncleared) | | Unrealized appreciation on interest rate swaps | | $ | 141,632 | | | | | | | — | | $ | — | |
The following table presents the Funds’ swap contracts subject to netting agreements and the collateral delivered related to those swap contracts as of the end of the reporting period.
| | | | | | | | | | | | | | | | | | | | | | |
| Fund | | Counterparty | | Gross
Unrealized
Appreciation on
Interest Rate
Swaps*** | | | Gross
Unrealized
(Depreciation) on
Interest Rate
Swaps*** | | | Net Unrealized
Appreciation
(Depreciation) on
Interest Rate
Swaps | | | Collateral
Pledged
to (from)
Counterparty | | | Net
Exposure | |
| JMF | | JPMorgan Chase Bank, N.A. | | $ | 1,130,986 | | | $ | — | | | $ | 1,130,986 | | | $ | (602,414 | ) | | $ | 528,572 | |
| JMLP | | Morgan Stanley Capital Services LLC | | $ | 141,632 | | | $ | — | | | $ | 141,632 | | | $ | — | | | $ | 141,632 | |
| *** | Represents gross unrealized appreciation (depreciation) for the counterparty as reported in the Fund’s Portfolio of Investments. |
The following table presents the amount of net realized gain (loss) and change in net unrealized appreciation (depreciation) recognized on swap contracts on the Statement of Operations during the current fiscal period, and the primary underlying risk exposure.
| | | | | | | | | | | | |
| Fund | | Underlying
Risk Exposure | | Derivative
Instrument | | Net Realized
Gain/(Loss)
from Swaps
Before Taxes | | | Change in Net
Unrealized
Appreciation
(Depreciation)
of Swaps
Before Taxes | |
| JMF | | Interest rate | | Swaps | | $ | (7,220,235 | ) | | $ | 9,413,579 | |
| JMLP | | Interest rate | | Swaps | | $ | — | | | $ | 141,632 | |
Market and Counterparty Credit Risk
In the normal course of business each Fund may invest in financial instruments and enter into financial transactions where risk of potential loss exists due to changes in the market (market risk) or failure of the other party to the transaction to perform (counterparty credit risk). The potential loss could exceed the value of the financial assets recorded on the financial statements. Financial assets, which potentially expose each Fund to counterparty credit risk, consist principally of cash due from counterparties on forward, option and swap transactions, when applicable. The extent of each Fund’s exposure to counterparty credit risk in respect to these financial assets approximates their carrying value as recorded on the Statement of Assets and Liabilities.
Each Fund helps manage counterparty credit risk by entering into agreements only with counterparties the Adviser believes have the financial resources to honor their obligations and by having the Adviser monitor the financial stability of the counterparties. Additionally, counterparties may be required to pledge collateral daily (based on the daily valuation of the financial asset) on behalf of each Fund with a value approximately equal to the amount of any unrealized gain above a pre-determined threshold. Reciprocally, when each Fund has an unrealized loss, the Funds have instructed the custodian to pledge assets of the Funds as collateral with a value approximately equal to the amount of the unrealized loss above a pre-determined threshold. Collateral pledges are monitored and subsequently adjusted if and when the valuations fluctuate, either up or down, by at least the pre-determined threshold amount.
4. Fund Shares
Shares Equity Shelf Programs and Offering Costs
The following Funds have each filed registration statements with the Securities and Exchange Commission (“SEC”) authorizing each Fund to issue additional shares through one or more equity shelf programs (“Shelf Offering”), which became effective with the SEC during the current fiscal period.
Under these Shelf Offerings, the Funds, subject to market conditions, may raise additional equity capital by issuing additional shares from time to time in varying amounts and by different offering methods at a net price at or above the Fund’s NAV per share. In the event a Fund’s Shelf Offering registration statement is no longer current, the Fund may not issue additional shares until a post-effective amendment to the registration statement has been filed with the SEC.
Additional authorized shares, shares sold and offering proceeds, net of offering costs under each Fund’s Shelf Offering during each Fund’s current fiscal period were as follows:
| | | | | | | | |
| | | JMF | | | JMLP | |
| | | Year Ended
11/30/17* | | | Year Ended
11/30/17** | |
Additional authorized shares | | | 9,800,000 | | | | 3,100,000 | |
Shares sold | | | 450,848 | | | | 399,500 | |
Offering proceeds, net of offering costs | | | $4,819,170 | | | | $3,479,922 | |
| * | Represents additional authorized shares for the period October 17, 2017 through November 30, 2017. |
| ** | Represents additional authorized shares for the period July 12, 2017 through November 30, 2017. |
Costs incurred by the Funds in connection with their initial Shelf Offerings were recorded as a deferred charge and recognized as a component of “Deferred offering costs” on the Statement of Assets and Liabilities. The deferred assets are reduced during the one-year period that additional shares are sold by reducing the proceeds from such sales and recognized as a component of “Proceeds from shelf offering, net of offering costs” on the Statement of Changes in Net Assets. Any remaining deferred charges at the end of the one-year life of the Shelf Offering period will be expensed accordingly, as well as any additional Shelf Offering costs the Funds may incur. As Shelf Offering costs are expensed they are recognized as a component of “Other expenses” on the Statement of Operations.
Share Transactions
Transactions in shares during the Funds’ current and prior fiscal period were as follows:
| | | | | | | | | | | | | | | | |
| | | JMF | | | JMLP | |
| | | Year
Ended
11/30/17 | | | Year
Ended
11/30/16 | | | Year
Ended
11/30/17 | | | Year
Ended
11/30/16 | |
Shares: | | | | | | | | | | | | | | | | |
Sold through shelf offering | | | 450,848 | | | | — | | | | 399,500 | | | | — | |
Issued to shareholders due to reinvestment of distributions | | | 144,671 | | | | 56,682 | | | | 2,728 | | | | 3,733 | |
Weighted average share: | | | | | | | | | | | | | | | | |
Premium to NAV per shelf offering share sold | | | 1.54 | % | | | — | | | | 1.65 | % | | | — | |
5. Investment Transactions
Long-term purchases and sales (excluding derivative transactions, where applicable) during the current fiscal period were as follows:
| | | | | | | | |
| | | JMF | | | JMLP | |
Purchases | | $ | 85,288,273 | | | $ | 44,871,272 | |
Sales | | | 98,643,395 | | | | 37,871,742 | |
6. Management Fees and Other Transactions with Affiliates
Management Fees
Each Fund’s management fee compensates the Adviser for overall investment advisory and administrative services and general office facilities. The Sub-Adviser is compensated for its services to the Funds from the management fees paid to the Adviser.
Notes to Financial Statements (continued)
Each Fund’s management fee consists of two components – a fund-level fee, based only on the amount of assets within each individual Fund, and a complex-level fee, based on the aggregate amount of all eligible fund assets managed by the Adviser. This pricing structure enables Fund shareholders to benefit from growth in the assets within their respective Fund as well as from growth in the amount of complex-wide assets managed by the Adviser.
The annual Fund-level fee, payable monthly, for each Fund is calculated according to the following schedule:
| | | | |
| Average Daily Managed Assets* | | Fund-Level Fee | |
For the first $500 million | | | 0.9000 | % |
For the next $500 million | | | 0.8750 | |
For the next $500 million | | | 0.8500 | |
For the next $500 million | | | 0.8250 | |
For managed assets over $2 billion | | | 0.8000 | |
The annual complex-level fee, payable monthly, for each Fund is calculated by multiplying the current complex-wide fee rate, determined according to the following schedule by the Fund’s daily managed assets:
| | | | |
| Complex-Level Managed Asset Breakpoint Level* | | Effective Rate at Breakpoint Level | |
$55 billion | | | 0.2000 | % |
$56 billion | | | 0.1996 | |
$57 billion | | | 0.1989 | |
$60 billion | | | 0.1961 | |
$63 billion | | | 0.1931 | |
$66 billion | | | 0.1900 | |
$71 billion | | | 0.1851 | |
$76 billion | | | 0.1806 | |
$80 billion | | | 0.1773 | |
$91 billion | | | 0.1691 | |
$125 billion | | | 0.1599 | |
$200 billion | | | 0.1505 | |
$250 billion | | | 0.1469 | |
$300 billion | | | 0.1445 | |
| * | For the complex-level fees, managed assets include closed-end fund assets managed by the Adviser that are attributable to certain types of leverage. For these purposes, leverage includes the funds’ use of preferred stock and borrowings and certain investments in the residual interest certificates (also called inverse floating rate securities) in tender option bond (TOB) trusts, including the portion of assets held by a TOB trust that has been effectively financed by the trust’s issuance of floating rate securities, subject to an agreement by the Adviser as to certain funds to limit the amount of such assets for determining managed assets in certain circumstances. The complex-level fee is calculated based upon the aggregate daily managed assets of all Nuveen funds that constitute “eligible assets.” Eligible assets do not include assets attributable to investments in other Nuveen funds or assets in excess of a determined amount (originally $2 billion) added to the Nuveen fund complex in connection with the Adviser’s assumption of the management of the former First American Funds effective January 1, 2011. As of November 30, 2017, the complex-level fee for each Fund was 0.1595%. |
7. Borrowing Arrangements
Each Fund has entered into a borrowing arrangement (“Borrowings”) as a means of leverage.
The Funds have entered into a credit agreement with a bank and its affiliate. Each Fund’s maximum commitment amount under its Borrowings is as follows:
| | | | | | | | |
| | | JMF | | | JMLP | |
Maximum commitment amount | | $ | 230,000,000 | | | $ | 60,000,000 | |
As of the end of the reporting period, each Fund’s outstanding balance on its Borrowings was a follows:
| | | | | | | | |
| | | JMF | | | JMLP | |
Outstanding balance on Borrowings | | $ | 175,000,000 | | | $ | 41,500,000 | |
Interest charged on these Borrowings is at a rate per annum equal to the 1-Month LIBOR (London Inter-Bank Offered Rate) plus 0.75% for JMF and plus 0.70% for JMLP. The Funds also accrue a commitment fee of 0.15% per annum on the daily undrawn portion of the Borrowings unless the undrawn portion of the Borrowings on that day is less than 40% of the maximum commitment amount.
During the current fiscal period, the average daily balance outstanding and average annual interest rate on each Fund’s Borrowings were as follows:
| | | | | | | | |
| | | JMF | | | JMLP | |
Average daily balance outstanding | | $ | 185,808,767 | | | $ | 42,890,137 | |
Average annual interest rate | | | 1.83 | % | | | 1.74 | % |
Other Borrowings Information for the Funds
In order to maintain the Borrowings, the Funds must meet certain collateral, asset coverage and other requirements. Borrowings outstanding are fully secured by eligible securities held in each Fund’s Portfolio of Investments.
Each Fund’s Borrowings outstanding is recognized as “Borrowings” on the Statement of Assets and Liabilities. Interest expense incurred on the borrowed amount and undrawn balance are recognized as a component of “Interest expense on borrowings” on the Statement of Operations.
Inter-Fund Borrowing and Lending
The SEC has granted an exemptive order permitting registered open-end and closed-end Nuveen funds to participate in an inter-fund lending facility whereby the Nuveen funds may directly lend to and borrow money from each other for temporary purposes (e.g., to satisfy redemption requests or when a sale of securities “fails,” resulting in an unanticipated cash shortfall) (the “Inter-Fund Program”). The closed-end Nuveen funds, including the Funds covered by this shareholder report, will participate only as lenders, and not as borrowers, in the Inter-Fund Program because such closed-end funds rarely, if ever, need to borrow cash to meet redemptions. The Inter-Fund Program is subject to a number of conditions, including, among other things, the requirements that (1) no fund may borrow or lend money through the Inter-Fund Program unless it receives a more favorable interest rate than is typically available from a bank or other financial institution for a comparable transaction; (2) no fund may borrow on an unsecured basis through the Inter-Fund Program unless the fund’s outstanding borrowings from all sources immediately after the inter-fund borrowing total 10% or less of its total assets; provided that if the borrowing fund has a secured borrowing outstanding from any other lender, including but not limited to another fund, the inter-fund loan must be secured on at least an equal priority basis with at least an equivalent percentage of collateral to loan value; (3) if a fund’s total outstanding borrowings immediately after an inter-fund borrowing would be greater than 10% of its total assets, the fund may borrow through the inter-fund loan on a secured basis only; (4) no fund may lend money if the loan would cause its aggregate outstanding loans through the Inter-Fund Program to exceed 15% of its net assets at the time of the loan; (5) a fund’s inter-fund loans to any one fund shall not exceed 5% of the lending fund’s net assets; (6) the duration of inter-fund loans will be limited to the time required to receive payment for securities sold, but in no event more than seven days; and (7) each inter-fund loan may be called on one business day’s notice by a lending fund and may be repaid on any day by a borrowing fund. In addition, a Nuveen fund may participate in the Inter-Fund Program only if and to the extent that such participation is consistent with the fund’s investment objective and investment policies. The Board is responsible for overseeing the Inter-Fund Program.
The limitations detailed above and the other conditions of the SEC exemptive order permitting the Inter-Fund Program are designed to minimize the risks associated with Inter-Fund Program for both the lending fund and the borrowing fund. However, no borrowing or lending activity is without risk. When a fund borrows money from another fund, there is a risk that the loan could be called on one day’s notice or not renewed, in which case the fund may have to borrow from a bank at a higher rate or take other actions to payoff such loan if an inter-fund loan is not available from another fund. Any delay in repayment to a lending fund could result in a lost investment opportunity or additional borrowing costs.
During May 2017, the Board approved the Nuveen funds participation in the Inter-Fund Program. During the current reporting period, none of the Funds covered by this shareholder report have entered into any inter-fund loan activity.
8. New Accounting Pronouncements
Financial Accounting Standards Board (“FASB”) Accounting Standards Update (“ASU”) 2016-18: Statement of Cash Flows – Restricted Cash (“ASU 2016-18”)
The FASB issued ASU 2016-18, which will require entities to include the total of cash, cash equivalents, restricted cash and restricted cash equivalents in the beginning and ending cash balances in the Statement of Cash Flows. The guidance will be applied retrospectively and is effective for fiscal years beginning after December 15, 2017, and interim periods within those years. Management is currently evaluating the implications of ASU 2016-18, if any.
9. Subsequent Events
Regulatory Events
As described in Note 1 – General Information and Significant Accounting Policies, the Tax Cuts and Jobs Act of 2017 was signed into law on December 22, 2017 and reduced the corporate income rate to from 35% to 21% beginning on January 1, 2018. As a result, JMF reduced the estimate of its net deferred tax liability balance to reflect this reduction in the corporate federal income tax rate as described in the Portfolio Managers’ Comments, Event subsequent to the close of this reporting period.
Additional
Fund Information (Unaudited)
| | | | | | | | | | |
| Board of Trustees | | | | | | | | |
Margo Cook* | | Jack B. Evans | | William C. Hunter | | David J. Kundert** | | Albin F. Moschner | | John K. Nelson |
William J. Schneider | | Judith M. Stockdale | | Carole E. Stone | | Terence J. Toth | | Margaret L. Wolff | | Robert L. Young |
| * | Interested Board Member. |
| ** | Retired from the Fund’s Board of Trustees effective December 31, 2017. |
| | | | | | | | |
| | | | | |
Fund Manager Nuveen Fund Advisors, LLC 333 West Wacker Drive Chicago, IL 60606 | | Custodian State Street Bank
& Trust Company One Lincoln Street Boston, MA 02111 | | Legal Counsel Chapman and Cutler LLP Chicago, IL 60603 | | Independent Registered
Public Accounting Firm PricewaterhouseCoopers LLP One North Wacker Drive Chicago, IL 60606 | | Transfer Agent and
Shareholder Services Computershare Trust
Company, N.A.
250 Royall Street
Canton, MA 02021
(800) 257-8787 |
Quarterly Form N-Q Portfolio of Investments Information
Each Fund is required to file its complete schedule of portfolio holdings with the Securities and Exchange Commission (SEC) for the first and third quarters of each fiscal year on Form N-Q. You may obtain this information directly from the SEC. Visit the SEC on-line at http://www.sec.gov or in person at the SEC’s Public Reference Room in Washington, D.C. Call the SEC toll-free at (800) SEC-0330 for room hours and operation.
Nuveen Funds’ Proxy Voting Information
You may obtain (i) information regarding how each fund voted proxies relating to portfolio securities held during the most recent twelve-month period ended June 30, without charge, upon request, by calling Nuveen toll-free at (800) 257-8787 or on Nuveen’s website at www.nuveen.com and (ii) a description of the policies and procedures that each fund used to determine how to vote proxies relating to portfolio securities without charge, upon request, by calling Nuveen toll free at (800) 257-8787. You may also obtain this information directly from the SEC. Visit the SEC on-line at http://www.sec.gov.
CEO Certification Disclosure
Each Fund’s Chief Executive Officer (CEO) has submitted to the New York Stock Exchange (NYSE) the annual CEO certification as required by Section 303A.12(a) of the NYSE Listed Company Manual. Each Fund has filed with the SEC the certification of its CEO and Chief Financial Officer required by Section 302 of the Sarbanes-Oxley Act.
Share Repurchases
Each Fund intends to repurchase, through its open-market share repurchase program, shares of its own common stock at such times and in such amounts as is deemed advisable. During the period covered by this report, each Fund repurchased shares of its common stock, as shown in the accompanying table. Any future repurchases will be reported to shareholders in the next annual or semi-annual report.
| | | | | | | | |
| | | JMF | | | JMLP | |
Shares repurchased | | | — | | | | — | |
FINRA BrokerCheck
The Financial Industry Regulatory Authority (FINRA) provides information regarding the disciplinary history of FINRA member firms and associated investment professionals. This information as well as an investor brochure describing FINRA BrokerCheck is available to the public by calling the FINRA BrokerCheck Hotline number at (800) 289-9999 or by visiting www.FINRA.org.
Glossary of Terms
Used in this Report (Unaudited)
| ∎ | | Alerian MLP Index: A composite of the 50 most prominent energy Master Limited Partnerships. The index, which is calculated using a float-adjusted, capitalization-weighted methodology, is disseminated real-time on a price-return basis, and the corresponding total-return index is disseminated daily. The index returns assume reinvestment of distributions, but do not reflect any applicable sales charges or management fees. |
| ∎ | | Average Annual Total Return: This is a commonly used method to express an investment’s performance over a particular, usually multi-year time period. It expresses the return that would have been necessary each year to equal the investment’s actual cumulative performance (including change in NAV or market price and reinvested dividends and capital gains distributions, if any) over the time period being considered. |
| ∎ | | Effective Leverage: Effective leverage is a fund’s effective economic leverage, and includes both regulatory leverage (see Leverage) and the leverage effects of certain derivative investments in the fund’s portfolio. |
| ∎ | | Gross Domestic Product (GOP): The total market value of all final goods and services produced in a country/region in a given year, equal to total consumer, investment and government spending, p!us the value of exports, minus the value of imports. |
| ∎ | | Leverage: Leverage is created whenever a fund has investment exposure (both reward and/or risk) equivalent to more than 100% of the investment capital. |
| ∎ | | Net Asset Value (NAV) Per Share: A fund’s Net Assets is equal to its total assets (securities, cash, accrued earnings and receivables) less its total liabilities. NAV per share is equal to the fund’s Net Assets divided by its number of shares outstanding. |
| ∎ | | Regulatory Leverage: Regulatory Leverage consists of preferred shares issued by or borrowings of a fund. Both of these are part of a fund’s capital structure. Regulatory leverage is subject to asset coverage limits set in the Investment Company Act of 1940. |
| ∎ | | S&P 500® Index: An unmanaged index generally considered representative of the U.S. stock market. Index returns assume reinvestment of distributions, but do not reflect any applicable sales charges or management fees. |
Reinvest Automatically,
Easily and Conveniently
Nuveen makes reinvesting easy. A phone call is all it takes to set up your reinvestment account.
Nuveen Closed-End Funds Automatic Reinvestment Plan
Nuveen Closed-End Fund allows you to conveniently reinvest distributions in additional Fund shares. By choosing to reinvest, you’ll be able to invest money regularly and automatically, and watch your investment grow through the power of compounding. Just like distributions in cash, there may be times when income or capital gains taxes may be payable on distributions that are reinvested. It is important to note that an automatic reinvestment plan does not ensure a profit, nor does it protect you against loss in a declining market.
Easy and convenient
To make recordkeeping easy and convenient, each month you’ll receive a statement showing your total distributions, the date of investment, the shares acquired and the price per share, and the total number of shares you own.
How shares are purchased
The shares you acquire by reinvesting will either be purchased on the open market or newly issued by the Fund. If the shares are trading at or above net asset value at the time of valuation, the Fund will issue new shares at the greater of the net asset value or 95% of the then-current market price. If the shares are trading at less than net asset value, shares for your account will be purchased on the open market. If the Plan Agent begins purchasing Fund shares on the open market while shares are trading below net asset value, but the Fund’s shares subsequently trade at or above their net asset value before the Plan Agent is able to complete its purchases, the Plan Agent may cease open-market purchases and may invest the uninvested portion of the distribution in newly-issued Fund shares at a price equal to the greater of the shares’ net asset value or 95% of the shares’ market value on the last business day immediately prior to the purchase date. Distributions received to purchase shares in the open market will normally be invested shortly after the distribution payment date. No interest will be paid on distributions awaiting reinvestment. Because the market price of the shares may increase before purchases are completed, the average purchase price per share may exceed the market price at the time of valuation, resulting in the acquisition of fewer shares than if the distribution had been paid in shares issued by the Fund. A pro rata portion of any applicable brokerage commissions on open market purchases will be paid by Plan participants. These commissions usually will be lower than those charged on individual transactions.
Flexible
You may change your distribution option or withdraw from the Plan at any time, should your needs or situation change. You can reinvest whether your shares are registered in your name, or in the name of a brokerage firm, bank, or other nominee. Ask your investment advisor if his or her firm will participate on your behalf. Participants whose shares are registered in the name of one firm may not be able to transfer the shares to another firm and continue to participate in the Plan. The Fund reserves the right to amend or terminate the Plan at any time. Although the Fund reserves the right to amend the Plan to include a service charge payable by the participants, there is no direct service charge to participants in the Plan at this time.
Call today to start reinvesting distributions
For more information on the Nuveen Automatic Reinvestment Plan or to enroll in or withdraw from the Plan, speak with your financial advisor or call us at (800) 257-8787.
Board
Members & Officers (Unaudited)
The management of the Funds, including general supervision of the duties performed for the Funds by the Adviser, is the responsibility of the Board of Trustees of the Funds. The number of trustees of the Funds is set at eleven. None of the trustees who are not “interested” persons of the Funds (referred to herein as “independent board members”) has ever been a director or employee of, or consultant to, Nuveen or its affiliates. The names and business addresses of the trustees and officers of the Funds, their principal occupations and other affiliations during the past five years, the number of portfolios each oversees and other directorships they hold are set forth below.
| | | | | | | | |
| | | | |
| | | | | | | | | |
Name,
Year of Birth
& Address | | Position(s) Held
with the Funds | | Year First
Elected or
Appointed
and Term(1) | | Principal
Occupation(s)
Including other
Directorships
During Past 5 Years | | Number
of Portfolios
in Fund Complex
Overseen by
Board Member |
| | | | |
| | | | | | | | | |
| | | |
| Independent Board Members: | | | | | | |
| | | | |
∎ WILLIAM J. SCHNEIDER
| | | | | | Chairman of Miller-Valentine Partners, a real estate investment company; Board Member of WDPR Public Radio station; formerly, Senior Partner and Chief Operating Officer (retired 2004) of Miller-Valentine Group; formerly, Board member, Business Advisory Council of the Cleveland Federal Reserve Bank and University of Dayton Business School Advisory Council; past Chair and Director, Dayton Development Coalition. | | |
1944 333 W. Wacker Drive Chicago, IL 60606 | | Chairman and Board Member | | 1996 Class III | | | 176 |
| | | | | | | |
| | | | |
∎ JACK B. EVANS
| | | | | | President, The Hall-Perrine Foundation, a private philanthropic corporation (since 1996); Director and Chairman, United Fire Group, a publicly held company; Director, Public Member, American Board of Orthopaedic Surgery (since 2015); Life Trustee of Coe College and the Iowa College Foundation; formerly, President Pro-Tem of the Board of Regents for the State of Iowa University System; formerly, Director, Alliant Energy and The Gazette Company; formerly, Director, Federal Reserve Bank of Chicago; formerly, President and Chief Operating Officer, SCI Financial Group, Inc., a regional financial services firm. | | |
1948 333 W. Wacker Drive Chicago, IL 60606 | | Board Member | | 1999 Class III | | | 176 |
| | | | | | | |
| | | | |
∎ WILLIAM C. HUNTER
| | | | | | Dean Emeritus, formerly, Dean, Tippie College of Business, University of Iowa (2006-2012); Director (since 2004) of Xerox Corporation; Director of Wellmark, Inc. (since 2009); past Director (2005-2015), and past President (2010-2014) Beta Gamma Sigma, Inc., The International Business Honor Society; formerly, Dean and Distinguished Professor of Finance, School of Business at the University of Connecticut (2003-2006); previously, Senior Vice President and Director of Research at the Federal Reserve Bank of Chicago (1995-2003); formerly, Director (1997-2007), Credit Research Center at Georgetown University. | | |
1948 333 W. Wacker Drive Chicago, IL 60606 | | Board Member | | 2003 Class I | | | 176 |
| | | | | | | |
| | | | |
∎ ALBIN F. MOSCHNER
| | | | | | Founder and Chief Executive Officer, Northcroft Partners, LLC, a management consulting firm (since 2012); Director, USA Technologies, Inc., a provider of solutions and services to facilitate electronic payment transactions (since 2012); formerly, Director, Wintrust Financial Corporation (1996-2016); previously, held positions at Leap Wireless International, Inc., including Consultant (2011-2012), Chief Operating Officer (2008-2011), and Chief Marketing Officer (2004-2008); formerly, President, Verizon Card Services division of Verizon Communications, Inc. (2000-2003); formerly, President, One Point Services at One Point Communications (1999-2000); formerly, Vice Chairman of the Board, Diba, Incorporated (1996-1997); formerly, various executive positions with Zenith Electronics Corporation (1991-1996). | | |
1952 333 W. Wacker Drive Chicago, IL 60606 | | Board Member | | 2016 Class III | | | 176 |
| | | | | | | |
Board Members & Officers (Unaudited) (continued)
| | | | | | | | |
| | | | |
| | | | | | | | | |
Name,
Year of Birth
& Address | | Position(s) Held
with the Funds | | Year First
Elected or
Appointed
and Term(1)
| | Principal
Occupation(s)
Including other
Directorships
During Past 5 Years | | Number
of Portfolios
in Fund Complex
Overseen by
Board Member |
| | | | |
| | | | | | | | | |
| | |
| Independent Board Members (continued): | | | | |
| | | | |
∎ JOHN K. NELSON
| | | | | | Member of Board of Directors of Core12 LLC (since 2008), a private firm which develops branding, marketing and communications strategies for clients; Director of The Curran Center for Catholic American Studies (since 2009) and The President’s Council, Fordham University (since 2010); formerly, senior external advisor to the financial services practice of Deloitte Consulting LLP (2012-2014): formerly, Chairman of the Board of Trustees of Marian University (2010 as trustee, 2011-2014 as Chairman); formerly, Chief Executive Officer of ABN AMRO N.V. North America, and Global Head of its Financial Markets Division (2007-2008); prior senior positions held at ABN AMRO include Corporate Executive Vice President and Head of Global Markets-the Americas (2006-2007), CEO of Wholesale Banking North America and Global Head of Foreign Exchange and Futures Markets (2001-2006), and Regional Commercial Treasurer and Senior Vice President Trading-North America (1996-2001); formerly, Trustee at St. Edmund Preparatory School in New York City. | | |
1962 333 W. Wacker Drive Chicago, IL 60606 | | Board Member | | 2013 Class II | | | 176 |
| | | | | | | |
| | | | |
∎ JUDITH M. STOCKDALE | | | | | | Board Member, Land Trust Alliance (since 2013) and U.S. Endowment for Forestry and Communities (since 2013); formerly, Executive Director (1994-2012), Gaylord and Dorothy Donnelley Foundation; prior thereto, Executive Director, Great Lakes Protection Fund (1990-1994). | | |
1947 333 W. Wacker Drive Chicago, IL 60606 | | Board Member | | 1997 Class I | | | 176 |
| | | | |
∎ CAROLE E. STONE | | | | | | Director, Chicago Board Options Exchange, Inc. (since 2006); Director, C2 Options Exchange, Incorporated (since 2009); Director, CBOE Holdings, Inc. (since 2010); formerly, Commissioner, New York State Commission on Public Authority Reform (2005-2010). | | |
1947 333 W. Wacker Drive Chicago, IL 60606 | | Board Member | | 2007 Class I | | | 176 |
| | | | |
∎ TERENCE J. TOTH
| | | | | | Co-Founding Partner, Promus Capital (since 2008); Director, Fulcrum IT Service LLC (since 2010) and Quality Control Corporation (since 2012); member: Catalyst Schools of Chicago Board (since 2008) and Mather Foundation Board (since 2012), and chair of its Investment Committee; formerly, Director, Legal & General Investment Management America, Inc. (2008-2013); formerly, CEO and President, Northern Trust Global Investments (2004-2007): Executive Vice President, Quantitative Management & Securities Lending (2000-2004); prior thereto, various positions with Northern Trust Company (since 1994); formerly, Member, Northern Trust Mutual Funds Board (2005-2007), Northern Trust Global Investments Board (2004-2007), Northern Trust Japan Board (2004-2007), Northern Trust Securities Inc. Board (2003-2007) and Northern Trust Hong Kong Board (1997-2004). | | |
1959 333 W. Wacker Drive Chicago, IL 60606 | | Board Member | | 2008 Class II | | | 176 |
| | | | | | | |
| | | | |
∎ MARGARET L. WOLFF | | | | | | Formerly, member of the Board of Directors (2013-2017) of Travelers Insurance Company of Canada and The Dominion of Canada General Insurance Company (each, a part of Travelers Canada, the Canadian operation of The Travelers Companies, Inc.); formerly, Of Counsel, Skadden, Arps, Slate, Meagher & Flom LLP (Mergers & Acquisitions Group) (2005-2014); Member of the Board of Trustees of New York- Presbyterian Hospital (since 2005); Member (since 2004) and Chair (since 2015) of the Board of Trustees of The John A. Hartford Foundation (a philanthropy dedicated to improving the care of older adults); formerly, Member (2005-2015) and Vice Chair (2011-2015) of the Board of Trustees of Mt. Holyoke College. | | |
1955 333 W. Wacker Drive Chicago, IL 60606 | | Board Member | | 2016 Class I | | | 176 |
| | | | | | | |
| | | | | | | | |
| | | | |
| | | | | | | | | |
Name,
Year of Birth
& Address | | Position(s) Held
with the Funds | | Year First
Elected or
Appointed
and Term(1) | | Principal
Occupation(s)
Including other
Directorships
During Past 5 Years | | Number
of Portfolios
in Fund Complex
Overseen by
Board Member |
| | | | |
| | | | | | | | | |
| | | |
| Independent Board Members (continued): | | | | | | |
| | | | |
∎ ROBERT L. YOUNG(2) | | | | | | Formerly, Chief Operating Officer and Director, J.P. Morgan Investment Management Inc. (2010-2016); formerly, President and Principal Executive Officer (2013-2016), and Senior Vice President and Chief Operating Officer (2005-2010), of J.P. Morgan Funds; formerly, Director and various officer positions for J.P. Morgan Investment Management Inc. (formerly, JPMorgan Funds Management, Inc. and formerly, One Group Administrative Services) and JPMorgan Distribution Services, Inc. (formerly, One Group Dealer Services, Inc.) (1999-2017). | | |
1963 333 W. Wacker Drive Chicago, IL 60606 | | Board Member | | 2017 Class II | | | 174 |
| | | | | | | |
| | | | |
| Interested Board Member: | | | | | | | | |
| | | | |
∎ MARGO L. COOK(3)(4) | | | | | | President (since April 2017), formerly, Co-Chief Executive Officer and Co-President (2016-2017), formerly, Senior Executive Vice President of Nuveen Investments, Inc.; President, Global Products and Solutions (since July 2017), and, Co-Chief Executive Officer (since 2015), formerly, Executive Vice President (2013-2015), of Nuveen Securities, LLC; Executive Vice President (since February 2017) of Nuveen, LLC; President (since August 2017), formerly Co-President (October 2016- August 2017), formerly, Senior Executive Vice President of Nuveen Fund Advisors, LLC (Executive Vice President since 2011); President (since 2017), Nuveen Alternative Investments, LLC; Chartered Financial Analyst. | | |
1964 333 W. Wacker Drive Chicago, IL 60606 | | Board Member | | 2016 Class III | | | 176 |
| | | | | | | |
| | | | |
| | | | | | | | | |
Name,
Year of Birth
& Address | | Position(s) Held
with the Funds | | Year First
Elected or
Appointed(4)
| | Principal
Occupation(s)
During Past 5 Years | | Number
of Portfolios
in Fund Complex
Overseen by
Officer |
| | | | |
| | | | | | | | | |
| | | | |
| Officers of the Funds: | | | | | | | | |
| | | | |
∎ CEDRIC H. ANTOSIEWICZ | | | | | | Senior Managing Director (since January 2017), formerly, Managing Director (2004-2017) of Nuveen Securities, LLC; Senior Managing Director (since February 2017), formerly, Managing Director (2014-2017) of Nuveen Fund Advisors, LLC. | | |
1962 333 W. Wacker Drive Chicago, IL 60606 | | Chief Administrative Officer | | 2007 | | | 75 |
| | | | |
∎ LORNA C. FERGUSON | | | | | | Senior Managing Director (since February 2017), formerly, Managing Director (2004-2017) of Nuveen. | | |
1945 333 W. Wacker Drive Chicago, IL 60606 | | Vice President | | 1998 | | | 176 |
| | | | |
∎ STEPHEN D. FOY | | | | | | Managing Director (since 2014), formerly, Senior Vice President (2013- 2014) and Vice President (2005-2013) of Nuveen Fund Advisors, LLC; Managing Director (since 2016) of Nuveen Securities, LLC; Certified Public Accountant. | | |
1954 333 W. Wacker Drive Chicago, IL 60606 | | Vice President and Controller | | 1998 | | | 176 |
| | | | |
∎ NATHANIEL T. JONES | | | | | | Managing Director (since January 2017), formerly, Senior Vice President (2016-2017), formerly, Vice President (2011-2016) of Nuveen.; Chartered Financial Analyst. | | |
1979 333 W. Wacker Drive Chicago, IL 60606 | | Vice President and Treasurer | | 2016 | | | 176 |
| | | | |
∎ WALTER M. KELLY | | | | | | Managing Director (since January 2017), formerly, Senior Vice President (2008-2017) of Nuveen. | | |
1970 333 W. Wacker Drive Chicago, IL 60606 | | Chief Compliance Officer and Vice President | | 2003 | | | 176 |
Board Members & Officers (Unaudited) (continued)
| | | | | | | | |
| | | | |
| | | | | | | | | |
Name,
Year of Birth
& Address | | Position(s) Held
with the Funds | | Year First
Elected or
Appointed(4)
| | Principal
Occupation(s)
During Past 5 Years | | Number
of Portfolios
in Fund Complex
Overseen by
Officer |
| | | | |
| | | | | | | | | |
| | | |
| Officers of the Funds (continued): | | | | | | |
| | | | |
∎ DAVID J. LAMB | | | | | | Managing Director (since January 2017), formerly, Senior Vice President of Nuveen (since 2006), Vice President prior to 2006. | | |
1963 333 W. Wacker Drive Chicago, IL 60606 | | Vice President | | 2015 | | | 75 |
| | | | |
∎ TINA M. LAZAR | | | | | | Managing Director (since January 2017), formerly, Senior Vice President (2014-2017) of Nuveen Securities, LLC. | | |
1961 333 W. Wacker Drive Chicago, IL 60606 | | Vice President | | 2002 | | | 176 |
| | | | |
∎ KEVIN J. MCCARTHY | | | | | | Senior Managing Director (since February 2017) and Secretary and General Counsel (since 2016) of Nuveen Investments, Inc., formerly, Executive Vice President (2016-2017) and Managing Director and Assistant Secretary (2008-2016); Senior Managing Director (since January 2017) and Assistant Secretary (since 2008) of Nuveen Securities, LLC, formerly Executive Vice President (2016-2017) and Managing Director (2008-2016); Senior Managing Director (since February 2017), Secretary (since 2016) and Co-General Counsel (since 2011) of Nuveen Fund Advisors, LLC, formerly, Executive Vice President (2016-2017), Managing Director (2008-2016) and Assistant Secretary (2007-2016); Senior Managing Director (since February 2017), Secretary (since 2016) and Associate General Counsel (since 2011) of Nuveen Asset Management, LLC, formerly Executive Vice President (2016-2017) and Managing Director and Assistant Secretary (2011-2016); Senior Managing Director (since February 2017) and Secretary (since 2016) of Nuveen Investments Advisers, LLC, formerly Executive Vice President (2016-2017); Vice President (since 2007) and Secretary (since 2016), formerly, Assistant Secretary, of NWQ Investment Management Company, LLC, Symphony Asset Management LLC, Santa Barbara Asset Management, LLC and Winslow Capital Management, LLC (since 2010). | | |
1966 333 W. Wacker Drive Chicago, IL 60606 | | Vice President and Assistant Secretary | | 2007 | | | 176 |
| | | | | | | |
| | | | |
∎ MICHAEL A. PERRY | | | | | | Executive Vice President since February 2017, previously Managing Director from October 2016), of Nuveen Fund Advisors, LLC and Nuveen Alternative Investments, LLC; Executive Vice President (since 2017), formerly, Managing Director (2015-2017), of Nuveen Securities, LLC; formerly, Managing Director (2010-2015) of UBS Securities, LLC. | | |
1967 333 W. Wacker Drive Chicago, IL 60606 | | Vice President | | 2017 | | | 75 |
| | | | | | | |
| | | | |
∎ KATHLEEN L. PRUDHOMME | | | | | | Managing Director, Assistant Secretary and Co-General Counsel (since 2011) of Nuveen Fund Advisors, LLC; Managing Director, Assistant Secretary and Associate General Counsel (since 2011) of Nuveen Asset Management, LLC; Managing Director and Assistant Secretary (since 2011) of Nuveen Securities, LLC; formerly, Deputy General Counsel, FAF Advisors, Inc. (2004-2010). | | |
1953 901 Marquette Avenue Minneapolis, MN 55402 | | Vice President and Assistant Secretary | | 2011 | | | 176 |
| | | | | | | |
| | | |
∎ CHRISTOPHER M. ROHRBACHER | | | | Managing Director (since January 2017) of Nuveen Securities, LLC; 2008 Managing Director (since January 2017), formerly, Senior Vice President (2016-2017) and Assistant Secretary (since October 2016) of Nuveen Fund Advisors, LLC. | | |
1971 333 W. Wacker Drive Chicago, IL 60606 | | Vice President and Assistant Secretary | | 2008 | | | 176 |
| | | | |
∎ WILLIAM A. SIFFERMANN | | | | | | Managing Director (since February 2017), formerly Senior Vice President (2016-2017) and Vice President (2011-2016) of Nuveen. | | |
1975 333 W. Wacker Drive Chicago, IL 60606 | | Vice President | | 2017 | | | 176 |
| | | | | | | | |
| | | | |
| | | | | | | | | |
Name,
Year of Birth
& Address | | Position(s) Held
with the Funds | | Year First
Elected or
Appointed(4)
| | Principal
Occupation(s)
During Past 5 Years | | Number
of Portfolios
in Fund Complex
Overseen by
Officer |
| | | | |
| | | | | | | | | |
| | |
| Officers of the Funds (continued): | | | | |
| | | | |
∎ JOEL T. SLAGER | | | | | | Fund Tax Director for Nuveen Funds (since 2013); previously, Vice President of Morgan Stanley Investment Management, Inc., Assistant Treasurer of the Morgan Stanley Funds (from 2010 to 2013). | | |
1978 333 W. Wacker Drive Chicago, IL 60606 | | Vice President and Assistant Secretary | | 2013 | | | 176 |
| | | | |
∎ GIFFORD R. ZIMMERMAN | | | | | | Managing Director (since 2002), and Assistant Secretary of Nuveen Securities, LLC; Managing Director (since 2004) and Assistant Secretary (since 1994) of Nuveen Investments, Inc.; Managing Director (since 2002), Assistant Secretary (since 1997) and Co-General Counsel (since 2011) of Nuveen Fund Advisors, LLC; Managing Director, Assistant Secretary and Associate General Counsel of Nuveen Asset Management, LLC (since 2011); Vice President (since February 2017), formerly, Managing Director (2003-2017) and Assistant Secretary (since 2003) of Symphony Asset Management LLC; Managing Director and Assistant Secretary (since 2002) of Nuveen Investments Advisers, LLC; Vice President and Assistant Secretary of NWQ Investment Management Company, LLC (since 2002), Santa Barbara Asset Management, LLC (since 2006), and of Winslow Capital Management, LLC, (since 2010); Chartered Financial Analyst. | | |
1956 333 W. Wacker Drive Chicago, IL 60606 | | Vice President and Secretary | | 1988 | | | 176 |
| | | | | | | |
| (1) | The Board of Trustees is divided into three classes, Class I, Class II, and Class III, with each being elected to serve until the third succeeding annual shareholders’ meeting subsequent to its election or thereafter in each case when its respective successors are duly elected or appointed, except two board members are elected by the holders of Preferred Shares, when applicable, to serve until the next annual shareholders’ meeting subsequent to its election or thereafter in each case when its respective successors are duly elected or appointed. The year first elected or appointed represents the year in which the board member was first elected or appointed to any fund in the Nuveen Complex. |
| (2) | On May 25, 2017, Mr. Young was appointed as a Board Member, effective July 1, 2017. He is a Board Member of each of the Nuveen Funds, except Nuveen Diversified Dividend and Income Fund and Nuveen Real Estate Income Fund. |
| (3) | “Interested person” as defined in the 1940 Act, by reason of her position with Nuveen, LLC. and certain of its subsidiaries, which are affiliates of the Nuveen Funds. |
| (4) | Officers serve one year terms through August of each year. The year first elected or appointed represents the year in which the Officer was first elected or appointed to any fund in the Nuveen Complex. |
Notes
Notes
| | | | | | | | | | | | | | |
| | | | | | | | |
| | | | |
| | | | | | | | |
| | |
| | Nuveen: | | |
| | | | Serving Investors for Generations | | | | |
| | |
| | | | |
| | | |
| | | | Since 1898, financial advisors and their clients have relied on Nuveen to provide
dependable investment solutions through continued adherence to proven, long-term investing
principles. Today, we offer a range of high quality solutions designed to
be integral components of a well-diversified core portfolio.
| | |
| | | |
| | | | | | |
| | | | |
| | | | | | Focused on meeting investor needs. Nuveen is the investment management arm of TIAA. We have grown into one of the world’s premier global asset managers, with specialist knowledge across all major asset classes and particular strength in solutions that provide income for investors and that draw on our expertise in alternatives and responsible investing. Nuveen is driven not only by the independent investment processes across the firm, but also the insights, risk management, analytics and other tools and resources that a truly world-class platform provides. As a global asset manager, our mission is to work in partnership with our clients to create solutions which help them secure their financial future. | | |
| | | | | |
| | | | | | | | | | |
| | | | | | Find out how we can help you.
To learn more about how the products and services of Nuveen
may be able to help you meet your financial goals, talk to your
financial advisor, or call us at (800) 257-8787. Please read the information
provided carefully before you invest. Investors should consider the
investment objective and policies, risk considerations, charges and
expenses of any investment carefully. Where applicable, be sure to obtain a
prospectus, which contains this and other relevant information. To obtain
a prospectus, please contact your securities representative or Nuveen,
333 W. Wacker Dr., Chicago, IL 60606. Please read the
prospectus carefully before you invest or send money.
Learn more about Nuveen Funds at: www.nuveen.com/cef
| | |
| | | | | | |
| | | | | | | | | | | | |
| | Nuveen Securities, LLC, member FINRA and SIPC | 333 West Wacker Drive Chicago, IL 60606 | www.nuveen.com | | |
EAN-A-1117D 366 863-INV-Y-01/19
ITEM 2. CODE OF ETHICS.
As of the end of the period covered by this report, the registrant has adopted a code of ethics that applies to the registrant’s principal executive officer, principal financial officer, principal accounting officer or controller, or persons performing similar functions. There were no amendments to or waivers from the Code during the period covered by this report. The registrant has posted the code of ethics on its website at www.nuveen.com/CEF/Shareholder/FundGovernance.aspx. (To view the code, click on Code of Conduct.)
ITEM 3. AUDIT COMMITTEE FINANCIAL EXPERT.
As of the end of the period covered by this report, the registrant’s Board of Directors or Trustees (“Board”) determined that the registrant has at least one “audit committee financial expert” (as defined in Item 3 of Form N-CSR) serving on its Audit Committee. The registrant’s audit committee financial experts are Carole E. Stone and Jack B. Evans, who are “independent” for purposes of Item 3 of Form N-CSR.
Ms. Stone served for five years as Director of the New York State Division of the Budget. As part of her role as Director, Ms. Stone was actively involved in overseeing the development of the State’s operating, local assistance and capital budgets, its financial plan and related documents; overseeing the development of the State’s bond-related disclosure documents and certifying that they fairly presented the State’s financial position; reviewing audits of various State and local agencies and programs; and coordinating the State’s system of internal audit and control. Prior to serving as Director, Ms. Stone worked as a budget analyst/examiner with increasing levels of responsibility over a 30 year period, including approximately five years as Deputy Budget Director. Ms. Stone has also served as Chair of the New York State Racing Association Oversight Board, as Chair of the Public Authorities Control Board, as a Commissioner on the New York State Commission on Public Authority Reform and as a member of the Boards of Directors of several New York State public authorities. These positions have involved overseeing operations and finances of certain entities and assessing the adequacy of project/entity financing and financial reporting. Currently, Ms. Stone is on the Board of Directors of CBOE Holdings, Inc., of the Chicago Board Options Exchange, and of C2 Options Exchange. Ms. Stone’s position on the boards of these entities and as a member of both CBOE Holdings’ Audit Committee and its Finance Committee has involved, among other things, the oversight of audits, audit plans and preparation of financial statements.
Mr. Evans was formerly President and Chief Operating Officer of SCI Financial Group, Inc., a full service registered broker-dealer and registered investment adviser (“SCI”). As part of his role as President and Chief Operating Officer, Mr. Evans actively supervised the Chief Financial Officer (the “CFO”) and actively supervised the CFO’s preparation of financial statements and other filings with various regulatory authorities. In such capacity, Mr. Evans was actively involved in the preparation of SCI’s financial statements and the resolution of issues raised in connection therewith. Mr. Evans has also served on the audit committee of various reporting companies. At such companies, Mr. Evans was involved in the oversight of audits, audit plans, and the preparation of financial statements. Mr. Evans also formerly chaired the audit committee of the Federal Reserve Bank of Chicago.
ITEM 4. PRINCIPAL ACCOUNTANT FEES AND SERVICES.
| | | | | | | | | | | | | | | | |
Fiscal Year Ended | | Audit Fees Billed
to Fund 1 | | | Audit-Related Fees
Billed to Fund 2 | | | Tax Fees
Billed to Fund 3 | | | All Other Fees
Billed to Fund 4 | |
November 30, 2017 | | $ | 60,096 | | | $ | 5,500 | | | $ | 38,500 | | | $ | 0 | |
| | | | | | | | | | | | | | | | |
| | | | | | | | | | | | | | | | |
Percentage approved pursuant to pre-approval exception | | | 0 | % | | | 0 | % | | | 0 | % | | | 0 | % |
| | | | | | | | | | | | | | | | |
| | | | | | | | | | | | | | | | |
November 30, 2016 | | $ | 57,137 | | | $ | 0 | | | $ | 35,000 | | | $ | 0 | |
| | | | | | | | | | | | | | | | |
| | | | | | | | | | | | | | | | |
Percentage approved pursuant to pre-approval exception | | | 0 | % | | | 0 | % | | | 0 | % | | | 0 | % |
| | | | | | | | | | | | | | | | |
1 “Audit Fees” are the aggregate fees billed for professional services for the audit of the Fund’s annual financial statements and services provided in connection with statutory and regulatory filings or engagements.
2 “Audit Related Fees” are the aggregate fees billed for assurance and related services reasonably related to the performance of the audit or review of financial statements that are not reported under “Audit Fees”. These fees include offerings related to the Fund’s common shares and leverage.
3 “Tax Fees” are the aggregate fees billed for professional services for tax advice, tax compliance, and tax planning. These fees include: all global withholding tax services; excise and state tax reviews; capital gain, tax equalization and taxable basis calculation performed by the principal accountant.
4 “All Other Fees” are the aggregate fees billed for products and services other than “Audit Fees”, “Audit-Related Fees” and “Tax Fees”. These fees represent all “Agreed-Upon Procedures” engagements pertaining to the Fund’s use of leverage.
SERVICES THAT THE FUND’S AUDITOR BILLED TO THE
ADVISER AND AFFILIATED FUND SERVICE PROVIDERS
The following tables show the amount of fees billed by PricewaterhouseCoopers LLP to Nuveen Fund Advisors, LLC (formerly Nuveen Fund Advisors, Inc.) (the “Adviser”), and any entity controlling, controlled by or under common control with the Adviser that provides ongoing services to the Fund (“Affiliated Fund Service Provider”), for engagements directly related to the Fund’s operations and financial reporting, during the Fund’s last two full fiscal years.
The tables also show the percentage of fees subject to the pre-approval exception. The pre-approval exception for services provided to the Adviser and any Affiliated Fund Service Provider (other than audit, review or attest services) waives the pre-approval requirement if: (A) the aggregate amount of all such services provided constitutes no more than 5% of the total amount of revenues paid to PricewaterhouseCoopers LLP by the Fund, the Adviser and Affiliated Fund Service Providers during the fiscal year in which the services are provided that would have to be pre-approved by the Audit Committee; (B) the Fund did not recognize the services as non-audit services at the time of the engagement; and (C) the services are promptly brought to the Audit Committee’s attention, and the Committee (or its delegate) approves the services before the Fund’s audit is completed.
| | | | | | | | | | | | |
Fiscal Year Ended | | Audit-Related Fees
Billed to Adviser and
Affiliated Fund Service
Providers | | | Tax Fees Billed to
Adviser and
Affiliated Fund
Service Providers | | | All Other Fees
Billed to Adviser
and Affiliated Fund
Service Providers | |
November 30, 2017 | | $ | 0 | | | $ | 0 | | | $ | 0 | |
| | | | | | | | | | | | |
| | | | | | | | | | | | |
Percentage approved pursuant to pre-approval exception | | | 0 | % | | | 0 | % | | | 0 | % |
| | | | | | | | | | | | |
| | | | | | | | | | | | |
November 30, 2016 | | $ | 0 | | | $ | 0 | | | $ | 0 | |
| | | | | | | | | | | | |
| | | | | | | | | | | | |
Percentage approved pursuant to pre-approval exception | | | 0 | % | | | 0 | % | | | 0 | % |
| | | | | | | | | | | | |
NON-AUDIT SERVICES
The following table shows the amount of fees that PricewaterhouseCoopers LLP billed during the Fund’s last two full fiscal years for non-audit services. The Audit Committee is required to pre-approve non-audit services that PricewaterhouseCoopers LLP provide to the Adviser and any Affiliated Fund Services Provider, if the engagement related directly to the Fund’s operations and financial reporting (except for those subject to the pre-approval exception described above). The Audit Committee requested and received information from PricewaterhouseCoopers LLP about any non-audit services that PricewaterhouseCoopers LLP rendered during the Fund’s last fiscal year to the Adviser and any Affiliated Fund Service Provider. The Committee considered this information in evaluating PricewaterhouseCoopers LLP’s independence.
| | | | | | | | | | | | | | | | |
Fiscal Year Ended | | Total Non-Audit Fees
Billed to Fund | | | Total Non-Audit Fees
billed to Adviser and
Affiliated Fund Service
Providers (engagements
related directly to the
operations and financial
reporting of the Fund) | | | Total Non-Audit Fees
billed to Adviser and
Affiliated Fund Service
Providers (all other
engagements) | | | Total | |
November 30, 2017 | | $ | 38,500 | | | $ | 0 | | | $ | 0 | | | $ | 38,500 | |
November 30, 2016 | | $ | 35,000 | | | $ | 0 | | | $ | 0 | | | $ | 35,000 | |
“Non-Audit Fees billed to Fund” for both fiscal year ends represent “Tax Fees” and “All Other Fees” billed to Fund in their respective amounts from the previous table.
Less than 50 percent of the hours expended on the principal accountant’s engagement to audit the registrant’s financial statements for the most recent fiscal year were attributed to work performed by persons other than the principal accountant’s full-time, permanent employees.
Audit Committee Pre-Approval Policies and Procedures. Generally, the Audit Committee must approve (i) all non-audit services to be performed for the Fund by the Fund’s independent accountants and (ii) all audit and non-audit services to be performed by the Fund’s independent accountants for the Affiliated Fund Service Providers with respect to operations and financial reporting of the Fund. Regarding tax and research projects conducted by the independent accountants for the Fund and Affiliated Fund Service Providers (with respect to operations and financial reports of the Fund) such engagements will be (i) pre-approved by the Audit Committee if they are expected to be for amounts greater than $10,000; (ii) reported to the Audit Committee chairman for his verbal approval prior to engagement if they are expected to be for amounts under $10,000 but greater than $5,000; and (iii) reported to the Audit Committee at the next Audit Committee meeting if they are expected to be for an amount under $5,000.
ITEM 5. AUDIT COMMITTEE OF LISTED REGISTRANTS.
The registrant’s Board has a separately designated Audit Committee established in accordance with Section 3(a)(58)(A) of the Securities Exchange Act of 1934, as amended (15 U.S.C. 78c(a)(58)(A)). As of the end of the period covered by this report, the members of the audit committee are Jack B. Evans, David J. Kundert, John K. Nelson, Carole E. Stone and Terence J. Toth.
ITEM 6. SCHEDULE OF INVESTMENTS.
(a) See Portfolio of Investments in Item 1.
(b) Not applicable.
ITEM 7. DISCLOSURE OF PROXY VOTING POLICIES AND PROCEDURES FOR CLOSED-END MANAGEMENT INVESTMENT COMPANIES.
The registrant has delegated the voting of proxies relating to its voting securities to its investment sub-adviser, Advisory Research Inc. (the “Sub-Adviser” or “ARI”). The Sub-Adviser’s Proxy Voting Policies and Procedures are as follows:
Proxy Voting Policy and Procedures
Regulatory Requirement
An adviser exercising proxy voting for clients must:
| | a) | Written Policies and Procedures. Adopt written policies and procedures that (1) are reasonably designed to ensure that the adviser votes proxies in the best interest of its clients, and (2) address how the adviser resolves any material conflicts of interest that may arise when voting client proxies; |
| | b) | Information Disclosures. Disclose to clients how they can obtain information about how the adviser voted their securities, and how clients can obtain a copy of the adviser’s proxy voting policies and procedures; and |
| | c) | Policies and Procedures Description. Describe in its Form ADV Part II or in a separate disclosure document the adviser’s proxy voting policies and procedures. |
[Rule 206(4)-6]
Policy
ARI seeks to vote or otherwise process, such as by a decision to abstain from voting or to take no action on, proxies over which it has voting authority in the best interests of ARI’s clients.
Procedures for MLP & Energy Infrastructure Strategies:
Voting decisions. ARI shall evaluate each proxy of a Master Limited Partnership (“MLP”) on a case by case basis due to their unique nature. Any proxies received for equity or debt securities other than MLP’s will be voted with management because ARI believes that recommendations by management teams or their board of directors generally are in shareholders’ best interests, and therefore in the best economic interest of ARI’s clients. There are times when ARI believes management’s position on a particular proxy issue is not in the best interests of our clients but it does not warrant a sale of the clients’ shares. In these circumstances, ARI will vote contrary to management’s recommendations.
Decision to abstain. ARI may process certain proxies without voting them, such as by making a decision to abstain from voting or take no action on such proxies (or on certain proposals within such proxies). Examples include, without limitation, proxies issued by companies that ARI has
decided to sell, proxies issued for securities that ARI did not select for a client portfolio (such as, without limitation, securities that were selected by the client or by a previous adviser, unsupervised securities held in a client’s account, money market securities, or other securities selected by clients or their representatives other than ARI), or proxies issued by foreign companies that impose burdensome or unreasonable voting, power of attorney, or holding requirements.
ARI also may abstain from voting, or take no action on, proxies in other circumstances, such as when voting may not be in the best interests of clients, as an alternative to voting with (or against) management, or when voting may be unduly burdensome or expensive.
Conflicts of Interest. In certain circumstances, such as when the proponent of a proxy proposal is also a client of ARI, an appearance might arise of a potential conflict between ARI’s interests and the interests of affected clients in how the proxies of that issuer are voted. When ARI itself knowingly does business with a particular proxy issuer and a material conflict of interest between ARI’s interests and clients’ interests may appear to exist, ARI generally would, to avoid any appearance concerns, follow an alternative procedure rather than vote proxies as recommended by management. Such an alternative procedure generally would involve causing the proxies to be voted in accordance with the recommendations of an independent service provider that ARI may use to assist in voting proxies.
ARI generally will not notify clients if it uses this procedure to resolve an apparent material conflict of interest. ARI will document the identification of any material conflict of interest and its procedure for resolving the particular conflict.
In unusual cases, ARI may use other alternative procedures to address circumstances when a material conflict of interest may appear to exist, such as, without limitation:
(i) Notifying affected clients of the conflict of interest (if practical), and seeking a waiver of the conflict to permit ARI to vote the proxies under its usual policy;
(ii) Abstaining from voting the proxies; or
(iii) Forwarding the proxies to clients so that clients may vote the proxies themselves. ARI generally will notify clients if it uses one of these alternative procedures to resolve a material conflict of interest.
Voting by Client Instead of ARI
An ARI client may vote its own proxies instead of directing ARI to do so. ARI recommends this approach if a client believes that proxies should be voted based on political or social interests. ARI generally will not accept proxy voting authority from a client (and will encourage the client to vote its own proxies) if the client seeks to impose client-specific voting guidelines that may be inconsistent with ARI’s procedures or with the client’s best economic interest in ARI’s view.
ARI generally will abstain from voting on (or otherwise participating in) the commencement of legal proceedings such as shareholder class actions or bankruptcy proceedings.
Recordkeeping. ARI or a service provider maintains, in accordance with Rule 204-2 of the Investment Advisers Act:
(i) Copies of all proxy voting policies and procedures;
(ii) Copies of proxy statements received (unless maintained elsewhere as described below);
(iii) Records of proxy votes cast on behalf of clients;
(iv) Documents prepared by ARI that are material to a decision on how to vote or memorializing the basis for a decision;
(v) Written client requests for proxy voting information and
(vi) Written responses by ARI to written or oral client requests.
ARI will obtain an undertaking from any service provider that the service provider will provide copies of proxy voting records and other documents promptly upon request if ARI relies on the service provider to maintain related records.
ARI or its service provider may rely on the SEC’s EDGAR system to keep records of certain proxy statements if the proxy statements are maintained by issuers on that system (as is generally true in the case of larger U.S.-based issuers).
Adopted effective August 1, 2003 and as amended July 31, 2014.
ITEM 8. PORTFOLIO MANAGERS OF CLOSED-END MANAGEMENT INVESTMENT COMPANIES.
Nuveen Fund Advisors, LLC is the registrant’s investment adviser (also referred to as the “Adviser”). The Adviser is responsible for the selection and on-going monitoring of the Fund’s investment portfolio, managing the Fund’s business affairs and providing certain clerical, bookkeeping and administrative services. The Adviser has engaged Advisory Research Inc., (“Advisory Research” or “Sub-Adviser”), as sub-adviser to provide discretionary investment advisory services. The following section provides information on the portfolio managers at the Sub-Adviser.
| Item 8(a)(1). | PORTFOLIO MANAGER BIOGRAPHIES |
The following individuals at the Sub-Adviser (the “Portfolio Managers”) have primary responsibility for the day-to-day implementation of the Fund’s investment strategy:
James J. Cunnane Jr., CFA – Managing Director, Chief Investment Officer-MLPs
Mr. Cunnane is the Managing Director and Chief Investment Officer of the Advisory Research MLP & Energy Infrastructure team. He oversees the firm’s MLP and energy infrastructure product lines and chairs the Risk Management Committee. He joined the MLP team in 1996 and currently serves as a portfolio manager for three closed-end mutual funds: the Fiduciary/Claymore MLP Opportunity Fund and the Nuveen Energy MLP Total Return Fund and the Nuveen All Cap Energy MLP Opportunities Fund. He also serves as a portfolio manager for three open-end mutual funds: the Advisory Research MLP & Energy Income Fund, the Advisory Research MLP & Energy Infrastructure Fund and the Advisory Research MLP & Equity Fund. Mr. Cunnane holds a B.S. in finance from Indiana University and is a Chartered Financial Analyst (CFA) charterholder. He serves on the finance council and investment committee of the Archdiocese of St. Louis, the investment committee of Mercy Health, and on the Board of Directors of St. Patrick’s Center.
Quinn T. Kiley – Managing Director, Senior Portfolio Manager
Mr. Kiley is the Managing Director and Senior Portfolio Manager of the Advisory Research MLP & Energy infrastructure team and his responsibilities include portfolio management of various energy infrastructure assets and oversight of the energy infrastructure research process. He joined the MLP team in 2005. Prior to joining the MLP team, Mr. Kiley served as Vice President of Corporate & Investment Banking at Banc of America Securities in New York. He was responsible for executing strategic advisory and financing transactions for clients in the Energy & Power sectors. Mr. Kiley serves as a portfolio manager for three closed-end mutual funds: the Fiduciary/Claymore MLP Opportunity Fund, the Nuveen Energy MLP Total Return Fund and the Nuveen All Cap Energy MLP Opportunities Fund. He also serves as a portfolio manager for three open-end mutual funds: the Advisory Research MLP & Energy Income Fund, the Advisory Research MLP & Energy Infrastructure Fund and the Advisory Research MLP & Equity Fund. Mr. Kiley holds a B.S. with Honors in Geology from Washington & Lee University, a M.S. in Geology from the University of Montana, a Juris Doctorate from Indiana University School of Law, and a M.B.A. from the Kelley School of Business at Indiana University. Mr. Kiley has been admitted to the New York State Bar. He serves on the finance committee of Rossman School and The Magic House.
| Item 8(a)(2). | OTHER ACCOUNTS MANAGED BY THE PORTFOLIO MANAGER |
Other Accounts Managed by Portfolio Manager(s) or Management team member as of November 30, 2017
| | | | | | | | | | | | | | | | | | | | | | | | |
| | | (ii) Number of Other Accounts Managed
and Assets by Account Type | | | | | | (iii) Number of Other Accounts and Assets for Which Advisory Fee is Performance-Based | | | | |
(i) Name of Portfolio Manager | | Other
Registered
Investment
Companies | | | Other Pooled
Investment
Vehicles | | | Other
Accounts | | | Other
Registered
Investment
Companies | | | Other
Pooled
Investment
Vehicles | | | Other
Accounts | |
James Cunnane | | | 5 | | | | 0 | | | | 421 | | | | 0 | | | | 0 | | | | 0 | |
| | $ | 2,066,850,366 | | | $ | 0 | | | $ | 984,072,857 | | | $ | 0 | | | $ | 0 | | | $ | 0 | |
Quinn T. Kiley | | | 5 | | | | 0 | | | | 421 | | | | 0 | | | | 0 | | | | 0 | |
| | $ | 2,066,850,366 | | | $ | 0 | | | $ | 984,072,857 | | | $ | 0 | | | $ | 0 | | | $ | 0 | |
POTENTIAL MATERIAL CONFLICTS OF INTEREST
Actual or apparent conflicts of interest may arise when a portfolio manager has day-to-day management responsibilities with respect to more than one fund or other account. More specifically, portfolio managers who manage multiple funds and/or other accounts may be presented with one or more of the following potential conflicts:
The management of multiple funds and/or other accounts may result in a portfolio manager devoting unequal time and attention to the management of each fund and/or other account. The Sub-Adviser seeks to manage such competing interests for the time and attention of a portfolio manager by having the portfolio manager focus on a particular investment discipline. Most other accounts managed by a portfolio manager are managed using the same investment models that are used in connection with the management of the Fund.
If a portfolio manager identifies a limited investment opportunity which may be suitable for more than one fund or other account, a fund may not be able to take full advantage of that opportunity due to an allocation of filled purchase or sale orders across all eligible funds and other accounts. To deal with these situations, the Sub-Adviser has adopted procedures for allocating portfolio transactions across multiple accounts. With respect to securities transactions for the Fund, the Sub-Adviser determines which broker to use to execute each order, consistent with its duty to seek best execution of the transaction. However, with respect to certain other accounts (such as pooled investment vehicles that are not registered mutual funds, and other accounts managed for organizations and individuals), the Sub-Adviser may be limited by the client with respect to the selection of brokers or may be instructed to direct trades through a particular broker. In these cases, trades for a fund in a particular security may be placed separately from, rather than aggregated with, such other accounts. Having separate transactions with respect to a security may temporarily affect the market price of the security or the execution of the transaction, or both, to the possible detriment of a fund or other account(s) involved.
The Sub-Adviser has adopted certain compliance procedures which are designed to address these types of conflicts. However, there is no guarantee that such procedures will detect each and every situation in which a conflict arises.
| Item 8(a)(3). | FUND MANAGER COMPENSATION |
Compensation Structure. The primary portfolio managers’ compensation is as follows for James J. Cunnane, Jr. and Quinn T. Kiley:
Each portfolio manager is paid a competitive salary and an annual bonus from a formula-based incentive pool created for the investment team. In addition to the salary and bonus paid, each portfolio manager is offered a comprehensive and competitive benefits program.
Investment team incentive compensation is tied to revenue generated by the team’s products and not to the performance of the investment strategy employed for the Funds or other clients of the team. Advisory Research performs regular assessments of our compensation plans and employees benefits to ensure we are competitive with the industry.
| Item 8(a)(4). | OWNERSHIP OF JMF SECURITIES AS OF NOVEMBER 30, 2017: |
| | | | | | | | | | | | | | | | | | | | | | |
Name of Portfolio Manager | | None | | $1 -
$10,000 | | | $10,001-
$50,000 | | $50,001-
$100,000 | | | $100,001-
$500,000 | | $500,001-
$1,000,000 | | | Over $1,000,000 | |
James J. Cunnane, Jr. | | | | | | | | x | | | | | | | | | | | | | | |
Quinn T. Kiley | | | | | | | | | | | | | | x | | | | | | | | |
ITEM 9. PURCHASES OF EQUITY SECURITIES BY CLOSED-END MANAGEMENT INVESTMENT COMPANY AND AFFILIATED PURCHASERS.
Not applicable.
ITEM 10. SUBMISSION OF MATTERS TO A VOTE OF SECURITY HOLDERS.
There have been no material changes to the procedures by which shareholders may recommend nominees to the registrant’s Board implemented after the registrant last provided disclosure in response to this Item.
ITEM 11. CONTROLS AND PROCEDURES.
| | (a) | The registrant’s principal executive and principal financial officers, or persons performing similar functions, have concluded that the registrant’s disclosure controls and procedures (as defined in Rule 30a-3(c) under the Investment Company Act of 1940, as amended (the “1940 Act”) (17 CFR 270.30a-3(c))) are effective, as of a date within 90 days of the filing date of this report that includes the disclosure required by this paragraph, based on their evaluation of the controls and procedures required by Rule 30a-3(b) under the 1940 Act (17 CFR 270.30a-3(b)) and Rules 13a-15(b) or 15d-15 (b) under the Securities Exchange Act of 1934, as amended (the “Exchange Act”) (17 CFR 240.13a-15(b) or 240.15d-15 (b)). |
| | (b) | There were no changes in the registrant’s internal control over financial reporting (as defined in Rule 30a-3(d) under the 1940 Act (17 CFR 270.30a-3(d)) that occurred during the second fiscal quarter of the period covered by this report that has materially affected, or is reasonably likely to materially affect, the registrant’s internal control over financial reporting. |
ITEM 12. EXHIBITS.
File the exhibits listed below as part of this Form.
(a)(1) Any code of ethics, or amendment thereto, that is the subject of the disclosure required by Item 2, to the extent that the registrant intends to satisfy the Item 2 requirements through filing of an exhibit: Not applicable because the code is posted on registrant’s website at www.nuveen.com/CEF/Shareholder/FundGovernance.aspx and there were no amendments during the period covered by this report. (To view the code, click on Code of Conduct.)
(a)(2) A separate certification for each principal executive officer and principal financial officer of the registrant as required by Rule 30a-2(a) under the 1940 Act (17 CFR 270.30a-2(a)) in the exact form set forth below: Ex-99.CERT Attached hereto.
(a)(3) Any written solicitation to purchase securities under Rule 23c-1 under the 1940 Act (17 CFR 270.23c-1) sent or given during the period covered by the report by or on behalf of the registrant to 10 or more persons. Not applicable.
(b) If the report is filed under Section 13(a) or 15(d) of the Exchange Act, provide the certifications required by Rule 30a-2(b) under the 1940 Act (17 CFR 270.30a-2(b)); Rule 13a-14(b) or Rule 15d-14(b) under the Exchange Act (17 CFR 240.13a-14(b) or 240.15d-14(b)), and Section 1350 of Chapter 63 of Title 18 of the United States Code (18 U.S.C. 1350) as an exhibit. A certification furnished pursuant to this paragraph will not be deemed “filed” for purposes of Section 18 of the Exchange Act (15 U.S.C. 78r), or otherwise subject to the liability of that section. Such certification will not be deemed to be incorporated by reference into any filing under the Securities Act of 1933 or the Exchange Act, except to the extent that the registrant specifically incorporates it by reference. Ex-99.906 CERT attached hereto.
SIGNATURES
Pursuant to the requirements of the Securities Exchange Act of 1934 and the Investment Company Act of 1940, the registrant has duly caused this report to be signed on its behalf by the undersigned, thereunto duly authorized.
(Registrant) Nuveen Energy MLP Total Return Fund
| | | | |
| By (Signature and Title) | | /s/ Gifford R. Zimmerman | | |
| | Gifford R. Zimmerman | | |
| | Vice President and Secretary | | |
| |
| Date: February 7, 2018 | | |
Pursuant to the requirements of the Securities Exchange Act of 1934 and the Investment Company Act of 1940, this report has been signed below by the following persons on behalf of the registrant and in the capacities and on the dates indicated.
| | | | |
| By (Signature and Title) | | /s/ Cedric H. Antosiewicz | | |
| | Cedric H. Antosiewicz | | |
| | Chief Administrative Officer | | |
| | (principal executive officer) | | |
| |
| Date: February 7, 2018 | | |
| | |
| By (Signature and Title) | | /s/ Stephen D. Foy | | |
| | Stephen D. Foy | | |
| | Vice President and Controller | | |
| | (principal financial officer) | | |
| |
| Date: February 7, 2018 | | |