Exhibit 99.2

| FY 1Q 2011 Supplemental Earnings Information 1 Fiscal Year 1Q 2011 Supplemental Earnings Information FY 1Q 2011 Supplemental Earnings Information |

| Non-GAAP Financial Measures The Company provides financial measures that are not defined under generally accepted accounting principles in the United States, or GAAP, including earnings before interest, taxes, depreciation and amortization (“EBITDA”) and Adjusted EBITDA. EBITDA and Adjusted EBITDA are not measurements of our financial performance under GAAP and should not be considered in isolation or as alternativesto net income or any other performance measures derived in accordance with GAAP or as alternatives to cash flows from operating activities as measures of our liquidity. “Adjusted EBITDA” is defined as EBITDA adjusted to exclude transaction costs related to acquisitions, stock-based compensation, and certain non-cash and non-recurring items. Management uses EBITDA and Adjusted EBITDA to evaluate operating performance and liquidity and these financial measures are among the primary measures used by management for planning and forecasting of future periods. The Company believes Adjusted EBITDA is especially important in a capital-intensive industry such as telecommunications. The Company further believes that the presentation of EBITDA and Adjusted EBITDA is relevant and useful for investors becauseitallows investors to view results in a manner similar to the method used by management and makes it easier to compare our resultswith the results of other companies that have different financing and capital structures. EBITDA and Adjusted EBITDA have limitations as analytical tools, and should not be considered in isolation from, or as substitutes for, analysis of our results as reported under GAAP. For example, Adjusted EBITDA: |
| ·does not reflect capital expenditures, or future requirements for capital and major maintenance expenditures or contractual commitments; |
| ·does not reflect changes in, or cash requirements for, our working capital needs; |
| ·does not reflect the significant interest expense, or the cash requirements necessary to service the interest payments, on our debt;and |
| ·does not reflect cash required to pay income taxes. |
| The Company’s computation of Adjusted EBITDA may not be comparable to other similarly titled measures computed by other companies, because all companies do not calculate Adjusted EBITDA in the same fashion. Because the Company has acquired numerous entities since inception and incurred transaction costs in connection with each acquisition, has borrowed money in order to finance operations, has used capital and intangible assets in the business, and because the payment of income taxes is necessary if taxable income is generated, any measure that excludes these items has material limitations. As a result of these limitations, EBITDA and Adjusted EBITDA should not be considered as measures of discretionary cash available to invest in the growth of the business or as measures of liquidity. In addition to Adjusted EBITDA, management uses unlevered free cash flow, which measures the ability of Adjusted EBITDA to cover capital expenditures. Gross profit, defined as revenue less operating costs, excluding depreciation and amortization, is usedbymanagement to assess profitability prior to selling, general and administrative expenses, stock-based compensation and depreciation and amortization. The Company also provides invested capital and the ratio of invested capital ratio. Management uses invested capital and the invested capital ratio to assess value creation in the business. 2FY 1Q 2011 Supplemental Earnings Information |

| Other Notes The enclosed supplement should be read in conjunction with the Company’s Fiscal Year 2010 Earnings Release and Annual Report Forward-Looking Statements Statements made in this presentation and conference call that are not historical in nature constitute forward-looking statements.We cannot assure you that the future results expressed or implied by the forward-looking statements will be achieved.Such statements are based on the current expectations and beliefs of management and are subject to a number of risks and uncertainties that couldcause actual results to differ materially from the future results expressed or implied by such forward-looking statements.The Company undertakes no obligation to publicly update or revise forward-looking statements to reflect events or circumstances after the date of this press release or to reflect the occurrence of unanticipated events. Other Operating Measures This earnings supplement contains operating measures used by the Company in managing the business. Management believes that providing this information enables analysts, investors and others to obtain a better understanding of the Company’s operatingperformance and to evaluate the efficacy of the methodology and information used by management to evaluate and measure such performance on a standalone and comparative basis. Certain supplemental information provided and related definitions may notbedirectly comparable to similarly titled items reported by other companies. Further, the Company may from time to time revise thecalculation or presentation of certain operating measures. Certain operating measures such as sales, network expense, installation and churn included intercompany items for the three months ended March 31, 2010 and June, 30 2010. The intercompany items were not material and have been eliminated for the period ended September 30, 2010. Estimates Certain operating measures presented herein are based on estimates. The measures are noted as estimates where presented and include; (1) estimated gross profit on gross new sales (2) estimated capital expenditures associated with gross new sales (3)estimated payback period on gross new sales (calculated) (4) estimated commitments of speculative capital expenditures and (5) estimated timing of service activation pipeline conversion. In addition to these measures that are based on estimates of future events, certain third quarter historical measures includeanestimate of the Zayo Enterprise Networks (“ZEN”) component of the consolidated historical operating measure. These estimates were necessitated by the lack of available historical data for the measure at the ZEN segment. Historical operating measures thatinclude an estimate for ZEN are; (1) gross profit, capital expenditures and payback for new sales (2) stratification of gross new sales (3) breakdown of installations and churn (4) price changes (5) upgrades (6) service activation and churn pipeline (7) revenue under contract (8) customer verticals and product mix and (9) customer and unit metrics. The three months ending June 30, 2010 also includes an estimate for ZEN’s revenue under contract. 3 FY 1Q 2011 Supplemental Earnings Information |
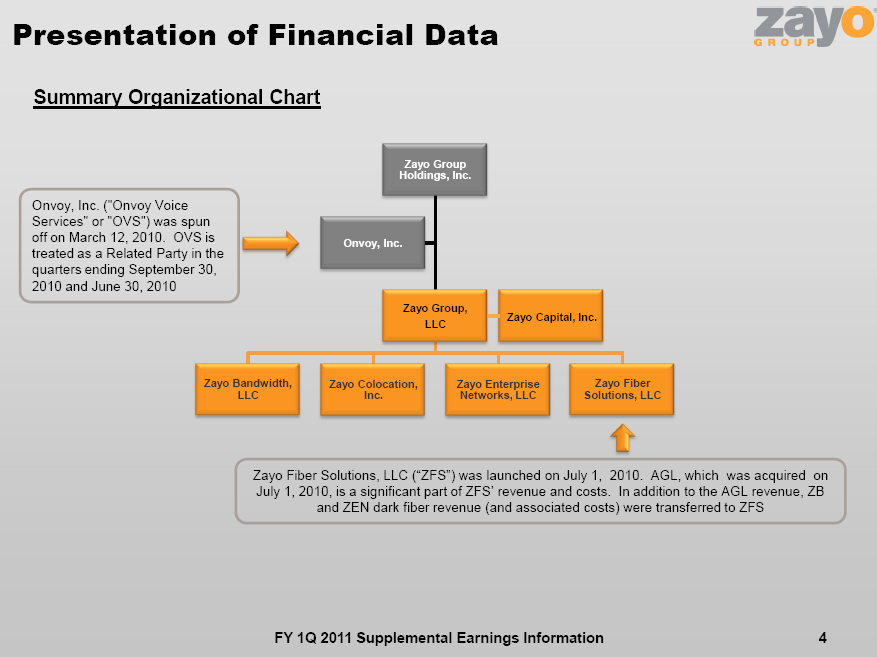
| Presentation of Financial Data Zayo Group Holdings, Inc. Zayo Group, LLC Zayo Bandwidth, LLC Zayo Enterprise Networks, LLC Zayo Colocation, Inc. Zayo Fiber Solutions, LLC Onvoy, Inc. 4 Summary Organizational ChartZayo Capital, Inc. FY 1Q 2011 Supplemental Earnings Information Onvoy, Inc. (“Onvoy Voice Services” or “OVS”) was spun off on March 12, 2010. OVS is treated as a Related Party in the quarters ending September 30, 2010 and June 30, 2010 Zayo Fiber Solutions, LLC (“ZFS”) was launched on July 1, 2010. AGL, which was acquired on July 1, 2010, is a significant part of ZFS’ revenue and costs. In addition to the AGL revenue, ZB and ZEN dark fiber revenue (and associated costs) were transferred to ZFS |

| Recent Acquisitions 5 FY 1Q 2011 Supplemental Earnings Information Pro-Forma Statistics Acquisition of AGL Networks closed on July 1, 2010; Acquisition of American Fiber Systems closed on October 1, 2010. Nashville Colo Facility signed and closed on September 20, 2010 1. Quarterly financial results include a pro-forma reduction to the historical revenue and adjusted EBITDA based on management’s estimates of the fair value of the acquired deferred revenue balance. Other purchase accounting adjustments are not included in the pro-forma presentation 2. Purchase price excludes $15 million for AFS interest in US Carrier 3. EBITDA multiple based on pro-forma adjusted EBITDA results annualized 4. Facility is 15,400 sq. ft. with 9,000 sq. ft. of Colo space built out and ~3,500 sq. ft. of expansion spaceJune 30,September 30, September 30, 201020102010AGLAmericanNashvilleNetworksFiber SystemsColo FacilityNETWORK STATISTICS Metro Markets3 9 1 Route Miles786 1,251 n/aFiber Miles192,048 165,404 n/aOn-Net Buildings289 644 n/aColocation Square Feet9,000 4 Cabinet Equivalents350 Cabinet Utilization5%PRO-FORMA QUARTERLY FINANCIAL STATISTICS ($M) 1Pro-forma Revenue$5.6$7.7$0.0Pro-forma Adjusted EBITDA$2.9$3.3($0.0) % Margin52%42%TRANSACTION STATISTICS ($M)Close DateJul 1Oct 1Sep 20Purchase Price$73.7$99.52 <$0.25EBITDA Multiple 36.3x7.6xThree months ended |

| ReportingImpacts Effective January 1, 2011, the Company intends to implement certain organizational changes. These changes, in conjunction with previously announced acquisitions, will impact our reporting and comparability of prior periods. The Company will provide an explanation and analysis of these changes in the future. The following is a summary of events that could impact our future reporting: |
| nAcquisition and related integration of AGL Networks, American Fiber Systems, and the Nashville colocation facility |
| nRestructuring of operating segments to more closely align with product categories |
| ·Transfer bandwidth infrastructure products currently in ZEN to ZB (expected 1/1/11) |
| ·Transfer ethernet and IP products currently in ZEN to ZB (expected 1/1/11) |
| ·Transfer colocation products currently in ZEN and ZB to zColo (expected 1/1/11) |
| nCreate a new shared sales channel for ZB, ZFS and zColo. While ZB, ZFS, and zColo will continue to have direct sales forces selling to their largest customers, the shared sales and marketing organization will represent the infrastructure products of ZB, ZFS and zColo to all but the largest customers. It will focus on regional carriers; internet companies; local colocation companies; and high bandwidth enterprise segments such as media, healthcare, and educational segments |
| nThe existing ZEN segment will contain only the legacy managed services / CLEC products (“Managed Communication Services” or “MCS”) that were acquired in various acquisitions. Effective 1/1/11, MCS will not be included in the consolidated operational metric reporting (e.g. Gross New Sales, Installs, Churn, etc.) |
| FY 1Q 2011 Supplemental Earnings Information 6 |

| Consolidated Pro-forma Financial Data7 FY 1Q 2011 Supplemental Earnings Information Pro-forma1Financial Data 1 The three months ended December 31, 2009 and the three months ended March 31, 2010 are presented pro-forma for the treatment of Onvoy Voice Services (spun-off March 12, 2010) as a related party rather than a discontinued operation 2 The three months ended September 30, 2010 amounts include the acquisition of AGL Networks. Excluding the effect of the AGL acquisition on July 1, 2010 the annualized revenue and AdjustedEBITDA growth rates for the three months ended September 30, 2010 were estimated to be 10% and 20% respectively($ in millions)December 31,1March 31,1June 30,September 30,22009201020102010Revenue$59.4 $59.8 $61.4 $68.6 Annualized revenue growth3%11%47%Annualized organic revenue growth110%Gross profit39.0 39.8 41.6 48.7 Gross profit %66%67%68%71%Operating income/(loss)$9.0 ($1.2)$6.5 $9.1 Earnings/(loss) from continuing operations$3.2 ($11.1)$5.4 ($0.3)Earnings / (loss) from discontinued operations, net of income taxes1.4 $0.9 0.2 0.0 Net earnings/ (loss)$4.7 ($10.2)$5.6 ($0.3)Adjusted EBITDA, from continuing operations$20.3 $22.4 $23.3 $26.8 Purchases of property and equipment9.8 16.7 21.6 21.4 Unlevered free cash flow / (deficit)$10.4 $5.7 $1.7 $5.4 Annualized EBITDA growth41%16%60%Annualized organic EBITDA growth120% Adjusted EBITDA margin34%37%38%39%Three months ended |

| Consolidated Invested Capital Ratio 8 FY 1Q 2011 Supplemental Earnings Information Invested Capital 1 The increase in member’s interest during the three months ended September 30, 2010 is a result of additional capital contributions from Zayo Group Holdings, Inc. in the amount of $35.5 million, a tax benefit of $1.0 million which the Company received from utilizing OVS’s net operating losses during the period and $0.3 million related to the push down of preferred stock compensation. Offsetting these increases is a reduction to the member’s interest balance in the amount of $0.7 million related to the allocation of certain assets and liabilities between the entities which were identified and transferred between the related parties subsequent to the spin-off of OVS in March 2010($ in millions)March 31,June 30,September 30,201020102010Member’s interest1$215.9 $217.1 $253.3 Capital lease obligations13.4 12.7 12.2 Long-term debt247.0 247.1 350.2 Less cash balance(81.5)(89.2)(154.2)Total invested capital$394.8 $387.7 $461.4 Adjusted EBITDA21.9 23.3 26.8 Invested capital ratio4.5 x4.2 x4.3 xThree months ended |

| Consolidating Financial Data 9FY 1Q 2011 Supplemental Earnings Information Consolidating Data($ in millions)Zayo BandwidthZayo Enterprise NetworkszColoZFSCorporate / Intercompany EliminationZayo GroupRevenue$47.2$8.2$7.2$7.5($1.5)$68.6Gross profit34.14.33.67.4(0.6)48.7 Gross profit %72%53%50%98%42%71%Operating income/(loss)8.80.01.02.0(2.6)9.1Earnings/(loss)$8.5$0.0$0.9$2.0($11.7)($0.3)Adjusted EBITDA$19.1$1.2$2.4$4.3($0.2)$26.8Purchases of property and equipment17.91.60.41.50%21.4Unlevered free cash flow (deficit)$1.2($0.4)$2.0$2.8($0.2)$5.4 Adjusted EBITDA margin40%15%33%57%39%Three Months Ended September 30, 2010 |
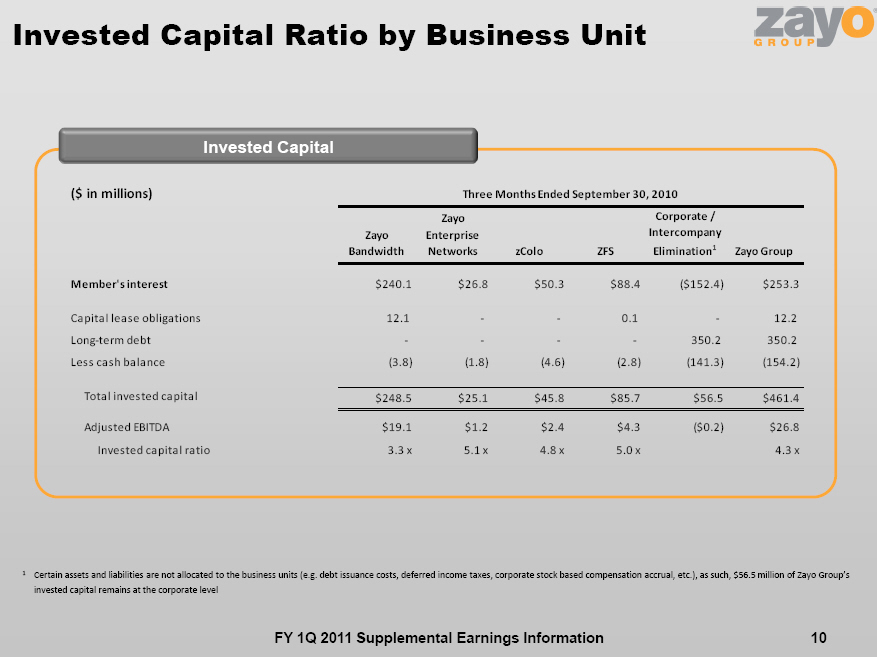
| Invested Capital Ratio by Business Unit 10FY 1Q 2011 Supplemental Earnings Information Invested Capital 1Certain assets and liabilities are not allocated to the business units (e.g. debt issuance costs, deferred income taxes, corporate stock based compensation accrual, etc.), as such, $56.5 million of Zayo Group’s invested capital remains at the corporate level($ in millions)Zayo BandwidthZayo Enterprise NetworkszColoZFSCorporate / Intercompany Elimination1Zayo GroupMember’s interest$240.1 $26.8 $50.3 $88.4 ($152.4)$253.3 Capital lease obligations 12.1 — - 0.1 — 12.2 Long-term debt — - - - - 350.2 350.2 Less cash balance (3.8) (1.8) (4.6) (2.8) (141.3) (154.2) Total invested capital$248.5 $25.1 $45.8 $85.7 $56.5 $461.4 Adjusted EBITDA$19.1 $1.2 $2.4 $4.3 ($0.2)$26.8 Invested capital ratio3.3 x5.1 x4.8 x5.0 x4.3 xThree Months Ended September 30, 2010 |

| Stratification of Revenue 11 $58.8 $59.7 $66.1 $0.4 $0.4 $0.5 $0.6 $0.6 $1.3 $0.1 $0.6 $0.7 $59.9 $61.4 $68.6 $0$10 $20 $30 $40 $50 $60 $70 Mar-10 Jun-10Sep-10 Revenue Stratification MRR and Usage Revenue excluding Amortization of Deferred Revenue Amortization of Deferred Revenue -Installs Amortization of Deferred Revenue -IRU Other Revenue $58.8 $59.7 $66.1 $0 $10 $20$30 $40 $50 $60 $70 Mar-10 Jun-10Sep-10 $0.4 $0.4 $0.5 $0.6 $0.6 $1.3 $1.0 $1.0 $1.8 $0.0 $0.5$1.0 $1.5 $2.0 $2.5 Mar-10 Jun-10 Sep-10 Amortization of Deferred Revenue Amortization of Deferred Revenue -InstallsAmortization of Deferred Revenue -IRU $0.5 $0.9$1.0 $0.4 $1.6 $0.1 $0.8 $2.6 $1.1 $0.0 $0.5$1.0 $1.5 $2.0 $2.5 $3.0 Mar-10 Jun-10Sep-10 Revenue Deferred Invoiced -Install Charges Invoiced -IRU charges $0.1 $0.6 $0.7 $0.0 $0.5 $1.0 $1.5 $2.0$2.5 Mar-10 Jun-10 Sep-10 Other Revenue millions millions millions millionsmillions FY 1Q 2011 Supplemental Earnings Information $19.6 $20.1 $22.3 $0$10 $20 $30 $40 $50 $60 $70 Mar-10 Jun-10Sep-10 MRR and Usage Revenue Excluding Amortization of Deferred Revenue millions MRR on the Last Day of the Quarter 1 1 Other revenue in the three months ending September 30, 2010 included $0.3 million of termination revenue and $0.3 million of non-recurring revenue. There were no asset sales $21.0 $21.7$24.4 $0.6 $0.6 $0.2 $0.4 $0.4 $1.6 ($0.0) $0.6 $0.6 $21.9 $23.3 $26.8 -$5 $0 $5$10 $15 $20 $25 Mar-10 Jun-10 Sep-10Adjusted EBITDA Stratification EBITDA excluding Amortization of Deferred Revenue and Adjustments Amortization of Deferred Revenue -Installs Amortization of Deferred Revenue -IRU EBITDA Associated with Other Revenue |

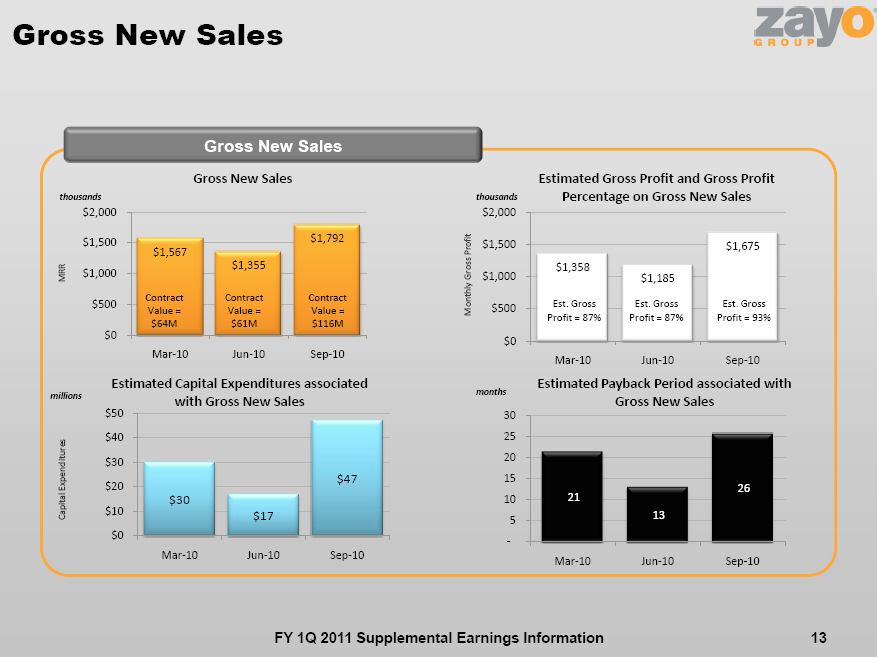
| Stratification of Adjusted EBITDA 12 $21.0 $21.7 $24.4 $0 $5$10 $15 $20 $25 Mar-10 Jun-10 Sep-10 millions millions $0.8 $1.1 $1.3-$1 $0 $1 $2 Mar-10 Jun-10 Sep-10 Capitalized Labor FY 1Q 2011 Supplemental Earnings Information millions Adjusted EBITDA excluding Amortization of Deferred Revenue and EBITDA Associated with Other Revenue $0.4 $0.4 $1.6 $0.6 $0.6 $0.2 $1.0 $1.0 $1.8 -$1 $0 $1 $2 Mar-10Jun-10 Sep-10 Amortization of Deferred Revenue millions Amortization of Deferred Revenue —IRU Amortization of Deferred Revenue -Installs millions ($0.0) $0.6 $0.6 -$1 $0 $1 $2 Mar-10 Jun-10Sep-10 Adjusted EBITDA Associated with Other Revenue 1 1 Adjusted EBITDA associated with other revenue includes EBITDA from other revenue. There were no asset sales $1,567 $1,355 $1,792 $0 $500 $1,000 $1,500 $2,000 Mar-10 Jun-10 Sep-10 Contract Value = $64M Contract Value = $61M Gross New Sales 13 FY 1Q 2011 Supplemental Earnings Information Gross New Sales $1,358 $1,185 $1,675 $0 $500 $1,000 $1,500 $2,000 Mar-10 Jun-10 Sep-10 Est. Gross Profit = 87% $30 $17 $47 $0 $10 $20 $30 $40 $50 Mar-10 Jun-10 Sep-10 21 13 26 — 5 10 15 20 25 30 Mar-10 Jun-10 Sep-10 Gross New Sales Estimated Gross Profit and Gross Profit Percentage on Gross New SalesEstimated Capital Expenditures associated with Gross New Sales Estimated Payback Period associated with Gross New Sales thousands thousands millions months MRR Monthly Gross Profit Capital Expenditures Est. Gross Profit = 87% Contract Value = $116M Est. Gross Profit = 93% |
| Stratification of Gross New Sales 14FY 1Q 2011 Supplemental Earnings Information Gross New Sales StratificationMarch 31,June 30,September 30,2010201020101.Network capacityGross New Sales ($ in thousands)$0$0$0Estimated Capital Expenditures on Gross New Sales ($ in millions)1.90.50.84%2.<12 Month PaybackGross New Sales ($ in thousands)$853$861$86455%Estimated Gross Profit % on Gross New Sales84%84%88%Estimated Capital Expenditures on Gross New Sales ($ in millions)1.51.61.75%Estimated Payback Period (in months)211Contract Value of Gross New Sales ($ in millions)22.524.431.73.>12 Month PaybackGross New Sales ($ in thousands)$302$235$13214%Estimated Gross Profit % on Gross New Sales78%94%99%Estimated Capital Expenditures on Gross New Sales ($ in millions)4.94.32.613%Estimated Payback Period (in months)211920Contract Value of Gross New Sales ($ in millions)12.211.37.04.Speculative ProjectsGross New Sales ($ in thousands)$49$0$01%Estimated Gross Profit % on Gross New Sales99%n/a100%Estimated Capital Expenditures on Gross New Sales ($ in millions)6.80.95.714%Estimated Payback Period (in months)n/an/an/aContract Value of Gross New Sales ($ in millions)2.60.00.05.FTT ProjectsGross New Sales ($ in thousands)$362$259$79530%Estimated Gross Profit % on Gross New Sales99%93%99%Estimated Capital Expenditures on Gross New Sales ($ in millions)14.69.436.065%Estimated Payback Period (in months)413846Contract Value of Gross New Sales ($ in millions)27.425.877.6Average % of prior three quartersThree months ended |

| Stratification of Speculative Projects FY 1Q 2011 Supplemental Earnings Information 15 Speculative Capital Expenditure Commitments($ in millions)March 31,June 30,September 30,201020102010Estimated Success Based Capital2.6$ -$2.9$ Estimated Speculative Capital4.1 0.9 2.9 Estimated Total Capital for Speculative Projects6.8$0.9$5.7$ By Category:Government StimulusEstimated Success Based Capital2.5$ -$2.9$ Estimated Speculative Capital3.8 — 2.9 Estimated Total Capital for Speculative Projects6.3$ -$5.7$ Opportunistic Network ExpansionsEstimated Success Based Capital-$ -$ -$ Estimated Speculative Capital0.3 0.9 — Estimated Total Capital for Speculative Projects0.3$0.9$ -$ Customer-Specific with Negative PaybackEstimated Success Based Capital0.1$ -$ -$ Estimated Speculative Capital0.1 — - Estimated Total Capital for Speculative Projects0.2$ -$ -$ OtherEstimated Success Based Capital-$ -$ -$ Estimated Speculative Capital- — - Estimated Total Capital for Speculative Projects-$ -$ -$ Three months ended |

| Quota Bearing Headcount (QBHC) FY 1Q 2011 Supplemental Earnings Information 16 Quota Bearing Headcount 37 36 43 0 10 20 30 40 50 Mar-10 Jun-10 Sep-10 $14$13 $14 $0 $5 $10 $15 Mar-10 Jun-10 Sep-10 Quota Bearing Headcount Monthly Average Gross New Salesper QBHC thousands Headcount Gross New Sales MRR |

| Installation and Churn 17 FY 1Q 2011 Supplemental Earnings Information Installation and Churn $1,032 $1,287 $1,580 $0 $400 $800 $1,200 $1,600 Mar-10 Jun-10 Sep-10 ($901) ($692) ($864) ($1,600) ($1,200) ($800) ($400) $0 Mar-10 Jun-10 Sep-10 Gross Profit = 79% $131 $595 $716 $0 $400 $800 $1,200 $1,600 Mar-10 Jun-10 Sep-10 $233 $592 $717 $0 $400 $800 $1,200 $1,600 Mar-10 Jun-10 Sep-10 Gross Installations Churn Monthly Recurring Revenue from Net Installations Gross Profit on Monthly Recurring Revenue from Net Installations thousands thousands thousands thousands Gross Profit = 87% Gross Profit = 89% Gross Profit = 74% MRR MRR MRR Monthly Gross Profit Gross Profit = 93% Gross Profit = 86% |

| Breakdown of Installations and Churn Installs and Churn 18 FY 1Q 2011 Supplemental Earnings Information $935 $1,030 $1,422 $38 $184 $106 $59 $73 $52 $1,032 $1,287 $1,580 $0 $200 $400 $600 $800 $1,000 $1,200 $1,400 $1,600 $1,800 Mar-10 Jun-10 Sep-10 Installations from New Serivce Installations from Price Increases Installations from Upgrades Gross Installations thousands 91% 6% 4% 80% 6% 14% ($784) ($576) ($707) ($76) ($44) ($120) ($41) ($73) ($37) $(901) $(692) $(864) ($1,800) ($1,600) ($1,400) ($1,200) ($1,000) ($800) ($600) ($400) ($200) $0 Mar-10 Jun-10 Sep-10 Hard Disconnects Churn from Negative Price Changes Churn associated with Upgrades Churn thousands 87% |

| 8% 5% 83% 6% 11% MRR MRR 100% 100% 100% 100% 90% 3% 7% 100% 82% 14% 4% 100% Churn = -1.6% Churn = -1.2% Churn = -1.3% |

| Price Changes Price Changes $38 $184 $106 $0 $50 $100 $150 $200 Mar-10 Jun-10 Sep-10 $1.5 $1.8 $5.7 $5.7 $1.5 $4.5 $7.1 $3.3 $10.2 $0 $2 $4 $6 $8 $10 $12 Mar-10 Jun-10 Sep-10 CV associated with Price Increases CV associated with Price Decreases ($76) ($44) ($120) ($200) ($150) ($100) ($50) $0 Mar-10 Jun-10 Sep-10 Price Increases Contract Value Associated with Price Changes Price Decreases thousands millions thousands Price Increase was 37% of affected MRR MRR Contract Value MRR Price Increase was 33% of affected MRR Price Decrease was -32% of affected MRR Price Decrease was -22% of affected MRR Price Increase was 31% of affected MRR Price Decrease was -12% of affected MRR ($38) $140 ($14) (50.00) - - 50.00 100.00 150.00 Mar-10 Jun-10 Sep-10 |
| Price Changes Net of Price Increases and Price Decreases thousands MRR 19 FY 1Q 2011 Supplemental Earnings Information |

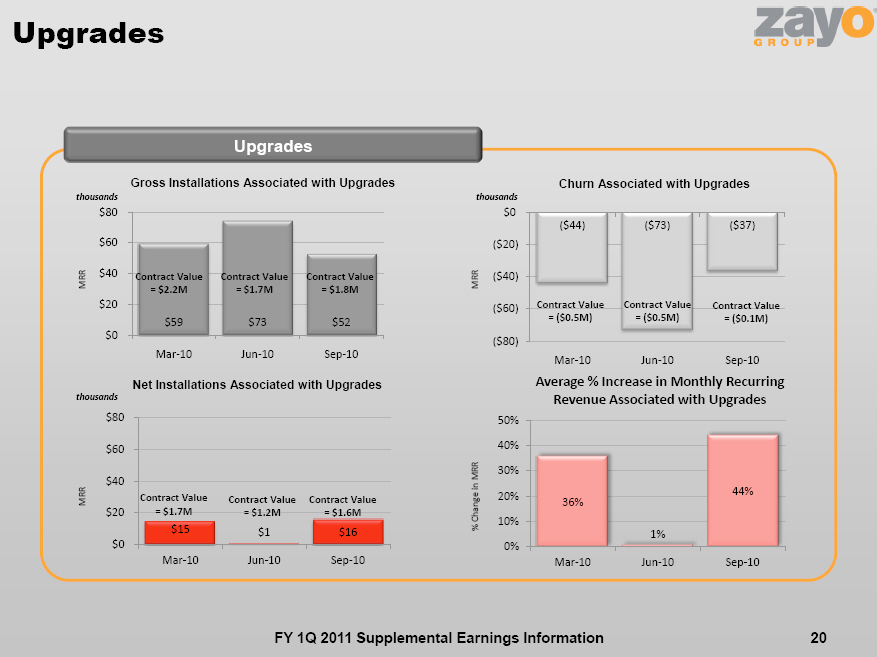
| Upgrades Upgrades $59 $73 $52 $0 $20 $40 $60 $80 Mar-10 Jun-10 Sep-10 ($44) ($73) ($37) ($80) ($60) ($40) ($20) $0 Mar-10 Jun-10 Sep-10 $15 $1 $16 $0 $20 $40 $60 $80 Mar-10 Jun-10 Sep-10 36% 1% 44% 0% 10% 20% 30% 40% 50% Mar-10 Jun-10 Sep-10 Gross Installations Associated with Upgrades Average % Increase in Monthly Recurring Revenue Associated with Upgrades thousands thousands thousands Contract Value = $2.2M Churn Associated with Upgrades Net Installations Associated with Upgrades Contract Value = $1.7M Contract Value = ($0.5M) Contract Value = ($0.5M) Contract Value = $1.7M Contract Value = $1.2M 20 FY 1Q 2011 Supplemental Earnings Information MRR MRR MRR % Change in MRR Contract Value = $1.8M Contract Value = ($0.1M) Contract Value = $1.6M $1.5 $1.6 $2.0 $0.7 $0.6 $0.7 $2.2 $2.3 $2.6 $0 $1 $2 $3 $4 Mar-10 Jun-10 Sep-10 Service Orders Revenue Commitment Service Activation and Churn Pipeline 21 FY 1Q 2011 Supplemental Earnings Information Service Activation and Churn Pipeline $1.7 $1.6 $1.6 $0.5 $0.6 $1.0 $2.2 $2.3 $2.6 $0 $1 $2 $3 $4 Mar-10 Jun-10 Sep-10 Delivery date within the next 6 months Delivery date after 6 months ($0.5) ($0.5) ($0.4) ($4) ($3) ($2) ($1) $0 Mar-10 Jun-10 Sep-10 $1.7 $1.8 $2.3 $0 $1 $2 $3 $4 Mar-10 Jun-10 Sep-10 Service Activation Pipeline Estimated Timing of Service Activation Pipeline Churn Pipeline Net Installation Pipeline millions millions millions Gross Profit = 92% MRR MRR MRR MRR 100% 22% 78% 100% 28% 72% millions 100% 39% 61% Gross Profit = 70% 1 Gross Profit = 94% Gross Profit = 97% 1The service activation pipeline on March 31, 2010 shows 78% of orders with a delivery date within the next 9 months and 22% of orders with a delivery date after the next 9 months |

| Gross Profit = 102% Gross Profit = 65% Gross Profit = 66% Gross Profit = 101% Gross Profit = 101% Revenue Under Contract 22 FY 1Q 2011 Supplemental Earnings Information Revenue Under Contract $390 $400 $577 $80 $95 $153 $57 $56 $65 $528 $552 $795 $0 $200 $400 $600 $800 $1,000 Mar-10 Jun-10 Sep-10 Embedded Base Service Activation Pipeline Revenue Commit Revenue Under Contract millions Months 24 25 32 — 5 10 15 20 25 30 35 Mar-10 Jun-10 Sep-10 Average Remaining Contract Term |

| Employee Data FY 1Q 2011 Supplemental Earnings Information 23 Employee Data 339 347 393 0 100 200 300 400 500 Mar-10 Jun-10 Sep-10 $706 $708 $698 $0 $200 $400 $600 $800 Mar-10 Jun-10 Sep-10 $10.7 $11.2 $12.4 $0 $2 $4 $6 $8 $10 $12 $14 Mar-10 Jun-10 Sep-10 $126 $129 $126 $0 $200 $400 $600 $800 Mar-10 Jun-10 Sep-10 Number of Employees Annualized Revenue per Employee Employee Related SG&A Annualized Employee Related SG&A per Employee thousands millions thousands % of Revenue = 18% Headcount Financial Statement Revenue SG&A SG&A % of Revenue = 18% % of Revenue = 18% |

| Customer Verticals and Product Mix 24 FY 1Q 2011 Supplemental Earnings Information Customer Verticals and Product MixZayo Group Customer VerticalsMarch 31,June 30,September 30,% of MRR201020102010Wireless27%28%29%National Carrier/ISP24%24%24%Public Sector/Enterprises16%15%14%PTT11%11%10%Regional Carrier/ISP6%6%6%RLEC5%5%5%CATV/Satellite4%4%5%Media/Content3%3%3%Reseller2%2%2%Data Centers/Disaster Recovery/Tech2%2%2%Zayo Group Product MixMarch 31,June 30,September 30,% of MRR201020102010Sonet/Digital Signal54%55%49%Ethernet11%11%12%Dark Fiber3%3%10%Wavelengths6%7%7%Colocation7%7%6%Access6%6%4%Interconnect5%5%4%Other3%3%3%Voice/Data Bundles2%2%2%DIA2%2%2% 1Period ending September 30, 2010 reflects $282K MRR transitioned from sonet/digital signal service to ethernet services for fiber to the tower site level billing modifications. Previously, balance of revenue commitments per site were billed through sonet/digital signal services, and are now reflected under ethernet. Adjustment had no impact to Zayo Bandwidth and Zayo Group reported financial statements 1 1 |

| Customer Concentration 25 FY 1Q 2011 Supplemental Earnings Information Customer Concentration |
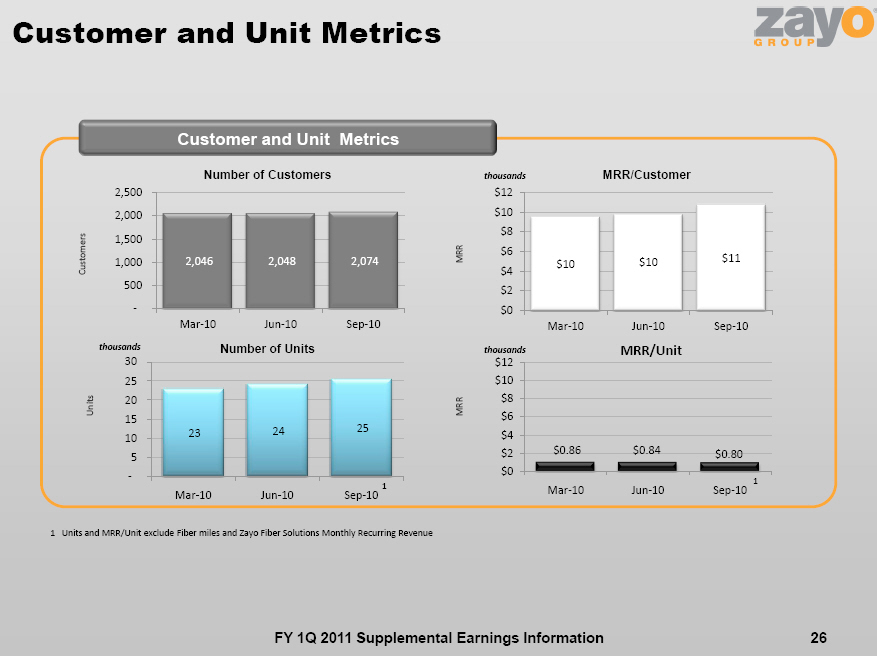
| 56% 55% 56% 0% 10% 20% 30% 40% 50% 60% 70% 80% 44% 44% 43% 34% 35% 34% 12% 12% 11% 9% 9% 9% 6% 7% 7% Mar-10 Jun-10 Sep-10 % of MRR Customer #1 Customer #2 Customer #3 Top 20 Top 10 Top 5 Customer and Unit Metrics Customer and Unit Metrics 2,046 2,048 2,074 — 500 1,000 1,500 2,000 2,500 Mar-10 Jun-10 Sep-10 23 24 25 — 5 10 15 20 25 30 Mar-10 Jun-10 Sep-10 $0.86 $0.84 $0.80 $0 $2 $4 $6 $8 $10 $12 Mar-10 Jun-10 Sep-10 Number of Customers Number of Units MRR/Unit 26 FY 1Q 2011 Supplemental Earnings Information Customers MRR MRR Units $10 $10 $11 $0 $2 $4 $6 $8 $10 $12 Mar-10 Jun-10 Sep-10 MRR/Customer thousands thousands thousands 1 1 1Units and MRR/Unit exclude Fiber miles and Zayo Fiber Solutions Monthly Recurring Revenue |

| Pricing Trends —Waves1 FY 1Q 2011 Supplemental Earnings Information 27 1Pricing trends for waves are Zayo Bandwidth only $931 $1,037 $1,287 $0 $1,000 $2,000 $3,000 Mar-10 Jun-10 Sep-10 10G Waves -MRR 108 122 137 0 40 80 120 160 Mar-10 Jun-10 Sep-10 10G Waves -Units $8.6 $8.5 $9.4 $0 $20 $40 $60 $80 Mar-10 Jun-10 Sep-10 10G Waves —MRR/Unit thousands MRR MRR thousands $332 $326 $359 $0 $1,000 $2,000 $3,000 Mar-10 Jun-10 Sep-10 2.5G Waves -MRR 34 35 37 0 40 80 120 160 Mar-10 Jun-10 Sep-10 2.5G Waves -Units $9.8 $9.3 $9.7 $0 $20 $40 $60 $80 Mar-10 Jun-10 Sep-10 2.5G Waves —MRR/Unit thousands MRR MRR thousands 3 |
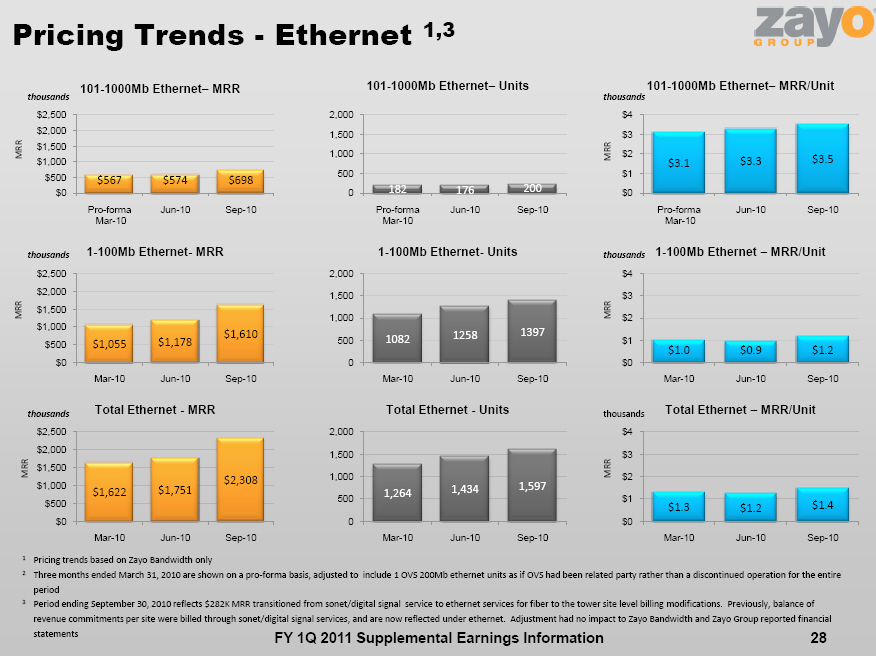
| Pricing Trends -Ethernet 1,3 FY 1Q 2011 Supplemental Earnings Information 28 $567 $574 $698 $0 $500 $1,000 $1,500 $2,000 $2,500 Pro-formaMar-10 Jun-10 Sep-10 101-1000Mb Ethernet—MRR 182 176 200 0 500 1,000 1,500 2,000 Pro-forma Mar-10 Jun-10 Sep-10 101-1000Mb Ethernet—Units $3.1 $3.3 $3.5 $0 $1 $2 $3 $4 Pro-formaMar-10 Jun-10 Sep-10 101-1000Mb Ethernet—MRR/Unit thousands MRR MRR thousands $1,055 $1,178 $1,610 $0 $500 $1,000 $1,500 $2,000 $2,500 Mar-10 Jun-10 Sep-10 1-100Mb Ethernet-MRR 1082 1258 1397 0 500 1,000 1,500 2,000 Mar-10 Jun-10 Sep-10 1-100Mb Ethernet-Units $1.0 $0.9 $1.2 $0 $1 $2 $3 $4 Mar-10 Jun-10 Sep-10 1-100Mb Ethernet —MRR/Unit thousands MRR MRR thousands $1,622 $1,751 $2,308 $0 $500 $1,000 $1,500 $2,000 $2,500 Mar-10 Jun-10 Sep-10 Total Ethernet -MRR 1,264 1,434 1,597 0 500 1,000 1,500 2,000 Mar-10 Jun-10 Sep-10 Total Ethernet -Units $1.3 $1.2 $1.4 $0 $1 $2 $3 $4 Mar-10 Jun-10 Sep-10 Total Ethernet —MRR/Unit thousands MRR MRR thousands 1Pricing trends based on Zayo Bandwidth only 2Three months ended March 31, 2010 are shown on a pro-forma basis, adjusted to include 1 OVS 200Mb ethernet units as if OVS had been related party rather than a discontinued operation for the entire period 3Period ending September 30, 2010 reflects $282K MRR transitioned from sonet/digital signal service to ethernet services for fiber to the tower site level billing modifications. Previously, balance of revenue commitments per site were billed through sonet/digital signal services, and are now reflected under ethernet. Adjustment had no impact to Zayo Bandwidth and Zayo Group reported financial statements |

| Pricing Trends —OC3, OC12, and OC481 FY 1Q 2011 Supplemental Earnings Information 29 $1,089 $1,081 $1,106 $0 $500 $1,000 $1,500 $2,000 $2,500 Mar-10 Jun-10 Sep-10 OC48 -MRR 80 76 78 0 100 200 300 400 Mar-10 Jun-10 Sep-10 OC48 -Units $13.6 $14.2 $14.2 $0 $5 $10 $15 Mar-10 Jun-10 Sep-10 OC48 —MRR/Unit thousands MRR MRR thousands $1,593 $1,748 $1,905 $0 $500 $1,000 $1,500 $2,000 $2,500 Mar-10 Jun-10 Sep-10 OC12 -MRR 223 248 282 0 100 200 300 400 Mar-10 Jun-10 Sep-10 OC12 -Units $7.1 $7.0 $6.8 $0 $5 $10 $15 Mar-10 Jun-10 Sep-10 OC12 —MRR/Unit thousands MRR MRR thousands $1,386 $1,399 $1,375 $0 $500 $1,000 $1,500 $2,000 $2,500 Mar-10 Jun-10 Sep-10 OC3 -MRR 364 368 362 0 100 200 300 400 Mar-10 Jun-10 Sep-10 OC3 -Units $3.8 $3.8 $3.8 $0 $5 $10 $15 Mar-10 Jun-10 Sep-10 OC3 —MRR/Unit thousands MRR MRR thousands 1Pricing trends based on Zayo Bandwidth only |

| Pricing Trends —DS1 and DS31 FY 1Q 2011 Supplemental Earnings Information 30 $3,969 $4,004 $3,963 $0 $1,000 $2,000 $3,000 $4,000 $5,000 Pro-forma Mar-10 Jun-10 Sep-10 DS3—MRR 3,410 3,440 3,359 0 2,000 4,000 6,000 8,000 10,000 Pro-forma Mar-10 Jun-10 Sep-10 DS3—Units $1.2 $1.2 $1.2 $0.0 $0.5 $1.0 $1.5 Pro-formaMar-10 Jun-10 Sep-10 DS3 —MRR/Unit thousands MRR MRR thousands $1,781 $1,952 $1,737 $0 $1,000 $2,000 $3,000 $4,000 $5,000 Pro-formaMar-10 Jun-10 Sep-10 DS1 —MRR 7,424 8,357 8,905 0 2,000 4,000 6,000 8,000 10,000 Pro-formaMar-10 Jun-10 Sep-10 DS1 —Units $0.2 $0.2 $0.2 $0.0 $0.5 $1.0 $1.5 Pro-forma Mar-10 Jun-10 Sep-10 DS1 —MRR/Unit thousands MRR MRR thousands 1Pricing trends based on Zayo Bandwidth only 2 Three months ended March 31, 2010 are shown on a pro-forma basis, adjusted to: include 3 OVS DS3 units and 255 OVS DS1 units as if OVS had been related party rather than a discontinued operation for the entire period 3Period ending September 30, 2010 reflects $282K MRR transitioned from sonet/digital signal service to ethernet services for fiber to the tower site level billing modifications. Previously, balance of revenue commitments per site were billed through sonet/digital signal services, and are now reflected under ethernet. Adjustment had no impact to Zayo Bandwidth and Zayo Group reported financial statements |

| 2 2 2 2 2 2 3 3 3 3 3 3 millions Purchases of Property and Equipment Purchases of Property and Equipment by Driver $15.1 $19.5 $20.4 $0.4 $0.4 $0.2 $0.8 $0.6 $0.4 $0.3 $1.1 $0.4 $16.7 $21.6 $21.4 $0 $5 $10 $15 $20 $25 Mar-10 Jun-10 Sep-10 Growth Maintenance Integration Other 31 FY 1Q 2011 Supplemental Earnings Information Capital Expenditures Purchases of Property and Equipment $0.4 $0.4 $0.2 $0.3 $1.1 $0.4 $0.7 $1.5 $0.6 $- $0.5 $1.0 $1.5 $2.0 $2.5 $3.0 Mar-10 Jun-10 Sep-10 Maintenance Other $0.8 $0.6 $0.4 $0.0 $0.5 $1.0 $1.5 $2.0 $2.5 $3.0 Mar-10 Jun-10 Sep-10 Maintenance and Other |

| Integration $13.5 $17.3 $19.2 $1.6 $2.2 $1.2 $15.1 $19.5 $20.4 $0 $5 $10 $15 $20 $25 Mar-10 Jun-10 Sep-10 Success Based Infrastructure Growth Capital Expenditures Capital Expenditures Capital Expenditures millions millions millions Network Metrics 32 FY 1Q 2011 Supplemental Earnings Information Network Metrics 20,172 20,409 21,584 — 5,000 10,000 15,000 20,000 25,000 Mar-10 Jun-10 Sep-10 532,428 538,810 753,089 0 200,000 400,000 600,000 800,000 Mar-10 Jun-10 Sep-10 2,256 2,418 3,103 — 500 1,000 1,500 2,000 2,500 3,000 3,500 Mar-10 Jun-10 Sep-10 141 143 146 — 50 100 150 200 Mar-10 Jun-10 Sep-10 Fiber Network -Route Miles Fiber Network -Fiber Miles Number of On-net Buildings Number of Markets Route Miles Fiber Miles On-Net Buildings # of Markets States = 26 + DC States = 27 + DC States = 27 + DC |
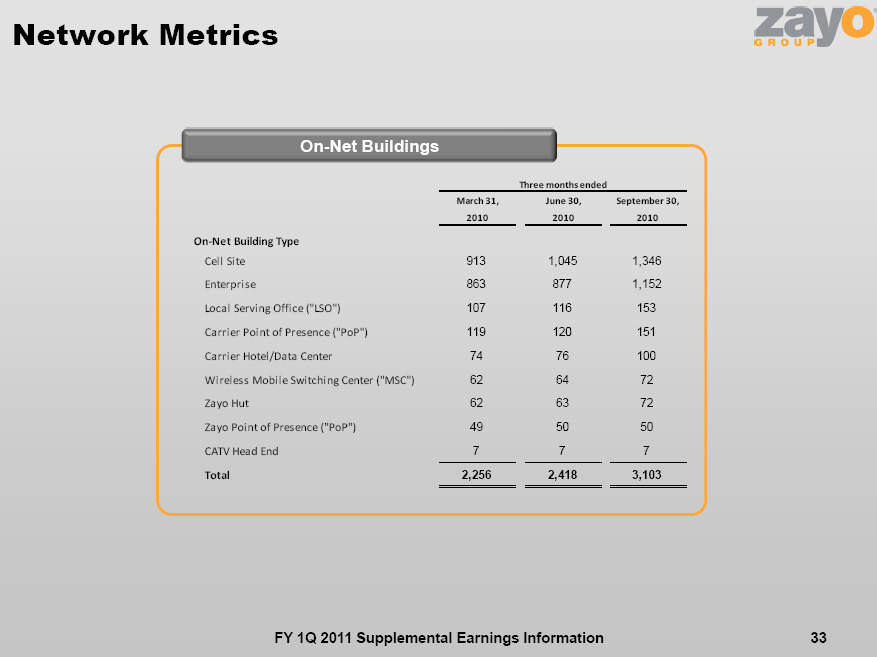
| Network Metrics 33 FY 1Q 2011 Supplemental Earnings Information On-Net BuildingsMarch 31,June 30,September 30,201020102010On-Net Building TypeCell Site9131,0451,346Enterprise8638771,152Local Serving Office (“LSO”)107116153Carrier Point of Presence (“PoP”)119120151Carrier Hotel/Data Center7476100Wireless Mobile Switching Center (“MSC”)626472Zayo Hut626372Zayo Point of Presence (“PoP”)495050CATV Head End777Total2,2562,4183,103Three months ended |

| Network Metrics 34 FY 1Q 2011 Supplemental Earnings Information Colocation Cabinet Utilization 39,949 41,091 50,091 — 10,000 20,000 30,000 40,000 50,000 60,000 Mar-10 Jun-10 Sep-10 1,598 1,642 2,004 0 500 1,000 1,500 2,000 2,500 Mar-10 Jun-10 Sep-10 1,330 1,327 1,361 — 500 1,000 1,500 Mar-10 Jun-10 Sep-10 Billable Colocation Square Feet Colocation Cabinet Equivalents Utilized Colocation Cabinet Equivalents Square Feet Colocation Cabinet Equivalents Colocation Cabinet Equivalents 83% Utilization 81% Utilization 68% Utilization |

| FY 1Q 2011 Supplemental Earnings Information 35 Fiber to the Tower |

| 1Bandwidth / Site excludes Dark Fiber Sites FTT Sites/Customer Metrics FTT Sites and Customer Metrics 856 913 1,045 1,346 487 552 564 872 1,343 1,465 1,609 2,218 — 500 1,000 1,500 2,000 2,500 Dec-09 Mar-10 Jun-10 Sep-10 In Service Under Construction 19 23 27 0 5 10 15 20 25 30 Dec-09 Mar-10 Jun-10 Sep-10 $1.9 $2.0 $2.1 $2.0 $0.0 $0.5 $1.0 $1.5 $2.0 $2.5 Dec-09 Mar-10 Jun-10 Sep-10 Total FTT Towers Bandwidth/Site (Mbs)1 Revenue/Tower & Revenue/Site thousands thousands 1,340 1,430 1,607 2,065 701 807 821 1,019 2,041 2,237 2,428 3,084 — 1,000 2,000 3,000 4,000 Dec-09 Mar-10 Jun-10 Sep-10 In Service Under Construction Customers/ Site = 1.6 36 FY 1Q 2011 Supplemental Earnings Information |

| $1.2 $1.2 $1.3 $1.3 Towers Sites MRR Mbs Customers/ Site = 1.5 Customers/ Site = 1.6 Not available Revenue/Tower Revenue/Site Total FTT sites Customers/ Site = 1.5 % of Zayo Group’s Wireless Carrier MRR1 34% 38% 41% 0% 10% 20% 30% 40% 50% Mar-10 Jun-10 Sep-10 Fiber to the Tower (FTT) Fiber to the Tower $1.8 $2.2 $2.6 $0 $20 $40 $60 $80 Mar-10 Jun-10 Sep-10 $41.8 $53.6 $65.3 $0 $20 $40 $60 $80 Mar-10 Jun-10 Sep-10 64% 62% 46% 36% 38% 49% 5% 0% 20% 40% 60% 80% 100% Mar-10 Jun-10 Sep-10 FTT Product Mix -% Private Line FTT Product Mix -% Dedicated Ethernet FTT Product Mix -% Dark Fiber FTT MRR FTT Cumulative Capital Expenditures FTT Product Mix millions millions 37 FY 1Q 2011 Supplemental Earnings Information % of MRR MRR % of MRR % of FTT MRR Capital Expenditures % of Zayo Group’s MRR 1 Zayo Group’s Wireless Carrier MRR was $5.2M on March 31, 2010 , $5.7M on June 30, 2010, and $6.6M on September 30, 2010 2Period ending September 30, 2010 reflects $282K MRR transitioned from sonet/digital signal service to ethernet services for fiber to the tower site level billing modifications. Previously, balance of revenue commitments per site were billed through sonet/digital signal services, and are now reflected under ethernet. Adjustment had no impact to Zayo Bandwidth and Zayo Group reported financial statements Contract Value = $113M Contract Value = $155M 9% 11% 12% Not available |

| FTT Markets FTT Markets |
| ·Mid-Atlanticincludes Washington D.C., Maryland, New Jersey, Virginia, West Virginia, and Pennsylvania |
| ·North Central includes Indiana, Minnesota, Kentucky, and Ohio |
| ·Southeast includes Tennessee and Georgia |
| ·Pacific Northwest includes Idaho and Washington |
| 38 FY 1Q 2011 Supplemental Earnings InformationMarch 31,June 30,September 30,201020102010In Service:Mid-Atlantic9913North Central459Southeast112Pacific Northwest011Total FTT Markets In Service141625Under Construction: Mid-Atlantic676North Central101011Pacific Northwest211Total FTT Markets Under Construction181818Total:Mid-Atlantic151619North Central141520Southeast112Pacific Northwest222Total FTT Markets323443 |

| FY 1Q 2011 Supplemental Earnings Information 39 Financial Data by Business Unit |
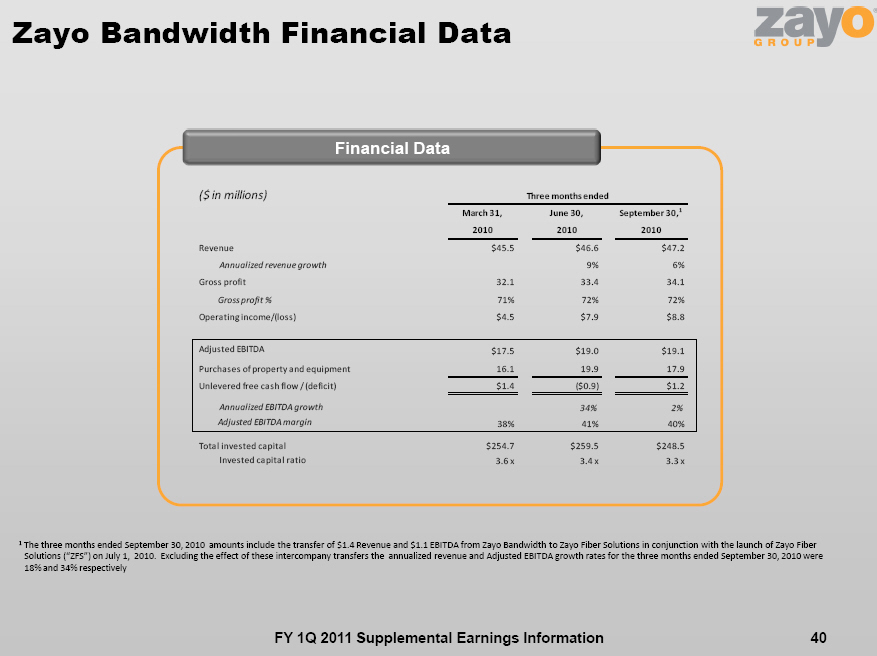
| Zayo Bandwidth Financial Data 40 Financial Data1The three months ended September 30, 2010 amounts include the transfer of $1.4 Revenue and $1.1 EBITDA from Zayo Bandwidth to Zayo Fiber Solutions in conjunction with the launch of Zayo Fiber Solutions (“ZFS”) on July 1, 2010. Excluding the effect of these intercompany transfers the annualized revenue and Adjusted EBITDA growth rates for the three months ended September 30, 2010 were 18% and 34% respectively FY 1Q 2011 Supplemental Earnings Information($ in millions)March 31,June 30,September 30,1201020102010Revenue$45.5 $46.6 $47.2 Annualized revenue growth9%6%Gross profit32.1 33.4 34.1 Gross profit %71%72%72%Operating income/(loss)$4.5 $7.9 $8.8 Adjusted EBITDA$17.5 $19.0 $19.1 Purchases of property and equipment16.1 19.9 17.9 Unlevered free cash flow / (deficit)$1.4 ($0.9)$1.2 Annualized EBITDA growth34%2% Adjusted EBITDA margin38%41%40%Total invested capital$254.7 $259.5 $248.5 Invested capital ratio3.6 x3.4 x3.3 xThree months ended |
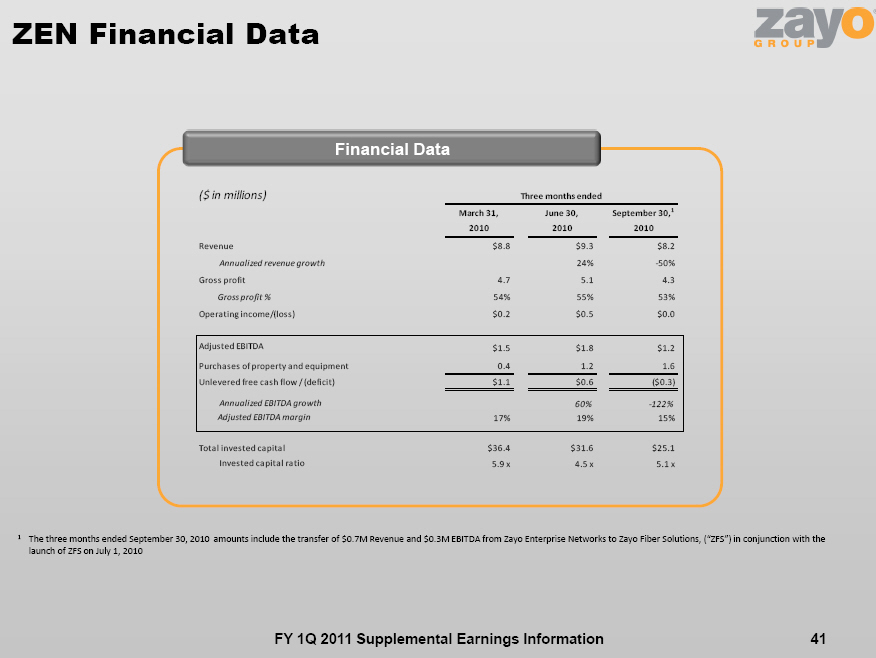
| ZEN Financial Data 41 FY 1Q 2011 Supplemental Earnings Information1The three months ended September 30, 2010 amounts include the transfer of $0.7M Revenue and $0.3M EBITDA from Zayo Enterprise Networks to Zayo Fiber Solutions, (“ZFS”) in conjunction with the launch of ZFS on July 1, 2010 ($ in millions)March 31,June 30,September 30,1201020102010Revenue$8.8 $9.3 $8.2 Annualized revenue growth24%-50%Gross profit4.7 5.1 4.3 Gross profit %54%55%53%Operating income/(loss)$0.2 $0.5 $0.0 Adjusted EBITDA$1.5 $1.8 $1.2 Purchases of property and equipment0.4 1.2 1.6 Unlevered free cash flow / (deficit)$1.1 $0.6 ($0.3)Annualized EBITDA growth60%-122% Adjusted EBITDA margin17%19%15%Total invested capital$36.4 $31.6 $25.1 Invested capital ratio5.9 x4.5 x5.1 xThree months ended Financial Data |

| zColo Financial Data FY 1Q 2011 Supplemental Earnings Information 42 Financial Data($ in millions)March 31,June 30,September 30,201020102010Revenue$6.9 $7.1 $7.2 Annualized revenue growth11%5%Gross profit3.6 3.7 3.6 Gross profit %52%52%50%Operating income/(loss)$1.0 $1.3 $1.0 Adjusted EBITDA$2.4 $2.6 $2.4 Purchases of property and equipment0.1 0.4 0.4 Unlevered free cash flow / (deficit)$2.3 $2.3 $2.0 Annualized EBITDA growth44%-38% Adjusted EBITDA margin34%37%33%Total invested capital$55.0 $47.4 $45.8 Invested capital ratio5.8 x4.5 x4.8 xThree months ended |

| ZFS Financial Data FY 1Q 2011 Supplemental Earnings Information43 Financial Data($ in millions)June 30,September 30,20102010Revenue$ — $7.5 Annualized revenue growth-Gross profit-7.4 Gross profit %-98%Operating income/(loss)-$2.0 Adjusted EBITDA-$4.3 Purchases of property and equipment-1.5 Unlevered free cash flow / (deficit)-$2.8 Annualized EBITDA growth- Adjusted EBITDA margin-57%Total invested capital-$85.7 Invested capital ratio-5.0 xThree months ended |
| FY 1Q 2011 Supplemental Earnings Information 44 HistoricalFinancial Data & Reconciliations |

| Consolidated Historical Financial Data 45 FY 1Q 2011 Supplemental Earnings Information($ in millions)Fiscal Year 2009Fiscal Year 2011September 30,December 31,March 31,June 30,September 30,Total2009200920102010Total2010Revenue$150.8 $45.5 $58.2 $58.9 $61.4 $224.0 $68.6 Annualized revenue growth50%112%5%17%49%47%Gross profit102.0 31.1 38.4 39.4 41.6 150.5 48.7 Gross profit %68%68%66%67%68%67%71%Operating income/(loss)$3.6 $4.3 $8.4 ($1.8)$6.5 $17.3 $9.1 Earnings/(loss) from continuing operations($9.3)$0.1 $2.9 ($11.4)$5.4 ($3.0)($0.3)Earnings from discontinued operations, net of income taxes7.0 1.5 1.1 0.6 0.2 3.4 0.0 Net earnings/ (loss)($2.2)$1.6 $4.1 ($10.8)$5.6 $0.5 ($0.3)Adjusted EBITDA, from continuing operations$40.5 $14.9 $19.6 $21.9 $23.3 $79.7 $26.8 Purchases of property and equipment62.1 11.7 9.8 16.7 21.6 59.8 21.4 Unlevered free cash flow (deficit)($21.6)$3.2 $9.8 $5.2 $1.7 $19.9 $5.4 Annualized EBITDA growth139%127%46%26%97%60% Adjusted EBITDA margin27%33%34%37%38%36%39%Fiscal Year 2010 Financial Data |

| Consolidated Historical Reconciliations 46 FY 1Q 2011 Supplemental Earnings Information($ in millions)Fiscal Year 2009Fiscal Year 2011September 30,December 31,March 31,June 30,September 30,Total2009200920102010Total2010Earnings/(loss) from continuing operations($9.3)$0.1 $2.9 ($11.4)$5.4 ($3.0)($0.3)Depreciation and amortization29.6 9.1 10.6 10.6 10.9 41.2 12.4 Interest expense (including loss on extinguishment of debt)15.2 3.6 3.2 10.3 7.4 24.6 6.3 Provision / (benefit) for income taxes(2.1)0.7 2.2 0.2 3.2 6.3 3.0 EBITDA, from continuing operations$33.4 $13.4 $18.9 $9.8 $26.9 $69.1 $21.4 Stock-based compensation6.4 0.9 0.6 11.8 5.0 18.2 5.2 Gain on bargain purchase of Fibernet Telecom, Inc.0.0 (0.0)(0.0)0.0 (9.1)(9.1)0.0 Transaction costs related to acquisitons0.7 0.6 0.1 0.2 0.5 1.4 0.2 Adjusted EBITDA, from continuing operations$40.5 $14.9 $19.6 $21.9 $23.3 $79.7 $26.8 Purchases of property and equipment62.1 11.7 9.8 16.7 21.6 59.8 21.4 Unlevered free cash flow (deficit)($21.6)$3.2 $9.8 $5.2 $1.7 $19.9 $5.4 Fiscal Year 2010Financial Data |

| 47 FY 1Q 2011 Supplemental Earnings Information Financial DataReconciliationZayo BandwidthZayo Enterprise NetworkszColoZFSCorporate / Interco EliminationZayo GroupEarnings/(loss) from continuing operations$8.5 $0.0 $0.9 $2.0 ($11.7)($0.3)Depreciation and amortization8.2 1.0 1.3 1.9 0.0 12.4 Interest expense (including loss on extinguishment of debt)0.3 0.0 0.1 0.0 5.9 6.3 Provision / (benefit) for income taxes0.0 0.0 0.0 0.0 3.0 3.0 EBITDA, from continuing operations$17.0 $1.0 $2.3 $3.9 ($2.8)$21.4 Stock-based compensation2.0 0.2 0.1 0.3 2.6 5.2 Transaction costs related to acquisitons0.1 0.0 0.0 0.1 (0.0)0.2 Adjusted EBITDA, from continuing operations$19.1 $1.2 $2.4 $4.3 ($0.2)$26.8 Purchases of property and equipment17.9 1.6 0.4 1.5 0.0 21.4 Unlevered free cash flow (deficit)$1.2 ($0.4)$2.0 $2.8 ($0.2)$5.4 Three months ended September 30, 2010 Financial Data |