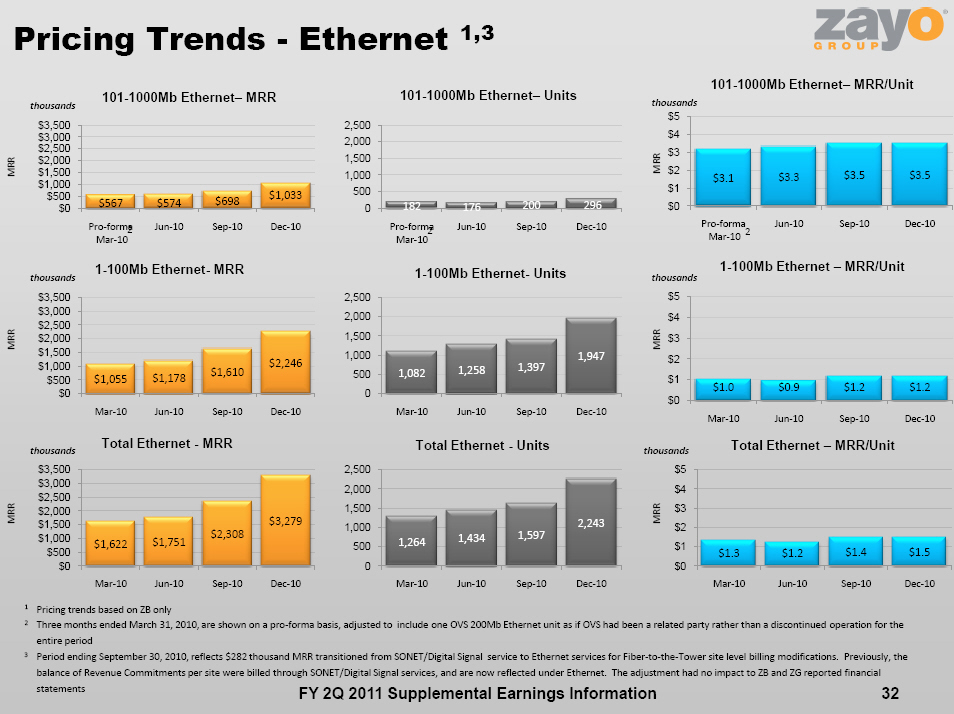
| Pricing Trends -Ethernet 1,3 FY 2Q 2011 Supplemental Earnings Information 32 $567 $574 $698 $1,033 $0 $500 $1,000 $1,500 $2,000 $2,500 $3,000 $3,500 Pro-formaMar-10 Jun-10 Sep-10 Dec-10 101-1000Mb Ethernet—MRR 182 176 200 296 0 500 1,000 1,500 2,000 2,500 Pro-forma Mar-10 Jun-10 Sep-10 Dec-10 101-1000Mb Ethernet—Units $3.1 $3.3 $3.5 $3.5 $0 $1 $2 $3 $4 $5 Pro-formaMar-10 Jun-10 Sep-10 Dec-10 thousands MRR MRR thousands $1,055 $1,178 $1,610 $2,246 $0 $500 $1,000 $1,500 $2,000 $2,500 $3,000 $3,500 Mar-10 Jun-10 Sep-10 Dec-10 1-100Mb Ethernet-MRR 1,082 1,258 1,397 1,947 0 500 1,000 1,500 2,000 2,500 Mar-10 Jun-10 Sep-10 Dec-10 1-100Mb Ethernet-Units $1.0 $0.9 $1.2 $1.2 $0 $1 $2 $3 $4 $5 Mar-10 Jun-10 Sep-10 Dec-10 thousands MRR MRR thousands $1,622 $1,751 $2,308 $3,279 $0 $500 $1,000 $1,500 $2,000 $2,500 $3,000 $3,500 Mar-10 Jun-10 Sep-10 Dec-10 Total Ethernet -MRR 1,264 1,434 1,597 2,243 0 500 1,000 1,500 2,000 2,500 Mar-10 Jun-10 Sep-10 Dec-10 Total Ethernet - -Units $1.3 $1.2 $1.4 $1.5 $0 $1 $2 $3 $4 $5 Mar-10 Jun-10 Sep-10 Dec-10 Total Ethernet —MRR/Unit thousands MRR MRR thousands 1Pricing trends based on ZB only 2Three months ended March 31, 2010, are shown on a pro-forma basis, adjusted to include one OVS 200Mb Ethernet unit as if OVS had been a related party rather than a discontinued operation for the entire period 3Period ending September 30, 2010, reflects $282 thousand MRR transitioned from SONET/Digital Signal service to Ethernet services for Fiber-to-the-Tower site level billing modifications. Previously, the balance of Revenue Commitments per site were billed through SONET/Digital Signal services, and are now reflected under Ethernet. The adjustment had no impact to ZB and ZG reported financial statements |