Exhibit 99.2

Forward-Looking Statements 2 FY 3Q 2012 Supplemental Earnings Information Information contained in this supplemental presentation that is not historical by nature constitutes “forward-looking statements” which can be identified by the use of forward-looking terminology such as “believes,” “expects,” “plans,” “intends,” “estimates,” “projects,” “could,” “may,” “will,” “should,” or “anticipates” or the negatives thereof, other variations thereon or comparable terminology, or by discussions of strategy. No assurance can be given that future results expressed or implied by the forward-looking statements will be achieved and actual results may differ materially from those contemplated by the forward-looking statements. Such statements are based on management’s current expectations and beliefs and are subject to a number of risks and uncertainties that could cause actual results to differ materially from those expressed or implied by the forward- looking statements. These risks and uncertainties include, but are not limited to, those relating to the Company’s financial and operating prospects, current economic trends, future opportunities, ability to retain existing customers and attract new ones, the Company’s acquisition strategy and ability to integrate acquired companies and assets, outlook of customers, and strength of competition and pricing. Other factors and risks that may affect our business and future financial results are detailed in our Annual Report on Form 10-K Item 1A: “Risk Factors.” We caution you not to place undue reliance on these forward-looking statements, which speak only as of their respective dates. We undertake no obligation to publicly update or revise forward-looking statements to reflect events or circumstances after releasing this supplemental information or to reflect the occurrence of unanticipated events, except as required by law.
Non-GAAP Financial Measures The Company provides financial measures that are not defined under generally accepted accounting principles in the United States, or GAAP, including earnings before interest, taxes, depreciation and amortization (“EBITDA”) and Adjusted EBITDA. EBITDA and Adjusted EBITDA are not measurements of our financial performance under GAAP and should not be considered in isolation or as alternatives to net income or any other performance measures derived in accordance with GAAP or as alternatives to cash flows from operating activities as measures of our liquidity. “Adjusted EBITDA” is defined as EBITDA from continuing operations adjusted to exclude transaction costs related to acquisitions, stock-based compensation, and certain non-cash items. Management uses Adjusted EBITDA to evaluate operating performance and liquidity and this financial measure is among the primary measures used by management for planning and forecasting of future periods. The Company believes Adjusted EBITDA is especially important in a capital-intensive industry such as telecommunications. The Company further believes that the presentation of Adjusted EBITDA is relevant and useful for investors because it allows investors to view results in a manner similar to the method used by management and makes it easier to compare our results with the results of other companies that have different financing and capital structures. Adjusted EBITDA has limitations as an analytical tool, and should not be considered in isolation from, or as a substitute for, analysis of our results as reported under GAAP. For example, Adjusted EBITDA: does not reflect capital expenditures, or future requirements for capital and major maintenance expenditures or contractual commitments; does not reflect changes in, or cash requirements for, our working capital needs; does not reflect the significant interest expense, or the cash requirements necessary to service the interest payments, on our debt; and does not reflect cash required to pay income taxes The Company’s computation of Adjusted EBITDA may not be comparable to other similarly titled measures computed by other companies, because all companies do not calculate Adjusted EBITDA in the same fashion. Because the Company has acquired numerous entities since inception and incurred transaction costs in connection with each acquisition, has borrowed money in order to finance operations, has used capital and intangible assets in the business, and because the payment of income taxes is necessary if taxable income is generated, any measure that excludes these items has material limitations. As a result of these limitations, Adjusted EBITDA should not be considered as a measure of discretionary cash available to invest in the growth of the business or as a measure of liquidity. In addition to Adjusted EBITDA, management uses Unlevered Free Cash Flow, which measures the ability of Adjusted EBITDA to cover capital expenditures. Gross profit, defined as revenue less operating costs, excluding depreciation and amortization, is used by management to assess profitability prior to selling, general and administrative expenses, stock-based compensation and depreciation and amortization. The Company also provides invested capital and the ratio of invested capital to Adjusted EBITDA. Management uses invested capital and the invested capital ratio to assess value creation in the business. Tables reconciling such non-GAAP measures are included in the Historical Financial Data & Reconciliations section of this presentation. A glossary of terms used throughout is available under the investor section of the Company’s website at http://www.zayo.com/investor-center. 3 FY 3Q 2012 Supplemental Earnings Information
Presentation of Certain Consolidated Pro-forma Financial Data 4 FY 3Q 2012 Supplemental Earnings Information Acquisitions have been, and are expected to continue to be, a component of the Company’s strategy. In this Supplemental Earnings Information under “Consolidated Pro-forma Financial Data,” the Company sets forth its pro-forma annualized revenue growth rate and pro-forma annualized Adjusted EBITDA growth rates for the two fiscal quarters impacted by the Company’s most recent acquisitions. These pro-forma measures are intended to provide additional information regarding such rates of growth on a more comparable basis than would be provided without such pro- forma adjustments. With regard to the recent acquisitions that impact the financial data reported within this supplemental earnings presentation (i.e. 360networks Holdings (USA), Inc. (“360networks”) and Mercury Marquis Holdings, LLC (“MarquisNet”)) the Company has calculated its pro-forma annualized revenue growth rate and pro-forma annualized Adjusted EBITDA growth rates in the quarter ended December 31, 2011, by adjusting the actual operating results as if the 360networks and MarquisNet acquisitions occurred on October 1, 2011. In making such adjustments, the Company made certain pro-forma adjustments to the revenue and Adjusted EBITDA of the acquired entities, which principally include an adjustment related to the fair value of the acquired deferred revenue balance, but do not include cost savings and other synergies that were only realized following completion of the acquisition. See “Consolidated Historical Reconciliations.” The Company provided the pro-forma annualized revenue growth rate and pro-forma annualized Adjusted EBITDA growth rate only for the fiscal quarters ended March 31, 2012 and December 31, 2011 on the slide entitled “Consolidated Financial Data.” Similarly, the company presents pro-forma annualized revenue and pro-forma annualized Adjusted EBITDA growth rates for its operating segments. The calculation of the pro-forma growth rates includes both the impact of the aforementioned acquisitions and the impact of transfers between the segments. The pro-forma growth rates, if applicable to the business unit, are presented for the fiscal quarters ended March 31, 2011, December 31, 2011, and March 31, 2012 on slides entitled: “Zayo Bandwidth Financial Data”; “ZFS Financial Data”; and “zColo Financial Data” within the “Financial Data by Business Unit” section of this supplemental earnings presentation.
Other Notes Operating Measures This earnings supplement contains operating measures used by the Company in managing the business. Management believes that providing this information enables analysts, investors ,and others to obtain a better understanding of the Company’s operating performance and to evaluate the efficacy of the methodology and information used by management to evaluate and measure such performance on a standalone and comparative basis. Certain supplemental information provided and related definitions may not be directly comparable to similarly titled items reported by other companies. Further, the Company may, from time to time, revise the calculation or presentation of certain operating measures. For the three months ended March 31, 2011 the Company changed the payback period calculation to include non-recurring network expense. Payback period is defined as the period of time (measured in months) in which the gross profit for a gross new sale is equivalent to the estimated capital expenditures and non-recurring network expense less non-recurring revenue related to the gross new sale booking. The payback period is an approximation of the return on a gross new sale booking and does not include sales costs, allocation of indirect operating expenses, depreciation and amortization, or any cost of capital. Prior periods were not revised. The company changed the treatment of Ethernet upgrades in the three months ended June 30, 2011. When a customer increases the amount of Mbs. at the same location, only the net increase in revenue is counted as gross new sales (bookings) and gross installations. In prior periods, the full value of the install and full value of the churn were reported. Prior periods were not revised. Revisions Certain prior period operating measures have been revised to reflect corrections or reclassifications of data. These revisions are not material and have no impact on the Company’s reported financial results. Estimates Certain operating measures presented herein are based on estimates. The measures are noted as estimates where presented and include: (1) estimated gross profit on gross new sales (bookings); (2) estimated capital expenditures associated with gross new sales (bookings); (3) estimated payback period on gross new sales (bookings )(calculated); (4) estimated commitments of speculative capital expenditures; and (5) estimated timing of service activation pipeline conversion. Rounding Components may not sum due to rounding. 5 FY 3Q 2012 Supplemental Earnings Information

6:
Recent 8-K Filings Change in the Company’s Independent Registered Public Accounting Firm On May 3rd, 2012, the Company made a filing on Form 8-K with the Securities and Exchange Commission (“SEC”) which announced that the Company has dismissed Grant Thornton LLP as the Company’s independent registered public accounting firm effective upon the issuance of the Company’s Quarterly Report for the quarter ended March 31, 2012. The same filing announced that the Company has engaged KPMG LLP to complete the audit of the Company’s fiscal 2012 financial statements. There were no disagreements between the Company and Grant Thornton on any matter of accounting principles or practices, financial statement disclosure or auditing scope or procedures. Restatement of Historical Financial Information On May 9, 2012, the Company made a filing on Form 8-K with the SEC which announced an error in its accounting for the Company’s acquisition of FiberNet. On May 7, 2012, the Company concluded that as a result of the identification of an error in accounting for the business combination that occurred during the fiscal year ended June 30, 2010, the Company’s annual financial statements for the fiscal years ended June 30, 2011 (“fiscal 2011”) and 2010 (“fiscal 2010”), the Company’s interim Financial Statements for each of the periods in fiscal 2011, as of and for the periods ended September 30, 2011 and December 31, 2011 should be restated and accordingly can no longer be relied upon. The Company intends to file an amended Annual Report on Form 10-K/A for the fiscal year ended June 30, 2011 and amended Quarterly Reports on Form 10-Q/A for the quarters ended September 30, 2011 and December 31, 2011 as soon as they can be made available. The restatement will also delay the issuance of the Company’s Quarterly Report on Form 10-Q for the quarter ended March 31, 2012. The error relates to the calculation of the deferred tax assets acquired in the FiberNet acquisition. The error arose from a mathematical error on the stub period tax return of FiberNet which covered the period January 1, 2009 through September 9, 2009. The mathematical error in the stub period tax return resulted in an overstatement of the tax deduction associated with the exercise of warrants that had previously been issued to a landlord of FiberNet. In purchase accounting, management utilized the overstated net operating loss carryforward included on the stub period return when determining the value to ascribe to the deferred tax assets and the resulting gain on bargain purchase. The Company intends to restate the financial statements identified above in order to correct the error. The misstatement does not impact operating income or cash flows from operating, investing or financing activities for any of the periods impacted by the misstatement. FY 3Q 2012 Supplemental Earnings Information 6
7:
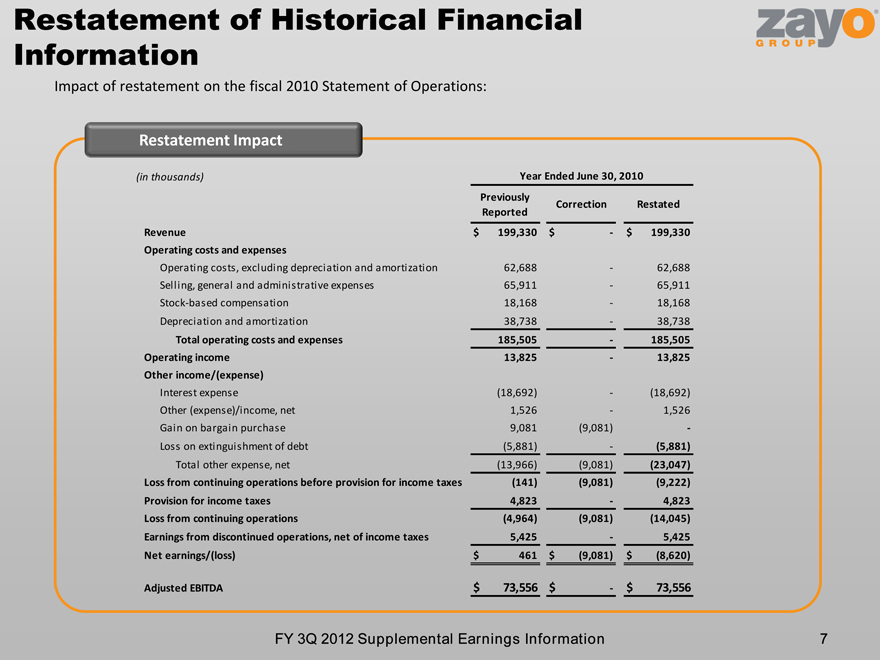
Restatement of Historical Financial Information Impact of restatement on the fiscal 2010 Statement of Operations: FY 3Q 2012 Supplemental Earnings Information 7 Restatement Impact
(in thousands) Year Ended June 30, 2010
Previously Correction Restated
Reported
Revenue $ 199,330 $—$ 199,330
Operating costs and expenses
Operating costs, excluding depreciation and amortization 62,688 — 62,688
Selling, general and administrative expenses 65,911 — 65,911
Stock-based compensation 18,168 — 18,168
Depreciation and amortization 38,738 — 38,738
Total operating costs and expenses 185,505 — 185,505
Operating income 13,825 — 13,825
Other income/(expense)
Interest expense (18,692) — (18,692)
Other (expense)/income, net 1,526 — 1,526
Gain on bargain purchase 9,081 (9,081) -
Loss on extinguishment of debt (5,881) — (5,881)
Total other expense, net (13,966) (9,081) (23,047)
Loss from continuing operations before provision for income taxes (141) (9,081) (9,222)
Provision for income taxes 4,823 — 4,823
Loss from continuing operations (4,964) (9,081) (14,045)
Earnings from discontinued operations, net of income taxes 5,425 — 5,425
Net earnings/(loss) $ 461 $ (9,081) $ (8,620)
Adjusted EBITDA $ 73,556 $—$ 73,556
8:
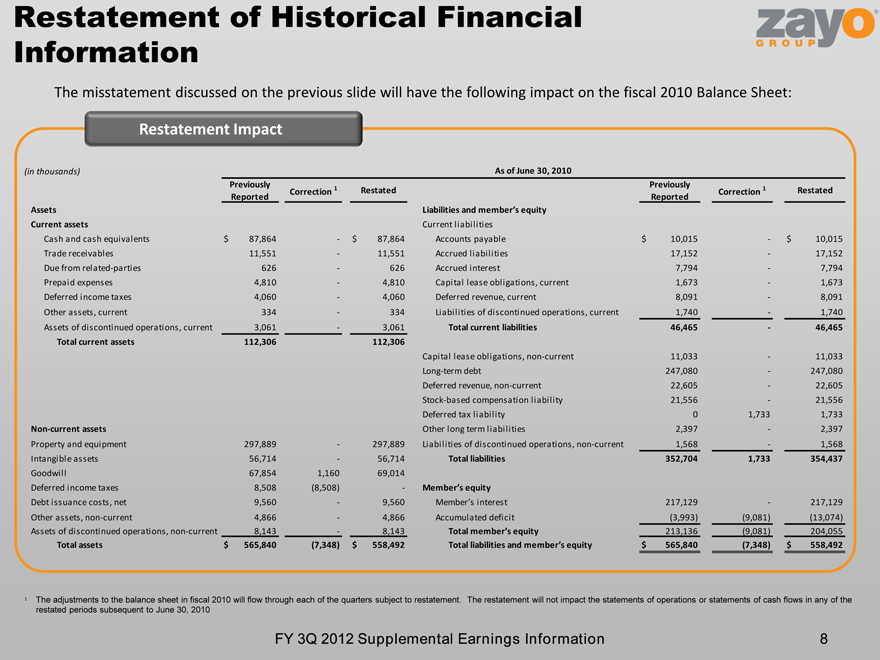
Restatement of Historical Financial Information The misstatement discussed on the previous slide will have the following impact on the fiscal 2010 Balance Sheet: FY 3Q 2012 Supplemental Earnings Information 8 1 The adjustments to the balance sheet in fiscal 2010 will flow through each of the quarters subject to restatement. The restatement will not impact the statements of operations or statements of cash flows in any of the restated periods subsequent to June 30, 2010 Restatement Impact
(in thousands) As of June 30, 2010
Previously Previously
Correction 1 Restated Correction 1 Restated
Reported Reported
Assets >
Current assets Current liabilities
Cash and cash equivalents $ 87,864—$ 87,864 Accounts payable $ 10,015—$ 10,015
Trade receivables 11,551—11,551 Accrued liabilities 17,152— 17,152
Due from related-parties 626—626 Accrued interest 7,794— 7,794
Prepaid expenses 4,810—4,810 Capital lease obligations, current 1,673— 1,673
Deferred income taxes 4,060—4,060 Deferred revenue, current 8,091— 8,091
Other assets, current 334—334 Liabilities of discontinued operations, current 1,740— 1,740
Assets of discontinued operations, current 3,061—3,061 Total current liabilities 46,465— 46,465
Total current assets 112,306 112,306
Capital lease obligations, non-current 11,033— 11,033
Long-term debt 247,080— 247,080
Deferred revenue, non-current 22,605— 22,605
Stock-based compensation liability 21,556— 21,556
Deferred tax liability 0 1,733 1,733
Non-current assets Other long term liabilities 2,397— 2,397
Property and equipment 297,889—297,889 Liabilities of discontinued operations, non-current 1,568— 1,568
Intangible assets 56,714—56,714 Total liabilities 352,704 1,733 354,437
Goodwill 67,854 1,160 69,014
Deferred income taxes 8,508 (8,508)—D
Debt issuance costs, net 9,560—9,560 D 217,129— 217,129
Other assets, non-current 4,866—4,866 Accumulated deficit (3,993) (9,081) (13,074)
Assets of discontinued operations, non-current 8,143—8,143 d 213,136 (9,081) 204,055
Total assets $ 565,840 (7,348) $ 558,492 d $ 565,840 (7,348) $ 558,492
9:
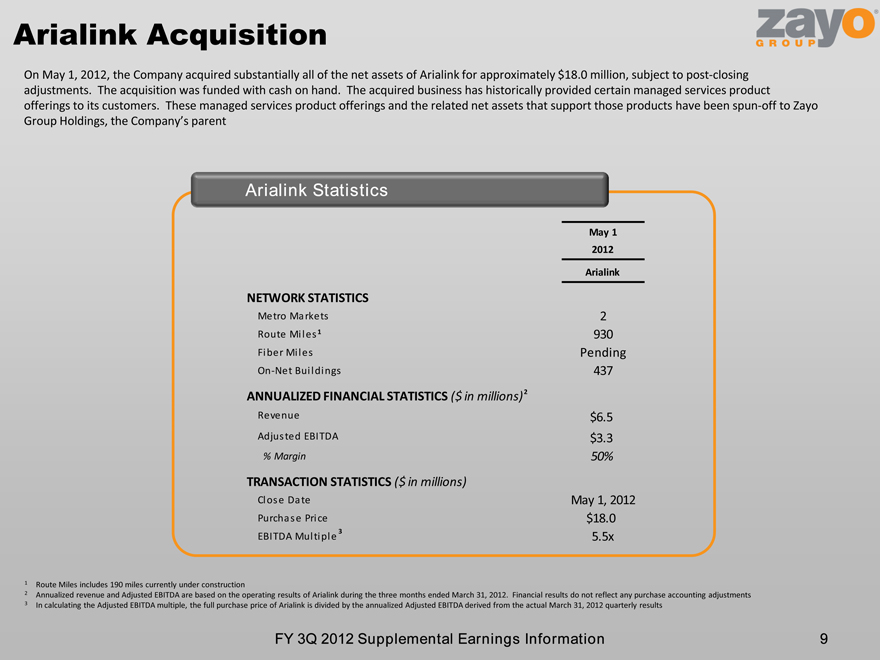
Arialink Acquisition 9 FY 3Q 2012 Supplemental Earnings Information Arialink Statistics On May 1, 2012, the Company acquired substantially all of the net assets of Arialink for approximately $18.0 million, subject to post-closing adjustments. The acquisition was funded with cash on hand. The acquired business has historically provided certain managed services product offerings to its customers. These managed services product offerings and the related net assets that support those products have been spun-off to Zayo Group Holdings, the Company’s parent 1 Route Miles includes 190 miles currently under construction 2 Annualized revenue and Adjusted EBITDA are based on the operating results of Arialink during the three months ended March 31, 2012. Financial results do not reflect any purchase accounting adjustments 3 In calculating the Adjusted EBITDA multiple, the full purchase price of Arialink is divided by the annualized Adjusted EBITDA derived from the actual March 31, 2012 quarterly results 1 2 3
10:
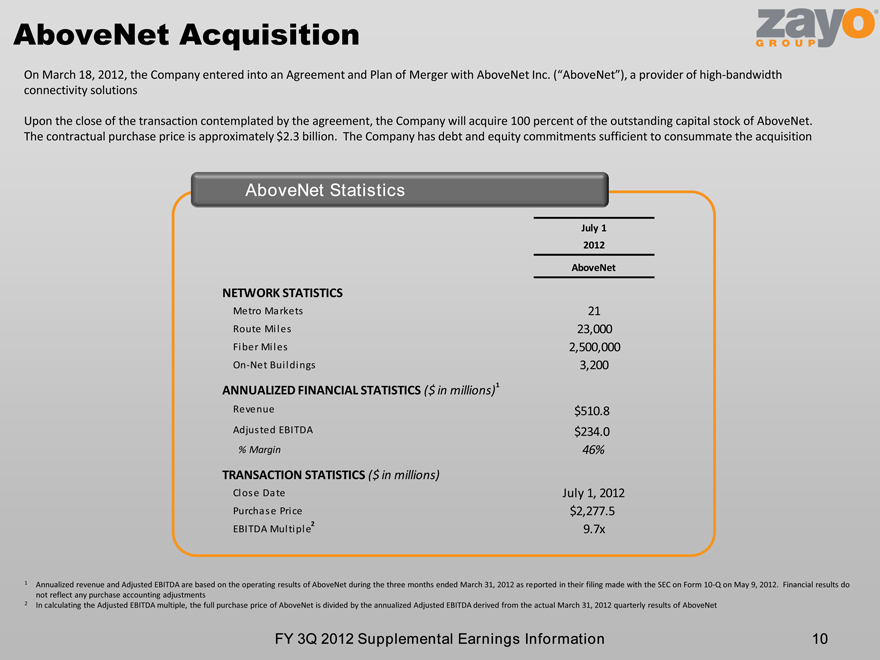
AboveNet Acquisition 10 FY 3Q 2012 Supplemental Earnings Information AboveNet Statistics On March 18, 2012, the Company entered into an Agreement and Plan of Merger with AboveNet Inc. (“AboveNet”), a provider of high-bandwidth connectivity solutions Upon the close of the transaction contemplated by the agreement, the Company will acquire 100 percent of the outstanding capital stock of AboveNet. The contractual purchase price is approximately $2.3 billion. The Company has debt and equity commitments sufficient to consummate the acquisition 1 Annualized revenue and Adjusted EBITDA are based on the operating results of AboveNet during the three months ended March 31, 2012 as reported in their filing made with the SEC on Form 10-Q on May 9, 2012. Financial results do not reflect any purchase accounting adjustments 2 In calculating the Adjusted EBITDA multiple, the full purchase price of AboveNet is divided by the annualized Adjusted EBITDA derived from the actual March 31, 2012 quarterly results of AboveNet 1 2
11:
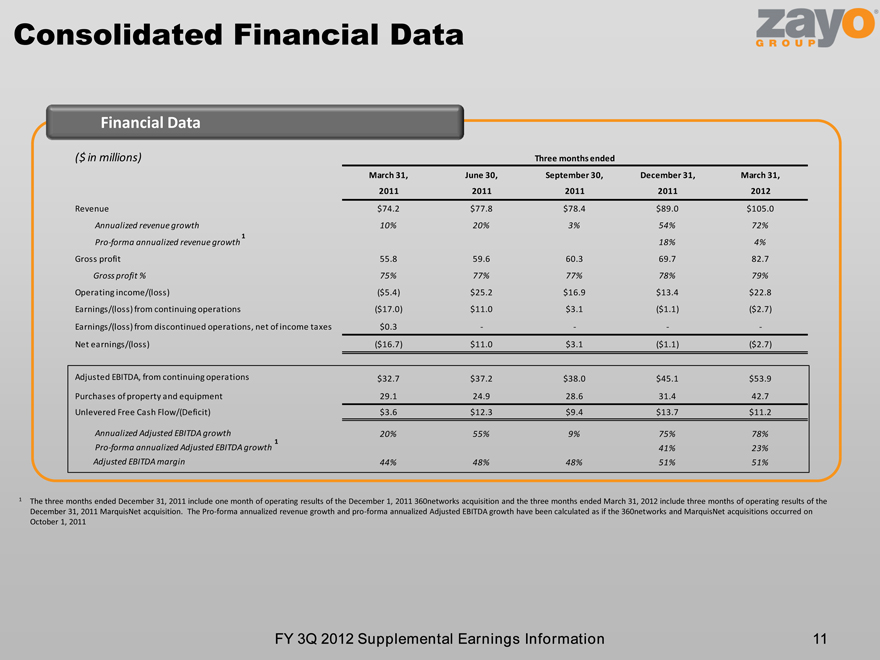
Consolidated Financial Data 11 FY 3Q 2012 Supplemental Earnings Information Financial Data 1 The three months ended December 31, 2011 include one month of operating results of the December 1, 2011 360networks acquisition and the three months ended March 31, 2012 include three months of operating results of the December 31, 2011 MarquisNet acquisition. The Pro-forma annualized revenue growth and pro-forma annualized Adjusted EBITDA growth have been calculated as if the 360networks and MarquisNet acquisitions occurred on October 1, 2011 1 1
12:
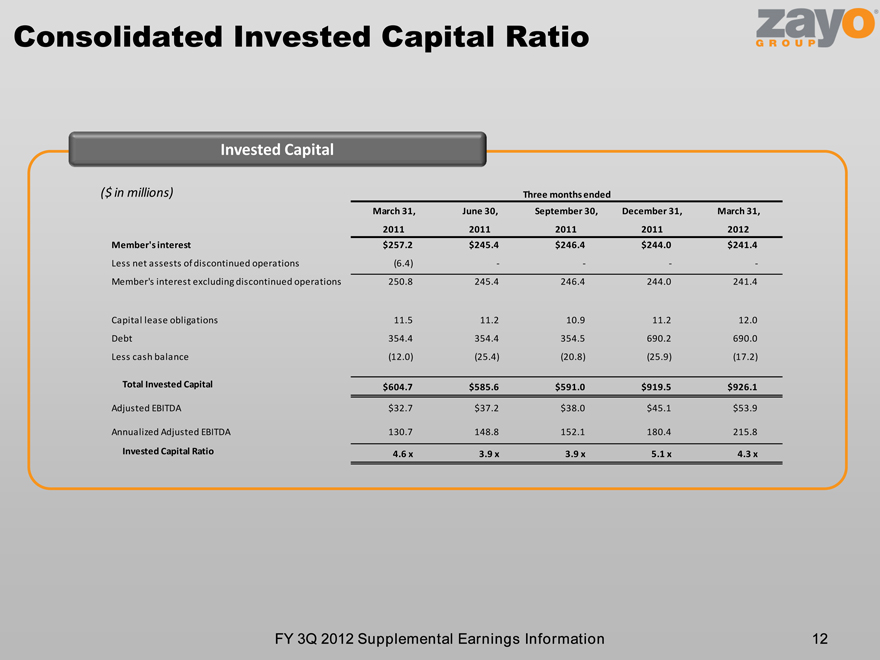
Consolidated Invested Capital Ratio 12 FY 3Q 2012 Supplemental Earnings Information Invested Capital
13:
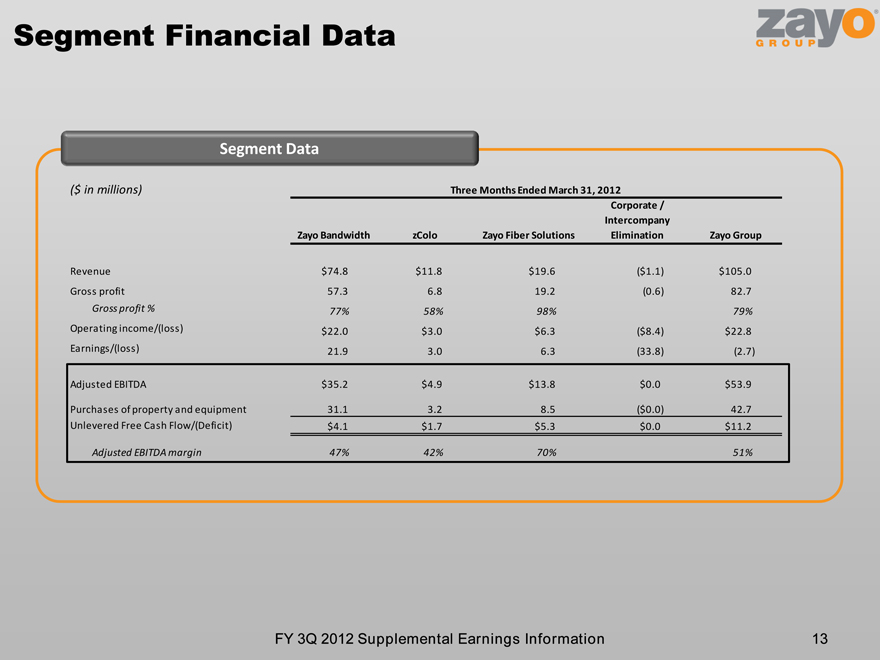
Segment Financial Data 13 FY 3Q 2012 Supplemental Earnings Information Segment Data
14:
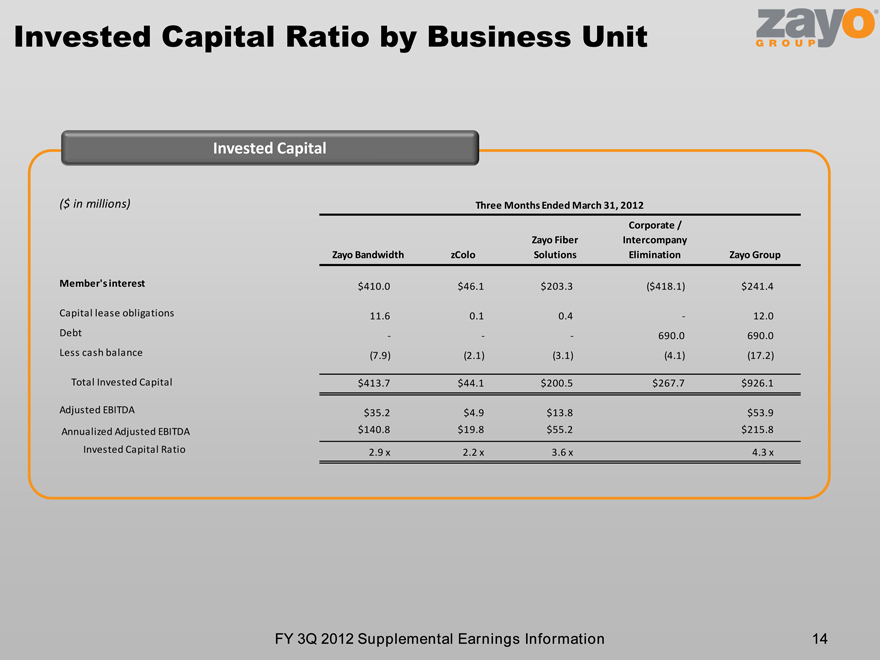
Invested Capital Ratio by Business Unit 14 FY 3Q 2012 Supplemental Earnings Information Invested Capital
15:
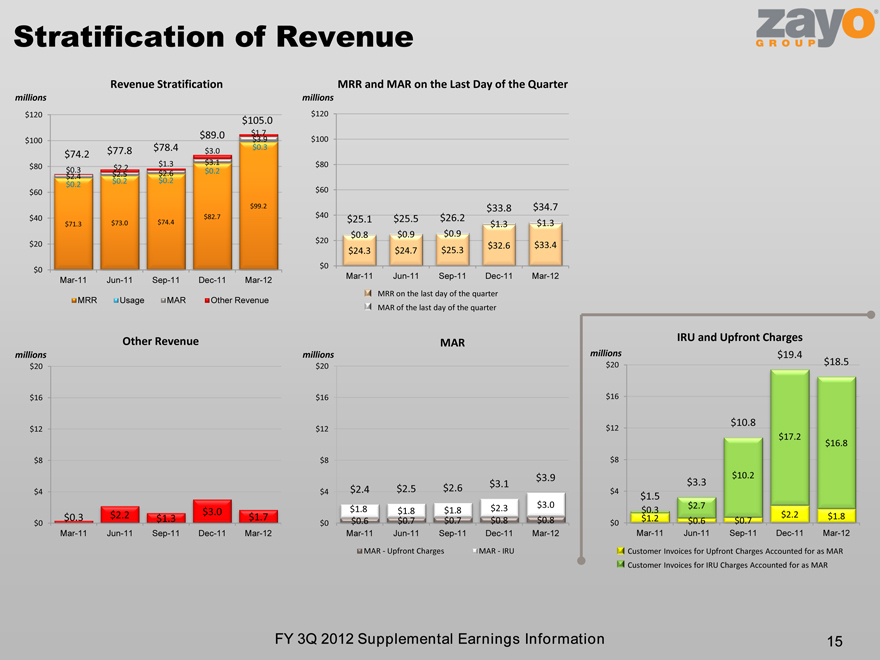
Stratification of Revenue 15 millions millions millions millions MRR and MAR on the Last Day of the Quarter MRR on the last day of the quarter MAR of the last day of the quarter millions Revenue Stratification FY 3Q 2012 Supplemental Earnings Information
16:
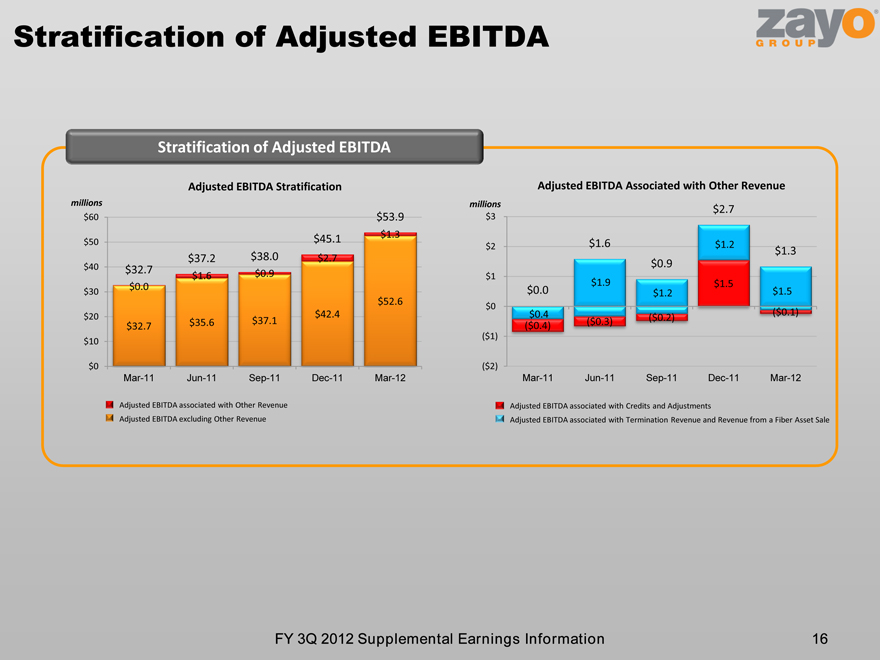
Stratification of Adjusted EBITDA 16 millions FY 3Q 2012 Supplemental Earnings Information millions Adjusted EBITDA Associated with Other Revenue Stratification of Adjusted EBITDA Adjusted EBITDA Stratification Adjusted EBITDA associated with Credits and Adjustments Adjusted EBITDA associated with Termination Revenue and Revenue from a Fiber Asset Sale Adjusted EBITDA associated with Other Revenue Adjusted EBITDA excluding Other Revenue
17:
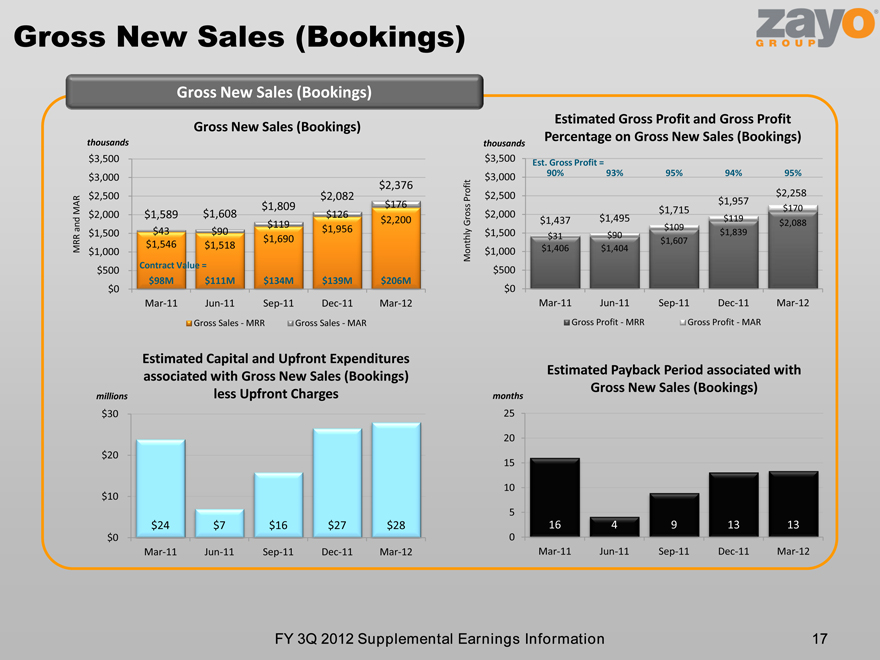
Gross New Sales (Bookings) 17 FY 3Q 2012 Supplemental Earnings Information Gross New Sales (Bookings) Gross New Sales (Bookings) Estimated Gross Profit and Gross Profit Percentage on Gross New Sales (Bookings) Estimated Capital and Upfront Expenditures associated with Gross New Sales (Bookings) less Upfront Charges Estimated Payback Period associated with Gross New Sales (Bookings) thousands thousands millions months MRR and MAR Monthly Gross Profit Est. Gross Profit = Contract Value =
18:
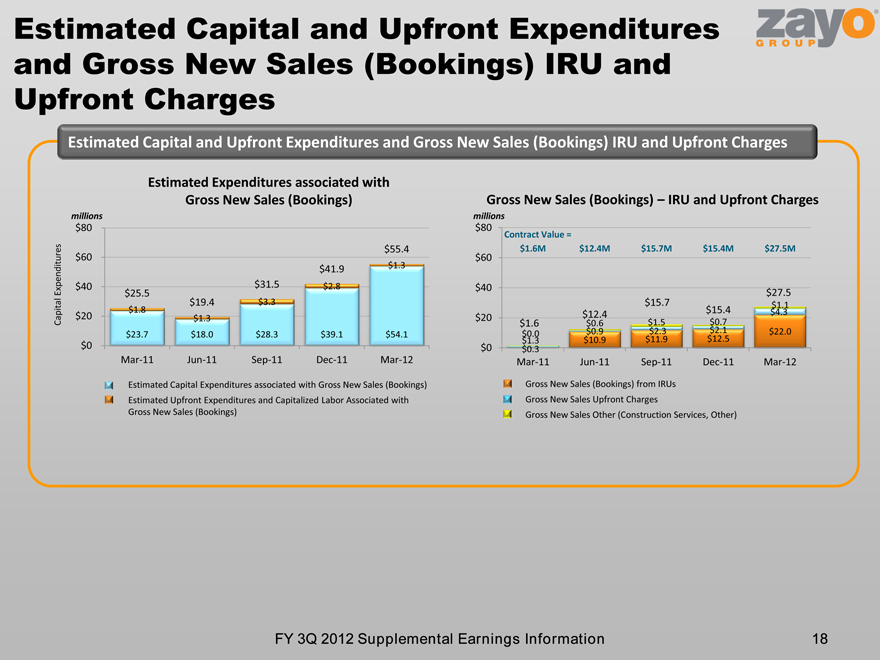
18 FY 3Q 2012 Supplemental Earnings Information Estimated Capital and Upfront Expenditures and Gross New Sales (Bookings) IRU and Upfront Charges Contract Value = Gross New Sales (Bookings) – IRU and Upfront Charges Gross New Sales (Bookings) from IRUs Gross New Sales Upfront Charges Gross New Sales Other (Construction Services, Other) millions Estimated Expenditures associated with Gross New Sales (Bookings) millions Capital Expenditures Estimated Capital and Upfront Expenditures and Gross New Sales (Bookings) IRU and Upfront Charges Estimated Capital Expenditures associated with Gross New Sales (Bookings) Estimated Upfront Expenditures and Capitalized Labor Associated with Gross New Sales (Bookings)
19:
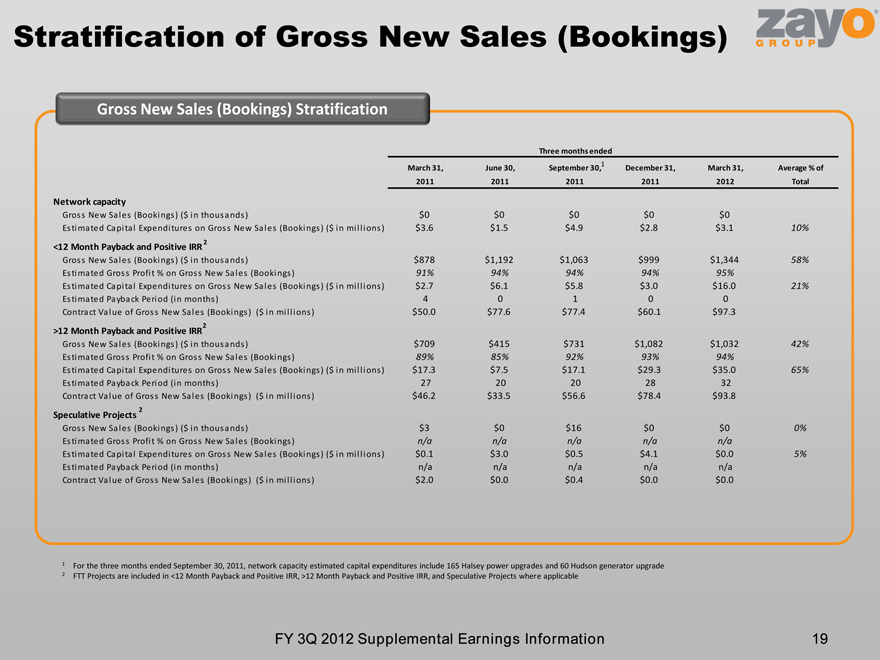
Stratification of Gross New Sales (Bookings) 19 FY 3Q 2012 Supplemental Earnings Information Gross New Sales (Bookings) Stratification 1 For the three months ended September 30, 2011, network capacity estimated capital expenditures include 165 Halsey power upgrades and 60 Hudson generator upgrade 2 FTT Projects are included in <12 Month Payback and Positive IRR, >12 Month Payback and Positive IRR, and Speculative Projects where applicable 1 2 2 2
20:
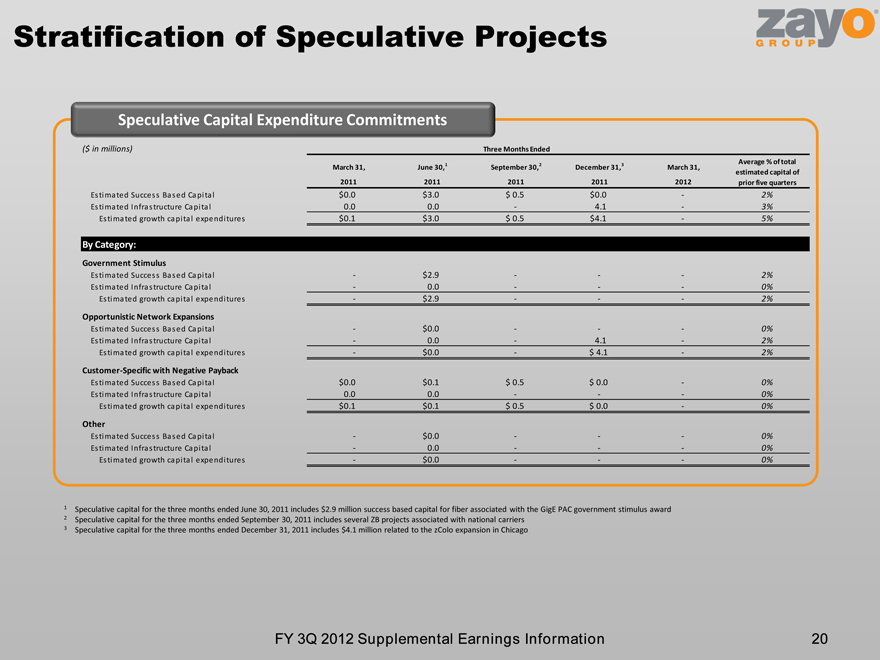
Stratification of Speculative Projects FY 3Q 2012 Supplemental Earnings Information 20 Speculative Capital Expenditure Commitments 1 Speculative capital for the three months ended June 30, 2011 includes $2.9 million success based capital for fiber associated with the GigE PAC government stimulus award 2 Speculative capital for the three months ended September 30, 2011 includes several ZB projects associated with national carriers 3 Speculative capital for the three months ended December 31, 2011 includes $4.1 million related to the zColo expansion in Chicago
21:
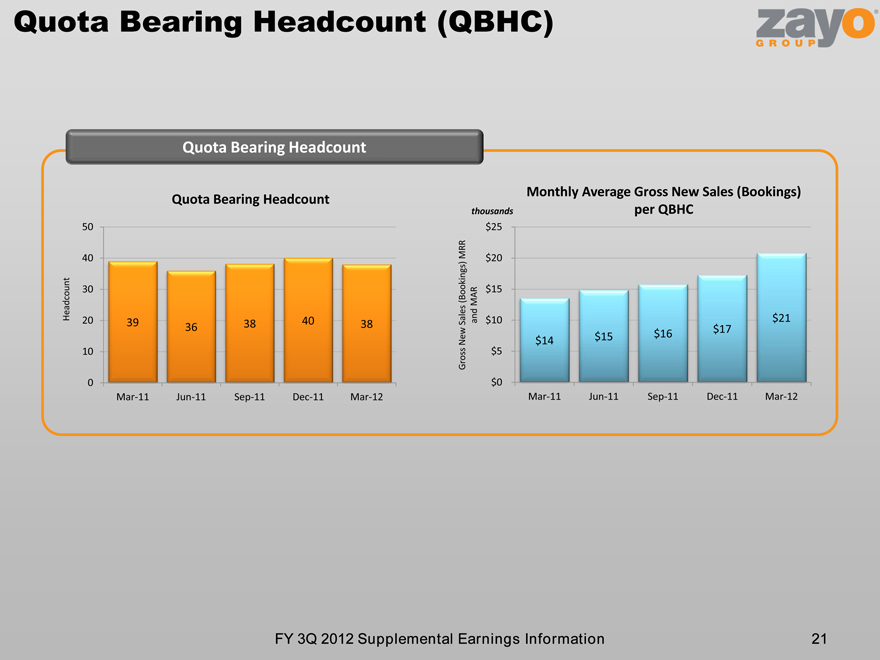
Quota Bearing Headcount (QBHC) FY 3Q 2012 Supplemental Earnings Information 21 Quota Bearing Headcount Quota Bearing Headcount Monthly Average Gross New Sales (Bookings) per QBHC thousands Headcount Gross New Sales (Bookings) MRR and MAR
22:
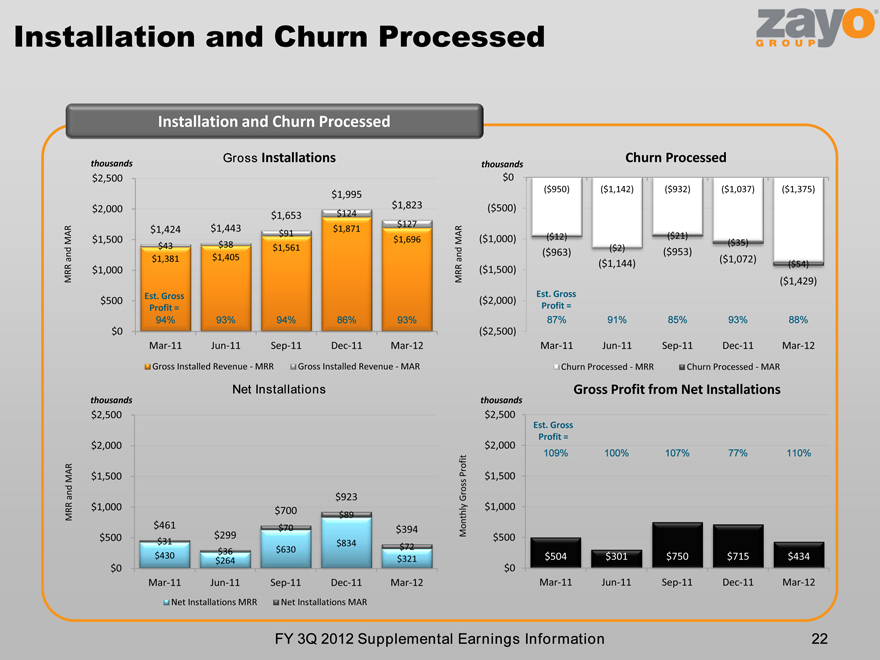
Installation and Churn Processed 22 FY 3Q 2012 Supplemental Earnings Information Installation and Churn Processed Gross Installations Churn Processed Net Installations Gross Profit from Net Installations thousands thousands thousands thousands MRR and MAR MRR and MAR MRR and MAR Monthly Gross Profit Est. Gross Profit = Est. Gross Profit = Est. Gross Profit =
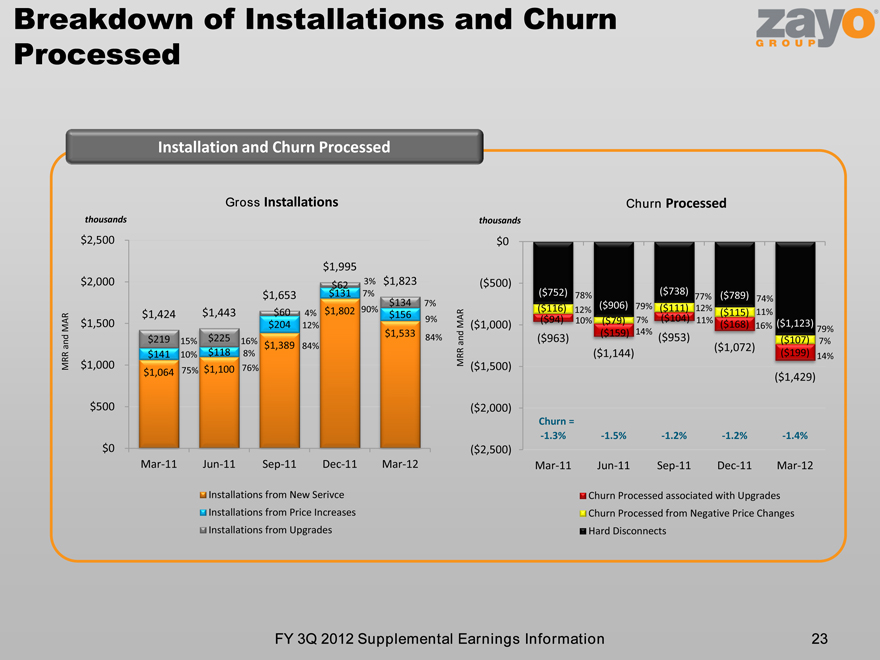
23:
Breakdown of Installations and Churn Processed Installation and Churn Processed 23 FY 3Q 2012 Supplemental Earnings Information Gross Installations thousands Churn Processed thousands MRR and MAR MRR and MAR Churn =
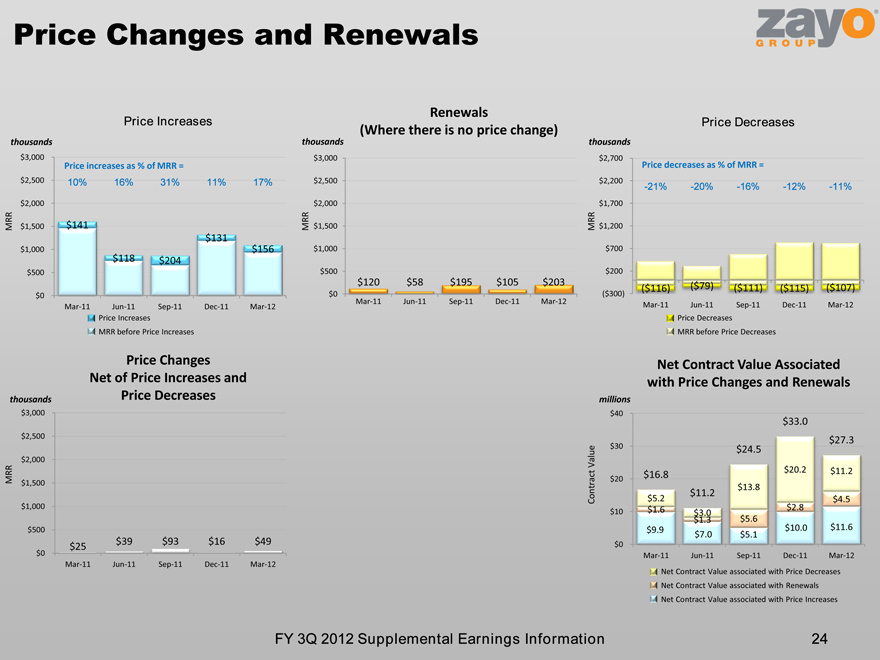
24:
Price Changes and Renewals Price Increases Net Contract Value Associated with Price Changes and Renewals Price Decreases thousands millions thousands MRR Contract Value MRR Price Changes Net of Price Increases and Price Decreases thousands MRR 24 FY 3Q 2012 Supplemental Earnings Information Price increases as % of MRR = Price decreases as % of MRR = Price Increases MRR before Price Increases Price Decreases MRR before Price Decreases Renewals (Where there is no price change) MRR Net Contract Value associated with Price Decreases Net Contract Value associated with Renewals Net Contract Value associated with Price Increases thousands
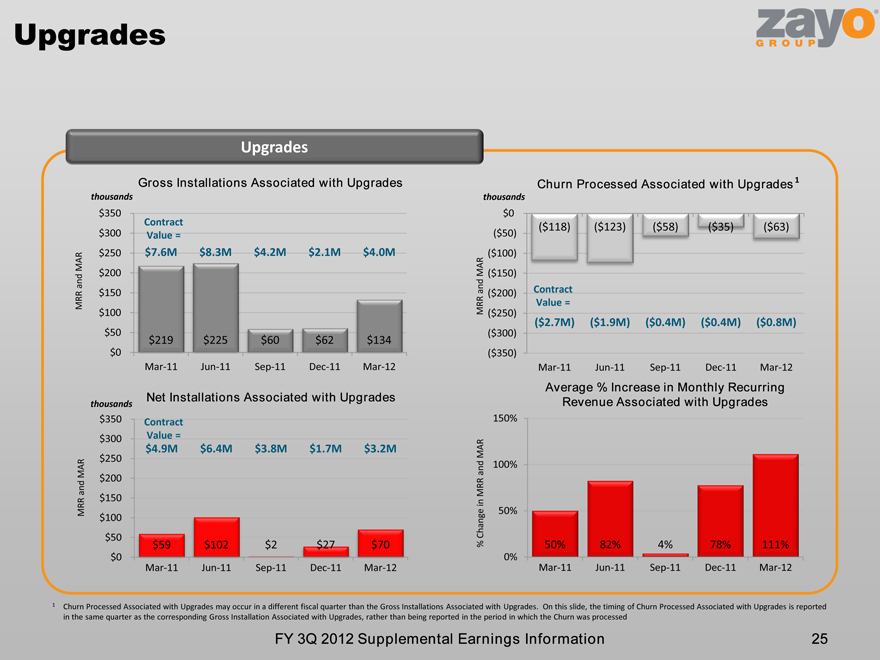
25:
Upgrades Upgrades Gross Installations Associated with Upgrades Average % Increase in Monthly Recurring Revenue Associated with Upgrades thousands thousands thousands Churn Processed Associated with Upgrades Net Installations Associated with Upgrades 25 FY 3Q 2012 Supplemental Earnings Information MRR and MAR MRR and MAR MRR and MAR % Change in MRR and MAR Contract Value = Contract Value = Contract Value = 1 Churn Processed Associated with Upgrades may occur in a different fiscal quarter than the Gross Installations Associated with Upgrades. On this slide, the timing of Churn Processed Associated with Upgrades is reported in the same quarter as the corresponding Gross Installation Associated with Upgrades, rather than being reported in the period in which the Churn was processed 1
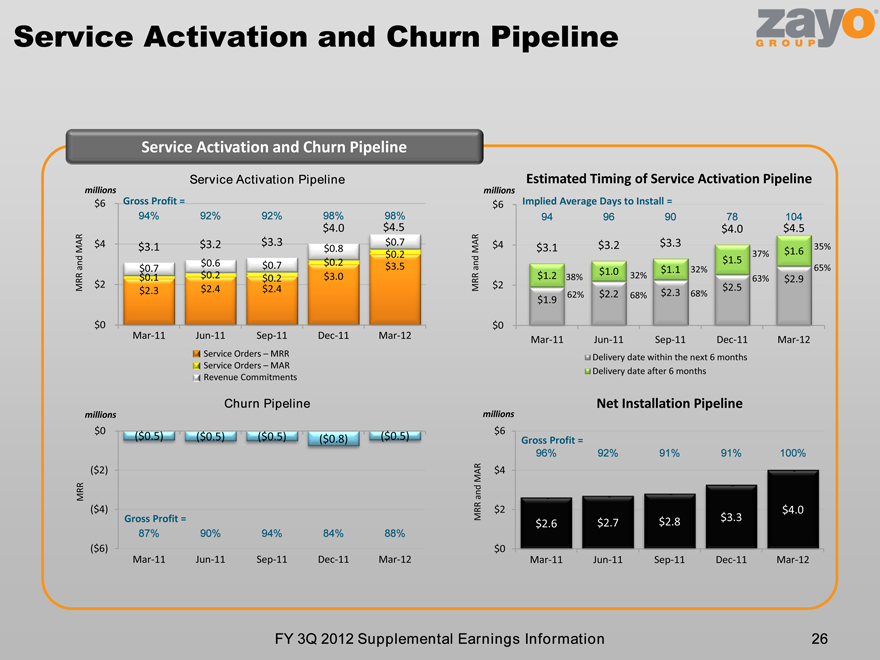
26:
Service Activation and Churn Pipeline 26 FY 3Q 2012 Supplemental Earnings Information Service Activation and Churn Pipeline Service Activation Pipeline Estimated Timing of Service Activation Pipeline Churn Pipeline Net Installation Pipeline millions millions millions MRR and MAR MRR MRR and MAR millions Gross Profit = Gross Profit = Gross Profit = Service Orders – MRR Service Orders – MAR Revenue Commitments Implied Average Days to Install = MRR and MAR
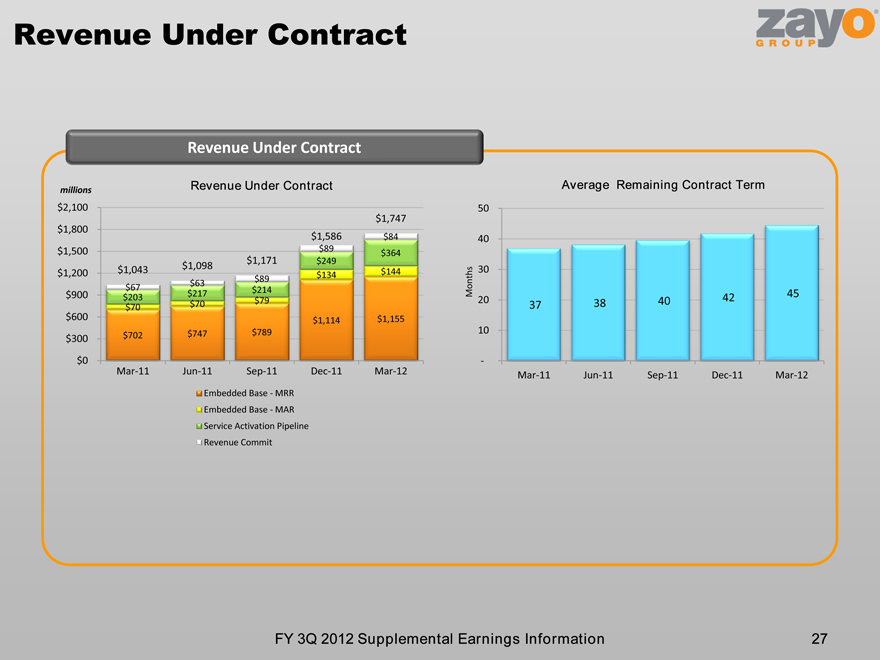
27:
Revenue Under Contract 27 FY 3Q 2012 Supplemental Earnings Information Revenue Under Contract Revenue Under Contract millions Average Remaining Contract Term Months
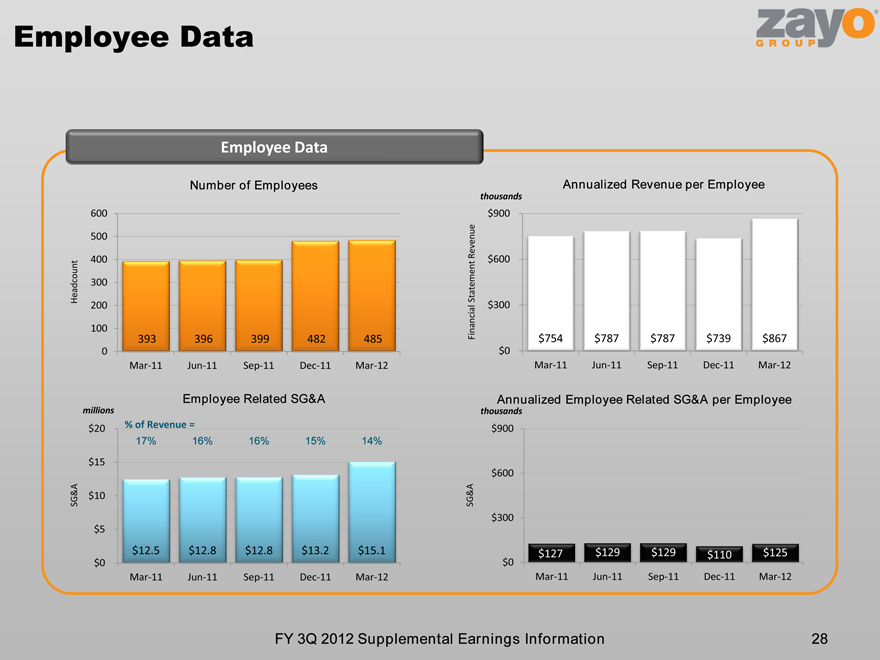
28:
Employee Data FY 3Q 2012 Supplemental Earnings Information 28 Employee Data Number of Employees Employee Related SG&A thousands millions thousands Headcount Financial Statement Revenue SG&A SG&A % of Revenue = Annualized Revenue per Employee Annualized Employee Related SG&A per Employee
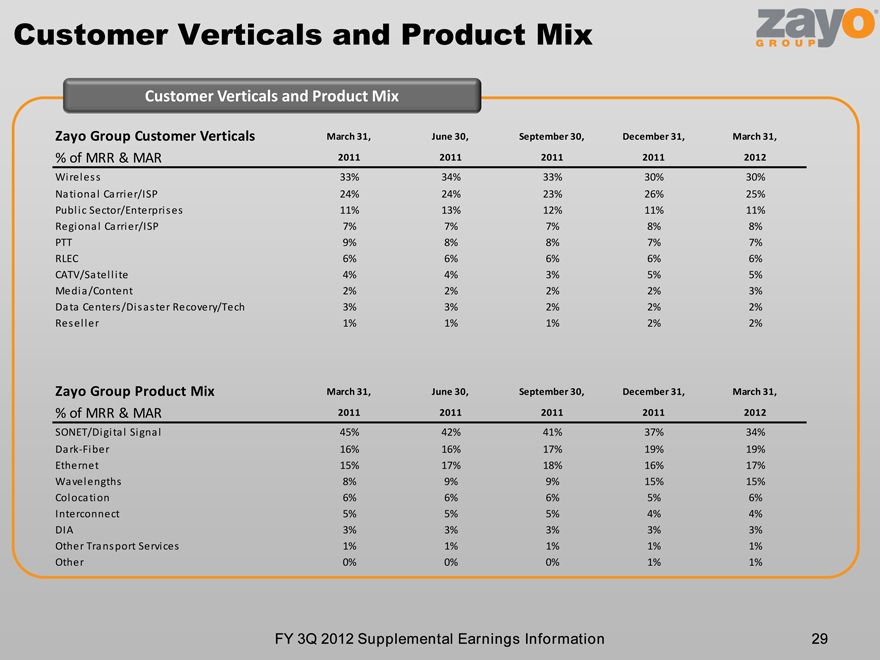
29:
Customer Verticals and Product Mix 29 FY 3Q 2012 Supplemental Earnings Information Customer Verticals and Product Mix
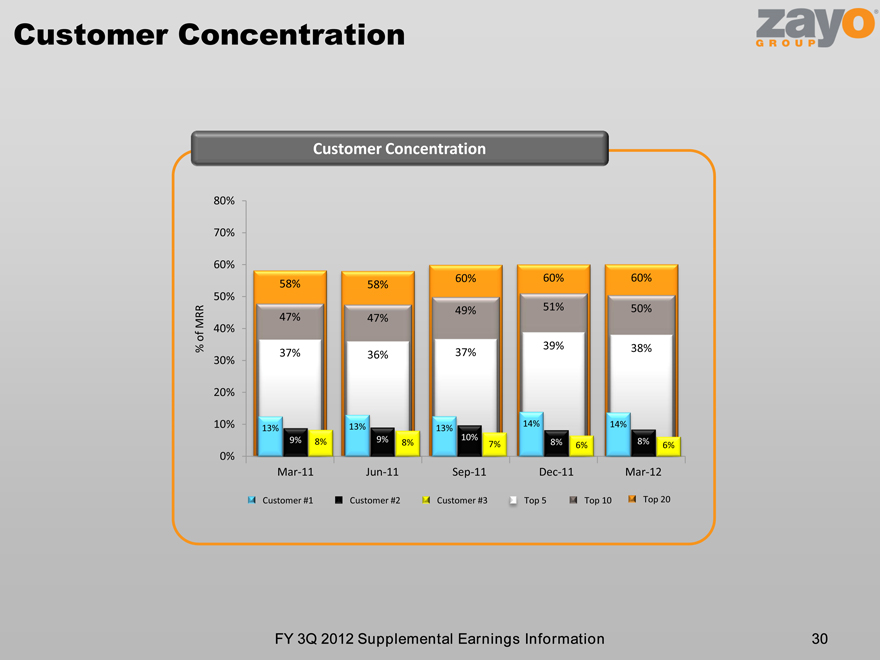
30:
Customer Concentration 30 FY 3Q 2012 Supplemental Earnings Information Customer Concentration % of MRR Customer #1 Customer #2 Customer #3 Top 20 Top 10 Top 5
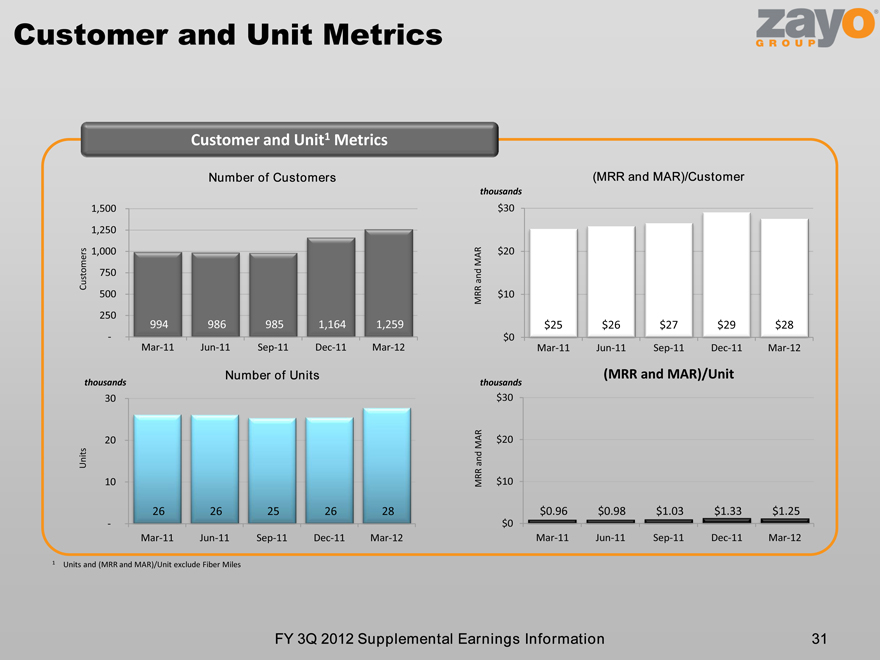
31:
Customer and Unit Metrics Customer and Unit1 Metrics Number of Customers Number of Units (MRR and MAR)/Unit 31 FY 3Q 2012 Supplemental Earnings Information Customers MRR and MAR MRR and MAR Units (MRR and MAR)/Customer thousands thousands thousands 1 Units and (MRR and MAR)/Unit exclude Fiber Miles
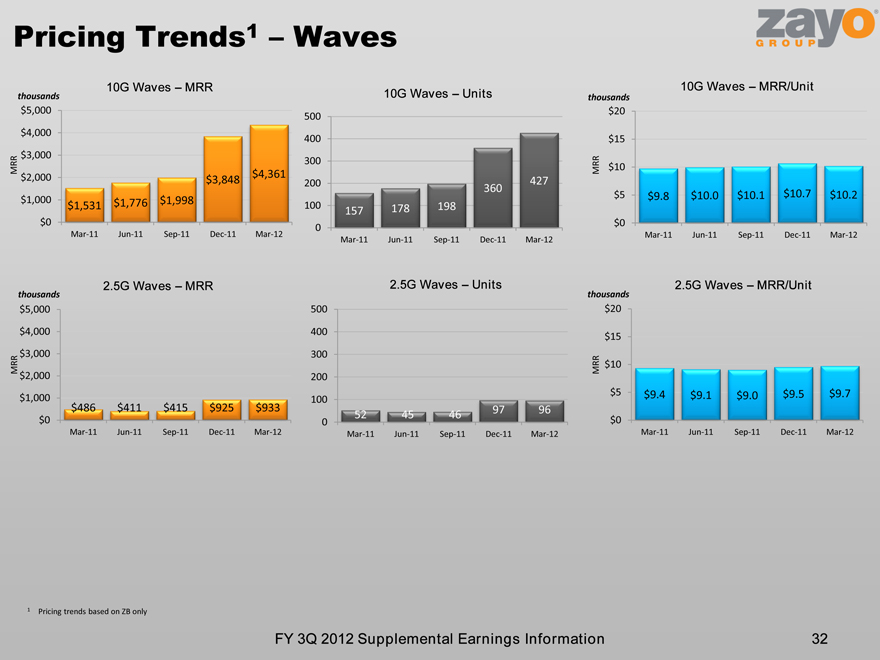
32:
Pricing Trends1 – Waves FY 3Q 2012 Supplemental Earnings Information 32 thousands MRR MRR thousands thousands MRR MRR thousands 1 Pricing trends based on ZB only
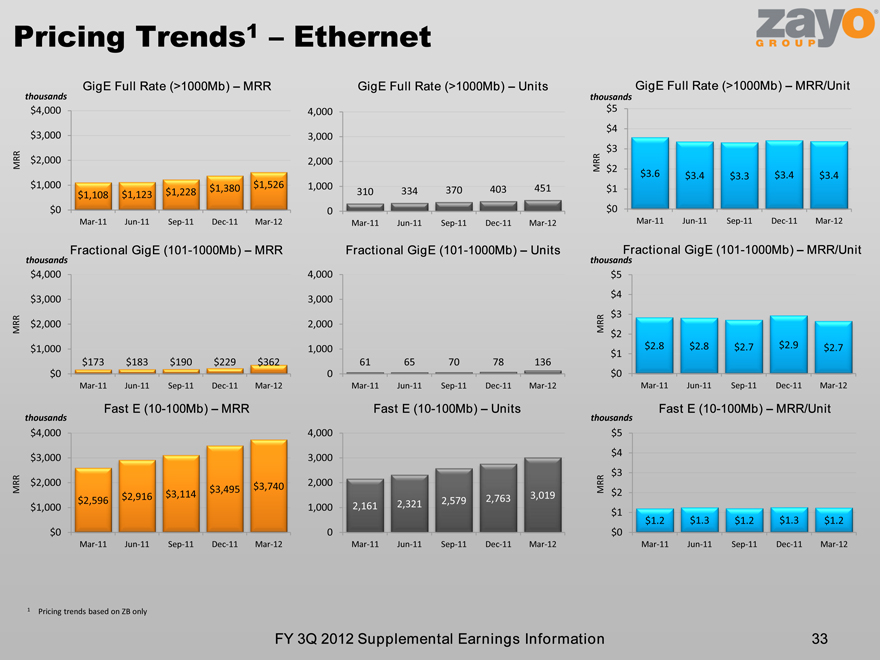
33:
Pricing Trends1 – Ethernet FY 3Q 2012 Supplemental Earnings Information 33 thousands MRR MRR thousands thousands MRR MRR thousands thousands MRR MRR thousands GigE Full Rate (>1000Mb) – MRR/Unit Fractional GigE (101-1000Mb) – MRR/Unit 1 Pricing trends based on ZB only
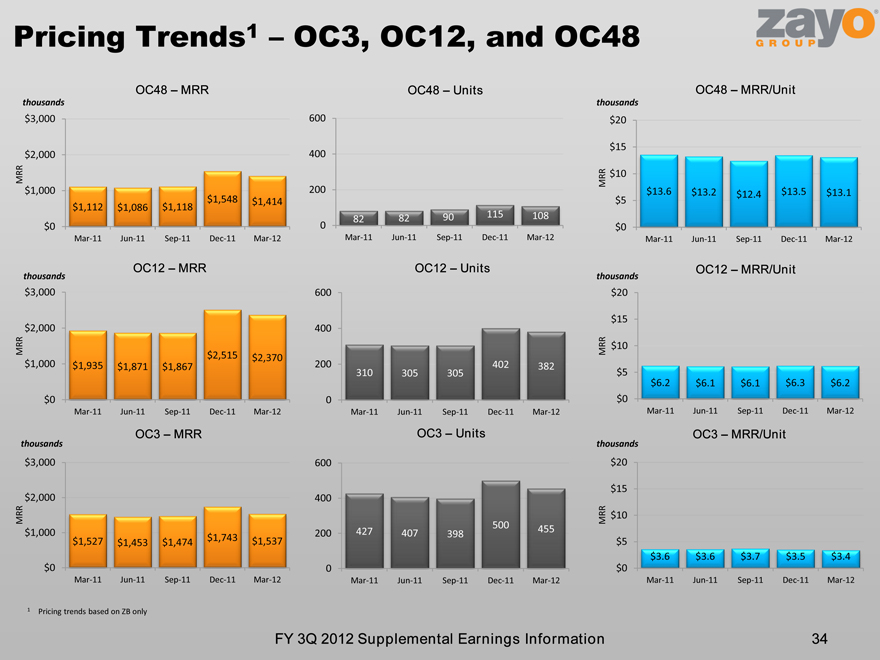
34:
Pricing Trends1 – OC3, OC12, and OC48 FY 3Q 2012 Supplemental Earnings Information 34 thousands MRR MRR thousands thousands MRR MRR thousands thousands MRR MRR thousands 1 Pricing trends based on ZB only
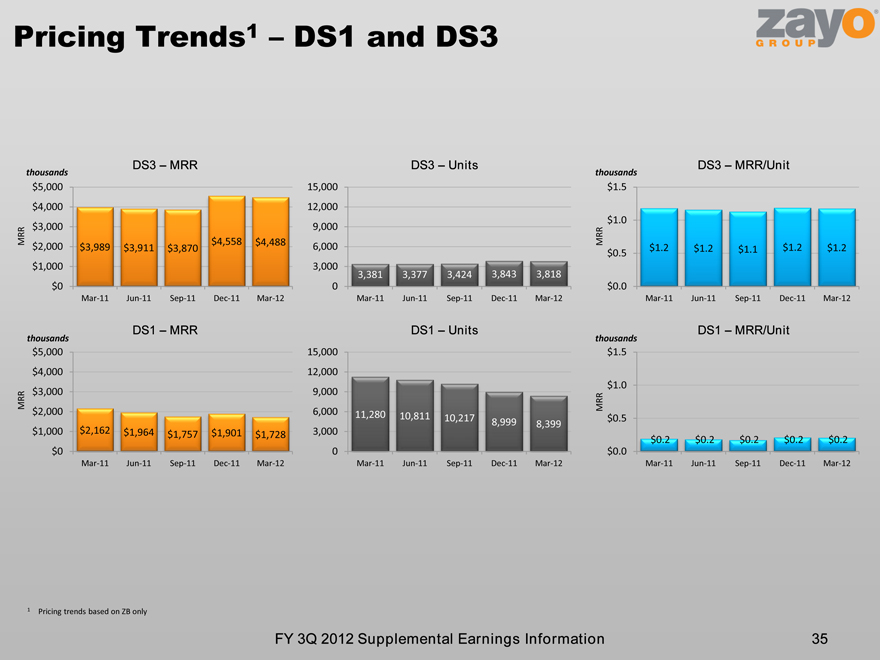
35:
Pricing Trends1 – DS1 and DS3 FY 3Q 2012 Supplemental Earnings Information 35 thousands MRR MRR thousands thousands MRR MRR thousands 1 Pricing trends based on ZB only
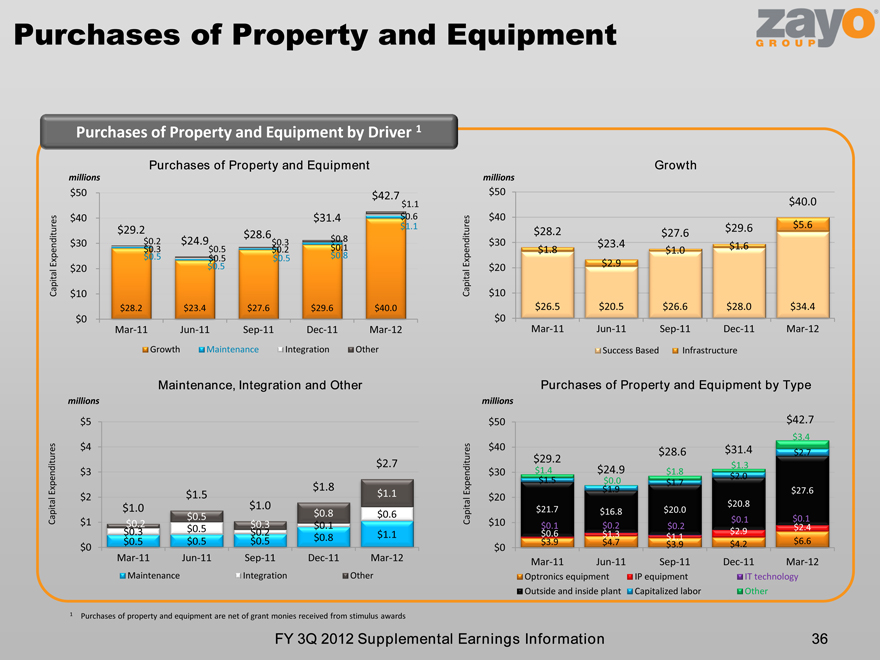
36:
millions Purchases of Property and Equipment Purchases of Property and Equipment by Driver 1 36 FY 3Q 2012 Supplemental Earnings Information Capital Expenditures Purchases of Property and Equipment Maintenance, Integration and Other Growth Capital Expenditures Capital Expenditures Capital Expenditures millions millions millions Purchases of Property and Equipment by Type 1 Purchases of property and equipment are net of grant monies received from stimulus awards
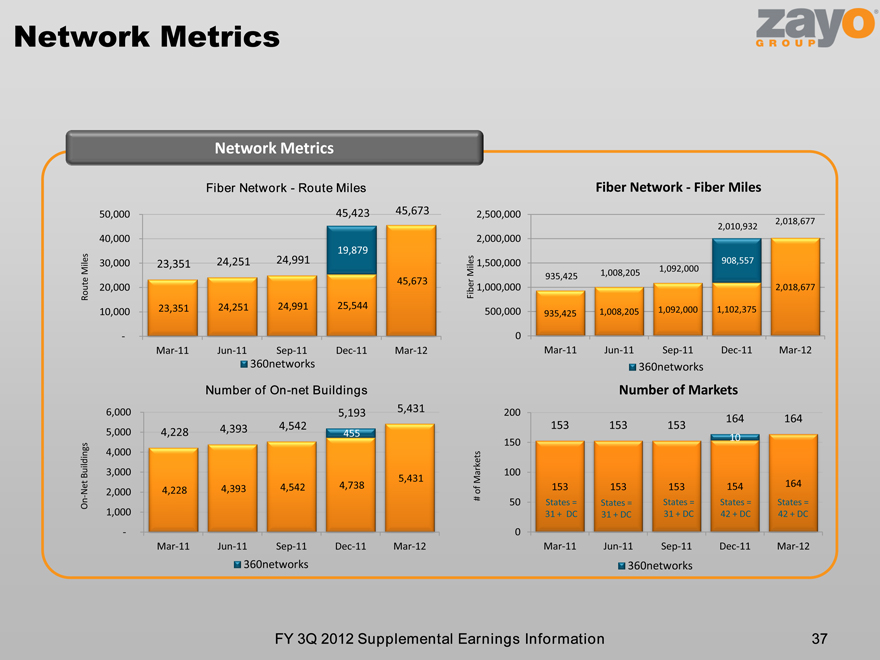
37:
Network Metrics 37 FY 3Q 2012 Supplemental Earnings Information Network Metrics Fiber Network—Route Miles Fiber Network—Fiber Miles Number of On-net Buildings Number of Markets Route Miles Fiber Miles On-Net Buildings # of Markets States = 31 + DC States = 31 + DC States = 31 + DC States = 42 + DC States = 42 + DC
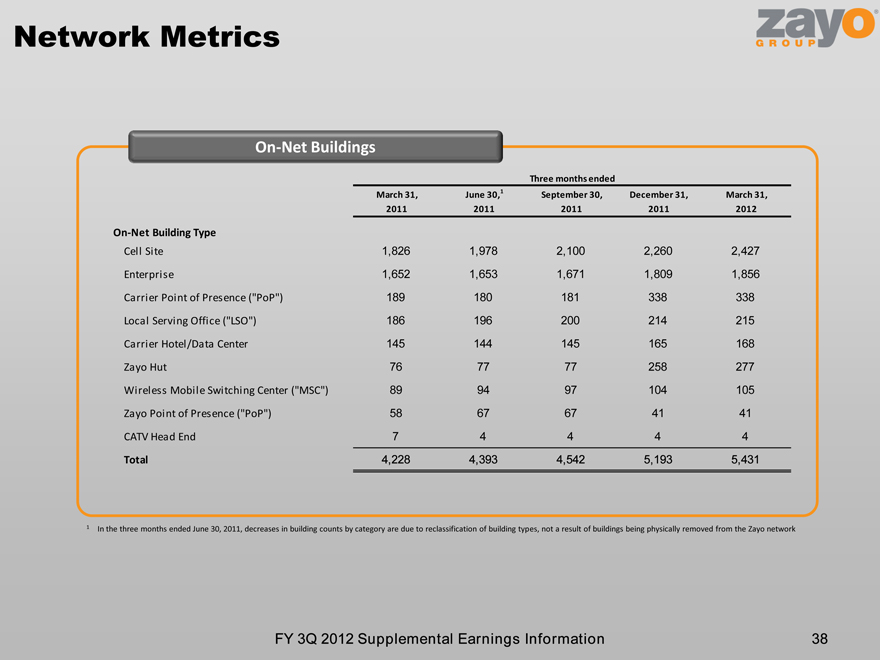
38:
Network Metrics 38 FY 3Q 2012 Supplemental Earnings Information On-Net Buildings 1 In the three months ended June 30, 2011, decreases in building counts by category are due to reclassification of building types, not a result of buildings being physically removed from the Zayo network
39:
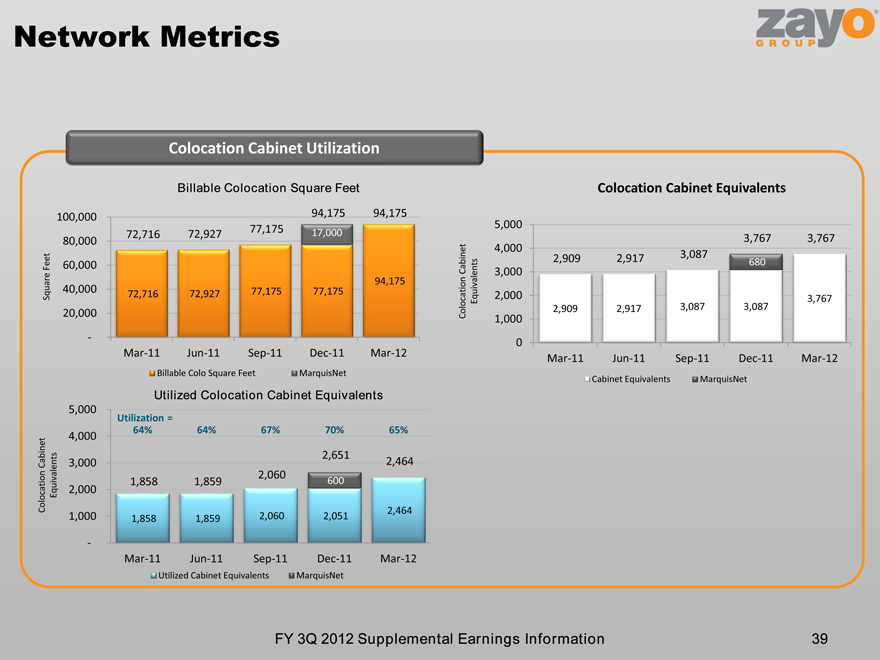
Network Metrics 39 FY 3Q 2012 Supplemental Earnings Information Colocation Cabinet Utilization Billable Colocation Square Feet Colocation Cabinet Equivalents Utilized Colocation Cabinet Equivalents Square Feet Colocation Cabinet Equivalents Colocation Cabinet Equivalents Utilization =

40:
FY 3Q 2012 Supplemental Earnings Information 40 Fiber to the Tower
41:
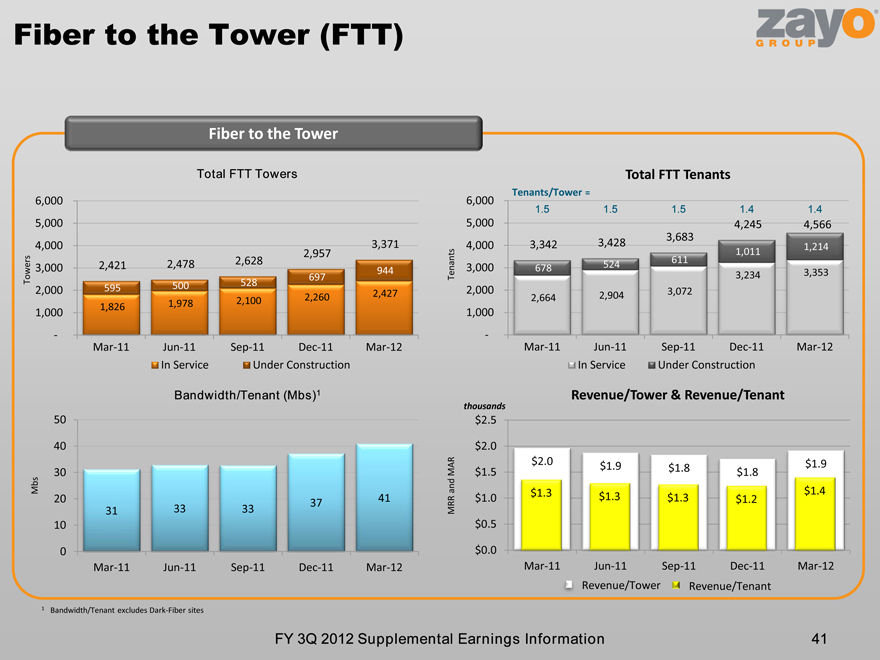
Fiber to the Tower (FTT) Fiber to the Tower Total FTT Towers Bandwidth/Tenant (Mbs)1 Revenue/Tower & Revenue/Tenant thousands 41 FY 3Q 2012 Supplemental Earnings Information Towers Tenants MRR and MAR Mbs Revenue/Tower Revenue/Tenant Total FTT Tenants Tenants/Tower = 1 Bandwidth/Tenant excludes Dark-Fiber sites

42:
% of MRR and MAR % of MRR and MAR % of Zayo Group’s Wireless Carrier MRR and MAR Fiber to the Tower (FTT) Fiber to the Tower FTT MRR and MAR FTT Cumulative Capital Expenditures FTT Product Mix millions millions 42 FY 3Q 2012 Supplemental Earnings Information MRR and MAR % of FTT MRR and MAR Capital Expenditures % of Zayo Group’s MRR and MAR 1 Contract Value =
43:
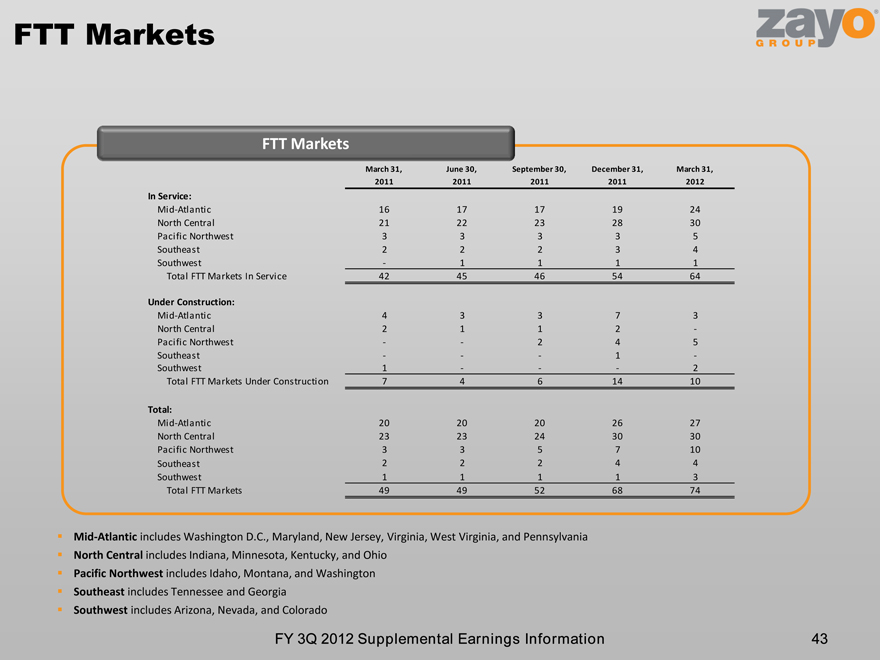
FTT Markets FTT Markets Mid-Atlantic includes Washington D.C., Maryland, New Jersey, Virginia, West Virginia, and Pennsylvania North Central includes Indiana, Minnesota, Kentucky, and Ohio Pacific Northwest includes Idaho, Montana, and Washington Southeast includes Tennessee and Georgia Southwest includes Arizona, Nevada, and Colorado 43 FY 3Q 2012 Supplemental Earnings Information

44:
FY 3Q 2012 Supplemental Earnings Information 44 Financial Data by Business Unit
45:
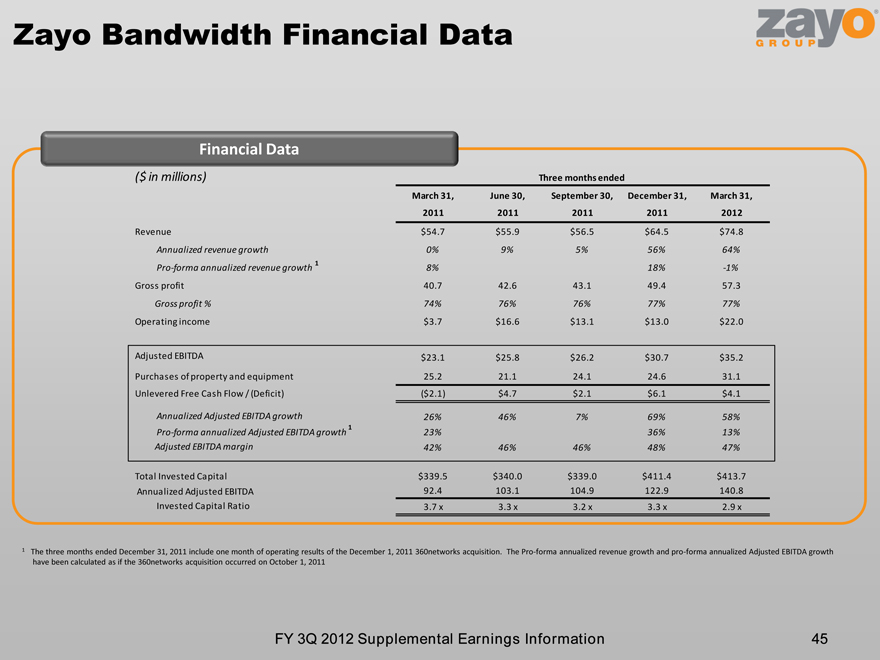
Zayo Bandwidth Financial Data 45 Financial Data FY 3Q 2012 Supplemental Earnings Information 1 The three months ended December 31, 2011 include one month of operating results of the December 1, 2011 360networks acquisition. The Pro-forma annualized revenue growth and pro-forma annualized Adjusted EBITDA growth have been calculated as if the 360networks acquisition occurred on October 1, 2011 1 1
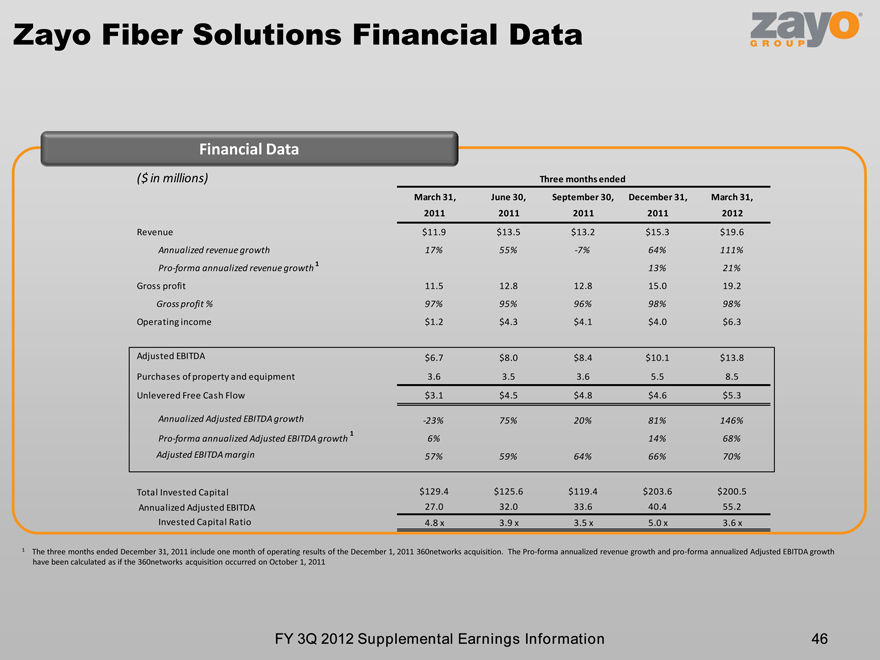
46:
Zayo Fiber Solutions Financial Data FY 3Q 2012 Supplemental Earnings Information 46 Financial Data 1 1 1 The three months ended December 31, 2011 include one month of operating results of the December 1, 2011 360networks acquisition. The Pro-forma annualized revenue growth and pro-forma annualized Adjusted EBITDA growth have been calculated as if the 360networks acquisition occurred on October 1, 2011
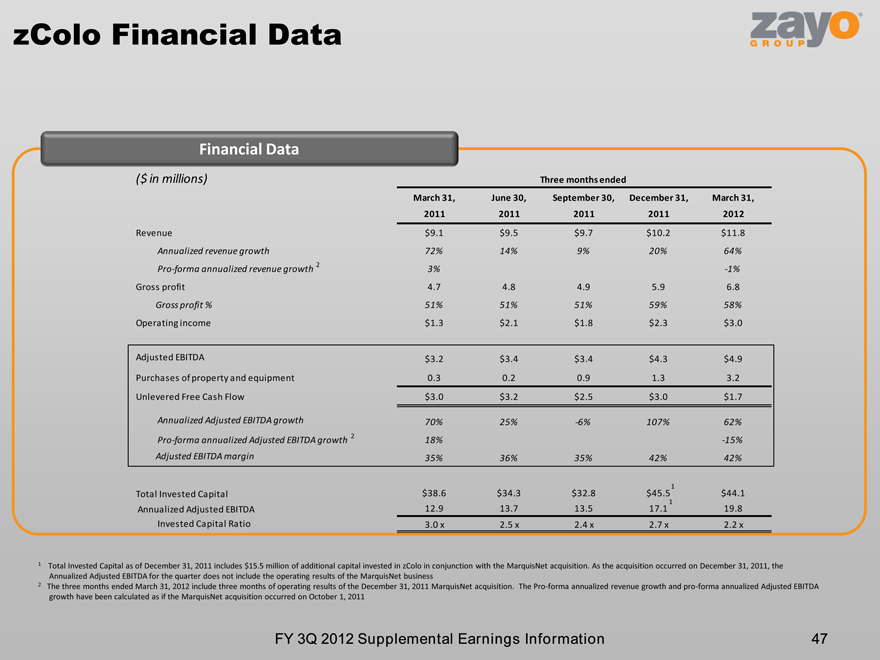
47:
zColo Financial Data FY 3Q 2012 Supplemental Earnings Information 47 Financial Data 1 Total Invested Capital as of December 31, 2011 includes $15.5 million of additional capital invested in zColo in conjunction with the MarquisNet acquisition. As the acquisition occurred on December 31, 2011, the Annualized Adjusted EBITDA for the quarter does not include the operating results of the MarquisNet business 2 The three months ended March 31, 2012 include three months of operating results of the December 31, 2011 MarquisNet acquisition. The Pro-forma annualized revenue growth and pro-forma annualized Adjusted EBITDA growth have been calculated as if the MarquisNet acquisition occurred on October 1, 2011 1 2 2 1

48:
FY 3Q 2012 Supplemental Earnings Information 48 Historical Financial Data & Reconciliations
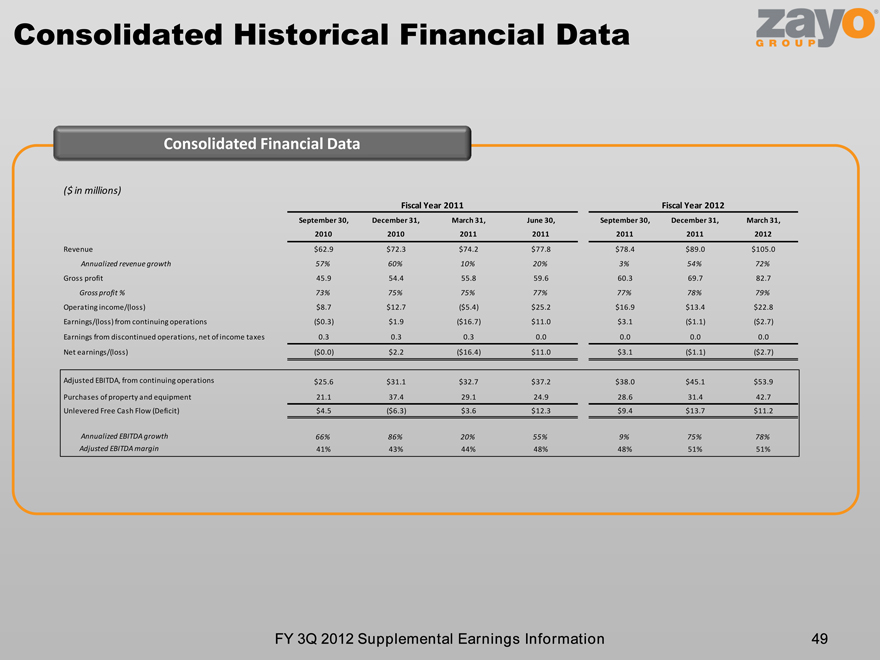
49:
Consolidated Historical Financial Data 49 FY 3Q 2012 Supplemental Earnings Information Consolidated Financial Data
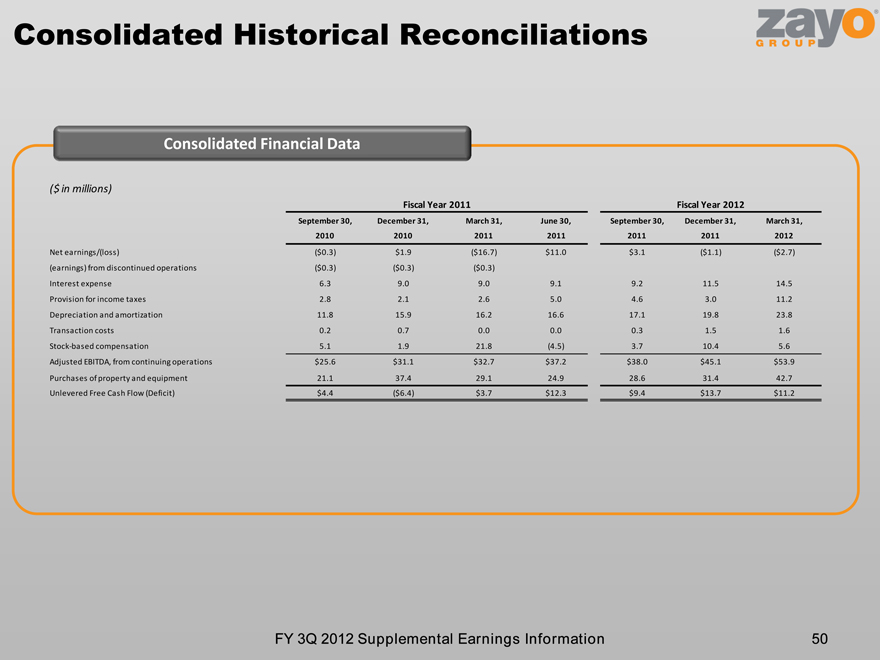
50:
Consolidated Historical Reconciliations 50 FY 3Q 2012 Supplemental Earnings Information Consolidated Financial Data
51:
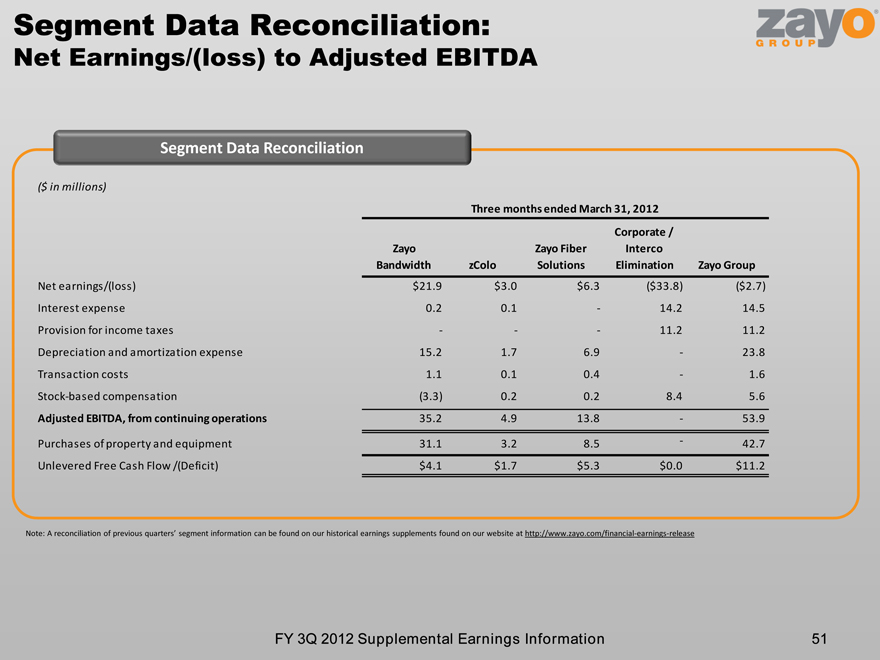
51 FY 3Q 2012 Supplemental Earnings Information Segment Data Reconciliation: Net Earnings/(loss) to Adjusted EBITDA Segment Data Reconciliation Note: A reconciliation of previous quarters’ segment information can be found on our historical earnings supplements found on our website at http://www.zayo.com/financial-earnings-release
52:
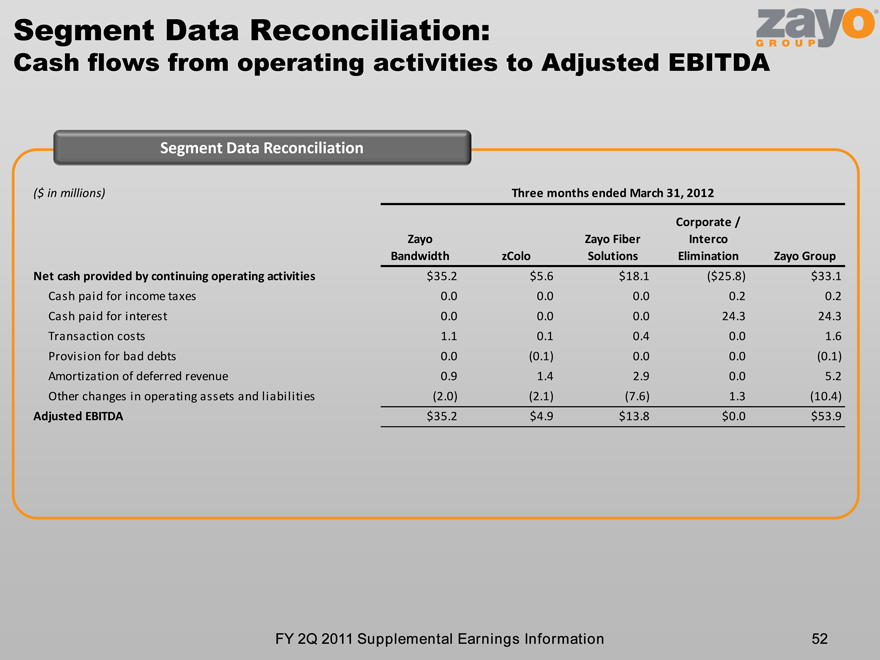
Segment Data Reconciliation: Cash flows from operating activities to Adjusted EBITDA FY 2Q 2011 Supplemental Earnings Information 52 Segment Data Reconciliation
53:
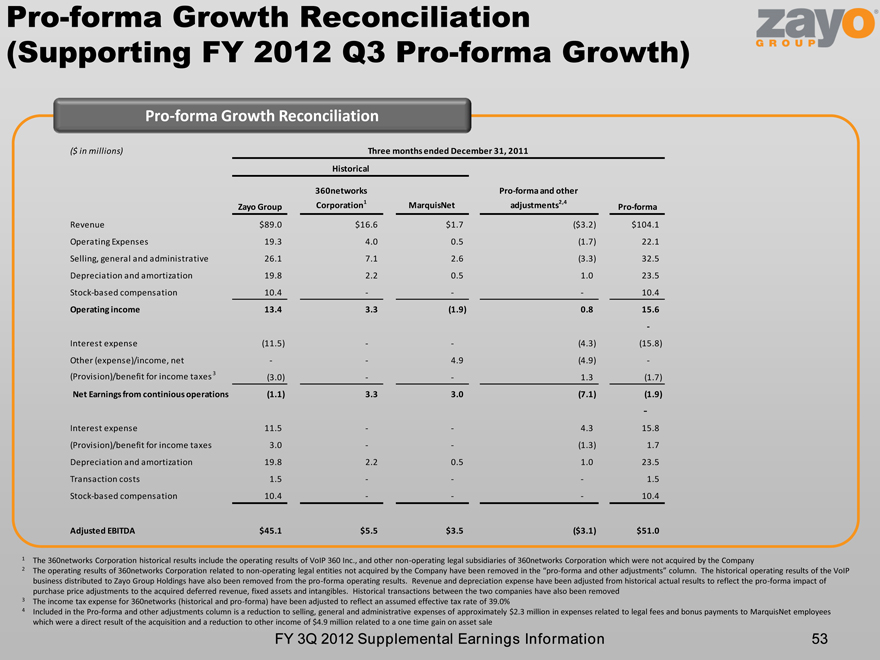
53 FY 3Q 2012 Supplemental Earnings Information Pro-forma Growth Reconciliation (Supporting FY 2012 Q3 Pro-forma Growth) Pro-forma Growth Reconciliation 1 The 360networks Corporation historical results include the operating results of VoIP 360 Inc., and other non-operating legal subsidiaries of 360networks Corporation which were not acquired by the Company 2 The operating results of 360networks Corporation related to non-operating legal entities not acquired by the Company have been removed in the “pro-forma and other adjustments” column. The historical operating results of the VoIP business distributed to Zayo Group Holdings have also been removed from the pro-forma operating results. Revenue and depreciation expense have been adjusted from historical actual results to reflect the pro-forma impact of purchase price adjustments to the acquired deferred revenue, fixed assets and intangibles. Historical transactions between the two companies have also been removed 3 The income tax expense for 360networks (historical and pro-forma) have been adjusted to reflect an assumed effective tax rate of 39.0% 4 Included in the Pro-forma and other adjustments column is a reduction to selling, general and administrative expenses of approximately $2.3 million in expenses related to legal fees and bonus payments to MarquisNet employees which were a direct result of the acquisition and a reduction to other income of $4.9 million related to a one time gain on asset sale
54:
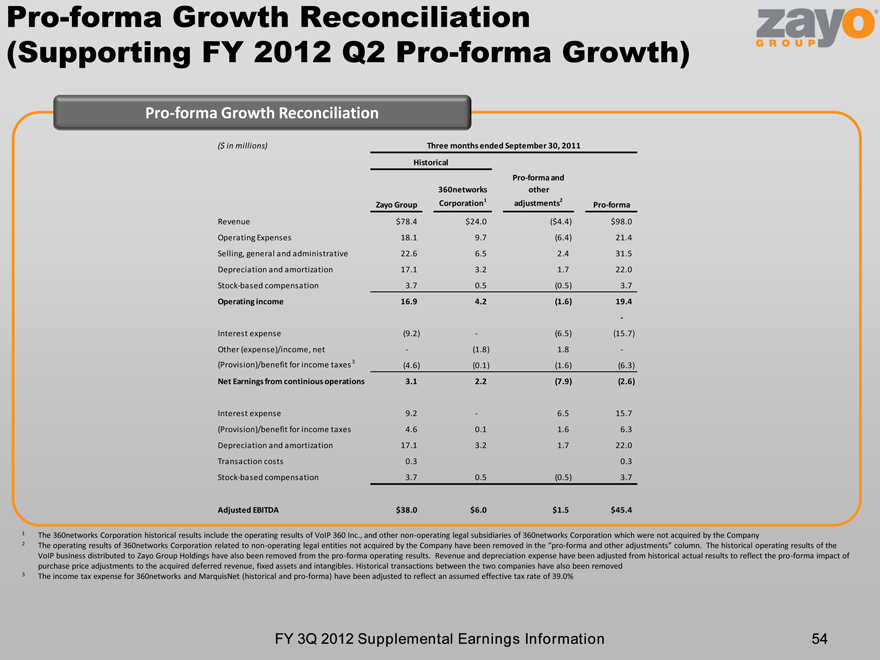
54 FY 3Q 2012 Supplemental Earnings Information Pro-forma Growth Reconciliation (Supporting FY 2012 Q2 Pro-forma Growth) Pro-forma Growth Reconciliation 1 The 360networks Corporation historical results include the operating results of VoIP 360 Inc., and other non-operating legal subsidiaries of 360networks Corporation which were not acquired by the Company 2 The operating results of 360networks Corporation related to non-operating legal entities not acquired by the Company have been removed in the “pro-forma and other adjustments” column. The historical operating results of the VoIP business distributed to Zayo Group Holdings have also been removed from the pro-forma operating results. Revenue and depreciation expense have been adjusted from historical actual results to reflect the pro-forma impact of purchase price adjustments to the acquired deferred revenue, fixed assets and intangibles. Historical transactions between the two companies have also been removed 3 The income tax expense for 360networks and MarquisNet (historical and pro-forma) have been adjusted to reflect an assumed effective tax rate of 39.0%