Exhibit 99.2

1 | | Fiscal Year 4Q 2012 Supplemental Earnings Information Privileged and Confidential |
Forward-Looking Statements 2 FY 4Q 2012 Supplemental Earnings Information Information contained in this supplemental presentation that is not historical by nature constitutes “forward-looking statements” which can be identified by the use of forward-looking terminology such as “believes,” “expects,” “plans,” “intends,” “estimates,” “projects,” “could,” “may,” “will,” “should,” or “anticipates” or the negatives thereof, other variations thereon or comparable terminology, or by discussions of strategy. No assurance can be given that future results expressed or implied by the forward-looking statements will be achieved and actual results may differ materially from those contemplated by the forward-looking statements. Such statements are based on management’s current expectations and beliefs and are subject to a number of risks and uncertainties that could cause actual results to differ materially from those expressed or implied by the forward-looking statements. These risks and uncertainties include, but are not limited to, those relating to the Company’s financial and operating prospects, current economic trends, future opportunities, ability to retain existing customers and attract new ones, the Company’s acquisition strategy and ability to integrate acquired companies and assets, outlook of customers, strength of competition and pricing, and our acquisition of AboveNet and the benefits thereof, including financial and operating results and synergy benefits that may be realized from the acquisition and the timeframe for realizing those benefits. Other factors and risks that may affect our business and future financial results are detailed in our Annual Report on Form 10-K Item 1A: “Risk Factors.” We caution you not to place undue reliance on these forward-looking statements, which speak only as of their respective dates. We undertake no obligation to publicly update or revise forward-looking statements to reflect events or circumstances after releasing this supplemental information or to reflect the occurrence of unanticipated events, except as required by law.
Non-GAAP Financial Measures The Company provides financial measures that are not defined under generally accepted accounting principles in the United States, or GAAP, including earnings before interest, taxes, depreciation and amortization (“EBITDA”) and Adjusted EBITDA. EBITDA and Adjusted EBITDA are not measurements of our financial performance under GAAP and should not be considered in isolation or as alternatives to net earnings or any other performance measures derived in accordance with GAAP or as alternatives to cash flows from operating activities as measures of our liquidity. “Adjusted EBITDA” is defined as EBITDA from continuing operations adjusted to exclude transaction costs related to acquisitions, stock- based compensation, and certain non-cash items. Management uses Adjusted EBITDA to evaluate operating performance and liquidity and this financial measure is among the primary measures used by management for planning and forecasting of future periods. The Company believes that the presentation of Adjusted EBITDA is relevant and useful for investors because it allows investors to view results in a manner similar to the method used by management and makes it easier to compare our results with the results of other companies that have different financing and capital structures. Adjusted EBITDA has limitations as an analytical tool, and should not be considered in isolation from, or as a substitute for, analysis of our results as reported under GAAP. For example, Adjusted EBITDA: does not reflect capital expenditures, or future requirements for capital and major maintenance expenditures or contractual commitments; does not reflect changes in, or cash requirements for, our working capital needs; does not reflect the significant interest expense, or the cash requirements necessary to service the interest payments, on our debt; and does not reflect cash required to pay income taxes The Company’s computation of Adjusted EBITDA may not be comparable to other similarly titled measures computed by other companies, because all companies do not calculate Adjusted EBITDA in the same fashion. Because the Company has acquired numerous entities since inception and incurred transaction costs in connection with each acquisition, has borrowed money in order to finance operations, has used capital and intangible assets in the business, and because the payment of income taxes is necessary if taxable income is generated, any measure that excludes these items has material limitations. As a result of these limitations, Adjusted EBITDA should not be considered as a measure of discretionary cash available to invest in the growth of the business or as a measure of liquidity. In addition to Adjusted EBITDA, management uses Unlevered Free Cash Flow, which measures the ability of Adjusted EBITDA to cover capital expenditures. Gross profit, defined as revenue less operating costs, excluding depreciation and amortization, is used by management to assess profitability prior to selling, general and administrative expenses, stock-based compensation and depreciation and amortization. The Company also provides invested capital and the ratio of invested capital to Adjusted EBITDA. Management uses invested capital and the invested capital ratio to assess value creation in the business. Tables reconciling such non-GAAP measures are included in the Historical Financial Data & Reconciliations section of this presentation. A glossary of terms used throughout is available under the investor section of the Company’s website at http://www.zayo.com/investor- center. 3 FY 4Q 2012 Supplemental Earnings Information
Presentation of Certain Consolidated Pro-forma Financial Data 4 FY 4Q 2012 Supplemental Earnings Information Acquisitions have been, and are expected to continue to be, a component of the Company’s strategy. In this Supplemental Earnings Information under “Consolidated Financial Data,” the Company sets forth its pro-forma annualized revenue growth rate and pro-forma annualized Adjusted EBITDA growth rates for the fiscal quarters impacted by the Company’s acquisitions. These pro-forma measures are intended to provide additional information regarding such rates of growth on a more comparable basis than would be provided without such pro-forma adjustments. With regard to the recent acquisitions that impact the financial data reported within this supplemental earnings presentation (i.e. 360networks Holdings (USA), Inc. (“360networks”), Mercury Marquis Holdings, LLC (“MarquisNet”) and Arialink) the Company has calculated its pro-forma annualized revenue growth rate and pro-forma annualized Adjusted EBITDA growth rates as if the acquisitions occurred on the first day of the quarter preceding the respective quarter in which the acquisition closed. In making such adjustments, the Company made certain pro-forma adjustments to the revenue and Adjusted EBITDA of the acquired entities, which principally include an adjustment related to the fair value of the acquired deferred revenue balance, but do not include cost savings and other synergies that were only realized following completion of the acquisitions. See “Consolidated Historical Reconciliations.” The Company provided the pro-forma annualized revenue growth rate and pro-forma annualized Adjusted EBITDA growth rate only for the fiscal quarters ended June 30, 2012, March 31, 2012, and December 31, 2011 on the slide entitled “Consolidated Financial Data.” Similarly, the company presents pro-forma annualized revenue and pro-forma annualized Adjusted EBITDA growth rates for its operating segments. The calculation of the pro-forma growth rates includes both the impact of the aforementioned acquisitions and the impact of transfers between the segments. The pro-forma growth rates, if applicable to the business unit, are presented for the fiscal quarters ended March 31, 2011, December 31, 2011, March 31, 2012, and June 30, 2012 on slides entitled: “Zayo Bandwidth Financial Data”; “ZFS Financial Data”; and “zColo Financial Data” within the “Financial Data by Business Unit” section of this supplemental earnings presentation.

Other Notes Operating Measures This earnings supplement contains operating measures used by the Company in managing the business. Management believes that providing this information enables analysts, investors, and others to obtain a better understanding of the Company’s operating performance and to evaluate the efficacy of the methodology and information used by management to evaluate and measure such performance on a standalone and comparative basis. Certain supplemental information provided and related definitions may not be directly comparable to similarly titled items reported by other companies. Further, the Company may, from time to time, revise the calculation or presentation of certain operating measures. For the three months ended March 31, 2011 the Company changed the payback period calculation to include non-recurring network expense. Payback period is defined as the period of time (measured in months) in which the gross profit for a gross new sale is equivalent to the estimated capital expenditures and non-recurring network expense less non-recurring revenue related to the gross new sale booking. The payback period is an approximation of the return on a gross new sale booking and does not include sales costs, allocation of indirect operating expenses, depreciation and amortization, or any cost of capital. Prior periods were not revised. Beginning with the three month period ended March 31, 2011 the operational measures exclude Zayo Enterprise Networks (however because the spin-off of Zayo Enterprise Networks occurred subsequent to March 31, 2011, the financial data does include Zayo Enterprise Networks). The company changed the treatment of Ethernet upgrades in the three months ended June 30, 2011. When a customer increases the amount of Mbs. at the same location, only the net increase in revenue is counted as gross new sales (bookings) and gross installations. In prior periods, the full value of the install and full value of the churn were reported. Prior periods were not revised. Revisions Certain prior period operating measures have been revised to reflect corrections or reclassifications of data. These revisions are not material and have no impact on the Company’s reported financial results. Estimates Certain operating measures presented herein are based on estimates. The measures are noted as estimates where presented and include: (1) estimated gross profit on gross new sales (bookings); (2) estimated capital expenditures associated with gross new sales (bookings); (3) estimated payback period on gross new sales (bookings )(calculated); (4) estimated commitments of speculative capital expenditures; and (5) estimated timing of service activation pipeline conversion. Rounding Components may not sum due to rounding. 5 FY 4Q 2012 Supplemental Earnings Information
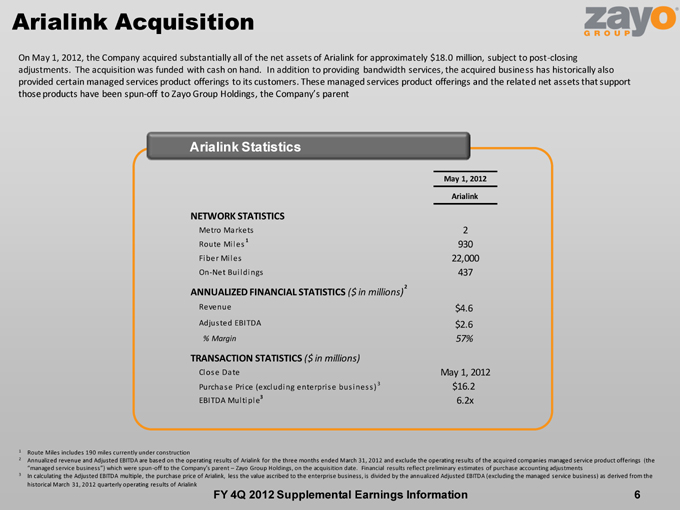
Arialink Acquisition 6 FY 4Q 2012 Supplemental Earnings Information Arialink Statistics On May 1, 2012, the Company acquired substantially all of the net assets of Arialink for approximately $18.0 million, subject to post-closing adjustments. The acquisition was funded with cash on hand. In addition to providing bandwidth services, the acquired business has historically also provided certain managed services product offerings to its customers. These managed services product offerings and the related net assets that support those products have been spun-off to Zayo Group Holdings, the Company’s parent 1 Route Miles includes 190 miles currently under construction 2 Annualized revenue and Adjusted EBITDA are based on the operating results of Arialink for the three months ended March 31, 2012 and exclude the operating results of the acquired companies managed service product offerings (the “managed service business”) which were spun-off to the Company’s parent—Zayo Group Holdings, on the acquisition date. Financial results reflect preliminary estimates of purchase accounting adjustments 3 In calculating the Adjusted EBITDA multiple, the purchase price of Arialink, less the value ascribed to the enterprise business, is divided by the annualized Adjusted EBITDA (excluding the managed service business) as derived from the historical March 31, 2012 quarterly operating results of Arialink 1 2 3
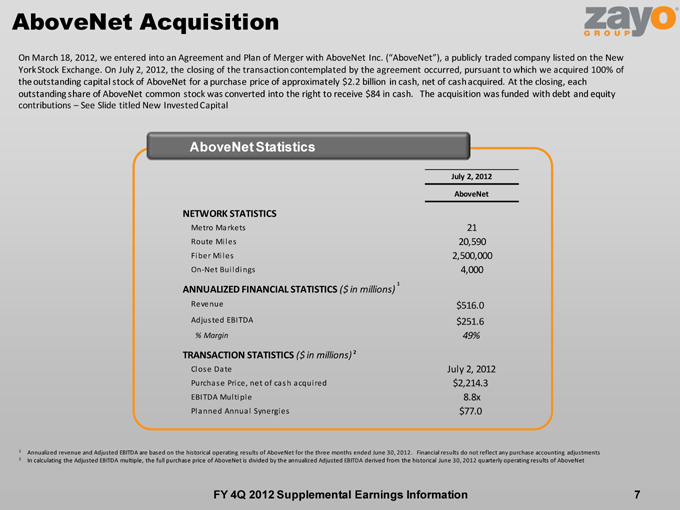
AboveNet Acquisition 7 FY 4Q 2012 Supplemental Earnings Information AboveNet Statistics On March 18, 2012, we entered into an Agreement and Plan of Merger with AboveNet Inc. (“AboveNet”), a publicly traded company listed on the New York Stock Exchange. On July 2, 2012, the closing of the transaction contemplated by the agreement occurred, pursuant to which we acquired 100% of the outstanding capital stock of AboveNet for a purchase price of approximately $2.2 billion in cash, net of cash acquired. At the closing, each outstanding share of AboveNet common stock was converted into the right to receive $84 in cash. The acquisition was funded with debt and equity contributions—See Slide titled New Invested Capital 1 Annualized revenue and Adjusted EBITDA are based on the historical operating results of AboveNet for the three months ended June 30, 2012. Financial results do not reflect any purchase accounting adjustments 2 In calculating the Adjusted EBITDA multiple, the full purchase price of AboveNet is divided by the annualized Adjusted EBITDA derived from the historical June 30, 2012 quarterly operating results of AboveNet 1 2
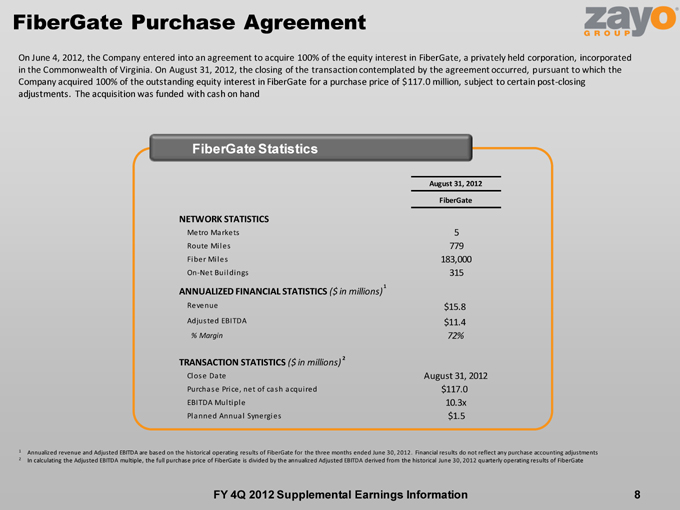
FiberGate Purchase Agreement 8 FY 4Q 2012 Supplemental Earnings Information FiberGate Statistics On June 4, 2012, the Company entered into an agreement to acquire 100% of the equity interest in FiberGate, a privately held corporation, incorporated in the Commonwealth of Virginia. On August 31, 2012, the closing of the transaction contemplated by the agreement occurred, pursuant to which the Company acquired 100% of the outstanding equity interest in FiberGate for a purchase price of $117.0 million, subject to certain post-closing adjustments. The acquisition was funded with cash on hand 1 Annualized revenue and Adjusted EBITDA are based on the historical operating results of FiberGate for the three months ended June 30, 2012. Financial results do not reflect any purchase accounting adjustments 2 In calculating the Adjusted EBITDA multiple, the full purchase price of FiberGate is divided by the annualized Adjusted EBITDA derived from the historical June 30, 2012 quarterly operating results of FiberGate 1 2
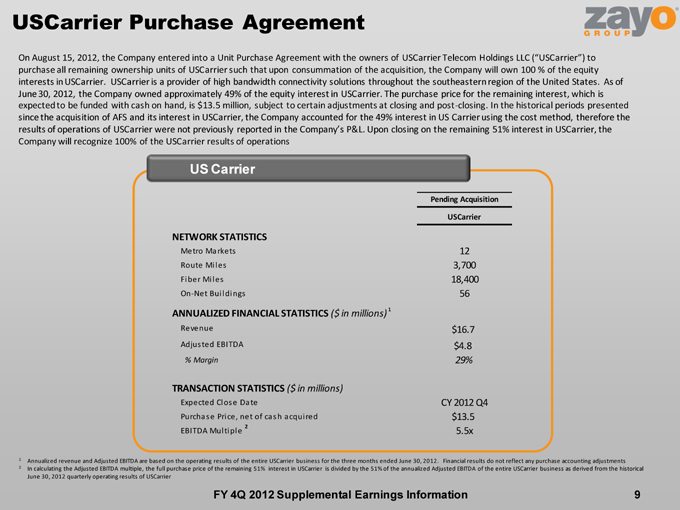
USCarrier Purchase Agreement 9 FY 4Q 2012 Supplemental Earnings Information US Carrier On August 15, 2012, the Company entered into a Unit Purchase Agreement with the owners of USCarrier Telecom Holdings LLC (“USCarrier”) to purchase all remaining ownership units of USCarrier such that upon consummation of the acquisition, the Company will own 100 % of the equity interests in USCarrier. USCarrier is a provider of high bandwidth connectivity solutions throughout the southeastern region of the United States. As of June 30, 2012, the Company owned approximately 49% of the equity interest in USCarrier. The purchase price for the remaining interest, which is expected to be funded with cash on hand, is $13.5 million, subject to certain adjustments at closing and post-closing. In the historical periods presented since the acquisition of AFS and its interest in USCarrier, the Company accounted for the 49% interest in US Carrier using the cost method, therefore the results of operations of USCarrier were not previously reported in the Company’s P&L. Upon closing on the remaining 51% interest in USCarrier, the Company will recognize 100% of the USCarrier results of operations 1 Annualized revenue and Adjusted EBITDA are based on the operating results of the entire USCarrier business for the three months ended June 30, 2012. Financial results do not reflect any purchase accounting adjustments 2 In calculating the Adjusted EBITDA multiple, the full purchase price of the remaining 51% interest in USCarrier is divided by the 51% of the annualized Adjusted EBITDA of the entire USCarrier business as derived from the historical June 30, 2012 quarterly operating results of USCarrier 1 2
New Invested Capital New Indebtedness On July 2, 2012, the Company issued $750.0 million aggregate principal amount of 8.125% senior secured first-priority notes due 2020 and $500.0 million aggregate principal amount of 10.125% senior unsecured notes due 2020 (collectively, the “Notes Offering”). The Company also entered into a new $250.0 million senior secured revolving credit facility (the “New Revolving Credit Facility”), and a new $1,620.0 million senior secured term loan facility which accrues interest at floating rates (the “New Term Loan Facility”). The effective rate on the New Term Loan Facility on July 2, 2012 was 7.125%. Equity Contributions On July 2, 2012, in connection with the Company’s acquisition of AboveNet, the Company completed a third round of equity financing in which 98,916,060.11 Class C Preferred Units were sold to new and existing investors for aggregate proceeds of $472.3 million. At the same time, all existing Preferred Units were converted into 257,548,148.92 Class C Preferred Units. Use of Proceeds A portion of the proceeds from the debt and equity contribution were used to pay the outstanding portion of the Company’s existing credit facilities, to finance the cash tender offer for the Company’s $350.0 million outstanding aggregate principal amount of our existing notes, to pay the cash consideration for the AboveNet acquisition, to refinance certain indebtedness of AboveNet in connection therewith, and to pay associated fees and expenses. 10 FY 4Q 2012 Supplemental Earnings Information
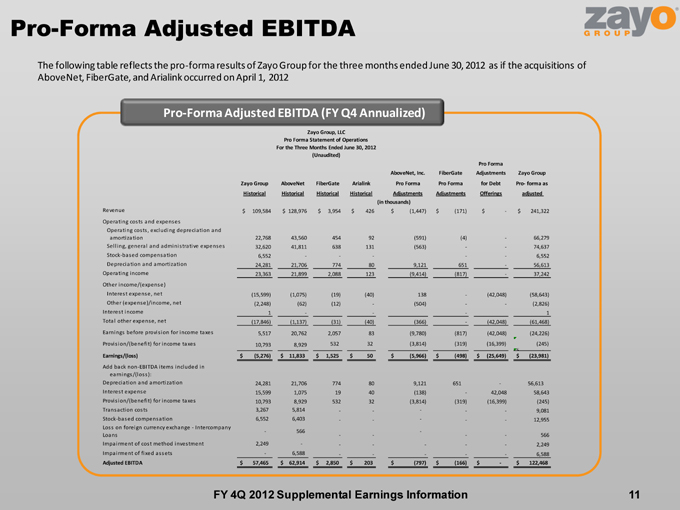
Pro-Forma Adjusted EBITDA FY 4Q 2012 Supplemental Earnings Information 11 Pro-Forma Adjusted EBITDA (FY Q4 Annualized) The following table reflects the pro-forma results of Zayo Group for the three months ended June 30, 2012 as if the acquisitions of AboveNet, FiberGate, and Arialink occurred on April 1, 2012
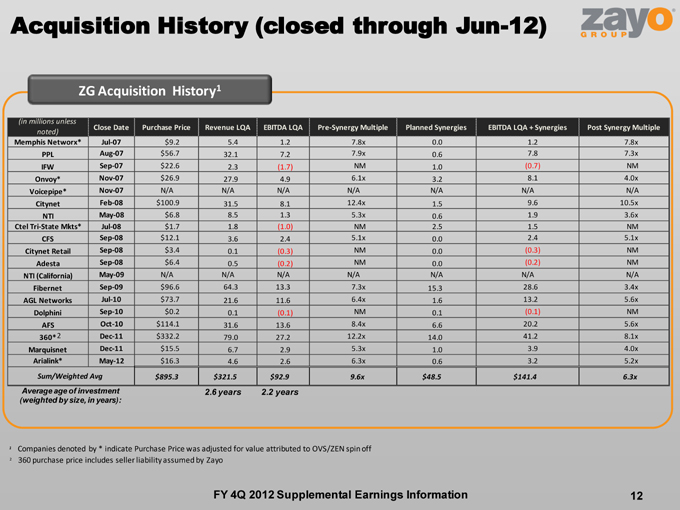
12 ZG Acquisition History1 Average age of investment (weighted by size, in years): 2.6 years 2.2 years 1 Companies denoted by * indicate Purchase Price was adjusted for value attributed to OVS/ZEN spin off Acquisition History (closed through Jun-12) 2 360 purchase price includes seller liability assumed by Zayo 2 FY 4Q 2012 Supplemental Earnings Information
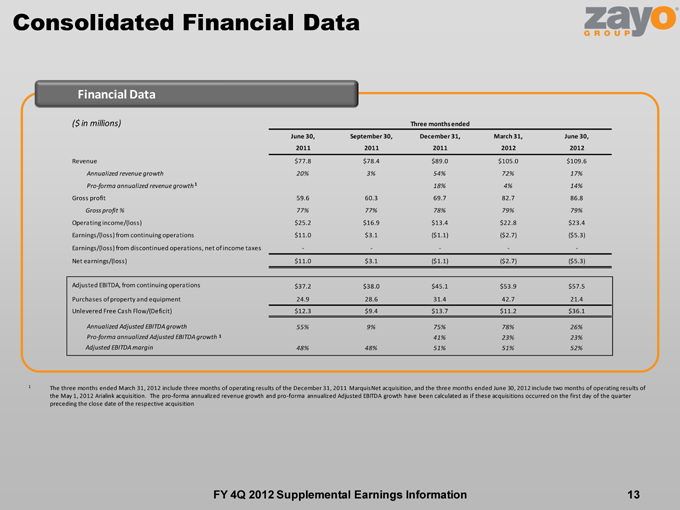
Consolidated Financial Data 13 FY 4Q 2012 Supplemental Earnings Information Financial Data 1 The three months ended March 31, 2012 include three months of operating results of the December 31, 2011 MarquisNet acquisition, and the three months ended June 30, 2012 include two months of operating results of the May 1, 2012 Arialink acquisition. The pro-forma annualized revenue growth and pro-forma annualized Adjusted EBITDA growth have been calculated as if these acquisitions occurred on the first day of the quarter preceding the close date of the respective acquisition 1 1
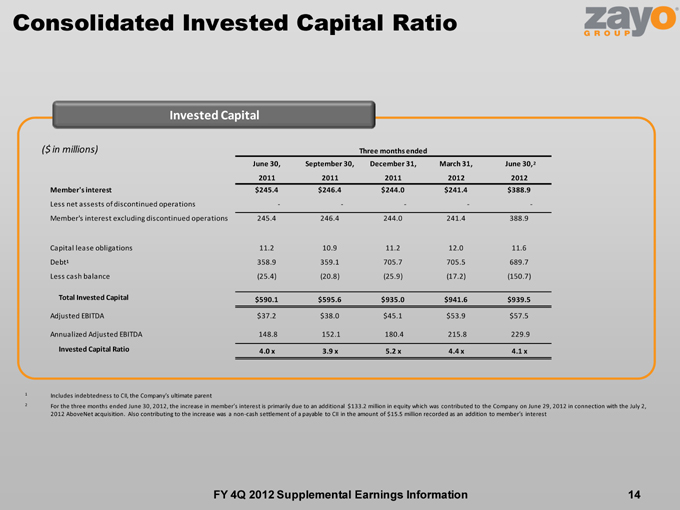
Consolidated Invested Capital Ratio 14 FY 4Q 2012 Supplemental Earnings Information Invested Capital 1 Includes indebtedness to CII, the Company’s ultimate parent 2 For the three months ended June 30, 2012, the increase in member’s interest is primarily due to an additional $133.2 million in equity which was contributed to the Company on June 29, 2012 in connection with the July 2, 2012 AboveNet acquisition. Also contributing to the increase was a non-cash settlement of a payable to CII in the amount of $15.5 million recorded as an addition to member’s interest 2 1
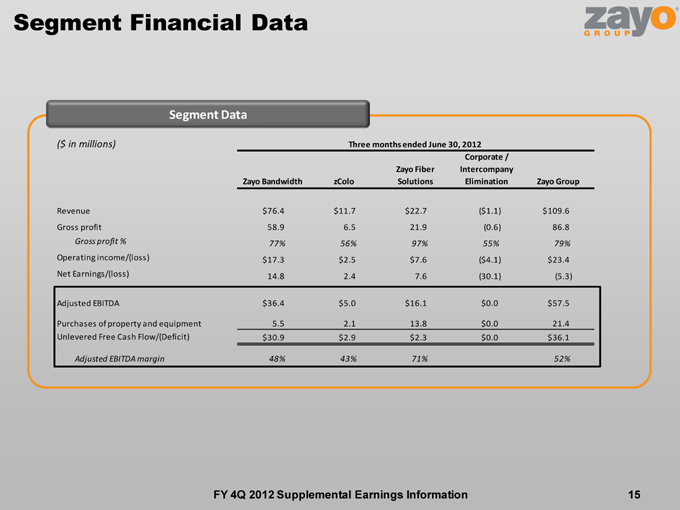
Segment Financial Data 15 FY 4Q 2012 Supplemental Earnings Information Segment Data
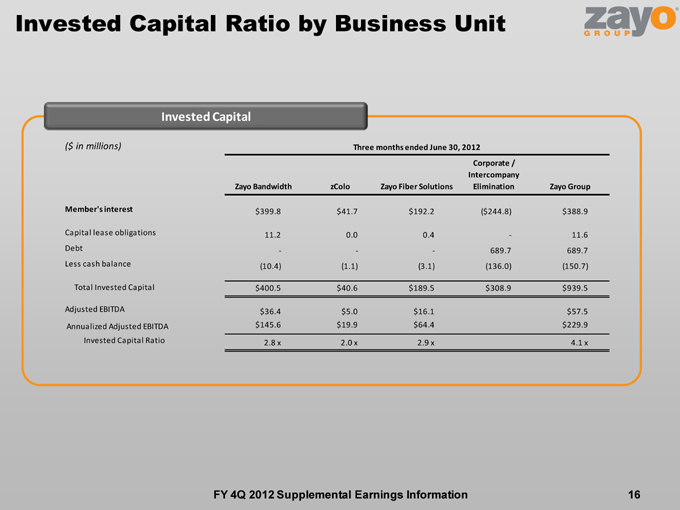
Invested Capital Ratio by Business Unit 16 FY 4Q 2012 Supplemental Earnings Information Invested Capital
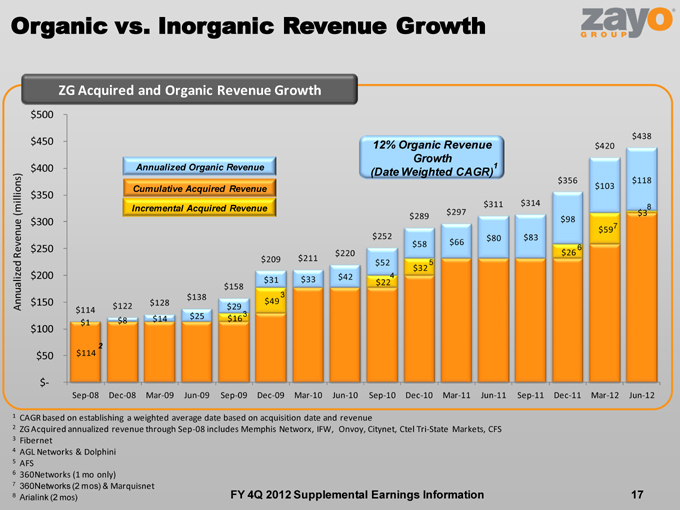
ZG Acquired and Organic Revenue Growth 12% Organic Revenue Growth (Date Weighted CAGR) Cumulative Acquired Revenue Annualized Organic Revenue 2 ZG Acquired annualized revenue through Sep-08 includes Memphis Networx, IFW, Onvoy, Citynet, Ctel Tri-State Markets, CFS Incremental Acquired Revenue 1 3 3 4 5 6 7 3 Fibernet 4 AGL Networks & Dolphini 5 AFS 6 360Networks (1 mo only) 7 360Networks (2 mos) & Marquisnet 1 CAGR based on establishing a weighted average date based on acquisition date and revenue 2 8 Arialink (2 mos) Organic vs. Inorganic Revenue Growth 17 FY 4Q 2012 Supplemental Earnings Information
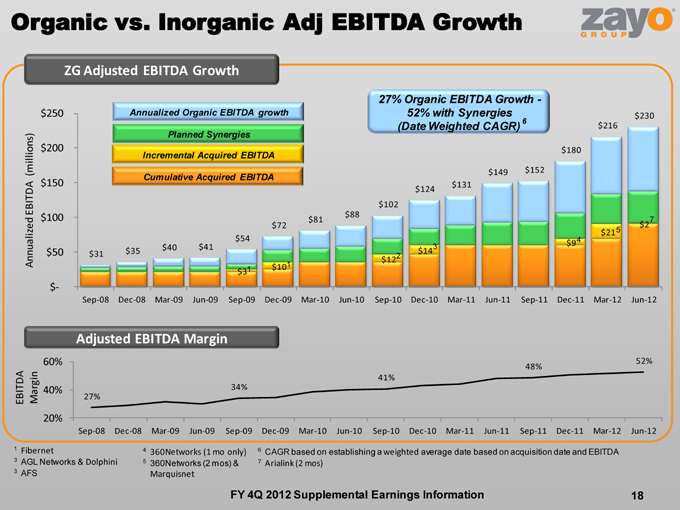
Cumulative Acquired EBITDA Annualized Organic EBITDA growth ZG Adjusted EBITDA Growth Adjusted EBITDA Margin 27% Organic EBITDA Growth —52% with Synergies (Date Weighted CAGR) Planned Synergies Incremental Acquired EBITDA 1 1 2 3 4 5 1 Fibernet 3 AGL Networks & Dolphini 3 AFS 4 360Networks (1 mo only) 5 360Networks (2 mos) & Marquisnet 6 CAGR based on establishing a weighted average date based on acquisition date and EBITDA 6 7 Arialink (2 mos) 7 Organic vs. Inorganic Adj EBITDA Growth 18 FY 4Q 2012 Supplemental Earnings Information
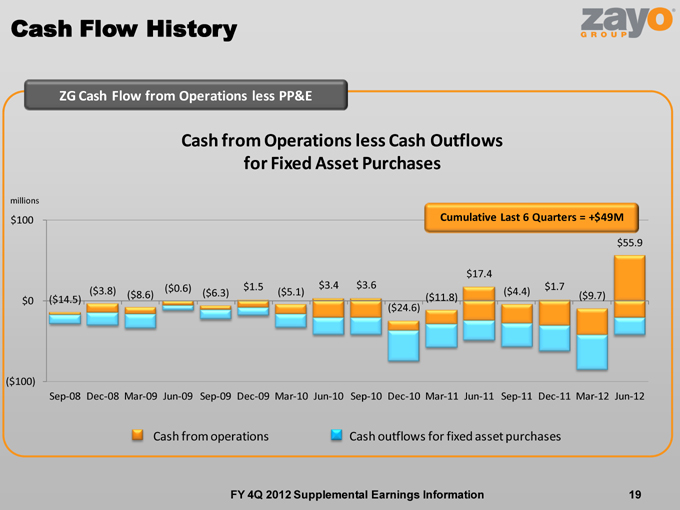
ZG Cash Flow from Operations less PP&E Cash from Operations less Cash Outflows for Fixed Asset Purchases Cumulative Last 6 Quarters = +$49M millions Cash from operations Cash outflows for fixed asset purchases Cash Flow History 19 FY 4Q 2012 Supplemental Earnings Information
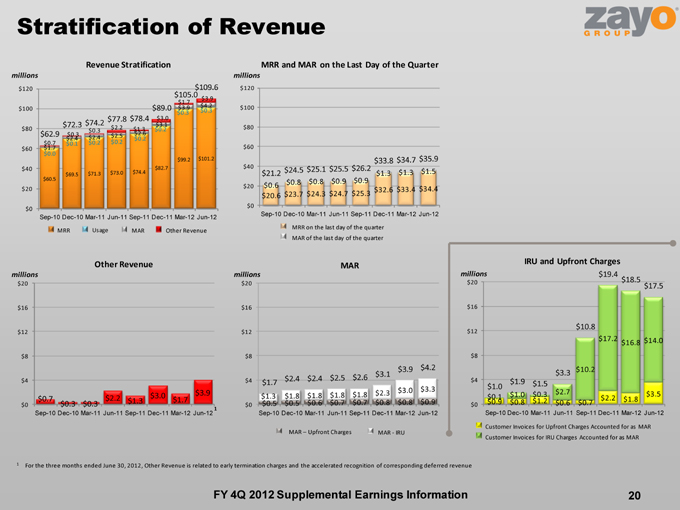
Stratification of Revenue 20 millions millions millions millions MRR and MAR on the Last Day of the Quarter MRR on the last day of the quarter MAR of the last day of the quarter millions Revenue Stratification FY 4Q 2012 Supplemental Earnings Information MRR Usage MAR Other Revenue MAR—Upfront Charges MAR—IRU 1 For the three months ended June 30, 2012, Other Revenue is related to early termination charges and the accelerated recognition of corresponding deferred revenue 1
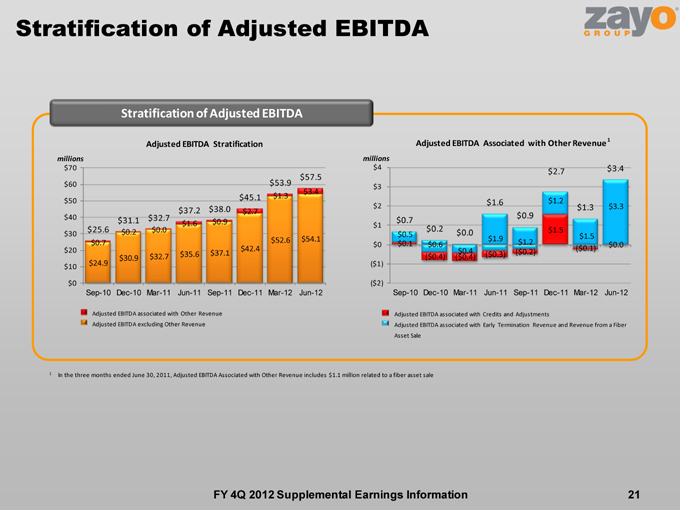
Stratification of Adjusted EBITDA 21 millions FY 4Q 2012 Supplemental Earnings Information millions Adjusted EBITDA Associated with Other Revenue Stratification of Adjusted EBITDA Adjusted EBITDA Stratification Adjusted EBITDA associated with Credits and Adjustments Adjusted EBITDA associated with Early Termination Revenue and Revenue from a Fiber Asset Sale Adjusted EBITDA associated with Other Revenue Adjusted EBITDA excluding Other Revenue 1 In the three months ended June 30, 2011, Adjusted EBITDA Associated with Other Revenue includes $1.1 million related to a fiber asset sale 1
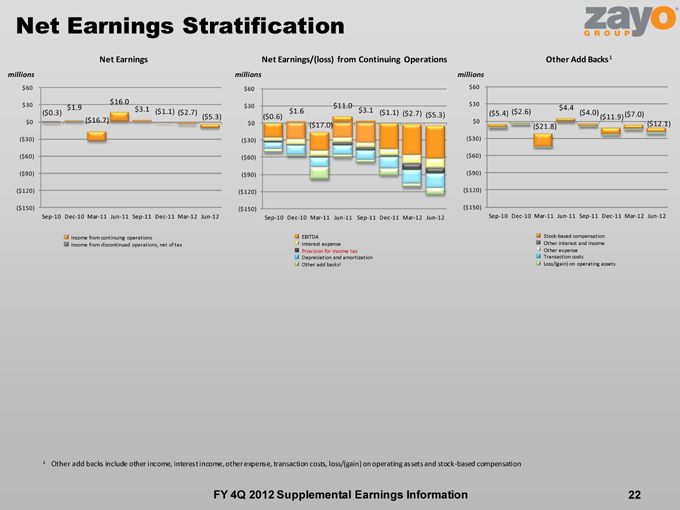
Net Earnings Stratification 22 millions Net Earnings/(loss) from Continuing Operations millions Net Earnings EBITDA Interest expense Provision for income tax Depreciation and amortization Other add backs1 Other Add Backs millions Income from continuing operations Income from discontinued operations, net of tax 1 Other add backs include other income, interest income, other expense, transaction costs, loss/(gain) on operating assets and stock-based compensation Stock-based compensation Other interest and income Other expense Transaction costs Loss/(gain) on operating assets FY 4Q 2012 Supplemental Earnings Information 1
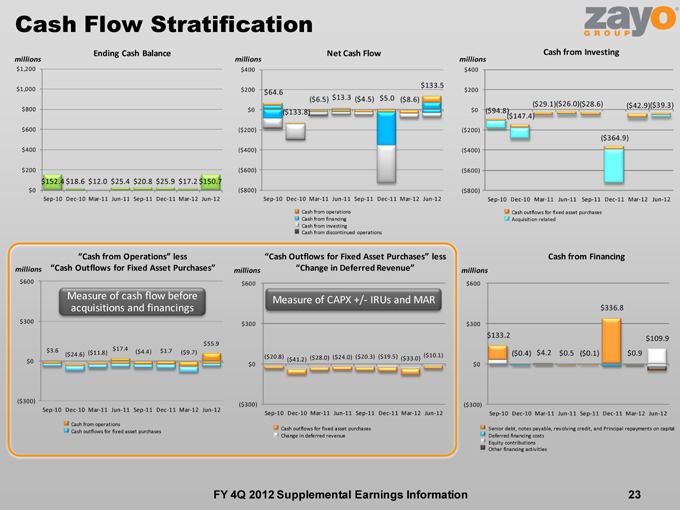
“Cash from Operations” less “Cash Outflows for Fixed Asset Purchases” Cash Flow Stratification 23 millions millions millions Net Cash Flow millions Ending Cash Balance Cash from operations Cash from financing Cash from investing Cash from discontinued operations millions Cash from Investing Cash outflows for fixed asset purchases Acquisition related Cash outflows for fixed asset purchases Change in deferred revenue Cash from Financing “Cash Outflows for Fixed Asset Purchases” less “Change in Deferred Revenue” Senior debt, notes payable, revolving credit, and Principal repayments on capital Deferred financing costs Equity contributions Other financing activities Cash from operations Cash outflows for fixed asset purchases Measure of cash flow before acquisitions and financings Measure of CAPX +/- IRUs and MAR FY 4Q 2012 Supplemental Earnings Information millions
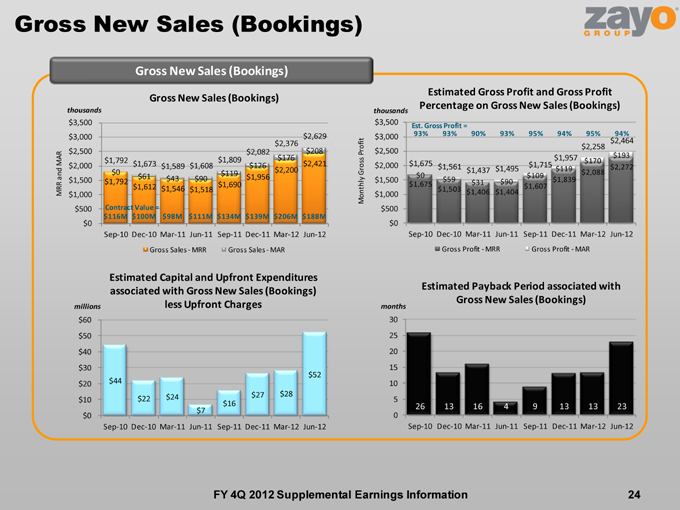
Gross New Sales (Bookings) 24 FY 4Q 2012 Supplemental Earnings Information Gross New Sales (Bookings) Gross New Sales (Bookings) Estimated Gross Profit and Gross Profit Percentage on Gross New Sales (Bookings) Estimated Capital and Upfront Expenditures associated with Gross New Sales (Bookings) less Upfront Charges Estimated Payback Period associated with Gross New Sales (Bookings) thousands thousands millions months MRR and MAR Monthly Gross Profit Est. Gross Profit = Contract Value =
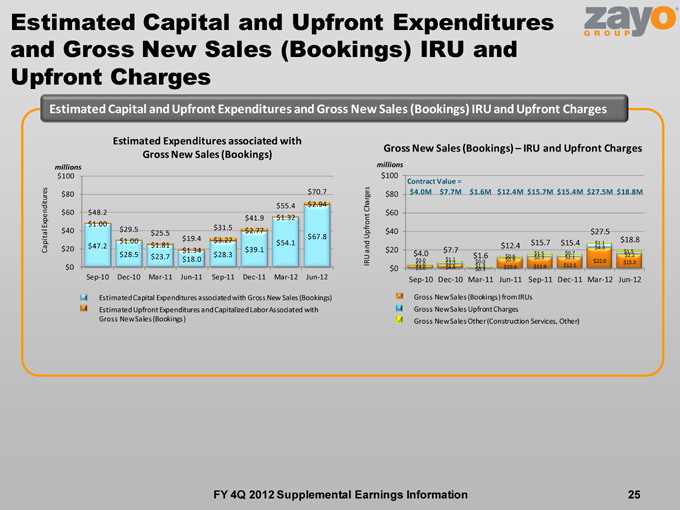
25 FY 4Q 2012 Supplemental Earnings Information Estimated Capital and Upfront Expenditures and Gross New Sales (Bookings) IRU and Upfront Charges Contract Value = Gross New Sales (Bookings)—IRU and Upfront Charges Gross New Sales (Bookings) from IRUs Gross New Sales Upfront Charges Gross New Sales Other (Construction Services, Other) millions Estimated Expenditures associated with Gross New Sales (Bookings) millions Capital Expenditures Estimated Capital and Upfront Expenditures and Gross New Sales (Bookings) IRU and Upfront Charges Estimated Capital Expenditures associated with Gross New Sales (Bookings) Estimated Upfront Expenditures and Capitalized Labor Associated with Gross New Sales (Bookings) IRU and Upfront Charges
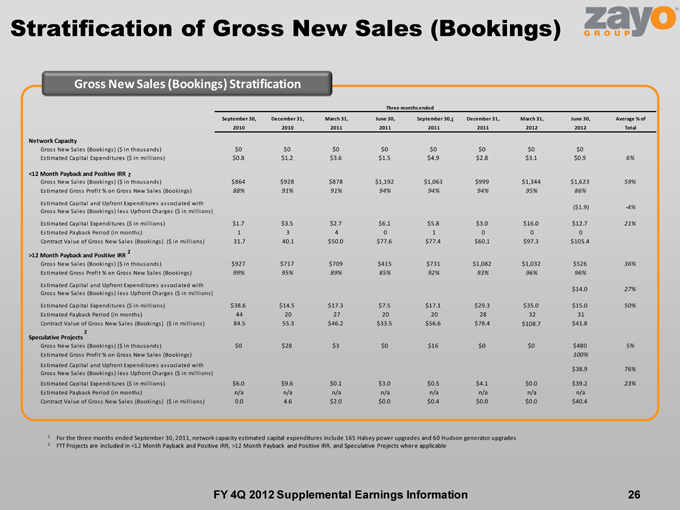
Stratification of Gross New Sales (Bookings) 26 FY 4Q 2012 Supplemental Earnings Information Gross New Sales (Bookings) Stratification 1 For the three months ended September 30, 2011, network capacity estimated capital expenditures include 165 Halsey power upgrades and 60 Hudson generator upgrades 2 FTT Projects are included in <12 Month Payback and Positive IRR, >12 Month Payback and Positive IRR, and Speculative Projects where applicable 1 2 2 2
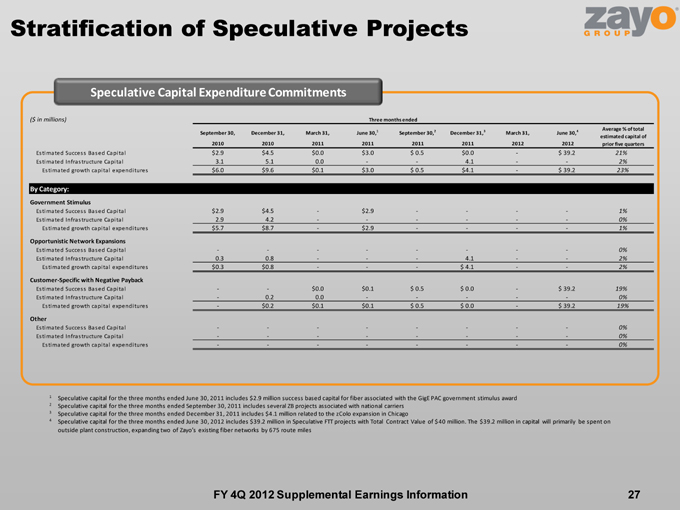
Stratification of Speculative Projects FY 4Q 2012 Supplemental Earnings Information 27 Speculative Capital Expenditure Commitments 1 Speculative capital for the three months ended June 30, 2011 includes $2.9 million success based capital for fiber associated with the GigE PAC government stimulus award 2 Speculative capital for the three months ended September 30, 2011 includes several ZB projects associated with national carriers 3 Speculative capital for the three months ended December 31, 2011 includes $4.1 million related to the zColo expansion in Chicago 4 Speculative capital for the three months ended June 30, 2012 includes $39.2 million in Speculative FTT projects with Total Contract Value of $40 million. The $39.2 million in capital will primarily be spent on outside plant construction, expanding two of Zayo’s existing fiber networks by 675 route miles
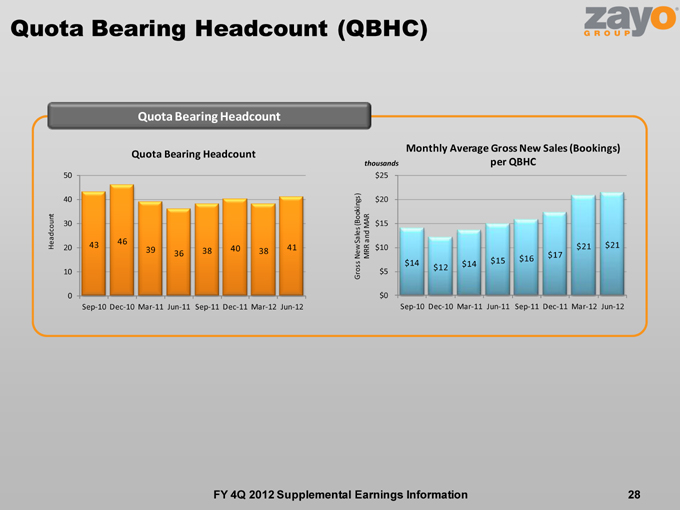
Quota Bearing Headcount (QBHC) FY 4Q 2012 Supplemental Earnings Information 28 Quota Bearing Headcount Quota Bearing Headcount Monthly Average Gross New Sales (Bookings) per QBHC thousands Headcount Gross New Sales (Bookings) MRR and MAR
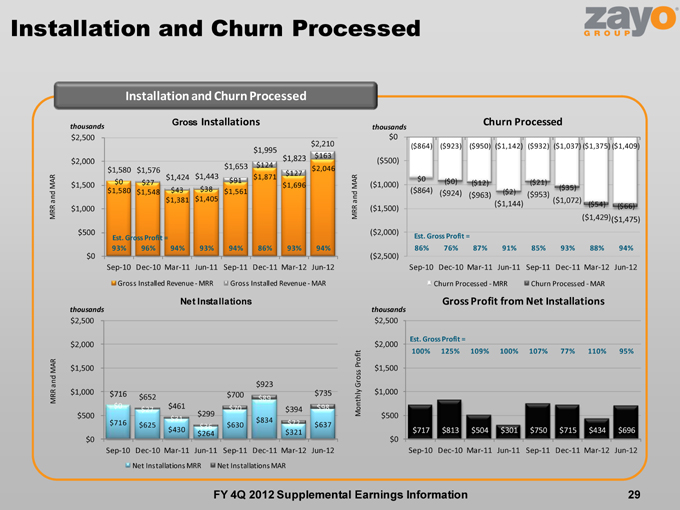
Installation and Churn Processed 29 FY 4Q 2012 Supplemental Earnings Information Installation and Churn Processed Gross Installations Churn Processed Net Installations Gross Profit from Net Installations thousands thousands thousands thousands MRR and MAR MRR and MAR MRR and MAR Monthly Gross Profit Est. Gross Profit = Est. Gross Profit = Est. Gross Profit =
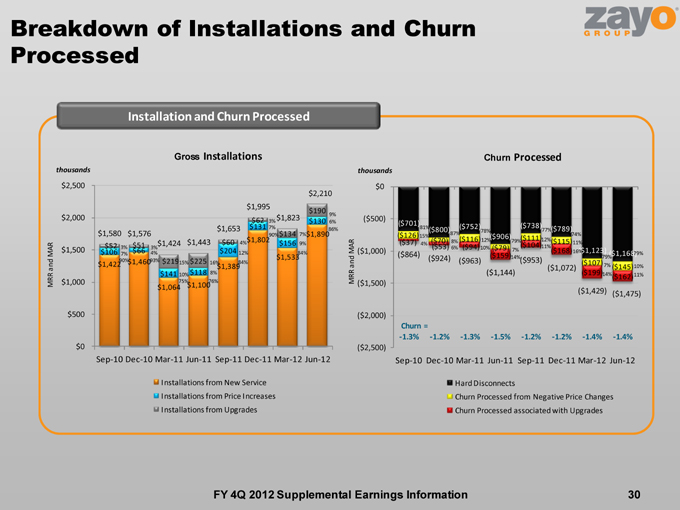
Churn = Breakdown of Installations and Churn Processed Installation and Churn Processed 30 FY 4Q 2012 Supplemental Earnings Information Gross Installations thousands Churn Processed thousands MRR and MAR MRR and MAR
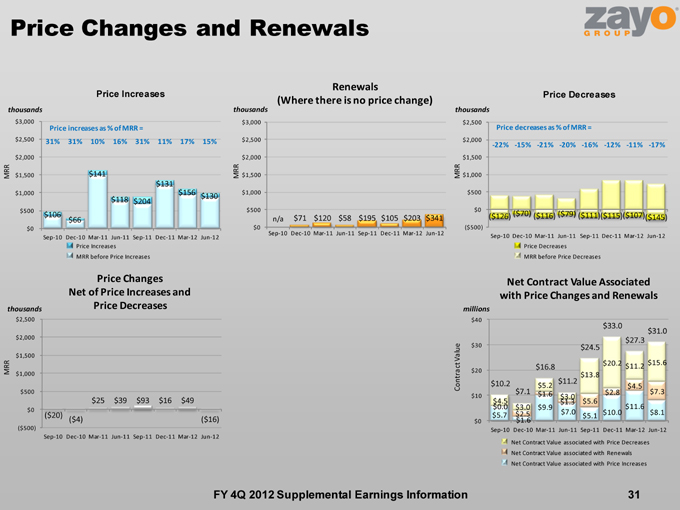
Price Changes and Renewals Price Increases Net Contract Value Associated with Price Changes and Renewals Price Decreases thousands millions thousands MRR Contract Value MRR Price Changes Net of Price Increases and Price Decreases thousands MRR 31 FY 4Q 2012 Supplemental Earnings Information Price increases as % of MRR = Price decreases as % of MRR = Price Increases MRR before Price Increases Price Decreases MRR before Price Decreases Renewals (Where there is no price change) MRR Net Contract Value associated with Price Decreases Net Contract Value associated with Renewals Net Contract Value associated with Price Increases thousands n/a
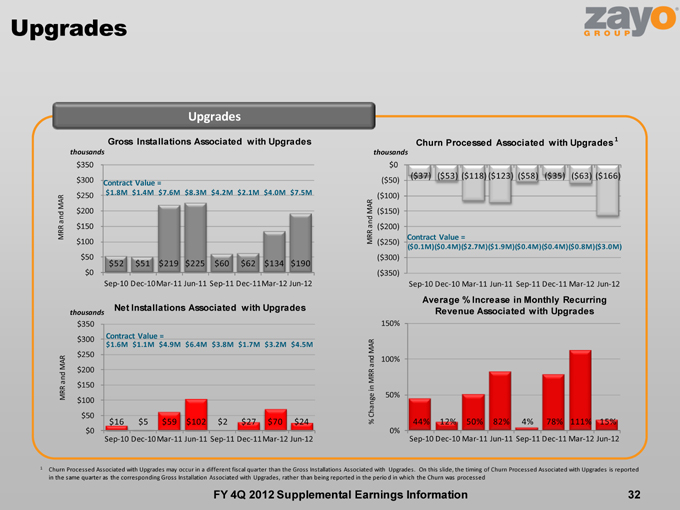
Upgrades Upgrades Gross Installations Associated with Upgrades Average % Increase in Monthly Recurring Revenue Associated with Upgrades thousands thousands thousands Churn Processed Associated with Upgrades Net Installations Associated with Upgrades 32 FY 4Q 2012 Supplemental Earnings Information MRR and MAR MRR and MAR MRR and MAR % Change in MRR and MAR Contract Value = Contract Value = Contract Value = 1 Churn Processed Associated with Upgrades may occur in a different fiscal quarter than the Gross Installations Associated with Upgrades. On this slide, the timing of Churn Processed Associated with Upgrades is reported in the same quarter as the corresponding Gross Installation Associated with Upgrades, rather than being reported in the period in which the Churn was processed 1
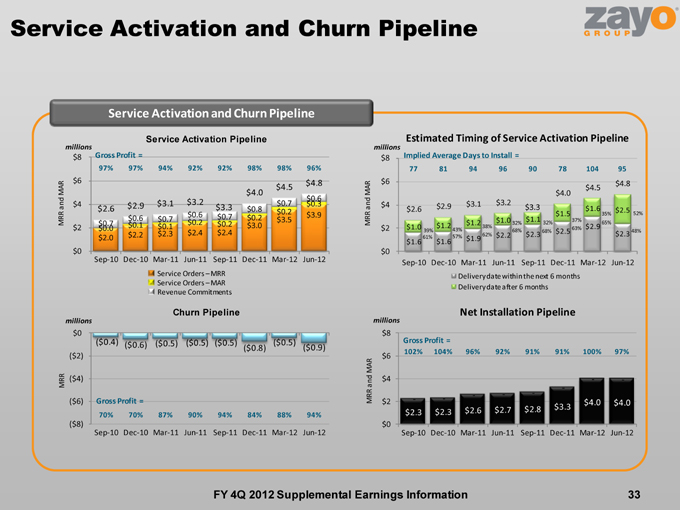
Service Activation and Churn Pipeline 33 FY 4Q 2012 Supplemental Earnings Information Service Activation and Churn Pipeline Service Activation Pipeline Estimated Timing of Service Activation Pipeline Churn Pipeline Net Installation Pipeline millions millions millions MRR and MAR MRR MRR and MAR millions Gross Profit = Gross Profit = Gross Profit = Service Orders—MRR Service Orders—MAR Revenue Commitments Implied Average Days to Install = MRR and MAR
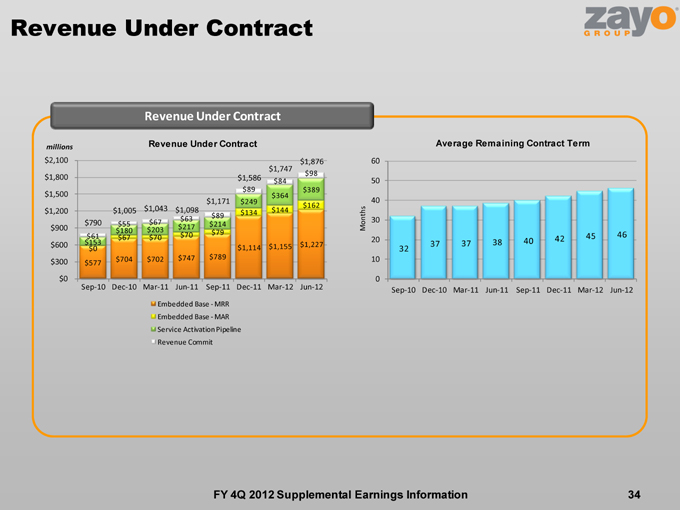
Revenue Under Contract 34 FY 4Q 2012 Supplemental Earnings Information Revenue Under Contract Revenue Under Contract millions Average Remaining Contract Term Months
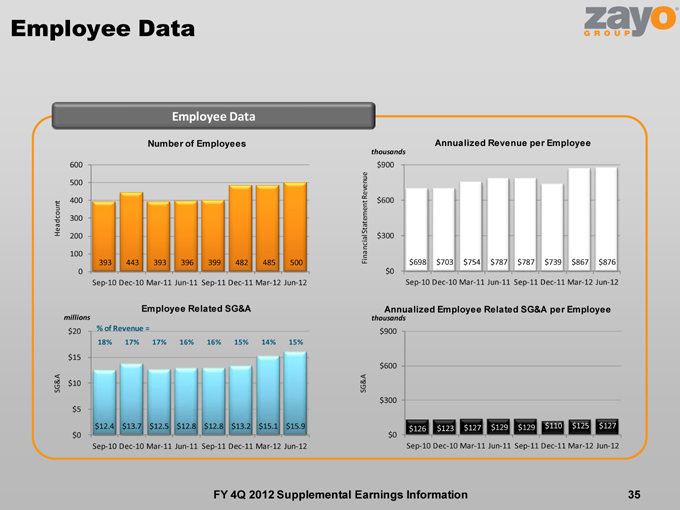
Employee Data FY 4Q 2012 Supplemental Earnings Information 35 Employee Data Number of Employees Employee Related SG&A thousands millions thousands Headcount Financial Statement Revenue SG&A SG&A % of Revenue = Annualized Revenue per Employee Annualized Employee Related SG&A per Employee
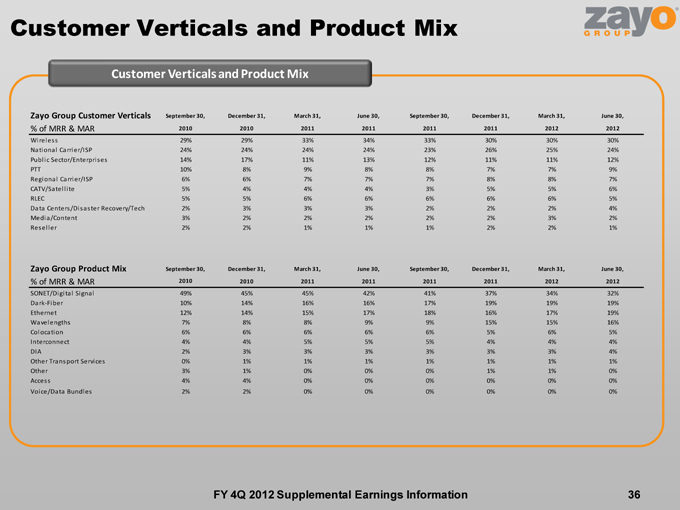
Customer Verticals and Product Mix 36 FY 4Q 2012 Supplemental Earnings Information Customer Verticals and Product Mix
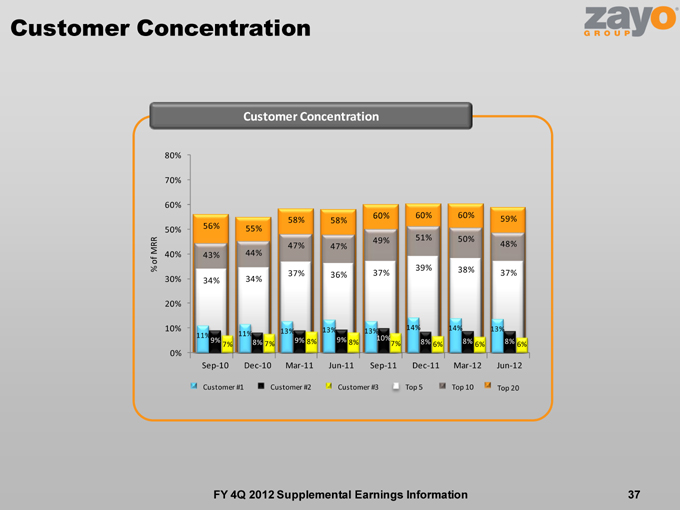
Customer Concentration 37 FY 4Q 2012 Supplemental Earnings Information Customer Concentration % of MRR Customer #1 Customer #2 Customer #3 Top 20 Top 10 Top 5
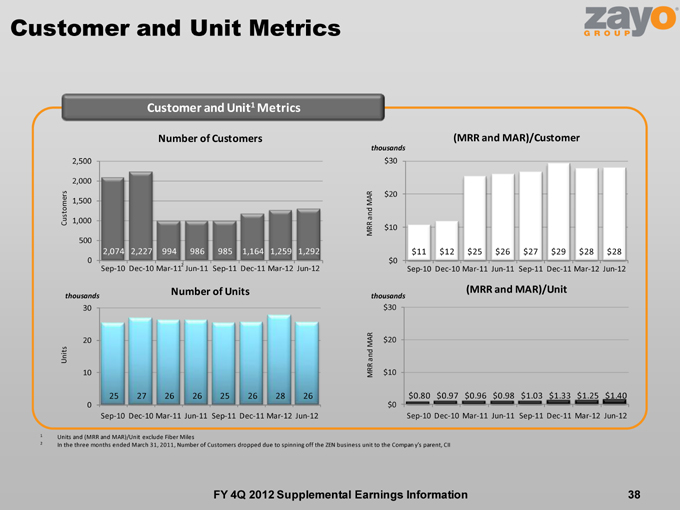
Customer and Unit Metrics Customer and Unit1 Metrics Number of Customers Number of Units (MRR and MAR)/Unit 38 FY 4Q 2012 Supplemental Earnings Information Customers MRR and MAR MRR and MAR Units (MRR and MAR)/Customer thousands thousands thousands 1 Units and (MRR and MAR)/Unit exclude Fiber Miles 2 In the three months ended March 31, 2011, Number of Customers dropped due to spinning off the ZEN business unit to the Company’s parent, CII 2
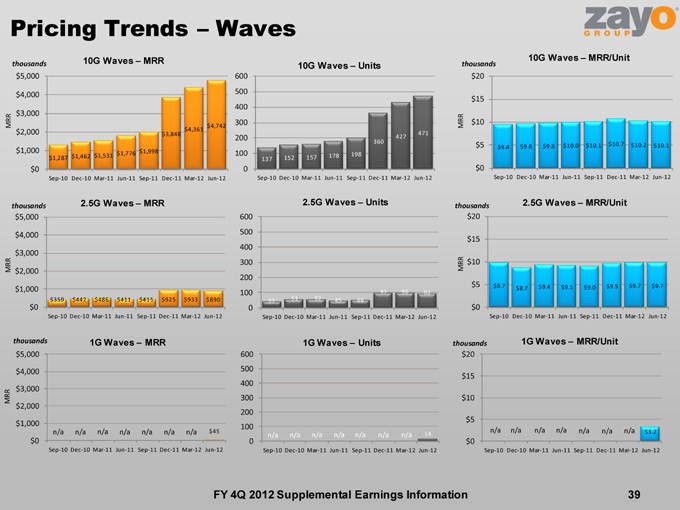
Pricing Trends—Waves FY 4Q 2012 Supplemental Earnings Information 39 thousands MRR MRR thousands thousands MRR MRR thousands thousands thousands MRR
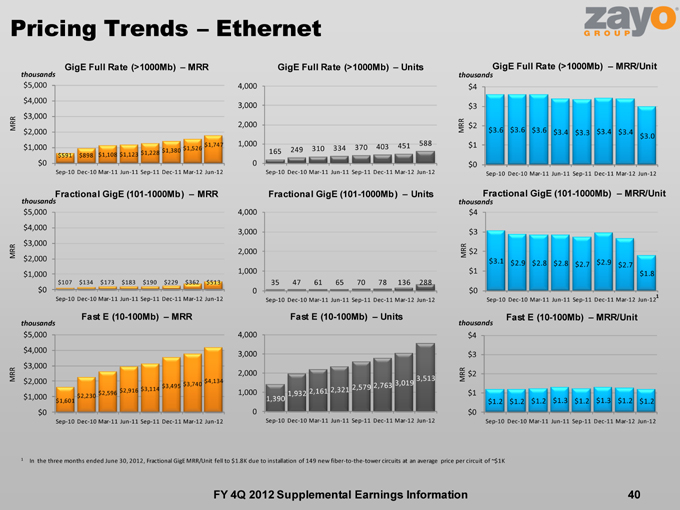
Pricing Trends—Ethernet FY 4Q 2012 Supplemental Earnings Information 40 thousands MRR MRR thousands thousands MRR MRR thousands thousands MRR MRR thousands GigE Full Rate (>1000Mb)—MRR/Unit Fractional GigE (101-1000Mb)—MRR/Unit 1 In the three months ended June 30, 2012, Fractional GigE MRR/Unit fell to $1.8K due to installation of 149 new fiber-to-the-tower circuits at an average price per circuit of ~$1K 1
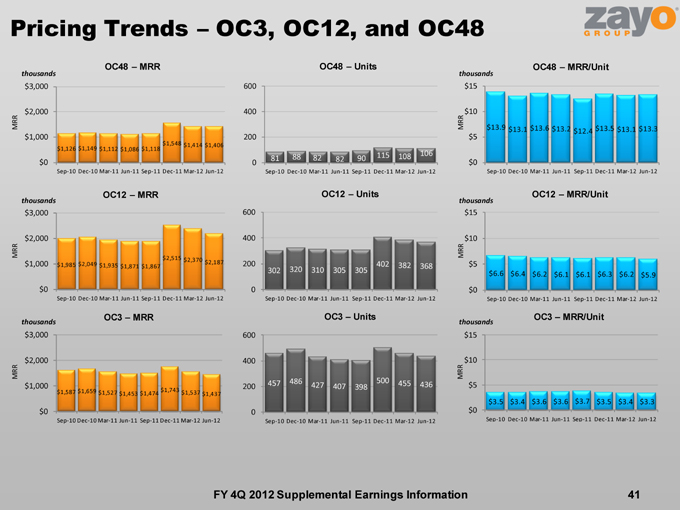
Pricing Trends—OC3, OC12, and OC48 FY 4Q 2012 Supplemental Earnings Information 41 thousands MRR MRR thousands thousands MRR MRR thousands thousands MRR MRR thousands
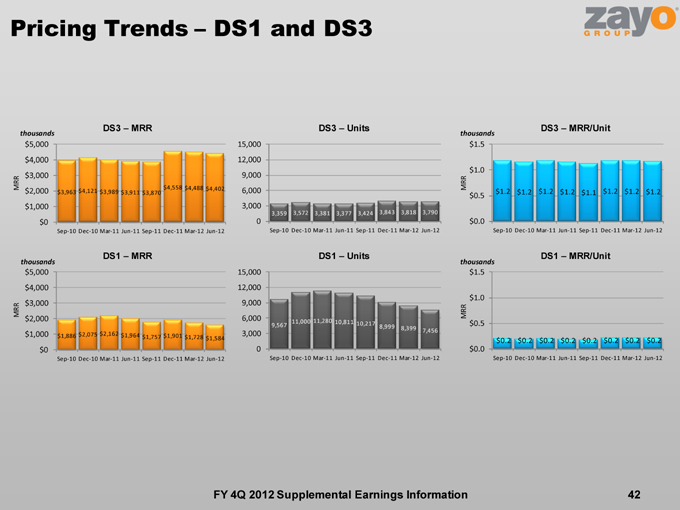
Pricing Trends—DS1 and DS3 FY 4Q 2012 Supplemental Earnings Information 42 thousands MRR MRR thousands thousands MRR MRR thousands
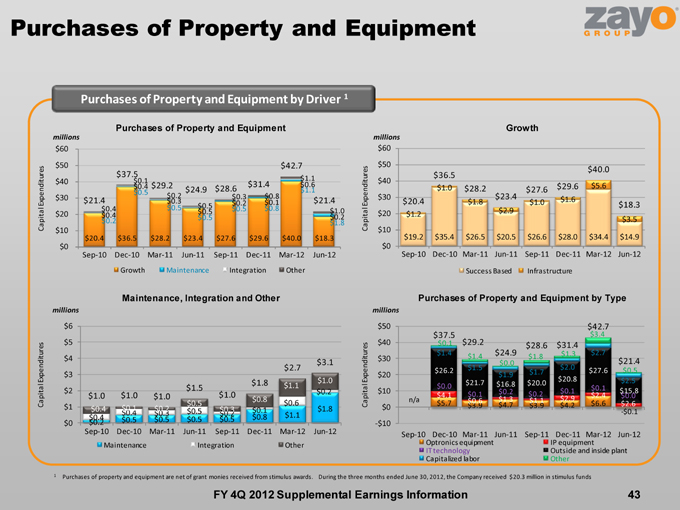
millions Purchases of Property and Equipment Purchases of Property and Equipment by Driver 1 43 FY 4Q 2012 Supplemental Earnings Information Capital Expenditures Purchases of Property and Equipment Maintenance, Integration and Other Growth Capital Expenditures Capital Expenditures Capital Expenditures millions millions millions Purchases of Property and Equipment by Type 1 Purchases of property and equipment are net of grant monies received from stimulus awards. During the three months ended June 30, 2012, the Company received $20.3 million in stimulus funds n/a
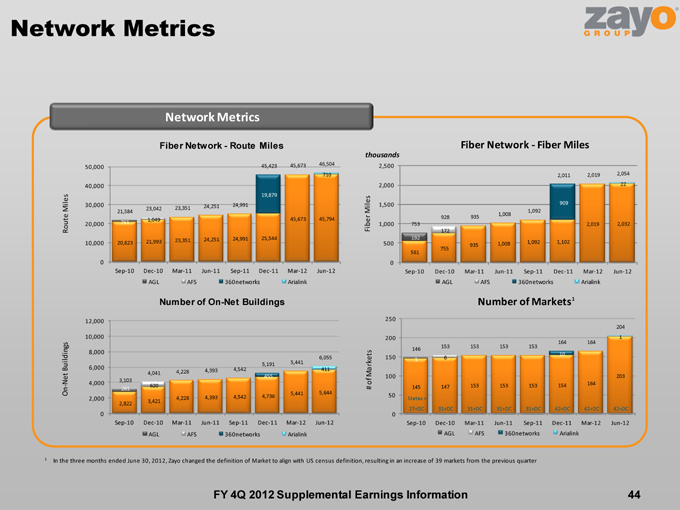
Network Metrics 44 FY 4Q 2012 Supplemental Earnings Information Network Metrics Fiber Network—Route Miles Fiber Network—Fiber Miles Number of On-Net Buildings Number of Markets Route Miles Fiber Miles On-Net Buildings # of Markets thousands 1 In the three months ended June 30, 2012, Zayo changed the definition of Market to align with US census definition, resulting in an increase of 39 markets from the previous quarter 1
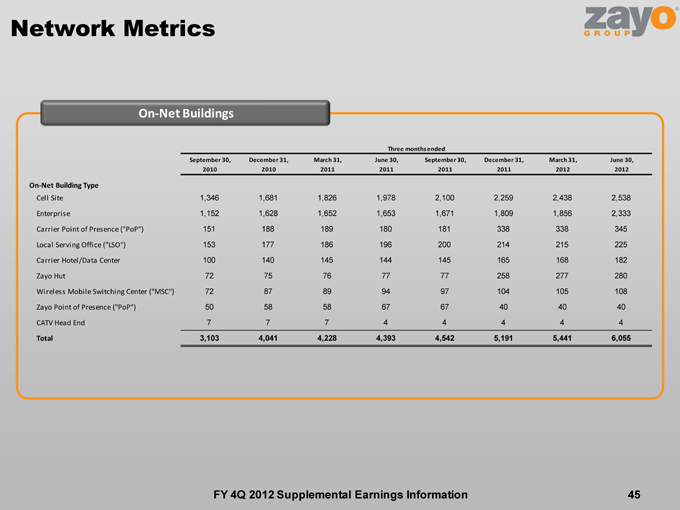
Network Metrics 45 FY 4Q 2012 Supplemental Earnings Information On-Net Buildings
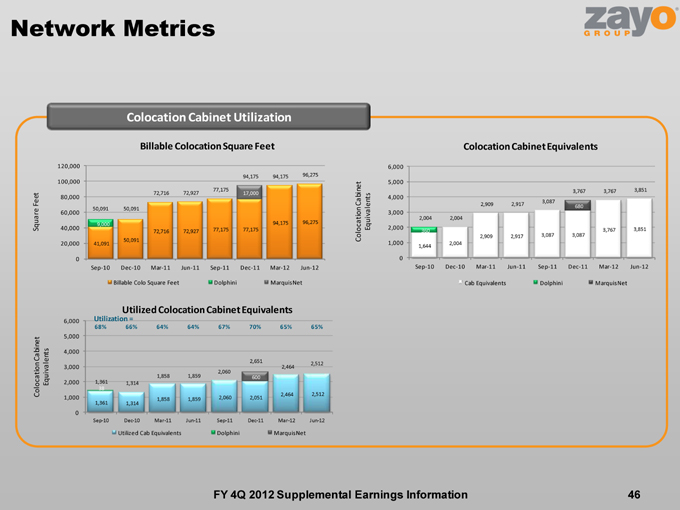
Network Metrics 46 FY 4Q 2012 Supplemental Earnings Information Colocation Cabinet Utilization Billable Colocation Square Feet Colocation Cabinet Equivalents Utilized Colocation Cabinet Equivalents Square Feet Colocation Cabinet Equivalents Colocation Cabinet Equivalents Utilization =

FY 4Q 2012 Supplemental Earnings Information 47 Fiber to the Tower
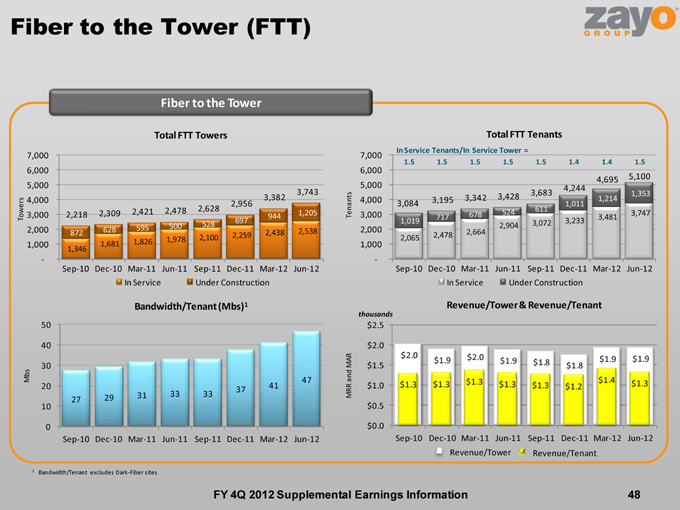
Fiber to the Tower (FTT) Fiber to the Tower Total FTT Towers Bandwidth/Tenant (Mbs)1 Revenue/Tower & Revenue/Tenant thousands 48 FY 4Q 2012 Supplemental Earnings Information Towers Tenants MRR and MAR Mbs Revenue/Tower Revenue/Tenant Total FTT Tenants In Service Tenants/In Service Tower = 1 Bandwidth/Tenant excludes Dark-Fiber sites
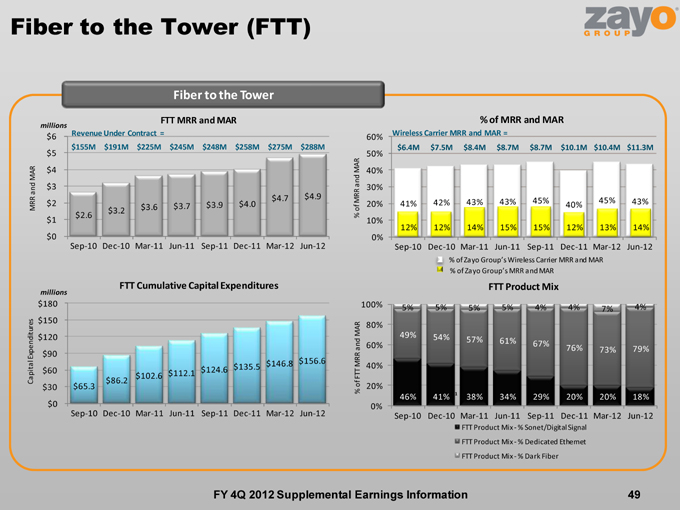
% of MRR and MAR % of MRR and MAR % of Zayo Group’s Wireless Carrier MRR and MAR Fiber to the Tower (FTT) Fiber to the Tower FTT MRR and MAR FTT Cumulative Capital Expenditures FTT Product Mix millions millions 49 FY 4Q 2012 Supplemental Earnings Information MRR and MAR % of FTT MRR and MAR Capital Expenditures % of Zayo Group’s MRR and MAR 1 Revenue Under Contract =
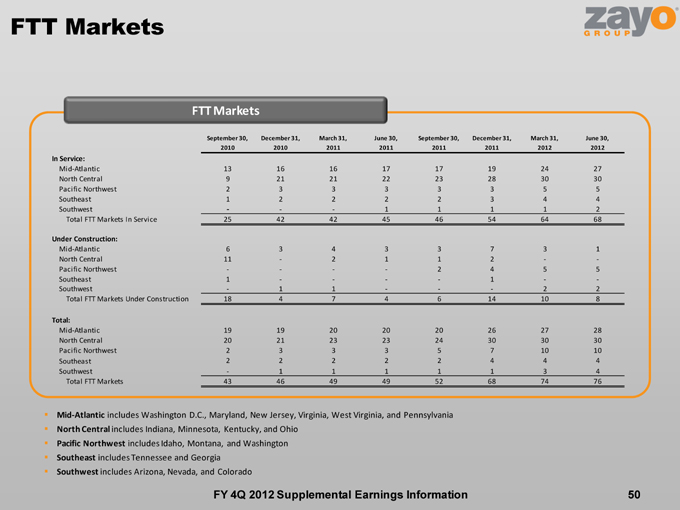
FTT Markets FTT Markets Mid-Atlantic includes Washington D.C., Maryland, New Jersey, Virginia, West Virginia, and Pennsylvania North Central includes Indiana, Minnesota, Kentucky, and Ohio Pacific Northwest includes Idaho, Montana, and Washington Southeast includes Tennessee and Georgia Southwest includes Arizona, Nevada, and Colorado 50 FY 4Q 2012 Supplemental Earnings Information

FY 4Q 2012 Supplemental Earnings Information 51 Financial Data by Business Unit
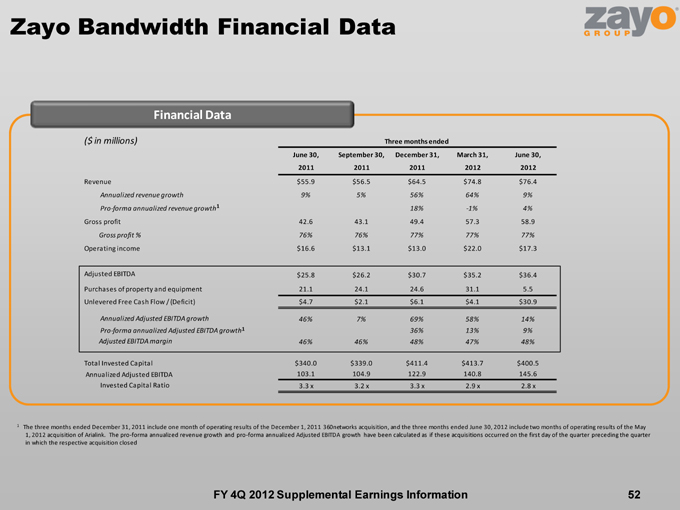
Zayo Bandwidth Financial Data 52 Financial Data FY 4Q 2012 Supplemental Earnings Information 1 The three months ended December 31, 2011 include one month of operating results of the December 1, 2011 360networks acquisition, and the three months ended June 30, 2012 include two months of operating results of the May 1, 2012 acquisition of Arialink. The pro-forma annualized revenue growth and pro-forma annualized Adjusted EBITDA growth have been calculated as if these acquisitions occurred on the first day of the quarter preceding the quarter in which the respective acquisition closed 1 1
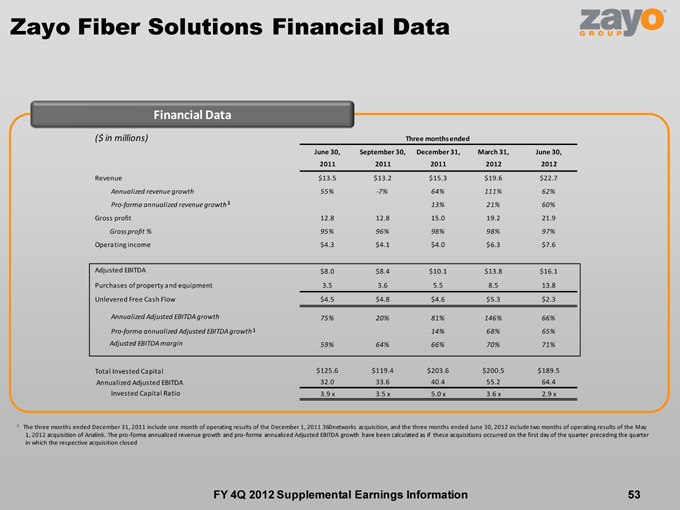
Zayo Fiber Solutions Financial Data FY 4Q 2012 Supplemental Earnings Information 53 Financial Data 1 1 1 The three months ended December 31, 2011 include one month of operating results of the December 1, 2011 360networks acquisition, and the three months ended June 30, 2012 include two months of operating results of the May 1, 2012 acquisition of Arialink. The pro-forma annualized revenue growth and pro-forma annualized Adjusted EBITDA growth have been calculated as if these acquisitions occurred on the first day of the quarter preceding the quarter in which the respective acquisition closed
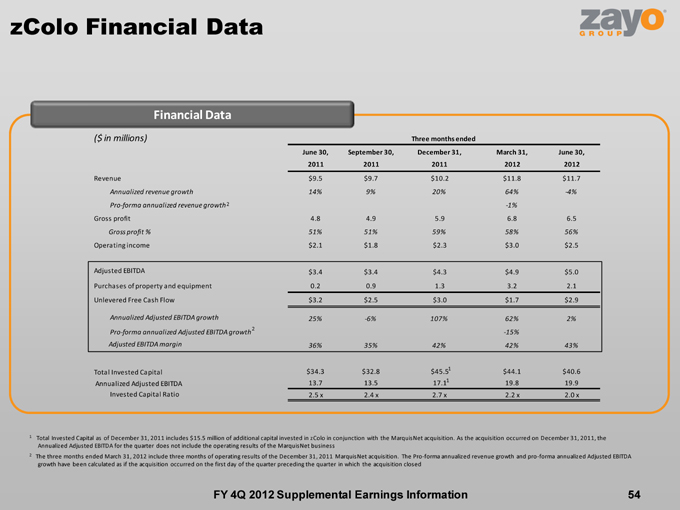
zColo Financial Data FY 4Q 2012 Supplemental Earnings Information 54 Financial Data 1 Total Invested Capital as of December 31, 2011 includes $15.5 million of additional capital invested in zColo in conjunction with the MarquisNet acquisition. As the acquisition occurred on December 31, 2011, the Annualized Adjusted EBITDA for the quarter does not include the operating results of the MarquisNet business 2 The three months ended March 31, 2012 include three months of operating results of the December 31, 2011 MarquisNet acquisition. The Pro-forma annualized revenue growth and pro-forma annualized Adjusted EBITDA growth have been calculated as if the acquisition occurred on the first day of the quarter preceding the quarter in which the acquisition closed 1 2 2 1

FY 4Q 2012 Supplemental Earnings Information 55 Historical Financial Data & Reconciliations
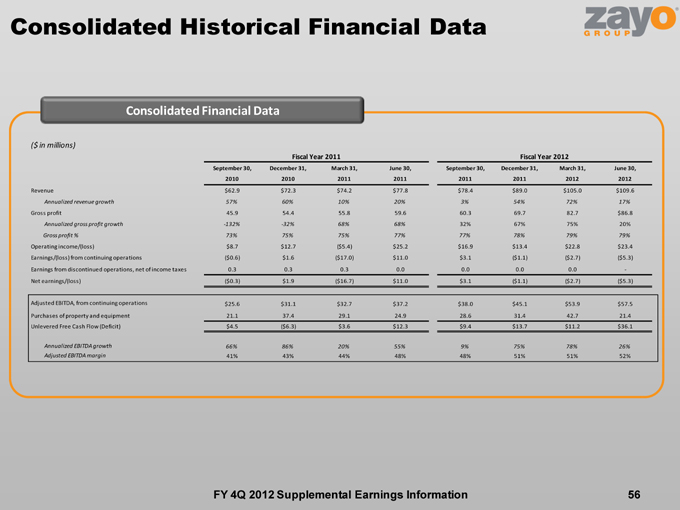
Consolidated Historical Financial Data 56 FY 4Q 2012 Supplemental Earnings Information Consolidated Financial Data
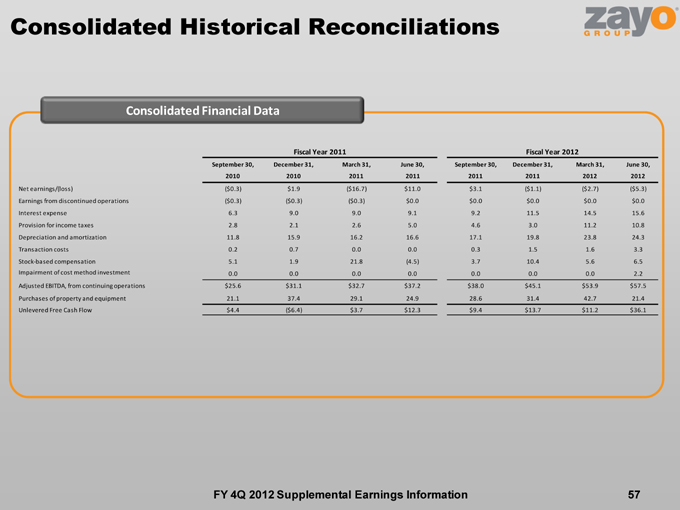
Consolidated Historical Reconciliations 57 FY 4Q 2012 Supplemental Earnings Information Consolidated Financial Data
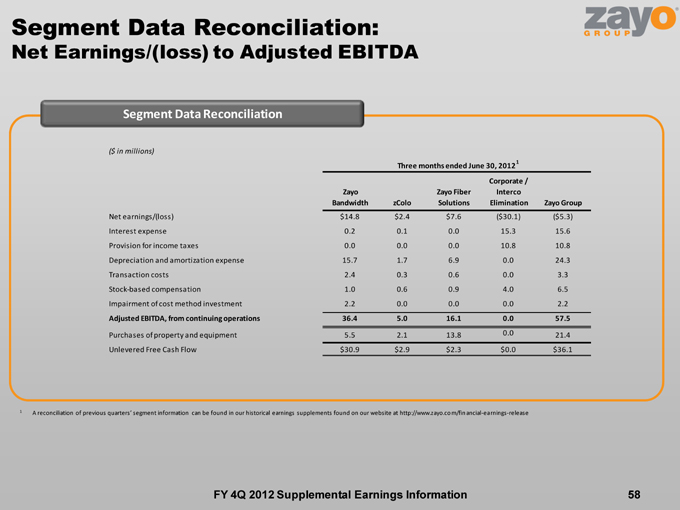
58 FY 4Q 2012 Supplemental Earnings Information Segment Data Reconciliation: Net Earnings/(loss) to Adjusted EBITDA Segment Data Reconciliation 1 A reconciliation of previous quarters’ segment information can be found in our historical earnings supplements found on our website at http://www.zayo.com/financial-earnings-release 1

59 FY 4Q 2012 Supplemental Earnings Information Pro-forma Growth Reconciliation (Supporting FY 2012 Q4 Pro-forma Growth) Pro-forma Growth Reconciliation2 1 Included in the Arialink acquisition were certain assets and liabilities which supported Arialink’s enterprise product offerings. Concurrently with the close of the Arialink acquisition, the Company spun-off the portion of Arialink’s business that supported those enterprise product offerings to the Company’s parent. The Company’s preliminary estimate of the fair value of the net assets spun-off to Holdings is approximately $1.7 million. The operating results relating to the acquired enterprise product offerings are excluded in the pro-forma results above 2 A reconciliation of previous quarter pro-forma growth can be found in our historical earnings supplements found on our website at http://www.zayo.com/financial-earnings-release 1 1