
Fiscal Year 2Q 2014 Supplemental Earnings Information FY 2Q 2014 Supplemental Earnings Information 1

Forward-Looking Statements Information contained in this supplemental presentation that is not historical by nature constitutes “forward-looking statements” which can be identified by the use of forward-looking terminology such as “believes,” “expects,” “plans,” “intends,” “estimates,” “projects,” “could,” “may,” “will,” “should,” or “anticipates” or the negatives thereof, other variations thereon or comparable terminology, or by discussions of strategy. No assurance can be given that future results expressed or implied by the forward-looking statements will be achieved and actual results may differ materially from those contemplated by the forward-looking statements. Such statements are based on management’s current expectations and beliefs and are subject to a number of risks and uncertainties that could cause actual results to differ materially from those expressed or implied by the forward- looking statements. These risks and uncertainties include, but are not limited to, those relating to the Company’s financial and operating prospects, current economic trends, future opportunities, ability to retain existing customers and attract new ones, outlook of customers, and strength of competition and pricing. In addition, there is risk and uncertainty in the Company’s acquisition strategy including our ability to integrate acquired companies and assets. Specifically there is a risk associated with our recent Colocation Asset Purchase, and acquisitions of Access and FiberLink, and the benefits thereof, including financial and operating results and synergy benefits that may be realized from these acquisitions and the timeframe for realizing these benefits. Other factors and risks that may affect our business and future financial results are detailed in our Annual Report on Form 10-K Item 1A: “Risk Factors.” We caution you not to place undue reliance on these forward-looking statements, which speak only as of their respective dates. We undertake no obligation to publicly update or revise forward-looking statements to reflect events or circumstances after releasing this supplemental information or to reflect the occurrence of unanticipated events, except as required by law. FY 2Q 2014 Supplemental Earnings Information 2

Presentation of Certain Consolidated Pro-forma Financial Data Acquisitions have been, and are expected to continue to be, a component of the Company’s strategy. In this Supplemental Earnings Information under “Consolidated Financial Data,” the Company sets forth its pro-forma annualized revenue growth rate and pro-forma annualized Adjusted EBITDA growth rates for the fiscal quarters impacted by the Company’s acquisitions. These pro-forma measures are intended to provide additional information regarding such rates of growth on a more comparable basis than would be provided without such pro-forma adjustments. With regard to the recent acquisitions that impact the financial data reported within this supplemental earnings presentation (i.e. AboveNet, FiberGate, USCarrier, First Telecom, Litecast, Core NAP, a Colocation Asset Purchase, Access, and FiberLink), the Company has calculated its pro- forma annualized revenue growth rate and pro-forma annualized Adjusted EBITDA growth rates as if the acquisitions occurred on the first day of the quarter preceding the respective quarter in which the acquisition closed. In making such adjustments, the Company made certain pro-forma adjustments to the revenue and Adjusted EBITDA of the acquired entities, which principally include an adjustment related to the estimated fair value of the acquired deferred revenue balance and the elimination of historical transactions between Zayo and the acquired company, but do not include cost savings and other synergies that were only realized following completion of the acquisitions. See “Pro-forma Growth Reconciliation” slides. The Company provides the pro-forma annualized revenue growth rate and pro-forma annualized Adjusted EBITDA growth rate for the fiscal quarters impacted by acquisitions on the slide entitled “Consolidated Financial Data.” Similarly, the Company presents pro-forma annualized revenue and pro-forma annualized Adjusted EBITDA growth rates for its operating segments. The calculation of the pro-forma growth rates includes both the impact of the aforementioned acquisitions and the impact of transfers between the segments. The pro-forma growth rates, if applicable to the reporting segments, are presented on slides entitled: “Zayo Wavelength Services Financial Data”; “Zayo SONET Services Financial Data”; “Zayo Ethernet Services Financial Data”; “Zayo IP Services Financial Data”; “Zayo Mobile Infrastructure Group Financial Data”; “zColo Financial Data”; and “Zayo Dark Fiber Financial Data” within the “Financial Data by Reporting Segment” section of this supplemental earnings presentation. 3 FY 2Q 2014 Supplemental Earnings Information
Non-GAAP Financial Measures The Company provides financial measures that are not defined under generally accepted accounting principles in the United States, or GAAP, including earnings before interest, taxes, depreciation and amortization (“EBITDA”) and Adjusted EBITDA. EBITDA and Adjusted EBITDA are not measurements of our financial performance under GAAP and should not be considered in isolation or as alternatives to net earnings or any other performance measures derived in accordance with GAAP or as alternatives to cash flows from operating activities as measures of our liquidity. “Adjusted EBITDA” is defined as EBITDA from continuing operations adjusted to exclude transaction costs related to acquisitions, stock-based compensation, and certain non-cash or non-recurring items. Management uses Adjusted EBITDA to evaluate operating performance and this financial measure is among the primary measures used by management for planning and forecasting of future periods. The Company believes that the presentation of Adjusted EBITDA is relevant and useful for investors because it allows investors to view results in a manner similar to the method used by management and makes it easier to compare our results with the results of other companies that have different financing and capital structures. Adjusted EBITDA has limitations as an analytical tool, and should not be considered in isolation from, or as a substitute for, analysis of our results as reported under GAAP. For example, Adjusted EBITDA: does not reflect capital expenditures, or future requirements for capital and major maintenance expenditures or contractual commitments; does not reflect changes in, or cash requirements for, our working capital needs; does not reflect the significant interest expense, or the cash requirements necessary to service the interest payments, on our debt; and does not reflect cash required to pay income taxes The Company’s computation of Adjusted EBITDA may not be comparable to other similarly titled measures computed by other companies, because all companies do not calculate Adjusted EBITDA in the same fashion. Because the Company has acquired numerous entities since inception and incurred transaction costs in connection with each acquisition, has borrowed money in order to finance operations, has used capital and intangible assets in the business, and because the payment of income taxes is necessary if taxable income is generated, any measure that excludes these items has material limitations. As a result of these limitations, Adjusted EBITDA should not be considered as a measure of discretionary cash available to invest in the growth of the business or as a measure of liquidity. In addition to Adjusted EBITDA, management uses Unlevered Free Cash Flow, which measures the ability of Adjusted EBITDA to cover capital expenditures. Adjusted EBITDA is a performance rather than cash flow measure. Correlating our capital expenditures to our Adjusted EBITDA does not imply that we will be able to fund such capital expenditures solely with cash from operations. Gross profit, defined as revenue less operating costs, excluding depreciation and amortization, is used by management to assess profitability prior to selling, general and administrative expenses, stock-based compensation and depreciation and amortization. The Company also provides invested capital and the ratio of invested capital to Adjusted EBITDA. Management uses invested capital and the invested capital ratio to assess value creation in the business. Tables reconciling such non-GAAP measures are included in the Historical Financial Data & Reconciliations section of this presentation. A glossary of terms used throughout is available under the investor section of the Company’s website at http://www.zayo.com/investor-center. 4 FY 2Q 2014 Supplemental Earnings Information

Other Notes Operating Measures This earnings supplement contains operating measures used by the Company in managing the business. Management believes that providing this information enables analysts, investors, and others to obtain a better understanding of the Company’s operating performance and to evaluate the efficacy of the methodology and information used by management to evaluate and measure such performance on a standalone and comparative basis. Certain supplemental information provided and related definitions may not be directly comparable to similarly titled items reported by other companies. Further, the Company may, from time to time, revise the calculation or presentation of certain operating measures. Revisions Certain prior period operating measures have been revised to reflect corrections or reclassifications of data. These revisions are not material and have no impact on the Company’s reported financial results. Estimates Certain operating measures presented herein are based on estimates. The measures are noted as estimates where presented and include: (1) estimated gross profit on net new sales (bookings); (2) estimated capital expenditures associated with net new sales (bookings); (3) estimated payback period on net new sales (bookings)(calculated); (4) estimated commitments of speculative capital expenditures; (5) estimated timing of service activation pipeline conversion; and (6) planned synergies. Rounding Components may not sum due to rounding. Lease Termination Costs During the quarter ended June 30, 2013, the Company recorded a charge for lease termination costs totaling $10.2 million related to exit activities initiated for unutilized space associated with leased office and technical facilities. In connection with integration activities associated with acquisitions completed during fiscal years 2012 and 2013, the Company completed an analysis of existing and acquired facilities leases and determined that certain facilities under lease would not be used by the Company in the future. The charge was included in operating costs and selling, general and administrative expenses and was included within earnings (loss) from continuing operations of the Company for the three months ended June 30, 2013. Debt Re-pricing Under the terms of the Fifth Amendment, effective November 26, 2013, the Company’s $1.6 billion term loan was increased by $150 million to $1.75 billion and now bears interest at LIBOR plus 3.0 percent (the “Term Loan LIBOR Spread”) with a minimum LIBOR rate of 1.0 percent. The amended terms represent a downward adjustment of 50 basis points on the Term Loan LIBOR Spread from the Fourth Amendment to the Original Credit Agreement. The Company’s revolving credit facility now bears interest at LIBOR plus 2.75 percent (based on the Company’s current leverage ratio) (the “Revolving Loan LIBOR Spread”), which represents a downward adjustment of 25 basis points on the Revolving Loan LIBOR Spread from the Fourth Amendment to the Original Credit Agreement. In connection with the Fifth Amendment, the Company did not incur a re-pricing premium. 5 FY 2Q 2014 Supplemental Earnings Information
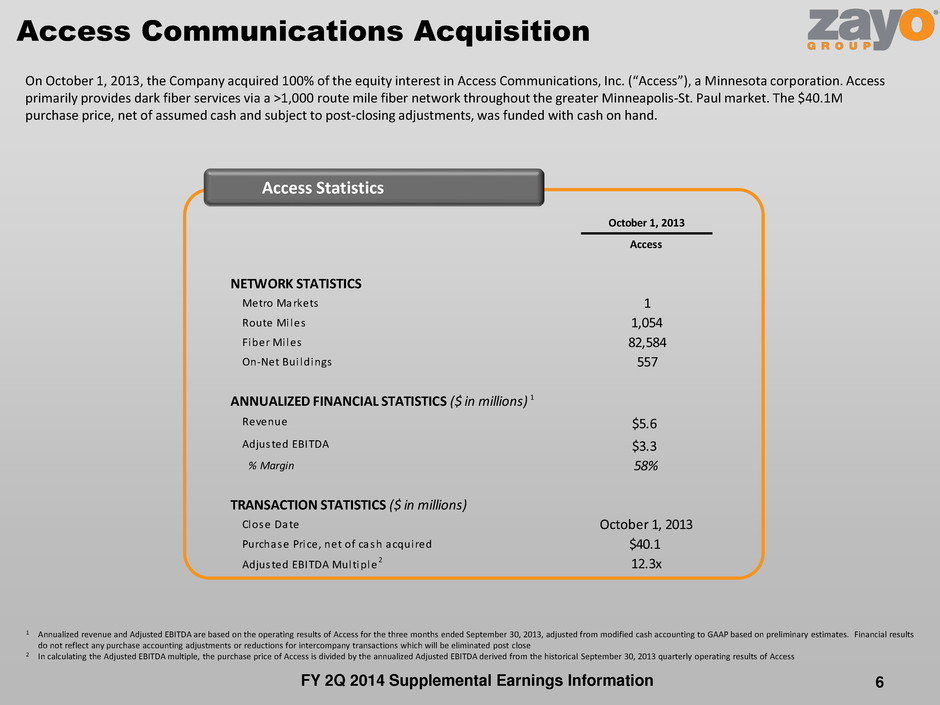
October 1, 2013 Access NETWORK STATISTICS Metro Markets 1 Route Mi les 1,054 Fiber Mi les 82,584 On-Net Bui ldings 557 ANNUALIZED FINANCIAL STATISTICS ($ in millions) 1 Revenue $5.6 Adjusted EBITDA $3.3 % Margin 58% TRANSACTION STATISTICS ($ in millions) Close Date October 1, 2013 Purchase Price, net of cash acquired $40.1 Adjusted EBITDA Multiple 2 12.3x Access Communications Acquisition Access Statistics 1 Annualized revenue and Adjusted EBITDA are based on the operating results of Access for the three months ended September 30, 2013, adjusted from modified cash accounting to GAAP based on preliminary estimates. Financial results do not reflect any purchase accounting adjustments or reductions for intercompany transactions which will be eliminated post close 2 In calculating the Adjusted EBITDA multiple, the purchase price of Access is divided by the annualized Adjusted EBITDA derived from the historical September 30, 2013 quarterly operating results of Access On October 1, 2013, the Company acquired 100% of the equity interest in Access Communications, Inc. (“Access”), a Minnesota corporation. Access primarily provides dark fiber services via a >1,000 route mile fiber network throughout the greater Minneapolis-St. Paul market. The $40.1M purchase price, net of assumed cash and subject to post-closing adjustments, was funded with cash on hand. FY 2Q 2014 Supplemental Earnings Information 6
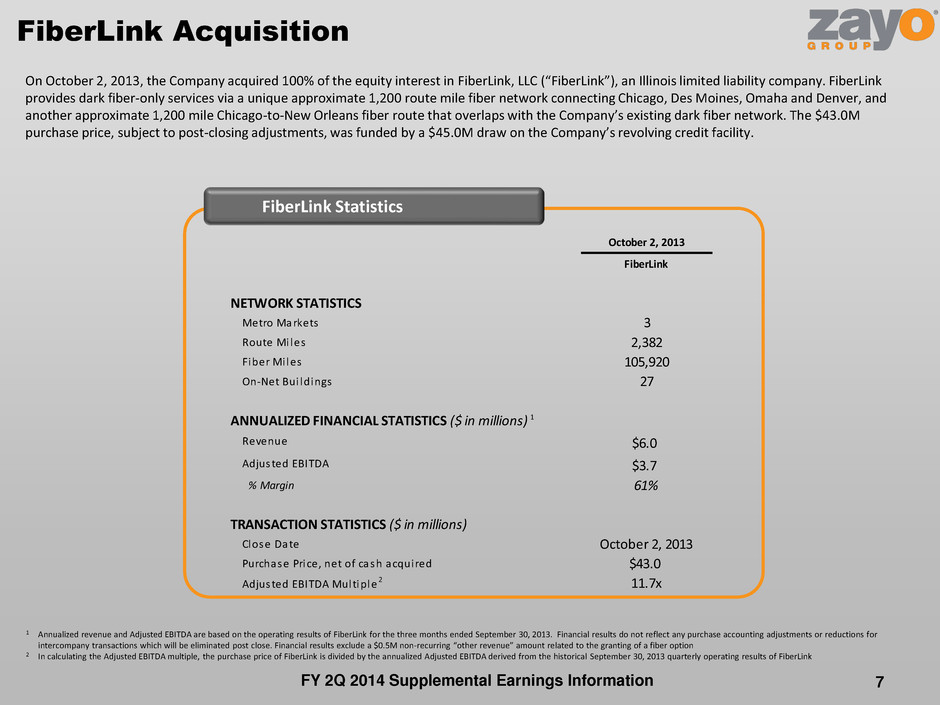
FiberLink Acquisition FiberLink Statistics 1 Annualized revenue and Adjusted EBITDA are based on the operating results of FiberLink for the three months ended September 30, 2013. Financial results do not reflect any purchase accounting adjustments or reductions for intercompany transactions which will be eliminated post close. Financial results exclude a $0.5M non-recurring “other revenue” amount related to the granting of a fiber option 2 In calculating the Adjusted EBITDA multiple, the purchase price of FiberLink is divided by the annualized Adjusted EBITDA derived from the historical September 30, 2013 quarterly operating results of FiberLink On October 2, 2013, the Company acquired 100% of the equity interest in FiberLink, LLC (“FiberLink”), an Illinois limited liability company. FiberLink provides dark fiber-only services via a unique approximate 1,200 route mile fiber network connecting Chicago, Des Moines, Omaha and Denver, and another approximate 1,200 mile Chicago-to-New Orleans fiber route that overlaps with the Company’s existing dark fiber network. The $43.0M purchase price, subject to post-closing adjustments, was funded by a $45.0M draw on the Company’s revolving credit facility. October 2, 2013 FiberLink NETWORK STATISTICS Metro Markets 3 Route Mi les 2,382 Fiber Mi les 105,920 On-Net Bui ldings 27 ANNUALIZED FINANCIAL STATISTICS ($ in millions) 1 Revenue $6.0 Adjusted EBIT A $3.7 % Margin 61% TRANSACTION STATISTICS ($ in millions) Close Date October 2, 2013 Purchase Price, net of cash acquired $43.0 Adjusted EBITDA Multiple 2 11.7x FY 2Q 2014 Supplemental Earnings Information 7

(in millions unless noted) Close Date Purchase Price Estimated Revenue LQA2 Estimated Adjusted EBITDA LQA2 Pre-Synergy Multiple Planned Synergies Adjusted EBITDA LQA + Synergies Post Synergy Multiple Memphis Networx* Jul-07 9.2 $5.4 $1.2 7.7x 0.0 $1.2 7.7x PPL Aug-07 46.3 32.1 7.2 6.5x 0.6 7.8 6.0x IFW Sep-07 22.6 2.3 (1.7) NM 1.0 (0.7) NM Onvoy* Nov-07 26.9 27.9 4.9 6.1x 3.2 8.1 4.0x Voicepipe* Nov-07 N/A N/A N/A N/A N/A N/A N/A Citynet Feb-08 99.2 31.5 8.1 12.2x 1.5 9.6 10.3x NTI May-08 5.2 8.5 1.3 4.0x 0.6 1.9 2.7x Ctel Tri-State Mkts* Jul-08 1.7 1.8 (1.0) NM 2.5 1.5 NM CFS Sep-08 12.1 3.6 2.4 5.1x 0.0 2.4 5.1x Citynet Retail Sep-08 3.4 0.1 (0.3) NM 0.0 (0.3) NM Adesta Sep-08 6.4 0.5 (0.2) NM 0.0 (0.2) NM NTI (California) May-09 N/A N/A N/A N/A N/A N/A N/A Fibernet Sep-09 96.6 64.3 13.3 7.3x 15.3 28.6 3.4x AGL Networks Jul-10 73.7 21.6 11.6 6.4x 1.6 13.2 5.6x Dolphini Sep-10 0.2 0.1 (0.1) NM 0.1 (0.1) NM AFS Oct-10 114.1 31.6 13.6 8.4x 6.6 20.2 5.6x 360* Dec-11 332.2 79.0 27.2 12.2x 14.0 41.2 8.1x Marquisnet Dec-11 13.6 6.6 2.9 4.6x 1.0 3.9 3.5x Arialink* May-12 15.4 4.6 2.6 6.0x 0.6 3.1 4.9x AboveNet* Jul-12 2,188.6 478.3 240.4 9.1x 77.0 317.4 6.9x Fibergate Aug-12 118.3 15.1 10.7 11.1x 1.5 12.2 9.7x USCarrier Oct-12 16.1 16.3 4.2 3.8x 2.5 6.8 2.4x First Telecom Services Dec-12 109.7 31.3 7.7 14.3x 3.3 11.0 10.0x LiteCast Dec-12 22.2 3.8 2.2 9.9x 0.8 3.0 7.3x Core NAP May-13 7.1 5.3 1.1 6.4x 1.0 2.1 3.4x Colocation Asset Purchase Aug-13 15.2 7.8 (1.6) NM 4.5 2.9 5.3x Access Communications Oct-13 40.1 5.6 3.3 12.3x 1.1 4.4 9.2x Fiberlink Oct-13 43.0 6.0 3.7 11.7x 1.2 4.9 8.8x $3,439.0 $890.8 $364.6 9.4x $141.4 $505.9 6.8x 2.4 years 2.0 years Sum/Weighted Avg Average age of investment (weighted by size, in years): Weighted Average Multiple = 9.4x Pre-Synergy and 6.8x Post Synergy 8 ZGL Acquisition History1 1 Companies denoted by * indicate Purchase Price was adjusted for value attributed to Onvoy Voice Services / Zayo Enterprise Networks / Zayo Professional Services spin-offs 2 Estimated Revenue LQA and Adjusted EBITDA LQA represents the Revenue and Adjusted EBITDA (adjusted for estimated purchase accounting adjustments) recognized by the acquired entity during the last quarterly period immediately preceding the respective acquisition date multiplied by four FY 2Q 2014 Supplemental Earnings Information
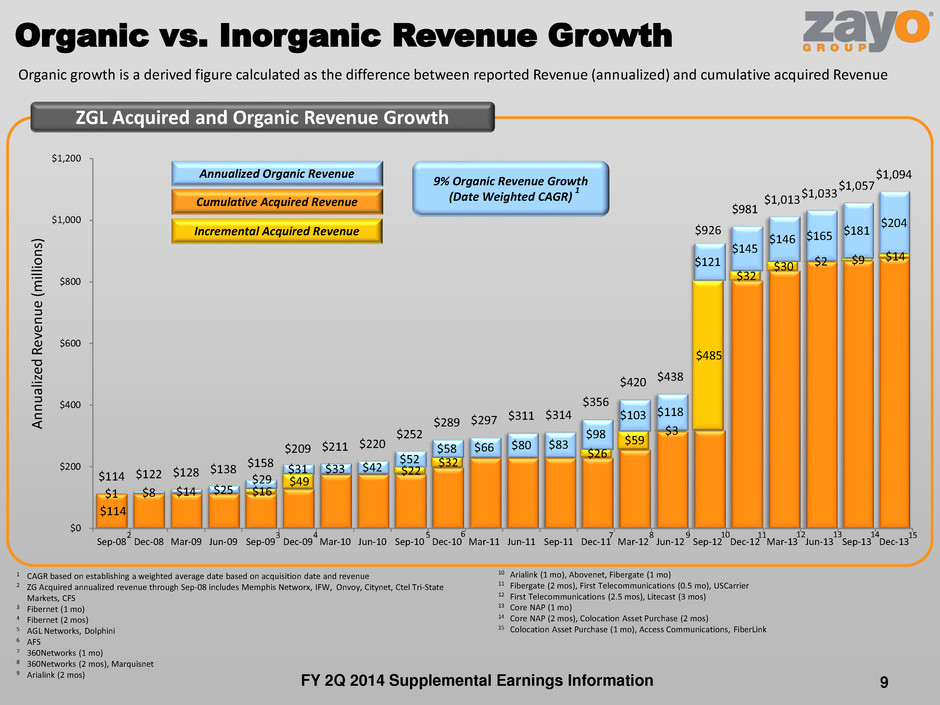
$114 $16 $49 $22 $32 $26 $59 $3 $485 $32 $30 $2 $9 $14 $1 $8 $14 $25 $29 $31 $33 $42 $52 $58 $66 $80 $83 $98 $103 $118 $121 $145 $146 $165 $181 $204 $114 $122 $128 $138 $158 $209 $211 $220 $252 $289 $297 $311 $314 $356 $420 $438 $926 $981 $1,013 $1,033 $1,057 $1,094 $0 $200 $400 $600 $800 $1,000 $1,200 Sep-08 Dec-08 Mar-09 Jun-09 Sep-09 Dec-09 Mar-10 Jun-10 Sep-10 Dec-10 Mar-11 Jun-11 Sep-11 Dec-11 Mar-12 Jun-12 Sep-12 Dec-12 Mar-13 Jun-13 Sep-13 Dec-13 A n n u ali ze d R ev en u e (milli o n s) ZGL Acquired and Organic Revenue Growth 3 4 5 6 7 8 1 CAGR based on establishing a weighted average date based on acquisition date and revenue 2 ZG Acquired annualized revenue through Sep-08 includes Memphis Networx, IFW, Onvoy, Citynet, Ctel Tri-State Markets, CFS 3 Fibernet (1 mo) 4 Fibernet (2 mos) 5 AGL Networks, Dolphini 6 AFS 7 360Networks (1 mo) 8 360Networks (2 mos), Marquisnet 9 Arialink (2 mos) 2 Organic vs. Inorganic Revenue Growth 9 10 10 Arialink (1 mo), Abovenet, Fibergate (1 mo) 11 Fibergate (2 mos), First Telecommunications (0.5 mo), USCarrier 12 First Telecommunications (2.5 mos), Litecast (3 mos) 13 Core NAP (1 mo) 14 Core NAP (2 mos), Colocation Asset Purchase (2 mos) 15 Colocation Asset Purchase (1 mo), Access Communications, FiberLink 11 Organic growth is a derived figure calculated as the difference between reported Revenue (annualized) and cumulative acquired Revenue 9 12 13 9% Organic Revenue Growth (Date Weighted CAGR) 1 Cumulative Acquired Revenue Annualized Organic Revenue Incremental Acquired Revenue 14 15 FY 2Q 2014 Supplemental Earnings Information
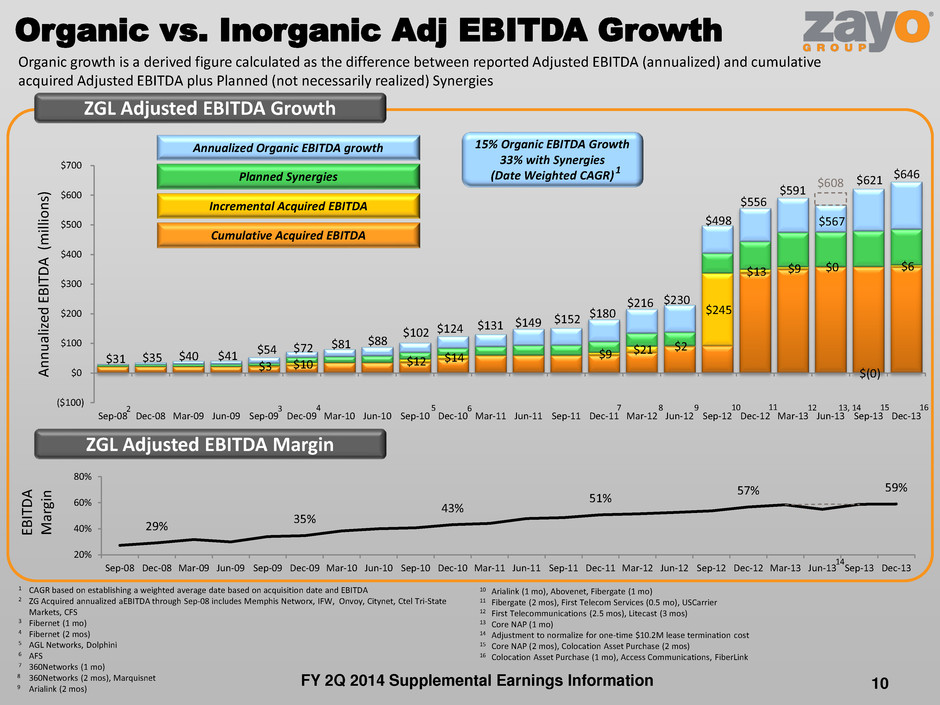
$3 $10 $12 $14 $9 $21 $2 $245 $13 $9 $0 $(0) $6 $567 $31 $35 $40 $41 $54 $72 $81 $88 $102 $124 $131 $149 $152 $180 $216 $230 $498 $556 $591 $608 $621 $646 ($100) $0 $100 $200 $300 $400 $500 $600 $700 Sep-08 Dec-08 Mar-09 Jun-09 Sep-09 Dec-09 Mar-10 Jun-10 Sep-10 Dec-10 Mar-11 Jun-11 Sep-11 Dec-11 Mar-12 Jun-12 Sep-12 Dec-12 Mar-13 Jun-13 Sep-13 Dec-13 A n n u ali ze d EB IT D A ( milli o n s) 29% 35% 43% 51% 57% 59% 20% 40% 60% 80% Sep-08 Dec-08 Mar-09 Jun-09 Sep-09 Dec-09 Mar-10 Jun-10 Sep-10 Dec-10 Mar-11 Jun-11 Sep-11 Dec-11 Mar-12 Jun-12 Sep-12 Dec-12 Mar-13 Jun-13 Sep-13 Dec-13 EB IT D A M ar gi n ZGL Adjusted EBITDA Growth ZGL Adjusted EBITDA Margin 1 CAGR based on establishing a weighted average date based on acquisition date and EBITDA 2 ZG Acquired annualized aEBITDA through Sep-08 includes Memphis Networx, IFW, Onvoy, Citynet, Ctel Tri-State Markets, CFS 3 Fibernet (1 mo) 4 Fibernet (2 mos) 5 AGL Networks, Dolphini 6 AFS 7 360Networks (1 mo) 8 360Networks (2 mos), Marquisnet 9 Arialink (2 mos) Organic vs. Inorganic Adj EBITDA Growth 10 10 Arialink (1 mo), Abovenet, Fibergate (1 mo) 11 Fibergate (2 mos), First Telecom Services (0.5 mo), USCarrier 12 First Telecommunications (2.5 mos), Litecast (3 mos) 13 Core NAP (1 mo) 14 Adjustment to normalize for one-time $10.2M lease termination cost 15 Core NAP (2 mos), Colocation Asset Purchase (2 mos) 16 Colocation Asset Purchase (1 mo), Access Communications, FiberLink Organic growth is a derived figure calculated as the difference between reported Adjusted EBITDA (annualized) and cumulative acquired Adjusted EBITDA plus Planned (not necessarily realized) Synergies 2 3 4 5 6 7 8 10 11 9 12 13, 14 15% Organic EBITDA Growth 33% with Synergies (Date Weighted CAGR) 1 14 Cumulative Acquired EBITDA Annualized Organic EBITDA growth Planned Synergies Incremental Acquired EBITDA 15 16 FY 2Q 2014 Supplemental Earnings Information
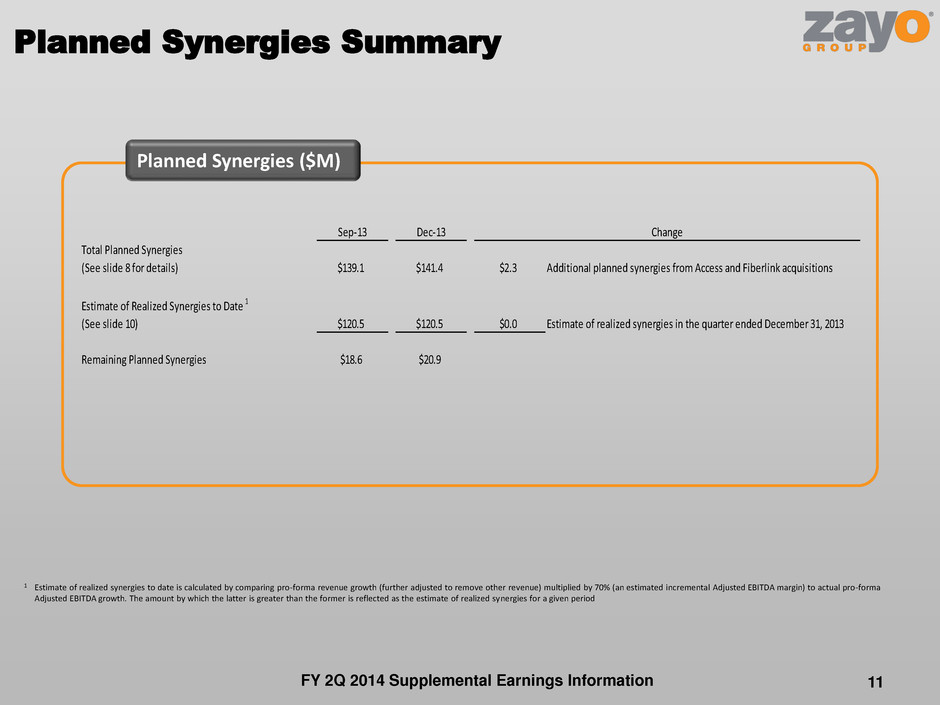
Planned Synergies Summary 11 Planned Synergies ($M) 1 Estimate of realized synergies to date is calculated by comparing pro-forma revenue growth (further adjusted to remove other revenue) multiplied by 70% (an estimated incremental Adjusted EBITDA margin) to actual pro-forma Adjusted EBITDA growth. The amount by which the latter is greater than the former is reflected as the estimate of realized synergies for a given period Sep-13 Dec-13 Change Total Planned Synergies (See slide 8 for details) $139.1 $141.4 $2.3 Additional planned synergies from Access and Fiberlink acquisitions Estimate of Realized Synergies to Date 1 (See slide 10) $120.5 $120.5 $0.0 Estimate of realized synergies in the quarter ended December 31, 2013 Remaining Planned Synergies $18.6 $20.9 FY 2Q 2014 Supplemental Earnings Information
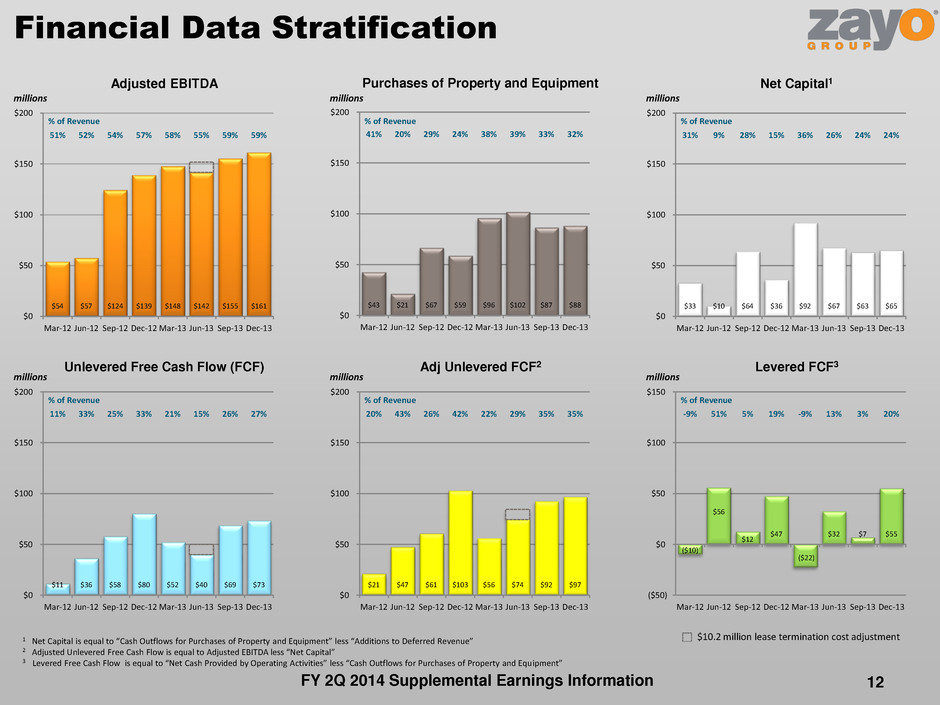
FY 2Q 2014 Supplemental Earnings Information Financial Data Stratification $43 $21 $67 $59 $96 $102 $87 $88 41% 20% 29% 24% 38% 39% 33% 32% $0 $50 $100 $150 $200 Mar-12 Jun-12 Sep-12 Dec-12 Mar-13 Jun-13 Sep-13 Dec-13 % of Revenue millions Purchases of Property and Equipment $54 $57 $124 $139 $148 $142 $155 $161 51% 52% 54% 57% 58% 55% 59% 59% $0 $50 $100 $150 $200 Mar-12 Jun-12 Sep-12 Dec-12 Mar-13 Jun-13 Sep-13 Dec-13 % of Revenue millions Adjusted EBITDA $33 $10 $64 $36 $92 $67 $63 $65 31% 9% 28% 15% 36% 26% 24% 24% $0 $50 $100 $150 $200 Mar-12 Jun-12 Sep-12 Dec-12 Mar-13 Jun-13 Sep-13 Dec-13 % of Revenue millions Net Capital1 1 Net Capital is equal to “Cash Outflows for Purchases of Property and Equipment” less “Additions to Deferred Revenue” 2 Adjusted Unlevered Free Cash Flow is equal to Adjusted EBITDA less “Net Capital” 3 Levered Free Cash Flow is equal to “Net Cash Provided by Operating Activities” less “Cash Outflows for Purchases of Property and Equipment” $21 $47 $61 $103 $56 $74 $92 $97 20% 43% 26% 42% 22% 29% 35% 35% $0 $50 $100 $150 $200 Mar-12 Jun-12 Sep-12 Dec-12 Mar-13 Jun-13 Sep-13 Dec-13 % of Revenue millions Adj Unlevered FCF2 $11 $36 $58 $80 $52 $40 $69 $73 11% 33% 25% 33% 21% 15% 26% 27% $0 $50 $100 $150 $200 Mar-12 Jun-12 Sep-12 Dec-12 Mar-13 Jun-13 Sep-13 Dec-13 % of Revenue millions Unlevered Free Cash Flow (FCF) ($10) $56 $12 $47 ($22) $32 $7 $55 -9% 51% 5% 19% -9% 13% 3% 20% ($50) $0 $50 $100 $150 Mar-12 Jun-12 Sep-12 Dec-12 Mar-13 Jun-13 Sep-13 Dec-13 % of Revenue millions Levered FCF3 $10.2 million lease termination cost adjustment 12
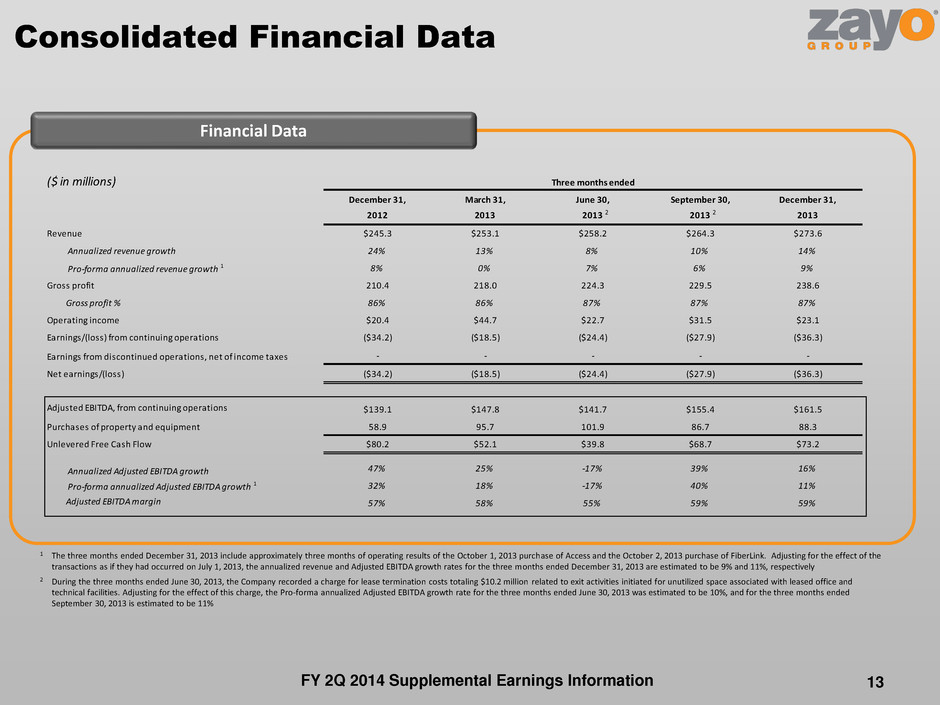
($ in millions) December 31, March 31, June 30, September 30, December 31, 2012 2013 2013 2013 2013 Revenue $245.3 $253.1 $258.2 $264.3 $273.6 Annualized revenue growth 24% 13% 8% 10% 14% Pro-forma annualized revenue growth 1 8% 0% 7% 6% 9% Gross profit 210.4 218.0 224.3 229.5 238.6 Gross profit % 86% 86% 87% 87% 87% Operating income $20.4 $44.7 $22.7 $31.5 $23.1 Earnings/(loss) from continuing operations ($34.2) ($18.5) ($24.4) ($27.9) ($36.3) Earnings from discontinued operations, net of income taxes - - - - - Net earnings/(loss) ($34.2) ($18.5) ($24.4) ($27.9) ($36.3) Adjusted EBITDA, from continuing operations $139.1 $147.8 $141.7 $155.4 $161.5 Purchases of property and equipment 58.9 95.7 101.9 86.7 88.3 Unlevered Free Cash Flow $80.2 $52.1 $39.8 $68.7 $73.2 Annualized Adjusted EBITDA growth 47% 25% -17% 39% 16% Pro-forma annualized Adjusted EBITDA growth 1 32% 18% -17% 40% 11% Adjusted EBITDA margin 57% 58% 55% 59% 59% Three months ended Consolidated Financial Data 13 1 The three months ended December 31, 2013 include approximately three months of operating results of the October 1, 2013 purchase of Access and the October 2, 2013 purchase of FiberLink. Adjusting for the effect of the transactions as if they had occurred on July 1, 2013, the annualized revenue and Adjusted EBITDA growth rates for the three months ended December 31, 2013 are estimated to be 9% and 11%, respectively 2 During the three months ended June 30, 2013, the Company recorded a charge for lease termination costs totaling $10.2 million related to exit activities initiated for unutilized space associated with leased office and technical facilities. Adjusting for the effect of this charge, the Pro-forma annualized Adjusted EBITDA growth rate for the three months ended June 30, 2013 was estimated to be 10%, and for the three months ended September 30, 2013 is estimated to be 11% Financial Data 2 2 FY 2Q 2014 Supplemental Earnings Information
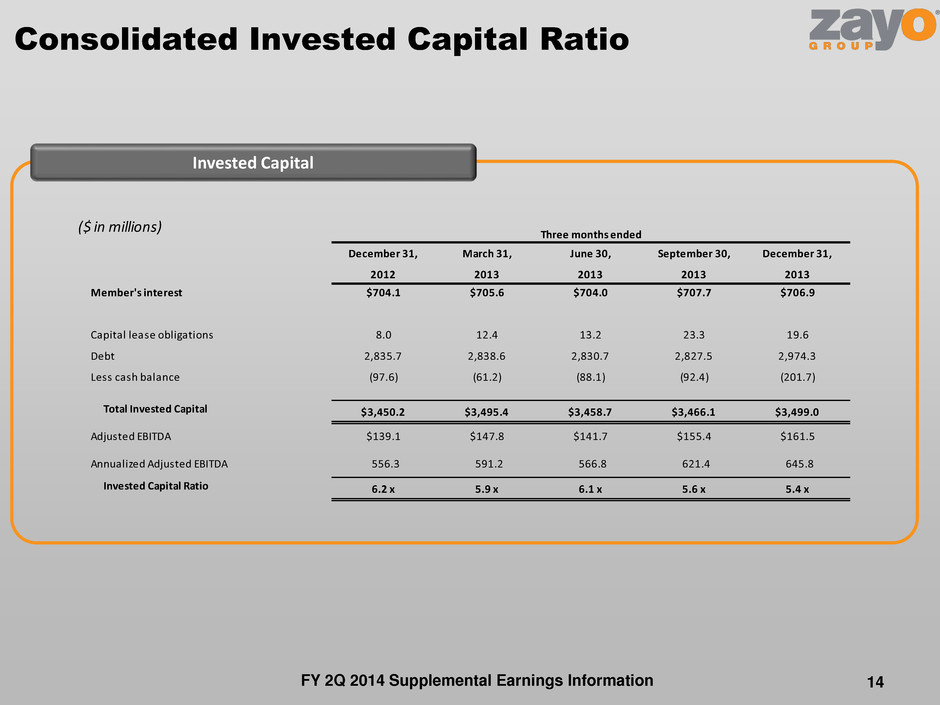
($ in millions) December 31, March 31, June 30, September 30, December 31, 2012 2013 2013 2013 2013 Member's interest $704.1 $705.6 $704.0 $707.7 $706.9 Capital lease obligations 8.0 12.4 13.2 23.3 19.6 Debt 2,835.7 2,838.6 2,830.7 2,827.5 2,974.3 Less cash balance (97.6) (61.2) (88.1) (92.4) (201.7) Total Invested Capital $3,450.2 $3,495.4 $3,458.7 $3,466.1 $3,499.0 Adjusted EBITDA $139.1 $147.8 $141.7 $155.4 $161.5 Annualized Adjusted EBITDA 556.3 591.2 566.8 621.4 645.8 Invested Capital Ratio 6.2 x 5.9 x 6.1 x 5.6 x 5.4 x Three months ended Consolidated Invested Capital Ratio 14 Invested Capital FY 2Q 2014 Supplemental Earnings Information
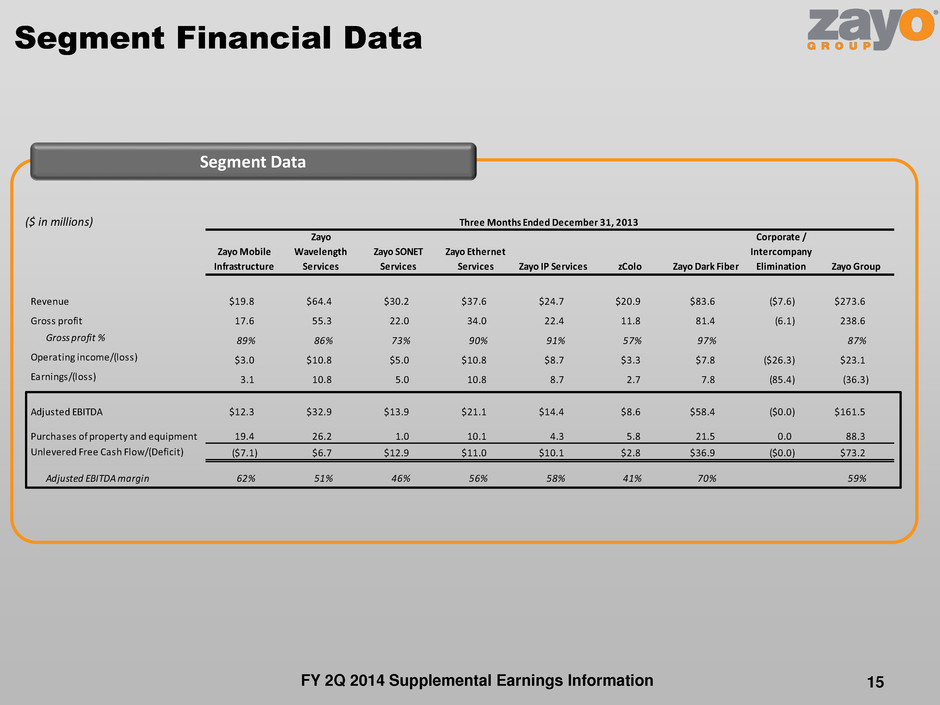
($ in millions) Zayo Mobile Infrastructure Zayo Wavelength Services Zayo SONET Services Zayo Ethernet Services Zayo IP Services zColo Zayo Dark Fiber Corporate / Intercompany Elimination Zayo Group Revenue $19.8 $64.4 $30.2 $37.6 $24.7 $20.9 $83.6 ($7.6) $273.6 Gross profit 17.6 55.3 22.0 34.0 22.4 11.8 81.4 (6.1) 238.6 Gross profit % 89% 86% 73% 90% 91% 57% 97% 87% Operating income/(loss) $3.0 $10.8 $5.0 $10.8 $8.7 $3.3 $7.8 ($26.3) $23.1 Earnings/(loss) 3.1 10.8 5.0 10.8 8.7 2.7 7.8 (85.4) (36.3) Adjusted EBITDA $12.3 $32.9 $13.9 $21.1 $14.4 $8.6 $58.4 ($0.0) $161.5 Purchases of property and equipment 19.4 26.2 1.0 10.1 4.3 5.8 21.5 0.0 88.3 Unlevered Free Cash Flow/(Deficit) ($7.1) $6.7 $12.9 $11.0 $10.1 $2.8 $36.9 ($0.0) $73.2 Adjusted EBITDA margin 62% 51% 46% 56% 58% 41% 70% 59% Three Months Ended December 31, 2013 Segment Financial Data 15 Segment Data FY 2Q 2014 Supplemental Earnings Information
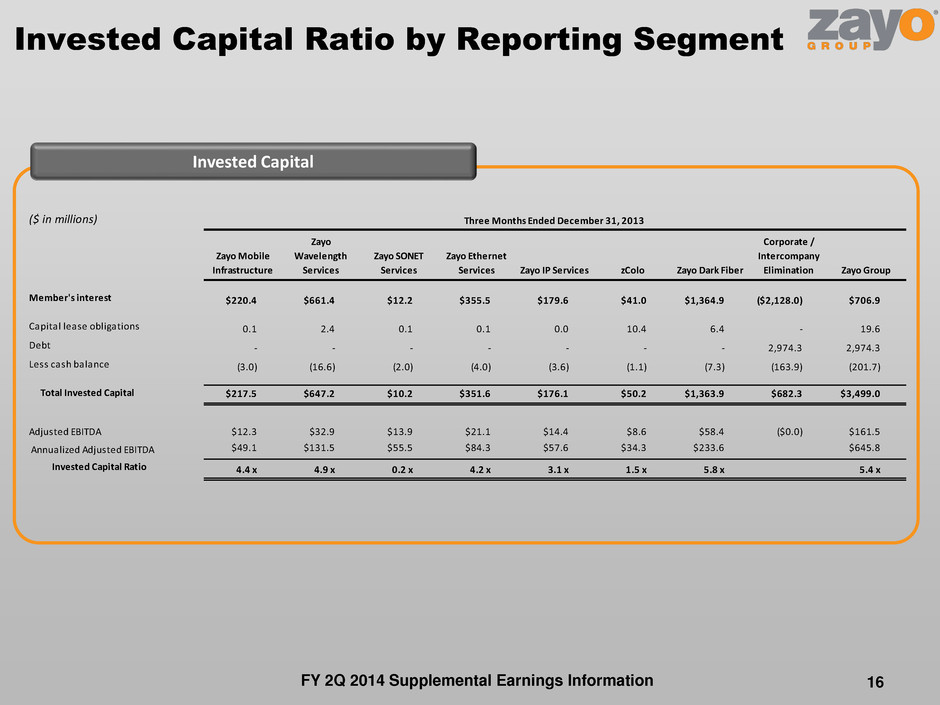
($ in millions) Zayo Mobile Infrastructure Zayo Wavelength Services Zayo SONET Services Zayo Ethernet Services Zayo IP Services zColo Zayo Dark Fiber Corporate / Intercompany Elimination Zayo Group Member's interest $220.4 $661.4 $12.2 $355.5 $179.6 $41.0 $1,364.9 ($2,128.0) $706.9 Capital lease obligations 0.1 2.4 0.1 0.1 0.0 10.4 6.4 - 19.6 Debt - - - - - - - 2,974.3 2,974.3 Less cash balance (3.0) (16.6) (2.0) (4.0) (3.6) (1.1) (7.3) (163.9) (201.7) Total Invested Capital $217.5 $647.2 $10.2 $351.6 $176.1 $50.2 $1,363.9 $682.3 $3,499.0 Adjusted EBITDA $12.3 $32.9 $13.9 $21.1 $14.4 $8.6 $58.4 ($0.0) $161.5 Annualized Adjusted EBITDA $49.1 $131.5 $55.5 $84.3 $57.6 $34.3 $233.6 $645.8 Invested Capital Ratio 4.4 x 4.9 x 0.2 x 4.2 x 3.1 x 1.5 x 5.8 x 5.4 x Three Months Ended December 31, 2013 Invested Capital Ratio by Reporting Segment 16 Invested Capital FY 2Q 2014 Supplemental Earnings Information

$33.4 $34.1 $76.8 $79.8 $81.1 $82.2 $83.7 $85.7 $1.3 $1.5 $2.8 $2.9 $3.2 $4.2 $4.2 $4.6 $34.7 $35.6 $79.5 $82.8 $84.4 $86.4 $88.0 $90.3 $0 $50 $100 $150 $200 $250 $300 $350 Mar-12 Jun-12 Sep-12 Dec-12 Mar-13 Jun-13 Sep-13 Dec-13 $99.2 $101.2 $220.0 $231.0 $239.7 $243.0 $247.6 $253.7 $0.3 $0.3 $1.3 $1.6 $1.6 $1.5 $1.2 $1.6 $3.9 $4.2 $9.8 $10.1 $10.8 $11.7 $12.1 $13.2 $1.7 $3.9 $0.4 $2.6 $1.0 $2.0 $3.3 $5.1 $105.0 $109.6 $231.5 $245.3 $253.1 $258.2 $264.3 $273.6 $0 $50 $100 $150 $200 $250 $300 $350 Mar-12 Jun-12 Sep-12 Dec-12 Mar-13 Jun-13 Sep-13 Dec-13 Stratification of Revenue $0.8 $0.9 $3.3 $3.5 $3.5 $3.8 $4.0 $4.3 $3.0 $3.3 $6.5 $6.6 $7.3 $7.8 $8.1 $8.9 $3.9 $4.2 $9.8 $10.1 $10.8 $11.7 $12.1 $13.2 $0 $5 $10 $15 $20 Mar-12 Jun-12 Sep-12 Dec-12 Mar-13 Jun-13 Sep-13 Dec-13 MAR $1.8 $3.5 $2.2 $5.2 $7.3 $8.0 $6.5 $7.7 $16.8 $14.0 $5.6 $16.8 $24.9 $22.0 $25.1 $42.3 $18.5 $17.5 $7.8 $21.9 $32.3 $30.0 $31.7 $50.0 $0 $20 $40 $60 $80 Mar-12 Jun-12 Sep-12 Dec-12 Mar-13 Jun-13 Sep-13 Dec-13 IRU and Upfront Charges Customer Invoices for Upfront Charges Accounted for as MAR Customer Invoices for IRU Charges Accounted for as MAR $1.7 $3.9 $0.4 $2.6 $1.0 $2.0 $3.3 $5.1 $0 $5 $10 $15 $20 Mar-12 Jun-12 Sep-12 Dec-12 Mar-13 Jun-13 Sep-13 Dec-13 Other Revenue millions millions millions millions MRR and MAR on the Last Day of the Quarter1 MRR on the last day of the quarter MAR of the last day of the quarter millions Revenue Stratification MRR Usage MAR Other Revenue MAR – Upfront Charges MAR - IRU 1 The change in MRR and MAR on the last day of the quarter is equal to the net installations in the period plus or minus any effects of fluctuations in foreign exchange rates 17 FY 2Q 2014 Supplemental Earnings Information
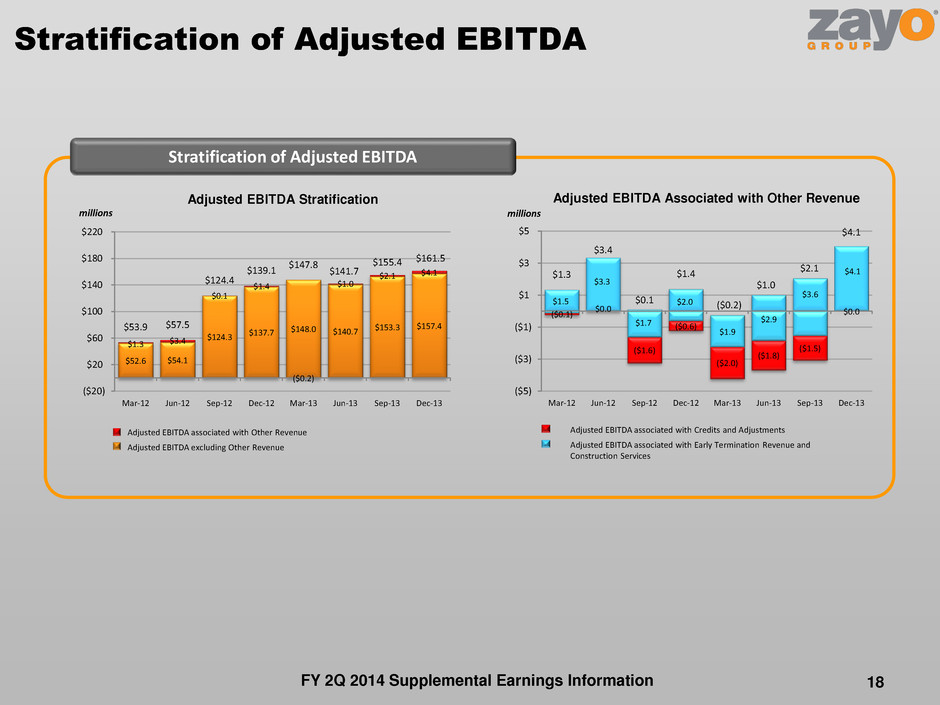
($0.1) $0.0 ($1.6) ($0.6) ($2.0) ($1.8) ($1.5) $0.0 $1.3 $3.4 $0.1 $1.4 ($0.2) $1.0 $2.1 $4.1 $1.5 $3.3 $1.7 $2.0 $1.9 $2.9 $3.6 $4.1 ($5) ($3) ($1) $1 $3 $5 Mar-12 Jun-12 Sep-12 Dec-12 Mar-13 Jun-13 Sep-13 Dec-13 $52.6 $54.1 $124.3 $137.7 $148.0 $140.7 $153.3 $157.4 $1.3 $3.4 $0.1 $1.4 ($0.2) $1.0 $2.1 $4.1 $53.9 $57.5 $124.4 $139.1 $147.8 $141.7 $155.4 $161.5 ($20) $20 $60 $100 $140 $180 $220 Mar-12 Jun-12 Sep-12 Dec-12 Mar-13 Jun-13 Sep-13 Dec-13 Stratification of Adjusted EBITDA 18 millions millions Adjusted EBITDA Associated with Other Revenue Stratification of Adjusted EBITDA Adjusted EBITDA Stratification Adjusted EBITDA associated with Credits and Adjustments Adjusted EBITDA associated with Early Termination Revenue and Construction Services Adjusted EBITDA associated with Other Revenue Adjusted EBITDA excluding Other Revenue FY 2Q 2014 Supplemental Earnings Information
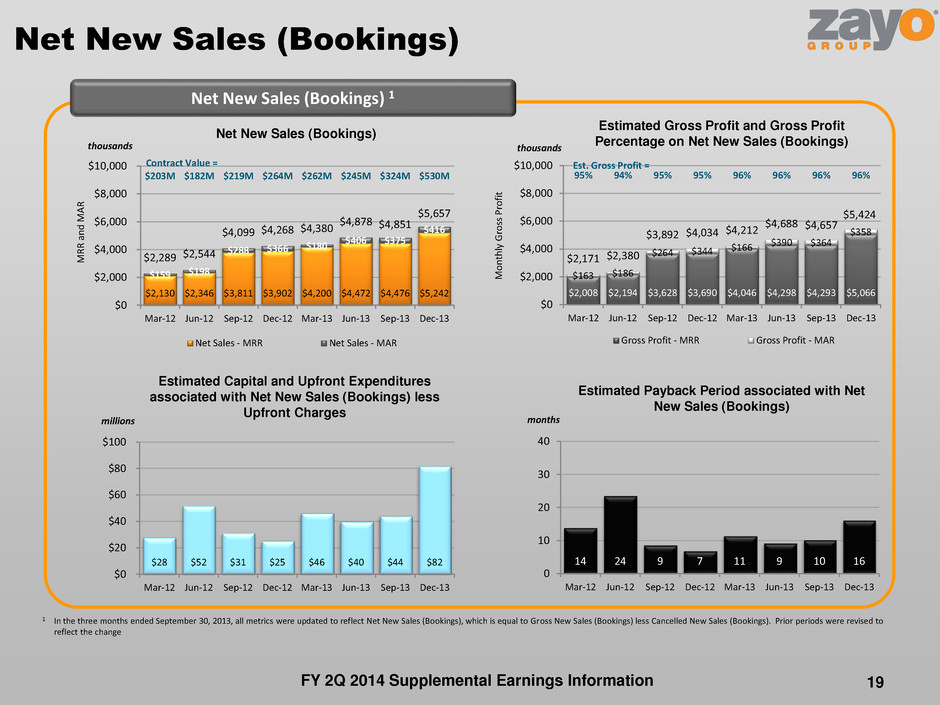
14 24 9 7 11 9 10 16 0 10 20 30 40 Mar-12 Jun-12 Sep-12 Dec-12 Mar-13 Jun-13 Sep-13 Dec-13 $2,130 $2,346 $3,811 $3,902 $4,200 $4,472 $4,476 $5,242 $159 $198 $288 $366 $180 $406 $375 $416 $2,289 $2,544 $4,099 $4,268 $4,380 $4,878 $4,851 $5,657 $203M $182M $219M $264M $262M $245M $324M $530M $0 $2,000 $4,000 $6,000 $8,000 $10,000 Mar-12 Jun-12 Sep-12 Dec-12 Mar-13 Jun-13 Sep-13 Dec-13 Net Sales - MRR Net Sales - MAR Contract Value = $2,008 $2,194 $3,628 $3,690 $4,046 $4,298 $4,293 $5,066 $163 $186 $264 $344 $166 $390 $364 $358 $2,171 $2,380 $3,892 $4,034 $4,212 $4,688 $4,657 $5,424 95% 94% 95% 95% 96% 96% 96% 96% $0 $2,000 $4,000 $6,000 $8,000 $10,000 Mar-12 Jun-12 Sep-12 Dec-12 Mar-13 Jun-13 Sep-13 Dec-13 Gross Profit - MRR Gross Profit - MAR $28 $52 $31 $25 $46 $40 $44 $82 $0 $20 $40 $60 $80 $100 Mar-12 Jun-12 Sep-12 Dec-12 Mar-13 Jun-13 Sep-13 Dec-13 Net New Sales (Bookings) 19 Net New Sales (Bookings) 1 Net New Sales (Bookings) Estimated Capital and Upfront Expenditures associated with Net New Sales (Bookings) less Upfront Charges thousands thousands millions months M R R a n d M A R M o n th ly G ro ss P ro fi t Est. Gross Profit = Estimated Payback Period associated with Net New Sales (Bookings) Estimated Gross Profit and Gross Profit Percentage on Net New Sales (Bookings) 1 In the three months ended September 30, 2013, all metrics were updated to reflect Net New Sales (Bookings), which is equal to Gross New Sales (Bookings) less Cancelled New Sales (Bookings). Prior periods were revised to reflect the change FY 2Q 2014 Supplemental Earnings Information

20 Estimated Capital and Upfront Expenditures and Net New Sales (Bookings) IRU and Upfront Charges $22.0 $15.0 $7.0 $32.6 $10.3 $39.6 $37.3 $51.7 $4.3 $2.2 $12.7 $6.9 $6.1 $9.6 $3.5 $7.1 $1.1 $1.5 $1.2 $1.4 $3.6 $3.4 $2.8 $10.0 $27.5 $18.8 $20.9 $40.9 $20.0 $52.7 $43.6 $68.7 $27.5M $18.8M $20.9M $40.9M $20.0M $52.7M $43.6M $68.7M $0 $25 $50 $75 $100 $125 $150 $175 Mar-12 Jun-12 Sep-12 Dec-12 Mar-13 Jun-13 Sep-13 Dec-13 Contract Value = Net New Sales (Bookings) – IRU and Upfront Charges Net New Sales (Bookings) from IRUs Net New Sales (Bookings) Upfront Charges Net New Sales (Bookings) Other Charges (Construction Services, Other) millions $54.0 $67.5 $49.8 $63.5 $63.5 $90.3 $86.1 $147.0 $0.7 $1.6 $1.3 $0.6 $2.7 $2.0 $1.4 $3.4 $54.7 $69.1 $51.1 $64.2 $66.1 $92.3 $87.5 $150.4 $0 $25 $50 $75 $100 $125 $150 $175 Mar-12 Jun-12 Sep-12 Dec-12 Mar-13 Jun-13 Sep-13 Dec-13 Estimated Expenditures associated with Net New Sales (Bookings) millions C ap it al E xp en d it u re s Estimated Capital and Upfront Expenditures and Net New Sales (Bookings) IRU and Upfront Charges Estimated Capital Expenditures associated with Net New Sales (Bookings) Estimated Upfront Expenditures associated with Net New Sales (Bookings) FY 2Q 2014 Supplemental Earnings Information
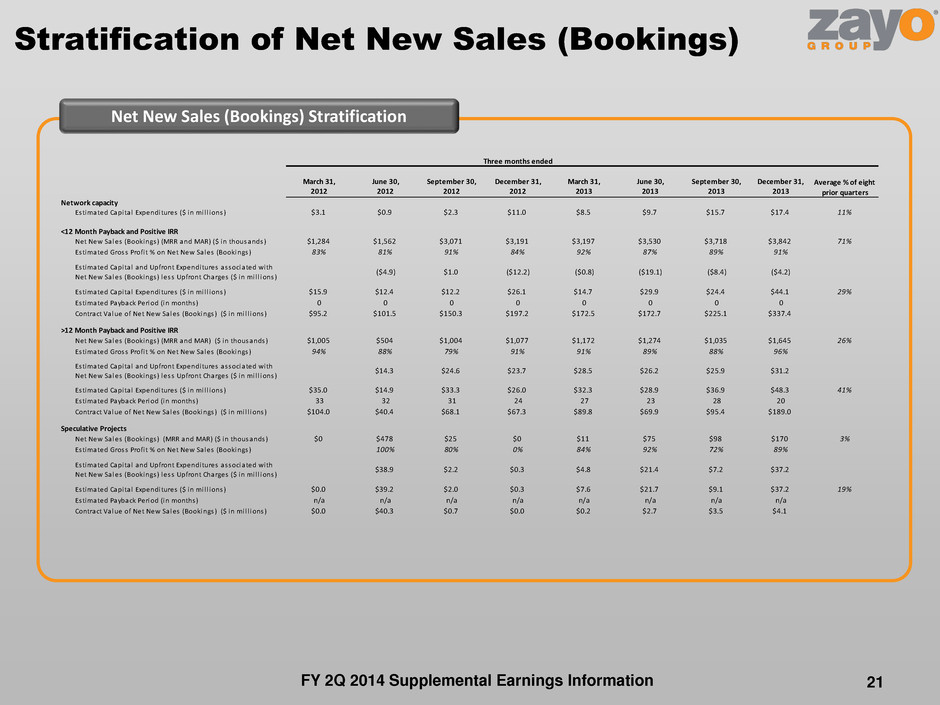
March 31, June 30, September 30, December 31, March 31, June 30, September 30, December 31, 2012 2012 2012 2012 2013 2013 2013 2013 Network capacity Estimated Capita l Expenditures ($ in mi l l ions) $3.1 $0.9 $2.3 $11.0 $8.5 $9.7 $15.7 $17.4 11% <12 Month Payback and Positive IRR Net New Sales (Bookings) (MRR and MAR) ($ in thousands) $1,284 $1,562 $3,071 $3,191 $3,197 $3,530 $3,718 $3,842 71% Estimated Gross Profi t % on Net New Sales (Bookings) 83% 81% 91% 84% 92% 87% 89% 91% Estimated Capita l and Upfront Expenditures associated with Net New Sales (Bookings) less Upfront Charges ($ in mi l l ions) ($4.9) $1.0 ($12.2) ($0.8) ($19.1) ($8.4) ($4.2) Estimated Capita l Expenditures ($ in mi l l ions) $15.9 $12.4 $12.2 $26.1 $14.7 $29.9 $24.4 $44.1 29% Estimated Payback Period (in months) 0 0 0 0 0 0 0 0 Contract Value of Net New Sales (Bookings) ($ in mi l l ions) $95.2 $101.5 $150.3 $197.2 $172.5 $172.7 $225.1 $337.4 >12 Month Payback and Positive IRR Net New Sales (Bookings) (MRR and MAR) ($ in thousands) $1,005 $504 $1,004 $1,077 $1,172 $1,274 $1,035 $1,645 26% Estimated Gross Profi t % on Net New Sales (Bookings) 94% 88% 79% 91% 91% 89% 88% 96% Estimated Capita l and Upfront Expenditures associated with Net New Sales (Bookings) less Upfront Charges ($ in mi l l ions) $14.3 $24.6 $23.7 $28.5 $26.2 $25.9 $31.2 Estimated Capita l Expenditures ($ in mi l l ions) $35.0 $14.9 $33.3 $26.0 $32.3 $28.9 $36.9 $48.3 41% Estimated Payback Period (in months) 33 32 31 24 27 23 28 20 Contract Value of Net New Sales (Bookings) ($ in mi l l ions) $104.0 $40.4 $68.1 $67.3 $89.8 $69.9 $95.4 $189.0 Speculative Projects Net New Sales (Bookings) (MRR and MAR) ($ in thousands) $0 $478 $25 $0 $11 $75 $98 $170 3% Estimated Gross Profi t % on Net New Sales (Bookings) 100% 80% 0% 84% 92% 72% 89% Estimated Capita l and Upfront Expenditures associated with Net New Sales (Bookings) less Upfront Charges ($ in mi l l ions) $38.9 $2.2 $0.3 $4.8 $21.4 $7.2 $37.2 Estimated Capita l Expenditures ($ in mi l l ions) $0.0 $39.2 $2.0 $0.3 $7.6 $21.7 $9.1 $37.2 19% Estimated Payback Period (in months) n/a n/a n/a n/a n/a n/a n/a n/a Contract Value of Net New Sales (Bookings) ($ in mi l l ions) $0.0 $40.3 $0.7 $0.0 $0.2 $2.7 $3.5 $4.1 Three months ended Average % of eight prior quarters Stratification of Net New Sales (Bookings) 21 Net New Sales (Bookings) Stratification FY 2Q 2014 Supplemental Earnings Information
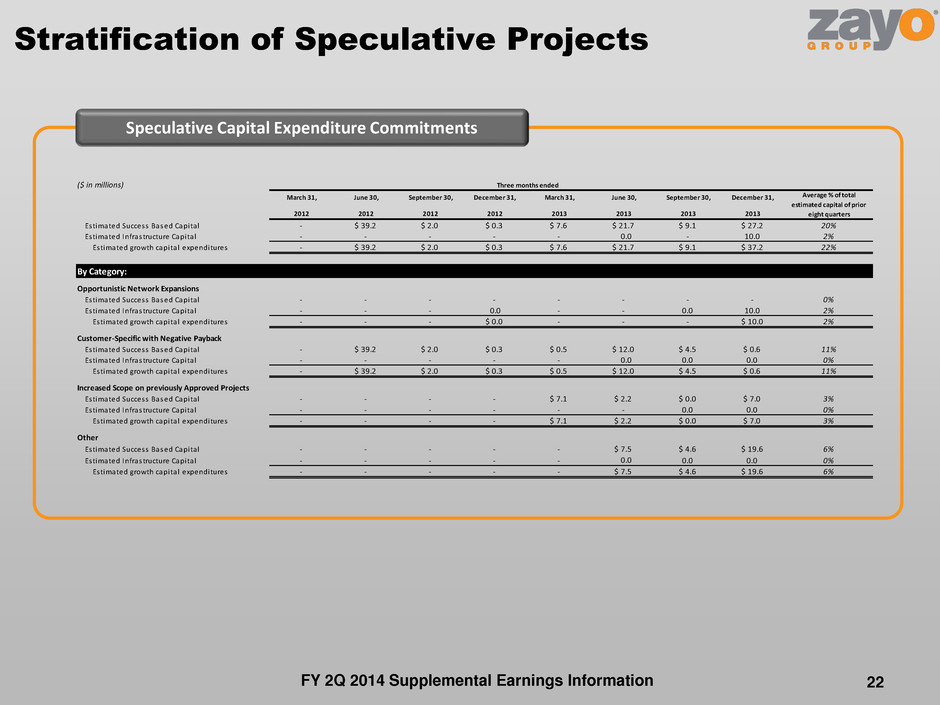
($ in millions) March 31, June 30, September 30, December 31, March 31, June 30, September 30, December 31, 2012 2012 2012 2012 2013 2013 2013 2013 Estimated Success Based Capita l - $ 39.2 $ 2.0 $ 0.3 $ 7.6 $ 21.7 $ 9.1 $ 27.2 20% Estimated Infrastructure Capita l - - - - - 0.0 - 10.0 2% Estimated growth capita l expenditures - $ 39.2 $ 2.0 $ 0.3 $ 7.6 $ 21.7 $ 9.1 $ 37.2 22% By Category: Opportunistic Network Expansions Estimated Success Based Capita l - - - - - - - - 0% Estimated Infrastructure Capita l - - - 0.0 - - 0.0 10.0 2% Estimated growth capita l expenditures - - - $ 0.0 - - - $ 10.0 2% Customer-Specific with Negative Payback Estimated Success Based Capita l - $ 39.2 $ 2.0 $ 0.3 $ 0.5 $ 12.0 $ 4.5 $ 0.6 11% Estimated Infrastructure Capita l - - - - - 0.0 0.0 0.0 0% Estimated growth capita l expenditures - $ 39.2 $ 2.0 $ 0.3 $ 0.5 $ 12.0 $ 4.5 $ 0.6 11% Increased Scope on previously Approved Projects Estimated Success Based Capita l - - - - $ 7.1 $ 2.2 $ 0.0 $ 7.0 3% Estimated Infrastructure Capita l - - - - - - 0.0 0.0 0% Estimated growth capita l expenditures - - - - $ 7.1 $ 2.2 $ 0.0 $ 7.0 3% Other Estimated Success Based Capita l - - - - - $ 7.5 $ 4.6 $ 19.6 6% Estimated Infrastructure Capita l - - - - - 0.0 0.0 0.0 0% Estimated growth capita l expenditures - - - - - $ 7.5 $ 4.6 $ 19.6 6% Average % of total estimated capital of prior eight quarters Three months ended Stratification of Speculative Projects 22 Speculative Capital Expenditure Commitments FY 2Q 2014 Supplemental Earnings Information
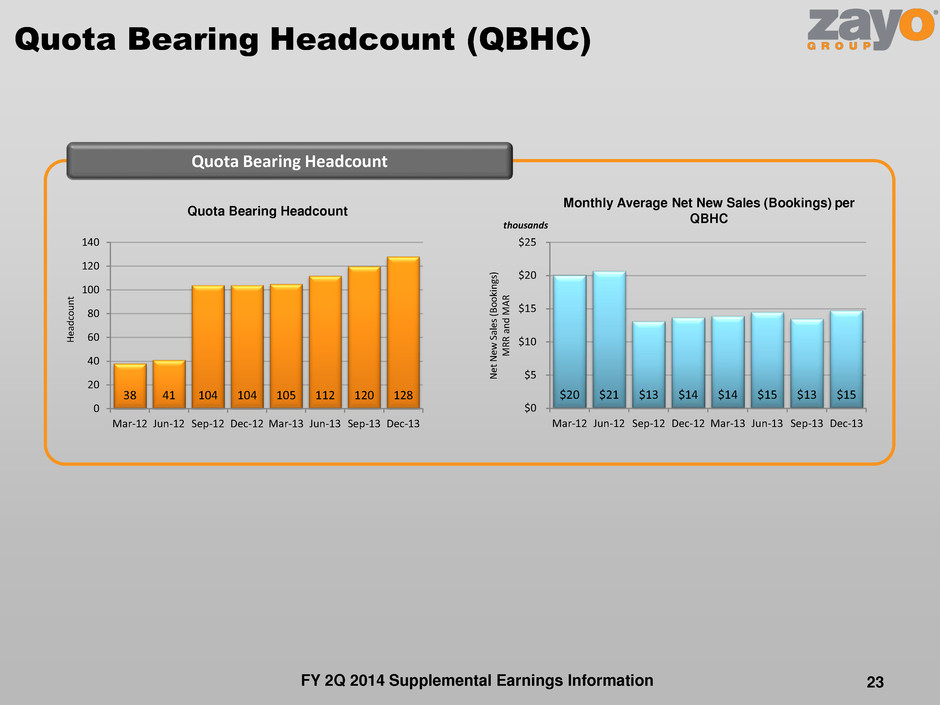
Quota Bearing Headcount (QBHC) 23 Quota Bearing Headcount $20 $21 $13 $14 $14 $15 $13 $15 $0 $5 $10 $15 $20 $25 Mar-12 Jun-12 Sep-12 Dec-12 Mar-13 Jun-13 Sep-13 Dec-13 Quota Bearing Headcount Monthly Average Net New Sales (Bookings) per QBHC thousands H ea d co u n t N et N ew Sa le s (B o o ki n gs ) M R R a n d M A R 38 41 104 104 105 112 120 128 0 20 40 60 80 100 120 140 Mar-12 Jun-12 Sep-12 Dec-12 Mar-13 Jun-13 Sep-13 Dec-13 FY 2Q 2014 Supplemental Earnings Information
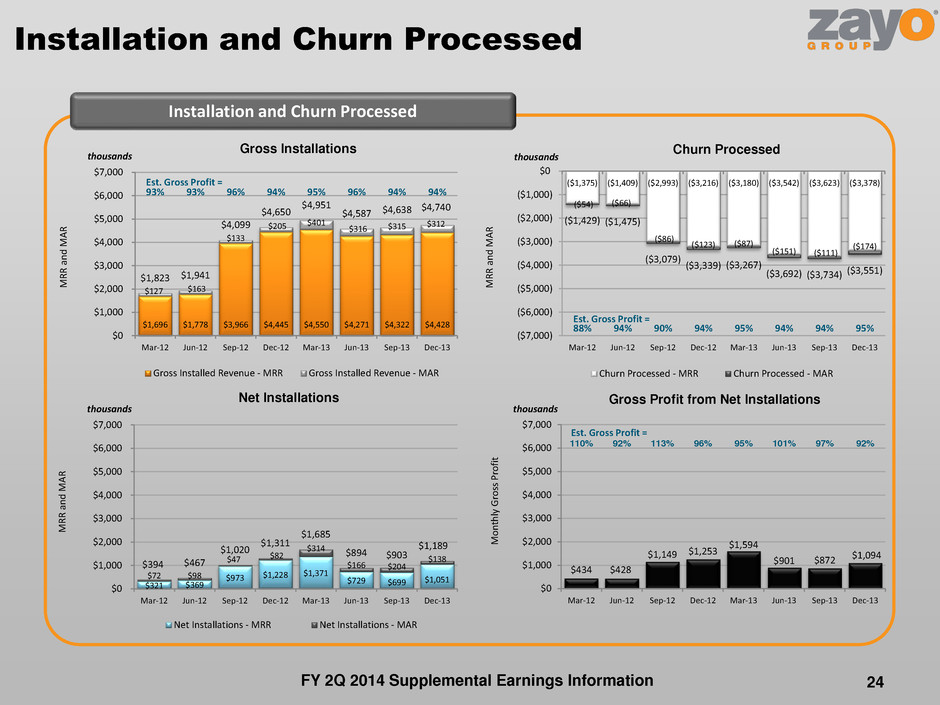
$1,696 $1,778 $3,966 $4,445 $4,550 $4,271 $4,322 $4,428 $127 $163 $133 $205 $401 $316 $315 $312 $1,823 $1,941 $4,099 $4,650 $4,951 $4,587 $4,638 $4,740 93% 93% 96% 94% 95% 96% 94% 94% $0 $1,000 $2,000 $3,000 $4,000 $5,000 $6,000 $7,000 Mar-12 Jun-12 Sep-12 Dec-12 Mar-13 Jun-13 Sep-13 Dec-13 Gross Installed Revenue - MRR Gross Installed Revenue - MAR Installation and Churn Processed 24 Installation and Churn Processed ($1,375) ($1,409) ($2,993) ($3,216) ($3,180) ($3,542) ($3,623) ($3,378) ($54) ($66) ($86) ($123) ($87) ($151) ($111) ($174) ($1,429) ($1,475) ($3,079) ($3,339) ($3,267) ($3,692) ($3,734) ($3,551) 88% 94% 90% 94% 95% 94% 94% 95% ($7,000) ($6,000) ($5,000) ($4,000) ($3,000) ($2,000) ($1,000) $0 Mar-12 Jun-12 Sep-12 Dec-12 Mar-13 Jun-13 Sep-13 Dec-13 Churn Processed - MRR Churn Processed - MAR $321 $369 $973 $1,228 $1,371 $729 $699 $1,051 $72 $98 $47 $82 $314 $166 $204 $138 $394 $467 $1,020 $1,311 $1,685 $894 $903 $1,189 $0 $1,000 $2,000 $3,000 $4,000 $5,000 $6,000 $7,000 Mar-12 Jun-12 Sep-12 Dec-12 Mar-13 Jun-13 Sep-13 Dec-13 Net Installations - MRR Net Installations - MAR $434 $428 $1,149 $1,253 $1,594 $901 $872 $1,094 110% 92% 113% 96% 95% 101% 97% 92% $0 $1,000 $2,000 $3,000 $4,000 $5,000 $6,000 $7,000 Mar-12 Jun-12 Sep-12 Dec-12 Mar-13 Jun-13 Sep-13 Dec-13 Net Installations thousands thousands thousands thousands M R R a n d M A R M R R a n d M A R M R R a n d M A R M o n th ly G ro ss P ro fi t Est. Gross Profit = Est. Gross Profit = Est. Gross Profit = Gross Profit from Net Installations Gross Installations Churn Processed FY 2Q 2014 Supplemental Earnings Information
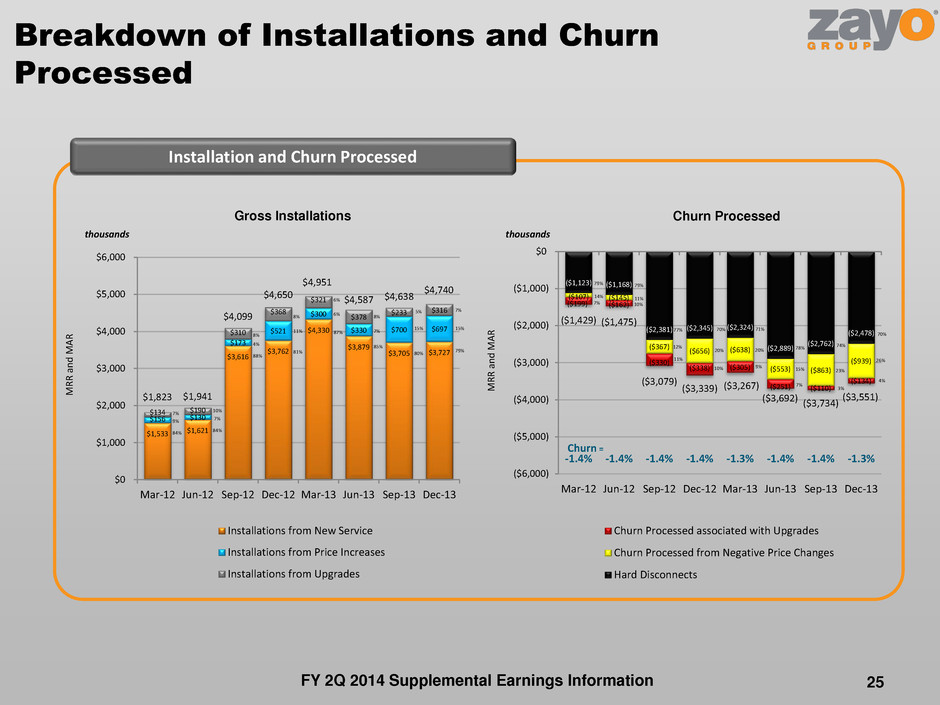
Breakdown of Installations and Churn Processed Installation and Churn Processed 25 thousands thousands M R R a n d M A R M R R a n d M A R ($1,123) ($1,168) ($2,381) ($2,345) ($2,324) ($2,889) ($2,762) ($2,478) ($107) ($145) ($367) ($656) ($638) ($553) ($863) ($939) ($199) ($162) ($330) ($338) ($305) ($251) ($110) ($134) ($1,429) ($1,475) ($3,079) ($3,339) ($3,267) ($3,692) ($3,734) ($3,551) 79% 79% 77% 70% 71% 78% 74% 70% 7% 10% 12% 20% 20% 15% 23% 26% 14% 11% 11% 10% 9% 7% 3% 4% -1.4% -1.4% -1.4% -1.4% -1.3% -1.4% -1.4% -1.3% ($6,000) ($5,000) ($4,000) ($3,000) ($2,000) ($1,000) $0 Mar-12 Jun-12 Sep-12 Dec-12 Mar-13 Jun-13 Sep-13 Dec-13 Churn Processed associated with Upgrades Churn Processed from Negative Price Changes Hard Disconnects Churn = $1,533 $1,621 $3,616 $3,762 $4,330 $3,879 $3,705 $3,727 $156 $130 $173 $521 $300 $330 $700 $697 $134 $190 $310 $368 $321 $378 $233 $316 $1,823 $1,941 $4,099 $4,650 $4,951 $4,587 $4,638 $4,740 84% 84% 88% 81% 87% 85% 80% 79% 9% 7% 4% 11% 6% 7% 15% 15% 7% 10% 8% 8% 6% 8% 5% 7% $0 $1,000 $2,000 $3,000 $4,000 $5,000 $6,000 Mar-12 Jun-12 Sep-12 Dec-12 Mar-13 Jun-13 Sep-13 Dec-13 Installations from New Service Installations from Price Increases Installations from Upgrades Gross Installations Churn Processed FY 2Q 2014 Supplemental Earnings Information

$156 $130 $173 $521 $300 $330 $700 $697 17% 15% 19% 15% 19% 17% 7% 13% $0 $2,000 $4,000 $6,000 $8,000 $10,000 $12,000 $14,000 Mar-12 Jun-12 Sep-12 Dec-12 Mar-13 Jun-13 Sep-13 Dec-13 Price Changes and Renewals $11.6 $8.1 $15.5 $25.5 $16.8 $17.2 $30.8 $34.9 $4.5 $7.3 $9.3 $14.3 $18.2 $67.8 $14.8 $13.9 $11.2 $15.6 $13.5 $18.5 $35.1 $31.8 $45.2 $43.0 $27.3 $31.0 $38.4 $58.4 $70.1 $116.8 $90.7 $91.8 $0 $40 $80 $120 $160 $200 Mar-12 Jun-12 Sep-12 Dec-12 Mar-13 Jun-13 Sep-13 Dec-13 ($107) ($145) ($367) ($656) ($638) ($553) ($863) ($939) -11% -17% -23% -35% -24% -23% -26% -22% ($4,000) ($2,000) $0 $2,000 $4,000 $6,000 $8,000 $10,000 Mar-12 Jun-12 Sep-12 Dec-12 Mar-13 Jun-13 Sep-13 Dec-13 Price Increases Price Decreases thousands millions thousands M R R C o n tr ac t V al u e M R R $49 ($16) ($195) ($135) ($338) ($223) ($163) ($242) ($4,000) ($2,000) $0 $2,000 $4,000 $6,000 $8,000 $10,000 Mar-12 Jun-12 Sep-12 Dec-12 Mar-13 Jun-13 Sep-13 Dec-13 Price Changes Net of Price Increases and Price Decreases thousands M R R 26 Price increases as % of MRR = Price decreases as % of MRR = Price Increases MRR before Price Increases Price Decreases MRR before Price Decreases $203 $341 $435 $1,176 $999 $1,070 $1,575 $1,591 $0 $2,000 $4,000 $6,000 $8,000 $10,000 $12,000 $14,000 Mar-12 Jun-12 Sep-12 Dec-12 Mar-13 Jun-13 Sep-13 Dec-13 Renewals (Where there is no price change) M R R Net Contract Value associated with Price Decreases Net Contract Value associated with Renewals Net Contract Value associated with Price Increases thousands Net Contract Value Associated with Price Changes and Renewals FY 2Q 2014 Supplemental Earnings Information
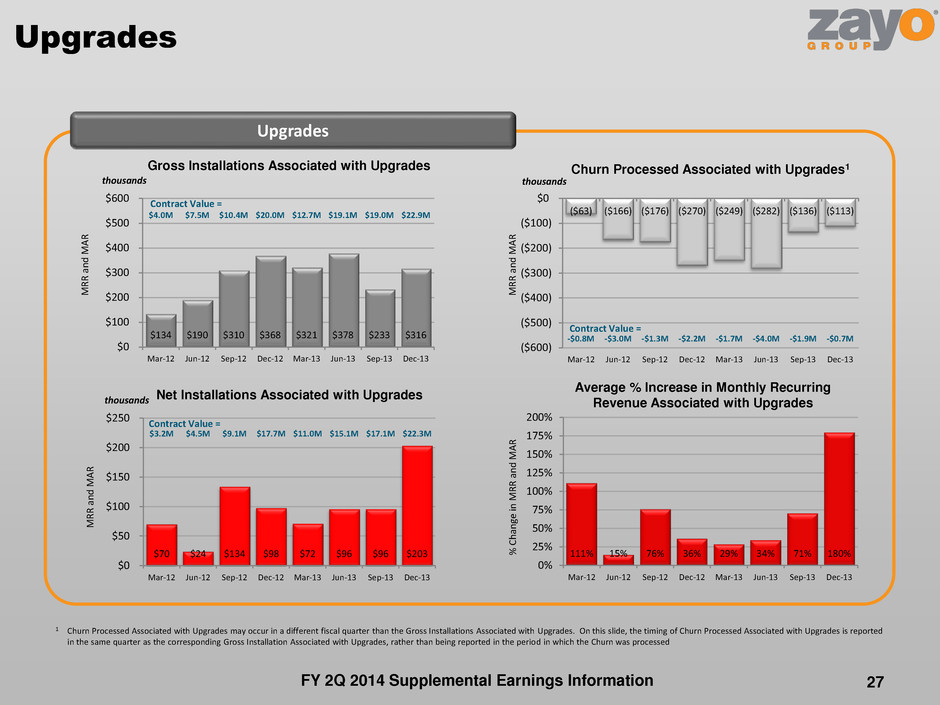
Upgrades Upgrades $134 $190 $310 $368 $321 $378 $233 $316 $4.0M $7.5M $10.4M $20.0M $12.7M $19.1M $19.0M $22.9M $0 $100 $200 $300 $400 $500 $600 Mar-12 Jun-12 Sep-12 Dec-12 Mar-13 Jun-13 Sep-13 Dec-13 ($63) ($166) ($176) ($270) ($249) ($282) ($136) ($113) -$0.8M -$3.0M -$1.3M -$2.2M -$1.7M -$4.0M -$1.9M -$0.7M ($600) ($500) ($400) ($300) ($200) ($100) $0 Mar-12 Jun-12 Sep-12 Dec-12 Mar-13 Jun-13 Sep-13 Dec-13 $70 $24 $134 $98 $72 $96 $96 $203 $3.2M $4.5M $9.1M $17.7M $11.0M $15.1M $17.1M $22.3M $0 $50 $100 $150 $200 $250 Mar-12 Jun-12 Sep-12 Dec-12 Mar-13 Jun-13 Sep-13 Dec-13 111% 15% 76% 36% 29% 34% 71% 180% 0% 25% 50% 75% 100% 125% 150% 175% 200% Mar-12 Jun-12 Sep-12 Dec-12 Mar-13 Jun-13 Sep-13 Dec-13 Gross Installations Associated with Upgrades thousands thousands thousands Churn Processed Associated with Upgrades1 Net Installations Associated with Upgrades 27 M R R a n d M A R M R R a n d M A R M R R a n d M A R % C h an ge in M R R a n d M A R Contract Value = Contract Value = Contract Value = 1 Churn Processed Associated with Upgrades may occur in a different fiscal quarter than the Gross Installations Associated with Upgrades. On this slide, the timing of Churn Processed Associated with Upgrades is reported in the same quarter as the corresponding Gross Installation Associated with Upgrades, rather than being reported in the period in which the Churn was processed Average % Increase in Monthly Recurring Revenue Associated with Upgrades FY 2Q 2014 Supplemental Earnings Information
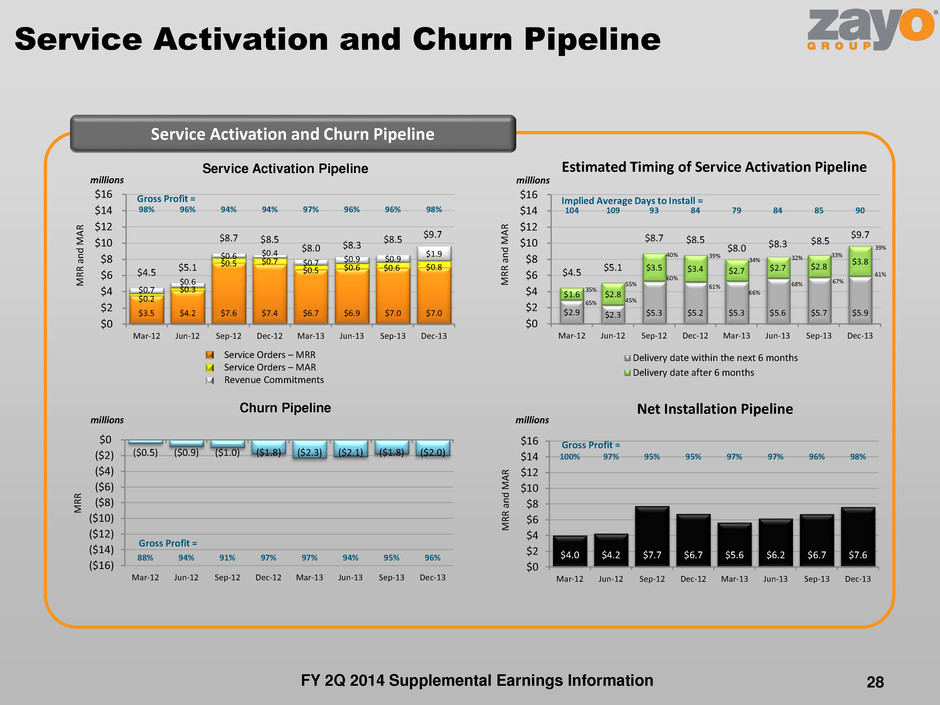
$3.5 $4.2 $7.6 $7.4 $6.7 $6.9 $7.0 $7.0 $0.2 $0.3 $0.5 $0.7 $0.5 $0.6 $0.6 $0.8 $0.7 $0.6 $0.6 $0.4 $0.7 $0.9 $0.9 $1.9 $4.5 $5.1 $8.7 $8.5 $8.0 $8.3 $8.5 $9.7 98% 96% 94% 94% 97% 96% 96% 98% $0 $2 $4 $6 $8 $10 $12 $14 $16 Mar-12 Jun-12 Sep-12 Dec-12 Mar-13 Jun-13 Sep-13 Dec-13 Service Activation and Churn Pipeline 28 Service Activation and Churn Pipeline ($0.5) ($0.9) ($1.0) ($1.8) ($2.3) ($2.1) ($1.8) ($2.0) 88% 94% 91% 97% 97% 94% 95% 96% ($16) ($14) ($12) ($10) ($8) ($6) ($4) ($2) $0 Mar-12 Jun-12 Sep-12 Dec-12 Mar-13 Jun-13 Sep-13 Dec-13 $4.0 $4.2 $7.7 $6.7 $5.6 $6.2 $6.7 $7.6 100% 97% 95% 95% 97% 97% 96% 98% $0 $2 $4 $6 $8 $10 $12 $14 $16 Mar-12 Jun-12 Sep-12 Dec-12 Mar-13 Jun-13 Sep-13 Dec-13 Service Activation Pipeline Estimated Timing of Service Activation Pipeline Churn Pipeline Net Installation Pipeline millions millions millions M R R a n d M A R M R R M R R a n d M A R millions Gross Profit = Gross Profit = Gross Profit = Service Orders – MRR Service Orders – MAR Revenue Commitments $2.9 $2.3 $5.3 $5.2 $5.3 $5.6 $5.7 $5.9 $1.6 $2.8 $3.5 $3.4 $2.7 $2.7 $2.8 $3.8 $4.5 $5.1 $8.7 $8.5 $8.0 $8.3 $8.5 $9.7 65% 45% 60% 61% 66% 68% 67% 61% 35% 55% 40% 39% 34% 32% 33% 39% 104 109 93 84 79 84 85 90 $0 $2 $4 $6 $8 $10 $12 $14 $16 Mar-12 Jun-12 Sep-12 Dec-12 Mar-13 Jun-13 Sep-13 Dec-13 Delivery date within the next 6 months Delivery date after 6 months Implied Average Days to Install = M R R a n d M A R FY 2Q 2014 Supplemental Earnings Information
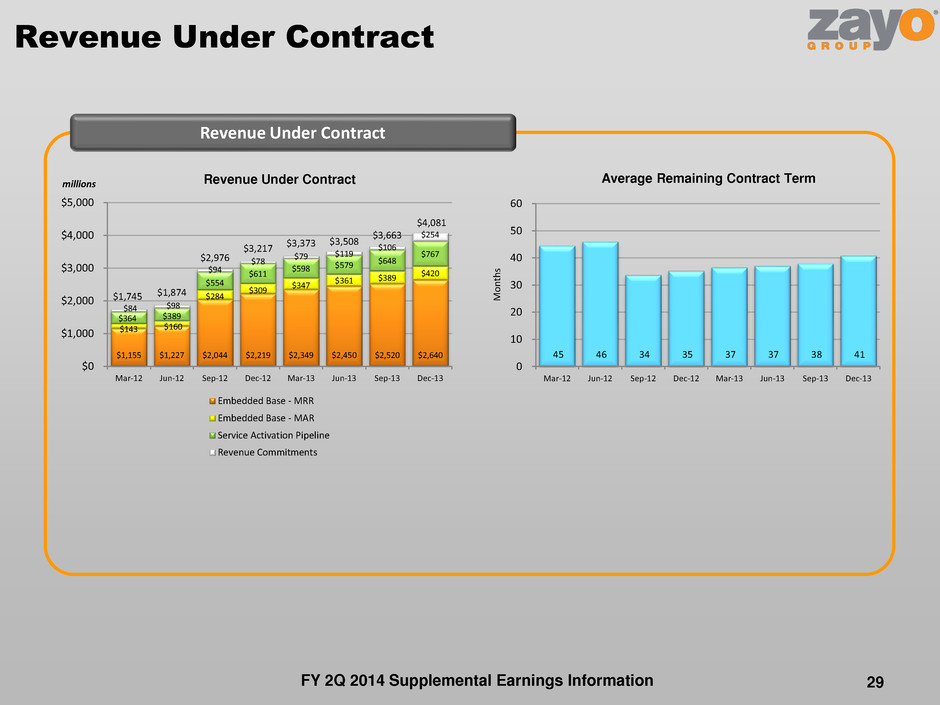
Revenue Under Contract 29 Revenue Under Contract Revenue Under Contract millions 45 46 34 35 37 37 38 41 0 10 20 30 40 50 60 Mar-12 Jun-12 Sep-12 Dec-12 Mar-13 Jun-13 Sep-13 Dec-13 Average Remaining Contract Term $1,155 $1,227 $2,044 $2,219 $2,349 $2,450 $2,520 $2,640 $143 $160 $284 $309 $347 $361 $389 $420 $364 $389 $554 $611 $598 $579 $648 $767 $84 $98 $94 $78 $79 $119 $106 $254 $1,745 $1,874 $2,976 $3,217 $3,373 $3,508 $3,663 $4,081 $0 $1,000 $2,000 $3,000 $4,000 $5,000 Mar-12 Jun-12 Sep-12 Dec-12 Mar-13 Jun-13 Sep-13 Dec-13 Embedded Base - MRR Embedded Base - MAR Service Activation Pipeline Revenue Commitments M o n th s FY 2Q 2014 Supplemental Earnings Information
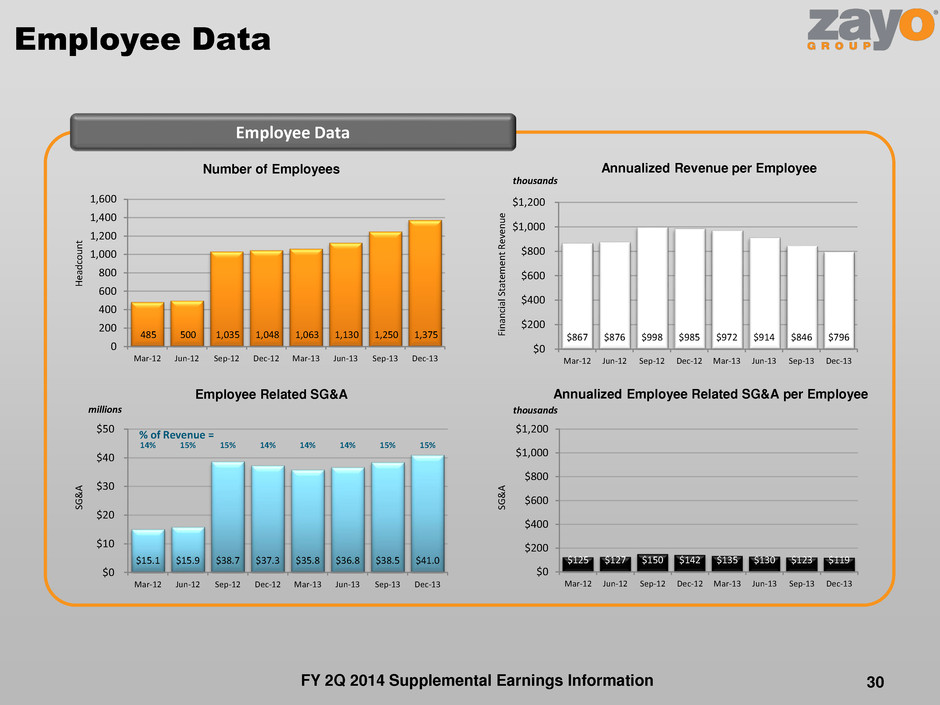
Employee Data 30 Employee Data 485 500 1,035 1,048 1,063 1,130 1,250 1,375 0 200 400 600 800 1,000 1,200 1,400 1,600 Mar-12 Jun-12 Sep-12 Dec-12 Mar-13 Jun-13 Sep-13 Dec-13 $867 $876 $998 $985 $972 $914 $846 $796 $0 $200 $400 $600 $800 $1,000 $1,200 Mar-12 Jun-12 Sep-12 Dec-12 Mar-13 Jun-13 Sep-13 Dec-13 $15.1 $15.9 $38.7 $37.3 $35.8 $36.8 $38.5 $41.0 14% 15% 15% 14% 14% 14% 15% 15% $0 $10 $20 $30 $40 $50 Mar-12 Jun-12 Sep-12 Dec-12 Mar-13 Jun-13 Sep-13 Dec-13 $125 $127 $150 $142 $135 $130 $123 $119 $0 $200 $400 $600 $800 $1,000 $1,200 Mar-12 Jun-12 Sep-12 Dec-12 Mar-13 Jun-13 Sep-13 Dec-13 Number of Employees Employee Related SG&A thousands millions thousands H ea d co u n t Fi n an ci al S ta te m en t R ev en u e SG & A SG & A % of Revenue = Annualized Revenue per Employee Annualized Employee Related SG&A per Employee FY 2Q 2014 Supplemental Earnings Information
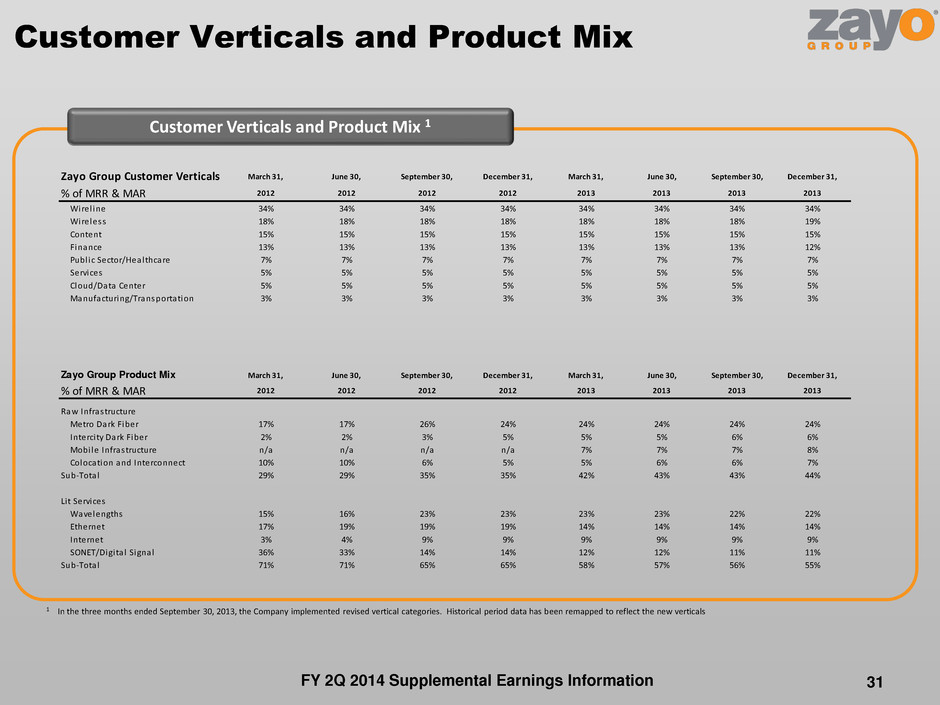
Zayo Group Customer Verticals March 31, June 30, September 30, December 31, March 31, June 30, September 30, December 31, % of MRR & MAR 2012 2012 2012 2012 2013 2013 2013 2013 Wirel ine 34% 34% 34% 34% 34% 34% 34% 34% Wireless 18% 18% 18% 18% 18% 18% 18% 19% Content 15% 15% 15% 15% 15% 15% 15% 15% Finance 13% 13% 13% 13% 13% 13% 13% 12% Publ ic Sector/Healthcare 7% 7% 7% 7% 7% 7% 7% 7% Services 5% 5% 5% 5% 5% 5% 5% 5% Cloud/Data Center 5% 5% 5% 5% 5% 5% 5% 5% Manufacturing/Transportation 3% 3% 3% 3% 3% 3% 3% 3% Zayo Group Product Mix March 31, June 30, September 30, December 31, March 31, June 30, September 30, December 31, % of MRR & MAR 2012 2012 2012 2012 2013 2013 2013 2013 Raw Infrastructure Metro Dark Fiber 17% 17% 26% 24% 24% 24% 24% 24% Interci ty Dark Fiber 2% 2% 3% 5% 5% 5% 6% 6% Mobi le Infrastructure n/a n/a n/a n/a 7% 7% 7% 8% Colocation and Interconnect 10% 10% 6% 5% 5% 6% 6% 7% Sub-Total 29% 29% 35% 35% 42% 43% 43% 44% Lit Services Wavelengths 15% 16% 23% 23% 23% 23% 22% 22% Ethernet 17% 19% 19% 19% 14% 14% 14% 14% Internet 3% 4% 9% 9% 9% 9% 9% 9% SONET/Digi ta l Signal 36% 33% 14% 14% 12% 12% 11% 11% Sub-Total 71% 71% 65% 65% 58% 57% 56% 55% Customer Verticals and Product Mix 31 Customer Verticals and Product Mix 1 1 In the three months ended September 30, 2013, the Company implemented revised vertical categories. Historical period data has been remapped to reflect the new verticals FY 2Q 2014 Supplemental Earnings Information
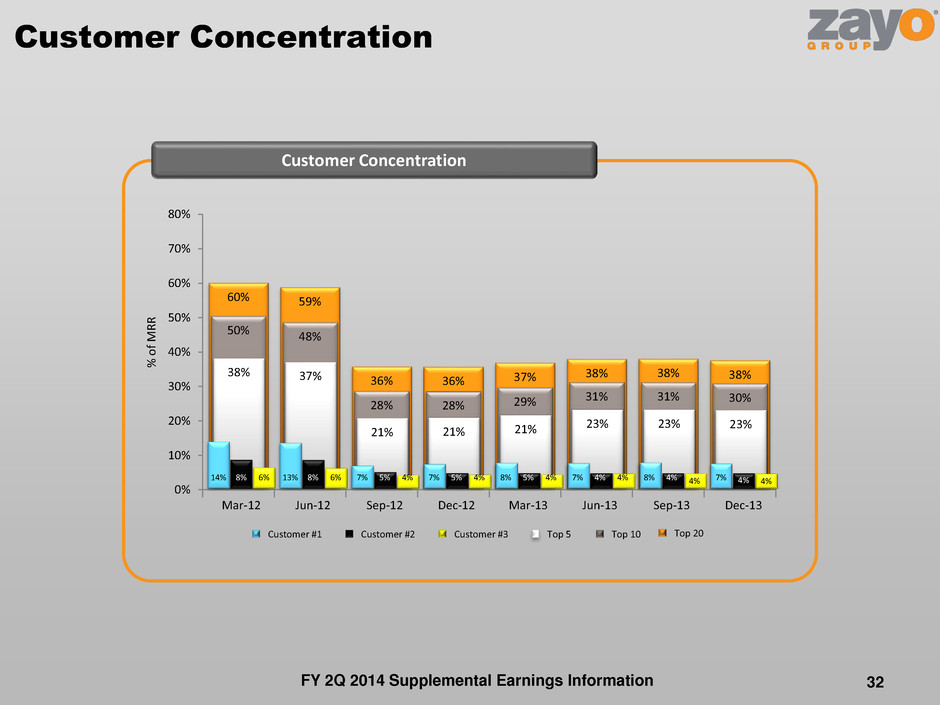
60% 59% 36% 36% 37% 38% 38% 38% 0% 10% 20% 30% 40% 50% 60% 70% 80% 50% 48% 28% 28% 29% 31% 31% 30% 38% 37% 21% 21% 21% 23% 23% 23% 14% 13% 7% 7% 8% 7% 8% 7% 8% 8% 5% 5% 5% 4% 4% 4% 6% 6% 4% 4% 4% 4% 4% 4% Mar-12 Jun-12 Sep-12 Dec-12 Mar-13 Jun-13 Sep-13 Dec-13 Customer Concentration 32 Customer Concentration % o f M RR Customer #1 Customer #2 Customer #3 Top 20 Top 10 Top 5 FY 2Q 2014 Supplemental Earnings Information
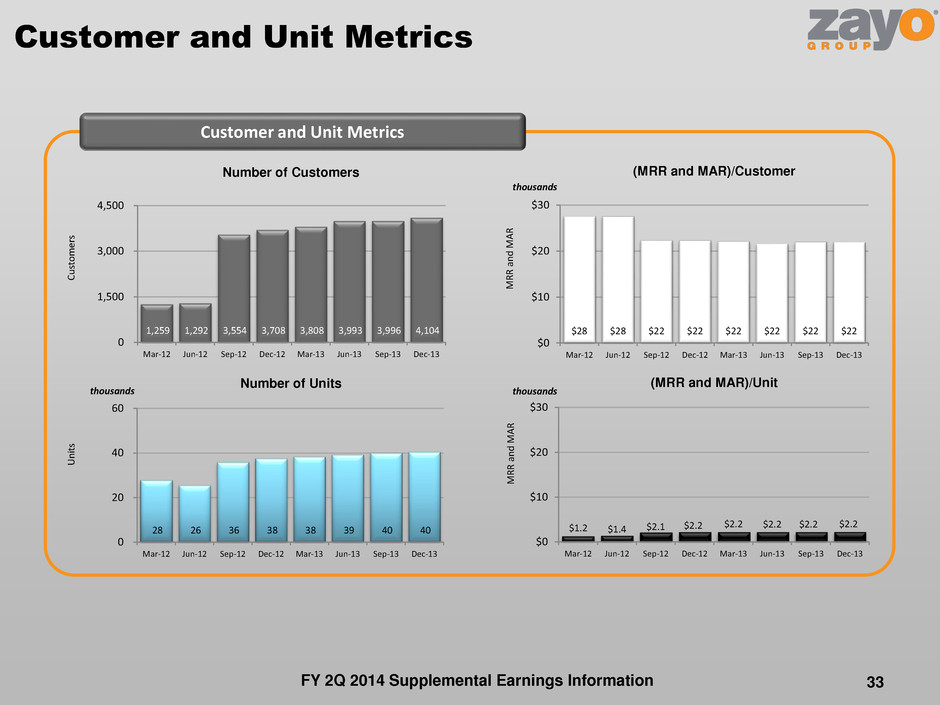
$28 $28 $22 $22 $22 $22 $22 $22 $0 $10 $20 $30 Mar-12 Jun-12 Sep-12 Dec-12 Mar-13 Jun-13 Sep-13 Dec-13 Customer and Unit Metrics Customer and Unit Metrics 1,259 1,292 3,554 3,708 3,808 3,993 3,996 4,104 0 1,500 3,000 4,500 Mar-12 Jun-12 Sep-12 Dec-12 Mar-13 Jun-13 Sep-13 Dec-13 28 26 36 38 38 39 40 40 0 20 40 60 Mar-12 Jun-12 Sep-12 Dec-12 Mar-13 Jun-13 Sep-13 Dec-13 $1.2 $1.4 $2.1 $2.2 $2.2 $2.2 $2.2 $2.2 $0 $10 $20 $30 Mar-12 Jun-12 Sep-12 Dec-12 Mar-13 Jun-13 Sep-13 Dec-13 Number of Customers Number of Units 33 C u st o m er s M R R a n d M A R M R R a n d M A R Un it s (MRR and MAR)/Customer thousands thousands thousands (MRR and MAR)/Unit FY 2Q 2014 Supplemental Earnings Information
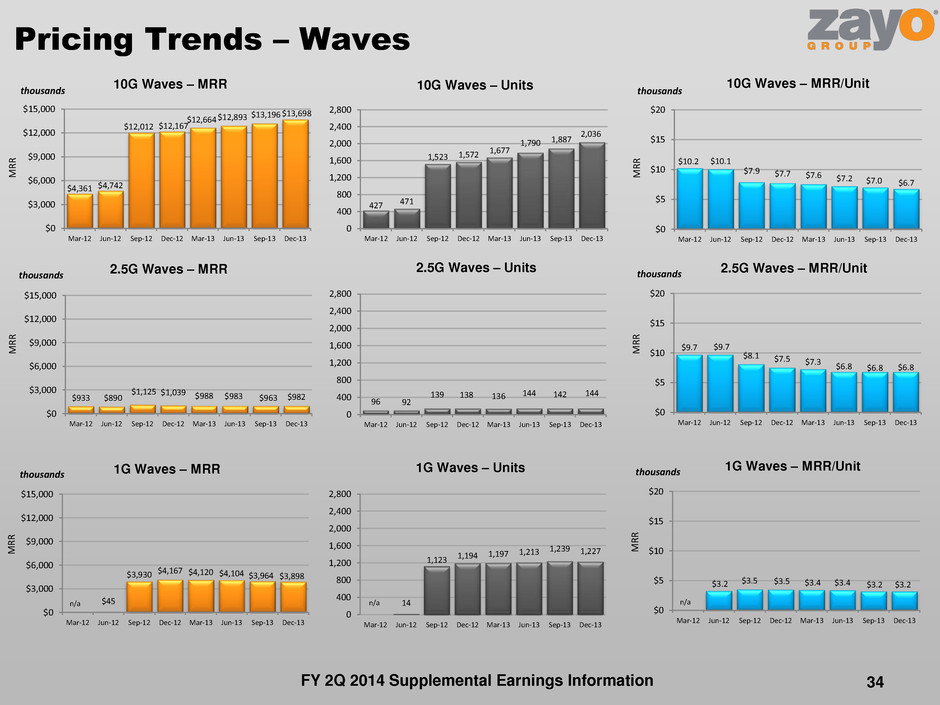
Pricing Trends – Waves 34 $4,361 $4,742 $12,012 $12,167 $12,664 $12,893 $13,196 $13,698 $0 $3,000 $6,000 $9,000 $12,000 $15,000 Mar-12 Jun-12 Sep-12 Dec-12 Mar-13 Jun-13 Sep-13 Dec-13 10G Waves – MRR 427 471 1,523 1,572 1,677 1,790 1,887 2,036 0 400 800 1,200 1,600 2,000 2,400 2,800 Mar-12 Jun-12 Sep-12 Dec-12 Mar-13 Jun-13 Sep-13 Dec-13 10G Waves – Units $10.2 $10.1 $7.9 $7.7 $7.6 $7.2 $7.0 $6.7 $0 $5 $10 $15 $20 Mar-12 Jun-12 Sep-12 Dec-12 Mar-13 Jun-13 Sep-13 Dec-13 10G Waves – MRR/Unit thousands M R R M R R thousands $933 $890 $1,125 $1,039 $988 $983 $963 $982 $0 $3,000 $6,000 $9,000 $12,000 $15,000 Mar-12 Jun-12 Sep-12 Dec-12 Mar-13 Jun-13 Sep-13 Dec-13 2.5G Waves – MRR $9.7 $9.7 $8.1 $7.5 $7.3 $6.8 $6.8 $6.8 $0 $5 $10 $15 $20 Mar-12 Jun-12 Sep-12 Dec-12 Mar-13 Jun-13 Sep-13 Dec-13 2.5G Waves – MRR/Unit thousands M R R M R R thousands 96 92 139 138 136 144 142 144 0 400 800 1,200 1,600 2,000 2,400 2,800 Mar-12 Jun-12 Sep-12 Dec-12 Mar-13 Jun-13 Sep-13 Dec-13 2.5G Waves – Units $45 $3,930 $4,167 $4,120 $4,104 $3,964 $3,898 $0 $3,000 $6,000 $9,000 $12,000 $15,000 Mar-12 Jun-12 Sep-12 Dec-12 Mar-13 Jun-13 Sep-13 Dec-13 1G Waves – MRR thousands M R R 14 1,123 1,194 1,197 1,213 1,239 1,227 0 400 800 1,200 1,600 2,000 2,400 2,800 Mar-12 Jun-12 Sep-12 Dec-12 Mar-13 Jun-13 Sep-13 Dec-13 1G Waves – Units $3.2 $3.5 $3.5 $3.4 $3.4 $3.2 $3.2 $0 $5 $10 $15 $20 Mar-12 Jun-12 Sep-12 Dec-12 Mar-13 Jun-13 Sep-13 Dec-13 1G Waves – MRR/Unit n/a M R R thousands n/a n/a FY 2Q 2014 Supplemental Earnings Information

Pricing Trends – Ethernet 35 $1,526 $1,747 $8,067 $7,702 $7,971 $8,242 $8,499 $8,666 $0 $2,000 $4,000 $6,000 $8,000 $10,000 Mar-12 Jun-12 Sep-12 Dec-12 Mar-13 Jun-13 Sep-13 Dec-13 GigE Full Rate (>1000Mb) – MRR 451 588 2,549 2,399 2,513 2,557 2,641 2,782 0 1,000 2,000 3,000 4,000 5,000 6,000 Mar-12 Jun-12 Sep-12 Dec-12 Mar-13 Jun-13 Sep-13 Dec-13 GigE Full Rate (>1000Mb) – Units $3.4 $3.0 $3.2 $3.2 $3.2 $3.2 $3.2 $3.1 $0 $1 $2 $3 $4 $5 Mar-12 Jun-12 Sep-12 Dec-12 Mar-13 Jun-13 Sep-13 Dec-13 thousands M R R M R R thousands $362 $513 $712 $1,171 $1,418 $1,589 $1,732 $1,840 $0 $2,000 $4,000 $6,000 $8,000 $10,000 Mar-12 Jun-12 Sep-12 Dec-12 Mar-13 Jun-13 Sep-13 Dec-13 Fractional GigE (101-1000Mb) – MRR 136 288 380 440 573 652 751 768 0 1,000 2,000 3,000 4,000 5,000 6,000 Mar-12 Jun-12 Sep-12 Dec-12 Mar-13 Jun-13 Sep-13 Dec-13 Fractional GigE (101-1000Mb) – Units $2.7 $1.8 $1.9 $2.7 $2.5 $2.4 $2.3 $2.4 $0 $1 $2 $3 $4 $5 Mar-12 Jun-12 Sep-12 Dec-12 Mar-13 Jun-13 Sep-13 Dec-13 thousands M R R M R R thousands $3,740 $4,134 $5,171 $6,081 $6,431 $6,630 $6,728 $6,900 $0 $2,000 $4,000 $6,000 $8,000 $10,000 Mar-12 Jun-12 Sep-12 Dec-12 Mar-13 Jun-13 Sep-13 Dec-13 Fast E (10-100Mb) – MRR 3,019 3,513 4,089 4,480 4,886 5,080 5,149 5,221 0 1,000 2,000 3,000 4,000 5,000 6,000 Mar-12 Jun-12 Sep-12 Dec-12 Mar-13 Jun-13 Sep-13 Dec-13 Fast E (10-100Mb) – Units $1.2 $1.2 $1.3 $1.4 $1.3 $1.3 $1.3 $1.3 $0 $1 $2 $3 $4 $5 Mar-12 Jun-12 Sep-12 Dec-12 Mar-13 Jun-13 Sep-13 Dec-13 Fast E (10-100Mb) – MRR/Unit thousands M R R M R R thousands GigE Full Rate (>1000Mb) – MRR/Unit Fractional GigE (101-1000Mb) – MRR/Unit FY 2Q 2014 Supplemental Earnings Information
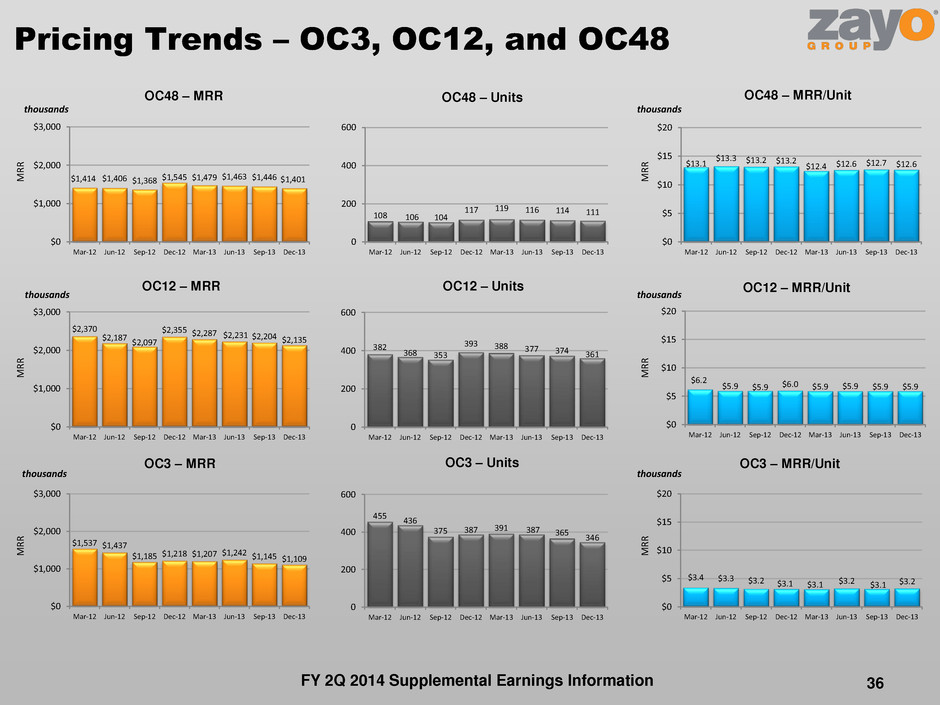
Pricing Trends – OC3, OC12, and OC48 36 $1,414 $1,406 $1,368 $1,545 $1,479 $1,463 $1,446 $1,401 $0 $1,000 $2,000 $3,000 Mar-12 Jun-12 Sep-12 Dec-12 Mar-13 Jun-13 Sep-13 Dec-13 OC48 – MRR 108 106 104 117 119 116 114 111 0 200 400 600 Mar-12 Jun-12 Sep-12 Dec-12 Mar-13 Jun-13 Sep-13 Dec-13 OC48 – Units $13.1 $13.3 $13.2 $13.2 $12.4 $12.6 $12.7 $12.6 $0 $5 $10 $15 $20 Mar-12 Jun-12 Sep-12 Dec-12 Mar-13 Jun-13 Sep-13 Dec-13 OC48 – MRR/Unit thousands M R R M R R thousands $2,370 $2,187 $2,097 $2,355 $2,287 $2,231 $2,204 $2,135 $0 $1,000 $2,000 $3,000 Mar-12 Jun-12 Sep-12 Dec-12 Mar-13 Jun-13 Sep-13 Dec-13 OC12 – MRR 382 368 353 393 388 377 374 361 0 200 400 600 Mar-12 Jun-12 Sep-12 Dec-12 Mar-13 Jun-13 Sep-13 Dec-13 OC12 – Units $6.2 $5.9 $5.9 $6.0 $5.9 $5.9 $5.9 $5.9 $0 $5 $10 $15 $20 Mar-12 Jun-12 Sep-12 Dec-12 Mar-13 Jun-13 Sep-13 Dec-13 OC12 – MRR/Unit thousands M R R M R R thousands $1,537 $1,437 $1,185 $1,218 $1,207 $1,242 $1,145 $1,109 $0 $1,000 $2,000 $3,000 Mar-12 Jun-12 Sep-12 Dec-12 Mar-13 Jun-13 Sep-13 Dec-13 OC3 – MRR 455 436 375 387 391 387 365 346 0 200 400 600 Mar-12 Jun-12 Sep-12 Dec-12 Mar-13 Jun-13 Sep-13 Dec-13 OC3 – Units thousands M R R M R R thousands $3.4 $3.3 $3.2 $3.1 $3.1 $3.2 $3.1 $3.2 $0 $5 $10 $15 $20 Mar-12 Jun-12 Sep-12 Dec-12 Mar-13 Jun-13 Sep-13 Dec-13 OC3 – MRR/Unit FY 2Q 2014 Supplemental Earnings Information
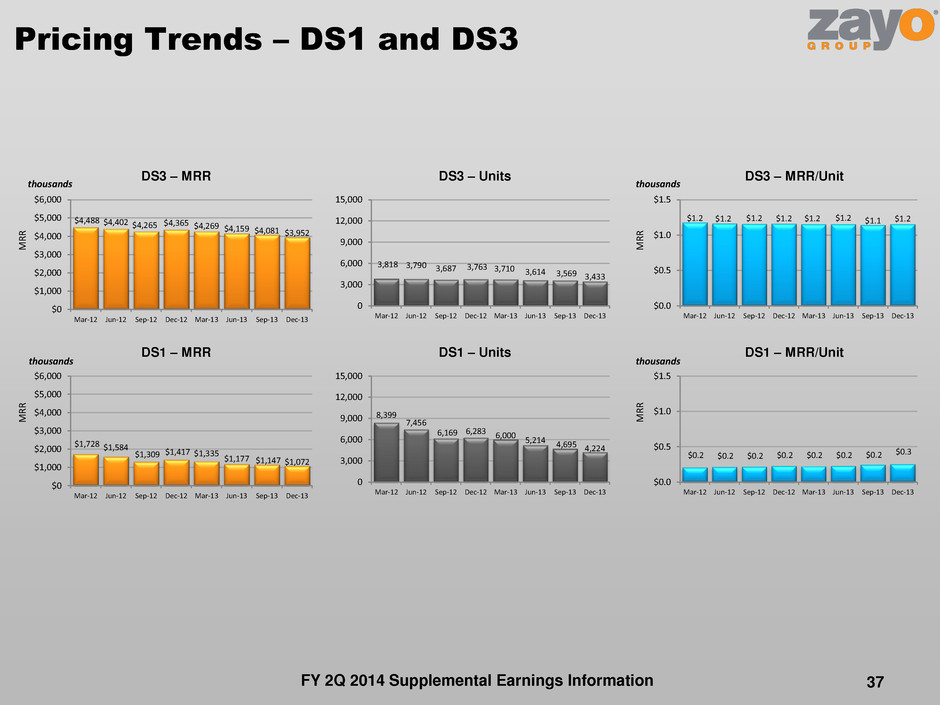
Pricing Trends – DS1 and DS3 37 $4,488 $4,402 $4,265 $4,365 $4,269 $4,159 $4,081 $3,952 $0 $1,000 $2,000 $3,000 $4,000 $5,000 $6,000 Mar-12 Jun-12 Sep-12 Dec-12 Mar-13 Jun-13 Sep-13 Dec-13 DS3 – MRR 3,818 3,790 3,687 3,763 3,710 3,614 3,569 3,433 0 3,000 6,000 9,000 12,000 15,000 Mar-12 Jun-12 Sep-12 Dec-12 Mar-13 Jun-13 Sep-13 Dec-13 DS3 – Units $1.2 $1.2 $1.2 $1.2 $1.2 $1.2 $1.1 $1.2 $0.0 $0.5 $1.0 $1.5 Mar-12 Jun-12 Sep-12 Dec-12 Mar-13 Jun-13 Sep-13 Dec-13 DS3 – MRR/Unit thousands M R R M R R thousands $1,728 $1,584 $1,309 $1,417 $1,335 $1,177 $1,147 $1,072 $0 $1,000 $2,000 $3,000 $4,000 $5,000 $6,000 Mar-12 Jun-12 Sep-12 Dec-12 Mar-13 Jun-13 Sep-13 Dec-13 DS1 – MRR 8,399 7,456 6,169 6,283 6,000 5,214 4,695 4,224 0 3,000 6,000 9,000 12,000 15,000 Mar-12 Jun-12 Sep-12 Dec-12 Mar-13 Jun-13 Sep-13 Dec-13 DS1 – Units $0.2 $0.2 $0.2 $0.2 $0.2 $0.2 $0.2 $0.3 $0.0 $0.5 $1.0 $1.5 Mar-12 Jun-12 Sep-12 Dec-12 Mar-13 Jun-13 Sep-13 Dec-13 DS1 – MRR/Unit thousands M R R M R R thousands FY 2Q 2014 Supplemental Earnings Information

$34.4 $14.9 $50.5 $50.6 $80.4 $84.4 $67.3 $67.7 $5.6 $3.5 $10.1 $3.2 $8.1 $11.0 $11.8 $13.0 $40.0 $18.3 $60.6 $53.8 $88.5 $95.4 $79.1 $80.7 $0 $20 $40 $60 $80 $100 $120 $140 Mar-12 Jun-12 Sep-12 Dec-12 Mar-13 Jun-13 Sep-13 Dec-13 Success Based Infrastructure millions Purchases of Property and Equipment Purchases of Property and Equipment by Driver $40.0 $18.3 $60.6 $53.8 $88.5 $95.4 $79.1 $80.7 $1.1 $1.8 $3.2 $3.0 $4.0 $4.2 $5.1 $4.9 $0.6 $0.2 $0.5 $0.5 $1.1 $0.6 $0.6 $0.8 $1.1 $1.0 $2.3 $1.6 $2.1 $1.7 $1.9 $1.8 $42.7 $21.4 $66.7 $58.9 $95.7 $101.9 $86.7 $88.3 $0 $20 $40 $60 $80 $100 $120 $140 Mar-12 Jun-12 Sep-12 Dec-12 Mar-13 Jun-13 Sep-13 Dec-13 Growth Maintenance Integration Other 38 C ap it al E xp en d it u re s Purchases of Property and Equipment $1.1 $1.8 $3.2 $3.0 $4.0 $4.2 $5.1 $4.9 $0.6 $0.2 $0.5 $0.5 $1.1 $0.6 $0.6 $0.8 $1.1 $1.0 $2.3 $1.6 $2.1 $1.7 $1.9 $1.8 $2.7 $3.1 $6.0 $5.1 $7.2 $6.5 $7.5 $7.6 $0 $2 $4 $6 $8 $10 $12 $14 Mar-12 Jun-12 Sep-12 Dec-12 Mar-13 Jun-13 Sep-13 Dec-13 Maintenance Integration Other Maintenance, Integration and Other Growth C ap it al E xp en d it u re s C ap it al E xp en d it u re s C ap it al E xp en d it u re s millions millions millions Purchases of Property and Equipment by Type $6.6 $(0.1) $14.6 $9.9 $20.2 $21.6 $16.6 $21.2 $2.4 $2.6 $4.2 $2.1 $7.2 $8.8 $3.6 $3.4 $0.1 $0.0 $0.1 $0.2 $1.1 $0.8 $0.6 $0.2 $27.6 $15.8 $41.5 $39.6 $57.6 $60.4 $53.5 $51.3 $2.7 $2.5 $4.3 $5.8 $6.2 $8.8 $9.2 $9.8 $3.4 $0.5 $2.0 $1.4 $3.4 $1.6 $3.1 $2.3 $42.7 $21.4 $66.7 $58.9 $95.7 $101.9 $86.7 $88.3 ($20) $0 $20 $40 $60 $80 $100 $120 Mar-12 Jun-12 Sep-12 Dec-12 Mar-13 Jun-13 Sep-13 Dec-13 Optronics equipment IP equipment IT technology Outside and inside plant Capitalized labor Other FY 2Q 2014 Supplemental Earnings Information
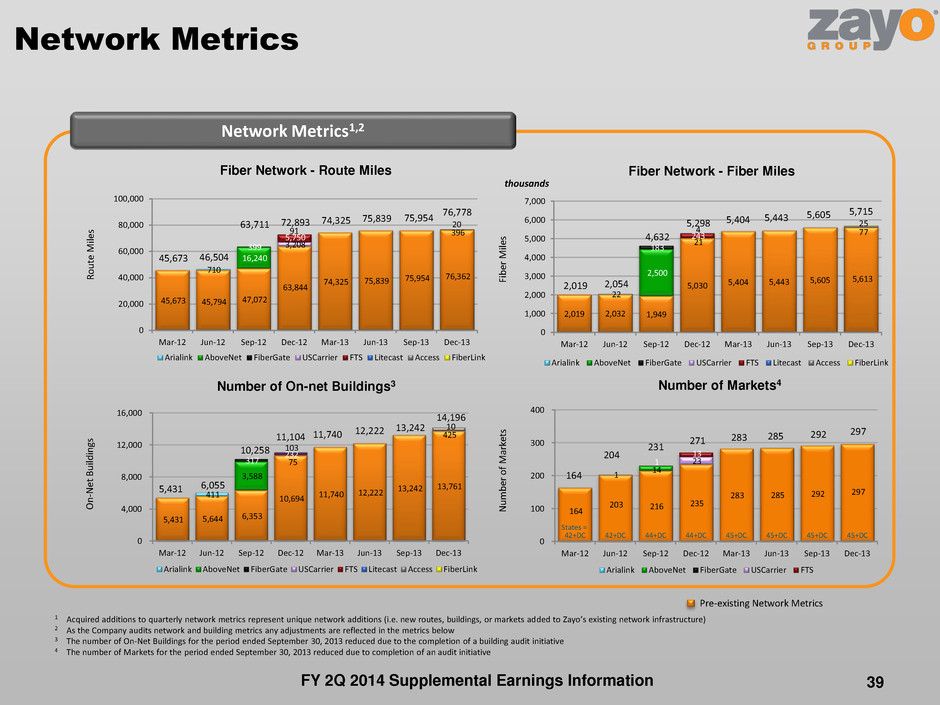
Network Metrics 39 Network Metrics1,2 45,673 45,794 47,072 63,844 74,325 75,839 75,954 76,362 710 16,240 399 3,208 5,750 91 396 20 45,673 46,504 63,711 72,893 74,325 75,839 75,954 76,778 0 20,000 40,000 60,000 80,000 100,000 Mar-12 Jun-12 Sep-12 Dec-12 Mar-13 Jun-13 Sep-13 Dec-13 Arialink AboveNet FiberGate USCarrier FTS Litecast Access FiberLink 2,019 2,032 1,949 5,030 5,404 5,443 5,605 5,613 22 2,500 183 21 243 4 77 25 2,019 2,054 4,632 5,298 5,404 5,443 5,605 5,715 0 1,000 2,000 3,000 4,000 5,000 6,000 7,000 Mar-12 Jun-12 Sep-12 Dec-12 Mar-13 Jun-13 Sep-13 Dec-13 Arialink AboveNet FiberGate USCarrier FTS Litecast Access FiberLink Fiber Network - Route Miles R o u te M ile s Fi b er M ile s O n -N et B u ild in gs N u m b er o f M ar ke ts 164 203 216 235 283 285 292 297 1 14 1 23 13 164 204 231 271 283 285 292 297 42+DC 42+DC 44+DC 44+DC 45+DC 45+DC 45+DC 45+DC 0 100 200 300 400 Mar-12 Jun-12 Sep-12 Dec-12 Mar-13 Jun-13 Sep-13 Dec-13 Arialink AboveNet FiberGate USCarrier FTS 5,431 5,644 6,353 10,694 11,740 12,222 13,242 13,761 411 3,588 317 75 232 103 425 10 5,431 6,055 10,258 11,104 11,740 12,222 13,242 14,196 0 4,000 8,000 12,000 16,000 Mar-12 Jun-12 Sep-12 Dec-12 Mar-13 Jun-13 Sep-13 Dec-13 Arialink AboveNet FiberGate USCarrier FTS Litecast Access FiberLink thousands States = Pre-existing Network Metrics Fiber Network - Fiber Miles FY 2Q 2014 Supplemental Earnings Information Number of On-net Buildings3 Number of Markets4 1 Acquired additions to quarterly network metrics represent unique network additions (i.e. new routes, buildings, or markets added to Zayo’s existing network infrastructure) 2 As the Company audits network and building metrics any adjustments are reflected in the metrics below 3 The number of On-Net Buildings for the period ended September 30, 2013 reduced due to the completion of a building audit initiative 4 The number of Markets for the period ended September 30, 2013 reduced due to completion of an audit initiative
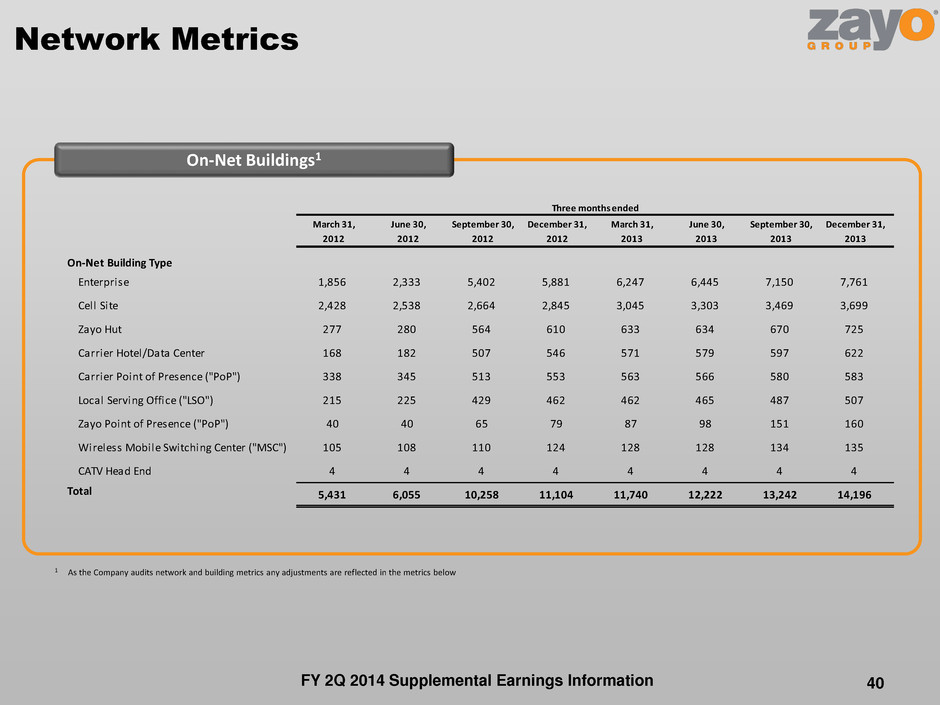
March 31, June 30, September 30, December 31, March 31, June 30, September 30, December 31, 2012 2012 2012 2012 2013 2013 2013 2013 On-Net Building Type Enterprise 1,856 2,333 5,402 5,881 6,247 6,445 7,150 7,761 Cell Site 2,428 2,538 2,664 2,845 3,045 3,303 3,469 3,699 Zayo Hut 277 280 564 610 633 634 670 725 Carrier Hotel/Data Center 168 182 507 546 571 579 597 622 Carrier Point of Presence ("PoP") 338 345 513 553 563 566 580 583 Local Serving Office ("LSO") 215 225 429 462 462 465 487 507 Zayo Point of Presence ("PoP") 40 40 65 79 87 98 151 160 Wireless Mobile Switching Center ("MSC") 105 108 110 124 128 128 134 135 CATV Head End 4 4 4 4 4 4 4 4 Total 5,431 6,055 10,258 11,104 11,740 12,222 13,242 14,196 Three months ended Network Metrics 40 On-Net Buildings1 1 As the Company audits network and building metrics any adjustments are reflected in the metrics below FY 2Q 2014 Supplemental Earnings Information
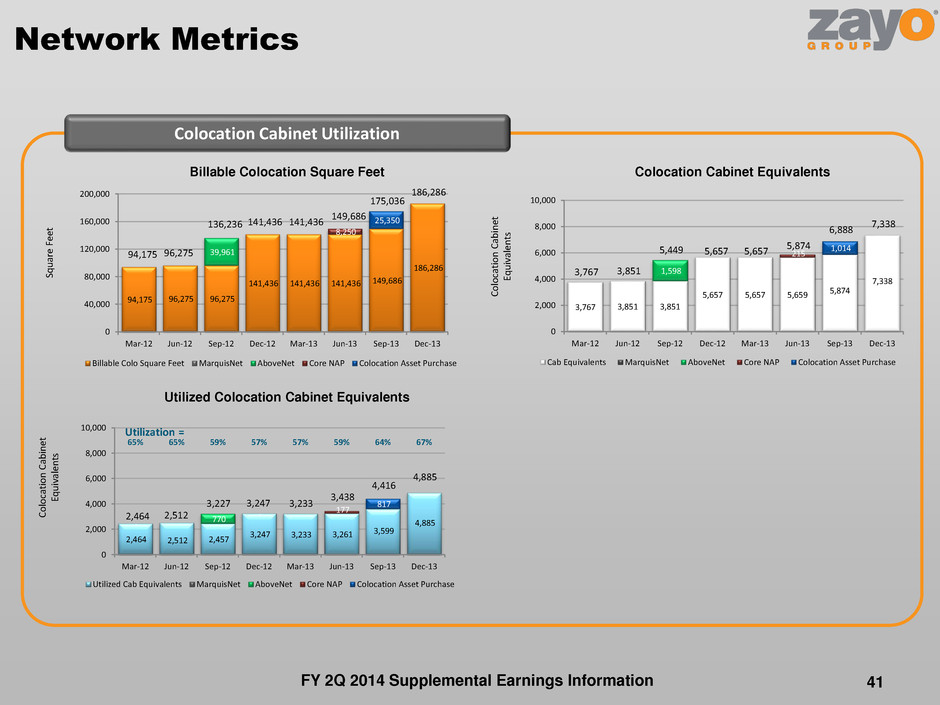
2,464 2,512 2,457 3,247 3,233 3,261 3,599 4,885 - 770 - 177 817 2,464 2,512 3,227 3,247 3,233 3,438 4,416 4,885 65% 65% 59% 57% 57% 59% 64% 67% 0 2,000 4,000 6,000 8,000 10,000 Mar-12 Jun-12 Sep-12 Dec-12 Mar-13 Jun-13 Sep-13 Dec-13 Utilized Cab Equivalents MarquisNet AboveNet Core NAP Colocation Asset Purchase 3,767 3,851 3,851 5,657 5,657 5,659 5,874 7,338 - 1,598 - 215 1,014 3,767 3,851 5,449 5,657 5,657 5,874 6,888 7,338 0 2,000 4,000 6,000 8,000 10,000 Mar-12 Jun-12 Sep-12 Dec-12 Mar-13 Jun-13 Sep-13 Dec-13 Cab Equivalents MarquisNet AboveNet Core NAP Colocation Asset Purchase 94,175 96,275 96,275 141,436 141,436 141,436 149,686 186,286 39,961 8,250 25,350 94,175 96,275 136,236 141,436 141,436 149,686 175,036 186,286 0 40,000 80,000 120,000 160,000 200,000 Mar-12 Jun-12 Sep-12 Dec-12 Mar-13 Jun-13 Sep-13 Dec-13 Billable Colo Square Feet MarquisNet AboveNet Core NAP Colocation Asset Purchase Network Metrics 41 Colocation Cabinet Utilization Billable Colocation Square Feet Utilized Colocation Cabinet Equivalents Sq u ar e F ee t C o lo ca ti o n C ab in et Eq u iv al en ts C o lo ca ti o n C ab in et Eq u iv al en ts Utilization = Colocation Cabinet Equivalents FY 2Q 2014 Supplemental Earnings Information

42 Fiber to the Tower FY 2Q 2014 Supplemental Earnings Information
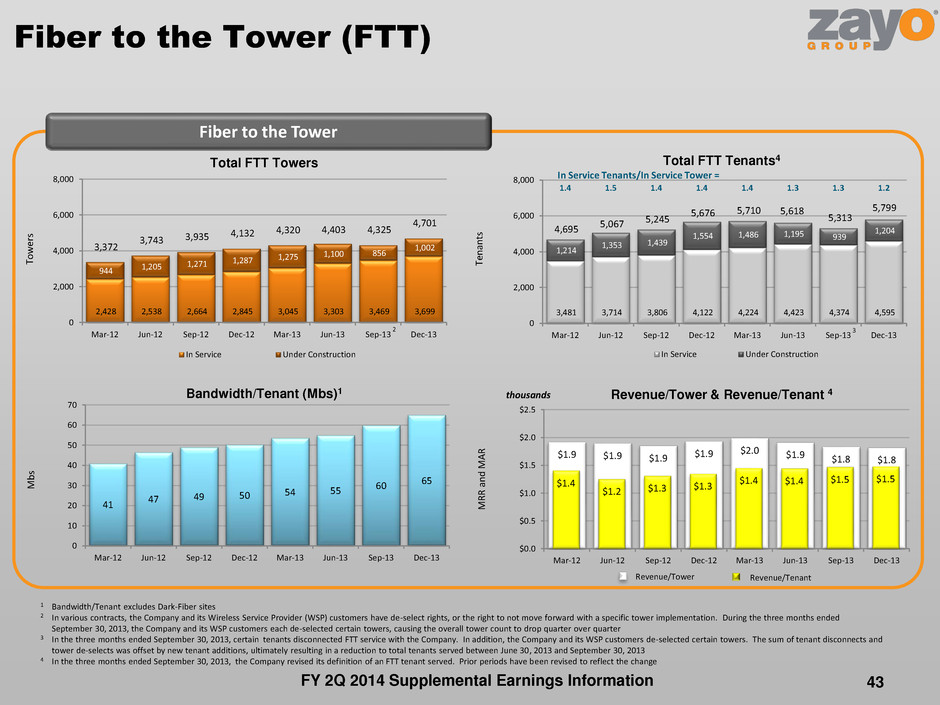
Revenue/Tower & Revenue/Tenant 4 $1.9 $1.9 $1.9 $1.9 $2.0 $1.9 $1.8 $1.8 $0.0 $0.5 $1.0 $1.5 $2.0 $2.5 Mar-12 Jun-12 Sep-12 Dec-12 Mar-13 Jun-13 Sep-13 Dec-13 $1.4 $1.2 $1.3 $1.3 $1.4 $1.4 $1.5 $1.5 Revenue/Tower 1 Bandwidth/Tenant excludes Dark-Fiber sites 2 In various contracts, the Company and its Wireless Service Provider (WSP) customers have de-select rights, or the right to not move forward with a specific tower implementation. During the three months ended September 30, 2013, the Company and its WSP customers each de-selected certain towers, causing the overall tower count to drop quarter over quarter 3 In the three months ended September 30, 2013, certain tenants disconnected FTT service with the Company. In addition, the Company and its WSP customers de-selected certain towers. The sum of tenant disconnects and tower de-selects was offset by new tenant additions, ultimately resulting in a reduction to total tenants served between June 30, 2013 and September 30, 2013 4 In the three months ended September 30, 2013, the Company revised its definition of an FTT tenant served. Prior periods have been revised to reflect the change Revenue/Tenant Fiber to the Tower (FTT) Fiber to the Tower 2,428 2,538 2,664 2,845 3,045 3,303 3,469 3,699 944 1,205 1,271 1,287 1,275 1,100 856 1,002 3,372 3,743 3,935 4,132 4,320 4,403 4,325 4,701 0 2,000 4,000 6,000 8,000 Mar-12 Jun-12 Sep-12 Dec-12 Mar-13 Jun-13 Sep-13 Dec-13 In Service Under Construction 41 47 49 50 54 55 60 65 0 10 20 30 40 50 60 70 Mar-12 Jun-12 Sep-12 Dec-12 Mar-13 Jun-13 Sep-13 Dec-13 Total FTT Towers Bandwidth/Tenant (Mbs)1 3,481 3,714 3,806 4,122 4,224 4,423 4,374 4,595 1,214 1,353 1,439 1,554 1,486 1,195 939 1,204 4,695 5,067 5,245 5,676 5,710 5,618 5,313 5,799 1.4 1.5 1.4 1.4 1.4 1.3 1.3 1.2 0 2,000 4,000 6,000 8,000 Mar-12 Jun-12 Sep-12 Dec-12 Mar-13 Jun-13 Sep-13 Dec-13 In Service Under Construction thousands 43 To w er s Te n an ts M R R a n d M A R M b s In Service Tenants/In Service Tower = Total FTT Tenants4 2 3 FY 2Q 2014 Supplemental Earnings Information

45% 43% 41% 40% 39% 40% 39% 40% $10.4M $10.6M $14.5M $14.7M $15.2M $15.9M $16.1M $17.0M 0% 10% 20% 30% 40% 50% 60% Mar-12 Jun-12 Sep-12 Dec-12 Mar-13 Jun-13 Sep-13 Dec-13 Wireless Carrier MRR and MAR = 13% 13% 6% 7% 7% 7% 7% 7% 20% 18% 15% 15% 13% 12% 12% 11% 73% 79% 82% 82% 84% 84% 84% 85% 7% 4% 3% 3% 4% 4% 4% 4% 0% 20% 40% 60% 80% 100% Mar-12 Jun-12 Sep-12 Dec-12 Mar-13 Jun-13 Sep-13 Dec-13 FTT Product Mix - % Sonet/Digital Signal FTT Product Mix - % Dedicated Ethernet FTT Product Mix - % Dark Fiber % o f M R R a n d M A R % of Zayo Group’s Wireless Carrier MRR and MAR Fiber to the Tower (FTT) FTT MRR and MAR millions 44 M R R a n d M A R % o f FT T M R R a n d M A R % of Zayo Group’s MRR and MAR $4.7 $4.6 $4.9 $5.5 $6.1 $6.3 $6.4 $6.7 $275M $272M $282M $475M $480M $497M $487M $542M $0 $2 $4 $6 $8 $10 Mar-12 Jun-12 Sep-12 Dec-12 Mar-13 Jun-13 Sep-13 Dec-13 Contract Value = Fiber to the Tower % of MRR and MAR FTT Product Mix FY 2Q 2014 Supplemental Earnings Information
45 Financial Data by Reporting Segment FY 2Q 2014 Supplemental Earnings Information
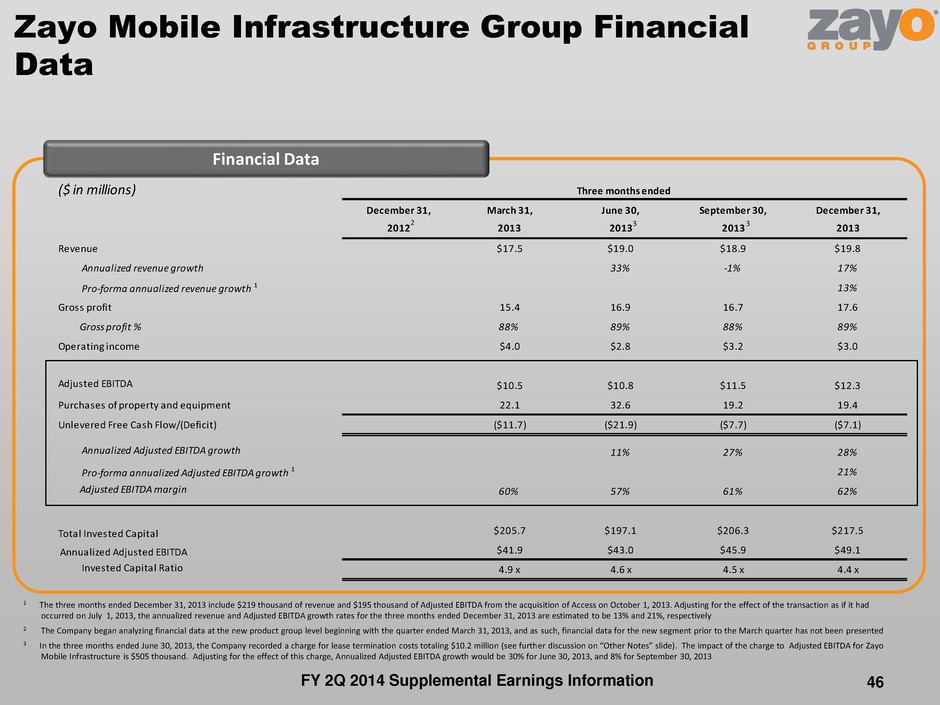
($ in millions) December 31, March 31, June 30, September 30, December 31, 2012 2013 2013 2013 2013 Revenue $17.5 $19.0 $18.9 $19.8 Annualized revenue growth 33% -1% 17% Pro-forma annualized revenue growth 1 13% Gross profit 15.4 16.9 16.7 17.6 Gross profit % 88% 89% 88% 89% Operating income $4.0 $2.8 $3.2 $3.0 Adjusted EBITDA $10.5 $10.8 $11.5 $12.3 Purchases of property and equipment 22.1 32.6 19.2 19.4 Unlevered Free Cash Flow/(Deficit) ($11.7) ($21.9) ($7.7) ($7.1) Annualized Adjusted EBITDA growth 11% 27% 28% Pro-forma annualized Adjusted EBITDA growth 1 21% Adjusted EBITDA margin 60% 57% 61% 62% Total Invested Capital $205.7 $197.1 $206.3 $217.5 Annualized Adjusted EBITDA $41.9 $43.0 $45.9 $49.1 Invested Capital Ratio 4.9 x 4.6 x 4.5 x 4.4 x Three months ended Zayo Mobile Infrastructure Group Financial Data 46 Financial Data 2 1 The three months ended December 31, 2013 include $219 thousand of revenue and $195 thousand of Adjusted EBITDA from the acquisition of Access on October 1, 2013. Adjusting for the effect of the transaction as if it had occurred on July 1, 2013, the annualized revenue and Adjusted EBITDA growth rates for the three months ended December 31, 2013 are estimated to be 13% and 21%, respectively 2 The Company began analyzing financial data at the new product group level beginning with the quarter ended March 31, 2013, and as such, financial data for the new segment prior to the March quarter has not been presented 3 In the three months ended June 30, 2013, the Company recorded a charge for lease termination costs totaling $10.2 million (see further discussion on “Other Notes” slide). The impact of the charge to Adjusted EBITDA for Zayo Mobile Infrastructure is $505 thousand. Adjusting for the effect of this charge, Annualized Adjusted EBITDA growth would be 30% for June 30, 2013, and 8% for September 30, 2013 3 3 FY 2Q 2014 Supplemental Earnings Information

($ in millions) December 31, March 31, June 30, September 30, December 31, 2012 2013 2013 2013 2013 Revenue $60.5 $62.1 $63.3 $64.4 Annualized revenue growth 10% 8% 7% Pro-forma annualized revenue growth Gross profit 51.3 53.0 54.6 55.3 Gross profit % 85% 85% 86% 86% Operating income $10.7 $9.2 $11.6 $10.8 Adjusted EBITDA $30.3 $29.3 $32.9 $32.9 Purchases of property and equipment 20.1 28.0 22.1 26.2 Unlevered Free Cash Flow $10.1 $1.4 $10.9 $6.7 Annualized Adjusted EBITDA growth -12% 49% -1% Pro-forma annualized Adjusted EBITDA growth Adjusted EBITDA margin 50% 47% 52% 51% Total Invested Capital $622.3 $664.5 $650.9 $647.2 Annualized Adjusted EBITDA $121.1 $117.3 $131.7 $131.5 Invested Capital Ratio 5.1 x 5.7 x 4.9 x 4.9 x Three months ended Zayo Wavelength Services Financial Data 47 Financial Data 1 The Company began analyzing financial data at the new product group level beginning with the quarter ended March 31, 2013, and as such, financial data for the new segment prior to the March quarter has not been presented 2 In the three months ended June 30, 2013, the Company recorded a charge for lease termination costs totaling $10.2 million (see further discussion on “Other Notes” slide). The impact of the charge to Adjusted EBITDA for Zayo Wavelength Services is $2.8 million. Adjusting for the effect of this charge, Annualized Adjusted EBITDA growth would be 25% for June 30, 2013, and 10% for September 30, 2013 2 2 FY 2Q 2014 Supplemental Earnings Information 1
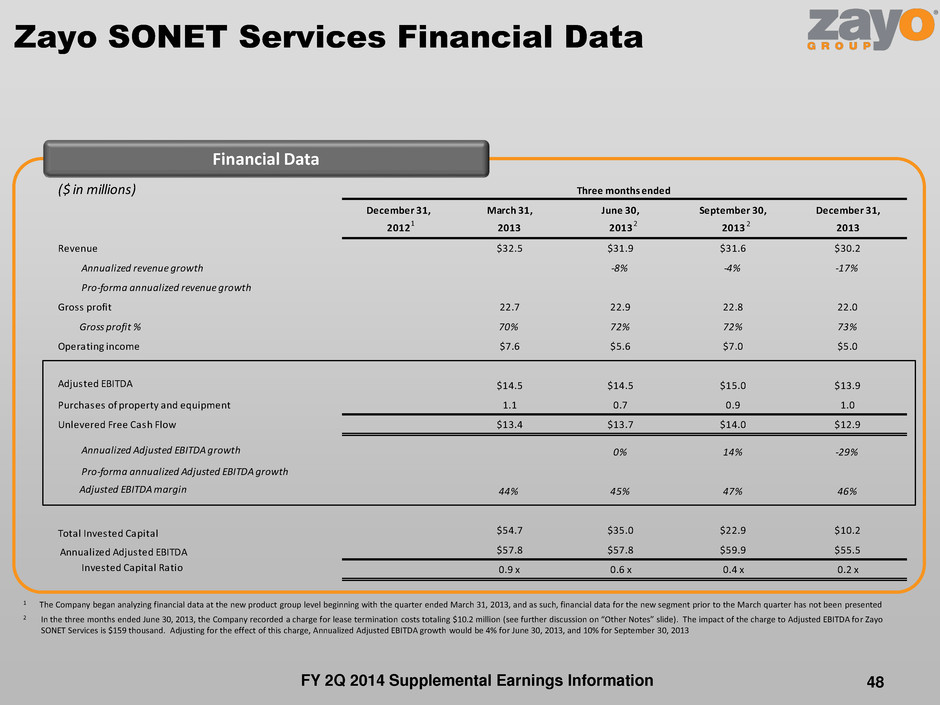
($ in millions) December 31, March 31, June 30, September 30, December 31, 2012 2013 2013 2013 2013 Revenue $32.5 $31.9 $31.6 $30.2 Annualized revenue growth -8% -4% -17% Pro-forma annualized revenue growth Gross profit 22.7 22.9 22.8 22.0 Gross profit % 70% 72% 72% 73% Operating income $7.6 $5.6 $7.0 $5.0 Adjusted EBITDA $14.5 $14.5 $15.0 $13.9 Purchases of property and equipment 1.1 0.7 0.9 1.0 Unlevered Free Cash Flow $13.4 $13.7 $14.0 $12.9 Annualized Adjusted EBITDA growth 0% 14% -29% Pro-forma annualized Adjusted EBITDA growth Adjusted EBITDA margin 44% 45% 47% 46% Total Invested Capital $54.7 $35.0 $22.9 $10.2 Annualized Adjusted EBITDA $57.8 $57.8 $59.9 $55.5 Invested Capital Ratio 0.9 x 0.6 x 0.4 x 0.2 x Three months ended Zayo SONET Services Financial Data 48 Financial Data 1 The Company began analyzing financial data at the new product group level beginning with the quarter ended March 31, 2013, and as such, financial data for the new segment prior to the March quarter has not been presented 2 In the three months ended June 30, 2013, the Company recorded a charge for lease termination costs totaling $10.2 million (see further discussion on “Other Notes” slide). The impact of the charge to Adjusted EBITDA for Zayo SONET Services is $159 thousand. Adjusting for the effect of this charge, Annualized Adjusted EBITDA growth would be 4% for June 30, 2013, and 10% for September 30, 2013 FY 2Q 2014 Supplemental Earnings Information 2 2 1

($ in millions) December 31, March 31, June 30, September 30, December 31, 2012 2013 2013 2013 2013 Revenue $33.9 $35.3 $36.1 $37.6 Annualized revenue growth 17% 9% 16% Pro-forma annualized revenue growth 1 13% Gross profit 30.7 32.2 32.6 34.0 Gross profit % 91% 91% 90% 90% Operating income $10.8 $7.5 $9.5 $10.8 Adjusted EBITDA $18.9 $18.0 $20.4 $21.1 Purchases of property and equipment 14.9 15.8 13.1 10.1 Unlevered Free Cash Flow $4.0 $2.2 $7.3 $11.0 Annualized Adjusted EBITDA growth -20% 52% 14% Pro-forma annualized Adjusted EBITDA growth 1 10% Adjusted EBITDA margin 56% 51% 56% 56% Total Invested Capital $351.1 $362.2 $355.1 $351.6 Annualized Adjusted EBITDA $75.8 $72.1 $81.5 $84.3 Invested Capital Ratio 4.6 x 5.0 x 4.4 x 4.2 x Three months ended Zayo Ethernet Services Financial Data 49 Financial Data 1 The three months ended December 31, 2013 include $272 thousand of revenue and $193 thousand of Adjusted EBITDA from the acquisition of Access on October 1, 2013. Adjusting for the effect of the transaction as if it had occurred on July 1, 2013, the annualized revenue and Adjusted EBITDA growth rates for the three months ended December 31, 2013 are estimated to be 13% and 10%, respectively 2 The Company began analyzing financial data at the new product group level beginning with the quarter ended March 31, 2013, and as such, financial data for the new segment prior to the March quarter has not been presented 3 In the three months ended June 30, 2013, the Company recorded a charge for lease termination costs totaling $10.2 million (see further discussion on “Other Notes” slide). The impact of the charge to Adjusted EBITDA for Zayo Ethernet Services is $1.9 million. Adjusting for the effect of this charge, Annualized Adjusted EBITDA growth would be 21% for June 30, 2013, and 9% for September 30, 2013 FY 2Q 2014 Supplemental Earnings Information 3 3 2

($ in millions) December 31, March 31, June 30, September 30, December 31, 2012 2013 2013 2013 2013 Revenue $23.1 $23.1 $23.8 $24.7 Annualized revenue growth 1% 12% 14% Pro-forma annualized revenue growth Gross profit 20.7 20.8 21.7 22.4 Gross profit % 90% 90% 91% 91% Operating income $9.6 $7.7 $9.4 $8.7 Adjusted EBITDA $13.1 $12.4 $14.3 $14.4 Purchases of property and equipment 5.2 4.5 5.4 4.3 Unlevered Free Cash Flow $7.9 $7.9 $8.9 $10.1 Annualized Adjusted EBITDA growth -21% 60% 4% Pro-forma annualized Adjusted EBITDA growth Adjusted EBITDA margin 57% 54% 60% 58% Total Invested Capital $197.5 $192.7 $183.9 $176.1 Annualized Adjusted EBITDA $52.3 $49.6 $57.0 $57.6 Invested Capital Ratio 3.8 x 3.9 x 3.2 x 3.1 x Three months ended Zayo IP Services Financial Data 50 Financial Data 1 The Company began analyzing financial data at the new product group level beginning with the quarter ended March 31, 2013, and as such, financial data for the new segment prior to the March quarter has not been presented 2 In the three months ended June 30, 2013, the Company recorded a charge for lease termination costs totaling $10.2 million (see further discussion on “Other Notes” slide). The impact of the charge to Adjusted EBITDA for Zayo IP Services is $1.0 million. Adjusting for the effect of this charge, Annualized Adjusted EBITDA growth would be 10% for June 30, 2013, and 26% for September 30, 2013 FY 2Q 2014 Supplemental Earnings Information 2 2 1

($ in millions) December 31, March 31, June 30, September 30, December 31, 2012 2013 2013 2013 2013 Revenue $15.4 $15.9 $16.7 $18.9 $20.9 Annualized revenue growth 4% 12% 20% 53% 42% Pro-forma annualized revenue growth 1 3% 14% 8% 2% 28% Gross profit 7.8 8.3 9.2 10.4 11.8 Gross profit % 51% 52% 55% 55% 57% Operating income $2.6 $4.2 $3.6 $3.1 $3.3 Adjusted EBITDA $5.2 $6.3 $6.6 $7.1 $8.6 Purchases of property and equipment 4.8 3.7 2.7 2.8 5.8 Unlevered Free Cash Flow $0.4 $2.6 $3.9 $4.3 $2.8 Annualized Adjusted EBITDA growth 58% 83% 18% 30% 86% Pro-forma annualized Adjusted EBITDA growth 1 58% 82% 4% 41% 107% Adjusted EBITDA margin 34% 40% 39% 37% 41% Total Invested Capital $47.8 $47.9 $41.2 $52.1 $50.2 Annualized Adjusted EBITDA $20.8 $25.1 $26.3 $28.2 $34.3 Invested Capital Ratio 2.3 x 1.9 x 1.6 x 1.8 x 1.5 x Three months ended zColo Financial Data 51 Financial Data 1 The three months ended September 30, 2013 include $1.3 million of revenue and ($0.8) million of Adjusted EBITDA from the Colocation Asset Purchase on August 1, 2013. Adjusting for the effect of the transaction as if it had occurred on July 1, 2013, the annualized revenue and Adjusted EBITDA growth rates for the three months ended December 31, 2013 are estimated to be 28% and 107%, respectively 2 In the three months ended June 30, 2013, the Company recorded a charge for lease termination costs totaling $10.2 million (see further discussion on “Other Notes” slide). The impact of the charge to Adjusted EBITDA for zColo is $194 thousand. Adjusting for the effect of this charge, the Pro-forma annualized Adjusted EBITDA growth rate for the three months ended June 30, 2013 was estimated to be -41%, and for the three months ended September 30, 2013 is estimated to be 58% FY 2Q 2014 Supplemental Earnings Information 2 2

($ in millions) December 31, March 31, June 30, September 30, December 31, 2012 2013 2013 2013 2013 Revenue $73.3 $76.6 $77.1 $78.9 $83.6 Annualized revenue growth 33% 18% 2% 9% 24% Pro-forma annualized revenue growth 1 12% -15% 12% Gross profit 70.6 74.6 75.1 76.5 81.4 Gross profit % 96% 97% 97% 97% 97% Operating income $7.7 $11.4 $5.1 $8.6 $7.8 Adjusted EBITDA $51.5 $54.3 $50.2 $54.3 $58.4 Purchases of property and equipment 15.2 28.6 17.6 23.2 21.5 Unlevered Free Cash Flow $36.3 $25.7 $32.6 $31.1 $36.9 Annualized Adjusted EBITDA growth 44% 22% -30% 33% 30% Pro-forma annualized Adjusted EBITDA growth 1 28% 6% 19% Adjusted EBITDA margin 70% 71% 65% 69% 70% Total Invested Capital $1,449.2 $1,427.5 $1,389.2 $1,346.3 $1,363.9 Annualized Adjusted EBITDA $206.0 $217.2 $200.7 $217.1 $233.6 Invested Capital Ratio 7.0 x 6.6 x 6.9 x 6.2 x 5.8 x Three months ended Zayo Dark Fiber Financial Data 52 Financial Data 1 The three months ended December 31, 2013 include $835 thousand of revenue and $458 thousand of Adjusted EBITDA from the acquisition of Access on October 1, 2013; and $1.5 million of revenue and $1 million of Adjusted EBITDA from the acquisition of FiberLink on October 2, 2013. Adjusting for the effect of the transactions as if they had occurred on July 1, 2013, the annualized revenue and Adjusted EBITDA growth rates for the three months ended December 31, 2013 are estimated to be 12% and 19%, respectively 2 In the three months ended June 30, 2013, the Company recorded a charge for lease termination costs totaling $10.2 million (see further discussion on “Other Notes” slide). The impact of the charge to Adjusted EBITDA for Zayo Dark Fiber is $3.6 million. Adjusting for the effect of this charge, Annualized Adjusted EBITDA growth would be -4% for June 30, 2013, and 4% for September 30, 2013 3 During the three months ended December 31, 2013, the Company settled its outstanding escrow claim with the sellers of 360 networks Holdings (USA), Inc. and recognized $3.8 million as a reduction in “Selling, general and administrative expenses” FY 2Q 2014 Supplemental Earnings Information 3 2 2

53 Historical Financial Data & Reconciliations FY 2Q 2014 Supplemental Earnings Information

($ in millions) September 30, December 31, March 31, June 30, September 30, December 31, 2012 2012 2013 2013 Total 2013 2013 Revenue $231.5 $245.3 $253.1 $258.2 $988.1 $264.3 $273.6 Annualized revenue growth 445% 24% 13% 8% 10% 14% Gross profit 198.8 210.4 218.0 224.3 851.5 229.5 238.6 Annualized gross profit growth 516% 23% 15% 12% 9% 16% Gross profit % 86% 86% 86% 87% 86% 87% 87% Operating income/(loss) $23.0 $20.4 $44.7 $22.7 $110.8 $31.5 $23.1 Earnings/(loss) from continuing operations ($67.4) ($34.2) ($18.5) ($24.4) ($144.6) ($27.9) ($36.3) Earnings from discontinued operations, net of income taxes $1.8 - - - $1.8 $0.0 $0.0 Net earnings/(loss) ($65.6) ($34.2) ($18.5) ($24.4) ($142.8) ($27.9) ($36.3) Adjusted EBITDA, from continuing operations $124.4 $139.1 $147.8 $141.7 $552.9 $155.4 $161.5 Purchases of property and equipment 66.7 58.9 95.7 101.9 323.2 86.7 88.3 Unlevered Free Cash Flow (Deficit) $57.8 $80.2 $52.1 $39.8 $229.7 $68.7 $73.2 Annualized EBITDA growth 466% 47% 25% -17% 39% 16% Adjusted EBITDA margin 54% 57% 58% 55% 59% 59% Fiscal Year 2013 Fiscal Year 2014 Consolidated Historical Financial Data 54 Consolidated Financial Data FY 2Q 2014 Supplemental Earnings Information
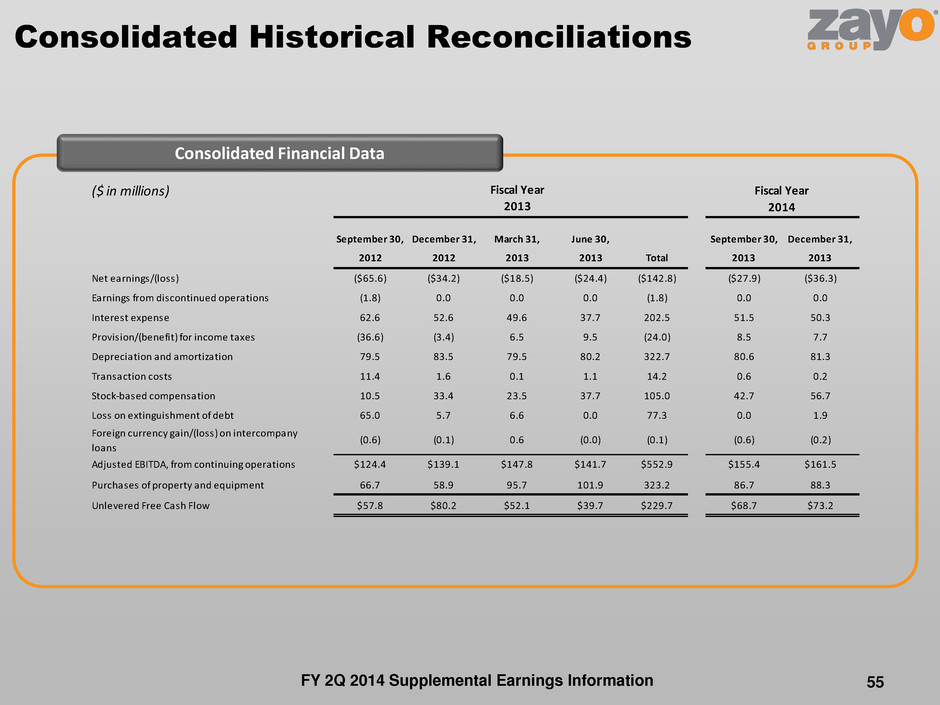
($ in millions) Fiscal Year 2013 September 30, December 31, March 31, June 30, September 30, December 31, 2012 2012 2013 2013 Total 2013 2013 Net earnings/(loss) ($65.6) ($34.2) ($18.5) ($24.4) ($142.8) ($27.9) ($36.3) Earnings from discontinued operations (1.8) 0.0 0.0 0.0 (1.8) 0.0 0.0 Interest expense 62.6 52.6 49.6 37.7 202.5 51.5 50.3 Provision/(benefit) for income taxes (36.6) (3.4) 6.5 9.5 (24.0) 8.5 7.7 Depreciation and amortization 79.5 83.5 79.5 80.2 322.7 80.6 81.3 Transaction costs 11.4 1.6 0.1 1.1 14.2 0.6 0.2 Stock-based compensation 10.5 33.4 23.5 37.7 105.0 42.7 56.7 Loss on extinguishment of debt 65.0 5.7 6.6 0.0 77.3 0.0 1.9 Foreign currency gain/(loss) on intercompany loans (0.6) (0.1) 0.6 (0.0) (0.1) (0.6) (0.2) Adjusted EBITDA, from continuing operations $124.4 $139.1 $147.8 $141.7 $552.9 $155.4 $161.5 Purchases of property and equipment 66.7 58.9 95.7 101.9 323.2 86.7 88.3 Unlevered Free Cash Flow $57.8 $80.2 $52.1 $39.7 $229.7 $68.7 $73.2 Fiscal Year 2014 Consolidated Historical Reconciliations 55 Consolidated Financial Data FY 2Q 2014 Supplemental Earnings Information
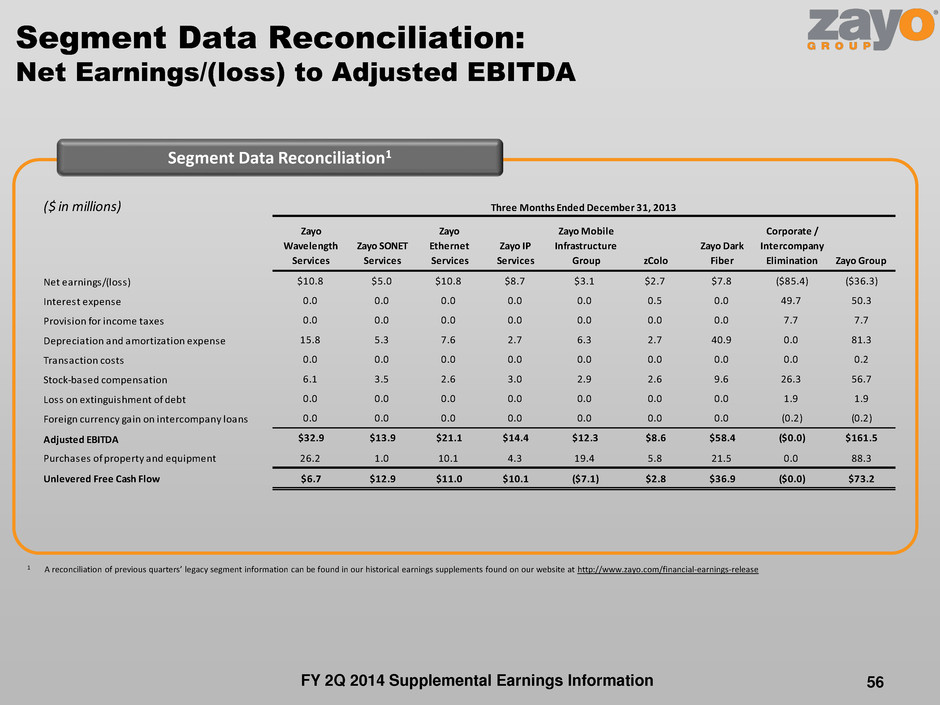
($ in millions) Zayo Wavelength Services Zayo SONET Services Zayo Ethernet Services Zayo IP Services Zayo Mobile Infrastructure Group zColo Zayo Dark Fiber Corporate / Intercompany Elimination Zayo Group Net earnings/(loss) $10.8 $5.0 $10.8 $8.7 $3.1 $2.7 $7.8 ($85.4) ($36.3) Interest expense 0.0 0.0 0.0 0.0 0.0 0.5 0.0 49.7 50.3 Provision for income taxes 0.0 0.0 0.0 0.0 0.0 0.0 0.0 7.7 7.7 Depreciation and amortization expense 15.8 5.3 7.6 2.7 6.3 2.7 40.9 0.0 81.3 Transaction costs 0.0 0.0 0.0 0.0 0.0 0.0 0.0 0.0 0.2 Stock-based compensation 6.1 3.5 2.6 3.0 2.9 2.6 9.6 26.3 56.7 Loss on extinguishment of debt 0.0 0.0 0.0 0.0 0.0 0.0 0.0 1.9 1.9 Foreign currency gain on intercompany loans 0.0 0.0 0.0 0.0 0.0 0.0 0.0 (0.2) (0.2) Adjusted EBITDA $32.9 $13.9 $21.1 $14.4 $12.3 $8.6 $58.4 ($0.0) $161.5 Purchases of property and equipment 26.2 1.0 10.1 4.3 19.4 5.8 21.5 0.0 88.3 Unlevered Free Cash Flow $6.7 $12.9 $11.0 $10.1 ($7.1) $2.8 $36.9 ($0.0) $73.2 Three Months Ended December 31, 2013 Segment Data Reconciliation: Net Earnings/(loss) to Adjusted EBITDA 56 Segment Data Reconciliation1 1 A reconciliation of previous quarters’ legacy segment information can be found in our historical earnings supplements found on our website at http://www.zayo.com/financial-earnings-release FY 2Q 2014 Supplemental Earnings Information
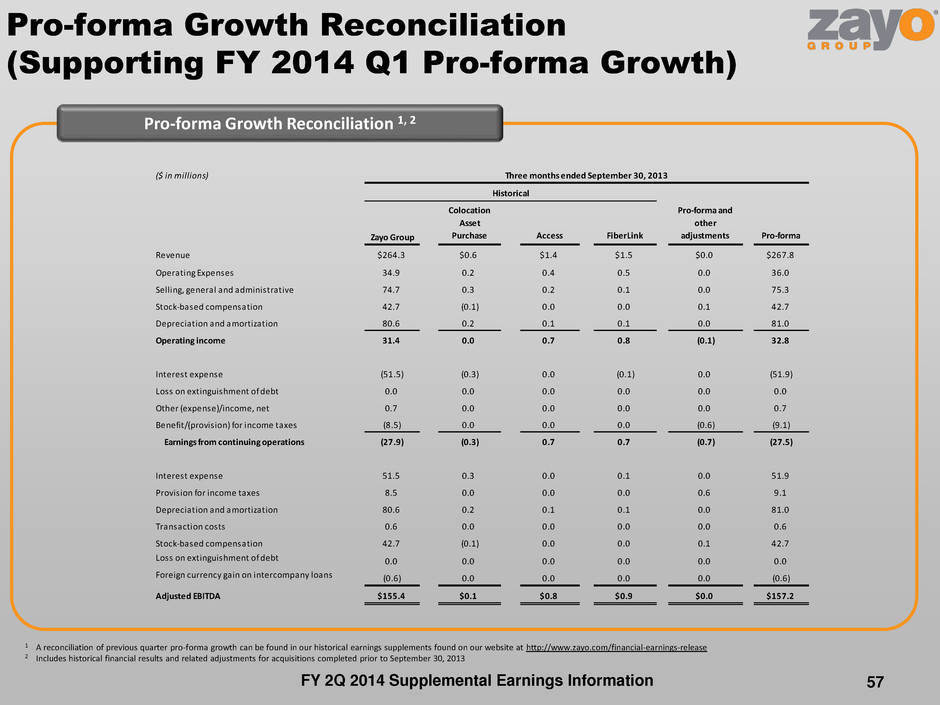
($ in millions) Zayo Group Colocation Asset Purchase Access FiberLink Pro-forma and other adjustments Pro-forma Revenue $264.3 $0.6 $1.4 $1.5 $0.0 $267.8 Operating Expenses 34.9 0.2 0.4 0.5 0.0 36.0 Selling, general and administrative 74.7 0.3 0.2 0.1 0.0 75.3 Stock-based compensation 42.7 (0.1) 0.0 0.0 0.1 42.7 Depreciation and amortization 80.6 0.2 0.1 0.1 0.0 81.0 Operating income 31.4 0.0 0.7 0.8 (0.1) 32.8 Interest expense (51.5) (0.3) 0.0 (0.1) 0.0 (51.9) Loss on extinguishment of debt 0.0 0.0 0.0 0.0 0.0 0.0 Other (expense)/income, net 0.7 0.0 0.0 0.0 0.0 0.7 Benefit/(provision) for income taxes (8.5) 0.0 0.0 0.0 (0.6) (9.1) Earnings from continuing operations (27.9) (0.3) 0.7 0.7 (0.7) (27.5) Interest expense 51.5 0.3 0.0 0.1 0.0 51.9 Provision for income taxes 8.5 0.0 0.0 0.0 0.6 9.1 Depreciation and amortization 80.6 0.2 0.1 0.1 0.0 81.0 Transaction costs 0.6 0.0 0.0 0.0 0.0 0.6 Stock-based compensation 42.7 (0.1) 0.0 0.0 0.1 42.7 Loss on extinguishment of debt 0.0 0.0 0.0 0.0 0.0 0.0 Foreign currency gain on intercompany loans (0.6) 0.0 0.0 0.0 0.0 (0.6) Adjusted EBITDA $155.4 $0.1 $0.8 $0.9 $0.0 $157.2 Three months ended September 30, 2013 Historical 57 Pro-forma Growth Reconciliation (Supporting FY 2014 Q1 Pro-forma Growth) Pro-forma Growth Reconciliation 1, 2 1 A reconciliation of previous quarter pro-forma growth can be found in our historical earnings supplements found on our website at http://www.zayo.com/financial-earnings-release 2 Includes historical financial results and related adjustments for acquisitions completed prior to September 30, 2013 FY 2Q 2014 Supplemental Earnings Information


