Exhibit 99.3

Q1 2016 % Change Y/Y Total Revenues $100.9 million +10% Sparkling Water Maker Units 575,000 +11% Flavor Units 5.3 million +7% CO 2 Refill Units 6.8 million +12% Net Income $6.1 million +1% EPS (1) $0.29 0% Net Income vs. 2015 Non - IFRS (2) $6.1 million - 27% Financial Highlights Q 1 2016 (1) Based on 21.2 million weighted shares outstanding in Q 1 2016 and 21.1 million weighted shares outstanding in Q 1 2015 (2) 2015 Non - IFRS is excluding restructuring

Quarterly Revenue 2010 - 2016 (in $ millions) Quarterly Revenue Change 39.1 50.0 54.5 64.9 58.5 69.1 75.7 85.7 87.9 103.0 112.5 132.9 117.6 132.4 144.6 168.1 118.2 141.2 125.9 126.5 91.3 101.7 110.0 112.9 100.9 - 20.0 40.0 60.0 80.0 100.0 120.0 140.0 160.0 180.0 Q1 Q2 Q3 Q4 2010 2011 2012 2013 2014 2015 2016
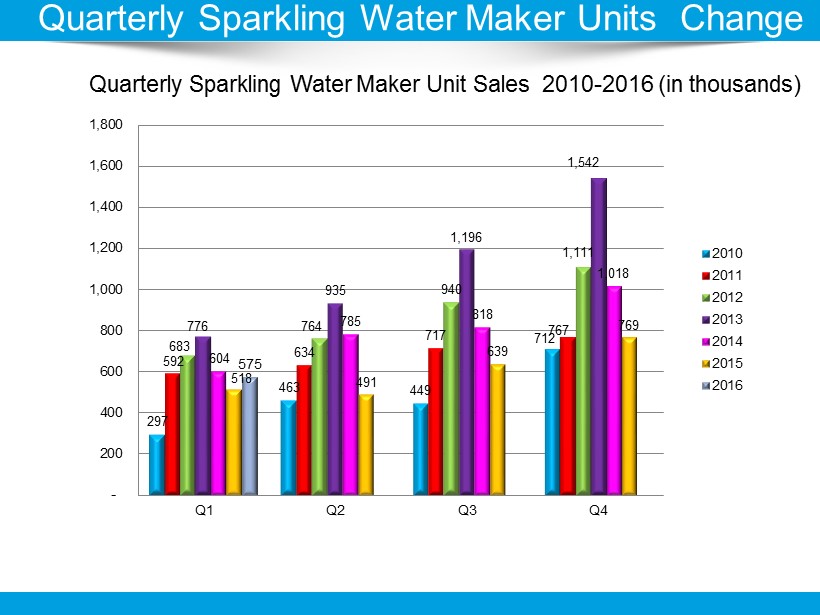
Quarterly Sparkling Water Maker Unit Sales 2010 - 2016 (in thousands ) Quarterly Sparkling Water Maker Units Change 297 463 449 712 592 634 717 767 683 764 940 1,111 776 935 1,196 1,542 604 785 818 1,018 518 491 639 769 575 - 200 400 600 800 1,000 1,200 1,400 1,600 1,800 Q1 Q2 Q3 Q4 2010 2011 2012 2013 2014 2015 2016
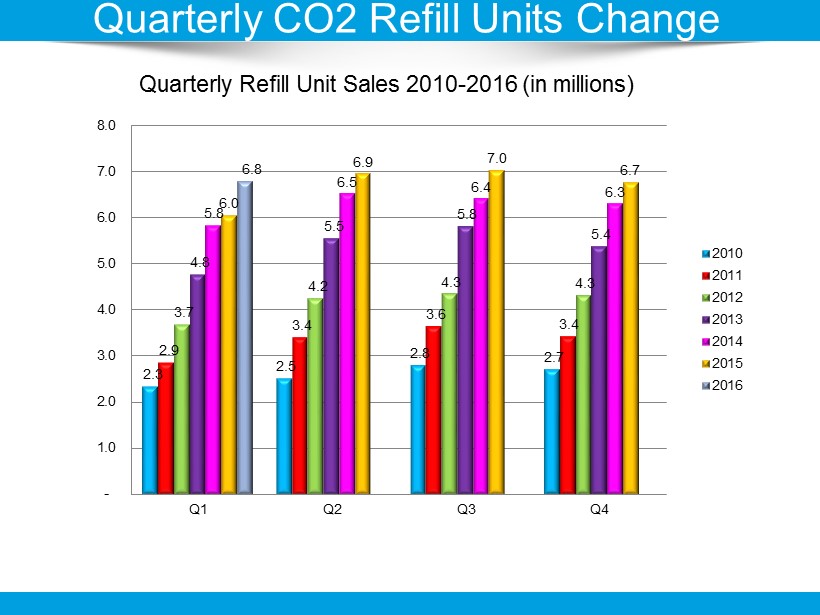
Quarterly Refill Unit Sales 2010 - 2016 (in millions) Quarterly CO 2 Refill Units Change 2.3 2.5 2.8 2.7 2.9 3.4 3.6 3.4 3.7 4.2 4.3 4.3 4.8 5.5 5.8 5.4 5.8 6.5 6.4 6.3 6.0 6.9 7.0 6.7 6.8 - 1.0 2.0 3.0 4.0 5.0 6.0 7.0 8.0 Q1 Q2 Q3 Q4 2010 2011 2012 2013 2014 2015 2016
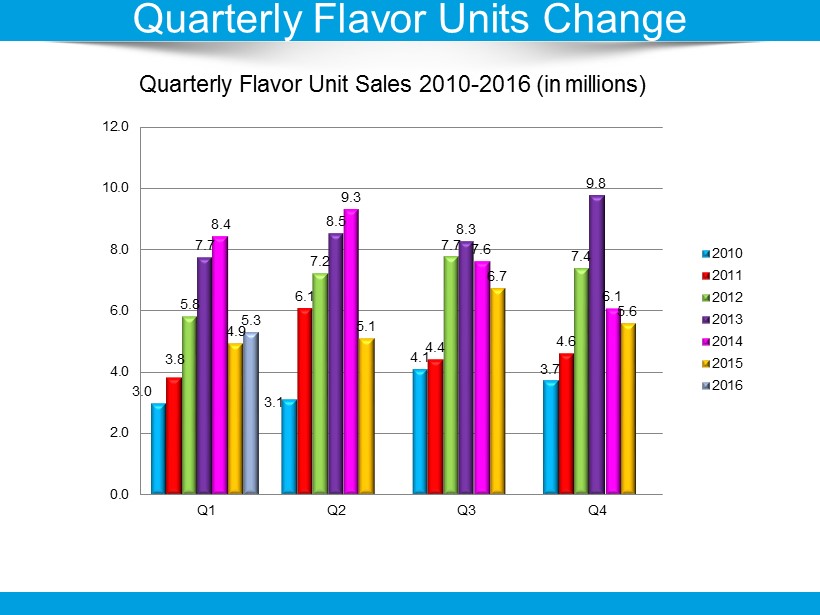
Quarterly Flavor Unit Sales 2010 - 2016 (in millions) Quarterly Flavor Units Change 3.0 3.1 4.1 3.7 3.8 6.1 4.4 4.6 5.8 7.2 7.7 7.4 7.7 8.5 8.3 9.8 8.4 9.3 7.6 6.1 4.9 5.1 6.7 5.6 5.3 0.0 2.0 4.0 6.0 8.0 10.0 12.0 Q1 Q2 Q3 Q4 2010 2011 2012 2013 2014 2015 2016

Consolidated Statements of Operations Q 1 - 2016 vs. Q 1 - 2015 2015 2016 Reported Reported (Unadjusted) Restructuring Adjusted (Unaudited ) (Unaudited ) (Unaudited ) (Unaudited) Revenue $90,344 $ $91,344 $100,873 Cost of revenue 44,893 (1,313) 43,580 49,701 Gross profit 45,451 2,313 47,764 51,172 Operating expenses Sales and marketing 32,461 32,461 32,671 General and administrative 11,641 11,641 10,581 Total operating expenses 44,102 0 44,102 43,252 Operating income 1,349 2,313 3,662 7,920 Interest expense (income), net 34 34 39 Other financial expense (income), net (5,702) (5,702) 871 Total financial expense (income), net (5,668) (5,668) 910 Income before income taxes 7,017 2,313 9,330 7,010 Income tax expense 970 970 917 Net income for the period $6,047 $2,313 $8,360 $6,093 Net income per share Basic $0.29 $0.40 $0.29 Diluted $0.29 $0.40 $0.29 $0.11 Weighted average number of shares Basic 21,017 21,017 21,100 Diluted 21,050 21,050 21,164