Exhibit 99.3
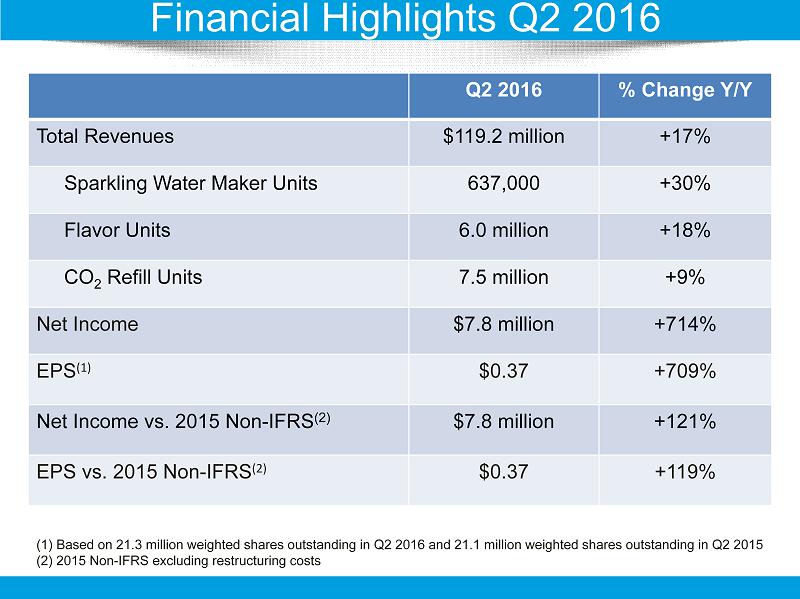
Q2 2016 % Change Y/Y Total Revenues $119.2 million +17% Sparkling Water Maker Units 637,000 +30% Flavor Units 6.0 million +18% CO 2 Refill Units 7.5 million +9% Net Income $7.8 million +714% EPS (1) $0.37 +709% Net Income vs. 2015 Non - IFRS (2) $7.8 million +121% EPS vs. 2015 Non - IFRS (2) $0.37 +119% Financial Highlights Q2 2016 (1) Based on 21.3 million weighted shares outstanding in Q2 2016 and 21.1 million weighted shares outstanding in Q2 2015 (2) 2015 Non - IFRS excluding restructuring costs
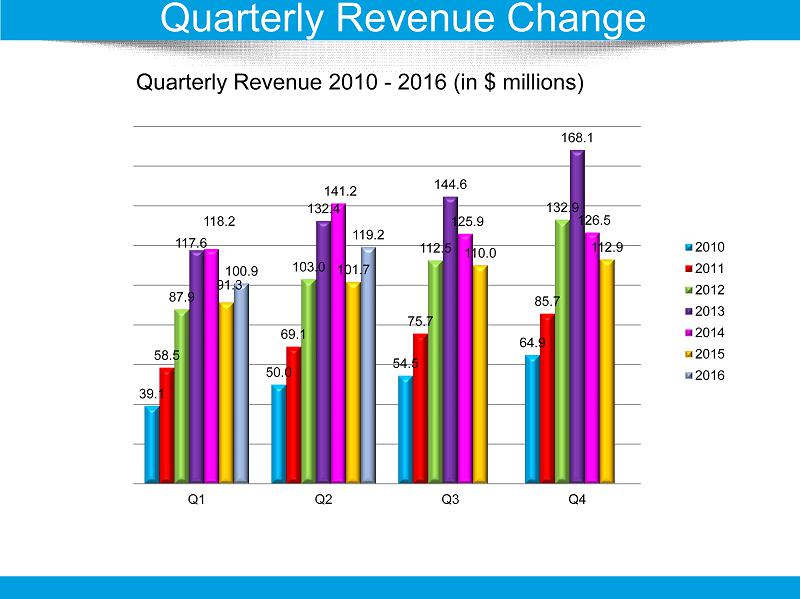
Quarterly Revenue 2010 - 2016 (in $ millions) Quarterly Revenue Change 39.1 50.0 54.5 64.9 58.5 69.1 75.7 85.7 87.9 103.0 112.5 132.9 117.6 132.4 144.6 168.1 118.2 141.2 125.9 126.5 91.3 101.7 110.0 112.9 100.9 119.2 Q1 Q2 Q3 Q4 2010 2011 2012 2013 2014 2015 2016
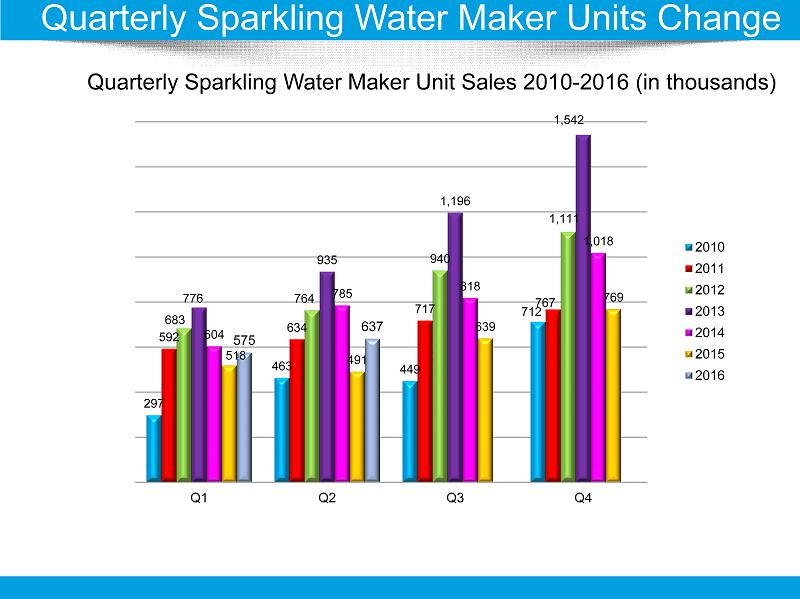
Quarterly Sparkling Water Maker Unit Sales 2010 - 2016 (in thousands ) Quarterly Sparkling Water Maker Units Change 297 463 449 712 592 634 717 767 683 764 940 1,111 776 935 1,196 1,542 604 785 818 1,018 518 491 639 769 575 637 Q1 Q2 Q3 Q4 2010 2011 2012 2013 2014 2015 2016
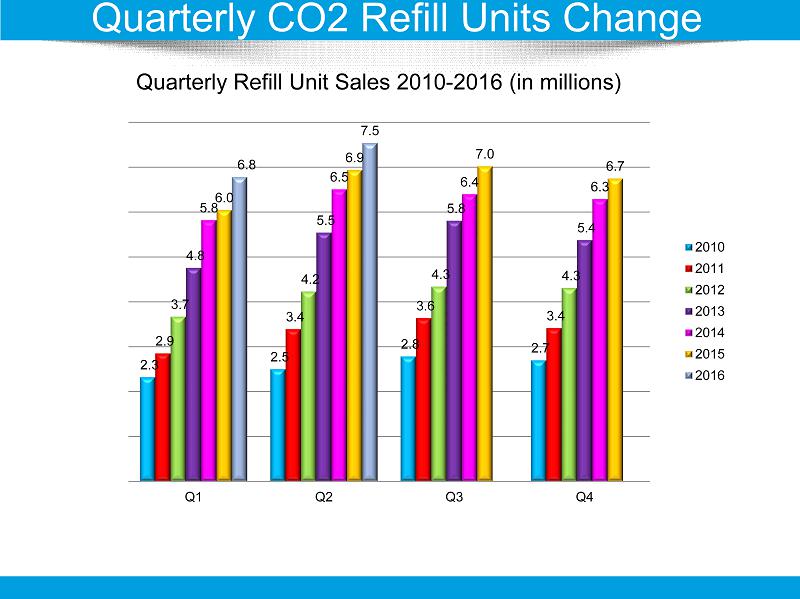
Quarterly Refill Unit Sales 2010 - 2016 (in millions) Quarterly CO 2 Refill Units Change 2.3 2.5 2.8 2.7 2.9 3.4 3.6 3.4 3.7 4.2 4.3 4.3 4.8 5.5 5.8 5.4 5.8 6.5 6.4 6.3 6.0 6.9 7.0 6.7 6.8 7.5 Q1 Q2 Q3 Q4 2010 2011 2012 2013 2014 2015 2016
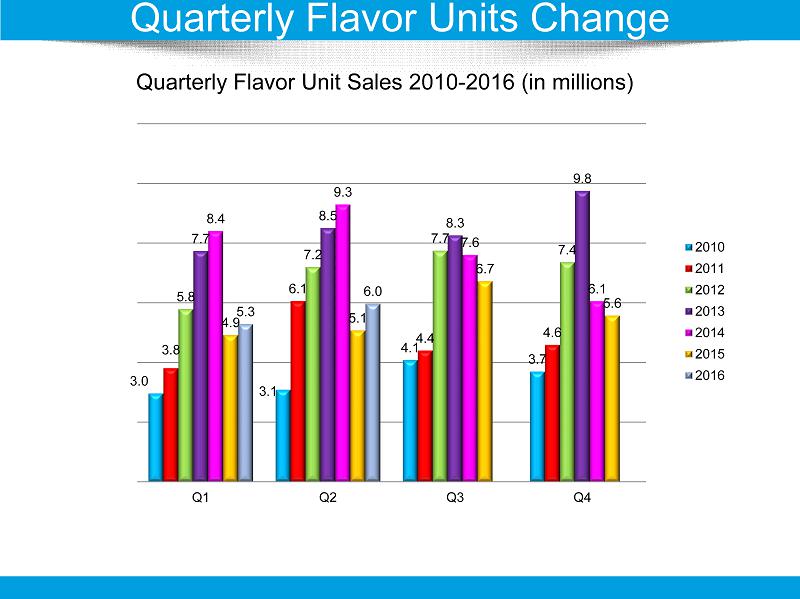
Quarterly Flavor Unit Sales 2010 - 2016 (in millions) Quarterly Flavor Units Change 3.0 3.1 4.1 3.7 3.8 6.1 4.4 4.6 5.8 7.2 7.7 7.4 7.7 8.5 8.3 9.8 8.4 9.3 7.6 6.1 4.9 5.1 6.7 5.6 5.3 6.0 Q1 Q2 Q3 Q4 2010 2011 2012 2013 2014 2015 2016
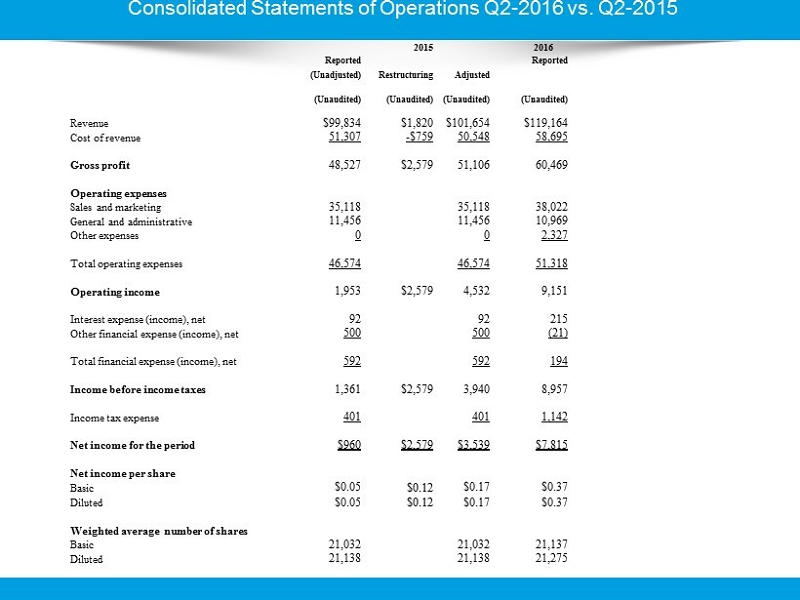
Consolidated Statements of Operations Q2 - 2016 vs. Q2 - 2015 2015 2016 Reported Reported (Unadjusted) Restructuring Adjusted (Unaudited ) (Unaudited) (Unaudited) ( Unaudited ) Revenue $99,834 $1,820 $101,654 $119,164 Cost of revenue 51,307 - $759 50,548 58,695 Gross profit 48,527 $2,579 51,106 60,469 Operating expenses Sales and marketing 35,118 35,118 38,022 General and administrative 11,456 11,456 10,969 Other expenses 0 0 2,327 Total operating expenses 46,574 46,574 51,318 Operating income 1,953 $2,579 4,532 9,151 Interest expense (income), net 92 92 215 Other financial expense (income), net 500 500 (21) Total financial expense (income), net 592 592 194 Income before income taxes 1,361 $2,579 3,940 8,957 Income tax expense 401 401 1,142 Net income for the period $960 $2,579 $3,539 $7,815 Net income per share Basic $0.05 $0.12 $0.17 $0.37 Diluted $0.05 $0.12 $0.17 $0.37 Weighted average number of shares Basic 21,032 21,032 21,137 Diluted 21,138 21,138 21,275
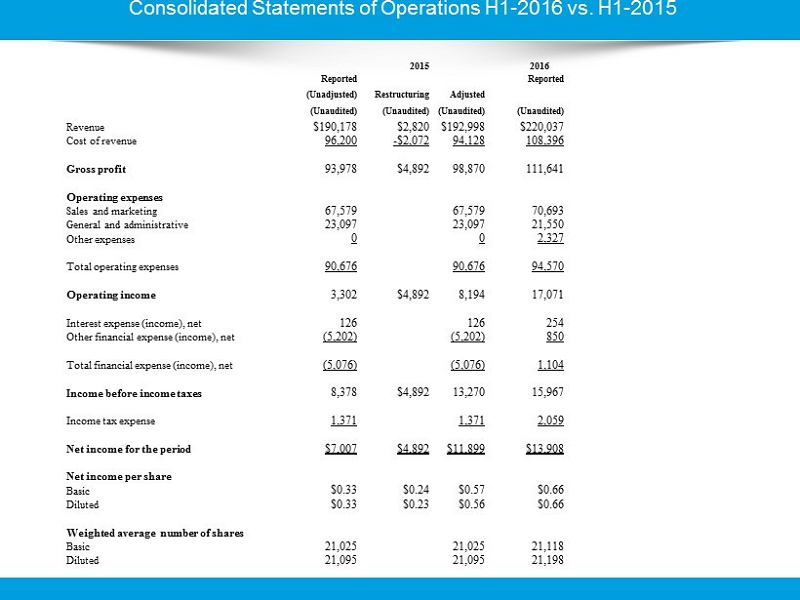
Consolidated Statements of Operations H 1 - 2016 vs. H1 - 2015 2015 2016 Reported Reported (Unadjusted) Restructuring Adjusted (Unaudited ) (Unaudited) (Unaudited) (Unaudited) Revenue $190,178 $2,820 $192,998 $220,037 Cost of revenue 96,200 - $2,072 94,128 108,396 Gross profit 93,978 $4,892 98,870 111,641 Operating expenses Sales and marketing 67,579 67,579 70,693 General and administrative 23,097 23,097 21,550 Other expenses 0 0 2,327 Total operating expenses 90,676 90,676 94,570 Operating income 3,302 $4,892 8,194 17,071 Interest expense (income), net 126 126 254 Other financial expense (income), net (5,202) (5,202) 850 Total financial expense (income), net (5,076) (5,076) 1,104 Income before income taxes 8,378 $4,892 13,270 15,967 Income tax expense 1,371 1,371 2,059 Net income for the period $7,007 $4,892 $11,899 $13,908 Net income per share Basic $0.33 $0.24 $0.57 $0.66 Diluted $0.33 $ 0.23 $0.56 $0.66 Weighted average number of shares Basic 21,025 21,025 21,118 Diluted 21,095 21,095 21,198