Exhibit 99.2
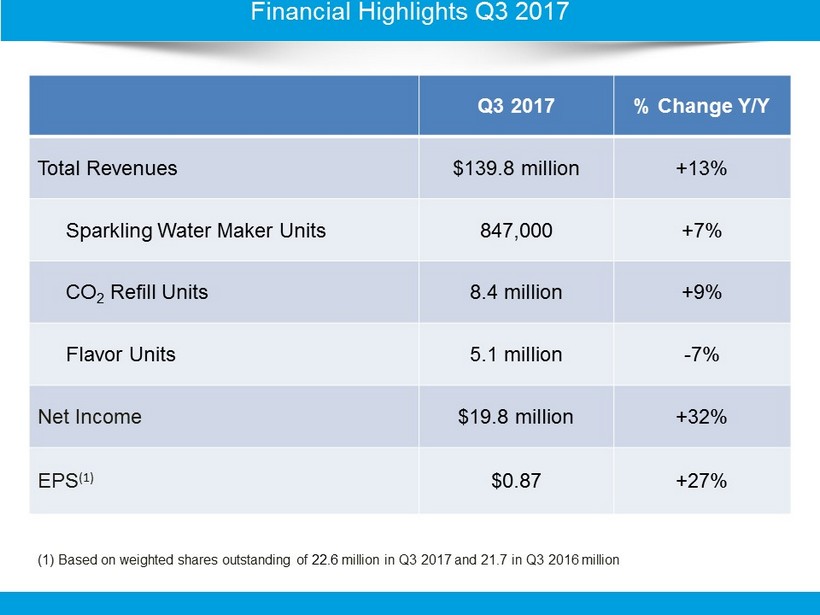
Q3 2017 % Change Y/Y Total Revenues $139.8 million +13% Sparkling Water Maker Units 847,000 +7% CO 2 Refill Units 8.4 million +9% Flavor Units 5.1 million - 7% Net Income $19.8 million +32% EPS (1) $0.87 +27% Financial Highlights Q3 2017 (1) Based on weighted shares outstanding of 22.6 million in Q3 2017 and 21.7 in Q3 2016 million
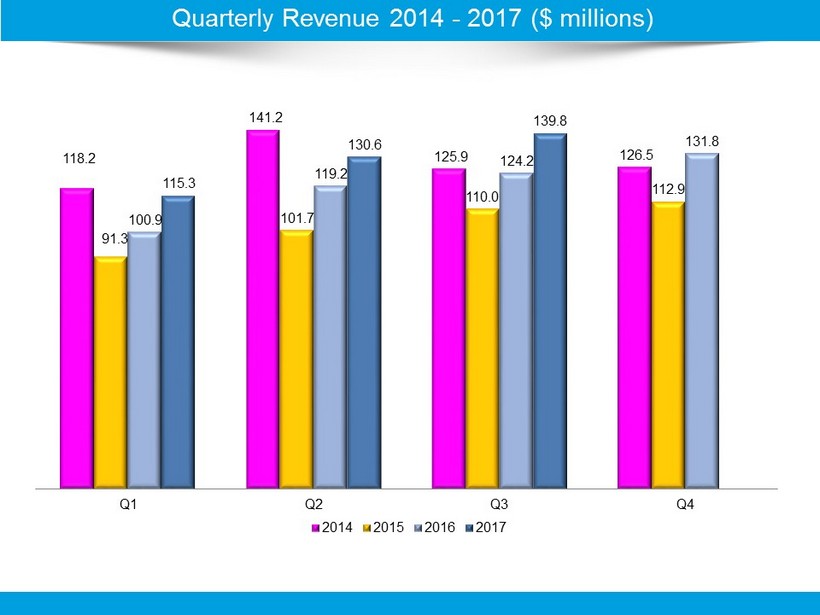
Quarterly Revenue 2014 - 2017 ($ millions) 118.2 141.2 125.9 126.5 91.3 101.7 110.0 112.9 100.9 119.2 124.2 131.8 115.3 130.6 139.8 Q1 Q2 Q3 Q4 2014 2015 2016 2017
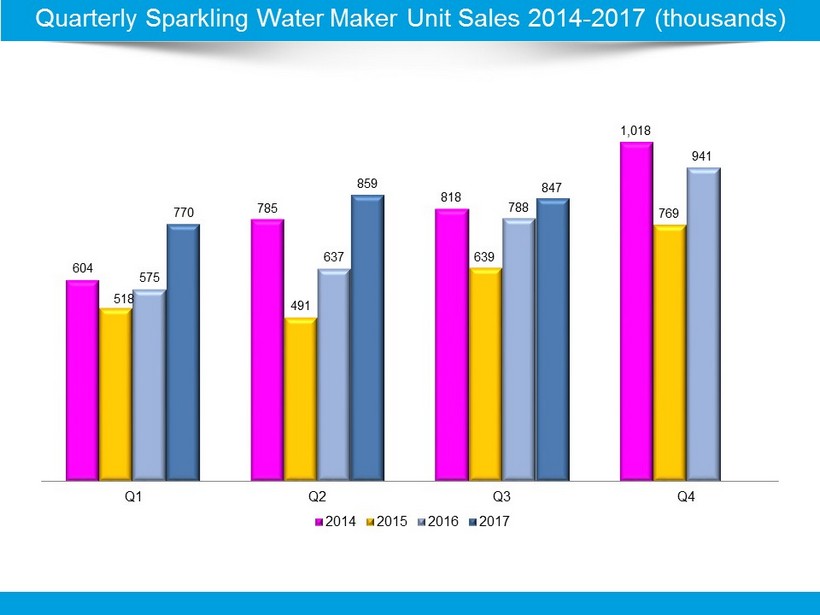
Quarterly Sparkling Water Maker Unit Sales 2014 - 2017 (thousands) 604 785 818 1,018 518 491 639 769 575 637 788 941 770 859 847 Q1 Q2 Q3 Q4 2014 2015 2016 2017
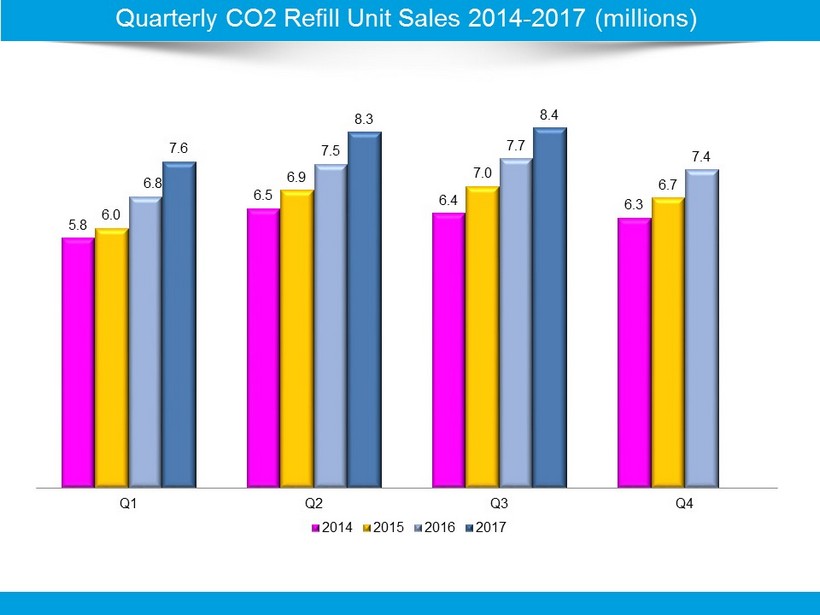
Quarterly CO 2 Refill Unit Sales 2014 - 2017 (millions ) 5.8 6.5 6.4 6.3 6.0 6.9 7.0 6.7 6.8 7.5 7.7 7.4 7.6 8.3 8.4 Q1 Q2 Q3 Q4 2014 2015 2016 2017

Quarterly Flavor Unit Sales 2014 - 2017 (millions ) 8.4 9.3 7.6 6.1 4.9 5.1 6.7 5.6 5.3 6.0 5.5 5.2 5.2 5.3 5.1 Q1 Q2 Q3 Q4 2014 2015 2016 2017
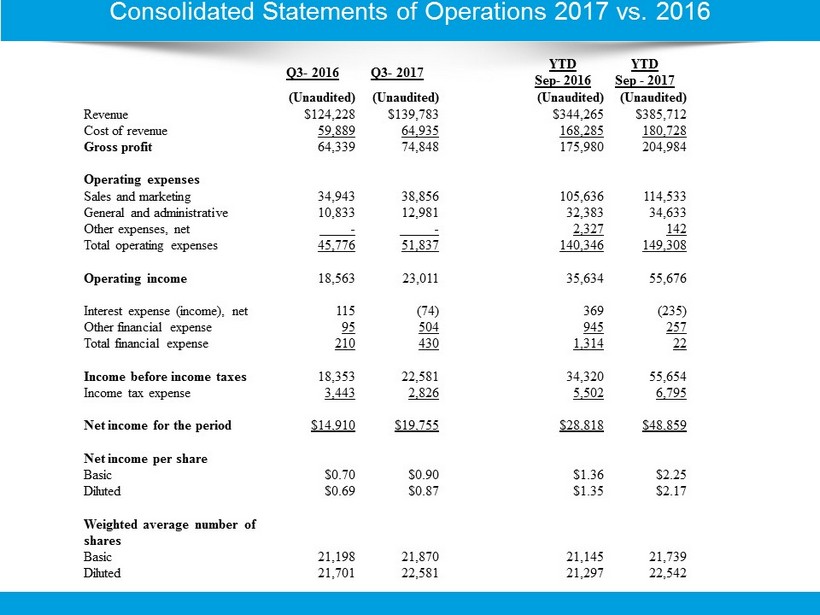
Consolidated Statements of Operations 2017 vs. 2016 Q3 - 2016 Q 3 - 2017 YTD Sep - 2016 YTD Sep - 2017 (Unaudited) (Unaudited) (Unaudited) (Unaudited) Revenue $124,228 $139,783 $344,265 $385,712 Cost of revenue 59,889 64,935 168,285 180,728 Gross profit 64,339 74,848 175,980 204,984 Operating expenses Sales and marketing 34,943 38,856 105,636 114,533 General and administrative 10,833 12,981 32,383 34,633 Other expenses, net - - 2,327 142 Total operating expenses 45,776 51,837 140,346 149,308 Operating income 18,563 23,011 35,634 55,676 Interest expense (income), net 115 (74) 369 (235) Other financial expense 95 504 945 257 Total financial expense 210 430 1,314 22 Income before income taxes 18,353 22,581 34,320 55,654 Income tax expense 3,443 2,826 5,502 6,795 Net income for the period $14,910 $19,755 $28,818 $48,859 Net income per share Basic $0.70 $0.90 $1.36 $2.25 Diluted $0.69 $0.87 $1.35 $2.17 Weighted average number of shares Basic 21,198 21,870 21,145 21,739 Diluted 21,701 22,581 21,297 22,542