Exhibit 99.2

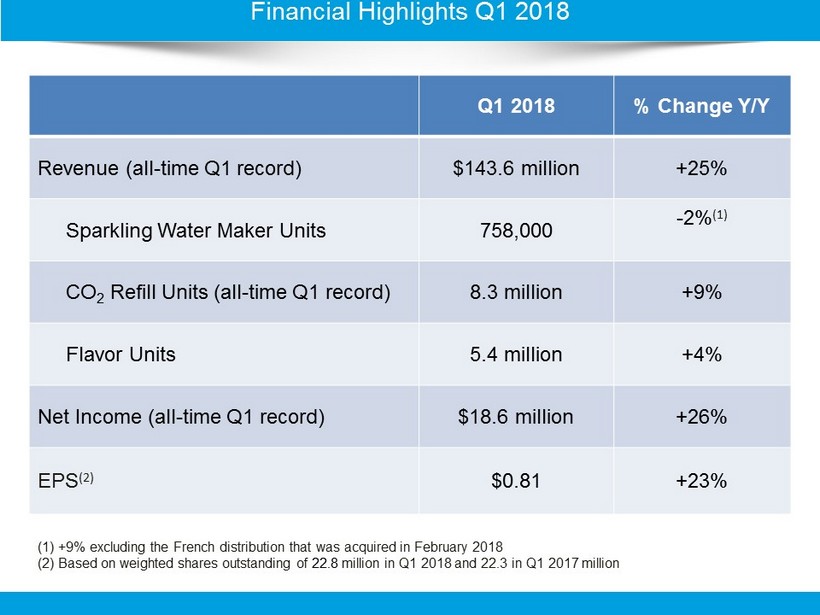
Q1 2018 % Change Y/Y Revenue (all - time Q1 record) $143.6 million +25% Sparkling Water Maker Units 758,000 - 2% (1) CO 2 Refill Units (all - time Q1 record) 8.3 million +9% Flavor Units 5.4 million +4% Net Income (all - time Q1 record) $18.6 million +26% EPS (2) $0.81 +23% Financial Highlights Q1 2018 (1) +9% excluding the French distribution that was acquired in February 2018 (2) Based on weighted shares outstanding of 22.8 million in Q1 2018 and 22.3 in Q1 2017 million

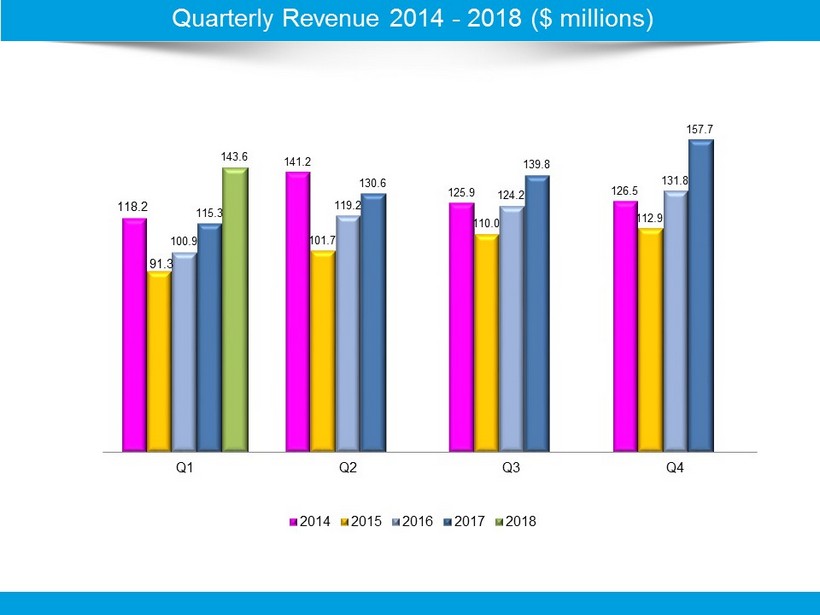
Quarterly Revenue 2014 - 2018 ($ millions) 118.2 141.2 125.9 126.5 91.3 101.7 110.0 112.9 100.9 119.2 124.2 131.8 115.3 130.6 139.8 157.7 143.6 Q1 Q2 Q3 Q4 2014 2015 2016 2017 2018

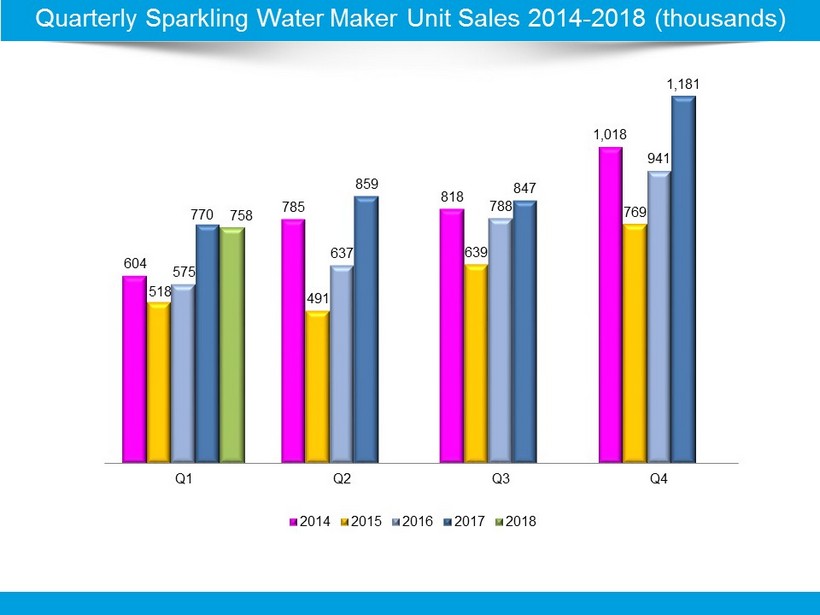
Quarterly Sparkling Water Maker Unit Sales 2014 - 2018 (thousands) 604 785 818 1,018 518 491 639 769 575 637 788 941 770 859 847 1,181 758 Q1 Q2 Q3 Q4 2014 2015 2016 2017 2018

Quarterly CO 2 Refill Unit Sales 2014 - 2018 (millions ) 5.8 6.5 6.4 6.3 6.0 6.9 7.0 6.7 6.8 7.5 7.7 7.4 7.6 8.3 8.4 8.2 8.3 Q1 Q2 Q3 Q4 2014 2015 2016 2017 2018

Quarterly Flavor Unit Sales 2014 - 2018 (millions ) 8.4 9.3 7.6 6.1 4.9 5.1 6.7 5.6 5.3 6.0 5.5 5.2 5.2 5.3 5.1 4.7 5.4 Q1 Q2 Q3 Q4 2014 2015 2016 2017 2018

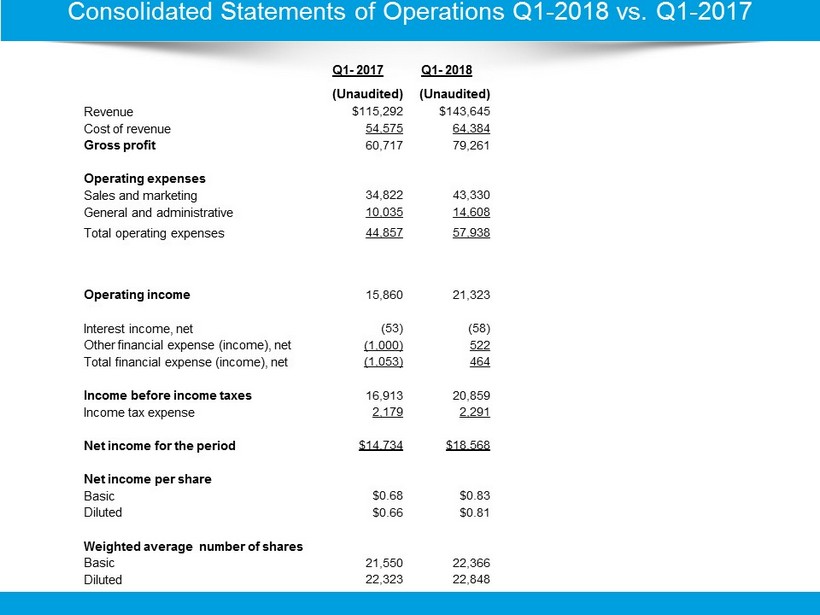
Consolidated Statements of Operations Q1 - 2018 vs. Q1 - 2017 Q 1 - 2017 Q 1 - 2018 (Unaudited) (Unaudited) Revenue $115,292 $143,645 Cost of revenue 54,575 64,384 Gross profit 60,717 79,261 Operating expenses Sales and marketing 34,822 43,330 General and administrative 10,035 14,608 Total operating expenses 44,857 57,938 Operating income 15,860 21,323 Interest income, net (53) (58) Other financial expense (income), net (1,000) 522 Total financial expense (income), net (1,053) 464 Income before income taxes 16,913 20,859 Income tax expense 2,179 2,291 Net income for the period $14,734 $18,568 Net income per share Basic $0.68 $0.83 Diluted $0.66 $0.81 Weighted average number of shares Basic 21,550 22,366 Diluted 22,323 22,848


