
Consolidated Financial Statements
As of and for the years ended December 31, 2018 and 2017
with Report of Independent Registered Public Accounting Firm

Independent Auditors’ Report
To the Board of Directors and Stockholders of
Ngen Technologies USA Corp. and Subsidiary
Dallas, Texas
Opinion on the Consolidated Financial Statements
We have audited the accompanying consolidated balance sheets of Ngen Technologies USA Corp. and subsidiary (the “Company”) as of December 31, 2018 and 2017, and the related consolidated statements of operations, stockholders’ equity, and cash flows for the years then ended. In our opinion, the consolidated financial statements referred to above present fairly, in all material respects, the consolidated financial position of the Company as of December 31, 2018 and 2017, and the results of its operations and its cash flows for the years then ended in conformity with accounting principles generally accepted in the United States of America.
Basis for Opinion
The Company’s management is responsible for these consolidated financial statements. Our responsibility is to express an opinion on these consolidated financial statements based on our audits. We are a public accounting firm registered with the Public Company Accounting Oversight Board (United States) (PCAOB) and are required to be independent with respect to the Company in accordance with the U.S. federal securities laws and the applicable rules and regulations of the Securities and Exchange Commission and the PCAOB.
We conducted our audit in accordance with the standards of the PCAOB. Those standards require that we plan and perform the audit to obtain reasonable assurance about whether the consolidated financial statements are free of material misstatement, whether due error or fraud. The Company is not required to have, nor were we engaged to perform, an audit of its internal control over financial reporting. As part of our audit, we are required to obtain an understanding of internal control over financial reporting as a basis for designing audit procedures that are appropriate in the circumstances, but not for the purpose of expressing an opinion on the effectiveness of the Company’s internal control over financial reporting. Accordingly, we express no such opinion.
Our audit included performing procedures to assess the risks of material misstatement of the consolidated financial statements, whether due to error or fraud, and performing procedures that respond to those risks. Such procedures included examining, on a test basis, evidence regarding the amounts and disclosures in the consolidated financial statements. Our audit also included evaluating the accounting principles used and significant estimates made by management, as well as evaluating the overall presentation of the consolidated financial statements. We believe that our audits provide a reasonable basis for our opinion.

We have served as the Company’s auditor since 2019
Anaheim, CA
September 9, 2019

| December 31, | | 2018 | | | 2017 | |
| | | | | | | |
| ASSETS | | | | | | | | |
| | | | | | | | | |
| Current assets: | | | | | | | | |
| Cash and cash equivalents | | $ | 3,721,784 | | | $ | 1,020,383 | |
| Accounts receivables | | | 1,057,693 | | | | 1,328,291 | |
| Inventories | | | 1,739,722 | | | | 1,192,316 | |
| Total current assets | | | 6,519,199 | | | | 3,540,990 | |
| | | | | | | | | |
| Non-current assets: | | | | | | | | |
| Property and equipment | | | 5,020,003 | | | | 5,238,985 | |
| Investment | | | 114,309 | | | | 313,871 | |
| Other assets | | | 107,352 | | | | 25,388 | |
| Total non-current assets | | | 5,241,664 | | | | 5,578,244 | |
| | | | | | | | | |
| Total Assets | | $ | 11,760,863 | | | $ | 9,119,234 | |
| | | | | | | | | |
| LIABILITIES AND STOCKHOLDERS’ EQUITY | | | | | | | | |
| | | | | | | | | |
| Current liabilities: | | | | | | | | |
| Accounts payable | | $ | 1,933,036 | | | $ | 826,760 | |
| Borrowings from shareholder | | | 10,207,353 | | | | 10,390,740 | |
| | | | | | | | | |
| Total current liabilities | | | 12,140,389 | | | | 11,217,500 | |
| | | | | | | | | |
| Total liabilities | | | 12,140,389 | | | | 11,217,500 | |
| | | | | | | | | |
| Commitments and contingencies | | | | | | | | |
| | | | | | | | | |
| Stockholders’ Equity (Deficit) | | | | | | | | |
| Common stock, no par value, 10,000,000 shares authorized, issued and outstanding | | | - | | | | - | |
| Additional paid-in-capital | | | 29,819 | | | | 29,819 | |
| Other comprehensive income (loss) | | | (55,067 | ) | | | (104,850 | ) |
| Accumulated retained earnings (deficit) | | | (354,278 | ) | | | (2,023,235 | ) |
| Total stockholders’ equity (deficit) | | | (379,526 | ) | | | (2,098,266 | ) |
| | | | | | | | | |
| Total Liabilities and Stockholders’ Equity | | $ | 11,760,863 | | | $ | 9,119,234 | |
See accompanying notes to consolidated financial statements.

| Years ended December 31 | | 2018 | | | 2017 | |
| | | | | | | |
| Net sales | | $ | 20,072,236 | | | $ | 5,080,391 | |
| | | | | | | | | |
| Cost of sales | | | 16,059,168 | | | | 4,915,608 | |
| | | | | | | | | |
| Gross profit | | | 4,013,068 | | | | 164,783 | |
| | | | | | | | | |
| Operating expenses: | | | | | | | | |
| Research and development | | | 682,472 | | | | 1,523,954 | |
| General and administrative | | | 1,478,774 | | | | 267,810 | |
| Total operating expense | | | 2,161,246 | | | | 1,791,764 | |
| | | | | | | | | |
| Income (loss) from operations | | | 1,851,822 | | | | (1,626,981 | ) |
| | | | | | | | | |
| Other income (expense): | | | | | | | | |
| Interest income | | | 21,057 | | | | 4,666 | |
| Interest expense | | | (29,238 | ) | | | (6,478 | ) |
| Miscellaneous income (expense), net | | | 58,476 | | | | 12,956 | |
| Total other income (expense), net | | | 50,295 | | | | 11,144 | |
| | | | | | | | | |
| Income (loss) before loss from equity investment and income tax provision | | | 1,902,117 | | | | (1,615,837 | ) |
| | | | | | | | | |
| Income (loss) from equity investment | | | (199,562 | ) | | | (186,129 | ) |
| | | | | | | | | |
| Net income (loss) before provision for income taxes | | | 1,702,555 | | | | (1,801,966 | ) |
| | | | | | | | | |
| Provision for income taxes | | | 33,598 | | | | 7,444 | |
| | | | | | | | | |
| Net income (loss) | | $ | 1,668,957 | | | $ | (1,809,410 | ) |
| | | | | | | | | |
| Comprehensive income statement: | | | | | | | | |
| Net income (loss) | | $ | 1,668,957 | | | $ | (1,809,410 | ) |
| Foreign currency translation income (loss) | | | 49,783 | | | | (105,863 | ) |
| | | | | | | | | |
| Total comprehensive income (loss) | | $ | 1,718,740 | | | $ | (1,915,273 | ) |
| | | | | | | | | |
| Earnings (loss) per share - Basic and diluted | | $ | 0.17 | | | $ | (0.18 | ) |
| | | | | | | | | |
| Weighted average number of common shares outstanding: | | | | | | | | |
| Basic | | | 10,000,000 | | | | 10,000,000 | |
| Diluted | | | 10,000,000 | | | | 10,000,000 | |
See accompanying notes to consolidated financial statements.

| | | No par value | | | Additional | | | Other | | | | | | Total | |
| | | Common Stock | | | Paid-in | | | Comprehensive | | | Retained | | | Stockholder’ | |
| | | Shares | | | Amount | | | Capital | | | Income | | | Earnings | | | Equity | |
| | | | | | | | | | | | | | | | | | | |
| Balance at December 31, 2016 | | | 10,000.000 | | | $ | - | | | $ | 14,418 | | | $ | 1,013 | | | $ | (213,825 | ) | | $ | (198,394 | ) |
| | | | | | | | | | | | | | | | | | | | | | | | | |
| Shareholder contribution | | | - | | | | - | | | | 15,401 | | | | - | | | | - | | | | 15,401 | |
| | | | | | | | | | | | | | | | | | | | | | | | | |
| Foreign currency translation | | | - | | | | - | | | | - | | | | (105,863 | ) | | | - | | | | (105,863 | ) |
| | | | | | | | | | | | | | | | | | | | | | | | | |
| Net loss | | | - | | | | - | | | | - | | | | - | | | | (1,809,410 | ) | | | (1,809,410 | ) |
| | | | | | | | | | | | | | | | | | | | | | | | | |
| Balance at December 31,2017 | | | 10,000,000 | | | | - | | | | 29,819 | | | | (104,850 | ) | | | (2,023,235 | ) | | | (2,098,266 | ) |
| | | | | | | | | | | | | | | | | | | | | | | | | |
| Foreign currency translation | | | - | | | | - | | | | - | | | | 49,783 | | | | - | | | | 49,783 | |
| | | | | | | | | | | | | | | | | | | | | | | | | |
| Net income | | | - | | | | - | | | | - | | | | - | | | | 1,668,957 | | | | 1,668,957 | |
| | | | | | | | | | | | | | | | | | | | | | | | | |
| Balance - December 31, 2018 | | | 10,000,000 | | | $ | - | | | $ | 29,819 | | | $ | (55,067 | ) | | $ | (354,278 | ) | | $ | (379,526 | ) |
See accompanying notes to consolidated financial statements.

| Years ended December 31 | | 2018 | | | 2017 | |
| | | | | | | |
| Cash flows from operating activities: | | | | | | | | |
| Net income (loss) | | $ | 1,668,957 | | | $ | (1,809,410 | ) |
| Adjustments to reconcile net income (loss) to net cash provided by operating activities: | | | | | | | | |
| Depreciation expense - property and equipment | | | 13,890 | | | | 13,524 | |
| Loss on equity investment | | | 199,562 | | | | 186,129 | |
| Changes in assets and liabilities: | | | | | | | | |
| Accounts receivable | | | 219,041 | | | | (585,410 | ) |
| Inventories | | | (603,431 | ) | | | (122,353 | ) |
| Other assets | | | (83,000 | ) | | | - | |
| Accounts payable | | | 1,154,086 | | | | 302,858 | |
| Net cash provided by (used in) operating activities | | | 2,569,105 | | | | (2,014,662 | ) |
| | | | | | | | | |
| Cash flows from investing activities: | | | | | | | | |
| Purchases of property and equipment | | | (8,717 | ) | | | - | |
| Net cash used in investing activities | | | (8,717 | ) | | | - | |
| | | | | | | | | |
| Cash flows from financing activities: | | | | | | | | |
| Borrowings from shareholder | | | 216,301 | | | | - | |
| Shareholder contribution | | | - | | | | 15,401 | |
| Net cash provided by investing activities | | | 216,301 | | | | 15,401 | |
| | | | | | | | | |
| Net increase (decrease) in cash and cash equivalents | | | 2,776,689 | | | | (1,999,261 | ) |
| | | | | | | | | |
| Foreign currency translation | | | (75,288 | ) | | | 239,175 | |
| | | | | | | | | |
| Cash and cash equivalents - beginning of year | | | 1,020,383 | | | | 2,780,469 | |
| | | | | | | | | |
| Cash and cash equivalents - end of year | | $ | 3,721,784 | | | $ | 1,020,383 | |
| | | | | | | | | |
| Supplemental disclosures of cash flow information | | | | | | | | |
| Cash paid during the year for: | | | | | | | | |
| Interest | | $ | 29,238 | | | $ | 6,478 | |
| Income taxes | | $ | 33,598 | | | $ | 7,444 | |
See accompanying notes to consolidated financial statements.

| 1. | PRESENTATION AND NATURE OF OPERATIONS |
Ngen Technologies USA Corp. (“Ngen USA”) was formed on January 19, 2015 and on January 27, 2015, Ngen USA amended its name change to Ngen Technologies USA Corp.
Ngen USA’s mission focuses to be the leader in glasses free 3D display technologies and become the first to manufacture, distribute and market commercial and consumer driven glasses free 3D display technologies. Ngen USA has invested significant resources and currently in preparation to introduce the following product to the market: Glasses Free 3D Mobile Display. Through its holdings in Joint Ventures with Egismos Technologies Taiwan, Ngen USA is also seeking to introduce innovative biomedical products including tumor detection scanner using laser and MEMS system.
Through its wholly owned subsidiary Ngen Technologies Korea Ltd (“Ngen Korea”), the Ngen Korea currently designs, manufactures and sell 3D enabled mobile communication (Smartphones) and electronic devices (PDAs) under OEM/ODM structure. Ngen Korea’s strategy is to manufacture and sell under major global handset manufacturers. Ngen Korea’s proprietary IP and products such as 3D film and algorithm will be closely guarded and protected through multi-layer encryption and controls.
Ngen Korea was formed on July 3, 2015 as a wholly owned subsidiary of Ngen USA. Ngen Korea’s mission focuses to be the leader in glasses free 3D display technologies and become the first to manufacture, distribute and market commercial and consumer driven glasses free 3D display technologies. Ngen Korea has invested significant resources and currently in preparation to introduce the following product to the market: Glasses Free 3D Mobile Display.
Ngen Korea plans to design, manufacture and sell 3D enabled mobile communication (Smartphones) and electronic devices (PDAs) under OEM/ODM structure. Ngen Korea plans to manufacture and sell under major handset manufacturers such as Samsung models and ZTE line up of Smartphones. Through the Company’s facilities, Ngen Korea continues to develop new and innovative applications of Ngen Korea’s glasses free 3D technologies for mobile phones, PDAs and electronic advertising devices with an expanding commercial market appeal. Ngen Korea’s proprietary IP and products such as 3D film and algorithm will be closely guarded and protected through multi-layer encryption and controls.
Ngen USA and Ngen Korea are referred as the “Company”.
| 2. | SUMMARY OF SIGNIFICANT ACCOUNTING POLICIES |
This summary of significant accounting policies of the Company is presented to assist in understanding the Company’s consolidated financial statements. The consolidated financial statements and notes are representation of the Company’s management who are responsible for the integrity and objectivity of the consolidated financial statements. These accounting policies confirm to accounting principles generally accepted in the United State of America and have been consistently applied in the preparation of the consolidated financial statements.
Basis of Presentation
The consolidated financial statements include the accounts of Ngen USA and its wholly owned subsidiary, Ngen Korea. All intercompany accounts, transactions, and profits have been eliminated upon consolidation. The accompanying consolidated financial statements and the notes hereto are reported in US Dollars.
| 2. | SUMMARY OF SIGNIFICANT ACCOUNTING POLICIES (continued) |
Use of Estimates
The preparation of consolidated financial statements in conformity with GAAP requires management to make estimates and assumptions that affect the reported amounts of assets and liabilities and disclosure of contingent assets and liabilities at the date of the consolidated financial statements and the reported amounts of revenue and expenses during the reporting period. Significant estimates include, but are not limited to, the estimated useful lives of property and equipment, patent and trademark, the ultimate collection of accounts receivable and accrued expenses. Actual results could materially differ from those estimates.
Foreign Currency Transaction and Translation
Ngen Korea financial position and results of operations are determined using the local currency, Korean Won (“KRW”), as the functional currency. As a result, assets and liabilities denominated in foreign currencies at the balance sheet date are translated at the exchange rates prevailing at the balance sheet date. The results of operations are translated from KWR to US Dollar at the weighted average rate of exchange during the reporting period. The registered equity capital denominated in the functional currency is translated at the historical rate of exchange at the time of capital contribution. All translation adjustments resulting from the translation of the financial statements into the reporting currency, US Dollar, are dealt with as a component of accumulated other comprehensive income.
As of December 31, 2018 and 2017, the exchange rate was KRW 1,112.85 and KRW 1,067.42 per US Dollar, respectively. The average exchange rate for the years ended December 31, 2018 and 2017 was KRW 1,099.29 and KRW 1,129.04, respectively.
Revenue Recognition
The Company recognizes revenue when persuasive evidence of an arrangement exists, the price is fixed or determinable, and collectability is reasonably assured, and delivery has occurred, or services have been rendered. The Company offers N/30 and N/45 days terms with all of its customers. The Company also offers 2% discount for N/10 days payment terms. The Company does not provide for return unless the products are damaged. The Company did not have any material returns historically.
The Company includes shipping and handling costs in cost of sales. Amounts billed for shipping and handling are included with revenues in the statement of operation.
The Company recognizes an allowance for estimated future sales returns in the period revenue is recorded, based on pending returns and historical return data, among other factors. Management did not believe any allowance for sales returns was required at December 31, 2018 and 2017.
Advertising Expense
Advertising costs are expensed as incurred. Advertising expense amounted to $103,496 and $18,528 for the years ended December 31, 2018 and 2017, respectively.
| 2. | SUMMARY OF SIGNIFICANT ACCOUNTING POLICIES (continued) |
Research and Development
Research and development costs related to both future and present products are expensed as incurred. During the years ended December 31, 2018 and 2017 research and development expenditure totaled $682,472 and $1,523,954, respectively.
Cash and Cash Equivalents
The Company considers all deposits with financial institutions and all highly liquid investments with original maturities of three months or less to be cash equivalents. There were no cash equivalents at December 31, 2018 and 2017.
Accounts Receivable
Accounts receivable are carried at original invoice amount less the allowance for doubtful accounts based on a review of all outstanding amounts at year end. Management determines the allowance for doubtful accounts based on a combination of write-off history, aging analysis, and any specific known troubled accounts. Trade receivables are written off when deemed uncollectible.
Bad debt expense was $40,144 and $7,187 for the years ended December 31, 2018 and 2017, respectively. Management considers accounts receivable at December 31, 2018 and 2017 to be fully collectable and no allowance for doubtful accounts has been recorded.
Inventories
Inventories primarily consist of finished goods and are stated at actual cost which is same as the lower of cost (first-in-first-out) or market. The Company maintains an allowance for potentially excess and obsolete inventories and inventories that are carried at costs that are higher than their estimated net realizable values.
Investments
Ngen USA provided an investment to a privately held company, Emotek in April 11, 2017 and received 2,500,000 shares which represented 50% equity of Emotek on a fully none dilutive basis. Emotek is a joint venture between Ngen USA and Egismos Technologies. Egismos Technologies’ mission is primarily to develop tumor detection scanner which will be handheld and used for home use. The Company applies the equity method for investments in affiliate, which a privately-held company where quoted market prices are not available, in which it has the ability to exercise significant influence over operating and financial policies of the affiliate. Significant influence is generally defined as 20% to 50% ownership in the voting stock of an investee. Under the equity method, the Company initially records the investment at cost and then adjusts the carrying value of the investment to recognize the proportional share of the equity-accounted affiliate’s net income (loss) including changes in capital of the affiliate.
Property and Equipment
Property and equipment consist of leasehold improvements, furniture and fixtures, machinery and equipment are stated at cost. Property and equipment are recorded at cost. Depreciation of property and equipment is provided using the straight-line method over the estimated useful lives of the assets, generally 5-7 years. Leasehold improvements are depreciated over the shorter of the useful life of the improvement or the lease term, including renewal periods that are reasonably assured.
| 2. | SUMMARY OF SIGNIFICANT ACCOUNTING POLICIES (continued) |
Impairment of Long-lived Assets
In accordance with ASC 360, “Property, Plant, and Equipment,” the Company reviews for impairment of long-lived assets and certain identifiable intangibles whenever events or circumstances indicate that the carrying amount of assets may not be recoverable. The Company considers the carrying value of assets may not be recoverable based upon our review of the following events or changes in circumstances: the asset’s ability to continue to generate income from operations and positive cash flow in future periods; loss of legal ownership or title to the assets; significant changes in our strategic business objectives and utilization of the asset; or significant negative industry or economic trends. An impairment loss would be recognized when estimated future cash flows expected to result from the use of the asset are less than its carrying amount.
As of December 31, 2018 and 2017, the Company was not aware of any events or changes in circumstances that would indicate that the long-lived assets are impaired.
Fair Value of Financial Instruments
The Company records its financial assets and liabilities at fair value, which is defined under the applicable accounting standards as the exchange price that would be received for an asset or paid to transfer a liability (an exit price) in the principal or most advantageous market for the asset or liability in an orderly transaction between market participants on the measure date. The Company uses valuation techniques to measure fair value, maximizing the use of observable outputs and minimizing the use of unobservable inputs.
Fair Value of Financial Instruments (continued)
The standard describes a fair value hierarchy based on three levels of inputs, of which the first two are considered observable and the last unobservable, that may be used to measure fair value which are the following:
Level 1 – Quoted prices in active markets for identical assets or liabilities.
Level 2 – Inputs other than Level 1 that are observable, either directly or indirectly, such as quoted prices for similar assets or liabilities; quoted prices in markets that are not active; or other inputs that are observable or can be corroborated by observable market data for substantially the full term of the assets or liabilities.
Level 3 – Inputs include management’s best estimate of what market participants would use in pricing the asset or liability at the measurement date. The inputs are unobservable in the market and significant to the instrument’s valuation.
As of December 31, 2018 and 2017, the Company believes that the carrying value of cash, account receivables, accounts payable, accrued expenses, and other current assets and liabilities approximate fair value due to the short maturity of theses financial instruments. The consolidated financial statements do not include any financial instruments at fair value on a recurring or non-recurring basis.
The Company also has financial instruments classified within the fair value hierarchy, which consists of the following:
| | ● | Investments in privately-held companies, where quoted market prices are not available, accounted for as available-for-sale securities, classified as Level 3 within the fair value hierarchy, and are recorded as an asset on the consolidated balance sheet |
| 2. | SUMMARY OF SIGNIFICANT ACCOUNTING POLICIES (continued) |
Income Taxes
The Company has elected to be taxed as an S-corporation. Accordingly, except for a minimal state tax, the Company is not taxed at the corporate level; rather, the tax on corporate income is paid and the benefits of losses are recognized at the stockholder level. Therefore, no provision or credit for federal income taxes has been included in the financial statements.
Certain transactions of the Company are subject to accounting methods for income tax purposes which differ from the accounting methods used in preparing the financial statements. Accordingly, the net income of the Company reported for federal income tax purposes may differ from the net income reported in these financial statements. The major differences relate to accounting for depreciation on property and equipment, stock compensation, and research credits.
The Company has adopted ASC 740-10-25, which provides criteria for the recognition, measurement, presentation and disclosure of uncertain tax position. The Company must recognize the tax benefit from an uncertain tax position only if it is more likely than not that the tax position will be sustained on examination by the taxing authorities, based on the technical merits of the position. The tax benefits recognized in the financial statements from such a position are measured based on the largest benefit that has a greater than 50% likelihood of being realized upon ultimate resolution. The Company did not recognize additional liabilities for uncertain tax positions as a result of the implementation of ASC 740-10-25 for the year ended December 31, 2017.
The Company is no longer subject to federal and state income tax examination by tax authorities for years ended before 2018 and 2017, respectively.
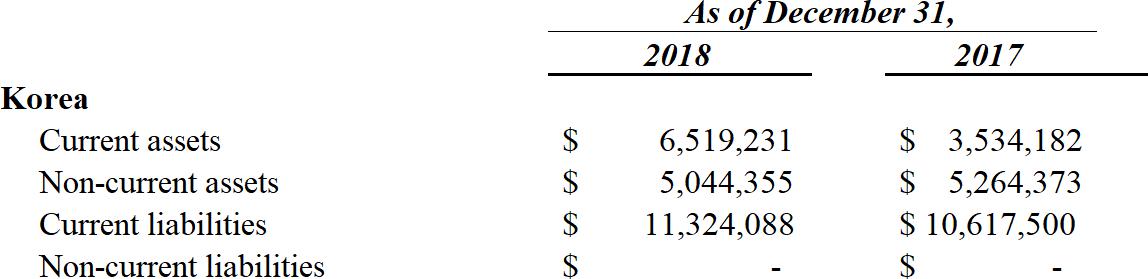
Segment Reporting
FASB ASC 280, Segment Reporting, requires public companies to report financial and descriptive information about their reportable operating segments. Operating segments are defined as components of an enterprise about which separate financial information is available and that is evaluated regularly by the chief operating decision maker in deciding how to allocate resources and in assessing performance. The Company’s chief executive officer has been identified as the chief decision maker.
The Company generates revenues from one geographic area, consisting of Korea. The following enterprise-wide disclosure is prepared on a basis consistent with the preparation of the consolidated financial statements:
| | | As of December 31, | |
| | | 2018 | | | 2017 | |
| Korea | | | | | | |
| Current assets | | $ | 6,519,231 | | | $ | 3,534,182 | |
| Non-current assets | | $ | 5,044,355 | | | $ | 5,264,373 | |
| Current liabilities | | $ | 11,324,088 | | | $ | 10,617,500 | |
| Non-current liabilities | | $ | - | | | $ | - | |
| | | Years Ended December 31, | |
| | | 2018 | | | 2017 | |
| Korea | | | | | | | | |
| Net sales | | $ | 20,072,236 | | | $ | 5,080,391 | |
| 2. | SUMMARY OF SIGNIFICANT ACCOUNTING POLICIES (continued) |
Concentration of Credit Risk
Financial instruments that potentially subject the Company to concentrations of credit risk are accounts receivable and other receivables arising from its normal business activities. The Company has a diversified customer base. The Company controls credit risk related to accounts receivable through credit approvals, credit limits and monitoring procedures. The Company routinely assesses the financial strength of its customers and, based upon factors surrounding the credit risk, establishes an allowance, if required, for uncollectable accounts and, as a consequence, believes that its accounts receivable related credit risk exposure beyond such allowance is limited.
All of the Company’s revenues are derived from the sale of Glasses Free 3D Mobile Display and related products and services.
Recently Issued Accounting Pronouncements
Pronouncements Not Yet Effective
In August 2018, the FASB amended “Fair Value Measurements” to modify the disclosure requirements related to fair value. The amendment removes requirements to disclose (1) the amount of and reasons for transfers between levels 1 and 2 of the fair value hierarchy, (2) our policy related to the timing of transfers between levels, and (3) the valuation processes used in level 3 measurements. It clarifies that, for investments measured at net asset value, disclosure of liquidation timing is only required if the investee has communicated the timing either to us or publicly. It also clarifies that the narrative disclosure of the effect of changes in level 3 inputs should be based on changes that could occur at the reporting date. The amendment adds a requirement to disclose the range and weighted average of significant unobservable inputs used in level 3 measurements. The guidance is effective for the Company with the Company’s quarterly filing for the period ended March 31, 2020 and the Company will make the required disclosure changes in that filing. Adoption will not have an impact on the Company’s consolidated results of operations, consolidated financial position, and cash flows.
| | ● | Income Statement – Reporting Comprehensive Income |
In February 2018, the FASB issued Accounting Standards Update No. 2018-02, Income Statement-Reporting Comprehensive Income (Topic 220) (ASU 2018-02), which amends existing standards for income statement-reporting comprehensive income to allow a reclassification from accumulated other comprehensive income to retained earnings for stranded tax effects resulting from Tax Cuts and Jobs Act and improve the usefulness of information reported to financial statements users. ASU 2018-02 will be effective forbeginning after December 15, 2018, and early adoption is permitted. The Company adopted ASU 2018-02 effective January 1, 2019; such adoption had no material impact on the Company’s consolidated financial statements.
| 2. | SUMMARY OF SIGNIFICANT ACCOUNTING POLICIES (continued) |
Recently Issued Accounting Pronouncements (continued)
In June 2016, the FASB amended “Financial Instruments” to provide financial statement users with more decision-useful information about the expected credit losses on debt instruments and other commitments to extend credit held by a reporting entity at each reporting date. During November 2018 and April 2019, the FASB made amendments to the new standard that clarified guidance on several matters, including accrued interest, recoveries, and various codification improvements. The new standard, as amended, replaces the incurred loss impairment methodology in the current standard with a methodology that reflects expected credit losses and requires consideration of a broader range of reasonable and supportable information to support credit loss estimates. The new guidance is effective for us on January 1, 2020, and in the first half of 2019, we established an implementation team and began analyzing the impact on our current policies and procedures to identify potential differences that would result from applying the requirements of the new standard. The implementation team reports findings and progress of the project to management on a frequent basis. Through this process, we have identified appropriate changes to our processes, systems, and controls to support recognition and disclosure under the new standard. The Company is still evaluating the impact of the new standard on the Company’s consolidated results of operations, consolidated financial position, and cash flows.
In March 2019, the FASB issued ASU 2019-01, Leases (Topic 842) Codification Improvements, which removed the requirement for an entity to disclose in the interim periods after adoption, the effect of the change on income from continuing operations, net income, any other affected financial statement line item, and any affected per share amount. For lessors, the new leasing standard requires leases to be classified as a sales-type, direct financing or operating leases. These criteria focus on the transfer of control of the underlying lease asset. This standard and related update was effective for fiscal yearsbeginning after December 15, 2018, and interim periods within those fiscal years. Early adoption is permitted. The Company is still evaluating the impact of the new standard on the Company’s consolidated results of operations, consolidated financial position, and cash flows.
In February 2016, the FASB issued ASU 2016-02, Leases (Topic 842), which requires the recognition of lease assets and lease liabilities on the balance sheet by lessees for those leases currently classified as operating leases under ASC 840 “Leases.” These amendments also require qualitative disclosures along with specific quantitative disclosures. These amendments are effective for fiscal yearsbeginning after December 15, 2018, including interim periods within those fiscal years. Early application is permitted. The Company can elect to record a cumulative-effect adjustment as of the beginning of the year of adoption or apply a modified retrospective transition approach. The Company expects that substantially all of its operating lease commitments will be subject to the new guidance and will be recognized as operating lease liabilities and right-of-use assets upon adoption. The Company is still evaluating the impact of the new standard on the Company’s consolidated results of operations, consolidated financial position, and cash flows.
Other recently issued accounting updates are not expected to have a material impact on the Company’s Interim Financial Statements.
Inventories consisted of the following:
| December 31, | | 2018 | | | 2017 | |
| | | | | | | |
| Finished goods | | $ | 1,739,722 | | | $ | 1,192,316 | |
| Parts | | | - | | | | - | |
| | | | | | | | | |
| Total inventories | | $ | 1,739,722 | | | $ | 1,192,316 | |
Ngen USA provided an investment to a privately held company, Emotek in April 11, 2017 and received 2,500,000 shares which represented 50% equity of Emotek on a fully none dilutive basis. Emotek is a joint venture between Ngen USA and Egismos Technologies. Egismos Technologies’ mission is primarily to develop tumor detection scanner which will be handheld and used for home use.
Equity Method
The Company applies the equity method for investments in affiliate, which a privately-held company where quoted market prices are not available, in which it has the ability to exercise significant influence over operating and financial policies of the affiliate. Significant influence is generally defined as 20% to 50% ownership in the voting stock of an investee. Under the equity method, the Company initially records the investment at cost and then adjusts the carrying value of the investment to recognize the proportional share of the equity-accounted affiliate’s net income (loss) including changes in capital of the affiliate.
The Company had the following equity investment accounted under the equity method:
| Equity investee | | Type of Shares Owned | | Number of Shares Owned | | | Original Investment Amount | | | Equity Investment Ownership | |
| Emotek | | Common stock | | | 2,500,000 | | | $ | 500,000 | | | | 50 | % |
The following is the roll-forward basis of equity investment accounted under the equity method:
| | | Year Ended December 31, 2017 | |
| Equity investee | | Beginning Balance | | | Proportional
Share of the
Equity Accounted
Affiliate’s
Net Income (loss) | | | Ending
Balance | |
| Emotek | | $ | 313,871 | | | $ | (199,562 | ) | | $ | 114,309 | |
| 4. | INVESTMENTS (CONTINUED) |
| | | Year Ended December 31, 2017 | |
| Equity investee | | Beginning Balance | | | Original Investment | | | Proportional Share of the Equity Accounted Affiliate’s Net Income (loss) | | | Ending Balance | |
| Emotek | | $ | - | | | $ | 500,000 | | | $ | (186,129 | ) | | $ | 313,871 | |
Summarized audited financial information of significant equity investments in affiliate are as follows:
| | | As of December 31, | |
| | | 2018 | | | 2017 | |
| Total current assets | | $ | 2,767,263 | | | $ | 2,533,355 | |
| Total assets | | $ | 5,935,437 | | | $ | 5,587,001 | |
| Total current liabilities | | $ | 5,688,818 | | | $ | 4,941,258 | |
| Total liabilities | | $ | 9,976,264 | | | $ | 9,228,704 | |
| | | Years Ended December 31, | |
| | | 2018 | | | 2017 | |
| Net sales | | $ | 747,560 | | | $ | 650,340 | |
| Gross profit | | $ | 747,560 | | | $ | 650,340 | |
| Income (loss) from operations | | $ | (446,650 | ) | | $ | (543,870 | ) |
| Net income (loss) | | $ | (399,124 | ) | | $ | (496,344 | ) |
Property and equipment consisted of the following:
| December 31, | | 2018 | | | 2017 | |
| | | | | | | |
| Machinery | | $ | 2,281,146 | | | $ | 2,378,233 | |
| Furniture and fixture | | | 23,659 | | | | 21,008 | |
| Equipment | | | 2,740,597 | | | | 2,857,238 | |
| Equipment | | | 15,765 | | | | 11,117 | |
| | | | | | | | | |
| Total property and equipment | | | 5,061,167 | | | | 5,267,596 | |
| | | | | | | | | |
| Accumulated depreciation | | | (41,164 | ) | | | (28,611 | ) |
| | | | | | | | | |
| Total property and equipment, net | | $ | 5,020,003 | | | $ | 5,238,985 | |
Depreciation expense on property and equipment amounted to $13,190 and $13,524 for the years ended December 31, 2018 and 2017, respectively.
| 6. | BORROWINGS FROM SHAREHOLDER |
The Company has borrowings from a majority shareholder of the Parent which is used for working capital. The borrowings are non-interest bearing and are due upon demand.
The Company calculates earnings per share in accordance with ASC 260, “Earnings Per Share,” which requires a dual presentation of basic and diluted earnings per share. Basic earnings per share are computed using the weighted average number of shares outstanding during the fiscal year. Dilutive earnings per share is computed on the basis of the weighted average number of shares plus potentially dilutive common shares which would consist of stock options outstanding (using the treasury method), which was none since the Company had net losses and any additional potential shares would be antidilutive. The following table sets forth the computation of basic and diluted net income per common share:
| Years ended December 31 | | 2018 | | | 2017 | |
| | | | | | | |
| Net income (loss) | | $ | 1,668,957 | | | $ | (1,809,410 | ) |
| Dividends | | | - | | | | - | |
| | | | | | | | | |
| Adjusted net loss attribution to stockholders | | | 1,668,957 | | | | (1,809,410 | ) |
| | | | | | | | | |
| Weighted-average shares of common stock outstanding: | | | | | | | | |
| Basic and Diluted | | | 10,000,000 | | | | 10,000,000 | |
| | | | | | | | | |
| Net loss attribute to shareholders per share: | | | | | | | | |
| Basic and Diluted | | $ | 0.17 | | | $ | (0.18 | ) |
| 8. | COMMITMENTS AND CONTINGENCIES |
Operating lease obligations
The Company does not have any leases of its facilities. Instead, the company partners with its strategic partners and customers to use their manufacturing, research and development locations. Currently, the Company has operations in Seoul, Korea and Taipei City, Taiwan.
The Company is subject to various legal proceedings from time to time as part of its business. As of December 31, 2018, the Company was not currently party to any legal proceedings or threatened legal proceedings, the adverse outcome of which, individually or in the aggregate, it believes would have a material adverse effect on its business, financial condition and results of operations.
The Company evaluated all events or transactions that occurred after December 31, 2018 up through the date the consolidated financial statements were available to be issued. During this period, the Company did not have any material recognizable subsequent events required to be disclosed as of and for the year ended December 31, 2018.