UNITED STATES
SECURITIES AND EXCHANGE COMMISSION
Washington, D.C. 20549
FORM N-CSR
CERTIFIED SHAREHOLDER REPORT OF REGISTERED MANAGEMENT INVESTMENT COMPANIES
| Investment Company Act file number: | | 811-22485 |
| | | |
| Exact name of registrant as specified in charter: | | abrdn Income Credit Strategies Fund |
| | | |
| Address of principal executive offices: | | 1900 Market Street, Suite 200 |
| | | Philadelphia, PA 19103 |
| | | |
| Name and address of agent for service: | | Andrea Melia |
| | | abrdn Inc. |
| | | 1900 Market Street Suite 200 |
| | | Philadelphia, PA 19103 |
| | | |
| Registrant’s telephone number, including area code: | | 1-800-522-5465 |
| | | |
| Date of fiscal year end: | | October 31 |
| | | |
| Date of reporting period: | | October 31, 2022 |
Item 1. Reports to Stockholders.
abrdn Income Credit Strategies Fund (ACP)
Annual Report
October 31, 2022
Letter to Shareholders (unaudited)
Dear Shareholder,
We present the Annual Report, which covers the activities of abrdn Income Credit Strategies Fund (the “Fund”), for the fiscal year ended October 31, 2022. The Fund's primary investment objective is to seek a high level of current income, with a secondary objective of capital appreciation.
Total Investment Return1
For the fiscal year ended October 31, 2022, the total return to shareholders of the Fund based on the net asset value (“NAV”) and market price of the Fund, respectively, compared to the Fund’s benchmark is as follows:
| NAV2,3 | -25.87% |
| Market Price2 | -34.92% |
| ICE BofAML Global High Yield Constrained (Hedged USD)4 | -13.84% |
For more information about Fund performance, please visit the Fund on the web at www.abrdnacp.com. Here, you can view quarterly commentary on the Fund's performance, monthly fact sheets, distribution and performance information, and other Fund literature.
NAV, Market Price and Premium(+)/Discount(-)
The below table represents comparison from current fiscal year end to prior fiscal year end of market price to NAV and associated Premium(+) and Discount(-).
| | |
| | NAV | Closing
Market
Price | Premium(+)/
Discount(-) |
| 10/31/2022 | $ 6.72 | $ 6.37 | -5.21% |
| 10/31/2021 | $10.45 | $11.30 | 8.10% |
During the fiscal year ended October 31, 2022, the Fund’s NAV traded within a range of $6.54 to $10.53 and the Fund’s market price traded
within a range of $6.16 to $11.45. During the fiscal year ended October 31, 2022, the Fund’s shares traded within a range of a premium(+)/discount(-) of 13.10% to -6.60%.
Distribution Policy
Distributions to common shareholders for the twelve-month period ended October 31, 2022 totaled $1.20 per share. Based on the market price of $6.37 on October 31, 2022, the distribution rate over the twelve-month period ended October 31, 2022 was 18.8%. Based on the NAV of $6.72 on October 31, 2022, the distribution rate over the twelve-month period ended October 31, 2022 was 17.9%. Since all distributions are paid after deducting applicable withholding taxes, the effective distribution rate may be higher for those U.S. investors who are able to claim a tax credit.
As announced on November 9, 2022, the Fund distributed $0.10 per share with a record date of November 22, 2022 and pay date of November 30, 2022. As announced on December 9, 2022, the Fund will distribute $0.10 per share with a record date of December 30, 2022 and pay date of January 11, 2023.
The Fund's policy is to provide common shareholders with a stable monthly distribution out of current income, supplemented by realized capital gains and, to the extent necessary, paid-in capital, which is a non-taxable return of capital. This policy is subject to an annual review as well as regular review at the Board's quarterly meetings, unless market conditions require an earlier evaluation.
For tax reporting purposes, not all components of the Fund's earnings can be used to support the monthly dividend distributions such as realized and unrealized gains on investments. Therefore, differences may exist between the distributable earnings of the Fund and the earnings from a total return perspective. We recommend reviewing both the composition of the common share distributions and the net asset value total return of the Fund when one is evaluating the current common share distribution rate and its sustainability.
{foots1}
| 1 | Past performance is no guarantee of future results. Investment returns and principal value will fluctuate and shares, when sold, may be worth more or less than original cost. Current performance may be lower or higher than the performance quoted. Net asset value return data include investment management fees, custodial charges and administrative fees (such as Trustee and legal fees) and assumes the reinvestment of all distributions. |
{foots1}
| 2 | Assuming the reinvestment of dividends and distributions. |
{foots1}
| 3 | The Fund’s total return is based on the reported net asset value (“NAV”) for each financial reporting period end and may differ from what is reported on the Financial Highlights due to financial statement rounding or adjustments. |
{foots1}
| 4 | The ICE BofAML Global High Yield Constrained (Hedged USD) Index tracks the performance of U.S. dollar-, Canadian dollar-, British pound- and euro-denominated below-investment-grade corporate debt publicly issued in the major domestic or eurobond markets. Indexes are unmanaged and have been provided for comparison purposes only. No fees or expenses are reflected. You cannot invest directly in an index. |
| abrdn Income Credit Strategies Fund | 1 |
Letter to Shareholders (unaudited) (continued)
Series A Perpetual Preferred Shares
As at October 31, 2022, the 5.25% Series A Perpetual Preferred Shares with a liquidation value of $40 million, are rated A2 by Moody's Investors Service. The Preferred Shares are listed on the New York Stock Exchange ("NYSE") under the ticker symbol "ACP PRA". A more detailed description of the Fund's Preferred Shares can be found in the Notes to Financial Statements.
Revolving Credit Facility
On November 23, 2022, the Fund’s senior secured 364-day revolving credit facility with BNP Paribas was amended to extend the scheduled commitment termination date to November 22, 2023 with a committed facility amount of $130,000,000. The Fund’s outstanding balance as of October 31, 2021 was $118,000,000 on the Revolving Credit Facility. During the fiscal year, the Fund paid down a net amount of $30,000,000. The Fund’s outstanding balance as of October 31, 2022 was $88,000,000. Under the terms of the loan facility and applicable regulations, the Fund is required to maintain certain asset coverage ratios for the amount of its outstanding borrowings. The Board of Trustees (the "Board") regularly reviews the use of leverage by the Fund. A more detailed description of the Fund's revolving credit facility can be found in the Notes to Financial Statements.
Unclaimed Share Accounts
Please be advised that abandoned or unclaimed property laws for certain states require financial organizations to transfer (escheat) unclaimed property (including Fund shares) to the state. Each state has its own definition of unclaimed property, and Fund shares could be considered “unclaimed property” due to account inactivity (e.g., no owner-generated activity for a certain period), returned mail (e.g., when mail sent to a shareholder is returned to the Fund’s transfer agent as undeliverable), or a combination of both. If your Fund shares are categorized as unclaimed, your financial advisor or the Fund’s transfer agent will follow the applicable state’s statutory requirements to contact you, but if unsuccessful, laws may require that the shares be escheated to the appropriate state. If this happens, you will have to contact the state to recover your property, which may involve time and expense. For more information on unclaimed property and how to maintain an active account, please contact your financial adviser or the Fund’s transfer agent.
Open Market Repurchase Program
The Fund’s Board approved an open market repurchase and discount management policy (the “Program”). The Program allows the Fund to purchase, in the open market, its outstanding common shares, with the amount and timing of any repurchase determined at the discretion of the Fund’s investment adviser. Such purchases may be made opportunistically at certain discounts to net asset value per share in the reasonable judgment of management based on historical
discount levels and current market conditions. The Fund reports repurchase activity on the Fund's website on a monthly basis. For the fiscal year ended October 31, 2022, the Fund did not repurchase any shares through the Program.
On a quarterly basis, the Fund’s Board will receive information on any transactions made pursuant to this policy during the prior quarter and management will post the number of shares repurchased on the Fund’s website on a monthly basis. Under the terms of the Program, the Fund is permitted to repurchase up to 10% of its outstanding shares of common stock in the open market during any 12 month period.
Portfolio Holdings Disclosure
The Fund’s complete schedule of portfolio holdings for the second and fourth quarters of each fiscal year are included in the Fund’s semi-annual and annual reports to shareholders. The Fund files its complete schedule of portfolio holdings with the Securities and Exchange Commission (the “SEC”) for the first and third quarters of each fiscal year as an exhibit to its reports on Form N-PORT. These reports are available on the SEC’s website at http://www.sec.gov. The Fund makes the information available to shareholders upon request and without charge by calling Investor Relations toll-free at 1-800-522-5465.
Proxy Voting
A description of the policies and procedures that the Fund uses to determine how to vote proxies relating to portfolio securities and information regarding how the Fund voted proxies relating to portfolio securities during the most recent 12 month period ended June 30 is available by August 31 of the relevant year: (1) upon request without charge by calling Investor Relations toll-free at 1-800-522-5465; and (2) on the SEC’s website at http://www.sec.gov.
Investor Relations Information
As part of abrdn’s commitment to shareholders, we invite you to visit the Fund on the web at www.abrdnacp.com. Here, you can view monthly fact sheets, quarterly commentary, distribution and performance information, and other Fund literature.
Enroll in abrdn’s email services and be among the first to receive the latest closed-end fund news, announcements, videos, and other information. In addition, you can receive electronic versions of important Fund documents, including annual reports, semi-annual reports, prospectuses and proxy statements. Sign up today at https://www.abrdn.com/enus/cefinvestorcenter/contact-us/preferences
Contact Us:
| • | Visit: https://www.abrdn.com/en-us/cefinvestorcenter |
| • | Email: Investor.Relations@abrdn.com; or |
| • | Call: 1-800-522-5465 (toll free in the U.S.). |
| 2 | abrdn Income Credit Strategies Fund |
Letter to Shareholders (unaudited) (concluded)
Yours sincerely,
/s/ Christian Pittard
Christian Pittard
President
{foots1}
All amounts are U.S. Dollars unless otherwise stated.
| abrdn Income Credit Strategies Fund | 3 |
Report of the Investment Adviser (unaudited)
Market/Economic Review
Global high yield bonds endured a difficult 12 months, with total returns negatively affected by the combination of rising government bond yields and wider corporate credit spreads. Sentiment weakened following the onset of the Russia-Ukraine war and repeated interest-rate increases by global central banks amid persistently high inflation. In the U.S., after surging to a high of 9.1% in June, the consumer price index (CPI)1 trended lower thereafter. However, core CPI, a measure that excludes more volatile items such as food and energy, concerned investors after reaching a new high of 6.6% in September. In response to inflationary pressures, the U.S. Federal Reserve continually hiked the federal funds rate, ending the reporting period at a range of 3.0-3.25%. Meanwhile, the 10-year U.S. Treasury yield rose over the 12 months, and breached 4% for the first time since 2010.
Elsewhere, European inflation continued to rise, as the Eurozone CPI hit a new high of 10.7% in October as the Ukrainian war entered its tenth month. Although a mild start to the winter did at least see power prices drop through the period, the energy component of Eurozone CPI is running at +40% year on year and it will take time for economies that had been reliant on Russian gas to establish a permanent alternative supply. Additionally, the European Central Bank hiked its deposit facility rate, moving back above zero after eight years of negative rates.
Towards the end of the 12 months, U.K. assets were particularly volatile during a calamitous period for the government and a remarkably short tenure for Prime Minister Liz Truss. Named as prime minister in early September, Truss and Chancellor Kwasi Kwarteng announced a range of largely unfunded, tax-cutting measures in a mini budget that was met with consternation and rejected by the markets. Five-year U.K. government bond yields widened by almost 1.0% to 4.5% in the two days following the announcement and sterling collapsed to an all-time low of $1.03. The scale of the move in longer-dated U.K. government bonds caused significant stress in the
pension system, which ultimately required intervention by the Bank of England.
Performance Review
The abrdn Income Credit Strategies Fund returned -25.87% over the 12 month reporting period ended October 31, 2022 on a net asset value2 basis, compared with the ICE Bank of America (BofA) Merrill Lynch Global High Yield Constrained Index (hedged to U.S. dollars) return of -13.84%.
On an unlevered basis, the net asset value of the Fund returned -15.68% over the period, so the levered effect on performance contributed more than 10% of the net asset value decline over the 12 months. Excluding the effect of leverage3 and the impact of the Fund’s operating expenses, the Fund’s portfolio slightly outperformed the Global High Yield Constrained Index4. The Fund employs leverage to help generate the yield required to fund the dividend. However, in a falling market, leverage has a negative effect on capital values. Over the reporting period, the Fund hedged all currency risk5 back to U.S. dollars, which protected further downside for the Fund given the strong underperformance of the euro and sterling against the U.S. dollar. During the reporting period, the Fund’s performance benefited approximately 12.66% from hedging the currency risk.
From a rating perspective, the Fund’s overweight6 exposure to B rated7 securities (Bs) was a slight tailwind to performance, as that rating class returned -13.3% (hedged to U.S. dollars) compared with -13.7% for BBs. However, the Fund’s large CCC exposure was a meaningful negative detractor, given the -16.7% return in that segment of the market.
With respect to the Fund’s holdings, Unifin was the weakest performer over the period. The Mexican non-bank financial institution announced that it would stop making coupon8 and principal payments on outstanding bonds. The U.S. healthcare-focused software provider Athena also hurt performance. Meanwhile, the Russian invasion of Ukraine negatively affected some of the Fund’s
{foots1}
| 1 | Consumer Price Index – a measure of inflation. An index of the cost of all goods and services to a typical consumer. |
{foots1}
| 2 | Net asset value (NAV) – A key measure of the value of a company, fund or trust – the total value of assets less liabilities, divided by the number of shares. |
{foots1}
| 3 | Leverage – usually refers to a fund being exposed by more than 100% of its net asset value to assets or markets; typically resulting from the use of debt or derivatives. |
{foots1}
| 4 | The Fund’s net operating expense ratio, excluding fee waivers based on the fiscal year ended October 31, 2022 was 3.95%. The net operating expense ratio, net of fee waivers based on the fiscal year ended October 31, 2022 was 3.70%. The net operating expenses, net of fee waivers and excluding interest expense based on the fiscal year ended October 31, 2022 was 2.48%. |
{foots1}
| 5 | Currency hedging – The use of derivative transactions to protect the value of an investment against fluctuations in exchange rates. |
{foots1}
| 6 | Overweight – A portfolio holding an excess amount of a particular security (or sector or region) compared to the security’s weight in the benchmark portfolio. |
{foots1}
| 7 | S&P Global Ratings’ credit ratings express the agency’s opinion about the ability and willingness of an issuer, such as a corporation or state or city government, to meet its financial obligations in full and on time. Typically, ratings are expressed as letter grades that range, for example, from AAA to D to communicate the agency’s opinion of relative level of credit risk. Ratings from AA to CCC may be modified by the addition of a plus (+) or minus (-) sign to show relative standing within the major rating categories. |
{foots1}
| 8 | Coupon – The interest rate stated on a bond when it’s issued. Typically coupons are paid semi-annually. |
| 4 | abrdn Income Credit Strategies Fund |
Report of the Investment Adviser (unaudited) (concluded)
Ukrainian holdings, including agricultural provider MHP and ferrous metals company Metinvest, to which the Fund held overweight exposures. Real estate names Kaisa and Adler Group also weighed on returns, as did plastic packaging manufacturer Kleopatra Holdings. We exited Adler Group due to growing concerns about the governance standards at the company. Though the property assets should more than cover the liabilities, we felt there was a risk of the assets being removed from the borrowing entity to the detriment of lenders. Kaisa, along with a number of other Chinese property developers, is currently undergoing a restructuring process where we expect final bondholder recoveries to be materially higher than the current bond prices.
On the other hand, our off-benchmark exposure to Enquest added to the Fund’s returns, as high oil prices allowed the company to generate a significant amount of free cash flow. This allowed the company to refinance the Fund’s bond position at the end of the period. Prior to the refinancing, the Enquest bonds represented the Fund’s largest single holding, although we have now reduced this exposure significantly as our view on the energy sector has cooled slightly. Overweight exposures to Cirsa Enterprises, Lumen Technologies and Boxer Parent Company also helped Fund performance. Lastly, telecommunications providers Altice and Telefonica both aided returns over the period.
The monthly distribution reflects the Fund’s current policy to provide shareholders with a relatively stable cash flow per share. This policy did not have a significant impact on the Fund’s investment strategy over the reporting period. During the 12-month period ended October 31, 2022, the distributions comprised of 100% net ordinary income.
Outlook
Although inflationary pressures have declined in the beginning of the fourth quarter of 2022, we believe that the first half of 2023 carries a high degree of risk. We expect focus to switch from central bank policy to the real economy and whether corporate earnings growth is slowing or negative. Although this view has become worryingly consensus, we continue to believe it is the correct one. Using forward-looking indicators such as money supply, we believe that there are significant further economic declines to come, and with valuations where they are as of the end of the reporting period, this has yet to be properly reflected in credit spreads or equity prices. We expect that high-yield spreads will peak next year somewhere between 700 and 800 basis points, but we also expect strong buying demand to emerge at those levels, meaning values of securities will not stay there for long, in our view. This is further supported by our belief that recessions in the developed world will neither be particularly deep nor long
lasting, that default rates will remain benign and that central banks will be more accommodative in the later stages of 2023 than what we believe is currently priced into the market. The carry available from the Fund’s asset class also generally provides some downside protection. In this context, although valuations are already reasonable for longer-term investors, we think it is likely that there will be a better entry point in the coming months.
Risk Considerations
Past performance is not an indication of future results. Foreign securities in which the Fund may invest may be more volatile, harder to price and less liquid than U.S. securities. They are subject to risks
associated with less stringent accounting and regulatory standards, the impact of currency exchange rate fluctuation, political and economic instability, reduced information about issuers, higher transaction costs and delayed settlement.
Fixed income securities are subject to certain risks including, but not limited to: interest rate (changes in interest rates may cause a decline in the market value of an investment), credit (changes in the financial condition of the issuer, borrower, counterparty, or underlying collateral), prepayment (debt issuers may repay or refinance their loans or obligations earlier than anticipated), and extension (principal repayments may not occur as quickly as anticipated, causing the expected maturity of a security to increase) and issuer risk (the value of a security may decline for reasons related to the issuer, such as management performance, financial leverage and reduced demand for the issuer’s goods or services.
The performance of the global high-yield market is measured by the ICE Bank of America Merrill Lynch (BofA ML) Global High Yield Constrained Index, which tracks the performance of U.S. dollar-, Canadian dollar-, euro- and sterling-denominated, below-investment grade corporate debt publicly issued in the major domestic or eurobond markets. CCC rated credit is represented by the ICE BofA ML CCC & Lower U.S. High Yield Constrained Index; BB rated credit is represented by the ICE BofA ML BB US High Yield Constrained Index; B rated credit is represented by the ICE BofA ML Single-B US High Yield Constrained Index; European high yield is represented by the ICE BofA ML Euro High Yield Constrained Index.
All indices are hedged to U.S. dollars.
Indexes are unmanaged and have been provided for comparison purposes only. No fees or expenses are reflected. You cannot invest directly in an index.
abrdn Investments Limited (formerly, Aberdeen Asset Managers Limited)
| abrdn Income Credit Strategies Fund | 5 |
Total Investment Return (unaudited)
The following table summarizes the average annual Fund performance compared to the Fund’s primary benchmark for the 1-year, 3-year, 5-year and 10-year periods ended October 31, 2022.
| | 1 Year | 3 Years | 5 Years | 10 Years |
| Net Asset Value (NAV) | -25.87% | -7.09% | -3.93% | 1.30% |
| Market Price | -34.92% | -5.74% | -4.11% | 0.90% |
| ICE BofAML Global High Yield Constrained (Hedged USD) | -13.84% | -1.22% | 1.13% | 3.93% |
Performance of a $10,000 Investment (as of October 31, 2022)
This graph shows the change in value of a hypothetical investment of $10,000 in the Fund for the period indicated. For comparison, the same investment is shown in the indicated index.
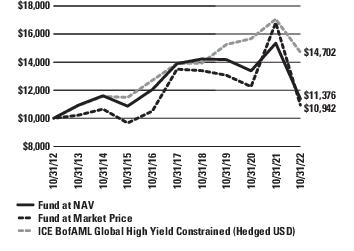
abrdn Investments limited (formerly known as Aberdeen Asset Managers Limited) and abrdn Inc. (formerly known as Aberdeen Standard Investments Inc.) assumed responsibility for the management of the Fund as investment adviser and sub adviser, respectively, on December 1, 2017. Performance prior to this date reflects the performance of an unaffiliated investment adviser. The performance above reflects fee waivers and/or expense reimbursements made by the Fund’s current and/or former investment adviser. Absent such waivers and/or reimbursements, the Fund’s returns would be lower. Additionally, abrdn Inc. entered into an agreement with the Fund to limit investor relations services fees. This agreement aligns with the term of the advisory agreement and may not be terminated prior to the end of the current term of the advisory agreement. See Note 3 in the Notes to Financial Statements.
Returns represent past performance. Total investment return at NAV is based on changes in the NAV of Fund shares and assumes reinvestment of dividends and distributions, if any, at market prices pursuant to the dividend reinvestment program sponsored by the Fund’s transfer agent. All return data at NAV includes fees charged to the Fund, which are listed in the Fund’s Statement of Operations under “Expenses.” Total investment return at market value is based on changes in the market price at which the Fund’s shares traded on the NYSE during the period and assumes reinvestment of dividends and distributions, if any, at market prices pursuant to the dividend reinvestment program sponsored by the Fund’s transfer agent. The Fund’s total investment return is based on the reported NAV on the financial reporting period ended October 31, 2022. Because the Fund’s shares trade in the stock market based on investor demand, the Fund may trade at a price higher or lower than its NAV. Therefore, returns are calculated based on both market price and NAV. Past performance is no guarantee of future results. The performance information provided does not reflect the deduction of taxes that a shareholder would pay on distributions received from the Fund. The current performance of the Fund may be lower or higher than the figures shown. The Fund’s yield, return, market price and NAV will fluctuate. Performance information current to the most recent month-end is available at www.abrdnacp.com or by calling 800-522-5465.
The net operating expense ratio excluding fee waivers based on the fiscal year ended October 31, 2022 was 3.95%. The net operating expense ratio net of fee waivers based on the fiscal year ended October 31, 2022 was 3.70%. The net operating expenses net of fee waivers and excluding interest expense based on the fiscal year ended October 31, 2022 was 2.48%.
| 6 | abrdn Income Credit Strategies Fund |
Portfolio Composition (as a percentage of net assets) (unaudited)
As of October 31, 2022
Quality of Investments(1)
As at October 31, 2022, 2.8% of the Fund’s investments were invested in securities where either the issue or the issuer was rated “A” or better by S&P Global Ratings (“S&P”), Moody’s Investors Service, Inc. ("Moody's") or Fitch Ratings, Inc. (“Fitch”) or, if unrated, was judged to be of equivalent quality by the Adviser. The following table shows the ratings of securities held by the Fund as at October 31, 2022, compared with April 30, 2022 and October 31, 2021:
| Date | AAA/Aaa
% | A
% | BBB/Baa
% | BB/Ba
% | B
% | CCC/CC/C
% | NR
% |
| October 31, 2022 | 1.2 | 1.6 | 0.0 | 13.4 | 45.6 | 38.2 | 0.0 |
| April 30, 2022 | 0.0 | 0.0 | 0.0 | 8.0 | 50.0 | 36.0 | 6.0 |
| October 31, 2021 | 3.0 | 0.0 | 1.0 | 9.0 | 41.0 | 43.0 | 3.0 |
| (1) | For financial reporting purposes, credit quality ratings shown above reflect the lowest rating assigned by either S&P, Moody’s or Fitch if ratings differ. These rating agencies are independent, nationally recognized statistical rating organizations and are widely used. Investment grade ratings are credit ratings of BBB/Baa or higher. Below investment grade ratings are credit ratings of BB/Ba or lower. Investments designated NR are not rated by these rating agencies. Unrated investments do not necessarily indicate low credit quality. Credit quality ratings are subject to change. The Adviser evaluates the credit quality of unrated investments based upon, but not limited to, credit ratings for similar investments. |
Geographic Composition
The Fund’s investments are divided into three categories: Developed Markets, Investment Grade Developing Markets and Sub-Investment Grade Developing Markets. The table below shows the geographical composition (with U.S. Dollar-denominated bonds issued by foreign issuers allocated into country of issuance) of the Fund’s total investments as at October 31, 2022, compared with April 30, 2022 and October 31, 2021:
| Date | Europe
% | United States
% | United Kingdom
% | Others
% |
| October 31, 2022 | 40.0 | 31.7 | 19.2 | 9.1 |
| April 30, 2022 | 28.0 | 33.0 | 18.0 | 21.0 |
| October 31, 2021 | 32.0 | 32.0 | 25.0 | 11.0 |
Maturity Composition
The average maturity of the Fund’s total investments was 4.5 years at October 31, 2022, compared with 3.9 years at April 30, 2022, and 3.4 years at October 31, 2021. The following table shows the maturity composition of the Fund’s investments as at October 31, 2022, compared with April 30, 2022 and October 31, 2021:
| Date | 0 to 5 Years
% | 5 to 10 Years
% | 10 Years & Over
% |
| October 31, 2022 | 65.7 | 32.7 | 1.6 |
| April 30, 2022 | 70.0 | 27.0 | 3.0 |
| October 31, 2021 | 81.0 | 17.0 | 2.0 |
Modified Duration
As of October 31, 2022, the modified duration* of the Fund was 6.0 years.
| * | Modified duration is a measure of the sensitivity of the price of a bond to the fluctuations in interest rates. |
| abrdn Income Credit Strategies Fund | 7 |
Portfolio of Investments
As of October 31, 2022
| | Shares or
Principal
Amount | Value |
| CORPORATE BONDS—164.1% | |
| ARGENTINA—1.6% | | |
| Telecom Argentina SA, 8.00%, 07/18/2026(a)(b) | $ | 3,120,000 | $ 2,693,429 |
| BRAZIL—1.1% | | |
| InterCement Financial Operations BV, 5.75%, 07/17/2024(a)(b)(c) | | 2,736,000 | 1,898,511 |
| CANADA—4.4% | | |
| Enerflex Ltd., 9.00%, 10/15/2027 | | 1,777,000 | 1,728,666 |
| Husky III Holding Ltd., 13.00%, 02/15/2025(a)(b)(d) | | 4,495,000 | 4,107,441 |
| Titan Acquisition Ltd. / Titan Co-Borrower LLC, 7.75%, 04/15/2026(a)(b) | | 1,875,000 | 1,532,812 |
| Total Canada | | 7,368,919 |
| CHINA—0.4% | | |
| China Evergrande Group, 9.50%, 04/11/2022(a)(c)(e) | | 3,304,000 | 115,590 |
| Kaisa Group Holdings Ltd., 9.38%, 06/30/2024(a)(b)(e) | | 7,510,000 | 506,925 |
| Total China | | 622,515 |
| DENMARK—2.3% | | |
| DKT Finance ApS, 9.38%, 06/17/2023(a)(b) | | 4,000,000 | 3,840,000 |
| FRANCE—8.0% | | |
| Banijay Group SAS REGS, 6.50%, 03/01/2026(a)(b) | EUR | 2,000,000 | 1,828,262 |
| CAB SELAS, 3.38%, 02/01/2028(a)(b) | | 3,305,000 | 2,547,609 |
| Electricite de France SA, (fixed rate to 01/22/2026, variable rate thereafter), 5.00%, 01/22/2026(a)(f) | | 3,200,000 | 2,688,039 |
| Iliad Holding SASU, 7.00%, 10/15/2028(a)(b) | $ | 1,568,000 | 1,419,040 |
| Loxam SAS, 5.75%, 07/15/2027(a)(b) | EUR | 3,500,000 | 2,759,995 |
| Mobilux Finance SAS, 4.25%, 07/15/2028(a)(b) | | 3,000,000 | 2,067,396 |
| Total France | | 13,310,341 |
| GEORGIA—0.3% | | |
| Bank of Georgia JSC, (fixed rate to 06/28/2024, variable rate thereafter), 11.13%, 06/28/2024(a)(f) | $ | 526,000 | 518,767 |
| GERMANY—8.8% | | |
| Cheplapharm Arzneimittel GmbH, 4.38%, 01/15/2028(a)(b) | EUR | 3,300,000 | 2,747,907 |
| CT Investment GmbH, 5.50%, 04/15/2026(a)(b) | | 3,400,000 | 2,758,399 |
| Deutsche Bank AG, (fixed rate to 04/30/2026, variable rate thereafter), 7.13%, 04/30/2026(a)(f) | GBP | 1,600,000 | 1,532,124 |
| HT Troplast GmbH, 9.25%, 07/15/2025(a)(b) | EUR | 4,865,000 | 4,182,336 |
| PrestigeBidCo GmbH, 3 mo. Euribor + 6.000%, 7.38%, 07/15/2027(a)(b)(g) | | 2,176,000 | 1,962,656 |
| Standard Profil Automotive GmbH, 6.25%, 04/30/2026(a)(b) | | 2,500,000 | 1,425,550 |
| Total Germany | | 14,608,972 |
| ISRAEL—1.7% | | |
| Teva Pharmaceutical Finance Netherlands II BV, 4.38%, 05/09/2030(b) | | 3,500,000 | 2,780,070 |
| | Shares or
Principal
Amount | Value |
| ITALY—3.2% | | |
| Gamma Bidco SpA, 6.25%, 07/15/2025(a)(b) | EUR | 1,000,000 | $ 935,104 |
| Gamma Bondco Sarl, 8.13%, 11/15/2026(a)(b)(d) | | 5,500,000 | 4,473,258 |
| Total Italy | | 5,408,362 |
| LUXEMBOURG—25.3% | | |
| Albion Financing 2Sarl, 8.75%, 04/15/2027(a)(b) | $ | 6,485,000 | 5,447,400 |
| Altice Finco SA, 4.75%, 01/15/2028(a)(b) | EUR | 5,000,000 | 3,427,497 |
| Altice France Holding SA | | | |
| 10.50%, 05/15/2027(a)(b) | $ | 2,700,000 | 2,104,029 |
| 6.00%, 02/15/2028(a)(b) | | 10,000,000 | 6,466,709 |
| Cidron Aida Finco Sarl | | | |
| 5.00%, 04/01/2028(a)(b) | EUR | 2,000,000 | 1,547,516 |
| 6.25%, 04/01/2028(a)(b) | GBP | 2,993,000 | 2,610,318 |
| Cirsa Finance International Sarl, 10.38%, 11/30/2027(b) | EUR | 1,590,000 | 1,573,281 |
| Cullinan Holdco Scsp, 4.63%, 10/15/2026(a)(b) | | 2,031,000 | 1,662,711 |
| Garfunkelux Holdco 3 SA | | | |
| 7.75%, 11/01/2025(a)(b) | GBP | 4,214,000 | 3,438,984 |
| 7.75%, 11/01/2025(a)(b) | | 3,000,000 | 2,448,256 |
| Herens Midco Sarl, 5.25%, 05/15/2029(a)(b) | EUR | 2,000,000 | 1,276,819 |
| HSE Finance Sarl, 5.63%, 10/15/2026(a)(b) | | 625,000 | 340,205 |
| LHMC Finco 2 Sarl PIK, 7.25%, 10/02/2025(a)(b)(d) | | 246,424 | 207,861 |
| Monitchem HoldCo 2 SA, 9.50%, 09/15/2026(a)(b) | | 5,150,000 | 4,643,902 |
| Summer BC Holdco A Sarl, 9.25%, 10/31/2027(a)(b) | | 6,397,473 | 4,905,158 |
| Total Luxembourg | | 42,100,646 |
| MAURITIUS—0.7% | | |
| Axian Telecom, 7.38%, 02/16/2027(a)(b) | $ | 1,447,000 | 1,237,185 |
| MEXICO—4.2% | | |
| Braskem Idesa SAPI, 6.99%, 02/20/2032(a)(b) | | 1,079,000 | 721,721 |
| Petroleos Mexicanos | | | |
| 6.49%, 01/23/2027(b) | | 4,200,000 | 3,658,200 |
| 4.75%, 02/26/2029(a) | EUR | 1,400,000 | 1,013,450 |
| Sixsigma Networks Mexico SA de CV, 7.50%, 05/02/2025(a)(b) | $ | 1,500,000 | 1,242,198 |
| Unifin Financiera SAB de CV | | | |
| (fixed rate to 01/29/2025, variable rate thereafter), 8.88%, 01/29/2025(a)(c)(e)(f) | | 2,000,000 | 32,500 |
| 8.38%, 01/27/2028(a)(b)(c)(e) | | 3,000,000 | 270,000 |
| Total Mexico | | 6,938,069 |
| NETHERLANDS—7.8% | | |
| Samvardhana Motherson Automotive Systems Group BV, 1.80%, 07/06/2024(a) | EUR | 963,000 | 847,342 |
| Sigma Holdco BV, 7.88%, 05/15/2026(a)(b) | $ | 4,300,000 | 2,634,911 |
| Stichting AK Rabobank Certificaten, 6.50%, 12/29/2049(a)(f) | EUR | 5,000,000 | 4,662,266 |
| Summer BidCo BV, 9.00%, 11/15/2025(a)(b)(d) | | 6,683,717 | 4,827,875 |
| Total Netherlands | | 12,972,394 |
| 8 | abrdn Income Credit Strategies Fund |
Portfolio of Investments (continued)
As of October 31, 2022
| | Shares or
Principal
Amount | Value |
| CORPORATE BONDS (continued) | |
| NIGERIA—1.3% | | |
| IHS Netherlands Holdco BV, 8.00%, 09/18/2027(a)(b) | $ | 2,860,000 | $ 2,207,577 |
| PORTUGAL—1.6% | | |
| Novo Banco SA, (fixed rate to 07/06/2023, variable rate thereafter), 8.50%, 07/06/2028(a)(b) | EUR | 3,000,000 | 2,662,345 |
| REPUBLIC OF IRELAND—2.7% | | |
| Virgin Media Vendor Financing Notes III DAC, 4.88%, 07/15/2028(a)(b) | GBP | 5,000,000 | 4,580,031 |
| SPAIN—4.9% | | |
| Cirsa Finance International Sarl, 6.25%, 12/20/2023(a)(b) | EUR | 5,264,857 | 5,189,309 |
| Telefonica Europe BV, 2.38%, 02/12/2029(a)(f) | | 4,100,000 | 3,001,826 |
| Total Spain | | 8,191,135 |
| SWEDEN—4.7% | | |
| DDM Debt AB, 9.00%, 04/19/2026(a)(b) | | 6,400,000 | 4,300,863 |
| Intrum AB, 3.50%, 07/15/2026(a)(b) | | 4,400,000 | 3,533,427 |
| Total Sweden | | 7,834,290 |
| TURKEY—0.5% | | |
| Yapi ve Kredi Bankasi AS, (fixed rate to 01/22/2026, variable rate thereafter), 7.88%, 01/22/2031(a)(b) | $ | 983,000 | 867,380 |
| UKRAINE—0.3% | | |
| MHP Lux SA, 6.95%, 04/03/2026(a)(e) | | 1,057,000 | 472,479 |
| UNITED ARAB EMIRATES—0.1% | | |
| Emirates Reit Sukuk Ltd., 5.13%, 12/12/2022(a) | | 200,000 | 155,150 |
| UNITED KINGDOM—30.5% | | |
| BCP V Modular Services Finance PLC, 6.75%, 11/30/2029(a)(b) | EUR | 2,700,000 | 1,841,109 |
| Bellis Acquisition Co. PLC, 4.50%, 02/16/2026(a)(b) | GBP | 3,600,000 | 3,473,247 |
| eG Global Finance PLC, 6.25%, 10/30/2025(a)(b) | EUR | 3,000,000 | 2,557,096 |
| EnQuest PLC | | | |
| 7.00%, 10/15/2023(a)(d) | GBP | 639,725 | 729,968 |
| 11.63%, 11/01/2027(b) | $ | 2,650,000 | 2,590,905 |
| Galaxy Finco Ltd., 9.25%, 07/31/2027(a)(b) | GBP | 6,300,000 | 5,687,103 |
| Intu Properties PLC, 11.00%, 12/04/2024(c)(h) | | 3,567,071 | 3,926,678 |
| Ithaca Energy North Sea PLC, 9.00%, 07/15/2026(a)(b) | $ | 5,236,000 | 5,168,874 |
| Jaguar Land Rover Automotive PLC | | | |
| 4.50%, 01/15/2026(a)(b) | EUR | 1,000,000 | 837,431 |
| 4.50%, 10/01/2027(a)(b) | $ | 1,700,000 | 1,205,002 |
| Jerrold Finco PLC, 4.88%, 01/15/2026(a)(b) | GBP | 2,900,000 | 2,735,403 |
| Motion Bondco DAC, 6.63%, 11/15/2027(a)(b) | $ | 4,000,000 | 3,346,320 |
| Punch Finance PLC, 6.13%, 06/30/2026(a)(b) | GBP | 2,740,000 | 2,724,314 |
| Sherwood Financing PLC, 6.00%, 11/15/2026(a)(b) | | 4,710,000 | 3,916,034 |
| Stonegate Pub Co. Financing 2019 PLC, 8.00%, 07/13/2025(a)(b) | | 2,000,000 | 2,064,239 |
| TalkTalk Telecom Group Ltd., 3.88%, 02/20/2025(a)(b) | | 1,600,000 | 1,449,555 |
| | Shares or
Principal
Amount | Value |
| Very Group Funding PLC, 6.50%, 08/01/2026(a)(b) | GBP | 4,095,000 | $ 3,181,638 |
| Wheel Bidco Ltd., 6.75%, 07/15/2026(a)(b) | | 3,783,000 | 3,405,599 |
| Total United Kingdom | | 50,840,515 |
| UNITED STATES—47.7% | | |
| Adams Homes, Inc., 7.50%, 02/15/2025(a)(b) | $ | 2,023,000 | 1,636,697 |
| Adient Global Holdings Ltd., 3.50%, 08/15/2024(a)(b) | EUR | 2,725,000 | 2,544,866 |
| Affinity Gaming, 6.88%, 12/15/2027(a)(b) | $ | 2,139,000 | 1,785,535 |
| Ardagh Packaging Finance PLC / Ardagh Holdings USA, Inc., 4.75%, 07/15/2027(a)(b) | GBP | ���955,000 | 709,390 |
| ASP Unifrax Holdings, Inc., 7.50%, 09/30/2029(a)(b) | $ | 2,162,000 | 1,448,540 |
| Banff Merger Sub, Inc. | | | |
| 8.38%, 09/01/2026(a)(b) | EUR | 4,200,000 | 3,814,098 |
| 8.38%, 09/01/2026(a)(b) | | 2,400,000 | 2,179,484 |
| Carnival Corp. | | | |
| 10.13%, 02/01/2026(a)(b) | | 236,000 | 227,979 |
| 7.63%, 03/01/2026(a)(b) | $ | 324,000 | 243,632 |
| Cimpress PLC, 7.00%, 06/15/2026(a)(b) | | 3,432,000 | 2,050,620 |
| Clydesdale Acquisition Holdings, Inc. | | | |
| 6.63%, 04/15/2029(a)(b) | | 1,460,000 | 1,386,124 |
| 8.75%, 04/15/2030(a)(b) | | 1,567,000 | 1,377,001 |
| Condor Merger Sub, Inc., 7.38%, 02/15/2030(a)(b) | | 6,715,000 | 5,553,797 |
| Consensus Cloud Solutions, Inc. | | | |
| 6.00%, 10/15/2026(a)(b) | | 913,000 | 822,385 |
| 6.50%, 10/15/2028(a)(b) | | 2,576,000 | 2,273,787 |
| Cornerstone Building Brands, Inc., 6.13%, 01/15/2029(a)(b) | | 3,022,000 | 1,888,750 |
| CSC Holdings LLC, 7.50%, 04/01/2028(a)(b) | | 4,000,000 | 3,465,480 |
| Encore Capital Group, Inc., 5.38%, 02/15/2026(a)(b) | GBP | 1,500,000 | 1,497,003 |
| Ford Motor Credit Co. LLC, 4.54%, 03/06/2025 | | 2,700,000 | 2,853,889 |
| Frontier Communications Holdings LLC | | | |
| 6.00%, 01/15/2030(a)(b) | $ | 3,088,000 | 2,414,816 |
| 8.75%, 05/15/2030(a)(b) | | 1,306,000 | 1,333,752 |
| Goodyear Europe BV | | | |
| 2.75%, 08/15/2028(a)(b) | EUR | 2,000,000 | 1,582,603 |
| 2.75%, 08/15/2028(a)(b) | | 1,019,000 | 806,336 |
| ITT Holdings LLC, 6.50%, 08/01/2029(a)(b) | $ | 3,825,000 | 3,073,407 |
| MajorDrive Holdings IV LLC, 6.38%, 06/01/2029(a)(b) | | 3,506,000 | 2,470,678 |
| Mauser Packaging Solutions Holding Co., 7.25%, 04/15/2025(a)(b) | | 4,324,000 | 3,892,022 |
| Michaels Cos., Inc., 5.25%, 05/01/2028(a)(b) | | 934,000 | 663,271 |
| Moss Creek Resources Holdings, Inc. | | | |
| 7.50%, 01/15/2026(a)(b) | | 2,567,000 | 2,361,640 |
| 10.50%, 05/15/2027(a)(b) | | 548,000 | 526,080 |
| NCL Corp. Ltd. | | | |
| 5.88%, 03/15/2026(a)(b) | | 721,000 | 590,319 |
| 7.75%, 02/15/2029(a)(b) | | 785,000 | 625,355 |
| NCL Finance Ltd., 6.13%, 03/15/2028(a)(b) | | 3,303,000 | 2,568,082 |
| New Enterprise Stone & Lime Co., Inc., 9.75%, 07/15/2028(a)(b) | | 4,814,000 | 4,131,916 |
| Photo Holdings Merger Sub, Inc., 8.50%, 10/01/2026(a)(b) | | 2,224,000 | 1,463,548 |
| Staples, Inc., 10.75%, 04/15/2027(a)(b) | | 8,205,000 | 5,975,340 |
| abrdn Income Credit Strategies Fund | 9 |
Portfolio of Investments (continued)
As of October 31, 2022
| | Shares or
Principal
Amount | Value |
| CORPORATE BONDS (continued) | |
| UNITED STATES (continued) | | |
| Viking Cruises Ltd., 5.88%, 09/15/2027(a)(b) | $ | 2,870,000 | $ 2,268,009 |
| Virtusa Corp., 7.13%, 12/15/2028(a)(b) | | 1,904,000 | 1,365,782 |
| Weatherford International Ltd. | | | |
| 11.00%, 12/01/2024(a)(b) | | 62,000 | 63,724 |
| 8.63%, 04/30/2030(a)(b) | | 3,687,000 | 3,474,997 |
| Total United States | | 79,410,734 |
| Total Corporate Bonds | | 273,519,816 |
| BANK LOANS—3.2% | |
| UNITED KINGDOM—3.2% | | |
| Impala Bidco 0 Ltd. GBP Term Loan, 7.44%, 06/08/2028 | GBP | 1,000,000 | 1,045,021 |
| Constellation Automotive Ltd. GBP 2nd Lien Term Loan B, 5.70%, 07/27/2029(c) | | 2,000,000 | 1,286,044 |
| EG Finco Ltd. 2021 EUR 2nd Lien Term Loan, 8.70%, 04/30/2027 | EUR | 3,500,000 | 2,997,692 |
| Total United Kingdom | | 5,328,757 |
| Total Bank Loans | | 5,328,757 |
| COMMON STOCKS—0.3% | |
| UNITED STATES—0.3% | | |
| California Resources Corp. | | 9,723 | 438,604 |
| Total Common Stocks | | 438,604 |
| WARRANTS—0.2% | |
| UNITED STATES—0.2% | | |
| California Resources Corp.(i) | | 22,363 | 317,555 |
| Total Warrants | | 317,555 |
| SHORT-TERM INVESTMENT—7.9% | |
| State Street Institutional U.S. Government Money Market Fund, Premier Class, 3.01%(j) | | 13,216,294 | 13,216,294 |
| Total Short-Term Investment | | 13,216,294 |
Total Investments
(Cost $379,621,428)(k)—175.7% | | 292,821,026 |
| Liabilities in Excess of Other Assets—(75.7%) | | (126,170,740) |
| Net Assets—100.0% | | $166,650,286 |
| (a) | Denotes a security issued under Regulation S or Rule 144A. |
| (b) | The maturity date presented for these instruments represents the next call/put date. |
| (c) | Illiquid security. |
| (d) | Payment-in-kind security for which part of the income earned may be paid as additional principal. |
| (e) | Security is in default. |
| (f) | Perpetual bond. This is a bond that has no maturity date, is redeemable and pays a steady stream of interest indefinitely. The maturity date presented for these instruments represents the next call/put date. |
| (g) | Variable or Floating Rate security. Rate disclosed is as of October 31, 2022. |
| (h) | Level 3 security. See Note 2(a) of the accompanying Notes to Financial Statements. |
| (i) | Non-income producing security. |
| (j) | Registered investment company advised by State Street Global Advisors. The rate shown is the 7 day yield as of October 31, 2022. |
| (k) | See accompanying Notes to Financial Statements for tax unrealized appreciation/(depreciation) of securities. |
| EUR | Euro Currency |
| GBP | British Pound Sterling |
| PIK | Payment-In-Kind |
| PLC | Public Limited Company |
| USD | U.S. Dollar |
| At October 31, 2022, the Fund held the following forward foreign currency contracts: |
Purchase Contracts
Settlement Date | Counterparty | Amount
Purchased | Amount
Sold | Fair Value | Unrealized
Appreciation/
(Depreciation) |
| Euro/United States Dollar | | | | | |
| 11/29/2022 | Morgan Stanley & Co. | EUR | 1,559,869 | USD | 1,552,798 | $1,544,490 | $(8,308) |
Sale Contracts
Settlement Date | Counterparty | Amount
Purchased | Amount
Sold | Fair Value | Unrealized
Appreciation/
(Depreciation) |
| United States Dollar/British Pound | | | | | |
| 11/29/2022 | Morgan Stanley & Co. | USD | 51,703,589 | GBP | 45,827,000 | $52,593,087 | $(889,498) |
| 11/29/2022 | UBS AG | USD | 3,808,123 | GBP | 3,284,969 | 3,769,975 | 38,148 |
| 10 | abrdn Income Credit Strategies Fund |
Portfolio of Investments (concluded)
As of October 31, 2022
Sale Contracts
Settlement Date | Counterparty | Amount
Purchased | Amount
Sold | Fair Value | Unrealized
Appreciation/
(Depreciation) |
| United States Dollar/Euro | | | | | |
| 11/29/2022 | Morgan Stanley & Co. | USD | 2,893,954 | EUR | 2,898,920 | $ 2,870,339 | $ 23,615 |
| 11/29/2022 | Morgan Stanley & Co. | USD | 89,906,187 | EUR | 91,234,611 | 90,335,087 | (428,900) |
| 11/29/2022 | Royal Bank of Canada (UK) | USD | 3,061,231 | EUR | 3,053,739 | 3,023,630 | 37,601 |
| 11/29/2022 | Royal Bank of Canada (UK) | USD | 579,501 | EUR | 591,000 | 585,173 | (5,672) |
| 11/29/2022 | UBS AG | USD | 7,098,056 | EUR | 7,045,406 | 6,975,942 | 122,114 |
| | $160,153,233 | $(1,102,592) |
| Unrealized appreciation on forward foreign currency exchange contracts | $ 221,478 |
| Unrealized depreciation on forward foreign currency exchange contracts | $(1,332,378) |
See Notes to Financial Statements.
| abrdn Income Credit Strategies Fund | 11 |
Statement of Assets and Liabilities
As of October 31, 2022
| Assets | |
| Investments, at value (cost $366,405,134) | $ 279,604,732 |
| Short-term investments, at value (cost $13,216,294) | 13,216,294 |
| Foreign currency, at value (cost $1,050,216) | 1,053,230 |
| Cash | 107,190 |
| Receivable for investments sold | 64,907 |
| Interest and dividends receivable | 6,294,468 |
| Unrealized appreciation on forward foreign currency exchange contracts | 221,478 |
| Prepaid expenses in connection with stock offering (Note 5) | 38,662 |
| Prepaid expenses in connection with the shelf registration (Note 5) | 59,956 |
| Prepaid expenses | 14,032 |
| Total assets | 300,674,949 |
| Liabilities | |
| Revolving credit facility payable (Note 8) | 88,000,000 |
| Payable for investments purchased | 3,921,733 |
| Unrealized depreciation on forward foreign currency exchange contracts | 1,332,378 |
| Investment advisory fees payable (Note 3) | 308,461 |
| Dividend payable on preferred shares | 175,003 |
| Administration fees payable (Note 3) | 31,234 |
| Investor relations fees payable (Note 3) | 7,642 |
| Other accrued expenses | 248,212 |
| Total liabilities | 94,024,663 |
| Cumulative Preferred Shares, $0.001 par value | |
Series A Mandatory Redeemable Preferred Shares
(5.25%, $25.00 liquidation value per share, 1,600,000 shares outstanding) (Note 7) | 40,000,000 |
| Net Assets Applicable to Common Shareholders | $166,650,286 |
| Composition of Net Assets Attributable to Common Shareholders | |
| Common stock (par value $0.001 per share) (Note 5) | $ 24,817 |
| Paid-in capital in excess of par | 322,693,053 |
| Distributable accumulated loss | (156,067,584) |
| Net Assets | $166,650,286 |
| Net asset value per share based on 24,817,382 common shares issued and outstanding | $ 6.72(a) |
| (a) | The NAV shown above differs from the traded NAV on October 31, 2022 due to financial statement rounding and/or financial statement adjustments. |
See Notes to Financial Statements.
| 12 | abrdn Income Credit Strategies Fund |
Statement of Operations
For the Year Ended October 31, 2022
| Net Investment Income | |
| Investment Income: | |
| Dividends and other income | $ 52,328 |
| Interest income (net of foreign withholding taxes of $25,173) | 28,462,718 |
| Total investment income | 28,515,046 |
| Expenses: | |
| Investment advisory fee (Note 3) | 4,403,179 |
| Administration fee (Note 3) | 440,318 |
| Trustees' fees and expenses | 273,706 |
| Independent auditors’ fees and expenses | 92,001 |
| Investor relations fees and expenses (Note 3) | 89,784 |
| Reports to shareholders and proxy solicitation | 77,993 |
| Legal fees and expenses | 56,092 |
| Transfer agent’s fees and expenses | 29,375 |
| Custodian’s fees and expenses | 22,941 |
| Insurance expense | 21,028 |
| Miscellaneous | 139,981 |
| Total operating expenses, excluding interest expense | 5,646,398 |
| Interest expense and commitment fee on credit facility (Note 8) | 2,512,850 |
| Total operating expenses before reimbursed/waived expenses | 8,159,248 |
| Investment advisor waiver | (519,698) |
| Net expenses | 7,639,550 |
| |
| Net Investment Income | 20,875,496 |
| Net Realized/Unrealized Gain/(Loss) from Investments and Foreign Currency Related Transactions: | |
| Net realized gain/(loss) from: | |
| Investment transactions | (24,301,519) |
| Forward foreign currency exchange contracts | 28,709,888 |
| Foreign currency transactions | (506,341) |
| | 3,902,028 |
| Net change in unrealized appreciation/(depreciation) on: | |
| Investments | (81,883,032) |
| Forward foreign currency exchange contracts | (2,542,771) |
| Foreign currency translation | (76,677) |
| | (84,502,480) |
| Net realized and unrealized loss from investments, forward foreign currency exchange contracts and foreign currencies | (80,600,452) |
| Net Decrease in Net Assets Resulting from Operations | $(59,724,956) |
| Total distributions to preferred shareholders | (2,070,833) |
| Net Increase in Net Assets Attributable to Common Shareholders Resulting from Operations | $(61,795,789) |
See Notes to Financial Statements.
| abrdn Income Credit Strategies Fund | 13 |
Statements of Changes in Net Assets
| | For the
Year Ended
October 31, 2022 | For the
Year Ended
October 31, 2021 |
| Increase/(Decrease) in Net Assets: | | |
| Operations: | | |
| Net investment income | $ 20,875,496 | $ 19,156,686 |
| Net realized gain/(loss) from investments, forward foreign currency exchange contracts and foreign currency transactions | 3,902,028 | 5,376,780 |
| Net change in unrealized appreciation/(depreciation) on investments, forward foreign currency exchange contracts and foreign currency translation | (84,502,480) | 10,453,855 |
| Net increase/(decrease) in net assets applicable to common shareholders resulting from operations | (59,724,956) | 34,987,321 |
| Distributions to Preferred Shareholders from: | | |
| Distributable earnings | (2,070,833) | (1,020,833) |
| Net decrease in net assets from distributions to preferred shareholders | (2,070,833) | (1,020,833) |
| Net decrease in net assets attributable to common shareholders resulting from operations | (61,795,789) | 33,966,488 |
| Distributions to Common Shareholders from: | | |
| Distributable earnings | (28,744,450) | (21,935,079) |
| Tax return of capital | – | (1,313,879) |
| Net decrease in net assets applicable to common shareholders from distributions | (28,744,450) | (23,248,958) |
| Proceeds from the rights offerings resulting in the issuance of 0 and 5,812,247 shares, respectively (net of offering costs of $0 and $529,848, respectively) | – | 57,139,536 |
| Proceeds from at the market stock offering resulting in the issuance of 1,523,512 and 0 shares of common stock, respectively (Note 5) | 13,839,680 | – |
| Expenses in connection with the at-the-market stock offering (Note 5) | (6,284) | – |
| Expenses in connection with the shelf offering (Note 5) | (5,301) | – |
| Reinvestment of dividends resulting in the issuance of 32,025 and 17,502 shares of common stock, respectively | 285,045 | 194,379 |
| Expenses in connection with the issuance of preferred shares | – | (1,845,297) |
| Change in net assets from capital transactions | 14,113,140 | 55,488,618 |
| Change in net assets applicable to common shareholders | (76,427,099) | 66,206,148 |
| Net Assets: | | |
| Beginning of year | 243,077,385 | 176,871,237 |
| End of year | $166,650,286 | $243,077,385 |
Amounts listed as “–” are $0 or round to $0.
See Notes to Financial Statements.
| 14 | abrdn Income Credit Strategies Fund |
Statement of Cash Flows
For the Year Ended October 31, 2022
| Cash flows from operating activities: | |
| Net increase (decrease) in net assets resulting from operations | $ (59,724,956) |
Adjustments to reconcile net increase (decrease) in net assets resulting
from operations to net cash provided by operating activities: | |
| Investments purchased | (225,449,622) |
| Investments sold and principal repayments | 222,487,633 |
| Decrease in short-term investments, excluding foreign government | 2,543,923 |
| Net amortization/accretion of premium (discount) | (1,489,319) |
| Decrease in receivable for common shares sold | 28,845 |
| Decrease in interest and dividends receivable | 1,298,211 |
| Net change unrealized (appreciation) depreciation on forward foreign currency exchange contracts | 2,542,771 |
| Increase in prepaid expenses | (33,897) |
| Decrease in accrued investment management fees payable | (82,578) |
| Increase in other accrued expenses | 14,711 |
| Net change in unrealized depreciation of investments | 81,883,032 |
| Net change unrealized depreciation on forward foreign currency translations | 76,677 |
| Net realized loss on investments transactions | 24,301,519 |
| Net cash provided by operating activities | 48,396,950 |
| Cash flows from financing activities: | |
| Decrease in due to custodian | (532,882) |
| Borrowings on line of credit | 4,000,000 |
| Repayment of revolving credit facility | (34,000,000) |
| Distributions paid to shareholders | (30,815,283) |
| Proceeds from at-the-market stock offering | 13,839,680 |
| Proceeds from reinvestment of dividends | 285,045 |
| Expenses in connection with the at-the-market and shelf offering | (11,585) |
| Net cash used in financing activities | (47,235,025) |
| Effect of exchange rate on cash | (1,505) |
| Net change in cash | 1,160,420 |
| Unrestricted and restricted cash and foreign currency, beginning of year | – |
| Unrestricted and restricted cash and foreign currency, end of year | $ 1,160,420 |
| Supplemental disclosure of cash flow information: | |
| Cash paid for interest and fees on borrowing | $ 2,512,850 |
Amounts listed as “–” are $0 or round to $0.
See Notes to Financial Statements.
| abrdn Income Credit Strategies Fund | 15 |
Financial Highlights
| | For the Fiscal Years Ended October 31, |
| | 2022 | 2021 | 2020 | 2019 | 2018 |
| PER SHARE OPERATING PERFORMANCE(a): | | | | | |
| Net asset value per common share, beginning of year | $10.45 | $10.15 | $12.46 | $14.08 | $15.25 |
| Net investment income | 0.87 | 0.98 | 0.87 | 1.05 | 1.55 |
Net realized and unrealized gains/(losses) on investments, forward foreign
currency exchange contracts and foreign currency transactions | (3.35) | 1.11 | (1.07) | (1.23) | (1.28) |
| Total from investment operations applicable to common shareholders | (2.48) | 2.09 | (0.20) | (0.18) | 0.27 |
| Distributions to preferred shareholders from: | | | | | |
| Net investment income | (0.09) | (0.05) | – | – | – |
Net increase/(decrease) in net assets attributable to
common shareholders resulting from operations | (2.57) | 2.04 | – | – | – |
| Distributions to common shareholders from: | | | | | |
| Net investment income | (1.20) | (1.13) | (0.77) | (1.41) | (1.44) |
| Tax return of capital | – | (0.07) | (0.63) | (0.03) | – |
| Total distributions | (1.20) | (1.20) | (1.40) | (1.44) | (1.44) |
| Capital Share Transactions: | | | | | |
| Offering costs for preferred shares charged to paid-in-capital | – | (0.11) | – | – | – |
| Impact of shelf offering | 0.04 | – | – | – | – |
| Dilutive effect of rights offer (Note 5) | – | (0.43) | (0.71) | – | – |
| Total capital share transactions | 0.04 | (0.54) | – | – | – |
| Net asset value per common share, end of year | $6.72 | $10.45 | $10.15 | $12.46 | $14.08 |
| Market price, end of year | $6.37 | $11.30 | $9.18 | $11.33 | $13.09 |
| Total Investment Return Based on(b): | | | | | |
| Market price | (34.92%) | 37.13% | (6.16%) | (2.48%) | (0.75%) |
| Net asset value | (25.76%)(c) | 14.69% | (5.65%) | (0.29%) | 2.34% |
| Ratio to Average Net Assets Applicable to Common Shareholders/Supplementary Data: | | | | | |
| Net assets including liquidation value of preferred shares, end of year(000 omitted) | $206,650 | $283,077 | $– | $– | $– |
| Net assets applicable to common shareholders, end of year (000 omitted) | $166,650 | $243,077 | $176,871 | $162,939 | $184,028 |
| Average net assets applicable to common shareholders (000 omitted) | $206,720 | $218,990 | $181,152 | $167,302 | $195,965 |
| Net operating expenses, net of fee waivers/recoupments | 3.70% | 2.86% | 3.06% | 3.89% | 3.49% |
| Net operating expenses, excluding fee waivers/recoupments | 3.95% | 3.01% | 3.24% | 4.05% | 3.55% |
Net operating expenses, net of fee waivers/recoupment, excluding
interest expense, commitment fee and loan servicing fees | 2.48% | 2.24% | 2.15% | 2.27% | 2.24% |
| Net Investment income | 10.10% | 8.75% | 8.26% | 8.19% | 10.34% |
| Portfolio turnover | 66% | 63% | 97% | 93% | 103% |
| Senior securities (loan facility) outstanding (000 omitted) | $88,000 | $118,000 | $81,200 | $72,000 | $83,000 |
| Asset coverage ratio on senior securities year end(d) | 335% | 340% | 318% | 326% | 322% |
| Asset coverage per $1000 on senior securities year end | $3,348 | $3,399 | $3,178 | $3,263 | $3,217 See Notes to Financial Statements. |
| 16 | abrdn Income Credit Strategies Fund |
Financial Highlights (concluded)
| | For the Fiscal Years Ended October 31, |
| | 2022 | 2021 | 2020 | 2019 | 2018 |
| Asset coverage ratio on total leverage at year end(e) | 230% | 254% | 318% | 326% | 322% |
| Asset coverage per $1,000 on total leverage at year end | $2,302 | $2,538 | $3,178 | $3,263 | $3,217 |
| (a) | Based on average shares outstanding. |
| (b) | Total investment return based on market value is calculated assuming that shares of the Fund’s common stock were purchased at the closing market price as of the beginning of the period, dividends, capital gains and other distributions were reinvested as provided for in the Fund’s dividend reinvestment plan and then sold at the closing market price per share on the last day of the period. The computation does not reflect any sales commission investors may incur in purchasing or selling shares of the Fund. The total investment return based on the net asset value is similarly computed except that the Fund’s net asset value is substituted for the closing market value. |
| (c) | The total return shown above includes the impact of financial statement rounding of the NAV per share and/or financial statement adjustments. |
| (d) | Asset coverage ratio is calculated by dividing net assets plus the amount of any borrowings, including Series A Perpetual Preferred Shares, for investment purposes by the amount of any senior securities, which includes the revolving credit facility. |
| (e) | Asset coverage ratio is calculated by dividing net assets plus the amount of any borrowings for investment purposes by the amount of any borrowings. |
Amounts listed as “–” are $0 or round to $0.
See Notes to Financial Statements.
| abrdn Income Credit Strategies Fund | 17 |
Notes to Financial Statements
October 31, 2022
1. Organization
abrdn Income Credit Strategies Fund (formerly, Aberdeen Income Credit Strategies Fund) (the “Fund”) is a Delaware statutory trust registered under the Investment Company Act of 1940, as amended (the "1940 Act"), as a closed-end management investment company. The Fund is diversified for purposes of 1940 Act. Pursuant to guidance from the Securities and Exchange Commission, the Fund’s classification changed from a non-diversified fund to a diversified fund. As a result of this classification change, the Fund is limited in the proportion of its assets that may be invested in the securities of a single issuer. The Fund’s primary investment objective is to seek a high level of current income, with a secondary objective of capital appreciation., The Fund commenced operations on January 27, 2011.
2. Summary of Significant Accounting Policies
The Fund is an investment company and accordingly follows the investment company accounting and reporting guidance of the Financial Accounting Standards Board (“FASB”) Accounting Standard Codification Topic 946 Financial Services-Investment Companies. The following is a summary of significant accounting policies followed by the Fund in the preparation of its financial statements. The policies conform to generally accepted accounting principles ("GAAP") in the United States of America. The preparation of financial statements requires management to make estimates and assumptions that affect the reported amounts of assets and liabilities, disclosure of contingent assets and liabilities at the date of the financial statements, and the reported amounts of income and expenses for the period. Actual results could differ from those estimates. The accounting records of the Fund are maintained in U.S. Dollars and the U.S. Dollar is used as both the functional and reporting currency.
a. Security Valuation:
The Fund values its securities at current market value or fair value, consistent with regulatory requirements. "Fair value" is defined in the Fund's Valuation and Liquidity Procedures as the price that could be received to sell an asset or paid to transfer a liability in an orderly transaction between willing market participants without a compulsion to transact at the measurement date. Pursuant to Rule 2a-5 under the 1940 Act, the Board of Trustees (the "Board") designated abrdn Investments Limited (formerly, Aberdeen Asset Managers Limited) (the "Adviser") as the valuation designee ("Valuation Designee") for the Fund to perform the fair value determinations relating to Fund investments for which market quotations are not readily available.
In accordance with the authoritative guidance on fair value measurements and disclosures under GAAP, the Fund discloses the fair value of its investments using a three-level hierarchy that classifies the inputs to valuation techniques used to measure the fair value. The hierarchy assigns Level 1, the highest level, measurements to valuations based upon unadjusted quoted prices in active markets for
identical assets, Level 2 measurements to valuations based upon other significant observable inputs, including adjusted quoted prices in active markets for similar assets, and Level 3, the lowest level, measurements to valuations based upon unobservable inputs that are significant to the valuation. Inputs refer broadly to the assumptions that market participants would use in pricing the asset or liability, including assumptions about risk, for example, the risk inherent in a particular valuation technique used to measure fair value including a pricing model and/or the risk inherent in the inputs to the valuation technique. Inputs may be observable or unobservable. Observable inputs are inputs that reflect the assumptions market participants would use in pricing the asset or liability, which are based on market data obtained from sources independent of the reporting entity. Unobservable inputs are inputs that reflect the reporting entity’s own assumptions about the assumptions market participants would use in pricing the asset or liability developed based on the best information available in the circumstances. A financial instrument’s level within the fair value hierarchy is based upon the lowest level of any input that is significant to the fair value measurement.
Long-term debt and other fixed-income securities are valued at the last quoted or evaluated bid price on the valuation date provided by an independent pricing service provider. If there are no current day bids, the security is valued at the previously applied bid. Pricing services generally price debt securities assuming orderly transactions of an institutional “round lot” size and the strategies employed by the Valuation Designee generally trade in round lot sizes. In certain circumstances, some trades may occur in smaller “odd lot” sizes which may be effected at lower, or higher, prices than institutional round lot trades. Short-term debt securities (such as commercial paper and U.S. treasury bills) having a remaining maturity of 60 days or less are valued at the last quoted or evaluated bid price on the valuation date provided by an independent pricing service, or on the basis of amortized cost, if it represents the best approximation of fair value. Debt and other fixed-income securities are generally determined to be Level 2 investments.
Short-term investments are comprised of cash and cash equivalents invested in short-term investment funds which are redeemable daily. The Fund sweeps available cash into the State Street Institutional U.S. Government Money Market Fund, which has elected to qualify as a “government money market fund” pursuant to Rule 2a-7 under the 1940 Act and has an objective, which is not guaranteed, to maintain a $1.00 per share net asset value (“NAV”). Registered investment companies are valued at their NAV as reported by such company. Generally, these investment types are categorized as Level 1 investments.
Senior loans are valued using an evaluated quote provided by an independent pricing service. Evaluated quotes provided by the pricing service may be determined without exclusive reliance on quoted
| 18 | abrdn Income Credit Strategies Fund |
Notes to Financial Statements (continued)
October 31, 2022
prices, and may reflect appropriate factors such as ratings, tranche type, industry, company performance, spread, individual trading characteristics, institutional-size trading in similar groups of securities and other market data.
Derivative instruments are valued at fair value. Exchange-traded futures are generally Level 1 investments and centrally cleared swaps and forwards are generally Level 2 investments. Forward foreign currency contracts are generally valued based on the bid price of the forward rates and the current spot rate. Forward exchange rate quotations are available for scheduled settlement dates, such as 1-, 3-, 6-, 9- and 12- month periods. An interpolated valuation is derived based on the actual settlement dates of the forward contracts held. Futures contracts are valued at the settlement price or at the last bid price if no settlement price is available. Swap agreements are generally valued by an approved pricing agent based on the terms of the swap agreement (including future cash flows). When market quotations or exchange rates are not readily available, or if the Adviser concludes that such market quotations do not accurately reflect fair value, the fair value of the Fund’s assets are determined in good faith in accordance with the Valuation Procedures.
In the event that a security’s market quotations are not readily available or are deemed unreliable (for reasons other than because the foreign exchange on which it trades closed before the Valuation Time), the security is valued at fair value as determined by the Adviser as Valuation Designee, taking into account the relevant factors and surrounding circumstances using valuation policies and procedures approved by the Board. Under normal circumstances the Valuation Time is as of the close of regular trading on the New York Stock Exchange (usually 4:00 p.m. Eastern Time). A security that has been fair valued by the Adviser may be classified as Level 2 or Level 3 depending on the nature of the inputs.
The three-level hierarchy of inputs is summarized below:
Level 1 - quoted prices in active markets for identical investments;
Level 2 - other significant observable inputs (including quoted prices for similar securities, interest rates, prepayment speeds, and credit risk); or
Level 3 - significant unobservable inputs (including the Fund’s own assumptions in determining the fair value of investments).
A summary of standard inputs is listed below:
| Security Type | Standard Inputs |
| Debt and other fixed-income securities | Reported trade data, broker-dealer price quotations, benchmark yields, issuer spreads on comparable securities, credit quality, yield, and maturity. |
| Forward foreign currency contracts | Forward exchange rate quotations. |
| abrdn Income Credit Strategies Fund | 19 |
Notes to Financial Statements (continued)
October 31, 2022
The following is a summary of the inputs used as of October 31, 2022 in valuing the Fund's investments at fair value. The inputs or methodologies used for valuing securities are not necessarily an indication of the risk associated with investing in those securities. Please refer to the Portfolio of Investments for a detailed breakout of the security types:
| Investments, at Value | Level 1 – Quoted
Prices | Level 2 – Other Significant
Observable Inputs | Level 3 – Significant
Unobservable Inputs | Total |
| Assets | | |
| Investments in Securities | | | |
| Bank Loans | $ – | $ 5,328,757 | $ – | $ 5,328,757 |
| Common Stocks | 438,604 | – | – | 438,604 |
| Corporate Bonds | – | 269,593,138 | 3,926,678 | 273,519,816 |
| Warrants | 317,555 | – | – | 317,555 |
| Short-Term Investment | 13,216,294 | – | – | 13,216,294 |
| Total Investments | $13,972,453 | $274,921,895 | $3,926,678 | $ 292,821,026 |
| Other Financial Instruments | | | |
| Foreign Currency Exchange Contracts | $ – | $ 221,478 | $ – | $ 221,478 |
| Total Assets | $13,972,453 | $275,143,373 | $3,926,678 | $293,042,504 |
| Liabilities | | |
| Other Financial Instruments | | | |
| Foreign Currency Exchange Contracts | $ – | $ (1,332,378) | $ – | $ (1,332,378) |
| Total Liabilities | $ – | $ 1,332,378) | $ – | $ (1,332,378) |
Amounts listed as “–” are $0 or round to $0.
Rollforward of Level 3 Fair Value Measurement
For the Year Ended October 31, 2022 |
Investments
in Securities | Balance
as of
October 31,
2021 | Accrued
Discounts
(Premiums) | Realized
Gain
(Loss) | Change in
Unrealized
Appreciation
(Depreciation) | Net
Purchases | Net
Sales | Net
Transfers
in to
Level 3 | Net
Transfers
out of
Level 3 | Balance
as of
October 31,
2022 | Change in
Unrealized
Appreciation
(Depreciation)
from
Investments
Held at
October 31,
2022 |
| Corporate Bonds | | | | | | | | | |
| United Kingdom | $4,512,120 | $18,937 | $- | $(1,079,849) | $475,470 | $- | $- | $- | $3,926,678 | $(1,079,849) |
| Total | $4,512,120 | $18,937 | $- | $(1,079,849) | $475,470 | $- | $- | $- | $3,926,678 | $(1,079,849) |
For the fiscal year ended October 31, 2022, there were no significant changes to the fair valuation methodologies.
The following is quantitative information about level 3 fair value measurements:
| Description | Fair Value at
10/31/22 | Valuation Technique (s) | Unobservable Inputs | Range | Weighted
Average |
| Corporate Bonds | $3,926,678 | Income Method | Credit Spread | 16.89% | 16.89% |
b. Restricted Securities:
Restricted securities are privately-placed securities whose resale is restricted under U.S. securities laws. The Fund may invest in restricted securities, including unregistered securities eligible for resale without registration pursuant to Rule 144A and privately-placed securities of
U.S. and non-U.S. issuers offered outside the U.S. without registration pursuant to Regulation S under the Securities Act of 1933, as amended (the "1933 Act"). Rule 144A securities may be freely traded among
| 20 | abrdn Income Credit Strategies Fund |
Notes to Financial Statements (continued)
October 31, 2022
certain qualified institutional investors, such as the Fund, but resale of such securities in the U.S. is permitted only in limited circumstances.
c. Foreign Currency Translation:
Foreign securities, currencies, and other assets and liabilities denominated in foreign currencies are translated into U.S. Dollars at the exchange rate of said currencies against the U.S. Dollar, as of the Valuation Time, as provided by an independent pricing service approved by the Board.
Foreign currency amounts are translated into U.S. Dollars on the following basis:
(i) market value of investment securities, other assets and liabilities – at the current daily rates of exchange at the Valuation Time; and
(ii) purchases and sales of investment securities, income and expenses – at the rate of exchange prevailing on the respective dates of such transactions.
The Fund does not isolate that portion of the results of operations arising from changes in the foreign exchange rates due to the fluctuations in the market prices of the securities held at the end of the reporting period. Similarly, the Fund isolates the effect of changes in foreign exchange rates from the fluctuations arising from changes in the market prices of portfolio securities sold during the reporting period.
Net exchange gain/(loss) is realized from sales and maturities of portfolio securities, sales of foreign currencies, settlement of securities transactions, dividends, interest and foreign withholding taxes recorded on the Fund’s books. Net unrealized foreign exchange appreciation/(depreciation) includes changes in the value of portfolio securities and other assets and liabilities arising as a result of changes in the exchange rate. The net realized and unrealized foreign exchange gain/(loss) shown in the composition of net assets represents foreign exchange gain/(loss) for book purposes that may not have been recognized for tax purposes.
Foreign security and currency transactions may involve certain considerations and risks not typically associated with those of domestic origin, including unanticipated movements in the value of the foreign currency relative to the U.S. Dollar. Generally, when the U.S. Dollar rises in value against foreign currency, the Fund’s investments denominated in that foreign currency will lose value because the foreign currency is worth fewer U.S. Dollars; the opposite effect occurs if the U.S. Dollar falls in relative value.
d. Derivative Financial Instruments:
The Fund is authorized to use derivatives to manage currency risk, credit risk, and interest rate risk and to replicate, or use as a substitute for, physical securities. Losses may arise due to changes in the value of the contract or if the counterparty does not perform under the
contract. The use of derivative instruments involves, to varying degrees, elements of market risk in excess of the amount recognized in the Statement of Assets and Liabilities.
Forward Foreign Currency Exchange Contracts
A forward foreign currency exchange contract ("forward contract") involves an obligation to purchase and sell a specific currency at a future date, which may be any fixed number of days from the date of the contract agreed upon by the parties, at a price set at the time of the contract. Forward contracts are used to manage the Fund's currency exposure in an efficient manner. They are used to sell unwanted currency exposure that comes with holding securities in a market, or to buy currency exposure where the exposure from holding securities is insufficient to give the desired currency exposure either in absolute terms or relative to a particular benchmark or index. The use of forward contracts allows for the separation of investment decision-making between foreign exchange holdings and their currencies.
The forward contract is marked-to-market daily and the change in market value is recorded by the Fund as unrealized appreciation or depreciation. Forward contracts' prices are received daily from an independent pricing provider. When the forward contract is closed, the Fund records a realized gain or loss equal to the difference between the value at the time it was opened and the value at the time it was closed. These realized and unrealized gains and losses are reported on the Statement of Operations. The Fund could be exposed to risks if the counterparties to the contracts are unable to meet the terms of their contracts or from unanticipated movements in exchange rates. During the fiscal year ended October 31, 2022, the Fund used forward contracts to hedge its currency exposure.
While the Fund may enter into forward contracts to seek to reduce currency exchange rate risks, transactions in such contracts involve certain risks. The Fund could be exposed to risks if the counterparties to the contracts are unable to meet the terms of their contracts and from unanticipated movements in exchange rates. Thus, while the Fund may benefit from such transactions, unanticipated changes in currency prices may result in a poorer overall performance for the Fund than if it had not engaged in any such transactions. Moreover, there may be imperfect correlation between the Fund’s portfolio holdings or securities quoted or denominated in a particular currency and forward contracts entered into by the Fund. Such imperfect correlation may prevent the Fund from achieving a desired hedge, which will expose the Fund to the risk of foreign exchange loss.
Forward contracts are subject to the risk that a counterparty to a forward contract may default on its obligations. Since a forward foreign currency exchange contract is not guaranteed by an exchange or clearing house, a default on the contract would deprive the Fund of unrealized profits, transaction costs or the benefits of a currency hedge
| abrdn Income Credit Strategies Fund | 21 |
Notes to Financial Statements (continued)
October 31, 2022
or force the Fund to cover its purchase or sale commitments, if any, at the market price at the time of default.
Summary of Derivative Instruments:
The Fund may use derivatives for various purposes as noted above. The following is a summary of the fair value of derivative instruments, not accounted for as hedging instruments, as of October 31, 2022.
| | Risk Exposure Category |
| | Interest
Rate
Contracts | Foreign
Currency
Contracts | Credit
Contracts | Equity
Contracts | Commodity
Contracts | Total |
| |
| Assets: |
| Unrealized appreciation on: |
| Forward Foreign Currency Exchange Contracts | $– | $ 221,478 | $– | $– | $– | $ 221,478 |
| Total | $– | $ 221,478 | $– | $– | $– | $ 221,478 |
| Liabilities: |
| Unrealized depreciation on: |
| Forward Foreign Currency Exchange Contracts | $– | $ 1,332,378 | $– | $– | $– | $ 1,332,378 |
| Total | $– | $1,332,378 | $– | $– | $– | $1,332,378 |
Amounts listed as “–” are $0 or round to $0.
The Fund has transactions that may be subject to enforceable master netting agreements. A reconciliation of the gross amounts on the Statement of Assets and Liabilities as of October 31, 2022 to the net amounts by broker and derivative type, including any collateral received or pledged, is included in the following tables:
| | |
| | | Gross Amounts Not Offset
in the Statement of
Assets and Liabilities | | Gross Amounts Not Offset
in the Statement of
Assets and Liabilities |
| | Gross Amounts
of Assets
Presented in
Statement of
Assets and
Liabilities | Financial
Instruments | Collateral
Received | Net
Amount | Gross Amounts
of Liabilities
Presented in
Statement of
Assets and
Liabilities | Financial
Instruments | Collateral
Pledged | Net
Amount |
| Description | Assets | Liabilities |
| Foreign Currency Exchange Contracts |
| Morgan Stanley & Co. | $23,615 | $(23,615) | $– | $– | $1,326,706 | $(23,615) | $– | $1,303,091 |
| Royal Bank of Canada (UK) | 37,601 | (5,672) | – | 31,929 | 5,672 | (5,672) | – | – |
| UBS AG | 160,262 | – | – | 160,262 | – | – | – | – |
Amounts listed as “–” are $0 or round to $0.
| 22 | abrdn Income Credit Strategies Fund |
Notes to Financial Statements (continued)
October 31, 2022
The effect of derivative instruments on the Statement of Operations for the fiscal year ended October 31, 2022:
| | Risk Exposure Category |
| | Interest
Rate
Contracts | Foreign
Currency
Contracts | Credit
Contracts | Equity
Contracts | Commodity
Contracts | Total |
| |
Realized Gain (Loss) on Derivatives Recognized
as a Result of Operations: |
| Net realized gain (loss) on: |
| Forward Currency Contracts | $– | $ 28,709,888 | $– | $– | $– | $ 28,709,888 |
| Total | $– | $28,709,888 | $– | $– | $– | $28,709,888 |
Net Change in Unrealized Appreciation (Depreciation) on
Derivatives Recognized as a Result of Operations: |
| Net change in unrealized appreciation (depreciation) of: |
| Forward Currency Contracts | $– | $ (2,542,771) | $– | $– | $– | $ (2,542,771) |
| Total | $– | $ (2,542,771) | $– | $– | $– | $ (2,542,771) |
Amounts listed as “–” are $0 or round to $0.
Information about derivatives reflected as of the date of this report is generally indicative of the type of activity for the fiscal year ended October 31, 2022. The table below summarizes the weighted average values of derivatives holdings for the Fund during the fiscal year ended October 31, 2022.
| Derivative | Average
Notional Value |
| Foreign Currency Contracts Purchased | $ 4,703,563 |
| Foreign Currency Contracts Sold | $158,009,043 |
The Fund values derivatives at fair value, as described in the Statement of Operations. Accordingly, the Fund does not follow hedge accounting even for derivatives employed as economic hedges.
e. Bank Loans:
The Fund may invest in bank loans. Bank loans include floating and fixed-rate debt obligations. Floating rate loans are debt obligations issued by companies or other entities with floating interest rates that reset periodically. Bank loans may include, but are not limited to, term loans, delayed funding loans, bridge loans and revolving credit facilities. Loan interest will primarily take the form of assignments purchased in the primary or secondary market but may include participations. Floating rate loans are secured by specific collateral of the borrower and are senior to most other securities of the borrower (e.g., common stock or debt instruments) in the event of bankruptcy. Floating rate loans are often issued in connection with recapitalizations, acquisitions, leveraged buyouts, and refinancings. Floating rate loans are typically structured and administered by a financial institution that acts as the agent of the lenders participating in the floating rate loan. Floating rate loans may be acquired directly through the agent, as an assignment from another lender who holds a direct
interest in the floating rate loan, or as a participation interest in another lender’s portion of the floating rate loan.
The Fund may also enter into, or acquire participations in, delayed funding loans and revolving credit facilities. Delayed funding loans and revolving credit facilities are borrowings in which the Fund agrees to make loans up to a maximum amount upon demand by the borrowing issuer for a specified term. A revolving credit facility differs from a delayed funding loan in that as the borrowing issuer repays the loan, an amount equal to the repayment is again made available to the borrowing issuer under the facility. The borrowing issuer may at any time borrow and repay amounts so long as, in the aggregate, at any given time the amount borrowed does not exceed the maximum amount established by the loan agreement. Delayed funding loans and revolving credit facilities usually provide for floating or variable rates of interest.
See “Bank Loan Risk” under “Portfolio Investment Risks” for information regarding the risks associated with an investment in bank loans.
f. Security Transactions, Investment Income and Expenses:
Security transactions are recorded on the trade date. Realized and unrealized gains/(losses) from security and foreign currency transactions are calculated on the identified cost basis. Interest income and expenses are recorded on an accrual basis. Discounts and premiums on securities purchased are accreted or amortized on an effective yield basis over the estimated lives of the respective securities. Dividend income and corporate actions are recorded generally on the ex-date, except for certain dividends and corporate
| abrdn Income Credit Strategies Fund | 23 |
Notes to Financial Statements (continued)
October 31, 2022
actions which may be recorded after the ex-date, as soon as the Fund acquires information regarding such dividends or corporate actions.
g. Distributions:
The Fund intends to make regular monthly distributions of net investment income to holders of Common Shares. The Fund expects to pay its Common Shareholders annually all or substantially all of its investment company taxable income. In addition, at least annually, the Fund intends to distribute all or substantially all of its net capital gains, if any. Distributions from net realized gains for book purposes may include short-term capital gains which are ordinary income for tax purposes. Distributions to Common Shareholders are recorded on the ex-dividend date.
Dividends and distributions to shareholders are determined in accordance with federal income tax regulations, which may differ from GAAP. These book basis/tax basis differences are either considered temporary or permanent in nature. To the extent these differences are permanent in nature, such amounts are reclassified within the capital accounts based on their federal income tax treatment. Temporary differences do not require reclassification. Dividends and distributions which exceed net investment income and net realized capital gains for tax purposes are reported as return of capital.
h. Federal Income Taxes:
The Fund intends to continue to qualify as a “regulated investment company” (RIC) by complying with the provisions available to certain investment companies, as defined in Subchapter M of the Internal Revenue Code of 1986, as amended, and to make distributions of net investment income and net realized capital gains sufficient to relieve the Fund from all federal income taxes. Therefore, no federal income tax provision is required.
The Fund recognizes the tax benefits of uncertain tax positions only where the position is “more likely than not” to be sustained assuming examination by tax authorities. Management of the Fund has concluded that there are no significant uncertain tax positions that would require recognition in the financial statements. Since tax authorities can examine previously filed tax returns, the Fund's U.S. federal and state tax returns for each of the most recent four fiscal years up to the most recent fiscal year ended October 31, 2022 are subject to such review.
i. Rights Issues and Warrants:
Rights issues give the right, normally to existing stockholders, to buy a proportional number of additional securities at a given price (generally at a discount) within a fixed period (generally a short-term period) and are offered at the company’s discretion. Warrants are securities that give the holder the right to buy common stock at a specified price for a specified period of time. Rights issues and warrants are speculative and have no value if they are not exercised before the expiration date.
Rights issues and warrants are valued at the last sale price on the exchange on which they are traded.
j. Foreign Withholding Tax:
Dividend and interest income from non-U.S. sources received by the Fund are generally subject to non-U.S. withholding taxes. In addition, the Fund may be subject to capital gains tax in certain countries in which it invests. The above taxes may be reduced or eliminated under the terms of applicable U.S. income tax treaties with some of these countries. The Fund accrues such taxes when the related income is earned.
In addition, when the Fund sells securities within certain countries in which it invests, the capital gains realized may be subject to tax. Based on these market requirements and as required under GAAP, the Fund accrues deferred capital gains tax on securities currently held that have unrealized appreciation within these countries. The amount of deferred capital gains tax accrued is reported on the Statement of Operations as part of the Net Change in Unrealized Appreciation/Depreciation on Investments.
k. Cash Flow Information:
The Fund invests in securities and distributes dividends from net investment income and net realized gains on investment and currency transactions which are paid in cash or are reinvested at the discretion of shareholders. These activities are reported in the Statements of Changes in Net Assets and additional information on cash receipts and cash payments is presented in the Statement of Cash Flows. Cash includes domestic and foreign currency as well as cash in segregated accounts for forward foreign currency contracts which has been designated as collateral.
l. Unfunded Loan Commitments:
The Fund may enter into certain credit agreements all or a portion of which may be unfunded. The Fund is obligated to fund these commitments at the borrower’s discretion. These commitments are disclosed in the accompanying Schedule of Investments. At October 31, 2022 the Fund did not hold any unfunded loan commitments.
m. Payment-In-Kind:
The Fund may invest in the open market or receive pursuant to debt restructuring, securities that pay-in-kind (PIK) the interest due on such debt instruments. The PIK interest, computed at the contractual rate specified, is added to the existing principal balance of the debt when issued bonds have same terms as the bond or recorded as a separate bond when terms are different from the existing debt, and is recorded as interest income.
| 24 | abrdn Income Credit Strategies Fund |
Notes to Financial Statements (continued)
October 31, 2022
3. Agreements and Transactions with Affiliates
a. Investment Adviser:
abrdn Investments Limited serves as investment adviser to the Fund and abrdn, Inc ("abrdn Inc." or the "Sub-Adviser") serves as the sub-adviser, pursuant to an investment advisory agreement and a sub-advisory agreement, respectively. The Adviser and the Sub-Adviser (collectively, the “Advisers”) are indirect wholly-owned subsidiaries of abrdn plc (“abrdn plc”), formerly known as Standard Life Aberdeen plc. In rendering advisory services, the Advisers may use the resources of investment advisor subsidiaries of abrdn plc. These affiliates have entered into procedures pursuant to which investment professionals from affiliates may render portfolio management and research services as associated persons of the Advisers.
For its services, the Adviser receives fees at an annual rate of: (i) 1.25% of the Fund’s average daily Managed Assets. Managed Assets is defined in the investment advisory agreement as total assets of the Fund (including any assets attributable to money borrowed for investment purposes, including proceeds from (and assets subject to) reverse repurchase agreements, any credit facility and any issuance of preferred shares or notes) minus the sum of the Fund’s accrued liabilities (other than Fund liabilities incurred for the purpose of leverage). For the fiscal year ended October 31, 2022, the Adviser earned a gross advisory fee of $4,403,179.
Effective December 1, 2019, the Adviser has contractually agreed to further limit total "Other Expenses" (excluding any interest, taxes, brokerage fees, short sale dividend and interest expenses and non-routine expenses) as a percentage of net assets attributable to Common Shares of the Fund to 0.35% of the average daily net assets of the Fund. This limit will be in effect at least through October 31, 2024. Through October 31, 2022, the Adviser waived and assumed a total of $(519,698) of the Fund’s other expenses. The Adviser may request and receive reimbursement of the advisory fees waived and other expenses reimbursed pursuant to the Expense Limitation Agreement as of a date not more than three years after the date when the Adviser limited the fees or reimbursed the expenses; provided that the following requirements are met: the reimbursements do not cause the Fund to exceed the lesser of the applicable expense limitation in the contract at the time the fees were limited or expenses are paid or the applicable expense limitation in effect at the time the expenses are being recouped by the Adviser (the "Reimbursement Requirements").
As of October 31, 2022, to the extent the Reimbursement Requirements are met, the cumulative potential reimbursements to the Adviser for the Fund, based on expenses reimbursed by the Adviser, including adjustments described above, would be:
| Amount Fiscal Year 2020 (Expires 10/31/23) | | $ 335,688 |
| Amount Fiscal Year 2021 (Expires 10/31/24) | | $ 332,380 |
| Amount Fiscal Year 2022 (Expires 10/31/25) | | $ 519,698 |
| Total* | | $1,187,766 |
| * | Amounts reported are due to expire throughout the respective 3-year expiration period presented above. |
b. Fund Administrator:
abrdn Inc. is the Fund’s Administrator, pursuant to an agreement under which abrdn Inc. receives a fee, payable monthly by the Fund, at an annual fee rate of 0.125% of the Fund’s average weekly Managed Assets up to $1 billion, 0.10% of the Fund’s average weekly Managed Assets between $1 billion and $2 billion, and 0.075% of the Fund’s average weekly Managed Assets in excess of $2 billion. For the fiscal year ended October 31, 2022, abrdn Inc. earned $440,318 from the Fund for administration services.
c. Investor Relations:
Under the terms of the Investor Relations Services Agreement approved by the Fund’s Board on June 12, 2018, abrdn Inc. provides and pays third parties to provide investor relations services to the Fund and certain other funds advised by the Adviser or its affiliates as part of an Investor Relations Program. Under the Investor Relations Services Agreement, the Fund owes a portion of the fees related to the Investor Relations Program (the “Fund’s Portion”). However, investor relations services fees are limited by abrdn Inc. so that the Fund will only pay up to an annual rate of 0.05% of the Fund’s average weekly net assets. Any difference between the capped rate of 0.05% of the Fund’s average weekly net assets and the Fund’s Portion is paid for by abrdn Inc.
Pursuant to the terms of the Investor Relations Services Agreement, abrdn Inc. (or third parties engaged by abrdn Inc.), among other things, provides objective and timely information to stockholders based on publicly available information; provides information efficiently through the use of technology while offering stockholders immediate access to knowledgeable investor relations representatives; develops and maintains effective communications with investment professionals from a wide variety of firms; creates and maintains investor relations communication materials such as fund manager interviews, films and webcasts, publishes white papers, magazine articles and other relevant materials discussing the Fund’s investment results, portfolio positioning and outlook; develops and maintains effective communications with large institutional shareholders; responds to specific shareholder questions; and reports activities and results to the Board and management detailing insight into general shareholder sentiment.
During the fiscal year ended October 31, 2022, the Fund incurred investor relations fees of approximately $89,784. For the fiscal year
| abrdn Income Credit Strategies Fund | 25 |
Notes to Financial Statements (continued)
October 31, 2022
ended October 31, 2022, abrdn Inc. did not contribute to the investor relations fees for the Fund because the Fund’s contribution was below 0.05% of the Fund’s average weekly net assets on an annual basis.
d. Purchase/Sale Transactions Between Affiliates:
The Fund is permitted to buy or sell securities with funds that have a common investment adviser (or investment advisers which are affiliates) under specific procedures which have been approved by the Board. The procedures are designed to satisfy the requirements of Rule 17a-7 of the 1940 Act (“Rule 17a-7”). During the fiscal year ended October 31, 2022, the Fund did not engage in any of these trades.
4. Investment Transactions
Purchases and sales of investment securities (excluding short-term securities) for the fiscal year ended October 31, 2022, were $221,154,390 and $219,315,248, respectively.
5. Capital
The Fund is authorized to issue an unlimited number of common shares of beneficial interest at par value $0.001 per common share. As of October 31, 2022, there were 24,817,382 shares of common stock issued and outstanding.
On February 11, 2022, the Fund entered into a distribution agreement (the “Distribution Agreement”) with ALPS Distributors, Inc. (“ALPS”), pursuant to which the Fund may offer and sell up to $100,000,000 of common shares of beneficial interest, par value $0.001 per share (“Common Shares”), from time to time through ALPS, in transactions deemed to be “at the market” as defined in Rule 415 under the Securities Act of 1933, as amended (the “ATM Offering”). Under the Investment Company Act of 1940, as amended, the Fund may not sell any Common Shares at a price below the current net asset value of such common shares, exclusive of any distributing commission or discount.
Pursuant to the Distribution Agreement, ALPS may enter into subplacement agent agreements with one or more selected dealers. ALPS has entered into a sub-placement agent agreement, dated February 11, 2022 (the “Sub-Placement Agent Agreement”), with UBS Securities LLC (“UBS”) relating to the Common Shares to be offered under the Distribution Agreement.
The ATM Offering is being made pursuant a prospectus supplement, dated February 11, 2022 and the accompanying prospectus, dated April 27, 2021, each of which constitute part of the Fund’s Registration Statement (defined above). On February 11, 2022, the Fund commenced the ATM Offering pursuant to the Fund’s Registration Statement.
During the fiscal year ended October 31, 2022, shares of common stock were sold under this agreement for $13,839,680 (net of
commissions of $111,842). The associated offering costs with this ATM Offering are approximately $44,946 of which $6,284 were charged to paid-in-capital upon the issuance of associated shares.
On May 20, 2021, the Fund commenced a transferable rights offering to shareholders of record on May 20, 2021 ("2021 Rights Offer") to subscribe for up to an aggregate of 5,812,247 common shares. The 2021 Rights Offer expired on June 16, 2021 (expiration date). Each record date shareholder received one right for each outstanding common share held, which entitled such shareholder to purchase one new Fund common share for every three rights held. The 2021 Rights Offer was over-subscribed. The subscription price on the expiration date pursuant to the 2021 Rights Offer was $10.20 per common share of the Fund, and was calculated based on a formula equal to 92.5% of the average of the last reported sales price of a common share of the Fund on the New York Stock Exchange on the expiration date of the 2021 Rights Offer and on each of the four preceding trading days. Rights holders exercised their rights to purchase 5,812,247 common shares. The Fund received the proceeds of the 2021 Rights Offer, minus the dealer manager fee and other expenses of the 2021 Rights Offer, with the Fund's net proceeds totaling $57,139,536.
Offering costs incurred through October 31, 2022 as a result of the Fund’s Registration Statement initially effective with the SEC on April 27, 2021 are approximately $113,754. The Fund’s ATM Offering, 2021 Right Offer and the Preferred Shares Offering were made under this Registration Statement and associated offering costs were capitalized at the time of share issuance. The Statement of Assets and Liabilities reflects the remaining offering costs of $59,956 as deferred offering costs. These offering costs will be charged to paid-in-capital upon the issuance of shares.
Additional shares of the Fund may be issued under certain circumstances, including pursuant to the Fund's Dividend Reinvestment and Optional Cash Purchase Plan. Additional information concerning the Automatic Dividend Reinvestment Plan is included within this report.
6. Open Market Repurchase Program
The Fund’s Board approved an open market repurchase and discount management policy (the “Program”). The Program allows the Fund to purchase, in the open market, its outstanding common shares, with the amount and timing of any repurchase determined at the discretion of the Fund’s investment adviser. Such purchases may be made opportunistically at certain discounts to net asset value per share in the reasonable judgment of management based on historical discount levels and current market conditions.
On a quarterly basis, the Fund’s Board will receive information on any transactions made pursuant to this policy during the prior quarter and management will post the number of shares repurchased on the Fund’s
| 26 | abrdn Income Credit Strategies Fund |
Notes to Financial Statements (continued)
October 31, 2022
website on a monthly basis. Under the terms of the Program, the Fund is permitted to repurchase up to 10% of its outstanding shares of common stock in the open market during any 12 month period.
7. Preferred Shares
On May 3, 2021, the Fund entered into an underwriting agreement by and among the Fund, the Adviser and Sub-Adviser, and UBS Securities LLC (“UBS”), as the underwriter representative, in connection with the issuance and sale of 1,600,000 shares of the Fund’s 5.250% Series A Perpetual Preferred Shares, par value $0.001 per share (the “Preferred Shares”) at a price to the public of $25.00 per Common Share (the “Preferred Shares Offering”).
The Preferred Shares Offering was made pursuant to a prospectus supplement, dated May 3, 2021 and the accompanying prospectus, dated April 27, 2021, each of which constitute part of the Fund’s effective shelf registration statement on Form N-2 (File No. 333-253698) previously filed with the Securities and Exchange Commission (the “Registration Statement”).
In connection with the Preferred Shares Offering, the Fund entered into an amendment, effective as of May 10, 2021, to the Transfer Agency and Service Agreement with Computershare Trust Company, N.A. and Computershare Inc. to provide services with respect to the Preferred Shares.
The Preferred Shares Offering, priced at $25 per share, resulted in net proceeds to the Fund of approximately $38.2 million after payment of underwriting discounts and commissions and estimated offering expenses payable by the Fund. The Fund applied to list the Preferred Shares on the NYSE under the ticker symbol “ACP PRA”. The Preferred Shares will have a liquidation preference of $25.00 per share, plus accumulated and unpaid dividends The shares have been assigned an A2 rating by Moody’s Investors Service.
The Preferred Shares will rank senior to the Fund’s Common Shares in priority of payment of dividends and as to the distribution of assets upon dissolution, liquidation or winding up of the Fund’s affairs; equal in priority with all other future series of preferred shares the Fund may issue as to priority of payment of dividends and as to distributions of assets upon dissolution, liquidation or the winding-up of the Fund’s affairs; and subordinate in right of payment to amounts owed under the Fund’s existing Credit Facility, and to the holder of any future senior Indebtedness, which may be issued without the vote or consent of preferred shareholders.
Holders of the Series A Perpetual Preferred Shares are entitled to receive quarterly cumulative cash dividend payments at a rate of 5.250%. Dividends and distributions on the Preferred Shares will accumulate from the date of their original issue. Dividends and distributions will be paid quarterly on March 31, June 30, September 30 and December 31 in each year (or, in each case, if such date is not a
business day, the next succeeding business day), commencing on June 30, 2021. Distributions are accrued daily and paid quarterly and are presented in the Statement of Assets and Liabilities as a dividend payable to preferred shareholders.
If the Fund fails to have asset coverage of at least 200% with respect to its preferred shares of beneficial interest (including Preferred Shares) (collectively, "preferred shares") as of the close of business on the last business day of each calendar quarter, and such failure is not cured as of the close of business on the date that is 30 calendar days following such business day (the "Asset Coverage Cure Date"), the Fund will fix a redemption date and proceed to redeem the number of preferred shares, including Preferred Shares, as described below at (in the case of Preferred Shares) a price per share equal to the $25.00 per share liquidation preference plus accumulated but unpaid dividends and distributions thereon (whether or not earned or declared but excluding interest thereon) through the date fixed for redemption by the Board.
Prior to June 30, 2026, the Preferred Shares are not subject to optional redemption by the Fund unless the redemption is necessary, in the judgment of the Board, to maintain the Fund's status as a RIC under Subchapter M of the Internal Revenue Code of 1986. On or after June 30, 2026 (any such date, an "Optional Redemption Date"), the Fund may redeem in whole or from time to time in part outstanding Preferred Shares at a redemption price per share equal to the $25.00 per share liquidation preference plus an amount equal to all unpaid dividends and distributions accumulated through the Optional Redemption Date (whether or not earned or declared by the Fund, but excluding interest thereon).
Except for matters that do not require the vote of holders of Preferred Shares under the 1940 Act and except as otherwise provided in the Fund's Governing Documents, or as otherwise required by applicable law, each holder of Preferred Shares will be entitled to one vote for each Preferred Share held by such holder on each matter submitted to a vote of shareholders of the Fund. Except as otherwise provided herein or in the Statement of Preferences, the holders of outstanding preferred shares, including the Preferred Shares, will vote together with holders of the Fund's Common Shares as a single class.
8. Revolving Credit Facility
On November 23, 2022, the Fund’s senior secured 364-day revolving credit facility with BNP Paribas was amended to extend the scheduled commitment termination date to November 22, 2023 with a committed facility amount of $130,000,000. The Fund’s outstanding balance as of October 31, 2021 was $118,000,000 on the Revolving Credit Facility. During the fiscal period, the Fund paid down a net $30,000,000. The Fund’s outstanding balance as of October 31, 2022 was $88,000,000. The average interest rate on the loan facility was 2.34%. Under the terms of the loan facility and applicable regulations, the Fund is required to maintain certain asset coverage ratios for the
| abrdn Income Credit Strategies Fund | 27 |
Notes to Financial Statements (continued)
October 31, 2022
amount of its outstanding borrowings. The Board regularly reviews the use of leverage by the Fund. A more detailed description of the Fund’s leverage can be found in the Report of the Investment Adviser and the Notes to Financial Statements. The average balance for the fiscal year ended October 31, 2022 was $104,893,151. Under the revolving credit facility, the Fund is charged interest on amounts borrowed at variable rate, which may be based on the Secured Overnight Financing Rate plus a spread. The interest expense is accrued on a daily basis and is payable to The BNP Paribas on a monthly basis.
The amounts borrowed from the loan facility may be invested to return higher rates than the rates in the Fund’s portfolio. However, the cost of leverage could exceed the income earned by the Fund on the proceeds of such leverage. To the extent that the Fund is unable to invest the proceeds from the use of leverage in assets which pay interest at a rate which exceeds the rate paid on the leverage, the yield on the Fund’s common stock will decrease. In addition, in the event of a general market decline in the value of assets in which the Fund invests, the effect of that decline will be magnified in the Fund because of the additional assets purchased with the proceeds of the leverage. Non-recurring expenses in connection with the implementation of the loan facility will reduce the Fund’s performance.
The Fund may use leverage to the maximum extent permitted by the 1940 Act, which permits leverage to exceed 33.33% of the Fund's total assets (including the amount obtained through leverage) in certain market conditions. The Fund’s leveraged capital structure creates special risks not associated with unleveraged funds having similar investment objectives and policies. The funds borrowed pursuant to the loan facility may constitute a substantial lien and burden by reason of their prior claim against the income of the Fund and against the net assets of the Fund in liquidation. The Fund is not permitted to declare dividends or other distributions in the event of default under the loan facility. In the event of default under the loan facility, the lender has the right to cause a liquidation of the collateral (i.e., sell portfolio securities and other assets of the Fund) and, if any such default is not cured, the lender may be able to control the liquidation as well. A liquidation of the Fund’s collateral assets in an event of default, or a voluntary paydown of the loan facility in order to avoid an event of default, would typically involve administrative expenses and sometimes penalties. Additionally, such liquidations often involve selling off of portions of the Fund’s assets at inopportune times which can result in losses when markets are unfavorable. The loan facility has a term of 364 days and is not a perpetual form of leverage; there can be no assurance that the loan facility will be available for renewal on acceptable terms, if at all.
The credit agreement governing the loan facility includes usual and customary covenants for this type of transaction. These covenants impose on the Fund asset coverage requirements, Fund composition requirements and limits on certain investments, such as illiquid
investments, which are more stringent than those imposed on the Fund by the 1940 Act. The covenants or guidelines could impede the Adviser or Sub-Adviser from fully managing the Fund’s portfolio in accordance with the Fund’s investment objective and policies. Furthermore, non-compliance with such covenants or the occurrence of other events could lead to the cancellation of the loan facility. The covenants also include a requirement that the Fund maintain net assets of no less than $100,000,000.
9. Portfolio Investment Risks
a. Bank Loan Risk:
There are a number of risks associated with an investment in bank loans including credit risk, interest rate risk, illiquid securities risk, and prepayment risk. There is also the possibility that the collateral securing a loan, if any, may be difficult to liquidate or be insufficient to cover the amount owed under the loan. These risks could cause the Fund to lose income or principal on a particular investment, which in turn could affect the Fund’s returns. In addition, bank loans may settle on a delayed basis, resulting in the proceeds from the sale of such loans not being readily available to make additional investments or distributions. To the extent the extended settlement process gives rise to short-term liquidity needs, the Fund may hold additional cash, sell investments or temporarily borrow from banks or other lenders.
b. Credit and Market Risk:
A debt instrument’s price depends, in part, on the credit quality of the issuer, borrower, counterparty, or underlying collateral and can decline in response to changes in the financial condition of the issuer, borrower, counterparty, or underlying collateral, or changes in specific or general market, economic, industry, political, regulatory, geopolitical, or other conditions. Funds that invest in high yield and emerging market instruments are subject to certain additional credit and market risks. The yields of high yield and emerging market debt obligations reflect, among other things, perceived credit risk. The Fund's investments in securities rated below investment grade typically involve risks not associated with higher rated securities including, among others, greater risk of not receiving timely and/or ultimate payment of interest and principal, greater market price volatility, and less liquid secondary market trading.
c. Emerging Markets Risk:
Investing in the securities of issuers operating in emerging markets involves a high degree of risk and special considerations not typically associated with investing in the securities of other foreign or U.S. issuers. Compared to the United States and other developed countries, emerging market countries may have relatively unstable governments, economies based on only a few industries and securities markets that trade a small number of securities. Securities issued by companies or governments located in emerging market countries tend
| 28 | abrdn Income Credit Strategies Fund |
Notes to Financial Statements (continued)
October 31, 2022
to be especially volatile and may be less liquid than securities traded in developed countries. Securities in these countries have been characterized by greater potential loss than securities of companies and governments located in developed countries. Investments in the securities of issuers located in emerging markets could be affected by risks associated with expropriation and/or nationalization, political or social instability, pervasiveness of corruption and crime, armed conflict, the impact on the economy of civil war, religious or ethnic unrest and the withdrawal or non-renewal of any license enabling the Fund to trade in securities of a particular country, confiscatory taxation, restrictions on transfers of assets, lack of uniform accounting and auditing standards, less publicly available financial and other information, diplomatic development which could affect U.S. investments in those countries, and potential difficulties in enforcing contractual obligations.
Russia/Ukraine Risk. In February 2022, Russia commenced a military attack on Ukraine. The outbreak of hostilities between the two countries and the threat of wider spread hostilities could have a severe adverse effect on the region and global economies, including significant negative impacts on the markets for certain securities and commodities, such as oil and natural gas. In addition, sanctions imposed on Russia by the United States and other countries, and any sanctions imposed in the future, could have a significant adverse impact on the Russian economy and related markets. The price and liquidity of investments may fluctuate widely as a result of the conflict and related events. How long the armed conflict and related events will last cannot be predicted. These tensions and any related events could have a significant impact on Fund performance and the value of the Funds’ investments.
d. High-Yield Bonds and Other Lower-Rated Securities Risk:
The Fund’s investments in high-yield bonds (commonly referred to as “junk bonds”) and other lower-rated securities will subject the Fund to substantial risk of loss. Investments in high-yield bonds are speculative and issuers of these securities are generally considered to be less financially secure and less able to repay interest and principal than issuers of investment-grade securities. Prices of high-yield bonds tend to be very volatile. These securities are less liquid than investment-grade debt securities and may be difficult to price or sell, particularly in times of negative sentiment toward high-yield securities.
e. Interest Rate Risk:
The prices of fixed income securities respond to economic developments, particularly interest rate changes, as well as to perceptions about the creditworthiness of individual issuers, including
governments. Generally, the Fund’s fixed income securities will decrease in value if interest rates rise and vice versa, and the volatility of lower rated securities is even greater than that of higher-rated securities. Also, longer-term securities are generally more volatile, so the average maturity or duration of these securities affects risk.
The Fund may be subject to a greater risk of rising interest rates due to current interest rate environment and the effect of potential government fiscal policy initiatives and resulting market reaction to those initiatives.
f. Risks Associated with Foreign Securities and Currencies:
Investments in securities of foreign issuers carry certain risks not ordinarily associated with investments in securities of U.S. issuers. These risks include future political and economic developments, and the possible imposition of exchange controls or other foreign governmental laws and restrictions. In addition, with respect to certain countries, there is the possibility of expropriation of assets, confiscatory taxation, and political or social instability or diplomatic developments, which could adversely affect investments in those countries.
Certain countries also may impose substantial restrictions on investments in their capital markets by foreign entities, including restrictions on investments in issuers of industries deemed sensitive to relevant national interests. These factors may limit the investment opportunities available and result in a lack of liquidity and high price volatility with respect to securities of issuers from developing countries. Foreign securities may also be harder to price than U.S. securities.
The value of foreign currencies relative to the U.S. Dollar fluctuates in response to market, economic, political, regulatory, geopolitical or other conditions. A decline in the value of a foreign currency versus the U.S. Dollar reduces the value in U.S. Dollars of investments denominated in that foreign currency. This risk may impact the Fund more greatly to the extent the Fund does not hedge its currency risk, or hedging techniques used by the Advisers are unsuccessful.
10. Contingencies
In the normal course of business, the Fund may provide general indemnifications pursuant to certain contracts and organizational documents. The Fund's maximum exposure under these arrangements is dependent on future claims that may be made against the Fund, and therefore, cannot be estimated; however, the Fund expects the risk of loss from such claims to be remote.
| abrdn Income Credit Strategies Fund | 29 |
Notes to Financial Statements (continued)
October 31, 2022
11. Tax Information
The U.S. federal income tax basis of the Fund’s investments (including derivatives, if applicable) and the net unrealized depreciation as of October 31, 2022, were as follows:
Tax Cost of
Securities | Unrealized
Appreciation | Unrealized
Depreciation | Net
Unrealized
Appreciation/
(Depreciation) |
| $380,412,612 | $6,366,032 | $(93,957,618) | $(87,591,586) |
The tax character of distributions paid during the fiscal years ended October 31, 2022 and October 31, 2021 was as follows:
| | October 31, 2022 | October 31, 2021 |
| | Common | Preferred | Common | Preferred |
| Distributions paid from: | | | | |
| Ordinary Income | $ 28,744,450 | $ 2,070,833 | $ 21,935,079 | $ 1,020,833 |
| Net long-term capital gains | — | — | — | — |
| Tax return of capital | — | — | 1,313,879 | — |
| Total tax character of distributions | $28,744,450 | $2,070,833 | $23,248,958 | $1,020,833 |
Amounts listed as “–” are $0 or round to $0.
As of October 31, 2022, the components of accumulated earnings on a tax basis were as follows:
| Undistributed Ordinary Income | $ 15,078,133 |
| Undistributed Long-Term Capital Gains | - |
| Total undistributed earnings | $ 15,078,133 |
| Capital loss carryforward | $ (82,382,140)* |
| Other currency gains | — |
| Other Temporary Differences | (828,851) |
| Unrealized Appreciation/(Depreciation) | (87,912,284)** |
| Total accumulated earnings/(losses) – net | $(156,045,142) |
Amounts listed as “–” are $0 or round to $0.
| * | On October 31, 2022, the Fund had a net capital loss carryforward of $(82,382,140) which will be available to offset like amounts of any future taxable gains. The Fund is permitted to carry forward capital losses for an unlimited period and capital losses that are carried forward will retain their character as either short-term or long-term capital losses. The breakdown of capital loss carryforwards are as follows: |
| Amounts | Expires |
| $28,763,878 | Unlimited (Short-Term) |
| 53,618,262 | Unlimited (Long-Term) |
** The difference between book-basis and tax-basis unrealized appreciation/(depreciation) is attributable to the difference between book and tax amortization methods for premiums and discounts on fixed income securities and the realization for tax purposes of unrealized gains/(losses) on certain foreign currency contracts and other timing differences.
GAAP requires that certain components of net assets be adjusted to reflect permanent differences between financial and tax reporting. Accordingly, the table below details the necessary reclassifications, which are a result of permanent differences primarily attributable to
| 30 | abrdn Income Credit Strategies Fund |
Notes to Financial Statements (concluded)
October 31, 2022
distributions to preferred shareholders and redemptions in-kind. These reclassifications have no effect on net assets or NAVs per share.
Paid-in
Capital | Distributable
Earnings/
(Accumulated
Loss) |
| $(2,077,902) | $2,077,902 |
12. Subsequent Events
Management has evaluated the need for disclosures and/or adjustments resulting from subsequent events through the date the financial statements were issued. Based on this evaluation, no disclosures and/or adjustments were required to the financial statements as of October 31, 2022, other than as noted below.
On November 9, 2022 and December 9, 2022, the Fund announced that it will pay on November 30, 2022 and January 11, 2023 a distribution of $0.10 per share to all shareholders of record as of November 22, 2022 and December 30, 2022, respectively.
On August 11, 2022, the Fund’s Board of Trustees and the board of directors of another closed-end fund, Delaware Ivy High Income Opportunities Fund (“IVH” or the “Target Fund”), announced that they had approved the reorganization of the Target Fund into the Fund, subject to the receipt of necessary approvals by shareholders of each of the Funds. The Fund would serve as the acquiring fund. At a special meeting of shareholders of the Fund held on November 9, 2022, the shareholders of the Fund approved the issuance of additional common shares of beneficial interest of the Fund in connection with the reorganization of the Target Fund with and into the Fund. Shareholders of the Target Fund also approved the reorganization at a special meeting held on November 9, 2022. It is currently expected that the reorganization will be completed in the first quarter of 2023, subject to the satisfaction of customary closing conditions.
| abrdn Income Credit Strategies Fund | 31 |
Report of Independent Registered Public Accounting Firm
To the Shareholders and Board of Trustees
abrdn Income Credit Strategies Fund:
Opinion on the Financial Statements
We have audited the accompanying statement of assets and liabilities of abrdn Income Credit Strategies Fund (formerly, Aberdeen Income Credit Strategies Fund) (the Fund), including the portfolio of investments, as of October 31, 2022, the related statements of operations and cash flows for the year then ended, the statements of changes in net assets for each of the years in the two-year period then ended, and the related notes (collectively, the financial statements) and the financial highlights for each of the years in the five-year period then ended. In our opinion, the financial statements and financial highlights present fairly, in all material respects, the financial position of the Fund as of October 31, 2022, the results of its operations and its cash flows for the year then ended, the changes in its net assets for each of the years in the two-year period then ended, and the financial highlights for each of the years in the five-year period then ended, in conformity with U.S. generally accepted accounting principles.
Basis for Opinion
These financial statements and financial highlights are the responsibility of the Fund's management. Our responsibility is to express an opinion on these financial statements and financial highlights based on our audits. We are a public accounting firm registered with the Public Company Accounting Oversight Board (United States) (PCAOB) and are required to be independent with respect to the Fund in accordance with the U.S. federal securities laws and the applicable rules and regulations of the Securities and Exchange Commission and the PCAOB.
We conducted our audits in accordance with the standards of the PCAOB. Those standards require that we plan and perform the audit to obtain reasonable assurance about whether the financial statements and financial highlights are free of material misstatement, whether due to error or fraud. Our audits included performing procedures to assess the risks of material misstatement of the financial statements and financial highlights, whether due to error or fraud, and performing procedures that respond to those risks. Such procedures included examining, on a test basis, evidence regarding the amounts and disclosures in the financial statements and financial highlights. Such procedures also included confirmation of securities owned as of October 31, 2022, by correspondence with custodians and brokers; when replies were not received from brokers, we performed other auditing procedures. Our audits also included evaluating the accounting principles used and significant estimates made by management, as well as evaluating the overall presentation of the financial statements and financial highlights. We believe that our audits provide a reasonable basis for our opinion.

We have served as the auditor of one or more abrdn investment companies since 2009.
Philadelphia, Pennsylvania
December 29, 2022
| 32 | abrdn Income Credit Strategies Fund |
Federal Tax Information: Dividends and Distributions (Unaudited)
In early 2023, the Fund will notify applicable shareholders of final amounts for use in preparing 2022 U.S. federal income tax forms.
| abrdn Income Credit Strategies Fund | 33 |
Supplemental Information (Unaudited)
A special meeting of shareholders was held virtually on November 9, 2022. The description of the proposal and number of shares voted at the meeting are as follows:
Proposal: To approve the issuance of additional common shares of beneficial interest of the Fund in connection with the reorganization of IVH, another closed-end fund, with and into the Fund.
| Votes For | Votes Against/
Withheld | Votes Abstained |
| 11,420,419 | 1,829,195 | 775,377 |
Board of Trustees’ Consideration of Advisory and Sub-Advisory Agreements
At a regularly scheduled quarterly meeting (the “Quarterly Meeting”) of the Board of Trustees (the “Board”) of abrdn Income Credit Strategies Fund (“ACP” or the “Fund”) held on June 14, 2022, the Board, including a majority of the Trustees who are not considered to be “interested persons” of the Fund (the “Independent Trustees”) under the Investment Company Act of 1940, as amended (the “1940 Act”), approved for an annual period the continuation of the Fund’s investment advisory agreement with abrdn Investments Limited (formerly, Aberdeen Asset Managers Limited) (the “Investment Adviser”) and the investment sub-advisory agreement among the Fund, the Investment Adviser and abrdn Inc. (the “Sub-Adviser” or “AI”). In addition, the Independent Trustees of the Fund held a separate telephonic meeting on June 8, 2022 (together with the Quarterly Meeting held on June 14, 2022, the “Meetings”) to review the materials provided and the relevant legal considerations. The Investment Adviser and the Sub-Adviser are referred to collectively herein as the “Advisers” and the aforementioned agreements with the Advisers are referred to as the “Advisory Agreements.” The Sub-Adviser is an affiliate of the Investment Adviser.
In connection with their consideration of whether to approve the continuation of the Fund’s Advisory Agreements, the Board members received and reviewed a variety of information provided by the Advisers relating to the Fund, the Advisory Agreements and the Advisers, including comparative performance, fee and expense information, and other information regarding the nature, extent and quality of services provided by the Advisers under their respective Advisory Agreements. The materials provided to the Board included, among other items: (i) information on the investment performance of the Fund and the performance of peer groups of funds and the Fund’s performance benchmark; (ii) information on the Fund’s advisory fees and other expenses, including information comparing the Fund’s expenses to those of a peer group of funds and information about any applicable expense limitations and fee “breakpoints”; (iii) a report prepared by the Advisers in response to a request submitted by the Independent Trustees’ independent legal counsel on behalf of such Trustees; (iv) information about the profitability of the Advisory Agreements to the Advisers; and (v) a memorandum from the Independent Trustees’ independent legal counsel on the responsibilities of the Board in considering the approval of the investment advisory and investment sub-advisory arrangements under the 1940 Act and Delaware law. The Board, including the Fund’s Independent Trustees, also considered other matters such as: (i) the Fund’s investment objective and strategies; (ii) the procedures employed to value the Fund’s assets; (iii) the Advisers’ investment personnel and operations; (iv) the Advisers’ financial results and financial condition; (v) the resources devoted to, and the record of compliance with, the Fund’s investment policies and restrictions, policies on personal securities transactions and other compliance policies; (vi) the allocation of the Fund’s brokerage, if any, including, if applicable, allocations to brokers affiliated with the Advisers and the use, if any, of “soft” commission dollars to pay Fund expenses and to pay for research and other similar services; and (vii) possible conflicts of interest. Throughout the process, the Board had the opportunity to ask questions of and request additional information from the Advisers.
In addition to the materials requested by the Trustees in connection with their annual consideration of the continuation of the Advisory Agreements, the Trustees received and reviewed materials in advance of each regular quarterly meeting of the Board that contained information about the Fund’s investment performance and information relating to the services provided by the Advisers.
The Independent Trustees were advised by separate independent legal counsel throughout the process and consulted in executive sessions with their independent legal counsel regarding their consideration of the renewal of the Advisory Agreements. In considering whether to approve the continuation of the Advisory Agreements, the Board, including the Independent Trustees, did not identify any single factor as determinative. Individual Trustees may have evaluated the information presented differently from one another, giving different weights to various factors. Matters considered by the Board, including the Independent Trustees, in connection with its approval of the continuation of the Advisory Agreements included the factors listed below.
Investment performance of the Fund and the Advisers. The Board received and reviewed with management, among other performance data, information that compared the Fund’s return to comparable investment companies. The Board also received and considered performance information compiled by Institutional Shareholder Services Inc. (“ISS”), an independent third-party provider of investment company data as to the Fund’s total return, as compared with the funds in the Fund’s Morningstar category (the “Morningstar Group”). In addition, the Board received and reviewed information regarding the Fund’s total return on a gross and net basis and relative to the Fund’s benchmark, the impact of foreign currency movements on the Fund’s performance and the Fund’s share performance and premium/discount information. The Board also received
| 34 | abrdn Income Credit Strategies Fund |
Supplemental Information (Unaudited) (continued)
and considered information about the Fund’s total return against the respective Morningstar Group average and against other comparable Aberdeen-managed funds. Additionally, the Trustees considered management’s discussion of the factors contributing to differences in performance, including differences in the investment strategies, restrictions and risks of each of these other funds and accounts. The Board took into account information about the Fund’s discount/premium ranking relative to its Morningstar Group and management’s discussion of the Fund’s performance.
The Board also considered the Advisers’ performance generally, the historical responsiveness of the Advisers to Trustee concerns about performance and the willingness of the Advisers to take steps intended to improve performance.
Economies of Scale. The Trustees considered the existence of any economies of scale in the provision of services by the Advisers and whether those economies would be shared with the Fund through breakpoints in the investment advisory fee or other means, such as expense waivers or limitations. The Board considered management’s discussion of the Fund’s management fee structure, including how the Fund’s management fee compared to its Peer Group (as defined below) at higher asset levels.
Fees and expenses. The Board reviewed with management the effective annual fee rate paid by the Fund to the Investment Adviser for investment management services. The Board also received and considered information compiled at the request of the Fund by ISS that compared the Fund’s effective annual management fee rate with the fees paid by a peer group consisting of other comparable closed-end funds (each such group, a “Peer Group”). The Trustees took into account the management fee structure, including that advisory fees for the Fund were based on the Fund’s total managed assets, whether attributable to common stock or borrowings, if any. The Trustees also considered information from management about the fees charged by the Advisers to other U.S. clients investing primarily in an asset class similar to that of the Fund. The Board reviewed and considered additional information about the Investment Adviser’s fees, including the amount of the management fees retained by the Investment Adviser after payment of the advisory fees. The Board considered that the compensation paid to the Sub-Adviser was paid by the Investment Adviser, and, accordingly that the retention of the Sub-Adviser did not increase the fees or expenses otherwise incurred by the Fund’s shareholders. The Board considered the fee comparisons in light of the differences in resources and costs required to manage the different types of accounts.
The Board also took into account management’s discussion of the Fund’s expenses, including the factors that impacted the Fund’s expenses.
The nature, extent and quality of the services provided to the Fund under the Advisory Agreements. The Board considered, among other things, the nature, extent and quality of the services provided by the Advisers to the Fund and the resources dedicated to the Fund by the Advisers. The Trustees took into account the Advisers’ investment experience and considered the allocation of responsibilities between the Advisers. The Board also considered the Advisers’ risk management processes. The Board considered the background and experience of the Advisers’ senior management personnel and the qualifications, background and responsibilities of the portfolio managers primarily responsible for the day-to-day portfolio management services for the Fund. The Board also considered information regarding the Advisers’ compliance with applicable laws and Securities and Exchange Commission and other regulatory inquiries or audits of the Fund and the Advisers. The Board considered that they received information on a regular basis from the Fund’s Chief Compliance Officer regarding the Advisers’ compliance policies and procedures and considered the Advisers’ brokerage policies and practices. Management reported to the Board on, among other things, its business plans and organizational changes. The Trustees took into account their knowledge of management and the quality of the performance of management’s duties through Board meetings, discussion and reports during the preceding year.
After reviewing these and related factors, the Board concluded that the nature, extent and quality of the services provided supported the renewal of the Advisory Agreements.
The Trustees also considered other factors, which included but were not limited to the following:
| • | the nature, quality, cost and extent of administrative services provided by AI, an affiliate of the Adviser, under a separate agreement covering administrative services. |
| • | whether the Fund has operated in accordance with its investment objective and the Fund’s record of compliance with its investment restrictions, and the compliance programs of the Advisers. The Trustees also considered the compliance-related resources the Advisers and their affiliates were providing to the Fund. |
| • | so-called “fallout benefits” to the Advisers and their affiliates, including indirect benefits. The Trustees considered any possible conflicts of interest associated with these fallout and other benefits, and the reporting, disclosure and other processes in place to disclose and monitor such possible conflicts of interest. |
| • | the effect of any market and economic volatility on the performance, asset levels and expense ratios of the Fund. |
* * *
Based on their evaluation of all factors that they deemed to be material, including those factors described above, and assisted by the advice of independent counsel, the Trustees, including the Independent Trustees, concluded that renewal of the Advisory Agreements would be in the best
| abrdn Income Credit Strategies Fund | 35 |
Supplemental Information (Unaudited) (concluded)
interest of the Fund and its shareholders. Accordingly, the Board, including the Board’s Independent Trustees voting separately, approved the Fund’s Advisory Agreements for an additional one-year period.
Delaware Statutory Trust Act - Control Share Acquisitions
On August 1, 2022, certain new provisions of Delaware law, applicable to the Fund as a Delaware statutory trust, went into effect. Pursuant to these new provisions, shareholders of the Fund that acquire ownership of shares equal to or greater than certain thresholds tied to the overall voting interests of the Fund or the voting interests of a class of shares of the Fund may, with respect to certain shares, have limited ability to vote with respect to certain proposals. The first threshold which could trigger these new provisions is ownership of 10% or more of the overall voting interests of the Fund or of a class of shares of the Fund.
| 36 | abrdn Income Credit Strategies Fund |
Additional Information Regarding the Fund (Unaudited)
Recent Changes
The following information is a summary of certain changes during the fiscal year ended October 31, 2022. This information may not reflect all of the changes that have occurred since you purchased the Fund.
During the applicable period, there have been: (i) no material changes to the Fund’s investment objectives and policies that constitute its principal portfolio emphasis that have not been approved by shareholders, (ii) no material changes to the Fund’s principal risks, (iii) no changes to the persons primarily responsible for day-to-day management of the Fund; and (iv) no changes to the Fund’s charter or by-laws that would delay or prevent a change of control that have not been approved by shareholders.
Investment Objectives and Policies
Investment Objectives
The Fund is a diversified, closed-end management investment company whose primary investment objective is to seek a high level of current income with a secondary objective of capital appreciation.
Principal Investment Strategy; Leverage
Depending on current market conditions and the Fund’s outlook over time, the Fund seeks to achieve its investment objectives by opportunistically investing primarily in loan and debt instruments (and loan-related or debt-related instruments, including repurchase and reverse repurchase agreements and derivative instruments) of issuers that operate in a variety of industries and geographic regions. The Fund expects to emphasize high current income, with a secondary emphasis on capital appreciation, by investing generally in senior secured floating rate and fixed rate loans and in second lien or other subordinated loans or debt instruments, including non-stressed and stressed credit obligations, and related derivatives. Under normal market conditions, the Fund will invest at least 80% of its “Managed Assets” in any combination of the following credit obligations and related instruments: (i) senior secured floating rate and fixed rate loans (“Senior Loans”) (including those that, at the time of investment, are rated below investment grade by a nationally recognized statistical rating organization (a “NRSRO”) or are unrated but deemed by the Advisers to be of comparable quality; these types of below investment grade instruments are commonly known as “junk” securities and are regarded as predominantly speculative with respect to the issuer’s capacity to pay interest and repay principal); (ii) second lien or other subordinated or unsecured floating rate and fixed rate loans or debt (including those that, at the time of investment, could be considered “junk” securities as described above); (iii) other debt obligations, including high-yield, high-risk obligations (i.e., instruments that are commonly known as “junk” securities as described above) and “covenant lite” loans; (iv) structured products, including collateralized debt and loan obligations (collectively,
“structured products”) that provide long or short exposure to other credit obligations; (v) swaps and other derivative instruments (including credit default, total return, index and interest rate swaps, options, forward contracts, futures contracts and options on futures contracts) that provide long or short exposure to other credit obligations; and (vi) short-term debt securities such as U.S. government securities, commercial paper and other money market instruments and cash equivalents (including shares of money market funds). Certain types of structured products, swaps and other derivative instruments provide short exposure to other credit obligations because the value of such instruments is inversely related to the value of one or more other credit obligations. “Managed Assets” are the total assets of the Fund (including any assets attributable to money borrowed for investment purposes, including proceeds from (and assets subject to) reverse repurchase agreements, any credit facility and any issuance of preferred shares or notes) minus the sum of the Fund’s accrued liabilities (other than Fund liabilities incurred for the purpose of leverage).
The Fund has no liquidity limitation or restriction, thus some or all its investments may be illiquid securities.
The Advisers have expertise in Senior Loans and subordinated debt instruments, including those of stressed and distressed issuers, and are responsible for the overall management of the Fund.
The Advisers seek to maximize risk adjusted returns, including by seeking to manage risk through shorting and other hedging strategies when deemed advisable by the Advisers. There can be no assurance that the Fund’s hedging strategies will succeed. The Advisers seek to achieve the Fund’s investment objectives while carefully evaluating risk/return within the capital structure of a company, as well as the industry and asset class. The Advisers look to maintain trading flexibility and to preserve capital. They conduct thorough in-depth research and employ a disciplined investment philosophy and a consistent investment approach in their focus on credit opportunities. The Advisers’ investment teams use a robust credit process that includes research and analysis using a top-down/bottom-up approach to find mispriced or undervalued opportunities: from the top down, they consider macroeconomic themes of the overall credit market and industries, and from the bottom up, they conduct detailed fundamental analysis related to credit obligations of specific issuers, including examining issuers’ financials and operations, including sales, earnings, growth potential, assets, debt, management and competition. The Advisers also seek to understand historic and prospective industry trends affecting an investment opportunity. The Fund typically seeks to balance interest rate risk with investment performance by investing, when deemed advisable by the Advisers, in both floating rate credit obligations, which are more likely to maintain their value in changing interest rate environments, and fixed rate credit obligations, which are more likely to lose value in rising interest
| abrdn Income Credit Strategies Fund | 37 |
Additional Information Regarding the Fund (Unaudited) (continued)
rate environments but may pay higher rates of interest than floating rate credit obligations.
The Fund typically seeks to balance credit risk with investment performance by investing, when deemed advisable by the Advisers, in both Senior Loans, which may pose less credit risk, and other credit obligations, which may offer the prospect of higher returns with more credit risk.
When investing in credit obligations, the Fund may invest in the same securities or other credit obligations in which other accounts managed by the Advisers also invest. To the extent that the Advisers serve as an investment manager to other accounts in the future that have the same investment strategy as the Fund, investment opportunities within such strategy will, to the extent practicable, be allocated among the Fund and such other accounts on a pro rata basis or on such other basis as the Advisers determine to be fair and equitable to the Fund and such other accounts.
Investors should note that the investment advisory fee structure for other accounts managed by the Advisers may be different than the investment advisory fee structure for the Fund. The Fund offers an opportunity for its investors to have access to an investment strategy implemented by the Advisers, which normally is not directly available to retail investors, albeit only at the lower risk and return segment of the market.
Leverage – The Fund is permitted to obtain leverage using any form or combination of financial leverage instruments, including reverse repurchase agreements, credit facilities such as bank loans or commercial paper, and the issuance of preferred shares or notes. The Fund is permitted to obtain leverage using any form or combination of financial leverage instruments, including reverse repurchase agreements, credit facilities such as bank loans or commercial paper, and the issuance of preferred shares or notes.
The Fund is permitted to have financial leverage representing up to the maximum extent permitted by the 1940 Act. The 1940 Act generally prohibits the Fund from engaging in most forms of leverage representing indebtedness other than preferred shares unless immediately after such incurrence the Fund's total assets less all liabilities and indebtedness not represented by senior securities (for these purposes, "total net assets") is at least 300% of the aggregate senior securities representing indebtedness (i.e., the use of leverage through senior securities representing indebtedness may not exceed 33 1/3% of the Fund's total net assets (including the proceeds from leverage)). Additionally, under the 1940 Act, the Fund generally may not declare any dividend or other distribution upon any class of its capital shares, or purchase any such capital shares, unless at the time of such declaration or purchase, this asset coverage test is satisfied. In addition, the 1940 Act limits the extent to which the Fund may issue preferred shares plus senior securities representing indebtedness to
50% of the Fund’s total assets (less the Fund’s liabilities and indebtedness not represented by senior securities). Indebtedness associated with reverse repurchase agreements and similar financing transactions may be aggregated with any other senior securities representing indebtedness for this purpose or be treated as derivatives transactions under the 1940 Act and the rules and regulations thereunder, depending on the Fund’s election under applicable SEC requirements.
Portfolio Composition
Portfolio Construction Guidelines
In addition to the principal strategies noted above, the Fund follows the following portfolio construction guidelines The Fund will not invest in credit obligations or related instruments that, at the time of investment, are in default. The Fund may invest in credit obligations or related instruments that, at the time of investment, are likely to default. The credit obligations and related instruments in which the Fund may invest include mortgage-backed and asset-backed securities and securities whose value depends on the value of mortgage-backed or asset-backed securities. These types of investments present special risks. The Fund may act as a lender originating a Senior Loan.
Under normal market conditions, the Fund may also invest up to 20% of its Managed Assets in any combination of the following: (i) structured products that do not provide long or short exposure to other credit obligations; (ii) swaps and other derivative instruments (including total return, index and interest rate swaps, options, warrants, forward contracts, futures contracts and options on futures contracts) that do not provide long or short exposure to other credit obligations; (iii) foreign currencies and foreign currency derivatives (including foreign currency related swaps, futures contracts and forward contracts) acquired for the purpose of hedging the currency risk arising from the credit obligations in the Fund's portfolio; and (iv) equity securities obtained through the conversion or exchange of convertible or exchangeable instruments, debt restructurings or bankruptcy proceedings and hedges on such positions. Structured products, swaps and other derivative instruments that do not provide long or short exposure to other credit obligations are those instruments whose reference or underlying assets or indices are not credit obligations or indices of credit obligations. Examples of such instruments include equity- and commodity-linked notes, total return swaps based on the value of an equity security and commodity futures contracts. The Fund may invest in such instruments in order, for example, (i) to seek current income or capital appreciation or (ii) to reduce the Fund's exposure solely to credit obligations. The Adviser believes that the flexibility afforded by being able to invest in such instruments may benefit the Fund by (i) allowing the Fund to invest in potentially attractive investment opportunities that are not credit
| 38 | abrdn Income Credit Strategies Fund |
Additional Information Regarding the Fund (Unaudited) (continued)
obligations and (ii) increasing the mix of instruments in the Fund's portfolio which could reduce the overall risk of the Fund's portfolio. There can be no assurance that these benefits will be realized and such instruments may expose the Fund to risks not presented by credit obligations.
If the Fund receives equity securities in a debt restructuring or bankruptcy proceeding in an amount that would cause it to exceed the foregoing 20% limitation, the Fund will not be required to reduce its positions in such securities, or in any related hedges or any other investment, if the Adviser believes it would not be in the best interest of the Fund to do so.
Percentage limitations described in the Fund's prospectus are as of the time of investment by the Fund and may be exceeded after such time because of changes in the market value of the Fund's assets.
The Fund may not invest in a derivative (other than a credit default swap or a currency hedging instrument) if, immediately after the investment, derivatives (other than credit default swaps and currency hedging instruments) would represent more than 30% of the Fund's Managed Assets on a marked-to-market basis. The Fund may use derivative instruments for hedging, as well as speculative, purposes.
The Fund's policy of investing, under normal market conditions, in accordance with the foregoing portfolio construction guidelines, is not considered to be fundamental by the Fund and can be changed without the vote of the Fund's shareholders by the Board with at least sixty (60) days written notice provided to shareholders.
Credit quality, liquidity and geographic origin of portfolio investments
The Fund may invest, without limitation, in credit obligations that are rated below investment grade by a NRSRO such as S&P or Moody’s or unrated credit obligations that are deemed by the Advisers to be of comparable quality, commonly known in either case as “junk” securities. Such securities are regarded as predominantly speculative with respect to the issuer’s capacity to pay interest and repay principal in accordance with the terms of the obligations and involve significant risk exposure to adverse conditions. Any of the Fund’s investments may be issued, at the time of investment by the Fund, by “non-stressed” or “stressed” issuers. The Fund may invest in credit obligations of any maturity or duration. “Non-stressed issuers” generally refers to those issuers that are in compliance with respect to their financial obligations and are not stressed or distressed issuers. “Non-stressed obligations” generally refers to credit obligations issued by non-stressed issuers. “Stressed issuers” generally refers to those issuers that the market expects to become distressed issuers in the near future. “Stressed obligations” generally refers to credit obligations issued by stressed issuers. “Distressed issuers” generally refers to those issuers that are unable to service their debt.
“Distressed obligations” generally refers to credit obligations issued by distressed issuers. The Fund does not intend to invest in credit obligations issued by issuers that, at the time of investment, the Advisers believe to be distressed issuers.
In making investments in accordance with the foregoing portfolio construction guidelines, the Fund may invest globally in U.S. and non-U.S. issuers’ obligations and such obligations may be U.S. dollar denominated as well as non-U.S. dollar denominated. The Fund typically seeks to limit its exposure to foreign currency risks by entering into forward transactions and other hedging transactions to the extent practical. There can be no assurance that the Fund’s currency hedging strategies will succeed. Under normal market conditions, the Fund expects to continue investing in both U.S. and non-U.S. issuers. The geographic areas of focus are subject to change from time to time and may be changed without notice to the Fund’s shareholders. There is no minimum or maximum limit on the amount of the Fund’s assets that may be invested in non-U.S. credit obligations generally or in emerging market credit obligations specifically.
The Fund may invest in loans and bonds issued by issuers of any size. The Fund’s focus with respect to borrower size is subject to change from time to time and may be changed without notice to the Fund’s shareholders. The Fund may invest in credit obligations at all levels of the capital structure. In investing in credit obligations, the Fund focuses on senior secured debt and other senior debt (including senior unsecured debt issued by an issuer that has also issued senior secured debt). The Fund’s focus in this regard is subject to change from time to time and may be changed without notice to the Fund’s shareholders.
Portfolio Investments
The Fund’s investments (primarily in Senior Loans, subordinated loans and debt, other debt obligations, structured products and swaps – each of which is described in more detail below) may be all or substantially in investments that are generally considered to have a credit quality rated below investment grade by a nationally recognized statistical ratings organization (“NRSRO”) or unrated credit obligations that are deemed to be of comparable quality by the Advisers. Below investment grade securities (that is, securities rated Ba or lower by Moody’s Corporation (“Moody’s”) or BB or lower by Standard & Poor’s (“S&P”)) are commonly referred to as “junk” securities and are regarded as predominantly speculative with respect to the issuer’s capacity to pay interest and repay principal in accordance with the terms of the obligations and involve major risk exposure to adverse conditions. Generally, lower-grade securities provide a higher yield than higher-grade securities of similar maturity but are subject to greater risks, such as greater credit risk, greater market risk and volatility, greater liquidity concerns and potentially greater manager risk. Lower-grade securities are more susceptible to
| abrdn Income Credit Strategies Fund | 39 |
Additional Information Regarding the Fund (Unaudited) (continued)
non-payment of interest and principal and default than higher-grade securities. Adverse changes in the economy or to the individual issuer often have a more significant impact on the ability of lower-grade issuers to make payments, meet projected goals or obtain additional financing. When an issuer of such securities is in financial difficulties, the Fund may incur additional expenditures or invest additional assets in an effort to obtain partial or full recovery on amounts due. Some of the securities held by the Fund, which may not be paying interest currently or may be in payment default, may be comparable to securities rated as low as C by Moody’s or CCC or lower by S& P. These securities are considered to have extremely poor prospects of ever attaining any real investment standing, to have a current identifiable vulnerability to default, to be unlikely to have the capacity to pay interest and repay principal when due in the event of adverse business, financial or economic conditions and/or to be in default or not current in the payment of interest or principal.
While all credit obligations tend to fluctuate inversely with changes in interest rates, the prices of lower-grade securities generally are less sensitive to changes in interest rates and are more sensitive to specific issuer developments or real or perceived general adverse economic changes than higher-grade securities. A projection of an economic downturn, for example, could cause a decline in prices of lower-grade securities because the advent of a recession could lessen the ability of a highly leveraged company to make principal and interest payments on its securities or obtain additional financing when necessary. A significant increase in market interest rates or a general economic downturn could severely disrupt the market as well as the market values of such securities. Such securities also often experience more volatility in prices than higher-grade securities.
Unrated credit obligations are usually not as attractive to as many buyers as are rated credit obligations, a factor which may make unrated credit obligations less marketable. These factors may have the effect of limiting the availability of the credit obligations for purchase by the Fund and may also limit the ability of the Fund to sell such credit obligations at their fair value.
Few lower grade credit obligations are listed for trading on any national exchange, and issuers of lower grade credit obligations may choose not to have a rating assigned to their credit obligations by an NRSRO. As a result, the Fund’s portfolio may consist of a greater portion of unlisted or unrated credit obligations as compared with a fund that invests primarily in higher grade credit obligations.
The markets for lower-grade loans and debt credit obligations may be less liquid than the markets for higher-grade credit obligations. Liquidity relates to the ability to sell an obligation in a timely manner at a price which reflects the value of that obligation. To the extent that there is no established retail market for some of the lower-grade securities in which the Fund may invest, trading in such securities may
be relatively inactive. Prices of lower-grade credit obligations may decline rapidly in the event a significant number of holders decide to sell. Changes in expectations regarding an individual issuer of lower-grade credit obligations generally could reduce market liquidity for such credit obligations and make their sale by the Fund more difficult, at least in the absence of price concessions. The effects of adverse publicity and investor perceptions may be more pronounced for securities for which no established retail market exists as compared with the effects on securities for which such a market does exist. An economic downturn or an increase in interest rates could severely disrupt the market for such credit obligations and adversely affect the value of outstanding credit obligations or the ability of the issuers to repay principal and interest. Further, the Fund may have more difficulty selling such credit obligations in a timely manner and at their stated value than would be the case for credit obligations for which an established retail market does exist.
During periods of reduced market liquidity or in the absence of readily available market quotations for lower-grade or other credit obligations held in the Fund's portfolio, the ability of the Fund to value the Fund's investments becomes more difficult and the judgment of the Advisers may play a greater role in the valuation of the Fund's investments due to the reduced availability of reliable objective data.
The Fund may invest in the credit obligations of stressed issuers, including obligations that are in covenant or payment default. Credit obligations that are or become stressed generally trade at prices below par, thus creating opportunities for capital appreciation (or loss) as the values of such securities change over time. A security purchased at a deep discount may currently pay a very high effective yield. In addition, if the financial condition of the company improves, the underlying value of the obligation may increase, resulting in capital appreciation. If the company defaults on its credit obligations or remains in default, or if the plan of reorganization does not provide sufficient payments for debtholders, the deep discount credit obligations may stop generating income and lose value or become worthless. Such obligations are subject to a multitude of legal, industry, market, economic and governmental forces each of which make analysis of these companies inherently difficult. The Advisers rely on company management, outside experts, market participants and personal experience to analyze potential investments. There can be no assurance that any of these sources will provide credible information, or that the analysis of the Advisers will produce conclusions that lead to profitable investments for the respective portion of the Fund’s portfolio managed by each. The Fund relies on the Advisers' judgment, analysis and experience in evaluating the creditworthiness of an issuer. The amount of available information about the financial condition of certain lower-grade issuers may be less extensive than other issuers. In their analysis, the Advisers may consider the credit ratings of NRSROs in evaluating credit obligations
| 40 | abrdn Income Credit Strategies Fund |
Additional Information Regarding the Fund (Unaudited) (continued)
although the Advisers do not rely primarily on these ratings. Credit ratings of NRSROs evaluate only the safety of principal and interest payments, not the market risk. In addition, ratings are general and not absolute standards of quality, and credit ratings are subject to the risk that the creditworthiness of an issuer may change and the NRSROs may fail to change such ratings in a timely fashion. A rating downgrade does not require the Fund to dispose of a security. The Advisers continuously monitor the issuers of credit obligations held in their respective managed portions of the Fund. Additionally, since most non-U.S. income credit obligations are not rated, the Fund will invest in such credit obligations based on the analysis of the Advisers without any guidance from published ratings. Because of the number of investment considerations involved in investing in lower-grade credit obligations and foreign income credit obligations, achievement of the Fund's investment objectives may be more dependent upon the credit analysis of the Advisers than is the case with investing in higher-grade credit obligations. Obligations of stressed issuers generally trade significantly below par and are considered speculative. The repayment of defaulted obligations is subject to significant uncertainties. Defaulted obligations might be repaid only after lengthy workout or bankruptcy proceedings or result in only partial recovery of cash payments or an exchange of the defaulted obligation for other debt or equity securities of the issuer or its affiliates, which may in turn be illiquid or speculative.
There are a number of significant risks inherent in the bankruptcy process. Many events in a bankruptcy are the product of contested matters and adversary proceedings and are beyond the control of the creditors. There can be no assurance that a bankruptcy court would not approve actions that would be contrary to the interests of the Fund. A bankruptcy filing by an issuer may cause such issuer to lose its market position and key employees and otherwise become incapable of restoring itself as a viable entity, and its liquidation value may be less than its value was believed to be at the time of investment. In addition, the duration of a bankruptcy proceeding is difficult to predict and as such, a creditor’s return on investment can be adversely affected by delays while the plan of reorganization is being negotiated, approved by the creditors and confirmed by the bankruptcy court and until it ultimately becomes effective. The administrative costs in connection with a bankruptcy proceeding are frequently high and would be paid out of the debtor’s estate prior to any return to creditors. Further, in the early stages of the bankruptcy process it is often difficult to estimate the extent of any contingent claims that might be made and as such, there is a risk that the Fund’s influence with respect to the class of obligations it owns can be lost by increases in the number and amount of claims in that class or by different classification and treatment. A creditor, such as the Fund, can also lose its ranking and priority if it is determined that such creditor exercised “domination and control” over a debtor and other creditors can demonstrate that they have been harmed by such
actions. In addition, certain claims have priority by law, such as claims for taxes, which may be substantial and could affect the ability of the Fund to be repaid.
In any investment involving stressed obligations, there is a risk that the transaction involving such debt obligations will be unsuccessful, take considerable time or will result in a distribution of cash or a new security or obligation in exchange for the stressed obligations, the value of which may be less than the Fund’s purchase price of such obligations. Furthermore, if an anticipated transaction does not occur, the Fund may be required to sell its investment at a loss. The Advisers seek to balance the benefits of deep discount credit obligations with the risks associated with investments in such obligations. While a diversified portfolio may reduce the overall impact of a deep discount obligation that is in default or loses its value, the risk cannot be eliminated. The Fund may sell portfolio securities without regard to the length of time they have been held to take advantage of new investment opportunities, when the Advisers believe the potential for high current income or capital appreciation has lessened, or for other reasons. The Fund’s portfolio turnover rate may vary from year to year.
Senior Loans
Senior Loans are business loans made to borrowers that may be corporations, partnerships or other entities that operate in a variety of industries and geographic regions. Senior Loans generally are negotiated between a borrower and several financial institution lenders represented by one or more lenders acting as agent of all the lenders. The agent is responsible for negotiating the loan agreement that establishes the terms and conditions of the Senior Loan and the rights of the borrower and the lenders. The Fund may act as one of the original lenders originating a Senior Loan, may purchase portions of Senior Loans through assignments from lenders and may invest in participations in Senior Loans. Senior Loans have the most senior position in a borrower’s capital structure or share the senior position with other senior debt securities of the borrower. This capital structure position generally gives holders of Senior Loans a claim on some or all of the borrower’s assets that is senior to that held by unsecured creditors, subordinated debt holders and stockholders of the borrowers. Senior Loans also have contractual terms designed to protect lenders. The Fund will generally acquire Senior Loans of borrowers that, among other things, in the Advisers’ judgment, can make timely payments on their Senior Loans and that satisfy other credit standards established by the Advisers. Because of the protective features of Senior Loans, the Fund and the Advisers believe that Senior Loans of borrowers that are experiencing, or are more likely to experience, financial difficulty may represent attractive investment opportunities.
| abrdn Income Credit Strategies Fund | 41 |
Additional Information Regarding the Fund (Unaudited) (continued)
Interest rates on Senior Loans may be fixed or may float periodically. On floating rate Senior Loans, the interest rates typically are adjusted based on a base rate plus a premium or spread over the base rate. The base rate usually is a standard inter-bank offered rate, such as the London Interbank Offered Rate (“LIBOR”), the prime rate offered by one or more major U.S. banks, or the certificate of deposit rate or other base lending rates used by commercial lenders. Floating rate Senior Loans may adjust over different time periods, including daily, monthly, quarterly, semi-annually or annually. The Fund may use interest rate swaps and other investment practices to shorten the effective interest rate adjustment period of floating rate Senior Loans or to adjust the overall interest rate exposure of the Fund.
When interest rates rise, the values of fixed income securities generally decline. When interest rates fall, the values of fixed income securities generally increase. The prices of adjustable, variable or floating rate income securities tend to have less fluctuation in response to changes in interest rates, but will have some fluctuation particularly when the next interest rate adjustment on such security is further away in time or adjustments are limited in amount over time.
The Fund’s Senior Loan investments will typically be secured by specific assets of the borrower that qualify as collateral, such as trademarks, accounts receivable, inventory, buildings, real estate, franchises and common and preferred stock in its subsidiaries and affiliates. Collateral may also include guarantees or other credit support by affiliates of the borrower. In some cases, a Senior Loan may be secured only by stock of the borrower or its subsidiaries. The borrower may experience financial difficulty and/or the value of collateral may decline over time. The loan agreement may or may not require the borrower to pledge additional collateral to secure the Senior Loan if the value of the initial collateral declines. In certain circumstances, the loan agreement may authorize the agent to liquidate the collateral and to distribute the liquidation proceeds pro rata among the lenders. As described below, the Fund may also invest in loans that are not secured by specific collateral. Investments in such unsecured loans involve a greater risk of loss.
Senior Loans also have contractual terms designed to protect lenders. Loan agreements often include restrictive covenants that limit the activities of the borrower. These covenants may include mandatory prepayment out of excess cash flows, restrictions on dividend payments, the maintenance of minimum financial ratios, limits on indebtedness and other financial tests. Breach of these covenants generally is an event of default and, if not waived by the lenders, may give lenders the right to accelerate principal and interest payments.
The proceeds of Senior Loans that the Fund will purchase typically will be used by borrowers to finance leveraged buyouts, recapitalizations, mergers, acquisitions, stock repurchases, debt refinancings and, to a lesser extent, for general operating and other purposes.
The Fund may purchase and retain in its portfolio Senior Loans of borrowers that have filed for protection under the federal bankruptcy laws or similar laws or that have had involuntary bankruptcy petitions filed against them by creditors. Investing in Senior Loans involves investment risk, and some borrowers default on their Senior Loan payments. The Fund attempts to manage these risks through selection of a varied portfolio of Senior Loans and analysis and monitoring of borrowers.
The Fund generally invests in a Senior Loan if, in the Advisers’ judgment, the borrower can meet its future payment obligations. The Advisers will perform their own independent credit analysis of the borrower in addition to utilizing information prepared and supplied by the agent or other lenders with respect to the portion of the Fund’s portfolio managed by each. When evaluating a borrower, the Advisers will consider many factors, including the borrower’s past and future projected financial performance. The Advisers also consider a borrower’s management, collateral and industry. The Fund generally acquires a collateralized Senior Loan if the Advisers believe that the collateral coverage equals or exceeds the outstanding principal amount of the Senior Loan. The Advisers continue to monitor a borrower on an ongoing basis for so long as the Fund continues to own the Senior Loan. Although the Advisers use their best judgment in selecting Senior Loans, there can be no assurance that such analysis will disclose factors that may impair the value of a Senior Loan. The Fund’s NAV of the Common Shares fluctuates as a result of changes in the credit quality of borrowers and other factors. A serious deterioration in the credit quality of a borrower could cause a permanent decrease in the Fund’s NAV of the Common Shares.
There is no minimum rating or other independent evaluation of a borrower or its securities limiting the Fund’s investments. Although a Senior Loan may not be rated by a NRSRO at the time the Fund purchases the Senior Loan, NRSROs have become more active in rating Senior Loans, and at any given time a substantial portion of the Senior Loans in the Fund’s portfolio may be rated. There is no limit on the percentage of the Fund’s assets that may be invested in Senior Loans that are rated below investment grade or that are unrated but deemed by the Advisers to be of comparable quality.
Original Lender. When the Fund acts as an original lender, it may participate in structuring the Senior Loan. When the Fund is an original lender, it will have a direct contractual relationship with the borrower, may enforce compliance of the borrower with the terms of the loan agreement and may have rights with respect to any funds acquired by other lenders through set-off. Lenders typically also have full voting and consent rights under loan agreements. Certain actions of the borrower typically requires the vote or consent of the holders of some specified percentage of the outstanding principal amount of the Senior Loan. Certain decisions, such as reducing the amount of interest on or principal of a Senior Loan, releasing collateral, changing
| 42 | abrdn Income Credit Strategies Fund |
Additional Information Regarding the Fund (Unaudited) (continued)
the maturity of a Senior Loan or a change in control of the borrower, frequently require the unanimous vote or consent of all lenders affected. The Fund intends never to act as the agent or principal negotiator or administrator of a Senior Loan, except to the extent it might be considered to be the principal negotiator of a loan negotiated by the Advisers for the Fund and/or one or more other registered investment companies managed by the Advisers.
The Fund will not act as an original lender for a loan if, after making such loan, loans originated by the Fund would exceed 5% of the Fund’s Managed Assets. The Fund will generally only act as an original lender for a loan if, among other things, in the Advisers’ judgment, the borrower can make timely payments on its loans and satisfy other credit standards established by the Advisers. The Advisers rely primarily on their own evaluation of the credit quality of such a borrower. As a result, the Fund is particularly dependent on the analytical abilities of the Advisers. Because of the nature of its investments, the Fund may be subject to allegations of lender liability and other claims. In addition, the Securities Act of 1933, as amended (the “Securities Act”) deems certain persons to be “underwriters” if they purchase a security from an issuer and later sell it to the public. Although it is not believed that the application of this Securities Act provision would cause the Fund to be engaged in the business of underwriting, a person who purchases an instrument from the Fund that was acquired by the Fund from the issuer of such instrument could allege otherwise. Under the Securities Act, an underwriter may be liable for material omissions or misstatements in an issuer’s registration statement or prospectus.
The Fund will not originate a loan (i) to a borrower that is a portfolio company controlled by a fund managed by Aberdeen or (ii) where Aberdeen or a fund managed by Aberdeen is the agent, principal negotiator or administrator of the loan, except to the extent that the Advisers or another registered investment company managed by the Advisers might be considered to be the principal negotiator of a loan it negotiates for the Fund and/or one or more other registered investment companies managed by the Advisers.
Senior Loan assignments and participations. The Fund may purchase Senior Loans by assignment from a lender in the original syndicate of lenders or from subsequent assignees. The purchaser of an assignment typically succeeds to all the rights and obligations under the loan agreement of the assigning lender and becomes a lender under the loan agreement. Assignments may, however, be arranged through private negotiations, and the rights and obligations acquired by the purchaser of an assignment may differ from, and be more limited than, those held by the assigning lender. The Fund may also purchase participations from lenders in the original syndicate making Senior Loans. When the Fund purchases a participation in a Senior Loan, the Fund will usually have a contractual relationship only with the lender selling the participation and not with the borrower. The
Fund may have the right to receive payments of principal, interest and any fees to which it is entitled only from the lender selling the participation and only upon receipt by the lender of such payments from the borrower. As a result, the Fund may assume the credit risk of both the borrower and the lender selling the participation. In the event of insolvency of the lender selling a participation, the Fund may be treated as a general creditor of the lender.
In the case of a participation, the Fund generally will not have the right to enforce compliance by the borrower with the loan agreement, nor rights to any funds acquired by other lenders through set-off against the borrower. In addition, when the Fund holds a participation in a Senior Loan, it may not have the right to vote on whether to waive enforcement of any restrictive covenant breached by a borrower. Lenders voting in connection with a potential waiver of a restrictive covenant may have interests different from those of the Fund and may not consider the interests of the Fund. The Fund may not benefit directly from the collateral supporting a Senior Loan in which it has purchased the participation, although lenders that sell participations generally are required to distribute liquidation proceeds received by them pro rata among the holders of such participations.
Second Lien or Other Subordinated or Unsecured Loans or Debt
The Fund may invest in second lien or other subordinated or unsecured loans or debt. Such loans or debt are made by public and private corporations and other non-governmental entities and issuers for a variety of purposes. As in the case of Senior Loans, the Fund may purchase interests in second lien or other subordinated or unsecured loans or debt through assignments or participations (each as described above).
Second lien loans are secured by a second priority security interest in or lien on specified collateral securing the borrower’s Senior Loans on a first lien basis. This means that Senior Loans are repaid in full with proceeds of the collateral before second lien loans are repaid. Second lien loans typically have less protections and rights as Senior Loans. Second lien loans are not (and by their terms cannot become) junior in lien priority to any obligation of the related borrower other than Senior Loans of such borrower. Second lien loans may have fixed or floating rate interest payments. Because second lien loans are secured on a junior basis to Senior Loans, they present a greater degree of investment risk but often pay interest at higher rates reflecting this additional risk. In addition, second lien loans of below investment grade quality share many of the risk characteristics of other non-investment grade securities.
Second lien and subordinated loans typically have greater price volatility than Senior Loans and may be less liquid.
Subordinated loans or debt may, and generally will, rank lower in priority of payment to Senior Loans and second lien loans of the
| abrdn Income Credit Strategies Fund | 43 |
Additional Information Regarding the Fund (Unaudited) (continued)
borrower. Subordinated secured loans or debt typically are secured by a lower priority security interest in or lien on specified collateral, and typically have more subordinated protections and rights than Senior Loans and second lien loans. Subordinated loans may have fixed or adjustable floating rate interest payments. Because subordinated loans may rank lower as to priority of payment than Senior Loans and second lien loans of the borrower, they may present a greater degree of investment risk than Senior Loans and second lien loans but often pay interest at higher rates reflecting this additional risk. Other than their more subordinated status, such investments have many characteristics and risks similar to Senior Loans and second lien loans discussed above. Subordinated interests of below investment grade quality share risks similar to those of below investment grade securities.
Unsecured loans or debt generally have lower priority in right of payment compared to holders of secured loans of the borrower. Unsecured loans are not secured by a security interest in or lien on specified collateral. Unsecured loans by their terms may be or may become subordinate in right of payment to other obligations of the borrower, including Senior Loans, second lien loans and other debt. Unsecured loans may have fixed or adjustable floating rate interest payments. Because unsecured loans are subordinate to the Senior Loans and secured debt of the borrower, they may present a greater degree of investment risk but often pay interest at higher rates reflecting this additional risk. Unsecured interests of below investment grade quality share risks similar to those associated with other below investment grade securities.
Structured Products
The Fund may also invest in structured products, including collateralized debt obligations (“CDOs”), collateralized bond obligations (“CBOs”), collateralized loan obligations (“CLOs”), structured notes, credit-linked notes and other types of structured products. Generally, investments in structured products are interests in entities organized and operated for the purpose of restructuring the investment characteristics of the underlying investment interests or securities. These investment entities may be structured as trusts or other types of pooled investment vehicles. This type of restructuring generally involves the deposit with or purchase by an entity of the underlying investments and the issuance by that entity of one or more classes of securities backed by, or representing interests in, the underlying investments or referencing an indicator related to such investments. The cash flow or rate of return on the underlying investments may be apportioned among the newly issued securities to create different investment characteristics, such as varying maturities, credit quality, payment priorities and interest rate provisions. The cash flow or rate of return on a structured product may be determined by applying a multiplier to the rate of total return on the underlying investments or referenced indicator. Application of
a multiplier is comparable to the use of financial leverage, both being speculative techniques. Leverage magnifies the potential for gain and the risk of loss. As a result, a relatively small decline in the value of the underlying investments or referenced indicator could result in a relatively large loss in the value of a structured product. Holders of structured products bear risks of the underlying investment, index or reference obligation (including income risk, credit risk and market risk) and are subject to counterparty risk. Certain structured products may be terminated early by the issuer if it is unable to hedge its obligations under the product, which could result in a loss to the Fund. In addition, the Fund may invest in other derivative instruments that are developed over time if their use would be consistent with the objectives of the Fund.
CDOs, CBOs and CLOs are types of asset-backed securities issued by special purpose vehicles created to reapportion the risk and return characteristics of a pool of assets. The underlying pool for a CLO, for example, may include domestic and foreign Senior Loans, senior unsecured loans and subordinate corporate loans, including loans that may be rated below investment grade or equivalent unrated loans. For CDOs, CBOs and CLOs, the cash flows are split into two or more portions, called tranches, varying in risk and yield. The assets, typically Senior Loans, are used as collateral supporting the various debt tranches issued by the special purpose vehicle. The key feature of these structures is the prioritization of the cash flows from a pool of underlying securities among the several classes of securities issued by a structured product. CBOs are structured debt securities backed by a diversified pool of high yield, public or private fixed income securities. These may be fixed pools or may be "market value" (or managed) pools of collateral. The riskiest portion is the "equity" tranche which bears the bulk of defaults from the bonds or loans in the trust and serves to protect to some degree the other, more senior tranches from default. Since it is partially protected from defaults, a senior tranche typically has higher ratings and lower yields than its underlying securities, and can be rated investment grade. Despite the protection from the equity tranche, the various tranches can experience substantial losses due to actual defaults, increased sensitivity to defaults due to collateral default and disappearance of protecting tranches, market anticipation of defaults, as well as aversion to such securities as a class.
Certain structured products may be thinly traded or have a limited trading market and may have the effect of increasing the Fund's illiquidity to the extent that the Fund, at a particular point in time, may be unable to find qualified buyers for, and may have difficulty valuing, these securities. CBOs, CLOs and other CDOs are typically privately offered and sold, and thus, are not registered under the securities laws. As a result, investments in CDOs may be characterized by the Fund as illiquid securities; however, an active dealer market may exist for CDOs allowing a CDO to be considered
| 44 | abrdn Income Credit Strategies Fund |
Additional Information Regarding the Fund (Unaudited) (continued)
liquid in some circumstances. In addition to the general risks associated with fixed income securities discussed herein, CDOs carry additional risks including, but not limited to: (i) the possibility that distributions from collateral securities will not be adequate to make interest or other payments; (ii) the quality of the collateral may decline in value or the collateral may go into default; (iii) the possibility that the CDOs are subordinate to other classes of obligations issued by the same issuer; and (iv) the complex structure of the security may not be fully understood at the time of investment and may produce disputes with the issuer or unexpected investment results.
Structured notes are derivative securities for which the amount of principal repayment and/or interest payments is based on the movement of one or more "factors." These factors include, but are not limited to: currency exchange rates, interest rates (such as the prime lending rate or LIBOR), referenced bonds and stock indices. Some of these factors may or may not correlate to the total rate of return on one or more underlying instruments referenced in such notes. In some cases, the impact of the movements of these factors may increase or decrease through the use of multipliers or deflators. A credit-linked note is a derivative instrument that is an obligation between two or more parties where the payment of principal and/or interest is based on the performance of some obligation (a reference obligation).
The Fund may have the right to receive payments to which it is entitled only from the issuer of the structured product, and generally does not have direct rights against the issuer of, or the entity that sold, the assets underlying the structured product. While certain structured products enable the investor to acquire interests in a pool of securities without the brokerage and other expenses associated with directly holding such securities, investors in structured products generally pay their share of the structured product's administrative and other expenses.
Structured products may be private investment funds (structured as trusts or other types of pooled investment companies that are excluded from the definition of "investment company" under the 1940 Act by the operation of Section 3(c)(1) or 3(c)(7) thereof) or investment companies that are registered under the 1940 Act. Investment in such products involves operating expenses and fees that are in addition to the expenses and fees of the Fund, and such expenses and fees are borne indirectly by holders of the Fund's Common Shares.
Swaps
The Fund may enter into swap transactions, including credit default, total return, index and interest rate swap agreements, as well as options thereon, and may purchase or sell interest rate caps, floors and collars. A swap is a derivative in the form of an agreement to
exchange the return generated by one instrument for the return generated by another instrument. A swap transaction involves swapping one or more investment characteristics of a security or a basket of securities with another party. The payment streams are calculated by reference to the investment characteristic(s) chosen applied to an agreed upon notional amount.
The Fund may write (sell) and purchase put and call swap options. A swap option, or swaption, is a contract that gives a counterparty the right (but not the obligation) to enter into a new swap agreement or to shorten, extend, cancel or otherwise modify an existing swap agreement, at some designated future time on specified terms.
Swaps generally do not involve the delivery of securities, other underlying assets or principal. Accordingly, the risk of loss with respect to swaps is limited to the net amount of payments that the Fund is contractually obligated to make. However, because some swap agreements have a leverage component, adverse changes in the value or level of the underlying asset, reference rate, or index can result in a loss substantially greater than the amount invested in the swap itself. If the other party to a swap defaults, the Fund's risk of loss consists of the net amount of payments that the Fund is contractually entitled to receive. Currency swaps usually involve the delivery of the entire principal value of one designated currency in exchange for the other designated currency. Therefore, the entire principal value of a currency swap is subject to the risk that the other party to the swap will default on its contractual delivery obligations. If there is a default by the counterparty, the Fund may have contractual remedies pursuant to the agreements related to the transaction.
The Fund may engage in swaptions for hedging purposes, to manage and mitigate credit and interest rate risks and to gain exposure to credit obligations. The use of swaptions involves risks, including, among others, (i) changes in the market value of securities held by the Fund, and of swaptions relating to those securities may not be proportionate, (ii) there may not be a liquid market to sell a swaption, which could result in difficulty closing a position, (iii) swaptions can magnify the extent of losses incurred due to changes in the market value of the securities to which they relate and (iv) counterparty risk.
The Fund will usually enter into swaps on a net basis, i.e., the two payment streams are netted out in a cash settlement on the payment date or dates specified in the instrument, with the Fund receiving or paying, as the case may be, only the net amount of the two payments. The Fund may enter into over-the-counter derivatives transactions (swaps, caps, floors and puts).
It is possible that government regulation of various types of derivative instruments, including futures and swap agreements, may limit or prevent the Fund from using such instruments as part of its investment strategy, which could negatively impact the Fund.
| abrdn Income Credit Strategies Fund | 45 |
Additional Information Regarding the Fund (Unaudited) (continued)
Foreign Securities
The Fund may invest without limitation in securities of borrowers that are organized or located in countries other than the United States, including non-U.S. dollar denominated securities and may invest without limitation in obligations of issuers located in emerging market countries. The percentage of assets invested in securities of a particular country or denominated in a particular currency will vary in accordance with the Fund's assessment of the relative yield, appreciation potential and the relationship of a country's currency to the U.S. dollar, which is based upon such factors as fundamental economic strength, credit quality and interest rate trends. Investments in securities of foreign issuers present certain risks not ordinarily associated with investments in securities of U.S. issuers, including that non-U.S. issuers may be subject to less rigorous accounting and reporting requirements than U.S. issuers, less rigorous regulatory requirements, different and perhaps not as well formulated and defined legal systems and laws relating to creditors' rights, the potential inability to enforce legal judgments and the potential for political, social and economic adversity. Investments by the Fund in non-U.S. dollar denominated investments will be subject to substantially similar risks to those associated with direct investment in securities of foreign issuers, and are subject to currency risk as well. Currency risk is the risk that fluctuations in the exchange rates between the U.S. dollar and non-U.S. currencies may negatively affect an investment. The value of investments denominated in non-U.S. currencies may fluctuate based on changes in the value of those currencies relative to the U.S. dollar, and a decline in applicable foreign exchange rates could reduce the value of such investments held by the Fund. The Fund may also hold non-U.S. dollar denominated Senior Loans or other securities received as part of a reorganization or restructuring. In addition, the underlying issuers of certain depositary receipts, particularly unsponsored or unregistered depositary receipts, are under no obligation to distribute shareholder communications to the holders of such receipts, or to pass through to them any voting rights with respect to the deposited securities.
The foreign securities in which the Fund may invest may be issued by companies or governments located in emerging market countries. Investing in the securities of issuers operating in emerging markets involves a high degree of risk and special considerations not typically associated with investing in the securities of other foreign or U.S. issuers. Compared to the United States and other developed countries, emerging market countries may have relatively unstable governments, economies based on only a few industries and securities markets that trade a small number of securities. Securities issued by companies or governments located in emerging market countries tend to be especially volatile and may be less liquid than securities traded in developed countries. Securities in these countries have been characterized by greater potential loss than securities of companies and governments located in developed countries.
Investments in the securities of issuers located in emerging markets could be affected by risks associated with expropriation and/or nationalization, political or social instability, pervasiveness of corruption and crime, armed conflict, the impact on the economy of civil war, religious or ethnic unrest and the withdrawal or non-renewal of any license enabling the Fund to trade in securities of a particular country, confiscatory taxation, restrictions on transfers of assets, lack of uniform accounting and auditing standards, less publicly available financial and other information, diplomatic development which could affect U.S. investments in those countries and potential difficulties in enforcing contractual obligations.
Since the Fund may invest in securities of foreign issuers denominated in the local currency, changes in foreign currency exchange rates will affect the value of securities in the Fund's portfolio and the unrealized appreciation or depreciation of investments. In addition to changes in the value of the Fund's portfolio investments resulting from currency fluctuations, the Fund may incur costs in connection with conversions between various currencies. The Fund may also invest directly in currencies for hedging purposes. The Fund is subject to the risk that those currencies will decline in value relative to the U.S. dollar. The values of the currencies of the emerging market countries in which the Fund may invest may be subject to a high degree of fluctuation due to changes in interest rates, the effects of monetary policies issued by the United States, foreign governments, central banks or supranational entities, the imposition of currency controls or due to other national or global political or economic developments. Foreign exchange dealers realize a profit based on the difference between the prices at which they are buying and selling various currencies. Thus, a dealer normally will offer to sell a foreign currency to the Fund at one rate, while offering a lesser rate of exchange should the Fund desire immediately to resell that currency to the dealer. The Fund conducts its foreign currency exchange transactions either on a spot (i.e., cash) basis at the spot rate prevailing in the foreign currency exchange market, or through entering into forward, futures or options contracts to purchase or sell foreign currencies. Therefore, the Fund's exposure to foreign currencies may result in reduced returns to the Fund. The Fund may also engage in foreign currency hedging transactions.
Investing in Euro-denominated (or other European currency-denominated) securities entails risk of being exposed to a currency that may not fully reflect the strengths and weaknesses of the disparate European economies. In addition, it is possible that the Euro could be abandoned in the future by countries that have already adopted its use. The effects of such an abandonment on the applicable country and the rest of the EMU are uncertain but could be negative and severe. Many European countries rely heavily upon export-dependent businesses and any change in the exchange rate between the Euro and the U.S. dollar can have either a positive or a negative effect upon corporate profits and the performance of
| 46 | abrdn Income Credit Strategies Fund |
Additional Information Regarding the Fund (Unaudited) (continued)
investments in the European Union. Moreover, the possibility of one or more European countries exiting the EMU, or even of the collapse of the Euro as a common currency, has arisen. The effects of the collapse of the Euro, or of the exit of one or more countries from the EMU, on the United States and global economy and securities markets are impossible to predict and any such events could have a significant adverse impact on the value and risk profile of the Fund's portfolio.
Foreign currency transactions. The Fund may enter into foreign exchange forward contracts ("forward contracts") for hedging or portfolio management purposes. A forward contract involves an obligation to purchase or sell a specific currency at a future date, which may be any fixed number of days from the date of the contract agreed upon by the parties, at a price set at the time of the contract. These contracts are traded in the interbank market conducted directly between currency traders (usually large, commercial and investment banks) and their customers. A non-deliverable currency forward contract is typically a short-term forward contract on a thinly traded non-convertible foreign currency where the profit and loss is the difference between a specified exchange rate and the spot rate at the time of settlement. A forward contract generally has no deposit requirement, and no commissions are charged at any stage for trades. By entering into a forward contract for the purchase or sale, for a fixed amount of dollars or other currency, of the amount of foreign currency involved in the underlying security transactions, the Fund may be able to protect itself against a possible loss resulting from an adverse change in the relationship between the U.S. dollar or other currency which is being used for the security purchase and the foreign currency in which the security is denominated during the period between the date on which the security is purchased or sold and the date on which payment is made or received. They may also be used to lock in the current exchange rate of the currency in which those securities anticipated to be purchased are denominated. At times, the Fund may enter into "cross-currency" hedging transactions involving currencies other than those in which securities that are held or proposed to be purchased are denominated. The Fund may also enter into currency swap transactions. A currency swap generally involves an agreement to pay interest streams in one currency based on a specified index in exchange for receiving interest streams denominated in another currency. Such swaps also usually involve initial and final exchanges of the designated currency that correspond to an agreed upon notional amount. Currency swaps usually involve the delivery of the entire principal value of one designated currency in exchange for the other designated currency. Therefore, the entire principal value of a currency swap is subject to the risk that the other party to the swap will default on its contractual delivery obligations.
The Fund may conduct its foreign currency exchange transactions either on a spot (i.e., cash) basis at the spot rate prevailing in the
foreign currency exchange market, or through entering into forward contracts to purchase or sell foreign currencies. The Fund will not enter into forward contracts or maintain a net exposure to these contracts where the consummation of the contracts would obligate the Fund to deliver an amount of foreign currency in excess of the value of the Fund's portfolio securities. When required by law, the Fund will cause its custodian bank to earmark cash or other liquid portfolio securities in an amount equal to the net amounts of the Fund's currency exposure under its forward contracts. If the value of the securities so earmarked declines, additional cash or liquid securities will be earmarked on a daily basis so that the value of such securities will equal the net amount of the Fund's currency exposure with respect to such contracts. Forward contracts may limit gains on portfolio securities that could otherwise be realized had they not been utilized and could result in losses. The contracts may also increase the Fund's volatility and may involve a significant amount of risk relative to the investment of cash.
Although the Fund values its assets daily in terms of U.S. dollars, it does not intend to convert its holdings of foreign currencies into U.S. dollars on a daily basis. It will, however, do so from time to time, and investors should be aware of the costs of currency conversion. Although foreign exchange dealers do not typically charge a separate fee for conversion, they do realize a profit based on the spread between the prices at which they are buying and selling various currencies. Thus, a dealer may offer to sell a foreign currency to the Fund at one rate, while offering a lesser rate of exchange should the Fund desire to resell that currency to the dealer.
Other Derivative Instruments
The Fund is permitted to use certain derivative instruments as portfolio management or hedging techniques. The Fund may seek to protect against possible adverse changes in the market value of securities held in or to be purchased for the Fund's portfolio, protect the Fund's unrealized gains, facilitate the sale of certain securities for investment purposes, protect against changes in currency exchange rates or adjust the exposure to a particular currency, manage the effective maturity or duration of the Fund's portfolio, or establish positions in the derivatives markets as a substitute for purchasing or selling particular securities. The Fund may also use derivative instruments to earn income. Among derivative instruments the Fund may utilize are forward contracts, options, futures contracts and options on futures contracts. In addition, the Fund may invest in other derivative instruments that are developed over time if their use would be consistent with the objectives of the Fund. However, currently, the Fund intends to use derivatives, primarily forward contracts, to hedge foreign currency risk, as described immediately above under “Foreign currency transactions”.
| abrdn Income Credit Strategies Fund | 47 |
Additional Information Regarding the Fund (Unaudited) (continued)
Derivative instruments have risks, including the imperfect correlation between the value of such instruments and the underlying assets, the possible default of the other party to the transaction and illiquidity of the derivative instrument. Furthermore, the ability to successfully use derivative instruments depends on the ability of the Fund to predict pertinent market movements, which cannot be assured. In addition, transactions in such instruments may involve commissions and other costs, which may increase the Fund's expenses and reduce its return. Thus, the use of derivative instruments may result in losses greater than if they had not been used, may require the Fund to sell or purchase portfolio securities at inopportune times or for prices other than current market values, may limit the amount of appreciation the Fund can otherwise realize on an investment, or may cause the Fund to hold a security that it might otherwise sell. In addition, amounts paid as premiums and cash or other assets held in margin accounts with respect to derivative instruments are not otherwise available to the Fund for investment purposes.
When conducted outside the United States, transactions in derivative instruments may not be regulated as rigorously as in the United States, may not involve a clearing mechanism and related guarantees, and are subject to the risk of governmental actions affecting trading in, or the prices of, foreign securities, currencies and other instruments. The value of such positions also could be adversely affected by: (i) other complex foreign political, legal and economic factors; (ii) lesser availability than in the United States of data on which to make trading decisions; (iii) delays in the Fund's ability to act upon economic events occurring in foreign markets during non-business hours in the United States; (iv) the imposition of different exercise and settlement terms and procedures and margin requirements than in the United States and (v) lower trading volume and liquidity.
Equity Securities
Common stock generally represents an ownership or equity interest in an issuer, without preference over any other class of securities, including such issuer's debt securities, preferred stock and other senior equity securities. Common stocks are entitled to the income and increase in the value of the assets and business of the issuer after all its debt obligations and obligations to preferred stockholders are satisfied. Common stocks generally have voting rights. Common stocks fluctuate in price in response to many factors including historical and prospective earnings of the issuer, the value of its assets, general economic conditions, interest rates, investor perceptions and market liquidity. They may or may not pay dividends, as some issuers reinvest all of their profits back into their businesses, while others pay out some of their profits to stockholders as dividends, while others do not generate sufficient income to support a dividend.
Securities of other investment companies
The Fund may invest its assets in securities of other open- and closed-end investment companies, including affiliated registered investment companies to the extent permitted by the 1940 Act. As a shareholder in an investment company, the Fund will bear its ratable share of that investment company's expenses, and will remain subject to payment of the Fund's investment advisory and other fees and expenses with respect to assets so invested. Common Shareholders will therefore be subject to duplicative expenses to the extent that the Fund invests in other investment companies. Expenses will be taken into account when evaluating the merits of such investments. In addition, the securities of other investment companies may also be leveraged and will therefore be subject to certain leverage risks. The NAV and market value of leveraged securities will be more volatile and the yield to stockholders will tend to fluctuate more than the yield generated by unleveraged securities. Investment companies may have investment policies that differ from those of the Fund. If the Fund invests in securities issued by an investment company that are not credit obligations, such investment will only count toward the Fund's 80% portfolio guideline if the investment company itself has a policy to invest at least 80% of its assets in credit obligations.
Zero coupon bonds
Certain debt obligations purchased by the Fund may take the form of zero coupon bonds. A zero coupon bond is a bond that does not pay interest either for the entire life of the obligation or for an initial period after the issuance of the obligation. When held to its maturity, its return comes from the difference between the purchase price and its maturity value. A zero coupon bond is normally issued and traded at a deep discount from face value. Zero coupon bonds allow an issuer to avoid or delay the need to generate cash to meet current interest payments and, as a result, may involve greater market risk and credit risk than bonds that pay interest currently or in cash. The Fund would be required to distribute the income on any of these instruments as it accrues, even though the Fund will not receive all of the income on a current basis or in cash. Thus, the Fund may have to sell other investments, including when it may not be advisable to do so, to make income distributions to its shareholders. Distributions attributable to the Fund's "original issue discount" income accruing on zero coupon bonds, and of all other ordinary income, will generally be taxable to the Common Shareholders as ordinary income. As a consequence of selling investments in order to make distributions of "original issue discount" income and other income in respect of which the Fund has not received a corresponding amount of cash, the Fund may realize additional income that gives rise to additional distribution requirements; distributions of such additional income may be taxable to the Common Shareholders as ordinary income or as long-term capital gain depending on which investments are sold.
| 48 | abrdn Income Credit Strategies Fund |
Additional Information Regarding the Fund (Unaudited) (continued)
Repurchase agreements and reverse repurchase agreements
The Fund may engage in repurchase agreements with broker-dealers, banks and other financial institutions to earn incremental income on temporarily available cash which would otherwise be uninvested. A repurchase agreement is a short-term investment in which the purchaser (i.e., the Fund) acquires ownership of a security and the seller agrees to repurchase the obligation at a future time and set price, thereby determining the yield during the holding period. Repurchase agreements involve certain risks in the event of default by the other party. The Fund may enter into repurchase agreements with broker-dealers, banks and other financial institutions deemed to be creditworthy.
Repurchase agreements are required to be fully collateralized by the underlying securities and are considered to be loans under the 1940 Act. The Fund pays for such securities only upon physical delivery or evidence of book entry transfer to the account of a custodian or bank acting as agent. The seller under a repurchase agreement will be required to maintain the value of the underlying collateral securities marked-to-market daily at not less than the repurchase price. The underlying securities (normally securities of the U.S. government and its agencies or instrumentalities) may have maturity dates exceeding one (1) year.
The Fund may borrow through entering into reverse repurchase agreements under which the Fund sells portfolio investments to financial institutions such as banks and broker-dealers and generally agrees to repurchase them at a mutually agreed future date and price. Generally, the effect of a reverse repurchase agreement is that, during the term of the agreement, the Fund can obtain and reinvest all or most of the cash value of the portfolio investment it sold under the agreement and still be entitled to the returns associated with such portfolio investment—thereby resulting in a transaction similar to a borrowing and giving rise to leverage for the Fund. The Fund may utilize reverse repurchase agreements when it is anticipated that the interest income to be earned from the investment of the proceeds of the transaction is greater than the interest expense of the transaction.
In the event the buyer of securities under a reverse repurchase agreement files for bankruptcy or becomes insolvent, the Fund's use of the proceeds of the agreement may be restricted pending a determination by the other party, or its trustee or receiver, whether to enforce the Fund's obligation to repurchase the securities. Reverse repurchase agreements are considered to be borrowings under the 1940 Act unless the Fund segregates an amount of cash and/or liquid securities equal to the Fund's obligations under the reverse repurchase agreements (or segregates such other amount permitted by the 1940 Act or SEC guidance from time to time).
When-issued and delayed delivery securities
The Fund may purchase and sell securities on a "when-issued" or "delayed delivery" basis whereby the Fund buys or sells a security with payment and delivery taking place in the future. The payment obligation and the interest rate are fixed at the time the Fund enters into the commitment. No income accrues to the Fund on securities in connection with such transactions prior to the date the Fund actually takes delivery of such securities. These transactions are subject to market risk as the value or yield of a security at delivery may be more or less than the purchase price or the yield generally available on securities when delivery occurs. In addition, the Fund is subject to counterparty risk because it relies on the buyer or seller, as the case may be, to consummate the transaction, and failure by the other party to complete the transaction may result in the Fund missing the opportunity of obtaining a price or yield considered to be advantageous. When the Fund is the buyer in such a transaction, however, it will segregate cash and/or liquid securities having an aggregate value at least equal to the amount of such purchase commitments until payment is made. An increase in the percentage of the Fund's assets committed to the purchase of securities on a when-issued or delayed delivery basis may increase the volatility of the Fund's NAV.
Private placements and restricted securities
The Fund may invest in securities which are subject to restrictions on resale because they have not been registered under the Securities Act. These securities are generally referred to as private placements or restricted securities. Limitations on the resale of these securities may have an adverse effect on their marketability, and may prevent the Fund from disposing of them promptly at reasonable prices. The Fund may have to bear the expense of registering the securities for resale and the risk of substantial delays in effecting the registration.
The Fund has no liquidity limitation or restriction; thus, some or all of the Fund investments may be in illiquid securities. At times, private placements or restricted securities, as well as other securities in which the Fund may invest, may be deemed illiquid. Investments in illiquid securities tend to restrict the Fund's ability to dispose of instruments in a timely fashion and restrict the Fund's ability to take advantage of market opportunities.
Short sales
The Fund may engage in short sales. A short sale is a transaction in which the Fund sells an instrument that it does not own in anticipation that the market price will decline. To deliver the securities to the buyer, the Fund arranges through a broker to borrow the securities and, in so doing, the Fund becomes obligated to replace the securities borrowed at their market price at the time of replacement. When selling short, the Fund intends to replace the securities at a lower price and therefore, profit from the difference between the cost
| abrdn Income Credit Strategies Fund | 49 |
Additional Information Regarding the Fund (Unaudited) (continued)
to replace the securities and the proceeds received from the sale of the securities. When the Fund makes a short sale, the proceeds it receives from the sale will be held on behalf of a broker until the Fund replaces the borrowed securities. The Fund may have to pay a premium to borrow the securities and must pay any dividends or interest payable on the securities until they are replaced. The Fund's obligation to replace the securities borrowed in connection with a short sale will be secured by collateral deposited with the broker that consists of cash and/or liquid securities. Short sales involve certain risks and special considerations. If the Fund incorrectly predicts that the price of the borrowed security will decline, the Fund will have to replace the securities with securities with a greater value than the amount received from the sale. As a result, losses from short sales differ from losses that could be incurred from a purchase of a security, because losses from short sales may be unlimited, whereas losses from purchases can equal only the total amount invested.
Warrants
Warrants give holders the right, but not the obligation, to buy common stock of an issuer at a given price, usually higher than the market price at the time of issuance, during a specified period. The risk of investing in a warrant is that the warrant may expire prior to the market value of the common stock exceeding the price fixed by the warrant. Warrants have a subordinate claim on a borrower's assets compared with Senior Loans. As a result, the values of warrants generally are dependent on the financial condition of the borrower and less dependent on fluctuations in interest rates than are the values of many debt securities. The values of warrants may be more volatile than those of Senior Loans and this may increase the volatility of the Fund's NAV of the Common Shares.
Temporary investments
During the period in which the net proceeds of this offering are being invested, in order to keep the Fund's cash fully invested and, for defensive purposes, during periods in which the Advisers believe that changes in economic, financial or political conditions make it advisable to do so, the Fund may reduce its primary investment holdings (when taking a defensive position) and invest in certain short-term (less than one (1) year to maturity) and medium-term (not greater than five (5) years to maturity) debt securities or hold cash. The short-term and medium-term debt securities in which the Fund may invest consist of: (i) obligations of the U.S. government, its agencies or instrumentalities; (ii) bank deposits and bank obligations (including certificates of deposit, time deposits and bankers' acceptances) of U.S. or foreign banks denominated in any currency; (iii) floating rate securities and other instruments denominated in any currency issued by various governments or international development agencies; (iv) finance company and corporate commercial paper and other short-term corporate debt obligations of
U.S. or foreign corporations; (v) repurchase agreements with banks and broker-dealers with respect to such securities; and (vi) shares of money market funds. The Fund intends to invest for these temporary purposes only in short-term and medium-term debt securities that the Advisers believe to be of high quality, i.e., subject to relatively low risk of loss of interest or principal. In taking such positions, the Fund temporarily would not be pursuing and may not achieve its investment objectives. It is impossible to predict when, or for how long, the Fund will use these alternative strategies. There can be no assurance that such strategies will be successful.
Risk Factors
Market Risk. Market risk is the possibility that the market values of securities owned by the Fund will decline. The values of fixed income securities tend to fall as interest rates rise, and such declines tend to be greater among fixed income securities with longer remaining maturities. Market risk is often greater among certain types of fixed income securities, such as zero coupon bonds which do not make regular interest payments but are instead bought at a discount to their face values and paid in full upon maturity. As interest rates change, these securities often fluctuate more in price than securities that make regular interest payments and therefore subject the Fund to greater market risk than a fund that does not own these types of securities. The values of adjustable, variable or floating rate income securities tend to have less fluctuation in response to changes in interest rates, but will have some fluctuation particularly when the next interest rate adjustment on such security is further away in time or adjustments are limited in number or degree over time. The Fund has no policy limiting the maturity of credit obligations it purchases. Such obligations often have mandatory and optional prepayment provisions and because of prepayments, the actual remaining maturity of loans and debts may be considerably less than their stated maturity. Obligations with longer remaining maturities or durations generally expose the Fund to more market risk. When-issued and delayed delivery transactions are subject to changes in market conditions from the time of the commitment until settlement. This may adversely affect the prices or yields of the securities being purchased. The greater the Fund’s outstanding commitments for these securities, the greater the Fund’s exposure to market price fluctuations. Interest rate risk can be considered a type of market risk.
Credit Risk. Credit risk refers to the possibility that the issuer of a security will be unable to make timely interest payments and/or repay the principal on its debt. Because the Fund may invest, without limitation, in securities that are below investment grade, the Fund is subject to a greater degree of credit risk than a fund investing primarily in investment grade securities. Below investment grade securities (that is, securities rated Ba or lower by Moody’s or BB or lower by S&P) are commonly referred to as “junk” securities.
| 50 | abrdn Income Credit Strategies Fund |
Additional Information Regarding the Fund (Unaudited) (continued)
Generally, lower-grade securities provide a higher yield than higher-grade securities of similar maturity but are subject to greater risks, such as greater credit risk, greater market risk and volatility, greater liquidity concerns and potentially greater manager risk. Such securities are generally regarded as predominantly speculative with respect to the issuers’ capacities to pay interest or repay principal in accordance with their terms. Lower-grade securities are more susceptible to non-payment of interest and principal and default than higher-grade securities and are more sensitive to specific issuer developments or real or perceived general adverse economic changes than higher-grade securities. The market for lower-grade securities may also have less information available than the market for other securities, further complicating evaluations and valuations of such securities and placing more emphasis on the experience, judgment and analysis of the Advisers.
Credit obligations of stressed and distressed issuers (including those that are in covenant or payment default) are subject to a multitude of legal, industry, market, economic and governmental forces each of which make analysis of these companies inherently difficult. The Advisers rely on company management, outside experts, market research and personal experience to analyze potential investments. There can be no assurance that any of these sources will provide credible information, or that the Advisers’ analysis will produce conclusions that lead to profitable investments. Obligations of stressed and distressed issuers generally trade significantly below par and are considered speculative. The repayment of defaulted obligations is subject to significant uncertainties. Defaulted obligations might be repaid only after lengthy workout or bankruptcy proceedings or result in only partial recovery of cash payments or an exchange of the defaulted obligation for other debt or equity securities of the issuer or its affiliates, which may in turn be illiquid or speculative. There are a number of significant risks inherent in the bankruptcy process. Many events in a bankruptcy are the product of contested matters and adversary proceedings and are beyond the control of the creditors. A bankruptcy court may approve actions that would be contrary to the interests of the Fund. A bankruptcy filing by an issuer may cause such issuer to lose its market position and key employees and otherwise become incapable of restoring itself as a viable entity, and its liquidation value may be less than its value was believed to be at the time of investment. In addition, the duration of a bankruptcy proceeding is difficult to predict and, as such, a creditor’s return on investment can be adversely affected by delays while the plan of reorganization is being negotiated, approved by the creditors and confirmed by the bankruptcy court and until it ultimately becomes effective. The administrative costs in connection with a bankruptcy proceeding are frequently high and would be paid out of the debtor’s estate prior to any return to creditors. Further, in the early stages of the bankruptcy process it is often difficult to estimate the extent of any contingent claims that might be made and, as such,
there is a risk that the Fund’s influence with respect to the class of obligations it owns could be lost by increases in the number and amount of claims in that class or by different classification and treatment. A creditor, such as the Fund, can also lose its ranking and priority if it is determined that such creditor exercised “domination and control” over a debtor and other creditors can demonstrate that they have been harmed by such actions. In addition, certain claims have priority by law, such as claims for taxes, which may be substantial and could affect the ability of the Fund to be repaid.
In any investment involving stressed or distressed obligations, there is a risk that the transaction involving such debt obligations will be unsuccessful, take considerable time or will result in a distribution of cash or a new security or obligation in exchange for the stressed or distressed obligations, the value of which may be less than the Fund’s purchase price of such obligations. Furthermore, if an anticipated transaction does not occur, the Fund may be required to sell its investment at a loss. However, investments in equity securities obtained through debt restructurings or bankruptcy proceedings may be illiquid and thus difficult or impossible to sell.
Interest Rate and Income Risk. The income you receive from the Fund is based in large part on interest rates, which can vary widely over the short and long term. If interest rates drop, your income from the Fund may drop as well. The more the Fund invests in adjustable, variable or floating rate securities or in securities susceptible to prepayment risk, the greater the Fund’s income risk. The current low interest rate environment increases the risks associated with rising interest rates, including the potential for periods of volatility and increased redemptions. The Fund may be subject to a greater risk of rising interest rates due to the recent period of historically low rates and the effect of potential government fiscal policy initiatives and resulting market reaction to those initiatives. Securities with longer durations are likely to be more sensitive to changes in interest rates, generally making them more volatile than securities with shorter durations. Lower rated fixed income securities have greater volatility because there is less certainty that principal and interest payments will be made as scheduled.
Prepayment or Call Risk. If interest rates fall, it is possible that issuers of fixed income securities with high interest rates will prepay or “call” their securities before their maturity dates. In this event, the proceeds from the prepaid or called securities would likely be reinvested by the Fund in securities bearing the new, lower interest rates, resulting in a possible decline in the Fund’s income and distributions to shareholders.
Risks of Senior Loans. There is less readily available and reliable information about most Senior Loans than is the case for many other types of instruments, including listed securities. Senior Loans are not listed on any national securities exchange or automated quotation
| abrdn Income Credit Strategies Fund | 51 |
Additional Information Regarding the Fund (Unaudited) (continued)
system and as such, many Senior Loans are illiquid, meaning that the Fund may not be able to sell them quickly at a fair price. To the extent that a secondary market does exist for certain Senior Loans, the market is more volatile than for liquid, listed securities and may be subject to irregular trading activity, wide bid/ask spreads and extended trade settlement periods. The market for Senior Loans could be disrupted in the event of an economic downturn or a substantial increase or decrease in interest rates, resulting in fluctuations in the NAV of the Fund’s common shares (“Common Shares”) and difficulty in valuing the Fund’s portfolio of Senior Loans. Although the Advisers believe that the Fund’s investments in adjustable rate Senior Loans could limit fluctuations in the NAV of the Fund’s Common Shares as a result of changes in interest rates, extraordinary and sudden changes in interest rates could nevertheless disrupt the market for such Senior Loans and result in fluctuations in the NAV of the Fund’s Common Shares and difficulty in valuing the Fund’s portfolio of Senior Loans. Senior Loans, like most other debt obligations, are subject to the risk of default. Default in the payment of interest or principal on a Senior Loan will result in a reduction of income to the Fund, a reduction in the value of the Senior Loan and a potential decrease in the NAV of the Fund’s Common Shares. The risk of default will increase in the event of an economic downturn or a substantial increase in interest rates. The Advisers rely primarily on their own evaluation of borrower credit quality rather than on any available independent sources. As a result, the Fund is particularly dependent on the analytical abilities of the Advisers.
The Fund may acquire or hold Senior Loans of borrowers that are experiencing, or are more likely to experience, financial difficulty, including Senior Loans issued to highly leveraged borrowers or borrowers that have filed for bankruptcy protection. Borrowers may have outstanding debt obligations, including Senior Loans that are rated below investment grade. The Fund may invest a substantial portion of its assets in Senior Loans that are rated below investment grade or that are unrated at the time of purchase but are deemed by the Advisers to be of comparable quality. If a Senior Loan is rated at the time of purchase, the Fund may consider the rating when evaluating the Senior Loan but, in any event, does not view ratings as a determinative factor in investment decisions. As a result, the Fund is dependent on the credit analytical abilities of the Advisers. Because of the protective terms of Senior Loans, the Advisers believe that the Fund is more likely to recover more of its investment in a defaulted Senior Loan than would be the case for most other types of defaulted credit obligations. The values of Senior Loans of borrowers that have filed for bankruptcy protection or that are experiencing payment difficulty could be affected by, among other things, the assessment of the likelihood that the lenders ultimately will receive repayment of the principal amount of such Senior Loans, the likely duration, if any, of a lapse in the scheduled payment of interest and repayment of principal and prevailing interest rates. There is no assurance that the
Fund will be able to recover any amount on Senior Loans of such borrowers or that sale of the collateral granted in connection with Senior Loans would raise enough cash to satisfy the borrower’s payment obligation or that the collateral can or will be liquidated. In the event of bankruptcy, liquidation may not occur and the bankruptcy court may not give lenders the full benefit of their senior position in the capital structure of the borrower.
The Fund may act as an original lender under Senior Loans or may acquire Senior Loans through assignments or participations. The Fund may make Senior Loans to, or acquire Senior Loans of, borrowers that, at the time of the making or acquisition of the loan by the Fund, are experiencing, or are likely to experience, financial difficulty (including highly leveraged borrowers) and such loans may constitute a material amount of the Fund’s portfolio. The Fund will not make Senior Loans to, or acquire Senior Loans of, borrowers that, at the time of the making or acquisition of the loan by the Fund, are in bankruptcy.
If the Fund acquires a Senior Loan through an assignment agreement, it will typically succeed to all the rights and obligations of the assigning institution and become a lender under the credit agreement with respect to the debt obligation purchased; however, its rights can be more restricted than those of the assigning institution, and, in any event, the Fund may not be able to unilaterally enforce all rights and remedies of the lenders under the loan agreement and with regard to any associated collateral. If the Fund acquires an interest in a Senior Loan through a participation agreement, the Fund will enter into a contractual relationship with the institution selling the participation, not with the borrower. In purchasing participations, the Fund generally will have no right to enforce compliance by the borrower with the terms of the loan agreement or any rights of setoff against the borrower, and the Fund may not directly benefit from the collateral supporting the debt obligation in which it has purchased the participation. As a result, the Fund will be exposed to the credit risk of both the borrower and the institution selling the participation. When purchasing a participation, the Advisers will analyze the credit risk posed by the institution selling the participation. The Advisers rely primarily on their own evaluation of the credit quality of such selling institutions rather than on any available independent sources. As a result, the Fund is particularly dependent on the analytical abilities of the Advisers. Because of the nature of its investments, the Fund may be subject to allegations of lender liability and other claims. In addition, the Securities Act deems certain persons to be “underwriters” if they purchase a security from an issuer and later sell it to the public. Although it is not believed that the application of this Securities Act provision would cause the Fund to be engaged in the business of underwriting, a person who purchases an instrument from the Fund that was acquired by the Fund from the issuer of such instrument could allege otherwise. Under the Securities Act, an
| 52 | abrdn Income Credit Strategies Fund |
Additional Information Regarding the Fund (Unaudited) (continued)
underwriter may be liable for material omissions or misstatements in an issuer’s registration statement or prospectus.
In certain circumstances, Senior Loans may not be deemed to be securities, and in the event of fraud or misrepresentation by a borrower, lenders and purchasers of interests in loans, such as the Fund, will not have the protection of the anti-fraud provisions of the federal securities laws, as would be the case for bonds or stocks. Instead, in such cases, lenders generally rely on the contractual provisions in the loan agreement itself, and common law fraud protections under applicable state law.
Below Investment Grade (High-Yield or Junk Bond) Securities Risk. Fixed income securities rated below investment grade generally offer a higher current yield than that available from higher grade issues, but typically involve greater risk. These securities are especially sensitive to adverse changes in general economic conditions, to changes in the financial condition of their issuers and to price fluctuation in response to changes in interest rates. During periods of economic downturn or rising interest rates, issuers of below investment grade instruments may experience financial stress that could adversely affect their ability to make payments of principal and interest and increase the possibility of default. The secondary market for high-yield securities may not be as liquid as the secondary market for more highly rated securities, a factor which may have an adverse effect on the Fund’s ability to dispose of a particular security. There are fewer dealers in the market for high-yield securities than for investment grade obligations. The prices quoted by different dealers may vary significantly, and the spread between the bid and asked price is generally much larger for high-yield securities than for higher quality instruments. Under continuing adverse market or economic conditions, the secondary market for high-yield securities could contract further, independent of any specific adverse changes in the condition of a particular issuer, and these securities may become illiquid. In addition, adverse publicity and investor perceptions, whether or not based on fundamental analysis, may also decrease the values and liquidity of below investment grade securities, especially in a market characterized by a low volume of trading. Unrated instruments involve the risk that the Advisers may not accurately evaluate the instrument’s comparative credit rating. As a result, the Fund’s investments in unrated instruments depend more heavily on the Advisers’ credit analysis than if the Fund invested in comparable rated instruments. Some unrated securities may not have an active trading market or may be difficult to value, and the Fund might have difficulty selling them at an acceptable price.
LIBOR risk. Under the revolving credit facility, the Fund is charged interest on amounts borrowed at a variable rate, which may be based on the London Interbank Offered Rate (“LIBOR”) plus a spread. Additionally, the Fund may invest in certain debt securities, derivatives or other financial instruments that utilize LIBOR as a
“benchmark” or “reference rate” for various interest rate calculations. In July 2017, the United Kingdom Financial Conduct Authority (“FCA”), which regulates the LIBOR administrator, announced that the FCA will no longer persuade or compel banks to submit rates for the calculation of LIBOR after 2021. However, for US dollar LIBOR, it now appears that the relevant date may be deferred to June 30, 2023 for the most common tenors (overnight and one, three, six and 12 months). As to those tenors, the LIBOR administrator has published a consultation regarding its intention to cease publication of US dollar LIBOR as of June 30, 2023 (instead of December 31, 2021, as previously expected), apparently based on continued rate submissions from banks. The FCA and other regulators have stated that they welcome the LIBOR Administrator’s action. An extension to 2023 would mean that many legacy US dollar LIBOR contracts would terminate before related LIBOR rates cease to be published. However, the same regulators emphasized that, despite any continued publication of US dollar LIBOR through June 30, 2023, no new contracts using US dollar LIBOR should be entered into after December 31, 2021. There is no assurance that LIBOR, of any particular currency and tenor, will continue to be published until any particular date.
Although the financial regulators and industry working groups have suggested alternative reference rates, such as the European Interbank Offer Rate (“EURIBOR”), Sterling Overnight Interbank Average Rate (“SONIA”) and Secured Overnight Financing Rate (“SOFR”), global consensus on alternative rates is incomplete, and the process for amending existing contracts or instruments to transition from LIBOR remains unclear.
It is not possible to predict the effect that these announcements or any such discontinuance will have on LIBOR or on floating rate securities linked to LIBOR (“LIBOR-linked securities”). Many, but not all, LIBOR-linked securities have provisions that will change their interest rate basis upon the occurrence of certain benchmark transitions events. If the calculation agent (or other party in certain cases) for such a security determines that a benchmark transition event and its related benchmark replacement date have occurred with respect to LIBOR for particular LIBOR-linked securities, then a benchmark replacement may be selected by the calculation agent (or other party) in accordance with the benchmark transition provisions of the relevant securities.
The selection of a benchmark replacement, and any decisions, determinations or elections made by the calculation agent (or other party) in connection with implementing a benchmark replacement with respect to LIBOR-linked securities in accordance with the relevant benchmark transition provisions could result in adverse consequences to the interest rate, which could adversely affect the return on, value of and market for LIBOR-linked securities held by the Funds. Further, there is no assurance that the characteristics of any
| abrdn Income Credit Strategies Fund | 53 |
Additional Information Regarding the Fund (Unaudited) (continued)
benchmark replacement will be similar to LIBOR, or that any benchmark replacement will produce the economic equivalent of LIBOR. In addition, these announcements and any additional regulatory or market changes, or any substitute reference rate and any pricing adjustments imposed by a regulator or by counterparties or otherwise may adversely affect the Fund’s performance and/or NAV. Until then, the Fund may continue to invest in instruments that reference such rates or otherwise use such reference rates due to favorable liquidity or pricing.
COVID-19 risk. The COVID-19 pandemic has caused major disruptions to economies and markets around the world, including the markets in which the Fund invests, and which has and may continue to negatively impact the value of certain of the Fund’s investments. Although vaccines for COVID-19 and variants thereof are becoming more widely available, the COVID-19 pandemic and impacts thereof may continue for an extended period of time and may vary from market to market. To the extent the impacts of COVID-19 continue, the Fund may experience negative impacts to its business that could exacerbate other risks to which the Fund is subject. Policy and legislative changes in countries around the world are affecting many aspects of financial regulation, and governmental and quasi-governmental authorities and regulators throughout the world have previously responded to serious economic disruptions with a variety of significant fiscal and monetary policy changes.
The rapid development and fluidity of this situation precludes any prediction as to the ultimate adverse impact of COVID-19 on economic and market conditions, and, as a result, present uncertainty and risk with respect to the Fund and the performance of its investments and ability to pay distributions. The full extent of the impact and effects of COVID-19 will depend on future developments, including, among other factors, the duration and spread of the outbreak, along with related travel advisories, quarantines and restrictions, the recovery time of the disrupted supply chains and industries, the impact of labor market interruptions, the impact of government interventions, and uncertainty with respect to the duration of the global economic slowdown.
The rapid development and fluidity of this situation precludes any prediction as to the ultimate adverse impact of COVID-19 on economic and market conditions, and, as a result, present uncertainty and risk with respect to the Fund and the performance of its investments and ability to pay distributions. The full extent of the impact and effects of COVID-19 will depend on future developments, including, among other factors, the duration and spread of the outbreak, along with related travel advisories, quarantines and restrictions, the recovery time of the disrupted supply chains and industries, the impact of labor market interruptions, the impact of government interventions, and uncertainty with respect to the duration of the global economic slowdown.
Brexit risk. The United Kingdom left the European Union on January 31, 2020 (“Brexit”). The ongoing negotiations surrounding the future relationship between the UK and the EU following UK’s exit from the EU on January 31, 2020 have yet to provide clarity on what the outcome will be for the UK, Europe and the worldwide economy. During a prescribed period (the “Transition Period”), which ended on December 31, 2020, certain transitional arrangements were in effect, such that the United Kingdom continued to be treated, in most respects, as if it were still a member of the European Union, and generally remained subject to European Union law. On December 24, 2020, the European Union and the United Kingdom reached an agreement in principle on the terms of certain agreements and declarations governing the ongoing relationship between the European Union and the United Kingdom, including the European Union-United Kingdom Trade and Cooperation Agreement (the “TCA”). The TCA is limited in its scope primarily to the trade of goods, transport, energy links and fishing; in particular the TCA does not make any meaningful provision for the financial services sector. Uncertainties remain relating to certain aspects of the United Kingdom’s future economic, trading and legal relationships with the European Union and with other countries. The TCA came into full force on May 1, 2021. Even under the TCA, many aspects of the United Kingdom-EU trade relationship remain subject to further negotiation. Due to political uncertainty, it is not possible to anticipate the form or nature of the future trading relationship between the United Kingdom and the EU. The Fund may face risks associated with the potential uncertainty and consequences that may follow Brexit, including with respect to potential volatility in exchange rates and interest rates. Whether or not the Fund invests in securities of issuers located in Europe (whether the EU, Eurozone or UK) or with significant exposure to European, EU, Eurozone or UK issuers or countries, the unavoidable uncertainties and events related to Brexit could negatively affect the value and liquidity of the Fund’s investments, increase taxes and costs of business and cause volatility in currency exchange rates and interest rates. Brexit could adversely affect the performance of contracts and European, UK or worldwide political, regulatory, economic or market conditions and could contribute to instability in political institutions, regulatory agencies and financial markets. Brexit could also lead to legal uncertainty and politically divergent national laws and regulations as a new relationship between the UK and EU is defined and the UK determines which EU laws to replace or replicate. Any of these effects of Brexit, and others that cannot be anticipated, could adversely affect the Fund’s business, results of operations and financial condition. In addition, the risk that abrdn plc, the parent of the companies that provide investment advisory, sub-advisory and administration services to the Fund and which is headquartered in the UK, fails to adequately respond to Brexit could have significant customer, reputation and capital impacts for abrdn plc and its subsidiaries, including those providing services to the Fund; however,
| 54 | abrdn Income Credit Strategies Fund |
Additional Information Regarding the Fund (Unaudited) (continued)
abrdn plc has detailed contingency planning in place to seek to manage the consequences of Brexit on the Fund and to manage any disruption to the Fund and to the services its subsidiaries provide. Given the fluidity and complexity of the situation, however, it cannot assure that the Fund will not be adversely impacted despite preparations.
Leverage risks. The Fund’s leveraged capital structure creates special risks not associated with unleveraged funds having similar investment objectives and policies. The funds borrowed pursuant to the loan facility may constitute a substantial lien and burden by reason of their prior claim against the income of the Fund and against the net assets of the Fund in liquidation. The Fund is limited in its ability to declare dividends or other distributions in the event of default under the loan facility. In the event of default under the loan facility, the lender has the right to cause a liquidation of the collateral (i.e., sell portfolio securities and other assets of the Fund) and, if any such default is not cured, the lender may be able to control the liquidation as well. The loan facility has a term of 364 days and is not a perpetual form of leverage; there can be no assurance that the loan facility will be available for renewal on acceptable terms, if at all.
The credit agreement governing the loan facility includes usual and customary covenants for this type of transaction. These covenants impose on the Fund asset coverage requirements, Fund composition requirements and limits on certain investments which are more stringent than those imposed on the Fund by the 1940 Act. The covenants or guidelines could impede the Fund’s investment adviser or sub-adviser from fully managing the Fund’s portfolio in accordance with the Fund’s investment objective and policies. Furthermore, non-compliance with such covenants or the occurrence of other events could lead to the cancellation of the loan facility.
Covenant Lite Loans Risk. Covenant lite loans contain fewer maintenance covenants than traditional loans, or no maintenance covenants at all, and may not include terms that allow the lender to monitor the financial performance of the borrower and declare a default if certain criteria are breached. This may hinder the Fund’s ability to reprice credit risk associated with the borrower and reduce the Fund’s ability to restructure a problematic loan and mitigate potential loss. As a result, the Fund’s exposure to losses on such investments may be increased, especially during a downturn in the credit cycle.
Risks of Changes in Fixed Income Market Conditions. The global financial crisis that began in 2008 caused a significant decline in the value and liquidity of many securities and unprecedented volatility in the markets. With continued economic recovery and the cessation of certain market support activities, the Fund may face a heightened level of interest rate risk as a result of a rise or increased volatility in interest rates. The current market environment could make
identifying investment risks and opportunities especially difficult for the Advisers. In addition, policy and legislative changes in the United States and in other countries are affecting many aspects of financial regulation. The impact of these changes on the markets, and the practical implications for market participants, may not be fully known for some time. Economies and financial markets throughout the world are becoming increasingly interconnected. As a result, whether or not the Fund invests in securities of issuers located in or with significant exposure to countries experiencing economic and financial difficulties, the value and liquidity of the Fund’s investments may be negatively affected by such events.
Foreign Securities Risk. The Fund will invest in credit obligations, including loans, of issuers that are organized or located in countries other than the United States, including non-US dollar denominated securities. Investing in non-US issuers involves risks, including that non-US issuers may be subject to less rigorous accounting and reporting requirements than US issuers, less rigorous regulatory requirements, different legal systems and laws relating to creditors’ rights, the potential inability to enforce legal judgments, the potential for political, social and economic adversity and currency risk.
Currency risk is the risk that fluctuations in the exchange rates between the US dollar and non-US currencies may negatively affect an investment. The value of investments denominated in non-US currencies may fluctuate based on changes in the value of those currencies relative to the US dollar, and a decline in such relative value could reduce the value of such investments held by the Fund.
Emerging Markets. The foreign securities in which the Fund may invest may be issued by companies or governments located in emerging market countries. Investing in the securities of issuers operating in emerging markets involves a high degree of risk and special considerations not typically associated with investing in the securities of other foreign or US issuers. Compared to the United States and other developed countries, emerging market countries may have relatively unstable governments, economies which may be more likely to take extra-legal action with respect to companies, industries, assets, or foreign ownership than those in more developed markets and therefore issuers of such emerging markets may be more affected by the performance of such industries or sectors. Emerging market economies may be based on only a few industries and securities markets that trade a small number of securities. Securities issued by companies or governments located in emerging market countries tend to be especially volatile (particularly during market closures due to local market holidays or other reasons) and may be less liquid than securities traded in developed countries. Securities in these countries have been characterized by greater potential loss than securities of companies and governments located in developed countries. Investments in the securities of issuers located in emerging markets could be affected by risks associated
| abrdn Income Credit Strategies Fund | 55 |
Additional Information Regarding the Fund (Unaudited) (continued)
with expropriation and/or nationalization, political or social instability, pervasiveness of corruption and crime, armed conflict, the impact on the economy of civil war, religious or ethnic unrest and the withdrawal or non-renewal of any license enabling the Fund to trade in securities of a particular country, confiscatory taxation, restrictions on transfers of assets, lack of uniform accounting and auditing standards, less publicly available financial and other information, diplomatic development which could affect US investments in those countries, and potential difficulties in enforcing contractual obligations. Emerging market countries generally have less developed legal, accounting and financial reporting systems than those in more developed markets, which may reduce the scope or quality of financial information available to investors. Moreover, it can be more difficult for investors to bring litigation or enforce judgments against issuers in emerging markets or for US regulators to bring enforcement actions against such issuers.
Foreign Currency Risk. Since the Fund may invest in credit obligations of foreign issuers denominated in the local currency, changes in foreign currency exchange rates will affect the value of credit obligations in the Fund’s portfolio and the unrealized appreciation or depreciation of investments. In addition to changes in the value of the Fund’s portfolio investments resulting from currency fluctuations, the Fund may incur costs in connection with conversions between various currencies. The Fund may also invest directly in currencies for hedging purposes. The Fund is subject to the risk that those currencies will decline in value relative to the US dollar. The values of the currencies of the emerging market countries in which the Fund may invest may be subject to a high degree of fluctuation due to changes in interest rates, the effects of monetary policies of the United States, foreign governments, central banks or supranational entities, the imposition of currency controls or due to other national or global political or economic developments. Foreign exchange dealers realize a profit based on the difference between the prices at which they are buying and selling various currencies. Thus, a dealer normally will offer to sell a foreign currency to the Fund at one rate, while offering a lesser rate of exchange should the Fund desire immediately to resell that currency to the dealer. The Fund will conduct its foreign currency exchange transactions either on a spot (i.e., cash) basis at the spot rate prevailing in the foreign currency exchange market, or through entering into forward, futures or options contracts to purchase or sell foreign currencies. Therefore, the Fund’s exposure to foreign currencies may result in reduced returns to the Fund. The Fund may, from time to time, seek to protect the value of some portion or all of its portfolio holdings against currency risks by engaging in currency hedging transactions. Such transactions may include entering into forward currency exchange contracts, currency futures contracts and options on such futures contracts as well as purchasing put or call options on currencies, in US or foreign markets. Currency hedging involves risks, including possible default by the
other party to the transaction, illiquidity and, to the extent the view as to certain market movements is incorrect, the risk that the use of hedging could result in losses greater than if they had not been used. In addition, in certain countries in which the Fund may invest, currency hedging opportunities may not be available. The use of currency transactions can result in the Fund incurring losses because of the imposition of exchange controls, suspension of settlements or the inability of the Fund to deliver or receive a specified currency.
Investing in Euro-denominated (or other European currency-denominated) securities entails risk of being exposed to a currency that may not fully reflect the strengths and weaknesses of the disparate European economies. In addition, it is possible that the Euro could be abandoned in the future by countries that have already adopted its use. The effects of such an abandonment on the applicable country and the rest of the European Economic and Monetary Union (“EMU”) are uncertain but could be negative and severe. Many European countries rely heavily upon export-dependent businesses and any change in the exchange rate between the Euro and the US dollar can have either a positive or a negative effect upon corporate profits and the performance of investments in the European Union. The effects of the collapse of the Euro, or of the exit of one or more countries from the EMU, on the United States and global economy and securities markets are impossible to predict and any such events could have a significant adverse impact on the value and risk profile of the Fund’s portfolio.
The Fund computes and expects to continue to distribute its income in US dollars, and the computation of income is made on the date that the income is earned by the Fund at the foreign exchange rate in effect on that date. If the value of the foreign currencies in which the Fund receives its income falls relative to the US dollar between the date of earning of the income and the time at which the Fund converts the foreign currencies to US dollars, the Fund may be required to liquidate securities in order to make distributions if the Fund has insufficient cash in US dollars to meet distribution requirements. The liquidation of investments, if required, may have an adverse impact on the Fund’s performance.
Risks of Second Lien or Other Subordinated or Unsecured Loans or Debt. Second lien or other subordinated or unsecured loans or debt generally are subject to similar risks as those associated with investments in Senior Loans. In addition, because second lien or other subordinated or unsecured loans or debt are subordinated in payment and/or lower in lien priority to Senior Loans, they are subject to additional risk that the cash flow of the borrower and property securing the loan or debt, if any, may be insufficient to meet scheduled payments after giving effect to the senior secured obligations of the borrower. This risk is generally higher for subordinated unsecured loans or debt, which are not backed by a security interest in any specific collateral. Second lien or subordinated
| 56 | abrdn Income Credit Strategies Fund |
Additional Information Regarding the Fund (Unaudited) (continued)
loans or debt, both secured and unsecured, are expected to have greater price volatility than Senior Loans and may be less liquid. There is also a possibility that originators will not be able to sell participations in second lien loans and subordinated loans or debt, both secured and unsecured, which would create greater credit risk exposure. Second lien or other subordinated or unsecured loans or debt of below investment grade quality share risks similar to those associated with investments in other below investment grade securities and obligations.
Risks of Structured Products. The Fund may invest in structured products, including collateralized debt obligations (“CDOs”), collateralized bond obligations (“CBOs”), collateralized loan obligations (“CLOs”), structured notes, credit-linked notes and other types of structured products. Holders of structured products bear risks of the underlying investments, index or reference obligation and are subject to counterparty risk. The Fund may have the right to receive payments to which it is entitled only from the issuer of the structured product, and generally does not have direct rights against the issuer of, or the entity that sold, assets underlying the structured product. While certain structured products enable the investor to acquire interests in a pool of securities without the brokerage and other expenses associated with directly holding such securities, investors in structured products generally pay their share of the structured product’s administrative and other expenses. When investing in structured products, it is impossible to predict whether the underlying indices or prices of the underlying assets will rise or fall, but prices of the underlying indices and assets (and, therefore, the prices of structured products) will be influenced by the same types of political and economic events that affect particular issuers of securities and capital markets generally. Certain structured products may be thinly traded or have a limited trading market and may have the effect of increasing the Fund’s illiquidity to the extent that the Fund, at a particular point in time, may be unable to find qualified buyers for, and may have difficulty valuing, these securities.
CBOs, CLOs and other CDOs are typically privately offered and sold, and thus, are not registered under the securities laws. As a result, investments in CDOs may be characterized by the Fund as illiquid securities; however, an active dealer market may exist for CDOs allowing a CDO to be considered liquid in some circumstances. In addition to the general risks associated with fixed income securities discussed herein, CDOs carry additional risks including, but not limited to: (i) the possibility that distributions from collateral securities will not be adequate to make interest or other payments; (ii) the quality of the collateral may decline in value or the collateral may go into default; (iii) the possibility that the CDOs are subordinate to other classes of obligations issued by the same issuer; and (iv) the complex structure of the security may not be fully understood at the
time of investment and may produce disputes with the issuer or unexpected investment results.
Investments in structured notes involve risks including income risk, credit risk and market risk. Recent market conditions have magnified the risks related to an investment in structured products, including greater volatility, increased lack of liquidity and significant losses in value. Where the return on a structured note held by the Fund is based upon the movement of one or more factors, including currency exchange rates, interest rates, referenced bonds and stock indices, depending on the factor used and the use of multipliers or deflators, changes in interest rates and movement of the factor may cause significant fluctuations in the price of the structured note. Additionally, changes in the reference instrument or security may cause the interest rate on the structured note to be reduced to zero and any further changes in the reference instrument may then reduce the principal amount payable on maturity. Structured notes may be less liquid than other types of securities and more volatile than the reference instrument or security underlying the note.
Asset-backed and mortgage-backed (or mortgage-related) instruments risk. To the extent the Fund invests in asset-backed and mortgage-backed (or mortgage-related) securities or other instruments, its exposure to prepayment and extension risks may be greater than other investments in fixed income instruments. Rising interest rates tend to extend the duration of mortgage-backed (or mortgage-related) instruments, making them more sensitive to changes in interest rates. In addition, mortgage-backed (or mortgage-related) instruments are subject to prepayment risk—the risk that borrowers may pay off their mortgages sooner than expected, particularly when interest rates decline. This can reduce the Fund’s returns because the Fund may have to reinvest that money at lower prevailing interest rates. The Fund’s investments in other asset-backed instruments, such as securities backed by car loans, are subject to risks similar to those associated with mortgage-backed (or mortgage-related) securities.
Privately issued asset-backed and mortgage-backed (or mortgage-related) instruments are typically not traded on an exchange and may have a limited market. Without an active trading market, these instruments may be particularly difficult to value given the complexities in valuing the underlying collateral. Unlike many mortgage-backed (or mortgage-related) instruments issued or guaranteed by the US government, its agencies and instrumentalities, or a government-sponsored enterprise (such as the Federal National Mortgage Association, or Fannie Mae), asset-backed and mortgage-backed (or mortgage-related) instruments issued by private issuers do not have a government or government-sponsored enterprise guarantee and may, and frequently do, have less favorable collateral, credit risk or other characteristics. Although instruments issued by a government-sponsored enterprise are sometimes considered to carry
| abrdn Income Credit Strategies Fund | 57 |
Additional Information Regarding the Fund (Unaudited) (continued)
an implicit guarantee from the US government, there can be no assurance that the US government would in fact guarantee such instruments.
Risks of Swaps. The fund may enter into swap transactions, including credit default, total return, index and interest rate swap agreements, as well as options thereon, and may purchase or sell interest rate caps, floors and collars. Such transactions are subject to market risk, risk of default by the other party to the transaction (i.e., counterparty risk), risk of imperfect correlation and manager risk and may involve commissions or other costs. Swaps generally do not involve delivery of securities, other underlying assets or principal. Accordingly, the risk of loss with respect to swaps generally is limited to the net amount of payments that the Fund is contractually obligated to make, or in the case of the other party to a swap defaulting, the net amount of payments that the Fund is contractually entitled to receive. If the Advisers are incorrect in their forecast of market values, interest rates or currency exchange rates, the investment performance of the Fund would be less favorable than it would have been if these investment techniques were not used.
Counterparty Risk. Changes in the credit quality of the dealers that serve as the Fund’s counterparties with respect to derivatives, swaps or other transactions will affect the value of those instruments. In the event of a default by, or the insolvency of, a counterparty, the Fund may sustain losses or be unable to liquidate a derivative or swap position. The Fund and the Advisers seek to deal only with counterparties of high creditworthiness. All of the Fund’s bank or dealer counterparties (including bank or dealer derivative counterparties) will be subject to approval by the Advisers’ risk and compliance groups. The Advisers evaluate and monitor the creditworthiness of the Fund’s counterparties. Specifically, the Advisers’ risk and compliance personnel implement processes with respect to pre-approval, ongoing monitoring and parameters with respect to the Fund’s counterparty risk exposure. The parameters and limitations that may be imposed depend on the creditworthiness of the Funds’ counterparties and the nature of the transactions in which the Fund engages. The counterparty risk for cleared derivatives is generally lower than for uncleared over-the-counter derivative transactions since generally a clearing organization becomes substituted for each counterparty to a cleared derivative contract and, in effect, guarantees the parties’ performance under the contract as each party to a trade generally looks to the clearing organization for performance of financial obligations under the derivative contract. However, there can be no assurance that a clearing organization, or its members, will satisfy its obligations to the Fund.
Financial Leverage Risk. The Fund is permitted to obtain leverage using any form or combination of financial leverage instruments, including reverse repurchase agreements, credit facilities such as bank loans or commercial paper, and the issuance of preferred shares or
notes. The Fund intends to use leverage opportunistically and may choose to increase or decrease its leverage, or use different types or combinations of leveraging instruments, at any time based on the Fund’s assessment of market conditions and the investment environment.
There can be no assurance that a financial leveraging strategy will continue to be utilized by the Fund or that, if utilized, it will be successful during any period in which it is employed. Leverage creates risks for Common Shareholders, including the likelihood of greater volatility of NAV of the Common Shares and market price of, and distributions on, the Common Shares and the risk that fluctuations in the costs to borrow, or in the distribution or interest rates on any preferred shares or notes, may affect the return to Common Shareholders. To the extent the income derived from investments purchased with proceeds received from leverage exceeds the cost of leverage, the Fund’s distributions will be greater than if leverage had not been used. Conversely, if the income from the investments purchased with such proceeds is not sufficient to cover the cost of the financial leverage, the amount available for distribution to Common Shareholders will be less than if leverage had not been used. In the latter case, the Fund may nevertheless maintain its leveraged position if such action is deemed to be appropriate based on market conditions. The Fund has issued preferred shares. Holders of preferred shares will have rights to elect a minimum of two Trustees. This voting power may negatively affect Common Shareholders (or the interests of holders of preferred shares may differ from the interests of Common Shareholders). The use of leverage by the Fund may magnify the Fund’s losses when there is a decrease in the value of a Fund investment and even totally eliminate the Fund’s equity in its portfolio or a Common Shareholder’s equity in the Fund.
The costs of a financial leverage program (including the costs of offering preferred shares and notes) will be borne by Common Shareholders and consequently will result in a reduction of the NAV of the Common Shares. During periods in which the Fund is using leverage, the fees paid by the Fund for investment advisory services will be higher than if the Fund did not use leverage because the investment advisory fees paid will be calculated on the basis of the Fund’s Managed Assets, which includes proceeds from (and assets subject to) reverse repurchase agreements, any credit facility and any issuance of preferred shares or notes, so that the investment advisory fees payable to the Adviser will be higher when leverage is utilized. This will create a conflict of interest between the Advisers, on the one hand, and Common Shareholders, on the other hand. Fees and expenses in respect of financial leverage, as well as the investment advisory fee and all other expenses of the Fund, will be borne entirely by the Common Shareholders, and not by preferred shareholders, noteholders or any other leverage providers.
| 58 | abrdn Income Credit Strategies Fund |
Additional Information Regarding the Fund (Unaudited) (continued)
Any lender in connection with a credit facility may impose specific restrictions as a condition to borrowing. The credit facility fees may include, among other things, up front structuring fees and ongoing commitment fees (including fees on amounts undrawn on the facility) in addition to the traditional interest expense on amounts borrowed. The credit facility may involve a lien on the Fund’s assets. The Fund is currently a party to a credit facility. Similarly, to the extent the Fund issues additional preferred shares or notes, the Fund currently intends to seek a credit rating from one or more NRSROs on any preferred shares or notes it issues and the Fund may be subject to fees, covenants and investment restrictions required by the NRSRO as a result. Such covenants and restrictions imposed by a NRSRO or lender may include asset coverage or portfolio composition requirements that are more stringent than those imposed on the Fund by the 1940 Act. It is not anticipated that these covenants or restrictions will significantly impede the Advisers in managing the Fund’s portfolio in accordance with its investment objectives and policies. Nonetheless, if these covenants or guidelines are more restrictive than those imposed by the 1940 Act, the Fund may not be able to utilize as much leverage as it otherwise could have, which could reduce the Fund’s investment returns.
The Fund may enter into other transactions that may give rise to a form of leverage including, among others, swaps, futures and forward contracts, options and other derivative transactions. Under current regulations, to the extent that the Fund covers its obligations under such other transactions, such transactions should not be treated as borrowings for purposes of the 1940 Act. However, these transactions, even if covered, may represent a form of economic leverage and will create risks. The potential loss on derivative instruments may be substantial relative to the initial investment therein.
Sovereign debt securities risk. Investments in government debt securities involve special risks. Certain countries have historically experienced, and may continue to experience, high rates of inflation, high interest rates, exchange rate fluctuations, large amounts of external debt, balance of payments and trade difficulties and extreme poverty and unemployment. The issuer or governmental authority that controls the repayment of a country’s debt may not be able or willing to repay the principal and/or interest when due in accordance with the terms of such debt. A debtor’s willingness or ability to repay principal and interest due in a timely manner may be affected by, among other factors, its cash flow situation and, in the case of a government debtor, the extent of its foreign reserves, the availability of sufficient foreign exchange on the date a payment is due, the relative size of the debt service burden to the economy as a whole, the government debtor’s policy towards the International Monetary Fund and the political constraints to which a government debtor may be subject.
Government debtors may default on their debt and may also be dependent on expected disbursements from foreign governments, multilateral agencies and others abroad to reduce principal and interest arrearages on their debt. The commitment on the part of these governments, agencies and others to make such disbursements may be conditioned on a debtor’s implementation of economic reforms and/or economic performance and the timely service of such debtor’s obligations. Failure to implement such reforms, achieve such levels of economic performance or repay principal or interest when due may result in the cancellation of such third parties’ commitments to lend funds to the government debtor, which may further impair such debtor’s ability or willingness to service its debts on a timely basis. Holders of government debt, potentially including the Fund, may be requested to participate in the rescheduling of such debt and to extend further loans to government debtors.
As a result of the foregoing, a government obligor may default on its obligations. If such an event occurs, the Fund may have limited legal recourse against the issuer and/or guarantor. Remedies must, in some cases, be pursued in the courts of the defaulting party itself, and the ability of the holder of foreign government debt securities to obtain recourse may be subject to the political climate in the relevant country.
Risks of Other Derivative Instruments. The Fund may utilize options, forward contracts, futures contracts and options on futures contracts. These instruments involve risks, including the imperfect correlation between the value of such instruments and the underlying assets, the possible default by the counterparty to the transaction (i.e., counterparty risk), illiquidity of the derivative instrument and, to the extent the prediction as to certain market movements is incorrect, the risk that the use of such instruments could result in losses greater than if they had not been used. In addition, transactions in such instruments may involve commissions and other costs, which may increase the Fund’s expenses and reduce its return. Amounts paid as premiums and cash or other assets held in margin accounts with respect to such instruments are not otherwise available to the Fund for investment purposes.
Further, the use of such instruments by the Fund could create the possibility that losses on the instrument would be greater than gains in the value of the Fund’s position. In addition, futures and options markets could be illiquid in some circumstances, and certain over-the-counter options could have no markets. As a result, in certain markets, the Fund might not be able to close out a position without incurring substantial losses. To the extent that the Fund utilizes forward contracts, futures contracts or options transactions for hedging, such transactions should tend to minimize the risk of loss due to a decline in the value of the hedged position and, at the same time, limit any potential gain to the Fund that might result from an increase in value of the position. In addition, the daily variation margin
| abrdn Income Credit Strategies Fund | 59 |
Additional Information Regarding the Fund (Unaudited) (continued)
requirements for futures contracts create a greater ongoing potential financial risk than would purchases of call options, in which case the market exposure is limited to the cost of the initial premium and transaction costs. Losses resulting from the use of hedging will reduce the NAV of the Fund’s Common Shares, and possibly income, and the losses can be greater than if hedging had not been used. Forward contracts may limit gains on portfolio securities that could otherwise be realized had they not been utilized and could result in losses. The contracts may also increase the Fund’s volatility and may involve a significant amount of risk relative to the investment of cash. The use of put and call options may result in losses to the Fund, force the sale of portfolio securities at inopportune times or for prices other than at current market values, limit the amount of appreciation the Fund can realize on its investments or cause the Fund to hold a security it might otherwise sell. The Fund will be subject to credit risk with respect to the counterparties to any transactions in options, forward contracts, futures contracts or options on futures contracts. If a counterparty becomes bankrupt or otherwise fails to perform its obligations under a derivative contract due to financial difficulties, the Fund may experience significant delays in obtaining any recovery under the derivative contract in bankruptcy or other reorganization proceeding. The Fund may obtain only a limited recovery or may obtain no recovery in such circumstances.
When conducted outside the United States, transactions in options, forward contracts, futures contracts or options on futures contracts may not be regulated as rigorously as in the United States, may not involve a clearing mechanism and related guarantees, and are subject to the risk of governmental actions affecting trading in, or the prices of, foreign securities, currencies and other instruments. The value of such positions also could be adversely affected by: (i) other complex foreign political, legal and economic factors; (ii) lesser availability than in the United States of data on which to make trading decisions; (iii) delays in the Fund’s ability to act upon economic events occurring in foreign markets during non-business hours in the United States; (iv) the imposition of different exercise and settlement terms and procedures and margin requirements than in the United States; and (v) lower trading volume and liquidity.
In October 2020, the SEC adopted Rule 18f-4 under the 1940 Act governing a registered investment company’s use of derivatives, short sales, reverse repurchase agreements, and certain other instruments. Under Rule 18f-4, a fund’s derivatives exposure is limited through a value-at-risk test and requires the adoption and implementation of a derivatives risk management program for certain derivatives users. However, subject to certain conditions, funds that do not invest heavily in derivatives may be deemed limited derivatives users and would not be subject to the full requirements of Rule 18f-4. Under the rule, when the Fund trades reverse repurchase agreements or similar financing transactions, including certain tender option bonds, it needs
to aggregate the amount of indebtedness associated with the reverse repurchase agreements or similar financing transactions with the aggregate amount of any other senior securities representing indebtedness when calculating the Fund’s asset coverage ratio or treat all such transactions as derivatives transactions. In addition, under the rule, the Fund is permitted to invest in a security on a when-issued or forward-settling basis, or with a non-standard settlement cycle, and the transaction will be deemed not to involve a senior security (as defined under Section 18(g) of the 1940 Act), provided that, (i) the Fund intends to physically settle the transaction and (ii) the transaction will settle within 35 days of its trade date (the “Delayed-Settlement Securities Provision”). The Fund may otherwise engage in when-issued, forward-settling and non-standard settlement cycle securities transactions that do not meet the conditions of the Delayed-Settlement Securities Provision so long as the Fund treats any such transaction as a “derivatives transaction” for purposes of compliance with the rule. Furthermore, under the rule, the Fund is permitted to enter into an unfunded commitment agreement, and such unfunded commitment agreement will not be subject to the asset coverage requirements under the 1940 Act, if the Fund reasonably believes, at the time it enters into such agreement, that it will have sufficient cash and cash equivalents to meet its obligations with respect to all such agreements as they come due. These requirements may limit the ability of the Fund to use derivatives, and reverse repurchase agreements and similar financing transactions as part of its investment strategies. These requirements may increase the cost of the Fund’s investments and cost of doing business, which could adversely affect investors.
Lender Liability Risk. A number of US judicial decisions have upheld judgments for borrowers against lending institutions on the basis of various evolving legal theories, collectively termed “lender liability.” Generally, lender liability is founded on the premise that a lender has violated a duty (whether implied or contractual) of good faith, commercial reasonableness and fair dealing, or a similar duty owed to the borrower or has assumed an excessive degree of control over the borrower resulting in the creation of a fiduciary duty owed to the borrower or its other creditors or shareholders. Because of the nature of its investments, the Fund may be subject to allegations of lender liability.
In addition, under common law principles that in some cases form the basis for lender liability claims, if a lender or bondholder (a) intentionally takes an action that results in the undercapitalization of a borrower to the detriment of other creditors of such borrower, (b) engages in other inequitable conduct to the detriment of such other creditors, (c) engages in fraud with respect to, or makes misrepresentations to, such other creditors or (d) uses its influence as a stockholder to dominate or control a borrower to the detriment of other creditors of such borrower, a court may elect to subordinate the
| 60 | abrdn Income Credit Strategies Fund |
Additional Information Regarding the Fund (Unaudited) (continued)
claim of the offending lender or bondholder to the claims of the disadvantaged creditor or creditors, a remedy called “equitable subordination.”
Because affiliates of, or persons related to, the Advisers may hold equity or other interests in obligors of the Fund, the Fund could be exposed to claims for equitable subordination or lender liability or both based on such equity or other holdings.
NAV Discount Risk. Frequently, shares of closed-end investment companies, such as the Fund, trade at a price below their NAV, commonly referred to as a “discount.” Historically, shares of closed-end funds have traded at a discount to their NAV, and the Fund can provide no assurance that its Common Shares will trade at or above their NAV. The Fund’s Common Shares frequently trade at a discount to NAV.
Manager Risk. As with any managed fund, the Advisers may not be successful in selecting the best-performing investments or investment techniques in managing the Fund’s portfolio, and the Fund’s performance may lag behind that of similar funds.
Conflicts of Interest Risk. Because the Advisers manage assets for other investment companies, pooled investment vehicles and/or other accounts (including institutional clients, pension plans and certain high net worth individuals), certain conflicts of interest are present. For instance, the Advisers receive fees from certain accounts that are higher than the fees received from the Fund, or receive a performance-based fee on certain accounts. In those instances, the Advisers have an incentive to favor the higher and/or performance-based fee accounts over the Fund. In addition, a conflict of interest exists to the extent the Advisers have proprietary investments in certain accounts or where the portfolio managers or other employees of the Advisers have personal investments in certain accounts. The Advisers have an incentive to favor these accounts over the Fund. Because the Advisers manage accounts that engage in short sales of (or otherwise take short positions in) securities or other instruments of the type in which the Fund invests, the Advisers could be seen as harming the performance of the Fund for the benefit of the accounts taking short positions, if such short positions cause the market value of the securities to fall. The Advisers have adopted trade allocation and other policies and procedures that they believe are reasonably designed to address these and other conflicts of interest. These policies and procedures will have the effect of foreclosing certain investment opportunities for the Fund from time to time.
The Advisers manage assets for accounts other than the Fund, including private accounts and private funds. The Advisers also currently serve as investment advisers to other registered, open-end and closed-end management investment companies (the Fund and all other accounts managed by the Advisers or their affiliates, including private and registered funds, are collectively referred to as
“ASI funds”). The Fund may invest in the same credit obligations as the other ASI funds, although their investments may include different obligations of the same issuer. For example, the Fund might invest in Senior Loans issued by a borrower and one or more other ASI funds might invest in the borrower’s junior debt. In addition, the Advisers also manage certain accounts (including CLOs) that invest in certain types of credit obligations in which the Fund may also invest. Investment opportunities appropriate for both the Fund and another ASI fund generally will be allocated between the Fund and the other ASI fund in a manner that the Advisers believe to be fair and equitable under the circumstances, in accordance with the Advisers’ trade allocation policies.
Conflicts of interest may arise where the Fund and other ASI funds simultaneously hold securities representing different parts of the capital structure of a stressed or distressed issuer. In such circumstances, decisions made with respect to the securities held by one ASI fund may cause (or have the potential to cause) harm to the different class of securities of the issuer held by another ASI fund (including the Fund). For example, if such an issuer goes into bankruptcy or reorganization, becomes insolvent or otherwise experiences financial distress or is unable to meet its payment obligations or comply with covenants relating to credit obligations held by the Fund or by the other ASI funds, such other ASI funds may have an interest that conflicts with the interests of the Fund. If additional financing for such an issuer is necessary as a result of financial or other difficulties, it may not be in the best interests of the Fund to provide such additional financing, but if the other ASI funds were to lose their respective investments as a result of such difficulties, the Advisers may have a conflict in recommending actions in the best interests of the Fund. In such situations, the Advisers will seek to act in the best interests of each of the ASI funds (including the Fund) and will seek to resolve such conflicts in accordance with its compliance policies and procedures.
In addition, the 1940 Act limits the Fund’s ability to enter into certain transactions with certain affiliates of the Advisers. As a result of these restrictions, the Fund may be prohibited from buying or selling any security directly from or to any portfolio company of a fund managed by the Advisers or one of their affiliates. Nonetheless, the Fund may under certain circumstances purchase any such portfolio company’s loans or securities in the secondary market, which could create a conflict for the Advisers between the interests of the Fund and the portfolio company, in that the ability of the Advisers to recommend actions in the best interest of the Fund might be impaired. The 1940 Act also prohibits certain “joint” transactions with certain of the Fund’s affiliates (which could include other ASI Funds), which could be deemed to include certain types of investments, or restructuring of investments, in the same portfolio company (whether at the same or different times). These limitations may limit the scope of investment
| abrdn Income Credit Strategies Fund | 61 |
Additional Information Regarding the Fund (Unaudited) (continued)
opportunities that would otherwise be available to the Fund. The Board has approved policies and procedures reasonably designed to monitor potential conflicts of interest. The Board will review any material amendments to these policies and procedures and will be apprised of any new conflicts that may arise.
Although the professional staff of the Advisers will devote as much time to the management of the Fund as the Advisers deem appropriate to perform their duties in accordance with the investment advisory and sub-advisory agreements and in accordance with reasonable commercial standards, the professional staff of the Advisers may have conflicts in allocating their time and services among the Fund and other ASI funds. The Advisers and their affiliates are not restricted from forming additional investment funds, from entering into other investment advisory relationships or from engaging in other business activities, even though such activities may be in competition with the Fund and/or may involve substantial time and resources of the Advisers and their professional staff. These activities could be viewed as creating a conflict of interest in that the time and effort of the members of the Advisers and their officers and employees will not be devoted exclusively to the business of the Fund but will be allocated between the business of the Fund and the management of the assets of other clients of the Advisers.
The Advisers or their respective members, officers, directors, employees, principals or affiliates may come into possession of material, non-public information. The possession of such information may limit the ability of the Fund to buy or sell a security or otherwise to participate in an investment opportunity. Situations may occur where the Fund could be disadvantaged because of the investment activities conducted by the Advisers for other clients, and the Advisers generally will not employ information barriers with regard to its operations on behalf of its registered and private funds, or other accounts.
Repurchase Agreements and Reverse Repurchase Agreements Risk. The Fund may invest in repurchase agreements and reverse repurchase agreements. In its purchase of repurchase agreements, the Fund does not bear the risk of a decline in the value of the underlying security unless the seller defaults under its repurchase obligation. In the event of the bankruptcy or other default of a seller of a repurchase agreement, the Fund could experience both delays in liquidating the underlying securities and losses, including possible decline in the value of the underlying security during the period while the Fund seeks to enforce its rights thereto, possible lack of access to income on the underlying security during this period, and expenses of enforcing its rights. A repurchase agreement effectively represents a loan from the Fund to the seller under the agreement.
The Fund’s use of reverse repurchase agreements involves many of the same risks involved in the Fund’s use of financial leverage, as the
proceeds from reverse repurchase agreements generally will be invested in additional securities. There is a risk that the market value of the securities acquired in the reverse repurchase agreement may decline below the price of the securities that the Fund has sold but remains obligated to repurchase. In addition, there is a risk that the market value of the securities retained by the Fund may decline. If the buyer of securities under a reverse repurchase agreement were to file for bankruptcy or experience insolvency, the Fund may be adversely affected. Also, in entering into reverse repurchase agreements, the Fund would bear the risk of loss to the extent that the proceeds of the reverse repurchase agreement are less than the value of the underlying securities. In addition, due to the interest costs associated with reverse repurchase agreements, the NAV of the Fund’s Common Shares will decline, and, in some cases, the investment performance of the Fund would be less favorable than it would have been if the Fund had not used such instruments. A reverse repurchase agreement effectively represents a loan from the buyer to the Fund under the agreement.
Other Risks
Investment risk. You may lose money by investing in the Fund, including the possibility that you may lose all of your investment. An investment in the Fund is not a deposit in a bank and is not insured or guaranteed by the US Federal Deposit Insurance Corporation or any other governmental agency.
The Fund is intended to be a long-term investment vehicle and is not designed to provide investors with a means of speculating on short-term stock market movements. Investors should not consider the Fund a complete investment program.
Risks of investing in other investment companies. The Fund may acquire shares in other investment companies, including foreign investment companies to the extent permitted by the 1940 Act. The market value of the shares of other investment companies may differ from the NAV of the particular fund. As a shareholder in an investment company, the Fund would bear its ratable share of that entity’s expenses, including its investment advisory and administration fees. At the same time, the Fund would continue to pay its own investment advisory fees and other expenses. As a result, the Fund and its Common Shareholders, in effect, will be absorbing two levels of fees with respect to investments in other investment companies.
Zero coupon securities risk. Certain debt obligations purchased by the Fund may take the form of zero coupon bonds. A zero coupon bond is a bond that does not pay interest either for the entire life of the obligation or for an initial period after the issuance of the obligation. When held to its maturity, its return comes from the difference between the purchase price and its maturity value. A zero coupon bond is normally issued and traded at a deep discount from
| 62 | abrdn Income Credit Strategies Fund |
Additional Information Regarding the Fund (Unaudited) (continued)
face value. Zero coupon bonds allow an issuer to avoid or delay the need to generate cash to meet current interest payments and, as a result, may involve greater credit risk than bonds that pay interest currently or in cash. The Fund would be required to distribute the income on any of these instruments as it accrues, even though the Fund will not receive all of the income on a current basis or in cash. Thus, the Fund may have to sell other investments, including when it may not be advisable to do so, to make income distributions to its shareholders.
Distributions attributable to the Fund’s “original issue discount” income accruing on zero coupon bonds, and of all other ordinary income, will generally be taxable to the Common Shareholders as ordinary income. As a consequence of selling investments in order to make distributions of “original issue discount” income and other income in respect of which the Fund has not received a corresponding amount of cash, the Fund may realize additional income that gives rise to additional distribution requirements; distributions of such additional income may be taxable to the Common Shareholders as ordinary income or as long-term capital gain depending on which investments are sold.
Inflation risk. Inflation risk is the risk that the value of assets or income from investments will be worth less in the future as inflation decreases the value of money. To the extent that inflation occurs, it will reduce the real value of dividends paid by the Fund and the Fund’s Common Shares. Most emerging market countries, in particular, have experienced substantial, and in some periods extremely high and volatile, rates of inflation. Inflation and rapid fluctuations in inflation rates have had and may continue to have very negative effects on the economies and securities markets globally. In an attempt to control inflation, wage and price controls have been imposed at times in certain countries.
When-issued and delayed delivery securities risk. The Fund may purchase and sell securities on a “when-issued” or “delayed delivery” basis whereby the Fund buys or sells a security with payment and delivery taking place in the future. These transactions are subject to market risk as the value or yield of a security at delivery may be more or less than the purchase price or the yield generally available on securities when delivery occurs. In addition, the Fund is subject to counterparty risk because it relies on the buyer or seller, as the case may be, to consummate the transaction, and failure by the other party to complete the transaction may result in the Fund missing the opportunity of obtaining a price or yield considered to be advantageous. When the Fund is the buyer in such a transaction, however, it will segregate cash and/or liquid securities having an aggregate value at least equal to the amount of such purchase commitments until payment is made. An increase in the percentage of the Fund’s assets committed to the purchase of securities on a
when-issued or delayed delivery basis may increase the volatility of the NAV of the Fund’s Common Shares.
Illiquid investments risk. The Fund’s investments in relatively illiquid investments and loans may restrict the ability of the Fund to dispose of its investments in a timely fashion and for fair value, as well as its ability to fairly value such investments and take advantage of market opportunities. The risks associated with illiquidity will be particularly acute in situations in which the Fund’s operations require cash, such as when the Fund pays dividends or distributions, and could result in the Fund borrowing to meet short-term cash requirements or incurring capital losses on the sale of illiquid investments.
Short sales risk. The Fund may engage in short sales. Short sales involve certain risks and special considerations. If the Fund incorrectly predicts that the price of the borrowed security will decline, the Fund will have to replace the securities with securities with a greater value than the amount received from the sale. As a result, losses from short sales differ from losses that could be incurred from a purchase of a security, because losses from short sales may be unlimited, whereas losses from purchases can equal only the total amount invested.
Equity securities risk. The value of equity securities, including common stock, preferred stock and convertible stock, will fluctuate in response to factors affecting the particular company, as well as broader market and economic conditions. An adverse event, such as an unfavorable earnings report, may depress the value of an issuer’s equity securities held by the Fund. The prices of equity securities fluctuate for several reasons, including changes in investors’ perceptions of the financial condition of an issuer or the general condition of the relevant market, or when political or economic events affecting the issuer occur. In addition, equity security prices may be particularly sensitive to rising interest rates, as the cost of capital rises and borrowing costs increase. Moreover, in the event of a company’s bankruptcy, claims of certain creditors, including bondholders, will have priority over claims of common stock holders and are likely to have varying types of priority over holders of preferred and convertible stock.
Warrants risk. The Fund may invest in warrants. The risk of investing in a warrant is that the warrant may expire prior to the market value of the common stock exceeding the price fixed by the warrant. Warrants have a subordinate claim on a borrower’s assets compared with Senior Loans. As a result, the values of warrants generally are dependent on the financial condition of the borrower and less dependent on fluctuations in interest rates than are the values of many debt securities. The values of warrants may be more volatile than those of Senior Loans and this may increase the volatility of the NAV of the Fund’s Common Shares.
Temporary investments risk. During periods in which the Advisers believe that changes in economic, financial or political conditions
| abrdn Income Credit Strategies Fund | 63 |
Additional Information Regarding the Fund (Unaudited) (continued)
make it advisable to do so, the Fund may, for temporary defensive purposes, reduce its primary investment holdings and invest in certain short-term and medium-term debt securities or hold cash. The Fund intends to invest for temporary defensive purposes only in short-term and medium-term debt securities believed to be of high quality, which are expected to be subject to relatively low risk of loss of interest or principal. In taking such defensive position, the Fund temporarily would not be pursuing and may not achieve its investment objectives.
Tax risk. The Fund has elected to be treated as, and intends to continue to qualify each year as, a “regulated investment company” under the Code. Assuming the Fund qualifies as a regulated investment company, it generally will not be subject to US federal income tax on its “investment company taxable income” as that term is defined in the Code (which includes, among other items, dividends, taxable interest, original issue discount, market discount and the excess of any net short-term capital gains over net long-term capital losses, as reduced by certain deductible expenses), and net capital gain, that it distributes (including amounts that are treated as distributed and reinvested pursuant to the Plan, as described below) to shareholders, provided that, for each taxable year, the Fund distributes (or is treated as distributing) to its shareholders an amount at least equal to 90% of its investment company taxable income. The Fund intends to continue to distribute annually all or substantially all of its investment company taxable income and net capital gain. In order for the Fund to qualify as a regulated investment company in any taxable year, the Fund must also meet certain asset diversification tests and at least 90% of its gross income for such year must be comprised of certain types of qualifying income. If, for any taxable year, the Fund does not qualify as a regulated investment company, it will be treated as a corporation subject to US federal income tax on its net income and capital gains at the regular corporate tax rates (without a deduction for distributions to shareholders). In addition, shareholders will be subject to tax on distributions to the extent of the Fund’s current or accumulated earnings and profits. Accordingly, in such event, the Fund’s ability to achieve its investment objectives would be adversely affected, and Common Shareholders would be subject to the risk of diminished investment returns.
Valuation risk. Unlike publicly traded common stock which trades on national exchanges, there is no central place or exchange for loans or fixed-income instruments to trade. Loans and fixed-income instruments generally trade on an “over-the-counter” market which may be anywhere in the world where the buyer and seller can settle on a price. Due to the lack of centralized information and trading, the valuation of loans or fixed-income instruments may carry more risk than that of common stock. Uncertainties in the conditions of the financial market, unreliable reference data, lack of transparency and
inconsistency of valuation models and processes may lead to inaccurate asset pricing. In addition, other market participants may value securities differently than the Fund. As a result, the Fund may be subject to the risk that when a loan or fixed-income instrument is sold in the market, the amount received by the Fund is less than the value of such loans or fixed-income instruments carried on the Fund’s books.
US government debt securities risk. US government debt securities have historically not involved the credit risks associated with investments in other types of debt securities, although, as a result, the yields available from US government debt securities are generally lower than the yields available from other securities. Like other debt securities, however, the values of US government securities change as interest rates fluctuate. Fluctuations in the value of portfolio securities will not affect interest income on existing portfolio securities but will be reflected in the NAV of the Fund’s Common Shares. Since the magnitude of these fluctuations will generally be greater at times when the Fund’s average maturity is longer, under certain market conditions the Fund may, for temporary defensive purposes, accept lower current income from short-term investments rather than investing in higher yielding long-term securities.
Operational Risk. Your ability to transact with the Fund or the valuation of your investment may be negatively impacted because of the operational risks arising from factors such as processing errors and human errors, inadequate or failed internal or external processes, failures in systems and technology, changes in personnel, and errors caused by third-party service providers or trading counterparties. Although the Fund attempts to minimize such failures through controls and oversight, it is not possible to identify all of the operational risks that may affect the Fund or to develop processes and controls that completely eliminate or mitigate the occurrence of such failures. The Fund and its shareholders could be negatively impacted as a result.
Government intervention in the financial markets risk. In the past decade financial markets throughout the world have experienced increased volatility, depressed valuations, decreased liquidity and heightened uncertainty. Governmental and non-governmental issuers have defaulted on, or been forced to restructure, their debts. These US and non-US governments and central banks have provided significant support to financial markets, including by keeping interest rates at historically low levels. Certain non-US governments and central banks have implemented or may implement so-called negative rates (e.g., charging depositors who keep their cash at a bank) to spur economic growth. Further Federal Reserve or other US or non-US governmental or central bank actions, including interest rate increases or contrary actions by different governments, could negatively affect financial markets generally, increase market
| 64 | abrdn Income Credit Strategies Fund |
Additional Information Regarding the Fund (Unaudited) (continued)
volatility and reduce the value and liquidity of securities in which the fund invests.
Federal, state, and other governments, their regulatory agencies or self-regulatory organizations may take additional actions that affect the regulation of the securities or structured products in which the Fund invests, or the issuers of such securities or structured products, in ways that are unforeseeable. Borrowers under Senior Loans held by the Fund may seek protection under bankruptcy laws. Legislation or regulation may also change the way in which the Fund itself is regulated. Such legislation or regulation could limit or preclude the Fund’s ability to achieve its investment objectives. The Advisers monitor developments and seek to manage the Fund’s portfolio in a manner consistent with achieving the Fund’s investment objectives, but there can be no assurance that they will be successful in doing so.
Anti-takeover provisions. The Fund’s Agreement and Declaration of Trust and By-Laws include provisions that could limit the ability of other entities or persons to acquire control of the Fund or convert the Fund to open-end status and delay or limit the ability of other persons to acquire control of the Fund. These provisions could deprive the Common Shareholders of opportunities to sell their Common Shares at a premium over the then-current market price of the Common Shares or at NAV. The Fund’s Board has determined that these provisions are in the best interests of shareholders generally.
Fundamental Investment Restrictions
The following are fundamental investment restrictions of the Fund and may not be changed without the approval of the holders of a majority of the Fund's outstanding voting securities (which for this purpose and under the 1940 Act means the lesser of (i) 67% or more of the Fund's voting securities present at a meeting at which more than 50% of the Fund's outstanding voting securities are present or represented by proxy or (ii) more than 50% of the Fund's outstanding voting securities). Except as otherwise noted, all percentage limitations set forth below apply immediately after a purchase and any subsequent change in any applicable percentage resulting from market fluctuations does not require any action. With respect to the limitations on the issuance of senior securities and in the case of borrowings, the percentage limitations apply at the time of issuance and on an ongoing basis.
The Fund may not:
| 1. | Issue senior securities or borrow money, except the Fund may issue senior securities and/or borrow money (including through reverse repurchase agreements) to the extent permitted by the 1940 Act, as amended from time to time, and as modified or supplemented from time to time by (i) the rules and regulations promulgated by the SEC under the 1940 Act, as amended from time to time and (ii) an exemption or other relief applicable to |
| | the Fund from the provisions of the 1940 Act, as amended from time to time. The Fund does not have an investment policy limiting the amount of leverage that may be obtained through the use of covered reverse repurchase agreements. |
| 2. | Act as an underwriter of securities issued by others, except to the extent that, in connection with the disposition of loans or portfolio securities, it may be deemed to be an underwriter under applicable securities laws. |
| 3. | Invest in any security if as a result, 25% or more of the value of the Fund's total assets, taken at market value at the time of each investment, are in the securities of issuers in any particular industry except (a) securities issued or guaranteed by the U.S. government and its agencies and instrumentalities or securities of state and municipal governments or their political subdivisions (however, not including private purpose industrial development bonds issued on behalf of non-government issuers), or (b) as otherwise provided by the 1940 Act, as amended from time to time, and as modified or supplemented from time to time by (i) the rules and regulations promulgated by the SEC under the 1940 Act, as amended from time to time, and (ii) any exemption or other relief applicable to the Fund from the provisions of the 1940 Act, as amended from time to time. For purposes of this restriction, (i) an investment in a loan participation will be considered to be an investment in the securities or obligations of the issuer of the loan to which the participation relates and (ii) an investment in a repurchase agreement, reverse repurchase agreement, CLO, CBO, CDO or a swap or other derivative will be considered to be an investment in the industry (if any) of the underlying or reference security, instrument or asset. The Fund defines an industry by reference to Bloomberg BICS codes for industry classifications. |
| 4. | Purchase or sell real estate, except that the Fund may: (a) acquire or lease office space for its own use, (b) invest in securities and/or other instruments of issuers that invest in real estate or interests therein or that are engaged in or operate in the real estate industry, (c) invest in securities and/or other instruments that are secured by real estate or interests therein, (d) purchase and sell mortgage-related securities and/or other instruments, and (e) hold and sell real estate acquired by the Fund as a result of the ownership of securities and/or other instruments. |
| 5. | Purchase or sell physical commodities unless acquired as a result of ownership of securities or other instruments; provided that this restriction shall not prohibit the Fund from purchasing or selling options, futures contracts and related options thereon, forward contracts, swaps, caps, floors, collars and any other financial or derivative instruments or from investing in securities or other instruments backed by physical commodities. |
| abrdn Income Credit Strategies Fund | 65 |
Additional Information Regarding the Fund (Unaudited) (continued)
| 6. | Make loans of money or property to any person, except (a) to the extent that securities, instruments, credit obligations or interests (including Senior Loans) in which the Fund may invest, or which the Fund may originate, are considered to be loans, (b) through the loan of portfolio securities or (c) by engaging in repurchase agreements. |
| 7. | May not purchase securities of any one issuer, other than obligations issued or guaranteed by the U.S. Government, its agencies or instrumentalities, if, immediately after such purchase, more than 5% of the Fund's total assets would be invested in such issuer or the Fund would hold more than 10% of the outstanding voting securities of the issuer, except that 25% or less of the Fund's total assets may be invested without regard to such limitations. There is no limit to the percentage of assets that may be invested in U.S. Treasury bills, notes, or other obligations issued or guaranteed by the U.S. Government, its agencies or instrumentalities. |
Thus, with respect to the foregoing restrictions 1 and 3, the Fund currently may not:
| 1. | Issue senior securities or borrow money, except as permitted by the 1940 Act and the rules and regulations thereunder. Currently, the 1940 Act and the rules and regulations thereunder generally limit the extent to which the Fund may utilize borrowings, together with any other senior securities representing indebtedness, to 33 and 1/3% of the Fund’s total assets at the time utilized (less the Fund’s liabilities and indebtedness not represented by senior securities). In addition, the 1940 Act limits the extent to which the Fund may issue preferred shares plus senior securities representing indebtedness to 50% of the Fund’s total assets (less the Fund’s liabilities and indebtedness not represented by senior securities). Indebtedness associated with reverse repurchase agreements and similar financing transactions may be aggregated with any other senior securities representing indebtedness for this purpose or be treated as derivatives transactions under the 1940 Act and the rules and regulations thereunder, depending on the Fund’s election under applicable SEC requirements. |
| 2. | Invest in any security if, as a result 25% or more of the value of the Fund's total assets, taken at market value at the time of each investment, are in the securities of issuers in any particular industry except securities issued or guaranteed by the U.S. government and its agencies and instrumentalities or securities of state and municipal governments or their political subdivisions (however, not including private purpose industrial development bonds issued on behalf of non-government issuers). |
The latter part of certain of the Fund's fundamental investment restrictions (i.e., the references to "as may otherwise be permitted by the 1940 Act, as amended from time to time and as modified or supplemented from time to time by (i) the rules and regulations promulgated by the SEC under the 1940 Act, as amended from time to time, and (ii) any exemption or other relief applicable to the Fund from the provisions of the 1940 Act, as amended from time to time") provide the Fund with flexibility to change its limitations in connection with changes in applicable law, rules, regulations or exemptive relief. The language used in these restrictions provides the necessary flexibility to allow the Fund's Board to respond efficiently to these kinds of developments without the delay and expense of a shareholder meeting.
Effects of Leverage
The following table is furnished in response to requirements of the SEC. It is designed to, among other things, illustrate the effects of leverage through the use of senior securities, as that term is defined under Section 18 of the 1940 Act, on Common Share total return, assuming investment portfolio total returns (consisting of income and changes in the value of investments held in a Fund's portfolio) of -10%, -5%, 0%, 5% and 10%. The table below reflects the Fund's continued use of the revolving credit facility, Preferred Shares, and reverse repurchase agreements, as applicable, as of October 31, 2022 as a percentage of total managed assets (including assets attributable to such leverage), and the annual return that the Fund's portfolio must experience (net of expenses) in order to cover such costs. The information below does not reflect the Fund's use of certain other forms of economic leverage achieved through the use of other instruments or transactions not considered to be senior securities under the 1940 Act, such as covered credit default swaps or other derivative instruments, if any.
The assumed investment portfolio returns in the table below are hypothetical figures and are not necessarily indicative of the investment portfolio returns experienced or expected to be experienced by the Fund. Your actual returns may be greater or less than those appearing below. In addition, actual borrowing expenses associated with reverse repurchase agreements (or dollar rolls or
| 66 | abrdn Income Credit Strategies Fund |
Additional Information Regarding the Fund (Unaudited) (concluded)
borrowings, if any) used by the Fund may vary frequently and may be significantly higher or lower than the rate used for the example below.
Assumed
annual
returns on
the Fund's
portfolio
(net of
expenses) | (10)% | (5)% | 0% | 5% | 10% |
Corresponding
return of
shareholder | (21.5%) | (12.6%) | (3.8%) | 5.1% | 13.9% |
Based on estimated indebtedness of $128,000,000 (representing approximately 43.4% of the Fund's Managed Assets as of October 31, 2022), and a weighted average annual interest rate of 4.93% (effective weighted interest rate on the revolving credit facility and preferred shares as of October 31, 2022), the Fund's investment portfolio at fair value would have to produce an annual return of approximately 2.14% to cover annual interest payments on the estimated debt.
Share total return is composed of two elements—the distributions paid by a Fund to holders of Shares (the amount of which is largely
determined by the net investment income of the Fund after paying dividend payments on any preferred shares issued by the Fund and expenses on any forms of leverage outstanding) and gains or losses on the value of the securities and other instruments the Fund owns. As required by SEC rules, the table assumes that a Fund is more likely to suffer capital losses than to enjoy capital appreciation. For example, to assume a total return of 0%, a Fund must assume that the income it receives on its investments is entirely offset by losses in the value of those investments. This table reflects hypothetical performance of a Fund's portfolio and not the actual performance of the Fund's Shares, the value of which is determined by market forces and other factors.
Should the Fund elect to add additional leverage to its portfolio, any benefits of such additional leverage cannot be fully achieved until the proceeds resulting from the use of such leverage have been received by the Fund and invested in accordance with the Fund's investment objective and policies. As noted above, the Fund's willingness to use additional leverage, and the extent to which leverage is used at any time, will depend on many factors, including, among other things, the Adviser's assessment of the yield curve environment, interest rate trends, market conditions and other factors.
| abrdn Income Credit Strategies Fund | 67 |
Dividend Reinvestment and Optional Cash Purchase Plan (Unaudited)
The Fund intends to distribute to stockholders substantially all of its net investment income and to distribute any net realized capital gains at least annually. Net investment income for this purpose is income other than net realized long-term and short-term capital gains net of expenses. Pursuant to the Dividend Reinvestment and Optional Cash Purchase Plan (the “Plan”), stockholders whose shares of common stock are registered in their own names will be deemed to have elected to have all distributions automatically reinvested by Computershare Trust Company N.A. (the “Plan Agent”) in the Fund shares pursuant to the Plan, unless such stockholders elect to receive distributions in cash. Stockholders who elect to receive distributions in cash will receive such distributions paid by check in U.S. Dollars mailed directly to the stockholder by the Plan Agent, as dividend paying agent. In the case of stockholders such as banks, brokers or nominees that hold shares for others who are beneficial owners, the Plan Agent will administer the Plan on the basis of the number of shares certified from time to time by the stockholders as representing the total amount registered in such stockholders’ names and held for the account of beneficial owners that have not elected to receive distributions in cash. Investors that own shares registered in the name of a bank, broker or other nominee should consult with such nominee as to participation in the Plan through such nominee and may be required to have their shares registered in their own names in order to participate in the Plan. Please note that the Fund does not issue certificates so all shares will be registered in book entry form. The Plan Agent serves as agent for the stockholders in administering the Plan. If the Trustees of the Fund declare an income dividend or a capital gains distribution payable either in the Fund’s common stock or in cash, nonparticipants in the Plan will receive cash and participants in the Plan will receive common stock, to be issued by the Fund or purchased by the Plan Agent in the open market, as provided below. If the market price per share (plus expected per share fees) on the valuation date equals or exceeds NAV per share on that date, the Fund will issue new shares to participants at NAV; provided, however, that if the NAV is less than 95% of the market price on the valuation date, then such shares will be issued at 95% of the market price. The valuation date will be the payable date for such distribution or dividend or, if that date is not a trading day on the New York Stock Exchange, the immediately preceding trading date. If NAV exceeds the market price of Fund shares at such time, or if the Fund should declare an income dividend or capital gains distribution payable only in cash, the Plan Agent will, as agent for the participants, buy Fund shares in the open market, on the New York Stock Exchange or elsewhere, for the participants’ accounts on, or shortly after, the payment date. If, before the Plan Agent has completed its purchases, the market price exceeds the NAV of a Fund share, the average per share purchase price paid by the Plan Agent may exceed the NAV of the Fund’s shares, resulting in the acquisition of fewer shares than if the distribution had been paid in shares issued by the Fund on the
dividend payment date. Because of the foregoing difficulty with respect to open-market purchases, the Plan provides that if the Plan Agent is unable to invest the full dividend amount in open-market purchases during the purchase period or if the market discount shifts to a market premium during the purchase period, the Plan Agent will cease making open-market purchases and will receive the uninvested portion of the dividend amount in newly issued shares at the close of business on the last purchase date.
Participants have the option of making additional cash payments of a minimum of $50 per investment (by check, one-time online bank debit or recurring automatic monthly ACH debit) to the Plan Agent for investment in the Fund’s common stock, with an annual maximum contribution of $250,000. The Plan Agent will wait up to three business days after receipt of a check or electronic funds transfer to ensure it receives good funds. Following confirmation of receipt of good funds, the Plan Agent will use all such funds received from participants to purchase Fund shares in the open market on the 25th day of each month or the next trading day if the 25th is not a trading day.
If the participant sets up recurring automatic monthly ACH debits, funds will be withdrawn from his or her U.S. bank account on the 20th of each month or the next business day if the 20th is not a banking business day and invested on the next investment date. The Plan Agent maintains all stockholder accounts in the Plan and furnishes written confirmations of all transactions in an account, including information needed by stockholders for personal and tax records. Shares in the account of each Plan participant will be held by the Plan Agent in the name of the participant, and each stockholder’s proxy will include those shares purchased pursuant to the Plan. There will be no brokerage charges with respect to common shares issued directly by the Fund. However, each participant will pay a per share fee of $0.02 incurred with respect to the Plan Agent’s open market purchases in connection with the reinvestment of dividends, capital gains distributions and voluntary cash payments made by the participant. Per share fees include any applicable brokerage commissions the Plan Agent is required to pay.
Participants also have the option of selling their shares through the Plan. The Plan supports two types of sales orders. Batch order sales are submitted on each market day and will be grouped with other sale requests to be sold. The price will be the average sale price obtained by Computershare’s broker, net of fees, for each batch order and will be sold generally within 2 business days of the request during regular open market hours. Please note that all written sales requests are always processed by Batch Order. ($10 and $0.12 per share). Market Order sales will sell at the next available trade. The shares are sold real time when they hit the market, however an available trade must be presented to complete this transaction. Market Order sales may only
| 68 | abrdn Income Credit Strategies Fund |
Dividend Reinvestment and Optional Cash Purchase Plan (Unaudited) (concluded)
be requested by phone at 1-800-647-0584 or using Investor Center through www.computershare.com/buyaberdeen. ($25 and $0.12 per share).
The receipt of dividends and distributions under the Plan will not relieve participants of any income tax that may be payable on such dividends or distributions. The Fund or the Plan Agent may terminate the Plan as applied to any voluntary cash payments made and any dividend or distribution paid subsequent to notice of the termination sent to members of the Plan at least 30 days prior to the record date for such dividend or distribution. The Plan also may be amended by
the Fund or the Plan Agent, but (except when necessary or appropriate to comply with applicable law or the rules or policies of the Securities and Exchange Commission or any other regulatory authority) only by mailing a written notice at least 30 days prior to the effective date to the participants in the Plan. All correspondence concerning the Plan should be directed to the Plan Agent by phone at 1-800-647-0584, using Investor Center through www.computershare.com/buyaberdeen or in writing to Computershare Trust Company N.A., P.O. Box 43006, Providence, RI 02940-3078.
| abrdn Income Credit Strategies Fund | 69 |
Management of the Fund (Unaudited)
As of October 31, 2022
The names, years of birth and business addresses of the trustees and officers of the Fund as of October 31, 2022, their principal occupations during the past five years, the number of portfolios each Trustee oversees and other directorships they hold are provided in the tables below. Trustees that are deemed “interested persons” (as that term is defined in Section 2(a)(19) of the Investment Company Act of 1940, as amended) of the Fund or the Fund's Advisers are included in the table below under the heading “Interested Trustees.” Trustees who are not interested persons, as described above, are referred to in the table below under the heading “Independent Trustees.” abrdn Inc., its parent company abrdn plc, and its advisory affiliates are collectively referred to as “abrdn” in the tables below.
Name, Address and
Year of Birth | Position(s) Held
with the Fund | Term of Office
and Length of
Time Served | Principal Occupation(s)
During Past Five Years | Number of
Funds in
Fund Complex*
Overseen by
Trustee | Other
Directorships
Held by
Trustee** |
| Interested Trustees | | | | | |
Stephen Bird†
c\o abrdn Inc.
1900 Market Street
Suite 200
Philadelphia, PA 19103
Year of Birth: 1967 | Class II Trustee | Term as Trustee expires 2025; Director since 2021 | Mr. Bird joined the Board of abrdn plc in July 2020 as Chief Executive-Designate, and was formally appointed Chief Executive Officer in September 2020. Previously, Mr. Bird served as chief executive officer of global consumer banking at Citigroup from 2015, retiring from the role in November 2019. His responsibilities encompassed all consumer and commercial banking businesses in 19 countries, including retail banking and wealth management, credit cards, mortgages, and operations and technology supporting these businesses. Prior to this, Mr. Bird was chief executive for all of Citigroup’s Asia Pacific business lines across 17 markets in the region, including India and China. Mr. Bird joined Citigroup in 1998, and during his 21 years with the company he held a number of leadership roles in banking, operations and technology across its Asian and Latin American businesses. Before this, he held management positions in the UK at GE Capital – where he was director of UK operations from 1996 to 1998 – and at British Steel. | 28 | None. |
| Independent Trustees | | | | | |
Nancy Yao Maasbach
c\o abrdn Inc.
1900 Market Street
Suite 200
Philadelphia, PA 19103
Year of Birth: 1972 | Class II Trustee and Preferred Shares Trustee | Term expires 2025; Trustee since 2019 | Nancy Yao Maasbach has served as the President of the Museum of Chinese in America since 2015. Previously, she served as the executive director of the Yale-China Association and managing director of the corporate program at the Council on Foreign Relations. Prior to her work in non-profit, Ms. Maasbach launched the Asia coverage at the Center for Financial Research and Analysis (currently known as RiskMetrics), served as the inaugural director of policy research of Goldman Sachs' Global Markets Institute, and was an investment banker at Goldman Sachs (Asia) L.L.C. Ms. Maasbach is an independent director of the abrdn-managed India Fund and Asian Emerging Markets Fund. Ms. Maasbach is a board member of the National Committee on U.S.-China Relations, a member of the Council on Foreign Relations, and a lecturer on governance at Yale University. | 7 | None. |
| 70 | abrdn Income Credit Strategies Fund |
Management of the Fund (Unaudited) (continued)
As of October 31, 2022
Name, Address and
Year of Birth | Position(s) Held
with the Fund | Term of Office
and Length of
Time Served | Principal Occupation(s)
During Past Five Years | Number of
Funds in
Fund Complex*
Overseen by
Trustee | Other
Directorships
Held by
Trustee** |
P. Gerald Malone
c\o abrdn Inc.
1900 Market Street
Suite 200
Philadelphia, PA 19103
Year of Birth: 1950 | Chairman of the Board; Class III Trustee | Term expires 2023; Trustee since 2017 | Mr. Malone is, by profession, a lawyer of over 40 years. Currently, he is a non-executive director of a number of U.S. companies, including Medality Medical (medical technology company) since 2018. He is also Chairman of many of the open and closed end funds in the Fund Complex. He previously served as a non-executive director of U.S. healthcare company Bionik Laboratories Corp. (2018 - July 2022), as Independent Chairman of UK companies Crescent OTC Ltd (pharmaceutical services) until February 2018; and fluidOil Ltd. (oil services) until June 2018; U.S. company Rejuvenan llc (wellbeing services) until September 2017 and as chairman of UK company Ultrasis plc (healthcare software services company) until October 2014. Mr. Malone was previously a Member of Parliament in the U.K. from 1983 to 1997 and served as Minister of State for Health in the U.K. government from 1994 to 1997. | 28 | None. |
John Sievwright
c\o abrdn Inc.
1900 Market Street
Suite 200
Philadelphia, PA 19103
Year of Birth: 1955 | Class I Trustee | Term expires 2024; Trustee since 2017 | Mr. Sievwright is a Non-Executive Director of Burford Capital Ltd (since May 2020) (provider of legal, finance, complex strategies, post-settlement finance and asset management services and products) and Revolut Limited, a UK-based digital banking firm (since August 2021). Previously, he was a Non-Executive Director for the UK company : NEX Group plc (2017-2018) (financial). | 8 | Non-Executive Director of Burford Capital Ltd (provider of legal finance, complex strategies, post-settlement finance and asset management services and products) since May 2020. |
Randolph Takian
c\o abrdn Inc.
1900 Market Street
Suite 200
Philadelphia, PA 19103
Year of Birth: 1974 | Class III Trustee and Preferred Shares Trustee | Term as Trustee expires 2023; Director since 2010 | Managing Director and Head of Bank and Lending of Global Wealth and Investment Management at Bank of America (since 2019); Vice President of Boulevard Acquisition Corp. II, a blank check company and an affiliate of Avenue Capital Group (from 2015 to 2019); President, Chief Executive Officer and Trustee of Avenue Mutual Funds Trust (from 2012 to 2019); Senior Managing Director and Head of Traditional Asset Management of Avenue Capital Group (from 2010 to 2019). Board Member and member of Executive Committee of Lenox Hill Neighborhood House, a non-profit. | 1 | None. |
| * | As of October 31, 2022, the Fund Complex consists of: abrdn Income Credit Strategies Fund, abrdn Asia-Pacific Income Fund, Inc., abrdn Global Income Fund, Inc., abrdn Australia Equity Fund, Inc., abrdn Emerging Markets Equity Income Fund, Inc., abrdn Japan Equity Fund, Inc., The India Fund, Inc., abrdn Global Dynamic Dividend Fund, abrdn Total Dynamic Dividend Fund, abrdn Global Premier Properties Fund, abrdn Global Infrastructure Income Fund, abrdn Funds (which consists of 19 portfolios) and abrdn ETFs (which consists of 3 portfolios). For the purposes of listing the number of funds in the Fund Complex overseen by each Board member, each portfolio of abrdn Funds and abrdn ETFs is counted individually. |
| ** | Current directorships (excluding Fund Complex) as of October 31, 2022 held in (1) any other investment companies registered under the 1940 Act, (2) any company with a class of securities registered pursuant to Section 12 of the Securities Exchange Act of 1934, as amended (the “1934 Act”) or (3) any company subject to the requirements of Section 15(d) of the Exchange Act. |
| † | Mr. Bird is considered to be an “interested person” of the Fund as defined in the 1940 Act because of his affiliation with the Adviser. |
| abrdn Income Credit Strategies Fund | 71 |
Management of the Fund (Unaudited) (continued)
As of October 31, 2022
Officers of the Fund
Name, Address and
Year of Birth | Position(s) Held
with the Fund | Term of Office*
and Length of
Time Served | Principal Occupation(s) During Past Five Years |
Joseph Andolina**
c\o abrdn Inc.
1900 Market Street
Suite 200
Philadelphia, PA 19103
Year of Birth: 1978 | Chief Compliance Officer and Vice President – Compliance | Since 2017 | Currently, Chief Risk Officer – Americas for abrdn Inc. and serves as the Chief Compliance Officer for abrdn Inc. Prior to joining the Risk and Compliance Department, he was a member of abrdn Inc.'s Legal Department, where he served as US Counsel since 2012. |
Chris Demetriou**
c\o abrdn Inc.
1900 Market Street
Suite 200
Philadelphia, PA 19103
Year of Birth: 1983 | Vice President | Since 2017 | Currently, Chief Executive Officer – UK, EMEA and Americas. Mr. Demetriou joined abrdn Inc. in 2013, as a result of the acquisition of SVG, a FTSE 250 private equity investor based in London. |
Sharon Ferrari**
c\o abrdn Inc.
1900 Market Street
Suite 200
Philadelphia, PA 19103
Year of Birth: 1977 | Vice President | Since 2017 | Currently, Senior Product Manager for abrdn Inc. Prior to that she was a Senior Fund Administration Manager for abrdn Inc. Ms. Ferrari joined the company in June 2008. |
Alan Goodson**
c\o abrdn Inc.
1900 Market Street
Suite 200
Philadelphia, PA 19103
Year of Birth: 1974 | Vice President | Since 2017 | Currently, Executive Director, Product & Client Solutions – Americas for abrdn Inc., overseeing Product Management & Governance , Product Development and Client Solutions for registered and unregistered investment companies in the U.S., Brazil and Canada. Mr. Goodson is Director and Vice President of abrdn Inc. and joined abrdn Inc. in 2000. |
Heather Hasson**
c\o abrdn Inc.
1900 Market Street
Suite 200
Philadelphia, PA 19103
Year of Birth: 1982 | Vice President | Since 2021 | Currently, Senior Product Solutions and Implementation Manager for abrdn Inc. Ms. Hasson joined the company in November 2006. |
Robert Hepp**
c\o abrdn Inc.
1900 Market Street
Suite 200
Philadelphia, PA 19103
Year of Birth: 1986 | Vice President | Since 2021 | Currently, Senior Product Governance Manager – US for abrdn Inc. Mr. Hepp joined abrdn Inc. as a Senior Paralegal in 2016. |
Matt Kence**
c\o abrdn Inc.
1900 Market Street
Suite 200
Philadelphia, PA 19103
Year of Birth: | Vice President | Since 2022 | Currently, Investment Director for abrdn Inc. |
Megan Kennedy**
c\o abrdn Inc.
1900 Market Street
Suite 200
Philadelphia, PA 19103
Year of Birth: 1974 | Vice President and Secretary | Since 2017 | Currently, Director, Senior Product Governance for abrdn Inc. Ms. Kennedy joined abrdn Inc. in 2005. |
Andrew Kim**
c\o abrdn Inc.
1900 Market Street
Suite 200
Philadelphia, PA 19103
Year of Birth: 1983 | Vice President | Since 2021 | Currently, Senior Product Governance Manager – US for abrdn Inc. Mr. Kim joined abrdn Inc. as a Product Manager in 2013. |
| 72 | abrdn Income Credit Strategies Fund |
Management of the Fund (Unaudited) (concluded)
As of October 31, 2022
Name, Address and
Year of Birth | Position(s) Held
with the Fund | Term of Office*
and Length of
Time Served | Principal Occupation(s) During Past Five Years |
Brian Kordeck**
c\o abrdn Inc.
1900 Market Street
Suite 200
Philadelphia, PA 19103
Year of Birth: 1978 | Vice President | Since 2021 | Currently, Senior Product Manager – US for abrdn Inc. Mr. Kordeck joined abrdn Inc. as a Senior Fund Administrator in 2013. |
Michael Marsico**
c\o abrdn Inc.
1900 Market Street
Suite 200
Philadelphia, PA 19103
Year of Birth: 1980 | Vice President | Since 2021 | Currently, Senior Product Manager – US for abrdn Inc. Mr. Marsico joined abrdn Inc. as a Fund Administrator in 2014. |
Andrea Melia**
c\o abrdn Inc.
1900 Market Street
Suite 200
Philadelphia, PA 19103
Year of Birth: 1969 | Treasurer and Chief Financial Officer | Since 2017 | Currently, Vice President and Senior Director, Product Management for abrdn Inc. Ms. Melia joined abrdn Inc. in September 2009. |
Ben Pakenham**
c\o Aberdeen Asset Managers Limited
Bow Bells House
1 Bread Street
London
EC4M 9HH
Year of Birth: 1973 | Vice President | Since 2017 | Currently, Head of European High Yield and Global Loans. Mr. Pakenham joined abrdn in 2011. |
Christian Pittard**
c/o abrdn Investments Limited
280 Bishopsgate
London, EC2M 4AG
Year of Birth: 1973 | President | Since 2017 | Currently, Group Head of Product Opportunities at abrdn and a Director of Aberdeen Asset Management PLC since 2010. Mr. Pittard joined abrdn from KPMG in 1999. |
Lucia Sitar**
c\o abrdn Inc.
1900 Market Street
Suite 200
Philadelphia, PA 19103
Year of Birth: 1971 | Vice President | Since 2017 | Currently, Vice President and Head of Product Management and Governance for abrdn Inc. since 2020. Previously, Ms. Sitar was Managing U.S. Counsel for abrdn Inc. She joined abrdn Inc. as U.S. Counsel in July 2007. |
| * | Officers hold their positions with the Fund until a successor has been duly elected and qualifies. Officers are elected annually at a meeting of the Board of Trustees. |
| ** | Each officer may hold officer position(s) in one or more other funds which are part of the Fund Complex. |
Further information about the Fund's Trustees and Officers is available in the Fund's Statement of Additional Information, which can be obtained without charge by calling (800) 522-5465.
| abrdn Income Credit Strategies Fund | 73 |
Additional Information (unaudited)
Summary of Fund Expenses
The purpose of the following table and the example below is to help you understand the fees and expenses that holders of Common Shares (“Common Shareholders”) would bear directly or indirectly. The expenses shown in the table under “Other expenses,” “Interest expenses on bank borrowings,” “Dividends on Preferred Shares,” “Total annual expenses” and “Total annual expenses after expense reimbursement” are based on the Fund’s capital structure as of October 31, 2022. As of October 31, 2022, the Fund had $128,000,000 of leverage outstanding through bank borrowings and Preferred Shares which represented 43.4% of the Managed Assets as of October 31, 2022. The table reflects Fund expenses as a percentage of net assets attributable to Common Shares. The following table should not be considered a representation of the Fund’s future expenses. Actual expenses may be greater or less than those shown below.
| Common Shareholder transaction expenses | |
| Sales load (as a percentage of offering price)(1) | 1.00% |
| Offering expenses (as a percentage of offering price)(2) | 0.12% |
Dividend reinvestment and optional cash purchase plan fees (per share for
open-market purchases of common shares)(3) | |
| Fee for Open Market Purchases of Common Shares | $0.02 (per share) |
| Fee for Optional Shares Purchases | $5.00 (max) |
| Sales of Shares Held in a Dividend Reinvestment Account | $0.12 (per share)
and $25.00 (max) |
| | Annual expenses
(as a percentage of net assets
attributable to
Common Shares) |
| Advisory fee(4) | 2.13% |
| Interest expenses on bank borrowings(5) | 1.00% |
| Dividends on Preferred Shares(6) | 1.00% |
| Other expenses | 0.60% |
| Total annual expenses | 4.73% |
| Less: expense reimbursement(7) | 0.35% |
| Total annual expenses after expense reimbursement | 4.38% |
(1) If Common Shares or Preferred Shares are sold to or through underwriters, a prospectus or prospectus supplement will set forth any applicable sales load and the estimated offering expenses borne by the Fund.
(2) Offering expenses payable by the Fund will be deducted from the proceeds, before expenses, to the Fund.
(3) Shareholders who participate in the Fund's Dividend Reinvestment and Optional Cash Purchase Plan (the “Plan”) may be subject to fees on certain transactions. The Plan Agent's (as defined under "Dividend Reinvestment and Optional Cash Purchase Plan" in the Fund’s Prospectus) fees for the handling of the reinvestment of dividends will be paid by the Fund; however, participating shareholders will pay a $0.02 per share fee incurred in connection with open-market purchases in connection with the reinvestment of dividends, capital gains distributions and voluntary cash payments made by the participant, which will be deducted from the value of the dividend. For optional share purchases, shareholders will also be charged a $2.50 fee for automatic debits from a checking/savings account, a $5.00 one-time fee for online bank debit and/or $5.00 for check. Shareholders will be subject to $0.12 per share fee and either a $10.00 fee (for batch orders) or $25.00 fee (for market orders) for sales of shares held in a dividend reinvestment account. Per share fees include any applicable brokerage commissions the Plan agent is required to pay. For more details about the Plan, see "Dividend Reinvestment and Optional Cash Purchase Plan" in the Fund’s Prospectus.
(4) The Adviser receives a monthly fee at an annual rate of 1.25% of the Fund’s average daily Managed Assets. The advisory fee percentage calculation assumes the use of leverage by the Fund as discussed in note (5) and (6). To derive the annual advisory fee as a percentage of the Fund’s net assets (which are the Fund’s total assets less all of the Fund’s liabilities including the liquidation preference on the Preferred Shares), the Fund’s average Managed Assets for the current fiscal year ended October 31, 2022 were multiplied by the annual advisory fee rate and then divided by the Fund’s average net assets for the same period.
(5) The percentage in the table is based on total borrowings of $88,000,000 (the balance outstanding under the Fund’s Credit Facility as of October 31, 2022, representing approximately 29.9% of the Fund’s Managed Assets) and an average interest rate during the fiscal year ended
| 74 | abrdn Income Credit Strategies Fund |
Additional Information (unaudited) (continued)
October 31, 2022 of 2.34%. There can be no assurances that the Fund will be able to obtain such level of borrowing (or to maintain its current level of borrowing), that the terms under which the Fund borrows will not change, or that the Fund’s use of leverage will be profitable. The expenses shown under “Interest expense on bank borrowings” in the table above reflect the cost to the Fund of borrowings, expressed as a percentage of the Fund’s net assets as of October 31, 2022, based on interest rates in effect as of October 31, 2022. The Fund currently intends during the next twelve months to maintain a similar proportionate amount of borrowings but may increase such amount to 33 1/3% of the average daily value of the Fund’s total assets.
(6) Based on 1,600,000 shares of Preferred Shares outstanding as of October 31, 2022 with an aggregate liquidation preference of $40 million and an annual dividend rate equal to 5.250% of such liquidation preference. The costs associated with the Preferred Shares are borne entirely by Common Shareholders.
(7) The Adviser has contractually agreed to reimburse the Fund so that total other expenses (excluding interest, taxes, brokerage fees, short sale dividend and interest expenses and non-routine expenses) (as a percentage of net assets attributable to Common Shares of the Fund) are limited to 0.35% of the average daily net assets of the Fund on an annualized basis. This contractual limitation may not be terminated before October 31, 2024 without the approval of the Independent Trustees. The Fund may repay any such reimbursement from the Adviser, within three years of the reimbursement, provided that the following requirements are met: the reimbursements do not cause the Fund to exceed the lesser of the applicable expense limitation in the contract at the time the fees were limited or expenses are paid or the applicable expense limitation in effect at the time the expenses are being recouped by the Adviser. Because interest expenses and investment related expenses are not subject to the reimbursement agreement, interest expenses and investment related expenses are included in the “Total annual expenses after expense reimbursement” line item.
Example
The following examples illustrate the expenses you would pay on a $1,000 investment in common shares assuming that (i) all dividends and other distributions are reinvested at NAV (ii) the percentage amounts listed under “Total annual expenses” above remain the same in the years shown and (iii) a 5% annual portfolio total return.(1)
The following example does not include the sales load:
| 1 Year | 3 Years | 5 Years | 10 Years |
| $44 | $137 | $233 | $476 |
The following example assumes a transaction fee of 1.12%, as a percentage of the offering price, as if it were borne solely by you, as purchaser(2):
| 1 Year | 3 Years | 5 Years | 10 Years |
| $55 | $147 | $242 | $482 |
(1) The examples above should not be considered representations of future expenses. Actual expenses may be higher or lower than those shown. The examples assume that all dividends and distributions are reinvested at net asset value. The Fund’s actual rate of return may be greater or less than the hypothetical 5% return shown in the examples. For more complete descriptions of certain of the Fund’s costs and expenses, see “Management of the Fund — Advisory Agreements” in the Fund’s Prospectus.
(2) Notwithstanding this assumption, in actuality, these fees will be indirectly borne by all holders of Common Shares.
Senior Securities
The following table sets forth information about the Fund’s outstanding senior securities as of the end of each of the Fund’s last ten fiscal years. The Fund’s senior securities during this time period are comprised of borrowings which constitutes a “senior security” as defined in the 1940 Act. The information in this table for the fiscal years ended 2022, 2021, 2020, 2019 and 2018 has been audited by KPMG LLP, independent registered public accounting firm. The Fund’s audited financial statements, including the report of KPMG LLP thereon, and accompanying notes thereto, are included in this Annual Report.
Fiscal Period
Ended) | Title of Security | Total Principal
Amount
Outstanding | Aggregate
Liquidation
Preference | Liquidation
Preference
Per Share | Asset Coverage
Per $1,000
of Principal
Amount |
| October 31, 2022 | Senior Secured Revolving Credit Facility | $ 88,000,000 | -- | -- | $ 3,348 (1) |
| October 31, 2022 | 5.250% Series A Perpetual Preferred Shares | $ 40,000,000 | $ 40,000,000 | $25.00 | $ 2,302(1) |
| abrdn Income Credit Strategies Fund | 75 |
Additional Information (unaudited) (continued)
Fiscal Period
Ended) | Title of Security | Total Principal
Amount
Outstanding | Aggregate
Liquidation
Preference | Liquidation
Preference
Per Share | Asset Coverage
Per $1,000
of Principal
Amount |
| October 31, 2021 | Senior Secured Revolving Credit Facility | $118,000,000 | -- | -- | $3,339(1) |
| October 31, 2021 | 5.250% Series A Perpetual Preferred
Shares | $ 40,000,000 | $40,000,000 | $25.00 | $2,538 (2) |
| October 31, 2020 | Senior Secured Revolving Credit Facility | $81,200,000 | -- | -- | $ 3,178 |
| October 31, 2019 | Senior Secured Revolving Credit Facility | $72,000,000 | -- | -- | $ 3,263 |
| October 31, 2018 | Senior Secured Revolving Credit Facility | $83,000,000 | -- | -- | $ 3,217 |
| October 31, 2017 | Senior Secured Revolving Credit Facility | $83,000,000 | -- | -- | $3,402 |
| October 31, 2016 | Senior Secured Revolving Credit Facility | $83,000,000 | -- | -- | $3,305 |
| October 31, 2015 | Senior Secured Revolving Credit Facility | $90,000,000 | -- | -- | $3,166 |
| October 31, 2014 | Senior Secured Revolving Credit Facility | $100,000,000 | -- | -- | $3,358 |
| October 31, 2013 | Senior Secured Revolving Credit Facility | $95,000,000 | -- | -- | $3,564 |
(1) The asset coverage ratio for the Revolving Credit Facility is calculated by dividing net assets plus the amount of any borrowings, including Series A Perpetual Preferred Shares, for investment purposes by the amount of any senior securities, which includes the Revolving Credit Facility, and then multiplying by $1,000.
(2) The asset coverage ratio for the Fund's total leverage is calculated by dividing net assets plus the amount of any borrowings for investment purposes by the amount of any borrowings, and then multiplying by $1,000.
Net Asset Value and Market Price Information
Net Asset Value
The Fund’s currently outstanding Common Shares are listed on the NYSE. The Common Shares commenced trading on the NYSE on January 27, 2011.
The Common Shares have traded both at a premium and at a discount to the Fund’s NAV per Common Share. Although the Common Shares recently have traded at a premium to NAV, there can be no assurance that this will continue after an offering of Common Shares or that the Common Shares will not trade at a discount in the future. Shares of closed-end investment companies frequently trade at a discount to NAV. The Fund’s NAV will be reduced immediately following an offering of Common Shares due to the costs of such offering, which will be borne entirely by the Fund. The sale of Common Shares by the Fund (or the perception that such sales may occur) may have an adverse effect on prices of Common Shares in the secondary market. An increase in the number of Common Shares available may result in downward pressure on the market price for Common Shares.
The Fund cannot predict whether its Common Shares will trade in the future at a premium to or discount from NAV, or the level of any premium or discount.
Market Price Information
The Fund’s Common Shares are publicly held and are listed and traded on the NYSE (trading symbol “ACP”). The following table sets forth for the fiscal quarters indicated the highest and lowest daily prices during the applicable quarter at the close of market on the NYSE per Common Share along with (i) the highest and lowest closing NAV and (ii) the highest and lowest premium or discount from NAV represented by such prices at the close of the market on the NYSE.
| | NYSE Market Price(1) | NAV at NYSE Market Price(1) | Market Premium/(Discount) to
NAV on Date of NYSE Market Price(1) |
| Quarter Ended (2) | High | Low | High | Low | High | Low |
| October 31, 2022 | $8.72 | $6.16 | $7.80 | $6.54 | 12.81% | -5.81% |
| July 31, 2022 | $9.33 | $7.57 | $8.74 | $7.11 | 6.75% | 3.13% |
| April 30, 2022 | $10.51 | $9.34 | $10.01 | $8.80 | 7.68% | 2.64% |
| January 31, 2022 | $11.45 | $9.62 | $10.53 | $9.94 | 8.94% | -4.47% |
| October 31, 2021 | $11.69 | $10.94 | $11.02 | $10.45 | 6.66% | 1.11% |
| July 31, 2021 | $12.59 | $10.76 | $11.71 | $10.87 | 8.35% | -6.19% |
| 76 | abrdn Income Credit Strategies Fund |
Additional Information (unaudited) (concluded)
| | NYSE Market Price(1) | NAV at NYSE Market Price(1) | Market Premium/(Discount) to
NAV on Date of NYSE Market Price(1) |
| Quarter Ended (2) | High | Low | High | Low | High | Low |
| April 30, 2021 | $12.56 | $10.91 | $11.70 | $11.32 | 7.63% | -3.62% |
| January 31, 2021 | $11.25 | $9.29 | $11.45 | $10.16 | -1.32% | -8.56% |
(1) Source: Bloomberg L.P.
(2) Data presented are with respect to a short period of time and are not indicative of future performance.
On November 30, 2022, the Fund’s NAV was $7.02 and the last reported sale price of a Common Share on the NYSE was $7.16, representing a premium to NAV of 1.99%.
| abrdn Income Credit Strategies Fund | 77 |
[THIS PAGE INTENTIONALLY LEFT BLANK]
[THIS PAGE INTENTIONALLY LEFT BLANK]
[THIS PAGE INTENTIONALLY LEFT BLANK]
Corporate Information
Trustees
P. Gerald Malone, Chairman
Stephen Bird
Nancy Yao Maasbach
John Sievwright
Randolph Takian
Investment Adviser
abrdn Investments Limited
10 Queen's Terrace
Aberdeen, AB10 1XL
Scotland, United Kingdom
Investment Sub-Adviser
abrdn Inc.
1900 Market Street, Suite 200
Philadelphia, PA19103
Administrator
abrdn Inc.
1900 Market Street, Suite 200
Philadelphia, PA 19103
Custodian
State Street Bank and Trust Co.
1 Heritage Drive, 3rd Floor
North Quincy, MA 02171
Transfer Agent
Computershare Trust Company, N.A.
P.O. Box 43006
Providence, RI 02940-3078
Independent Registered Public Accounting Firm
KPMG LLP
1601 Market Street
Philadelphia, PA 19103
Legal Counsel
Dechert LLP
1900 K Street N.W.
Washington D.C. 20006
Investor Relations
abrdn Inc.
1900 Market Street, Suite 200
Philadelphia, PA 19103
1-800-522-5465
Investor.Relations@abrdn.com
Notice is hereby given in accordance with Section 23(c) of the Investment Company Act of 1940, as amended, that the Fund may purchase, from time to time, shares of its common stock in the open market.
Shares of abrdn Income Credit Strategies Fund are traded on the NYSE under the symbol “ACP”. Information about the Fund’s net asset value and market price is available at www.abrdnacp.com.
This report, including the financial information herein, is transmitted to the shareholders of abrdn Income Credit Strategies Fund for their general information only. It does not have regard to the specific investment objectives, financial situation and the particular needs of any specific person. Past performance is no guarantee of future results.
Item 2. Code of Ethics.
| (a) | As of October 31, 2022, abrdn Income Credit Strategies Fund (the “Fund” or the “Registrant”) had adopted a Code of Ethics that applies to the Registrant’s principal executive officer, principal financial officer, principal accounting officer or controller, or persons performing similar functions, regardless of whether these individuals are employed by the Registrant or a third party (the “Code of Ethics”). |
| (c) | There have been no amendments, during the period covered by this report, to a provision of the Code of Ethics. |
| (d) | During the period covered by this report, there were no waivers to the provisions of the Code of Ethics. |
| (f) | A copy of the Code of Ethics has been filed as an exhibit to this Form N-CSR. |
Item 3. Audit Committee Financial Expert.
The Registrant's Board of Trustees has determined that John Sievwright, a member of the Board of Trustees’ Audit Committee, possesses the attributes, and has acquired such attributes through means, identified in instruction 2 of Item 3 to Form N-CSR to qualify as an “audit committee financial expert,” and has designated Mr. Sievwright as the Audit Committee’s financial expert. Mr. Sievwright is considered to be an “independent” trustee, as such term is defined in paragraph (a)(2) of Item 3 to Form N-CSR.
Item 4. Principal Accountant Fees and Services.
(a) – (d) Below is a table reflecting the fee information requested in Items 4(a) through (d):
Fiscal Year
Ended | | (a)
Audit Fees1 | | | (b)
Audit-Related Fees2 | | | (c)
Tax Fees3 | | | (d)
All Other Fees4 | |
| October 31, 2022 | | $ | 94,740 | | | $ | 0 | | | $ | 0 | | | $ | 0 | |
| Percentage approved pursuant to pre-approval exception5 | | | 0 | % | | | 0 | % | | | 0 | % | | | 0 | % |
| October 31, 2021 | | $ | 83,633 | | | $ | 112,000 | | | $ | 11,605 | | | $ | 0 | |
| Percentage approved pursuant to pre-approval exception5 | | | 0 | % | | | 0 | % | | | 0 | % | | | 0 | % |
1 “Audit Fees” are the aggregate fees billed for professional services for the audit of the Fund’s annual financial statements and services provided in connection with statutory and regulatory filings or engagements.
2 “Audit Related Fees” are the aggregate fees billed for assurance and related services reasonably related to the performance of the audit or review of financial statements that are not reported under “Audit Fees”. These fees include offerings related to the Fund’s common shares.
3 “Tax Fees” are the aggregate fees billed for professional services for tax advice, tax compliance, and tax planning. These fees include: federal and state income tax returns, review of excise tax distribution calculations and federal excise tax return.
4 “All Other Fees” are the aggregate fees billed for products and services other than “Audit Fees”, “Audit-Related Fees” and “Tax Fees”.
5 Pre-approval exception under Rule 2-01 of Regulation S-X. The pre-approval exception for services provided directly to the Fund waives the pre-approval requirement for services other than audit, review or attest services if: (A) the aggregate amount of all such services provided constitutes no more than 5% of the total amount of revenues paid by the Fund to its accountant during the fiscal year in which the services are provided; (B) the Fund did not recognize the services as non-audit services at the time of the engagement; and (C) the services are promptly brought to the Audit Committee’s attention, and the Committee (or its delegate) approves the services before the audit is completed.
| (e)(1) | The Registrant’s Audit Committee (the “Committee”) has adopted a Charter that provides that the Committee shall annually select, retain or terminate, and recommend to the Independent Trustees for their ratification, the selection, retention or termination, the Registrant’s independent auditor and, in connection therewith, to evaluate the terms of the engagement (including compensation of the independent auditor) and the qualifications and independence of the independent auditor, including whether the independent auditor provides any consulting, auditing or tax services to the Registrant’s investment adviser (the “Adviser”) or any sub-adviser, and to receive the independent auditor’s specific representations as to their independence, delineating all relationships that may affect the independent auditor’s independence, including the disclosures required by PCAOB Rule 3526 or any other applicable auditing standard. PCAOB Rule 3526 requires that, at least annually, the auditor: (1) disclose to the Committee in writing all relationships between the auditor and its related entities and the Registrant and its related entities that in the auditor’s professional judgment may reasonably be thought to bear on independence; (2) confirm in the letter that, in its professional judgment, it is independent of the Registrant within the meaning of the Securities Acts administered by the SEC; and (3) discuss the auditor’s independence with the audit committee. The Committee is responsible for actively engaging in a dialogue with the independent auditor with respect to any disclosed relationships or services that may impact the objectivity and independence of the independent auditor and for taking, or recommending that the full Board take, appropriate action to oversee the independence of the independent auditor. The Committee Charter also provides that the Committee shall review in advance, and consider approval of, any and all proposals by Management or the Adviser that the Registrant, the Adviser or their affiliated persons, employ the independent auditor to render “permissible non-audit services” to the Registrant and to consider whether such services are consistent with the independent auditor’s independence. “Permissible non-audit services” include any professional services, including tax services, provided to the Registrant by the independent auditor, other than those provided to the Registrant in connection with an audit or a review of the financial statements of the Registrant. Permissible non-audit services may not include: (i) bookkeeping or other services related to the accounting records or financial statements of the Registrant; (ii) financial information systems design and implementation; (iii) appraisal or valuation services, fairness opinions or contribution-in-kind reports; (iv) actuarial services; (v) internal audit outsourcing services; (vi) management functions or human resources; (vii) broker or dealer, investment adviser or investment banking services; (viii) legal services and expert services unrelated to the audit; and (ix) any other service the PCAOB determines, by regulation, is impermissible. Pre-approval by the Committee of any permissible non-audit services is not required so long as: (i) the aggregate amount of all such permissible non-audit services provided to the Registrant constitutes not more than 5% of the total amount of revenues paid by the Registrant to its auditor during the fiscal year in which the permissible non-audit services are provided; (ii) the permissible non-audit services were not recognized by the Registrant at the time of the engagement to be non-audit services; and (iii) such services are promptly brought to the attention of the Committee and approved by the Committee or its Delegate(s) prior to the completion of the audit. The Committee may delegate to one or more of its members (“Delegates”) authority to pre-approve permissible non-audit services to be provided to the Registrant. Any pre-approval determination of a Delegate shall be presented to the full Committee at its next meeting. Any pre-approval determination of a Delegate shall be presented to the full Committee at its next meeting. Pursuant to this authority, the Registrant’s Committee delegates to the Committee Chair, subject to subsequent ratification by the full Committee, up to a maximum amount of $25,000, which includes any professional services, including tax services, provided to the Registrant by its independent registered public accounting firm other than those provided to the Registrant in connection with an audit or a review of the financial statements of the Registrant. The Committee shall communicate any pre-approval made by it or a Delegate to the Adviser, who will ensure that the appropriate disclosure is made in the Registrant’s periodic reports required by Section 30 of the Investment Company Act of 1940, as amended, and other documents as required under the federal securities laws. |
| (e)(2) | None of the services described in each of paragraphs (b) through (d) of this Item involved a waiver of the pre-approval requirement by the Audit Committee pursuant to Rule 2-01 (c)(7)(i)(C) of Regulation S-X. |
The following table shows the amount of fees that KPMG LLP billed during the Fund’s last two fiscal years for non-audit services to the Registrant, and to the Adviser, and any entity controlling, controlled by or under common control with the Adviser that provides ongoing services to the Fund (“Affiliated Fund Service Provider”):
| Fiscal Year Ended | | Total Non-Audit Fees
Billed to Fund | | | Total Non-Audit Fees
billed to Adviser and
Affiliated Fund Service
Providers (engagements
related directly to the
operations and financial
reporting of the Fund) | | | Total Non-Audit Fees
billed to Adviser and
Affiliated Fund Service
Providers (all other
engagements) | | | Total | |
| October 31, 2022 | | $ | 0 | | | $ | 0 | | | $ | 1,108,929 | | | $ | 1,108,929 | |
| October 31, 2021 | | $ | 11,605 | | | $ | 0 | | | $ | 1,547,556 | | | $ | 1,559,161 | |
“Non-Audit Fees billed to Fund” for both fiscal years represent “Tax Fees” and “All Other Fees” billed to Fund in their respective amounts from the previous table.
Item 5. Audit Committee of Listed Registrants.
| (a) | The Registrant has a separately-designated standing Audit Committee established in accordance with Section 3(a)(58)(A) of the Exchange Act (15 U.S.C. 78c(a)(58)(A)). |
As of the fiscal year ended October 31, 2022, the Audit Committee members were:
Nancy Yao Maasbach
P. Gerald Malone
John Sievwright
Randolph Takian
Item 6. Schedule of Investments.
(a) Included as part of the Report to Shareholders filed under Item 1 of this Form N-CSR.
(b) Not applicable.
Item 7. Disclosure of Proxy Voting Policies and Procedures for Closed-End Management Investment Companies.
Pursuant to the Registrant's Proxy Voting Policy and Procedures, the Registrant has delegated responsibility for its proxy voting to its Adviser, provided that the Registrant's Board of Trustees has the opportunity to periodically review the Adviser's proxy voting policies and material amendments thereto.
The proxy voting policies of the Registrant are included herewith as Exhibit (c) and policies of the Adviser are included as Exhibit (d).
Item 8. Portfolio Managers of Closed-End Management Investment Companies.
(a)(1) PORTFOLIO MANAGER BIOGRAPHIES
The Fund is managed by abrdn’s Euro High Yield and Global Leverage Loans teams. The Euro High Yield and Global Leverage Loans teams work in a truly collaborative fashion; all team members have both portfolio management and research responsibilities. The teams are responsible for the day-to-day management of the Fund. As of the date of filing this report, the following individuals have primary responsibility for the day-to-day management of the Fund’s portfolio:
Individual &
Position | Past Business Experience |
Ben Pakenham
Head of European High Yield and Global Loans | Ben Pakenham is Head of European High Yield and Global Loans. He joined abrdn in 2011 from Henderson Global Investors (from 2008-2011), where he was the lead fund manager on the Extra Monthly Income Bond Fund and a named manager on various other credit portfolios including the High Yield Monthly Income Bond Fund. Prior to Henderson Global Investors, he was an Assistant Fund Manager on the High Yield Funds at New Star Asset Management (2005-2008). |
Matthew Kence
Investment Director – US High Yield and Global High Yield | Matthew Kence is an Investment Director and is a Portfolio Manager on the abrdn Income Credit Strategies Fund and the Global High Yield strategies at abrdn. He is also responsible for covering US high yield energy companies. Matt joined the company in 2010 from Gannet Welsh & Kotler where he was a Vice President, Credit. Previously, Matt also worked for MFS Investment Management as a high yield analyst. Matt graduated with a BS Mechanical Engineering from Ohio University and received his MBA from the Haas School of Business at the University of California, Berkeley. |
Adam Tabor
Investment Director – European High Yield and Leveraged Loans | Adam Tabor is an Investment Director on the Global High Yield team at abrdn. Adam joined the company in 2010 on the graduate rotation scheme having previously interned with the company in 2009. Adam graduated with an MA in Financial Economics from the University of St Andrews. He is a CFA Charterholder. |
George Westervelt
Head of Global High Yield and Head of US High Yield Research | George Westervelt is Head of Global High Yield and Head of US High Yield Research. He is one of the Portfolio Managers on the team that manages the Global High Yield strategies and is also a member of the North American Fixed Income Leadership team. George joined abrdn in 2009 as a Credit Analyst and joined the portfolio management group in 2011. Prior to joining abrdn, George worked at MFS Investment Management in Boston and Citigroup in New York. He earned a BA in English from the University of Vermont and is a CFA Charterholder. |
(a)(2) OTHER ACCOUNTS MANAGED BY PORTFOLIO MANAGERS.
The following chart summarizes information regarding other accounts for which each portfolio manager has day-to-day management responsibilities. Accounts are grouped into the following three categories: (1) registered investment companies; (2) other pooled investment vehicles; and (3) other accounts. To the extent that any of these accounts pay advisory fees that are based on account performance (“performance-based fees”), information on those accounts is provided separately. The figures in the chart below for the category of “registered investment companies” include the Fund. The “Other Accounts Managed” represents the accounts managed by the teams of which the portfolio manager is a member. The information in the table below is as of October 31, 2022
Name of
Portfolio Manager | | Type of Accounts | | Other Accounts
Managed | | Total Assets ($M) | | | Number of
Accounts
Managed for
Which
Advisory
Fee is Based
on
Performance | | | Total Assets for
Which
Advisory Fee is
Based on
Performance ($M) | |
| Adam Tabor1 | | Registered Investment Companies | | 1 | | $ | 289.95 | | | | 0 | | | $ | 0 | |
| | | Pooled Investment Vehicles | | 4 | | $ | 691.95 | | | | 0 | | | $ | 0 | |
| | | Other Accounts | | 2 | | $ | 111.39 | | | | 0 | | | $ | 0 | |
| Ben Pakenham2 | | Registered Investment Companies | | 1 | | $ | 289.95 | | | | 0 | | | $ | 0 | |
| | | Pooled Investment Vehicles | | 4 | | $ | 691.95 | | | | 0 | | | $ | 0 | |
| | | Other Accounts | | 2 | | $ | 111.39 | | | | 0 | | | $ | 0 | |
| Matthew Kence1 | | Registered Investment Companies | | 2 | | $ | 393.43 | | | | 0 | | | $ | 0 | |
| | | Pooled Investment Vehicles | | 5 | | $ | 1,433.54 | | | | 0 | | | $ | 0 | |
| | | Other Accounts | | 3 | | $ | 378.01 | | | | 0 | | | $ | 0 | |
| George Westervelt2 | | Registered Investment Companies | | 2 | | $ | 393.43 | | | | 0 | | | $ | 0 | |
| | | Pooled Investment Vehicles | | 5 | | $ | 1,433.54 | | | | 0 | | | $ | 0 | |
| | | Other Accounts | | 3 | | $ | 378.01 | | | | 0 | | | $ | 0 | |
1 Includes accounts managed by the Euro High Yield and Global Leverage Loans teams, of which the portfolio manager is a member.
2 Includes accounts managed by the US High Yield, Global High Yield, US Global Credit, Euro High Yield and Global Leverage Loans teams, of which the portfolio manager is a member.
POTENTIAL CONFLICTS OF INTEREST
The Adviser and its affiliates (collectively referred to herein as “abrdn”) serve as investment advisers for multiple clients, including the Registrant and other investment companies registered under the 1940 Act and private funds (such clients are also referred to below as “accounts”). The portfolio managers’ management of “other accounts” may give rise to potential conflicts of interest in connection with their management of the Registrant’s investments, on the one hand, and the investments of the other accounts, on the other. The other accounts may have the same investment objective as the Registrant. Therefore, a potential conflict of interest may arise as a result of the identical investment objectives, whereby the portfolio manager could favor one account over another. However, the Adviser believes that these risks are mitigated by the fact that: (i) accounts with like investment strategies managed by a particular portfolio manager are generally managed in a similar fashion, subject to exceptions to account for particular investment restrictions or policies applicable only to certain accounts, differences in cash flows and account sizes, and similar factors; and (ii) portfolio manager personal trading is monitored to avoid potential conflicts. In addition, the Adviser has adopted trade allocation procedures that require equitable allocation of trade orders for a particular security among participating accounts.
In some cases, another account managed by the same portfolio manager may compensate Aberdeen based on the performance-based fees with qualified clients. The existence of such a performance-based fee may create additional conflicts of interest for the portfolio manager in the allocation of management time, resources and investment opportunities.
Another potential conflict could include instances in which securities considered as investments for the Registrant also may be appropriate for other investment accounts managed by the Adviser or its affiliates. Whenever decisions are made to buy or sell securities for the Registrant and one or more of the other accounts simultaneously, the Adviser may aggregate the purchases and sales of the securities and will allocate the securities transactions in a manner that it believes to be equitable under the circumstances. As a result of the allocations, there may be instances where the Registrant will not participate in a transaction that is allocated among other accounts. While these aggregation and allocation policies could have a detrimental effect on the price or amount of the securities available to the Registrant from time to time, it is the opinion of the Adviser that the benefits from the policies outweigh any disadvantage that may arise from exposure to simultaneous transactions. The Registrant has adopted policies that are designed to eliminate or minimize conflicts of interest, although there is no guarantee that procedures adopted under such policies will detect each and every situation in which a conflict arises.
With respect to non-discretionary model delivery accounts (including UMA accounts) and discretionary SMA accounts, abrdn Inc. will utilize a third party service provider to deliver model portfolio recommendations and model changes to the Sponsors. abrdn Inc. seeks to treat clients fairly and equitably over time, by delivering model changes to our service provider and investment instructions for our other discretionary accounts to our trading desk, simultaneously or approximately at the same time. The service provider will then deliver the model changes to each Sponsor on a when-traded, randomized full rotation schedule. All Sponsors will be included in the rotation schedule, including SMA and UMA.
UMA Sponsors will be responsible for determining how and whether to implement the model portfolio or model changes and implementation of any client specific investment restrictions. The Sponsors are solely responsible for determining the suitability of the model portfolio for each model delivery client, executing trades and seeking best execution for such clients.
As it relates to SMA accounts, abrdn Inc. will be responsible for managing the account on the basis of each client’s financial situation and objectives, the day to day investment decisions, best execution, accepting or rejecting client specific investment restrictions and performance. The SMA Sponsors will collect suitability information and will provide a summary questionnaire for our review and approval or rejection. For dual contract SMAs, abrdn Inc. will collect a suitability assessment from the client, along with the Sponsor suitability assessment. Our third party service provider will monitor client specific investment restrictions on a day to day basis. For SMA accounts, model trades will be traded by the Sponsor or may be executed through a “step-out transaction,”- or traded away- from the client’s Sponsor if doing so is consistent with abrdn’s obligation to obtain best execution. When placing trades through Sponsor Firms (instead of stepping them out), we will generally aggregate orders where it is possible and in the client’s best interests. In the event we are not comfortable that a Sponsor can obtain best execution for a specific security and trading away is infeasible, we may exclude the security from the model.
Trading costs are not covered by the Wrap Program fee and may result in additional costs to the client. In some instances, step-out trades are executed without any additional commission, mark-up, or mark-down, but in many instances, the executing broker-dealer may impose a commission or a mark-up or mark-down on the trade. Typically, the executing broker will embed the added costs into the price of the trade execution, making it difficult to determine and disclose the exact added cost to clients. In this instance, these additional trading costs will be reflected in the price received for the security, not as a separate commission, on trade confirmations or on account statements. In determining best execution for SMA accounts, abrdn Inc. takes into consideration that the client will not pay additional trading costs or commission if executing with the Sponsor.
While UMA accounts are invested in the same strategies as and may perform similarly to SMA accounts, there are expected to be performance differences between them. There will be performance dispersions between UMAs and other types of accounts because abrdn does not have discretion over trading and there may be client specific restrictions for SMA accounts.
abrdn may have already commenced trading for its discretionary client accounts before the model delivery accounts have executed abrdn's recommendations. In this event, trades placed by the model delivery clients may be subject to price movements, particularly with large orders or where securities are thinly traded, that may result in model delivery clients receiving less favorable prices than our discretionary clients. abrdn has no discretion over transactions executed by model delivery clients and is unable to control the market impact of those transactions.
Timing delays or other operational factors associated with the implementation of trades may result in non-discretionary and model delivery clients receiving materially different prices relative to other client accounts. In addition, the constitution and weights of stocks within model portfolios may not always be exactly aligned with similar discretionary accounts. This may create performance dispersions within accounts with the same or similar investment mandate.
(a)(3)
DESCRIPTION OF COMPENSATION STRUCTURE
abrdn’s remuneration policies are designed to support its business strategy as a leading international asset manager. The objective is to attract, retain and reward talented individuals for the delivery of sustained, superior returns for abrdn’s clients and shareholders. abrdn operates in a highly competitive international employment market, and aims to maintain its strong track record of success in developing and retaining talent.
abrdn’s policy is to recognize corporate and individual achievements each year through an appropriate annual bonus scheme. The bonus is a single, fully discretionary variable pay award. The aggregate value of awards in any year is dependent on the group’s overall performance and profitability. Consideration is also given to the levels of bonuses paid in the market. Individual awards, which are payable to all members of staff, are determined by a rigorous assessment of achievement against defined objectives.
The variable pay award is composed of a mixture of cash and a deferred award, the portion of which varies based on the size of the award. Deferred awards are by default abrdn plc shares, with an option to put up to 50% of the deferred award into funds managed by abrdn. Overall compensation packages are designed to be competitive relative to the investment management industry.
Base Salary
abrdn’s policy is to pay a fair salary commensurate with the individual’s role, responsibilities and experience, and having regard to the market rates being offered for similar roles in the asset management sector and other comparable companies. Any increase is generally to reflect inflation and is applied in a manner consistent with other abrdn employees; any other increases must be justified by reference to promotion or changes in responsibilities.
Annual Bonus
The Remuneration Committee determines the key performance indicators that will be applied in considering the overall size of the bonus pool. In line with practices amongst other asset management companies, individual bonuses are not subject to an absolute cap. However, the aggregate size of the bonus pool is dependent on the group’s overall performance and profitability. Consideration is also given to the levels of bonuses paid in the market. Individual awards are determined by a rigorous assessment of achievement against defined objectives, and are reviewed and approved by the Remuneration Committee.
abrdn has a deferral policy which is intended to assist in the retention of talent and to create additional alignment of executives’ interests with abrdn’s sustained performance and, in respect of the deferral into funds managed by abrdn, to align the interest of portfolio managers with our clients.
Staff performance is reviewed formally at least once a year. The review process evaluates the various aspects that the individual has contributed to abrdn, and specifically, in the case of portfolio managers, to the relevant investment team. Discretionary bonuses are based on client service, asset growth and the performance of the respective portfolio manager. Overall participation in team meetings, generation of original research ideas and contribution to presenting the team externally are also evaluated.
In the calculation of a portfolio management team’s bonus, abrdn takes into consideration investment matters (which include the performance of funds, adherence to the company investment process, and quality of company meetings) as well as more subjective issues such as team participation and effectiveness at client presentations through key performance indicator scorecards. To the extent performance is factored in, such performance is not judged against any specific benchmark and is evaluated over the period of a year - January to December. The pre- or after-tax performance of an individual account is not considered in the determination of a portfolio manager’s discretionary bonus; rather the review process evaluates the overall performance of the team for all of the accounts the team manages.
Portfolio manager performance on investment matters is judged over all of the accounts the portfolio manager contributes to and is documented in the appraisal process. A combination of the team’s and individual’s performance is considered and evaluated.
Although performance is not a substantial portion of a portfolio manager’s compensation, abrdn also recognizes that fund performance can often be driven by factors outside one’s control, such as (irrational) markets, and as such pays attention to the effort by portfolio managers to ensure integrity of our core process by sticking to disciplines and processes set, regardless of momentum and ‘hot’ themes. Short-terming is thus discouraged and trading-oriented managers will thus find it difficult to thrive in the abrdn environment. Additionally, if any of the aforementioned undue risks were to be taken by a portfolio manager, such trend would be identified via abrdn’s dynamic compliance monitoring system.
In rendering investment management services, the Adviser may use the resources of additional investment adviser subsidiaries of abrdn plc. These affiliates have entered into a memorandum of understanding (“MOU”) pursuant to which investment professionals from each affiliate may render portfolio management, research or trading services to abrdn clients. Each investment professional who renders portfolio management, research or trading services under a MOU or personnel sharing arrangement (“Participating Affiliate”) must comply with the provisions of the Advisers Act, the 1940 Act, the Securities Act of 1933, the Exchange Act, and the Employee Retirement Income Security Act of 1974, and the laws of states or countries in which the Adviser does business or has clients. No remuneration is paid by the Fund with respect to the MOU/personnel sharing arrangements.
(a)(4)
Dollar Range of Equity Securities in the
Registrant Beneficially Owned by the Portfolio
Manager as of October 31, 2022 | | | | |
| Adam Tabor | | | None | |
| Ben Pakenham | | | None | |
| Matthew Kence | | | None | |
| George Westervelt | | | None | |
(b) Not applicable.
Item 9. Purchases of Equity Securities by Closed-End Management Investment Company and Affiliated Purchasers.
No such purchases were made by or on behalf of the Registrant during the period covered by the report.
Item 10. Submission of Matters to a Vote of Security Holders.
During the period ended October 31, 2022, there were no material changes to the procedures by which shareholders may recommend nominees to the Registrant’s Board of Trustees.
Item 11. Controls and Procedures.
| | (a) | The Registrant’s principal executive and principal financial officers, or persons performing similar functions, have concluded that the Registrant’s disclosure controls and procedures (as defined in Rule 30a-3(c) under the Investment Company Act of 1940 (the “Act”) (17 CFR 270.30a-3(c)) are effective, as of a date within 90 days of the filing date of the report that includes the disclosure required by this paragraph, based on the evaluation of these controls and procedures required by Rule 30a-3(b) under the Act (17 CFR 270.30a3(b)) and Rule 13a-15(b) or 15d-15(b) under the Securities Exchange Act of 1934, as amended (17 CFR 240.13a-15(b) or 240.15d15(b)). |
| | (b) | There were no changes in the Registrant’s internal control over financial reporting (as defined in Rule 30a-3(d) under the Act (17 CFR 270.30a-3(d))) that occurred during the second fiscal quarter of the period covered by this report that has materially affected, or is reasonably likely to materially affect, the Registrant’s internal control over financial reporting. |
Item 12. Disclosure of Securities Lending Activities for Closed-End Management Investment Companies
Not applicable
Item 13. Exhibits.
SIGNATURES
Pursuant to the requirements of the Securities Exchange Act of 1934 and the Investment Company Act of 1940, the Registrant has duly caused this report to be signed on its behalf by the undersigned, thereunto duly authorized.
abrdn Income Credit Strategies Fund
| |
| By: | /s/ Christian Pittard | |
| | Christian Pittard, | |
| | Principal Executive Officer of | |
| | abrdn Income Credit Strategies Fund | |
| |
| Date: January 9, 2023 |
| | | |
Pursuant to the requirements of the Securities Exchange Act of 1934 and the Investment Company Act of 1940, this report has been signed below by the following persons on behalf of the Registrant and in the capacities and on the dates indicated.
| By: | /s/ Christian Pittard | |
| | Christian Pittard, | |
| | Principal Executive Officer of | |
| | abrdn Income Credit Strategies Fund | |
| |
| Date: January 9, 2023 |
| By: | /s/ Andrea Melia | |
| | Andrea Melia, | |
| | Principal Financial Officer of | |
| | abrdn Income Credit Strategies Fund | |
| |
| Date: January 9, 2023 |